boualem hammouda national institute of standards and ... · boualem hammouda national institute of...
TRANSCRIPT

INSIGHT INTO THE SANS TECHNIQUE
Boualem Hammouda
National Institute of Standards and Technology Center for Neutron Research
10 20 300
NANOMETERS
Polymers Complex Fluids Biology Materials Science

OUTLINE
• 1. NIST Guide Hall and Elements of Neutron Scattering
• 2. SANS Instrument ComponentsVelocity SelectorsNeutron Detectors
• 3. Typical SANS Spectra
• 4. SANS Data ModelingThe Random Phase ApproximationThe Ornstein-Zernike Equation
• 5. SANS Research TopicsA - Polymer SolutionB - Pressure EffectC - Crystalline LamellaeD - Protein Complex
• 6. Gallery of SANS Data Images
• 7. SANS User Statistics and Final Words

1. NIST GUIDE HALL

ΩΣ
+Ω
Σ=
dd
d)Q(d)Q(I incohcoh
COHERENT INCOHERENT
-- spin incoherence -- composition disorderContrast factor = (ρA-ρB)2
NEUTRON CROSS SECTIONS

SMALL-ANGLE NEUTRON SCATTERING
Monochromation Collimation Scattering Detection
Incident Beam
Area Detector
Scattered BeamSample Q
SourceAperture
SampleAperture
MonochromaticNeutron Beam
⎟⎠⎞
⎜⎝⎛ θ
λπ
=2
sin4Q
neutron wavelength
scattering angle

The NG3 SANS Instrument

BEAM BEAMON OFF
METERS
Small-Angle Neutron Scattering
10 20 300
3He +
CF4
4He
detection chamber
membrane
dome electronicschamber
High count rate neutron detector
3. SANS INSTRUMENT COMPONENTS
Multidisk velocity selector
1n0 + 3He21H1 + 3H1 + 765 keV
Monochromation Detection

Neutron area detector Velocity selector NG3 SANS scattering vessel

4. TYPICAL SANS SPECTRA
0.1
1
10
0.01 0.1
Poly(ethylene oxide)/d-water
85 oC 65 oC 50 oC 37.5 oC 25 oC 10 oC
Sca
tterin
g In
tens
ity (c
m-1
)
Scattering Variable Q (Å-1)
0
5
10
15
20
0 0.01 0.02 0.03 0.04 0.05 0.06 0.07
Polystyrene-Polyisoprene Diblock Copolymer
20 oC 30 oC 40 oC 50 oC 60 oC 70 oC
Sca
tterin
g In
tens
ity (c
m-1
)
Scattering Variable Q (Å-1)
0.1
1
10
100
0.01 0.1
P85/d-water
60 oC
50 oC
40 oC
30 oC
Scat
tere
d In
tens
ity (c
m-1
)
Scattering Variable Q (Å-1)
0.01
0.1
1
10
100
1000
0.001 0.01 0.1
Silica Particles/d-water
Data Model Fit
Scat
tere
d In
tens
ity (c
m-1
)
Scattering Variable Q (Å-1)
Polymer Solution
Complex Fluid
Copolymer
Silica Particles

4. SANS MODELING
( ) )Q(S )Q(PVV
Nd
)Q(dI
2A
2BA
A ρ−ρ⎟⎠⎞
⎜⎝⎛=
ΩΣ
cross section
number density
contrastfactor
form factor
structure factor
MACROMOLECULES PARTICLES
STRUCTURE FACTOR
SI(Q)
FORM FACTOR
P(Q)
STRUCTURE FACTOR
SI(Q)
FORM FACTOR
P(Q)
Random Phase Approximation Ornstein Zernike
particle volume

5. SANS RESEARCH TOPICS
A - Polymer Solution
B – Pressure Effects
C – Crystalline Lamellae
D – Protein Complex

A - Polymer Solution

SANS From hPoly(Ethylene Oxide)/D2O
50
100
150
200
250
0 5 10 15 20 25
PEO/D2O, M
w = 100,000 g/mole
Spinodal Temperature
Tem
pera
ture
(o C)
PEO Volume Fraction (%)
Two-phase region
One-phase region
LCST
-[CH2CH2O]n-

4 % dPEO/H2O
4 % hPEO/D2O 4 % hPEO/H2O
4 % dPEO/D2O
average contrastmatch line
33.5 % D2O /66.5 % H2O
17.2 % D2O /82.8 % H2O
50 % dPEO /50 % hPEO
1
10
0.01 0.1
SANS DataScat
terin
g In
tens
ity (c
m-1
)
Scattering Vector Q (Å-1)
4% PEO/water, T=10oC50 % dPEO/50 % hPEO63.5 % D
2O/36.5 % H
2O
0.1
1
0.01 0.1
4% PEO/d-water, Mw=100,000 g/mole, T=10oC
SANS Data
Scat
terin
g In
tens
ity (c
m-1
)
Scattering Vector Q (Å-1)
The Contrast Match Method
4% PEO/d-water dPEO
hPEO
D2O
H2O

B – Pressure Effects
Retaining Lens
Sapphire Window
Pressurizing Fluid valve
SampleConfining O-ring
Seal Backup
7.62 cm
9.525 cm

10
20
30
40
50
60
0 0.2 0.4 0.6 0.8 1
dPMB/PEB Polyolefin Blend
Binodal Temperature Tb
Spinodal Temperature Ts Tr
ansi
tion
Tem
pera
ture
s (o C
)
Pressure (kBar)
mixed phase region
nucleation and growth region
spinodal region
phaseseparated
mixed phase
composition
Temp
dPMB/PEB
pressure
dPS/PBMA
phaseseparated
phaseseparated
mixed phase
composition
Temp
pressure
pressureDH>0, DV<0
3.8
4
4.2
4.4
4.6
4.8
5
20 40 60 80 100 120 140 160
10%/90% dPS/PBMA Polymer Blend
100 kPa27.2 MPa54.4 MPa81.6 MPa
I(0)
Temperature (oC)
Phase Shifts
UCST LCST and UCST
mixed phase
phaseseparated
composition
Temp
dPS/PVME
pressure
LCST

HV
dPdT
ΔΔ
=
Volume change upon mixing
The Clausius-ClapeyronEquation
Enthalpy change upon mixing
phaseseparated
mixed phase
composition
Temp
dPMB/PEB
pressureΔH>0, ΔV>0
mixed phase
phaseseparated
composition
Temp
dPS/PVME
pressureΔH<0, ΔV<0
phaseseparated
phaseseparated
mixed phase
composition
Temp
dPS/PBMA
pressure
pressureΔH>0, ΔV<0
ΔH<0, ΔV<0

C – Crystalline Lamellae
z
Region B is crystalline
Region A is amorphous
Q
θ = cos-1(μ)
Region C is solvent
Q
z
z
z
lamellar stack

10-4
10-3
10-2
10-1
100
101
102
103
104
0.01 0.1
4 % PEO/d-ethanol, MW
= 50,000 g/mol
23 oC 35 oC 45 oC
Sca
tterin
g In
tens
ity (c
m-1
)
Scattering Variable Q (Å-1)
SANS Density Measurement
0.86
0.87
0.88
0.89
0.9
0.91
0.92
10 20 30 40 50 60 70
4% PEO/d-ethanol
HeatingCooling
Den
sity
(g/c
m3 )
Temperature (oC)
Crystalline Lamellae
crystalline
amorphous

0.001
0.01
0.1
1
10
100
1000
104
105
0.01 0.1
15 % PEO/d-Ethanol, Mw = 90,000 g/mol
Model FitSANS Data
Sca
ttere
d In
tens
ity (c
m-1
)
Scattering Variable Q (Å-1)
Lamellar stacks volume fraction φS = 0.36Lamellae radius R = 10,757 ÅThickness of the amorphous region LA = 3 ÅLamellar thickness LB = 50 ÅSLD of the amorphous region ρA = 4.15*10-6 Å-2
SLD of the crystalline region ρB = 7.67*10-7 Å-2
SLD of the d-ethanol region rS = 6.07*10-6 Å-2
Number of lamellae per stack NL = 6.86
Lamellar Stack Model
Model
1/Q2

Transmission Electron Microscopy Electron Diffraction
Morphology

D – Protein Complex
sensor domain
CA domain
DHp stalk
CA domain
ATPphosphate
group
SpoA
Histidineon KinA
Sda
KinA
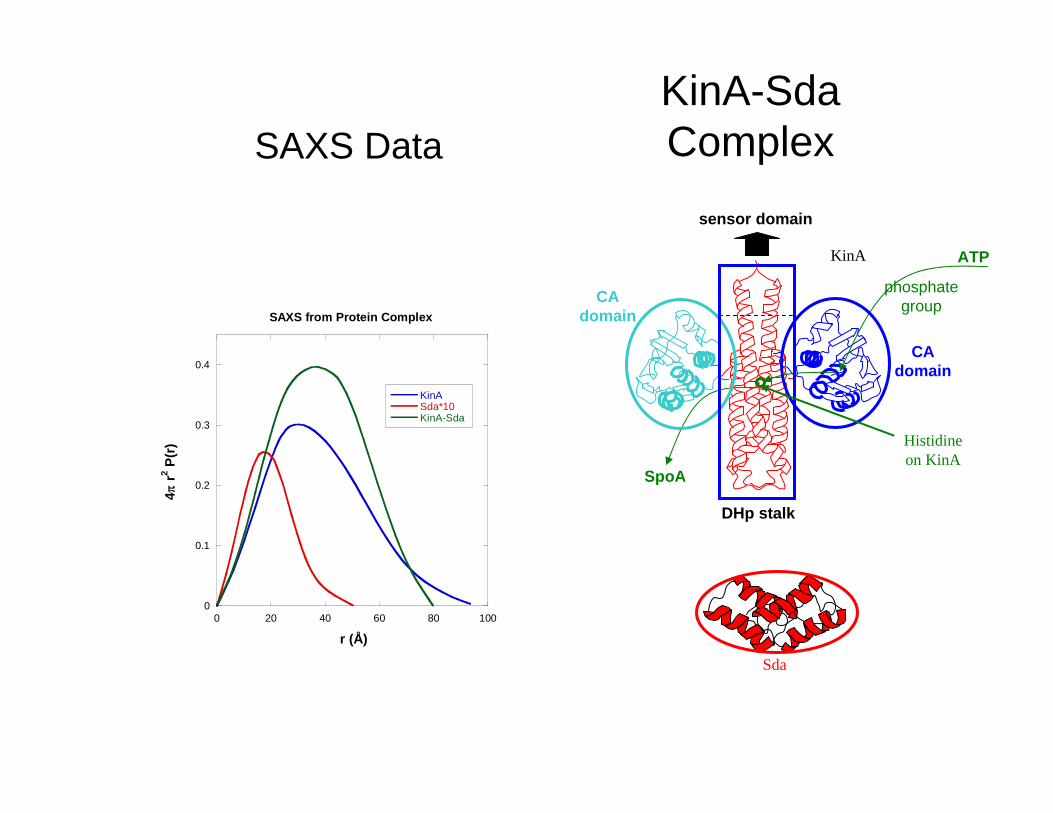
0
0.1
0.2
0.3
0.4
0 20 40 60 80 100
SAXS from Protein Complex
KinA Sda*10 KinA-Sda
4π
r2 P(r
)
r (Å)
KinA-SdaComplex
Sda
ATP
sensor domain
CA domain
DHp stalk
CA domain
phosphategroup
SpoA
Histidineon KinA
KinA
SAXS Data

D
Particle 2
Particle 1
-0.002
0
0.002
0.004
0.006
0.008
0.01
0.012
0.014
0 20 40 60 80
SANS from Protein Complex
P11
(r), KinA P
22(r), d-Sda*10
2P12
(r), KinA/d-Sda
4π
r2 P(r
)
r (Å)
SANS Data
KinA
SdA
KinA-SdaComplex
DHp Stalk on KinA
Sda
CA Domain on KinA
CA Domain on KinA
Histidineon KinA
ATP
phosphategroup
SpoA

6. GALLERY OF SANS DATA IMAGES

Sheared Multilayer Vesicles
120
100
80
60
40
20
0
120100806040200
-0.10 -0.05 0.00 0.05 0.10
-0.10
-0.05
0.00
0.05
0.10
3.0
2.8
2.6
2.4
2.2
2.0
1.8
120
100
80
60
40
20
0
120100806040200
-0.10 -0.05 0.00 0.05 0.10
-0.10
-0.05
0.00
0.05
0.10 2.5
2.0
1.5
1.0
0.5
0.0
120
100
80
60
40
20
0
120100806040200
-0.10 -0.05 0.00 0.05 0.10
-0.10
-0.05
0.00
0.05
0.104.0
3.5
3.0
2.5
2.0
1.5
120
100
80
60
40
20
0
120100806040200
-0.10 -0.05 0.00 0.05 0.10
-0.10
-0.05
0.00
0.05
0.103.0
2.5
2.0
1.5
1.0
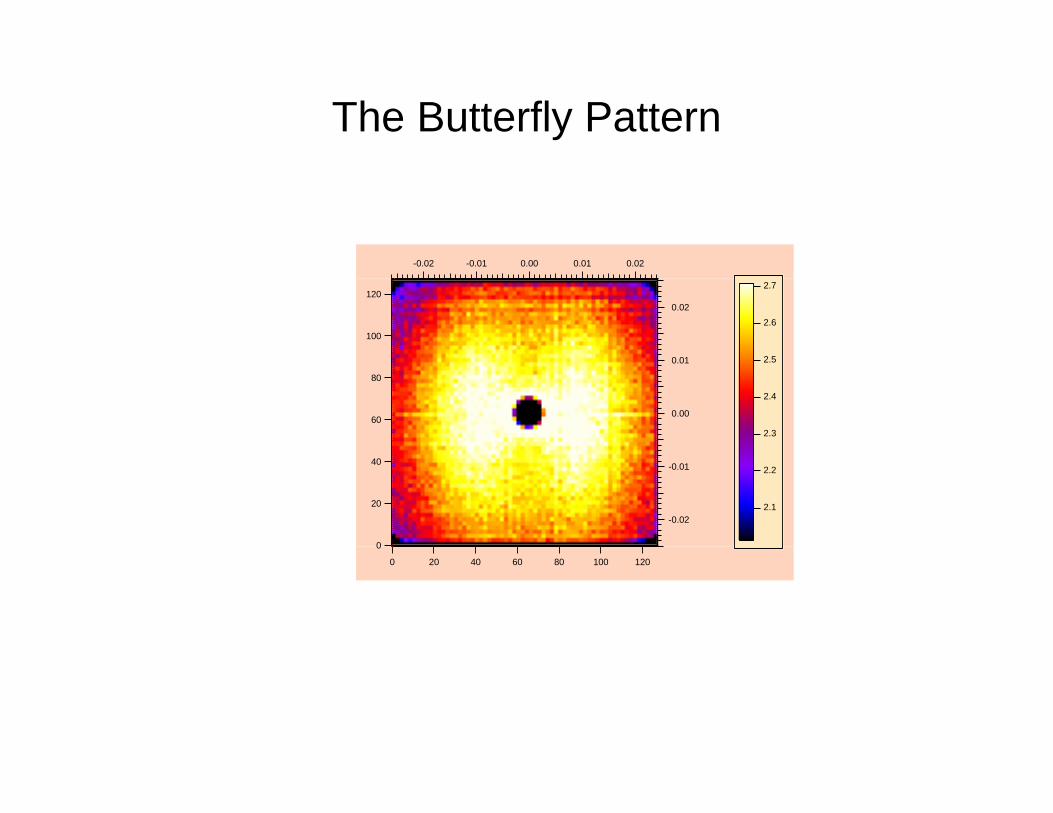
The Butterfly Pattern
120
100
80
60
40
20
0
120100806040200
-0.02 -0.01 0.00 0.01 0.02
0.02
0.01
0.00
-0.01
-0.02
2.7
2.6
2.5
2.4
2.3
2.2
2.1

Packed Spheres
120
100
80
60
40
20
0
120100806040200
-0.008 -0.004 0.000 0.004
-0.008
-0.006
-0.004
-0.002
0.000
0.002
0.004
0.006
0.008
3.0
2.5
2.0
1.5
1.0
0.5
0.0

Kangaroo Tail Tendon
120
100
80
60
40
20
0
120100806040200
-0.08 -0.04 0.00 0.04
-0.08
-0.06
-0.04
-0.02
0.00
0.02
0.04
0.06
0.08 3.5
3.0
2.5
2.0
1.5
1.0
0.5
0.0
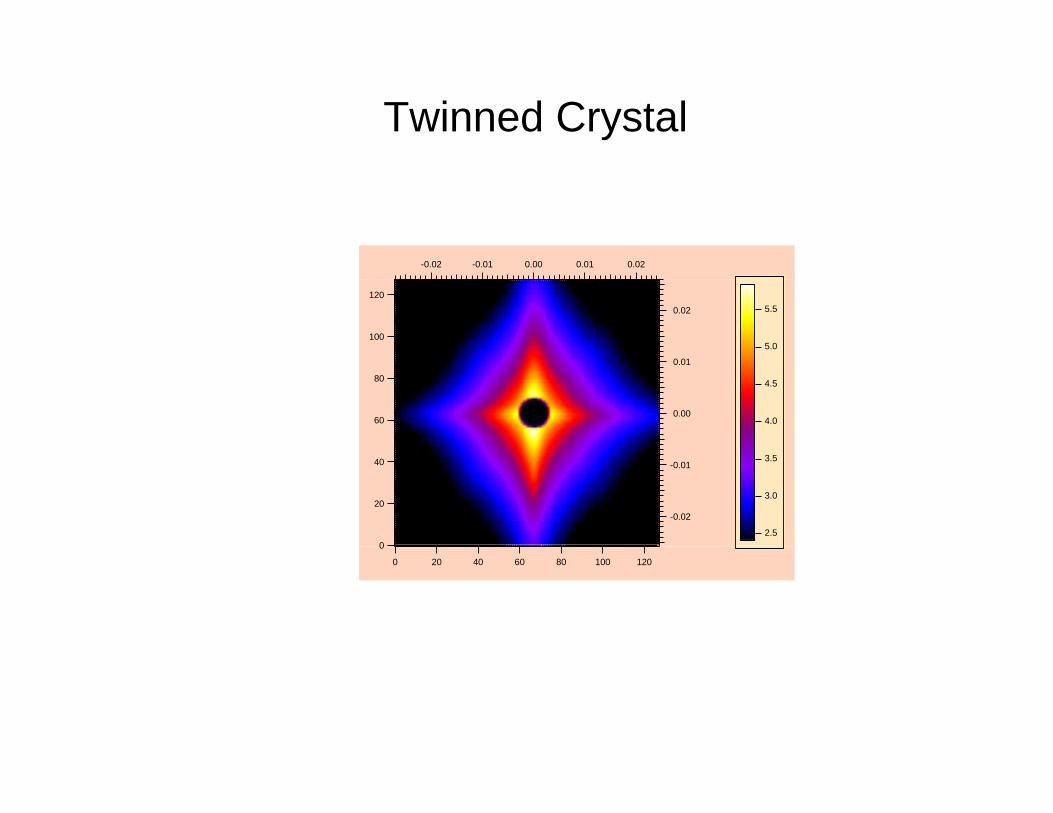
Twinned Crystal
120
100
80
60
40
20
0
120100806040200
-0.02 -0.01 0.00 0.01 0.02
0.02
0.01
0.00
-0.01
-0.02
5.5
5.0
4.5
4.0
3.5
3.0
2.5

Peptides Oriented in Membranes
120
100
80
60
40
20
0
120100806040200
-0.2 -0.1 0.0 0.1
-0.2
-0.1
0.0
0.1
4.5
4.0
3.5
3.0
2.5
2.0
1.5
120
100
80
60
40
20
0
120100806040200
-0.2 -0.1 0.0 0.1
-0.2
-0.1
0.0
0.1
3.5
3.0
2.5
2.0
120
100
80
60
40
20
0
120100806040200
-0.2 -0.1 0.0 0.1
-0.2
-0.1
0.0
0.1
4.0
3.5
3.0
2.5
2.0
120
100
80
60
40
20
0
120100806040200
-0.2 -0.1 0.0 0.1
-0.2
-0.1
0.0
0.1
4.0
3.5
3.0
2.5
2.0
1.5
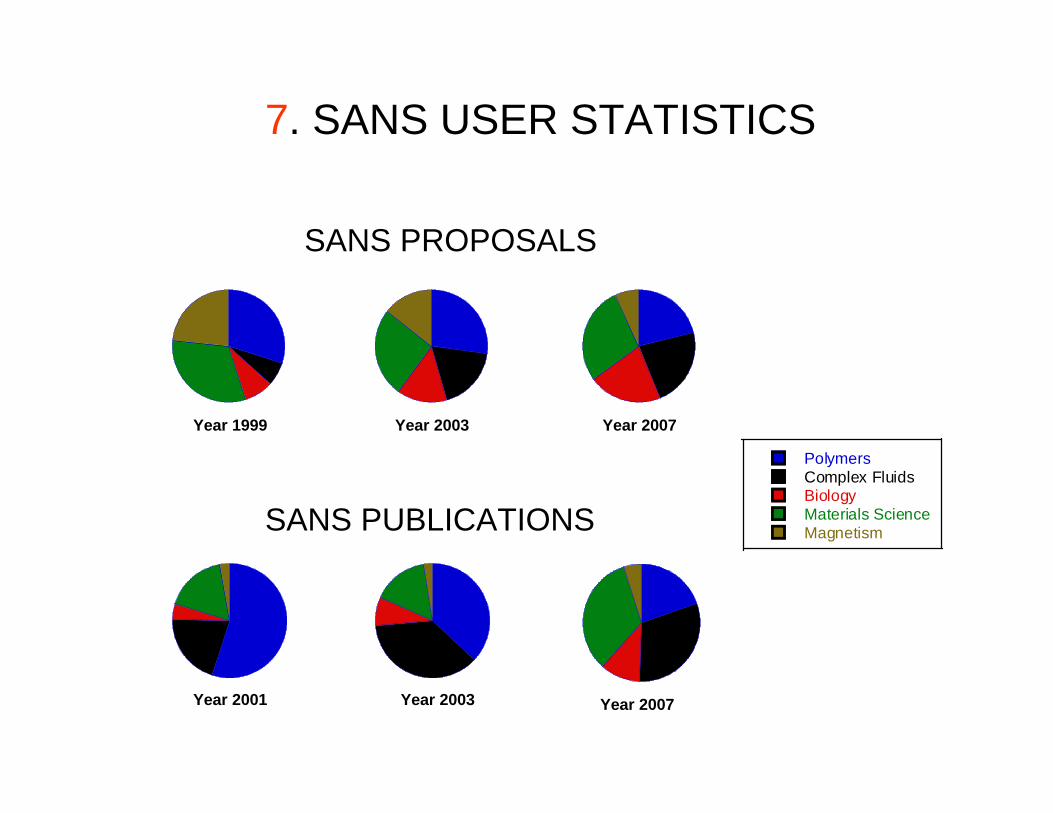
Year 2007Year 2003Year 1999
PolymersComplex FluidsBiologyMaterials ScienceMagnetism
Year 2007Year 2003Year 2001
SANS PROPOSALS
SANS PUBLICATIONS
7. SANS USER STATISTICS

FINAL WORDS
THE SANS PROGRAM AT NIST200 experiments per year15 theses per year70 publications per year
OTHER CHARACTERIZATION METHODSSmall-Angle X-Ray ScatteringElectron Microscopy
PROBING NANOSCALE STRUCTURES –THE SANS TOOLBOX
http://www.ncnr.nist.gov/staff/hammouda/the_SANS_toolbox.pdf
ACKNOWLEDGMENTSDerek Ho, Nitash Balsara, Jill Trewhella, Steve Kline