bound bisphosphonate in the presence of simulated body
TRANSCRIPT

1
Supplementary Information for:Interaction of microfibrous borate bioactive glass dressing with bone-
bound bisphosphonate in the presence of simulated body fluid
Chandrani Pramanik,a,† Tianda Wang,b,† Sushanta Ghoshal,a Lina Niu,c Bradley Newcomb,a Yaodong Liu,a Carolyn M. Primus,d Hailan Feng,b* David H. Pashley,e Satish Kumara,* and Franklin R. Taye,*
aSchool of Materials Science and Engineering, Georgia Institute of Technology, Atlanta, Georgia, 30332 (USA). Email: [email protected]
bDepartment of Prosthodontics, Peking University School and Hospital of Stomatology,Beijing,100081 (P.R. China) E-mail: [email protected];
Fax: +861062173402; Tel: +861082195232cState Key Laboratory of Military Stomatology, School of Stomatology
, Fourth Military Medical University, Xi’an, 710032 (P.R. China)d7046 Owl’s Nest Terrace, Bradenton, FL (USA)
eGeorgia Regents University, Augusta, Georgia, 30912-1129 (USA). E-mail: [email protected]; Fax: (706)721-6252; Tel: (706)7212031
† These authors contributed equally to this work.
Electronic Supplementary Material (ESI) for Journal of Materials Chemistry B.This journal is © The Royal Society of Chemistry 2015

2
S1 Materials and methods
1.1 Starting materials Microfibrous borate bioactive glass (BBG) dressings (GL1550) with the composition 53.8 B2O3, 20.0
CaO, 12.1 K2O, 4.6 Na2O, 4.6 MgO, 3.8 P2O5 (in wt%) were obtained from Mo-Sci Corp. (Rolla, MO, USA). The composition was confirmed with X-ray fluorescence analysis by the manufacturer.
Simulated body fluid (SBF) was prepared according to the method described by Kokubo et al.1 The requisite amounts of reagent grade sodium chloride, sodium bicarbonate, potassium chloride, calcium chloride, dibasic potassium phosphate, sodium sulfate and magnesium chloride (Sigma-Aldrich, St. Louis, MI, USA) were dissolved in deionised water. The pH of the solution was adjusted to 7.25 at 36.5 °C using 50 mM tris(hydroxymethyl)aminomethane and approximately 45 mM HCl. The ionic concentrations of the SBF (in mM) were 142.0 Na+, 5.0 K+, 1.5 Mg2+, 2.5 Ca2+, 148.8 Cl-, 4.2 HCO3
-, 1.0 HPO4
2- and 0.5 SO42-.
1.2 Dissolution of BBG microfibrous dressing in water To examine the differential dissolution of the shot and fibre components of the BBG in water, 0.4 g
of BBG was immersed in 40 mL of deionised water. After blending, the mixture was divided into 2 aliquots, each containing 200 mg of BBG in 20 mL of deionised water. The samples were kept in sealed polyethylene bottles for 2 hr or 4 hr at 37 °C. At the designated time period, BBG materials that remained were retrieved by filtering through 0.1 μm filters (EMD Millipore, Billerica, MA USA), lyophilised, sputter-coated with Au/Pd and examined with a field emission-scanning electron microscope (FE-SEM. Model XL-30 FEG; Philips, Eindhoven, The Netherlands) at 10 keV. Dried BBG was examined by SEM in the same manner.
1.3 Interaction of BBG microfibrous dressing with SBFOne gram of BBG microfibrous dressing was immersed in 100 mL of SBF. After gentle blending, the
mixture was divided equally into 5 aliquots (each containing 200 mg of BBG in 20 mL of SBF) and kept in sealed polyethylene bottles for 12 hr, 1 day, 4 days, 7 days or 12 days at 37 °C. At the designated time period, the BBG materials were retrieved by filtering, washed twice with deionised water and lyophilised.
1.3.1 Morphological examinationMicrofibrous BBG dressings after immersion in SBF were lyophilised, sputter-coated with Au/Pd
and examined using FE-SEM as previously described. For transmission electron microscopy (TEM), BBG specimens were sonicated in methanol for 2 min. A drop of the dispersed solution was placed on a Lacey carbon grid (LC300-Cu, Electron Microscopy Sciences, Hatfield, PA, USA) and dried thoroughly before imaging. Images of carbon-coated, as-received and reacted BBG were acquired using the 100CX II TEM (JEOL, Peabody, MA, USA) at 100 keV.
1.3.2 Compositional and chemo-analytical characterisation Infrared spectra of as-received and reacted BBG specimens were obtained using a 6700 Fourier
transform-infrared spectrophotometer with a diamond attenuated total reflection set-up (Thermo Fisher Scientific Inc., Waltham, MA, USA). Raman spectra were collected using a Holoprobe Research 785 Raman Microscope (Kaiser Optical Systems, Inc., Ann Arbor, MI, USA) at λ = 785 nm, using 600 grating with 10x optical lens for 20 sec acquisition time. Prior to recording Raman spectra for any specimen, the microprobe was calibrated with silicon wafer. Solid-state nuclear magnetic resonance spectroscopy was used to detect 11B and 31P in as-received BBG and in the 12-day specimens. 11B and 31P magic angle spinning (MAS) NMR measurements were performed using an Avance III 400 spectrometer (Bruker

3
BioSpin Corp., Billerica, MA, USA) at B0 of 9.4 T (corresponding 11B and 31P Larmor frequency of 128.4 MHz and 161.9 MHz, respectively). The MAS spinning speed was set to 10 kHz. Chemical shifts of 31P and 11B were referenced to ammonium dihydrogen phosphate and boric acid, respectively. For 11B MAS NMR, a single pulse with 1 msec duration and 14 sec repetition time was used to ensure that all 11B signals were fully relaxed prior to the next scan. To subtract the probe background, the signal of an empty rotor was measured under identical conditions. 31P experiments were performed under 1H high power decoupling with a pi/2 pulse duration of 5 msec and a repetition time of 600 sec, which was sufficient to enable relaxation.
Wide angle X-ray diffraction (XRD) patterns (1D and 2D) were acquired by Cu Kα radiation (k = 0.15418 nm), using a Micro Max 002 X-ray generator and R-axis IV++ detector system (Rigaku Americas Corp., The Woodlands, TX, USA). Semi-quartz glass capillary tubes (HR6-122, Hampton Research, Aliso Vuejo, CA, USA) with a diameter of 1 mm were used for the study. The XRD pattern was analysed using AreaMax and MDI Jade 7 softwares. Selected area electron diffraction (SAED) patterns were recorded using the JEOL 100CX II TEM at 100 keV with 60 cm camera length. The calculated d-spacing values were matched with those obtained from XRD analysis. The camera constant value was verified by standard Au crystal particles. The elemental composition of unreacted and SBF-immersed BBG microfibrous dressings and the corresponding Ca/P ratios were determined using TEM-energy dispersive X-ray spectroscopy (TEM-EDX) and X-ray photoelectron spectroscopy (XPS). TEM-EDX was performed using a Tecnai F30 transmission electron microscope (FEI, Hillsboro, OR, USA) at 200 keV, on the same carbon-coated grids used for TEM imaging. The K-α XPS system (Thermo Fisher Scientific Inc.) with a spot size of 400 µm was used for recording the XPS survey scan, as well as high resolution spectra of the individual elements (B, Ca, K, Na, Mg, O and P); data was analysed using Avantage software.
1.4 Degradation of BBG microfibrous dressing and ion-leachingWeight loss of the BBG dressing after immersion in SBF was performed at a ratio of 1 g of dressing
per 100 mL of SBF. Immersion was performed in a sealed polyethylene bottle at 37 °C for up to 12 days, with the system shaken once every day. At designated time periods, the reacted BBG was retrieved, gently rinsed twice with deionised water and lyophilised using a freeze dryer (FreeZone 4.5, Labconco Corporation, MO, USA). Gravimetric measurements were performed using an XP6 Microbalance (Mettle Toledo, Tokyo, Japan). Measurements for each point were performed in duplicate.
To examine the pH changes associated with hydrolytic degradation of the BBG dressing, 1 g of BBG was immersed in 50 mL of SBF. The solution was stored at 37 °C for 15 days, with the system shaken once every day. At designated time periods, the pH value of SBF was measured using a pH meter (Orion 3 star, Thermo Scientific, Beverly, MA, USA) at room temperature.
Leaching of ionic species from the BBG into SBF over time was quantified by inductively coupled plasma-mass spectrometry (ICP-MS) and spectrophotometric determinations. Evaluation of the B, Ca, K, Mg, Na, and P leachate in SBF by ICP-MS was conducted using a NexION® 300Q spectrometer (PerkinElmer, Waltham, MA, USA). Five millilitre aliquots of SBF were retrieved individually from sealed polyethylene bottles containing BBG dressings that had been immersed in SBF for 0 hr, 12 hr, 1 day, 4 days, 7 days or 12 days. Each aliquot was centrifuged for 10 min at 8,000 rpm to remove particulates in the solution prior to elemental analysis. The concentration of the sample solutions was adjusted per ICP-MS analysis requirements by diluting with 1 wt% nitric acid.
For spectrophotometric determination of the concentrations of Ca2+, (PO4)3- and (BO3)3- ions, 1 g of BBG was immersed in 100 mL SBF for each of the ions to be determined. The solutions were stored in

4
sealed polyethylene bottles at 37 °C for up to 15 days. At designated immersion times, the pH of the solutions was measured. The concentrations of calcium, phosphate and borate ions were determined spectrophotometrically using the O-cresolphthalein complexone method for calcium ions, bismuth-phosphomolybdate complex method for phosphate ions, and the curcumin test method (ASTM D3082 standard) for borate ions.2-4 An UV-visible light spectrophotometer (UV-160A, Shimadzu, Columbia, MD, USA) equipped with a pair of 1 cm quartz-matched cells was used for all spectral measurements.
1.5 Interactions of BBG dressing with unbound and bone-bound bisphosphonate
1.5.1 Preparation of bisphosphonate-bound bone powderFour kinds of aminobisphosphonates, risedronate sodium (Mw 305.09; Sigma-Aldrich), alendronate
sodium trihydrate (Mw 325.12; Sigma-Aldrich), pamidronate disodium salt hydrate (Mw 279.03; Sigma-Aldrich) and zoledronic acid monohydrate (Mw 290.10; Sigma-Aldrich), were selected for evaluation. The bisphosphonates were dissolved in deionised water to produce solutions with a concentration of 1g/mL.
Bovine bone obtained freshly from a local abattoir was sectioned into small pieces with a bone saw, delipidated in a solution of 1:1 chloroform-methanol for 4 hr, and placed in liquid nitrogen inside stainless steel screw-top jars. The jars were triturated in a ball-mill (Model MM201, Retsch Inc., Newtown, PA, USA) for 15 min at 30 Hz to produce crude bone powder. The resulting powder was pass through a series of sieves to generate a refined bone powder with a mean particle size less than 50 μm in diameter.5 The bone powder was kept frozen at -80 °C until use to prevent degradation of the collagen component.
Thawed bone powder was immersed in the bisphosphonate solution at a ratio of 1 mg powder to 1 mL of bisphosphonate solution. The mixture was kept at room temperature in a sealed container for 72 hr under shaking. The bisphosphonate-treated bone powder was rinsed twice with deionised water, further dialysed against deionised water for 48 hr and lyophilised. The amount of bone-bound risedronate was calculated from a regression equation that correlates risedronate concentration with colour intensity, and was found to be 1.046 μmol/mg. The amounts of bisphosphonates (risedronate, alendronate, pamidronate and zoledronate) bound to bone powder were determined by demineralising the respective bisphosphonate-treated bone powder in 2M perchloric acid. The concentrations of risedronate, alendronate, pamidronate and zoledronate in supernatant obtained were determined using the Fe (III) spectrophotometric method (λmax 290 nm).7 The amounts of bone-bound bisphosphonate were calculated from regression equations the correlate bisphosphonate concentration with colour intensity, and were found to be 0.44 μmol/mg for alendronate, 3.24 μmol/mg for pamidronate and 3.72 μmol/mg for zoledronate, respectively.
1.5.2 Sequestration of bone-bound bisphosphonate Four hundred milligrams of bisphosphonate-treated bone powder was immersed in 100 mL of
previously-prepared SBF containing leached ions derived from the BBG dressing, or 100 mL of virgin SBF (control). The mixtures were kept at room temperature for 24 hr under shaking. At designated time points, the concentration of bisphosphonate in the supernatant of each mixture was determined using the aforementioned copper (II) sulphate or Fe (III) spectrophotometric methods.6, 7 Experiments were performed in duplicate.
At the end of the 24-hr immersion period, the bone powder in the corresponding solution mixture was retrieved, rinsed twice with deionised water, dialysed against deionised water for 48 h and lyophilised.

5
Infrared spectra of bisphosphonate treated bone powder before and after immersion in BBG-treated SBF were obtained using the 6700 FT-IR spectrophotometer with a diamond attenuated total reflection set-up.
1.5.3 Reaction of unbound bisphosphonate with leached ions derived from BBG dressing To determine the fate of free bisphosphonate after it was extracted from bone powder,
bisphsophonate solutions were prepared with a concentration of 1g/mL. SBF containing leached ions derived from the BBG dressing was prepared by immersing 1 g of BBG in 50 mL of SBF for 72 hr in a sealed container, with the system shaken once daily. The supernatant from the BBG-treated aqueous solution was added dropwise to an equal volume of the bisphosphonate solution. The mixture was kept overnight in a closed vial, at room temperature under shaking. The resulting precipitate was rinsed twice with deionised water and lyophilised. Infrared spectra of bisphosphonate sodium salts and bisphosphonate precipitates were obtained as described previously.
6
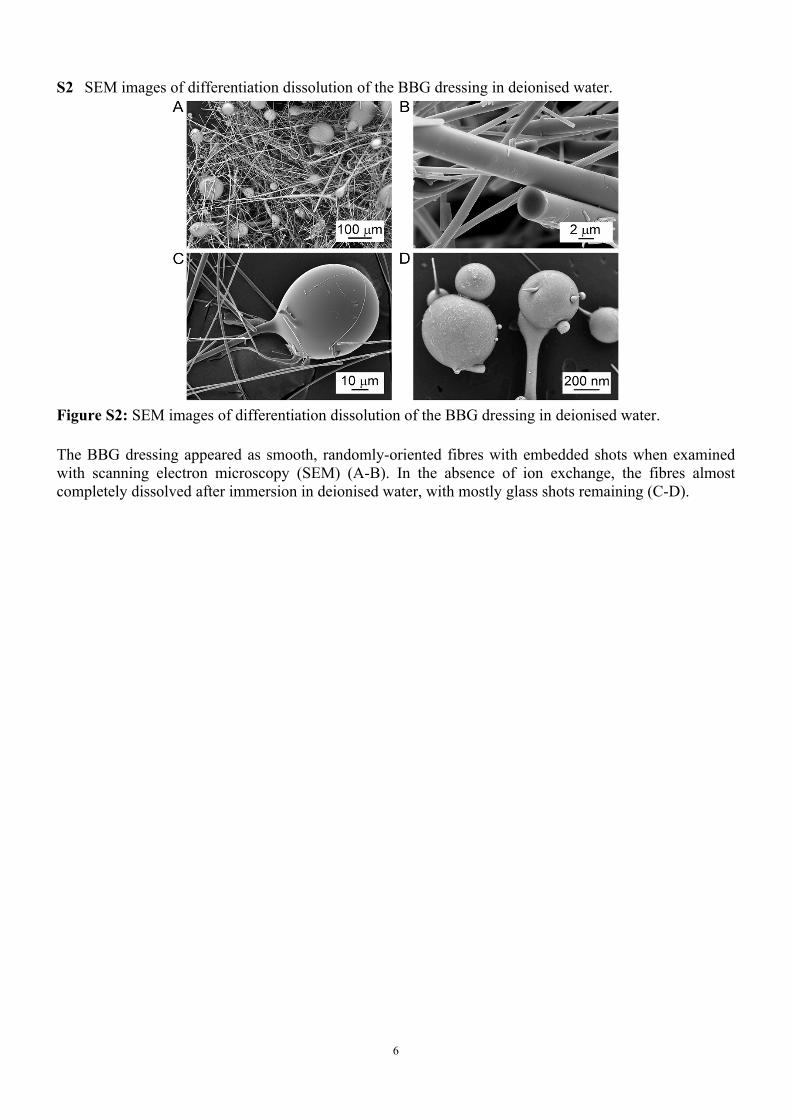
S2 SEM images of differentiation dissolution of the BBG dressing in deionised water.
Figure S2: SEM images of differentiation dissolution of the BBG dressing in deionised water.
The BBG dressing appeared as smooth, randomly-oriented fibres with embedded shots when examined with scanning electron microscopy (SEM) (A-B). In the absence of ion exchange, the fibres almost completely dissolved after immersion in deionised water, with mostly glass shots remaining (C-D).

7
S3 TEM images of BBG fibres before and after immersion in SBF
Figure S3. TEM images of BBG fibres before and after immersion in SBF.
A) Fibre prior to SBF immersion. B) After immersion in SBF for 12 hr, the core-shell structure of the modified fibres was identifiable by increase in electron density of the outer shell (arrow). Arrowheads: extrafibrillar globules. C) Fibre with fully loaded core. Intrafibrillar globules were exposed by fracture of the fibre shell (pointer). D) Fibre with complete replacement of its electron-dense outer shell by superimposed globular aggregates.

8
S4 Chemoanalytical analyses of the BBG dressing after immersion in SBF
4.1 FT-IR spectroscopyNormalised infrared spectra of the as-received BBG dressing and dressings immersed in SBF for
different time periods (12 hr, 1, 4, 7 and 12 days) were compared with the spectrum derived from hydroxyapatite. Characteristic resonance peaks of B-O stretching and bending modes of the -BO3 group were found at 1280–1580 cm-1 (B3: 1373 cm-1) and 640–780 cm-1 (B1: 712 cm-1), respectively. The broad band at 790–1120 cm-1 (B2: 924 cm-1) corresponded to the B–O stretching mode of the BO4 group.8
These peaks, which were present in the as-received BBG dressing, were reduced after the dressings were immersed in SBF. Commercial hydroxyapatite shows a strong peak at 900–1140 cm-1 (P3: 1020 cm-1) with two shoulders (1084 and 960 cm-1), all attributed to the triply-degenerate asymmetric stretching mode of the P-O bond. Another peak at around 530–630 cm-1 (P1: 565 cm-1), with a sharp shoulder at 600 cm-1, is part of triply-degenerate bending mode of P-O bond.9 Similar phosphate peaks were also detected for the SBF-treated BBG dressing, with minor shifts in P-O asymmetric stretching. These shifts were caused by the presence of CO3
2− groups in nonstoichiometric apatite. This was supported by the presence of the stretching mode at 1650–1450 cm-1 (C1: 1410 cm-1 and C3: 1645 cm-1), and bending mode at 820–890 cm-1 (C1: 874 cm-1), consistent with the CO3
2− group in carbonated apatite.10
4.2 Raman spectroscopyNormalised Raman spectra were collected from the same specimens used for FI-IR spectroscopy. The
intensity of a broad borate band in the as-received BBG, at ~1243 cm-1,11 became weaker with increasing SBF immersion time. A sharp peak corresponding to the totally symmetric stretching mode of the tetrahedral PO4 group (P-O) was slightly shifted (949 cm-1), when compared to that of hydroxyapatite (957 cm-1).9 The shifted peak was not consistent with that of OCP. The symmetric stretching mode for the P-O bond in OCP usually appears very sharp at 957 cm-1, with a shoulder at ~966 cm-1.12 Although P-O stretching peaks corresponding to the apatite peak in the reacted BBG specimens were shifted negatively by ~8 cm-1, the absence of an associated shoulder peak suggests the absence of the OCP phase. The peaks associated to the triply- and doubly-generated bending mode of the PO4 group (O-P-O bond) were also detected at the 370-780 cm-1 region. These peaks appeared to be broader but stronger when compared to the peaks present in hydroxyapatite.
4.3 NMR spectroscopyThe 11B MAS spectra contained a sharp central peak and relatively small sidebands. The sharp peak
was assigned to tetrahedral BO4 structure. The broad shoulder was assigned to BO3 due to the second-order quadruple interaction of planar triangular structures.13 The BBG specimens before and after immersion in SBF showed similar NMR parameters, indicating that boron in these specimens was in similar local chemical environments. Based on a semi-quantitative comparison obtained from the integration of the NMR absolute peak area and calibrated using the respective specimen weight employed in the experiment, the 12-day specimen was found to contain 8% less boron than the as-received specimen. The spin-lattice relaxation time (T1) of these specimens was in the range of 2 sec and full recovery of the NMR signals was ensured using a repetition time longer than 5 T1.
The 31P MAS spectrum of the as-received BBG dressing showed a peak at 2.71 ppm, whereas a peak at 2.26 ppm could be seen after the dressing was immersed in SBF for 12 days. The peak at 2.26 ppm might be attributed to the formation of apatite.14 The T1 relaxation time of the BBG was >500 sec, which was reduced to ~120 sec for the 12-day specimen. A full recovery of the NMR signal for BBG was not performed due to the long repetition time and consequently, a semi-quantitative comparison was not

9
performed. Furthermore, the 31P MAS NMR spectrum of OCP showed peaks from -0.2 to 3.7 ppm,15 which would overlap with the present spectra if this calcium phosphate phase was present in the 12-day BBG specimen.
4.4 XRDThe as-received BBG was amorphous, as evidenced by the presence of only two broad bands
centreed at around 30º and 45º. Those two amorphous bands were also reflected in the SBF-treated BBG specimens. Small crystalline spikes could be identified as early as 12 hr after SBF immersion. The most commonly identified peak for all reacted BBG specimens was at 32º, corresponding to the (211) plane of hydroxyapatite. The d-spacing corresponding to the Bragg angle 2θ = 31.76º is 2.815 Å, whereas that of hydroxyapatite at 2θ = 31.764º (211 plane) is 2.8148 Å.9 Weaker, non-uniform peaks were also identified from the reacted BBG specimens, which were assigned to the (100), (002) (300), (202), (130) and (213) planes of hydroxyapatite.
4.5 TEM-SAEDOnly an amorphous halo was observed for the as-received BBG dressing. By contrast, discontinuous
diffraction rings were detected for BBG specimens that had been immersed in SBF, with increases in crystallinity of the mineral phase over the 12 days of immersion. The d-spacing of 2.82 Å for the SAED ring patterns in those SBF-treated BBG specimens was in close agreement with the aforementioned XRD data.
Figure S4. A) Infrared, and B) Raman spectra of hydroxyapatite (HAp), and BBG dressings before and after immersion in SBF. C) 11B and 31P MAS NMR spectra of the BBG dressing before and after immersion in SBF for 12 days.
10
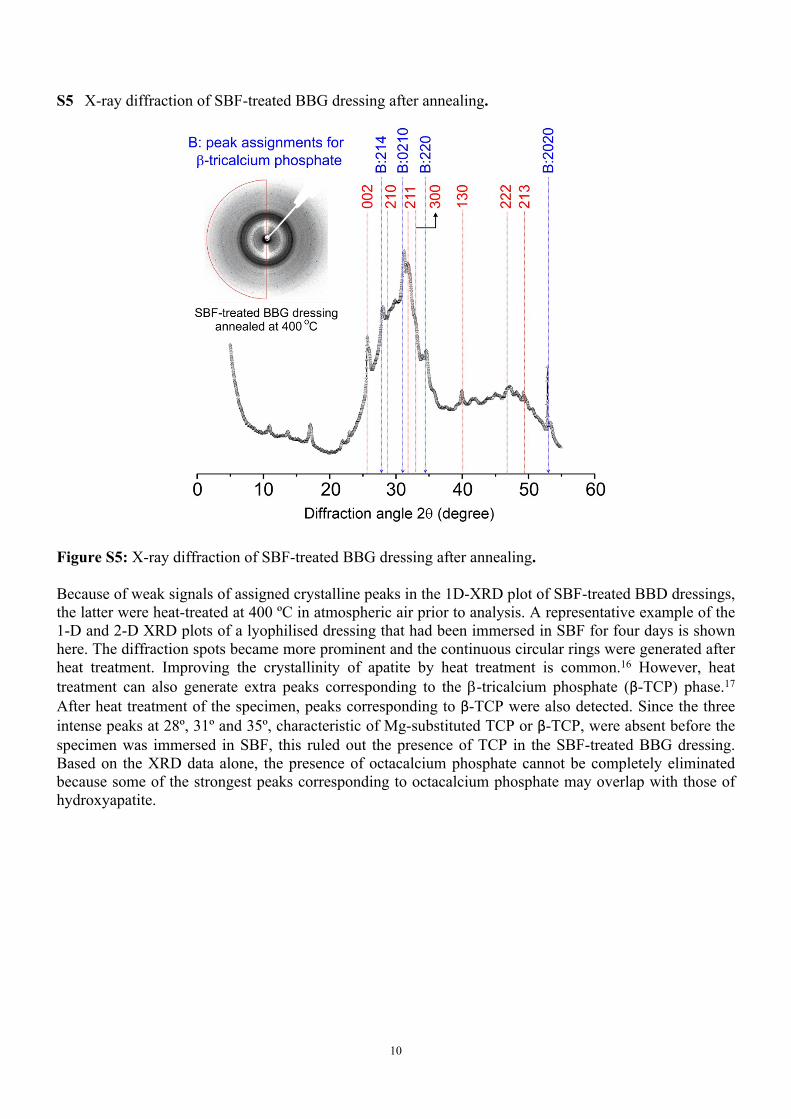
S5 X-ray diffraction of SBF-treated BBG dressing after annealing.
Figure S5: X-ray diffraction of SBF-treated BBG dressing after annealing.
Because of weak signals of assigned crystalline peaks in the 1D-XRD plot of SBF-treated BBD dressings, the latter were heat-treated at 400 ºC in atmospheric air prior to analysis. A representative example of the 1-D and 2-D XRD plots of a lyophilised dressing that had been immersed in SBF for four days is shown here. The diffraction spots became more prominent and the continuous circular rings were generated after heat treatment. Improving the crystallinity of apatite by heat treatment is common.16 However, heat treatment can also generate extra peaks corresponding to the -tricalcium phosphate (β-TCP) phase.17 After heat treatment of the specimen, peaks corresponding to β-TCP were also detected. Since the three intense peaks at 28º, 31º and 35º, characteristic of Mg-substituted TCP or β-TCP, were absent before the specimen was immersed in SBF, this ruled out the presence of TCP in the SBF-treated BBG dressing. Based on the XRD data alone, the presence of octacalcium phosphate cannot be completely eliminated because some of the strongest peaks corresponding to octacalcium phosphate may overlap with those of hydroxyapatite.

11
S6 High resolution XPS spectra of B 1s, Mg 1s, K 2p and Na 1s
Figure S6: High resolution XPS spectra of B 1s, Mg 1s, K 2p and Na 1s
12
S7 Biocompatibility of ions leached from BBG
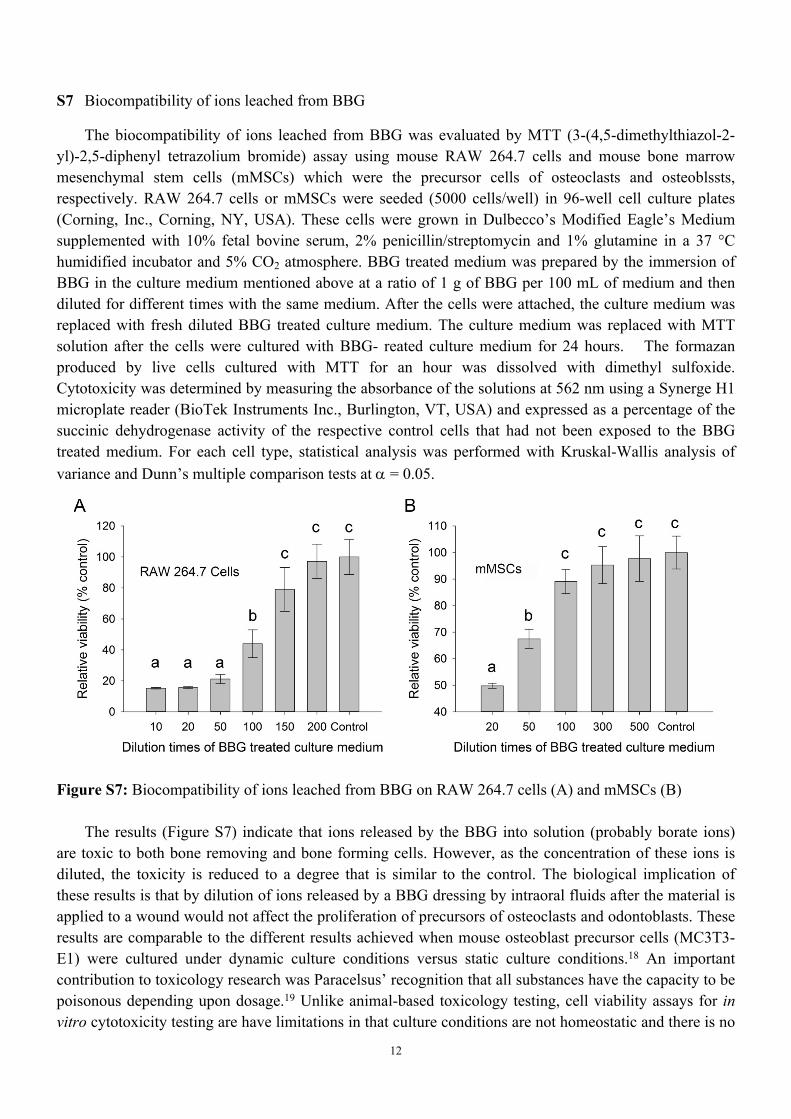
The biocompatibility of ions leached from BBG was evaluated by MTT (3-(4,5-dimethylthiazol-2-yl)-2,5-diphenyl tetrazolium bromide) assay using mouse RAW 264.7 cells and mouse bone marrow mesenchymal stem cells (mMSCs) which were the precursor cells of osteoclasts and osteoblssts, respectively. RAW 264.7 cells or mMSCs were seeded (5000 cells/well) in 96-well cell culture plates (Corning, Inc., Corning, NY, USA). These cells were grown in Dulbecco’s Modified Eagle’s Medium supplemented with 10% fetal bovine serum, 2% penicillin/streptomycin and 1% glutamine in a 37 °C humidified incubator and 5% CO2 atmosphere. BBG treated medium was prepared by the immersion of BBG in the culture medium mentioned above at a ratio of 1 g of BBG per 100 mL of medium and then diluted for different times with the same medium. After the cells were attached, the culture medium was replaced with fresh diluted BBG treated culture medium. The culture medium was replaced with MTT solution after the cells were cultured with BBG- reated culture medium for 24 hours. The formazan produced by live cells cultured with MTT for an hour was dissolved with dimethyl sulfoxide. Cytotoxicity was determined by measuring the absorbance of the solutions at 562 nm using a Synerge H1 microplate reader (BioTek Instruments Inc., Burlington, VT, USA) and expressed as a percentage of the succinic dehydrogenase activity of the respective control cells that had not been exposed to the BBG treated medium. For each cell type, statistical analysis was performed with Kruskal-Wallis analysis of variance and Dunn’s multiple comparison tests at = 0.05.
Figure S7: Biocompatibility of ions leached from BBG on RAW 264.7 cells (A) and mMSCs (B)
The results (Figure S7) indicate that ions released by the BBG into solution (probably borate ions) are toxic to both bone removing and bone forming cells. However, as the concentration of these ions is diluted, the toxicity is reduced to a degree that is similar to the control. The biological implication of these results is that by dilution of ions released by a BBG dressing by intraoral fluids after the material is applied to a wound would not affect the proliferation of precursors of osteoclasts and odontoblasts. These results are comparable to the different results achieved when mouse osteoblast precursor cells (MC3T3-E1) were cultured under dynamic culture conditions versus static culture conditions.18 An important contribution to toxicology research was Paracelsus’ recognition that all substances have the capacity to be poisonous depending upon dosage.19 Unlike animal-based toxicology testing, cell viability assays for in vitro cytotoxicity testing are have limitations in that culture conditions are not homeostatic and there is no

13
elimination of toxic substances as there would be in vivo. While the lack of biotransformation capabilities is probably the best-known limitation in cell culture systems,20 the lack of defense mechanisms has probably a stronger impact on the precision of toxicity estimations.21 For example, the human body possesses a lymphatic system and periapical defenses such as polymorphonuclear leukocytes, plasma cells and macrophages to help eliminate toxic substances, which is not possible in in vitro cytotoxicity testing.

14
References1. T. Kokubo, H. Kushitani, S. Sakka, T. Kitsugi and T. Yamamuro, J. Biomed. Mater. Res, 1990, 24,
721.2. A. R. A. Nogueira, S. M. Brienza, E. A. Zagatto, J. L. Lima and A. N. Araújo, J. Agric. Food.
Chem., 1996, 44, 165.3. R. P. Mihajlovic, V. M. Kaljevic, M. P. Vukasinovic, L. V. Mihajlovic and I. D. Pantic, Water SA,
2007, 33, 513-517.4. American Society for Testing and Materials. Designation D3082-09: Standard Test Method for
Boron in Water. 2009.5. K. M. Kozloff, L. I. Volakis, J. C. Marini and M. S. Caird, J. Bone Miner. Res., 2010, 25, 1748.6. J. Kuljanin, I. Janković, J. Nedeljković, D. Prstojević and V. Marinković, J. Pharm. Biomed. Anal.,
2002, 28, 1215-.7. C. Gautam, A. K. Yadav and A. K. Singh, Int. Sch. Res. Notices, 2012, 2012.8. M. Markovic, B. O. Fowler and M. S. Tung, J. Res. Natl. Inst. Stand. Technol., 2004, 109, 553.9. A. Ślósarczyk, Z. Paszkiewicz and C. Paluszkiewicz, J. Mol. Struct., 2005, 744, 657.10. T. Yongxing, J. Zhonghong and S. Xiuyu, J. Non-Cryst. Solids, 1989, 112, 131.11. S. Koutsopoulos, J. Biomed. Mater. Res., 2002, 62, 600.12. B. Zhou, Z. Sun, Y. Yao and Y. Pan, Phy. Chem. Miner., 2012, 39, 363.13. C. Jäger, T. Welzel, W. Meyer-Zaika and M. Epple, Magn. Reson. Chem., 2006, 44, 573.14. Y.-H. Tseng, J. Zhan, K. S. Lin, C.-Y. Mou and J. C. Chan, Solid State Nucl. Magn. Reson., 2004,
26, 99.15. K. Kandori, S. Mizumoto, S. Toshima, M. Fukusumi and Y. Morisada, J. Phy. Chem. B, 2009,
113, 11016.16. X. Zhang, F. Jiang, T. Groth and K. S. Vecchio, J. Mater. Sci.: Mater. Med., 2008, 19, 3063.17. M. Arellano-Jiménez, R. García-García and J. Reyes-Gasga, J. Phys. Chem. Solids, 2009, 70, 390.18. R.F. Brown, M.N. Rahaman, A.B. Dwilewicz, W. Huang, D.E. Day, Y. Li and B.S. Bal, J.
Biomed. Mater. Res. A, 2009, 88, 392.19. K. Rozman and J. Doull, Toxicology, 2001, 160, 191.20. S. Coecke, H. Ahr, B.J. Blaauboer, S. Bremer, S. Casati, J. Castell J and et al.. Altern. Lab. Anim.
2006, 34, 49.21. T. Hartung and G. Daston, Toxicol. Sci. 2009, 111, 233.