bournemouth business school
TRANSCRIPT

The University of Bournemouth
Bournemouth Business School
Working Paper Series
PATTERNS OF SPECIALISATION IN THE INTERNATIONAL
TRADE OF FORMER SOVIET ECONOMIES
Jenifer Piesse
Allen Webster

Authors and affiliation:
Jenifer Piesse
Bournemouth University Business School
Email: [email protected]
and University of Stellenbosch, South Africa
Allan Webster
Bournemouth University Business School
Email: [email protected]
Abstract
This paper investigates patterns of comparative advantage and export specialisation in a selection of
former Soviet states, some of which have natural resource endowments while others do not. For the
former, common patterns of specialisation is found in the export of raw materials, both directly and
embodied in the goods that make intensive use of them. The latter group are more limited and there
exists only a small range of manufactures for which there are common patterns of advantage, most of
which are intensive in skilled labour. Bilateral factor content of trade between each of the countries is
also examined and many are found to be competitive outside the sample rather than with each other,
which makes the creation of a customs union less advantageous.
JEL classification: F13, F15, F47, P33
Keywords: trade, regional integration, CIS

PATTERNS OF SPECIALISATION IN THE INTERNATIONAL
TRADE OF FORMER SOVIET ECONOMIES
1. INTRODUCTION
Regional trade agreements continue to proliferate despite being economically inferior from a global
perspective to non-discriminatory trade liberalization on a most-favoured-nation (MFN) basis.
However, multilateral liberalisation and regional integration will continue to coexist in the future
(IMF, 2005). Thus, this paper examines the pattern of specialisation in international trade for a sample
of seven former Soviet countries, Armenia, Azerbaijan, Belarus, Georgia, Kazakhstan, Russia and
Ukraine in the context of both Customs Unions and future membership of the World Trade
Organisation. This is important for a number of reasons. Firstly, the extent to which countries are
competitive with each other has traditionally been seen as significant in the formation of a Customs
Union, and several of these are currently in such a union. Secondly, the pattern of specialisation in
trade has implications for countries who have either recently joined the WTO or are planning to do so.
And finally, patterns of specialisation of these countries are of interest in their own right. Recently,
improved data availability has made this region more accessible and, thus, increasingly the focus of
empirical research.
Of the sample countries, three are listed as WTO members: Armenia (2003), Georgia (2000)
and the Ukraine (2008), and the rest all have observer status. Media reports suggest that Russia plans
to conclude negotiations on membership in the near future. With respect to international trade both
economic theory and evidence predict that the liberalisation of trade expands exports of those goods in
which countries have a comparative advantage and expands imports for those goods in which they
have a comparative disadvantage. The current pattern of specialisation in international trade should
provide some guidance as to which goods are likely to be so affected. With respect to the pattern of
specialisation in different goods this should give a reasonable basis to identify short to medium term
effects. Over a longer period of time WTO membership is also likely to change this pattern of
specialisation. Thus, the paper also examines the current pattern of comparative advantage with
respect to underlying factors of production.
Russia, Belarus and Kazakhstan formed a Customs Union in July 2010 and other former
Soviet countries are also considering membership although there have been attempts to form a
Customs Union amongst former Soviet economies in the past. The basic economic theory of Customs
Union was proposed by Viner (1950) and remains the foundation of much more recent empirical
studies of international economic integration, for example, Clausing (2001). This established theory
emphasises the trade creation and trade diversion aspects of Customs Unions. Traditionally, trade
creation is thought more likely where member states are competitive with each other (allowing
cheaper partner country imports to replace more costly domestic production) and trade diversion more
likely where they are not (risking the substitution of higher cost partner country imports for lower cost
imports from third party countries). More modern studies, for example those dealing with the
European Union’s single market programme such as Allen et al (1998), emphasise the potential gains
from increased competition. The relevance of the pattern of export specialisation is that it helps to
establish where member states or potential member states might be expected to be competitive with
each other and where they are not.
The paper begins by briefly reviewing recent trading arrangements in the CIS, followed by a
review of the literature on Customs Unions, particularly in the context of comparative advantage and
WTO accession. Section 4 describes the data and discussion two approaches to identifying trade
patterns between countries: export similarity and revealed comparative advantage. Patterns of
specialisation are examined using factor content analysis based on the Heckscher-Ohlin-Vanek Model
proposed by Vanek (1968), in both a single and bi-lateral form, are in Section 5. Then, the validity of
these results IS confirmed using a simple gravity model. Section 6 discusses the policy implications
and the final section concludes.
2. REGIONAL TRADING ARRANGEMENTS
The CIS countries have committed to several bilateral and regional trade agreements since the breakup
of the Soviet Union (see Tumbarello, 2005 for details). However, these were largely driven by a wish
to preserve previous trading relationships established during the Soviet era, particularly as preferential
trade agreements were viewed as being mutually beneficial until market institutions could be
introduced and exchange rate convertibility established and stable. Unfortunately, many of these
agreements were not monitored or enforced and were de jure arrangements only. There were also
numerous exceptions introduced to protect national sovereignty, for example, Kazakhstan and Russia
did not include oil and gas in any trade agreement. However, these somewhat flawed arrangements
have not proved fatal and more recently regional trade initiatives have been proposed and some
implemented. The Eurasian Economic Community agreement between Belarus, Kazakhstan, the
Kyrgyz Republic, the Russian Federation, and Tajikistan was introduced in October 2000 and in May
2003 members focused their attention on improving their customs union in order to gain accession to
the WTO. Then, in September 19, 2003 Belarus, Kazakhstan, the Russian Federation, and Ukraine
met to form a Common Economic Space within the next 7 years. This has three stages. The first is to
harmonise trade regulations, the second is to elimination of trade barriers and create a customs union
and the third is the implementation of a common customs boundary with no internal barriers to trade.
This final stage also includes a regulatory institution that is common to all.
CIS member countries, with the exception of Belarus, Turkmenistan, and Uzbekistan, are
generally open economies, although the degree of openness varies. Kazakhstan and the Russian
Federation are more restrictive, while the CIS-5 (Armenia, Georgia, the Kyrgyz Republic, Moldova,
and Tajikistan) have the most liberal trading policies, see Table 1. Despite the de jure liberal trade
regimes in most of the CIS, unofficial and non-transparent barriers, including corruption, present

obstacles to liberal trade. For example, problems of transit trade include rail, roads, poor infrastructure
and air transportation. Transport markets are either absent or incomplete and excepting Kazakhstan,
Turkmenistan, and Russia there are few opportunities to benefit from scale economies. There are also
cross country dependences, for example, despite its dominant position in gas exports to Europe, Russia
still relies on the Ukrainian for a transit route and Kazakhstan needs the Russian Transneft pipeline.
Thus, the tariff level is not always an obstacle to trade, rather the lack of transparent custom valuation
procedures. Essentially, a policy declaration of openness does not always result in trade openness.
Table 1
3. LITERATURE REVIEW
The literature on patterns of trade and the impact on integration began with traditional customs union
theory (Viner, 1950), based largely on comparative advantage. This assumed perfect competition and
hence integration was of little importance as any response was a function of the effect of shifts in
barriers to trade. Economies of scale were recognised as important but it was not until the notion of
imperfect competition in trade that effects of integration were established (see Baldwin and Venables,
1995; Venables, 2003). In this literature, imperfect competition is either the underlying motivation for
international trade or necessary to allow for product differentiation and economies of scale. By
opening up competitor markets, trade liberalization increases the level of competition and changes the
nature of cross border interactions resulting in economic integration. Thus, while in segmented
markets prices are set nationally, in an integrated market prices are determined by members of the
customs union. These tend to be at more competitive levels as producers face a single market and
adopt a unified pricing strategy. However, with both segmented and integrated markets, the
competitiveness of customs union member firms may generate trade diversion as non-member
producers lose market share to union markets. However, there is also the possibility of the market-
access effect, that is, common regulatory systems within the union may make union markets more
attractive to non-union producers resulting in external trade creation (see Smith and Venables (1991).
The issue of trade creation or trade diversion and therefore whether world economic
welfare may be increased or lowered as the result of a preferential arrangement is conveniently
summarised by Wonnacott and Lutz (1989, pp 67-70), suggesting the ratio between these two
outcomes depends on whether:
a) The tariffs of outside countries are high and the initial tariffs of member countries are
also high. In this case, the formation of a preferential arrangement is not likely to be trade
diverting since there would not be a great deal of trade with outside countries. By the same
token, the welfare effects of the preferential arrangement would be enhanced if the member-
country tariffs on imports from outside countries were subsequently set at low rates.

b) The prospective member countries are already major trading partners and are close
geographically.
c) There are important differences in comparative advantage among the member countries.
In addition, the level of development is important, and if this is similar in the member
countries, and if the benefits can be distributed without major economic and political
disagreement. This is a particularly pertinent issue in this paper given regulatory harmonisation may
not overcome the more troublesome conflicts that are a legacy of the region.
This paper focuses on comparative advantage to determine levels of possible trade creation
and trade diversion. The CIS customs union is a political and not an economic construct and given the
member countries are small, with the exception of Russia, prices of traded goods are set outside the
union rather than within (Venables, 2003) and therefore a framework is needed that allows the analysis
to include dynamic effects and political economy concerns (Krugman, 1993; Krishna, 1998; Baldwin,
1995). The major interesting feature is that two crucial export goods, oil and gas, can distort the
economic important of the union and impact on issues of competition. We follow Venables (2003) by
considering two possibilities. Firstly, whether goods have alternative sources of supply or terms of
trade effects introduced, so that price changes can take place. Then it is possible to examine if country
comparative advantage, relative to other union members and relative to the rest of the world, yields
some important insights about the costs and benefits of custom union membership
4. DATA AND INITIAL ANALYSIS
(a) Data
Data on exports by commodity were taken from the United Nations COMTRADE database. Export
shares were calculated using export data, according to the HS 2002 classification (four digit). Data
were obtained for the 4 year period 2006-2009, to minimise the effects of short run temporary
fluctuations in export data. For Georgia and a small number of the comparison countries the period
2006-2008 was used due to the absence of data for 2009. It is also important to note that the available
data included only commodities. Thus the results are representative of trade in commodities but, since
they do not include exports of services, do not provide a complete analysis. As with the export
similarity indices export data from the COMTRADE database according to the (four digit) HS 2002
classification were used. This gives something in excess of 1200 categories of commodity. As before,
calculations were made using the four year total of exports for 2006-2009 and for 2006-2008 for
Georgia (2009 data not available)
In the factor contents analysis section, it was necessary to use trade data for the sample of CIS
countries for exports and imports of detailed commodities (4 digit HS 2002 Codes). These were taken
for each country from the UN’s COMTRADE database. They were then aggregated by sector to
correspond to the UK input-output classification of industries. The UK factor requirements matrix was
based on the UK input output table for 2008 (taken from the Office of National Statistics website).
These data were supplemented by labour data specially commissioned from the (UK) Office of
National Statistics, taken from the Labour Force Survey, to provide a detailed factor requirements
matrix. In a similar fashion data on the exports and imports of each sampled CIS country (4 digit HS
2002) were taken from the UN’s COMTRADE database and aggregated to the classification used for
the US input output table for 2008. Data on US requirements were based on the US input output table
for 2008 (US Department of Commerce, Bureau of Economic Analysis). These data were
supplemented by labour data for 2008 taken from Occupational Employment (OES) Statistics (US
Bureau of Labor Statistics), again to provide a detailed factor requirements matrix. For bilateral factor
content calculations data on the GDP of each country are also required. These were taken from the
World Bank’s World Development Indicators database.
(b) Export similarity analysis
The export similarity index first proposed by Finger and Kreinin (1979) is an established method for
analysing similarities between countries with respect to their pattern of specialisation in different types
of goods. This index, denoted XSi,j, provides a comparison between any pair of countries, j and k with
respect to their export specialisation and is defined:
N
i,j ij ik
i=1
XS = minimum x ,x∑ (1)
where xij is the share of good i in country j’s total exports and xik the share of the same good in country
k’s total exports. Values of the export similarity index range between 0 to 1 (or 100%).
In this study export similarity indices were constructed for the sample countries, both with
each other and with a much larger sample of countries from outside the region. These comprised a
pair wise value for each of the CIS included countries with the remaining CIS countries in the sample
plus a group of comparison countries. To provide a benchmark the degree of export similarity between
each sample country and total world exports was calculated. Thus, similar countries are defined to be
those with a higher value of the export similarity index with the country concerned than the index of
similarity with total world exports.
Given the size of the sample of countries the analysis generated a large number of results and
these are presented in Appendix 1, which also serves to provide a list of the 89 countries included in
the sample. Table 2 lists the results for all of those countries found to be similar according to the
definition above. The sample of former Soviet countries is divided into (a) major oil and gas exporters
and (b) others. It is immediately clear that former oil and gas exporting Soviet countries have a
similar pattern of commodity exports to other oil and gas exporters, no matter how different they are in
any other respect. For example, the high degree of similarity between Azerbaijan and Venezuela or
between Russia and Oman is almost entirely attributable to oil and related exports. At the same time

the indices for neither Belarus nor the Ukraine exhibit a similar pattern of exports to either Azerbaijan
or Russia. In general, the data show that a common specialisation in oil and related exports tends to
dominate any other pattern of similarity in the commodity composition of exports. For countries that
are not major oil exporters it is worth noting that both Georgia and Armenia are substantially more
similar to each other than any other country in the extended sample. However, both exhibit a degree
of similarity with a diverse group of countries including, for example, South Africa, and with Bulgaria
for Armenia and Canada for Georgia. Ukraine is only shown to be similar to one other country,
Romania.
Table 2
Overall the export similarity analysis suggests that both common and distinct export patterns
exist within the sample of former Soviet economies. The most distinctive common feature in exports is
a found in a group of oil and gas exporters, namely Azerbaijan, Kazakhstan and Russia. Both Georgia
and Armenia share much common ground with each other in their export patterns but no real similarity
with the other former Soviet countries. The remaining two countries in the sample, Belarus and
Ukraine, are neither similar with each other nor similar with any of the other countries in the sample.
Finally, the export similarity indices provide a picture of similar countries with respect to the
composition of commodity trade, although they do not provide any guidance as to which commodities
are in factor exported by these countries. To address this issue indices of revealed comparative
advantage are constructed.
(c) Revealed comparative advantage
The principle of revealed comparative advantage, that is, that patterns of comparative advantage by
commodity are not directly observable but can be inferred from observed trade data, has been widely
used in the international trade literature (Balassa, 1965). It has also generated an on-going
methodological literature, see, for example, Yu et al (2009).
There are a variety of different indices of revealed comparative advantage, each with its own
strengths and weaknesses. The original index proposed by Balassa (1965) is used here mainly because
of its direct comparability with export similarity indices since both are based on export shares. It is
defined:
ij
ij
iw
xB =
x (2)
where xij is the share of good i in country j’s total exports and xiw the share of the same good in total
world exports. Values of the index greater than 1 are interpreted as revealing a comparative advantage
and values less than 1 a comparative disadvantage.
As above, this analysis yielded a huge number of results, which are not presented here.1
However, Table 3 shows results for those categories of commodity in which three or more of the
sample countries exhibited a revealed comparative advantage as defined by the Balassa index. As
expected, crude petroleum and related products, including refined petroleum, is one category that is
important. However, other broad areas in which three or more of countries exhibit a revealed
advantage include:
• Minerals (cement, iron and copper ores, silicates, granite, basalt, mineral fertilisers, clays,
construction aggregates)
• Wood (crude and sawn)
• Various iron and steel products
• Chemical products (ammonia, sulphates, hair preparations, explosives)
• Specific agricultural and food products (bran, sunflower seeds, wheat, wheat flour, barley,
fruit and nuts, jams, fruit juices, sugar, alcoholic drink)
• Railway machinery and equipment
• Various metal articles (nails, tacks, wire, titanium articles)
Table 3
With the exception of some agricultural and food products, the results suggest that where
former Soviet countries have overlapping export specialisations these are typically in groups of
producer rather than consumer goods. Consequence some doubt exists as to how far potential gains in
the form of greater competition between member states exist for either the present Customs Union or
for any l future combination similar trading bloc of former Soviet countries. Certainly, it is unlikely
that competition in the majority of consumer goods would be greatly stimulated unless patterns of
specialisation change substantially.
5. FACTOR CONTENT ANALYSIS
This section derives the factor content of trade for the sample of CIS countries, using UK and US data
as a proxy for reasons of data availability. The results are then used to determine the trade relationship
in a regression model.
(a) The Heckscher-Ohlin-Vanek Model
This was initially a theoretical extension of Heckscher-Ohlin trade theory by Vanek (1968) but was
subsequently used to extend the applied analysis of Leontief (1953) and has long been used in
empirical models of international trade. It can be defined through the following relationship:
AT = V – sVw (3)
where there are k factors of production and n goods and where:
1 A full set of results are available from the authors on request.

• A is a (k x n) matrix of factor requirements
• T is a (n x 1) vector of net exports (exports less imports)
• V is the (k x 1) vector of domestic factor supplies
• s is a scalar representing the ratio of domestic to world GDP
• VW is the (k x 1) vector of world factor supplies.
The basic model makes a number of key assumptions. These include:
• linearly homogeneous production
• identical homothetic consumer preferences between countries
• balanced trade
• identical techniques of production across countries (that is, the A matrix is common).
Not all of these assumptions are strictly necessary. Helpman (1984) has shown that the model
remains valid even if the assumption of identical homothetic preferences is violated. Leamer (1980)
has shown that the model remains valid even if aggregate trade is not balanced, provide that the results
are reported relative to the factor requirements of consumption and in the form of a ranking. Indeed it
is for this reason that the results below are presented as they are in Table 3.
Previously, the terms on the right on equation (3) have been difficult to measure satisfactorily.
Factor supplies are notoriously difficult to calibrate for any single country, not to mention for the
world as a whole. Data on international trade has often been readily available, at least for goods, and
the data necessary to construct a factor requirements matrix occasionally available. Thus, the most
common use for the model has been to calculate AT as a measure of the underlying pattern of
comparative advantage by factor of production, that is, to reveal the underlying pattern of
specialisation by trade in embodied factor services in a manner similar to using trade statistics to
reveal the pattern of advantage in goods.
Another, but less common, application of model has been as a test of the theory. To do this
both the factor content of trade, AT, and the actual differences in factor supplies, V – sVW, are
calculated. These can then be compared to assess how well the model represents the theoretical
relationship. It was studies of this type, most notably Trefler (1995), which led to one source of
criticism of the model. Trefler’s argument is that firstly, comparisons between actual factor supplies
and the factor content of trade suggest that much trade is observable and secondly, that this
unobservable trade can be linked to technological differences between countries. Thus, Trefler and
others have correctly pointed out that the assumption of identical technology between countries is an
important limitation in the model as an accurate measure of true differences between country level
factors.
Leamer (2000) also raised objections to the use of the model to gain insights into the effects of
international trade on relative wage levels. Leamer’s argument is that the theoretical basis for such
effects is the Stolper-Samuelson theorem, which links goods’ prices to factor prices, not volumes of
trade to factor prices. These objections are not a concern in the current paper. However, the HOV
model has recently undergone a partial revival, for example, Krugman (2000) has argued that it may
be both valid and useful despite differences between countries in both consumer preferences and
technology and thus if the model is re-interpreted as comparing actual trade with a counter-factual of
autarky then it remains a valid exercise.
One practical problem in applying the model to many countries is the factor requirements
matrix. This typically requires both an input-output table and some supplementary data allowing
labour requirements to be divided into a number of different categories. Not all countries produce
input-output tables with a sufficient degree of disaggregation and it is even more difficult to find
matching labour data. Even if such data could be obtained for some countries it would not be
particularly useful. The factor requirements matrix has to cover at least a full range of production
activities and preferably all economic activity. For a large, diversified country this can be satisfied but
for a small or highly specialised country this will not be so. That is, the absence of certain industries
means that a full factor requirements matrix cannot be derived.
One technique for dealing with these difficulties is to proxy factor requirements data by using
another suitable country, and this practice is followed here. Factor requirements from the UK are used
to derive estimates of the factor content of trade for the sample of CIS countries. However, this may
bias the results so to minimise any distortion the analysis is repeated using US factor requirements
data to allow for a different technology set. Thus, if both analyses produce comparable results there is
some reason to suppose that the results are not excessively sensitive to changes in technical
requirements.
i. Results: Factor Contents Using UK Requirements Data
Table 4 reports the results of the factor content analysis for the CIS countries using UK data for factor
requirements, presented according to the value of the factor content of net exports for each country
relative to the content of the relevant factor in UK consumption and according to their ranking by this
measure. As previously discussed, Leamer (1980) shows that ranking of factors according to the factor
content of net exports relative to consumption is the appropriate procedure if aggregate trade is
imbalanced.
Unsurprisingly, the countries in the sample classed as major oil and gas exporters exhibit a
pattern of specialisation based on the use of oil and gas. Clearly, they would directly export oil and gas
but the factor content analysis is somewhat different as this provides estimates of the extent that the
extraction of oil and gas is a factor input into a wider based set of exports. That is, they are measures
of the extent to which the crude fuels are embodied in the exports of other goods and services. For
Azerbaijan and Belarus oil and gas is ranked by far the most important source of comparative
advantage. For Russia and Kazakhstan it is ranked second.
Table 4

After oil and gas, exports of goods that make intensive use of other natural resources is a
common source of specialisation in the net exports of the sample of former Soviet countries. Other
minerals are ranked first for Armenia, Georgia and Kazakhstan, second for the Ukraine and third for
Russia. Exports of goods intensive in forestry are ranked second for Belarus and Georgia, first for
Russia. Fishing is the one exception in the list of natural resources and is highly ranked for Armenia,
Belarus and Georgia but ranked low for all other countries. In summary, these results suggest that this
sample of former Soviet countries are highly specialised not just in the direct export of natural
resources but in those goods that make intensive use of such resources.
Most of the countries in the sample are shown to be specialised in goods that make intensive
use of professional and technical workers (at least according to UK production techniques).
Professional workers ranked third for Azerbaijan, fifth for Armenia and Kazakhstan and seventh for
Russia and Ukraine. Technicians ranked fourth for Armenia, Azerbaijan and Belarus and sixth for
Georgia and Russia. Agricultural and fishery workers were ranked highest of all for the Ukraine, third
for Kazakhstan and fifth for Georgia but these workers ranked low in the exports of all other countries.
Skilled manual workers are not ranked highly in most countries except Georgia (ranked third), Belarus
and Ukraine (ranked fifth in each).
Overall, these results suggest that there are important differences between countries in this
sample but that some common features can be identified. The most important common pattern of
specialisation is the export of natural resources, not just directly but also as embodied inputs into other
goods. A secondary common pattern is specialisation in goods that make intensive use of professional
and technical workers.
ii. Results: Factor Contents Using US Requirements Data
Table 5 reports the results of the factor content analysis for the CIS countries using US data for factor
requirements for 2008. These also suggest oil and gas to be a highly important source of advantage for
essentially the same group of countries as in the UK based analysis. Thus, oil and gas are ranked
highest for Azerbaijan, Belarus and Russia and ranked second for Kazakhstan. Mining is also shown
to be highly ranked for Armenia, Kazakhstan, Russia and Ukraine. However, forestry and fishing is
only highly ranked for Russia and Ukraine. Real estate is highly ranked in the pattern of export
specialisation of all countries in the sample except Russia. Overall, the results using US production
techniques are broadly consistent with those of the UK with respect to natural resources, despite using
a different classification of factors of production. That is, the most important common pattern of
specialisation is in the exporting of goods intensive in natural resources.
With respect to different categories of labour the results using US factor requirements are
again broadly consistent with those using UK production techniques. Professional workers are highly
ranked in almost all countries and mid-ranked in two (tenth in the Ukraine and ninth in Belarus).
Technicians are highly ranked in all countries except Russia (ranked twelfth). A minor difference with

the UK based results is with respect to service and sales workers, which are typically mid-ranked
using UK factor requirements while using US factor requirements this type of labour is ranked more
highly – first in Georgia, second in Armenia and third in Belarus.
It is not possible to rule out the fact that the results may have been biased by the use of factor
requirements data borrowed from other countries but the consistency between the results using UK
data and those using US factor requirements provides some reassurance that the sensitivity of the
analysis to different production techniques may not be excessive.
Table 5
(b) The Bilateral Factor Content Model
The bilateral factor content model provides two important contributions to the analysis, one conceptual
and the other methodological. From the analysis of Venables (2003) the likely gains to individual
countries from the formation of a Customs Union depend on comparative advantage in two ways – in
relation to the world and in comparison to partner countries. The standard H-O-V model provides a
way to assess the underlying pattern of comparative advantage of each country relative to the world.
The bilateral factor content model provides evidence on the second aspect – the comparative
advantage of each CIS country relative to each other. For data availability reasons the standard H-O-
V model was calculated using factor requirements data from the US and UK, which introduces some
risk of error. The bilateral factor content model, as shown below, can also be used to reduce this risk.
The bilateral factor content model is a misleading title as it does not compute the factor
content of bilateral trade between two countries; it compares the factor content of each countries net
exports to the world. Consider two countries (denoted by subscript 1 and 2) that are sufficiently
similar in production techniques for a common factor requirements matrix (A) to be a reasonable
supposition. From equation 3 the difference between country 1’s and country 2’s net exports to the
world can be written as:
AT1 – (s1/s2), AT2 = V1 - (s1/s2), V2 (4)
The variables for equation 4 are as defined previously for equation 3 save for the introduction
of subscripts for countries 1 and 2. Then assume that for this sample of CIS countries a common
factor requirements matrix (A) is a reasonable one. However, suppose that the common A matrix for
the CIS countries differs from that for a third, country (the UK or the US in this analysis), denoted as
A3. Maskus and Webster (1999) propose two types of representation of technological differences:
Factor Enhancing Industry Neutral (FEIN) and Industry Specific Hicks Neutral (ISHN). Using a
FEIN representation would suggest a relationship between A3 (the factor requirements matrix for the
UK or the US) and A (the factor requirements matrix for the CIS countries) such that:
A3 = ΦA (5)
where Φ is a (k x k) diagonal matrix whose diagonal elements are factor enhancing coefficients,
representing the differences in technology between the two A matrices. Thus, for example, if the
coefficient for skilled manual workers is 1.2 this would imply that these workers are 20% more

productive in the US than in the CIS countries. Suppose now that a factor requirements matrix from a
third country (UK or US) is used in place of an unknown true a matrix for the CIS countries. From
equation 4 this would result in the following:
Φ AT1 – (s1/s2), Φ AT2 = Φ V1 - (s1/s2), Φ V2 (6)
Note that, by pre-multiplying both sides of equation 6 by the inverse of Φ (Φ-1
) it is easy to
demonstrate that equation 6 simplifies back to equation 4. That is, two assumptions need to be
satisfied - (a) that the CIS countries share a common A matrix and (b) that the differences between this
common A matrix and the requirements matrix for a third country (A3) can be adequately represented
by a FEIN transformation such as Φ. If these assumptions can be satisfied it can be shown that the
resulting bilateral content using the borrowed requirements matrix A3 would be the same as using the
true but unknown matrix A.
The second representation of difference between A matrices suggested by Webster and
Maskus (1999) was an Industry Specific Hicks Neutral (ISHN) transformation matrix Ω. Thus, using a
third county matrix with this type of transformation gives:
A3 = A Ω (7)
where Ω is a (n x n) diagonal matrix whose diagonal elements represent Hicks neutral differences
between the UK or US and the same industry in the CIS countries. Thus, if the coefficient for a
particular industry is 1.15 this would suggest that the industry in the US uses all factor of production
15% more productively than in CIS countries. Calculating the bilateral factor content using a third
country A matrix in this case results in:
A Ω T1 – (s1/s2), A Ω T2 = V1 - (s1/s2).V2 + Γ (8)
It is possible to simplify equation 8 back to the standard bilateral factor content model (equation 4)
but, for reasons of brevity, this is not done here. However, the insight is much the same – differences
between the UK or US matrix and a common A matrix for the SIS countries cancel out in the bilateral
factor content model where the technological differences can be represented by an ISHN matrix.
Where this transformation is valid the bilateral factor content using the US or UK matrix (A3) is the
same as that using the true but unknown common CIS matrix A.
To summarise, the attraction of a bilateral factor content model is twofold. Firstly, it meets the
theoretical need, from Venables (2003), to identify patterns of comparative advantage of one CIS
country relative to another. Secondly, it provides a better basis for reducing any biases resulting from
the use of a borrowed factor requirements matrix from a third country.
i. Results: Bilateral Factor Contents Using UK Requirements Data
Table 6 presents the results of the bilateral factor content analysis using a UK requirements (A)
matrix. In interpreting the bilateral factor content results it is important to remember that the results
are for factors of production. Bilateral factor contents, for example for oil and gas are for these natural
resources embodied within other goods and services and do not reflect exports of the natural resources

themselves. For example, Azerbaijan’s heavy emphasis on oil and gas reflects in large part its export
of petroleum products.
Bilateral factor contents again reflect the dominance of oil and gas (as a factor of production)
in the trade of a number of CIS countries. Armenia, Georgia and the Ukraine all exhibit a propensity
to be net importers compared to the other CIS countries of goods embodying oil and gas inputs.
Conversely the other countries in our sample tend to be net exporters of goods and services using oil
and gas compared to the former group. Belarus and Russia are shown to be specialised in goods
making use of forestry, Russia and Ukraine with respect to those intensive in real estate.
Differences in patterns of specialisation also exist within this sample of CIS countries with
respect to the varied categories of labour. Russia and, to a lesser extent, Kazakhstan tend to have the
strongest pattern of export specialisation in goods making intensive use of various categories of highly
educated labour - managers, professionals and technicians. Belarus and the Ukraine tend to be the
most specialised of these countries with respect to goods intensive in skilled manual labour (craft and
related workers). Azerbaijan is shown to be the most specialised with respect to semi-skilled process
workers (plant and machine operators).
Taken overall what do these results suggest about the possibilities for economic gains from a
hypothetical Customs Union formed by this sample of countries? Traditional Customs Union theory
and more recent models based on the gains from competition all suggest that a common pattern of
specialisation is necessary for economic gains to be likely. The results of Venables (2003) – that
countries with a pattern of advantage intermediate between that of their partners and the world are
most likely to gain from a Customs Union – also suggests that a number of key countries in our
sample might not gain from economic integration. For example, Russia tends to have an extreme
pattern of advantage on several counts – oil and gas, forestry and educated labour.
Table 6
ii. Results: Bilateral Factor Contents Using US Requirements Data
The results using US requirements data, presented in Table 7 below, are similar to those using UK
requirements data. Thus, the bilateral factor content model shows Russia, Azerbaijan, Kazakhstan and
Belarus have the strongest pattern of comparative advantage in industries using oil and gas. Oil and
gas is also again shown to be the most important factor of production in explaining variations in the
factor content of trade within this sample of countries.
Russia again is shown to have the strongest advantage in goods intensive in the use of real
estate and one of the strongest patterns of specialisation in goods intensive in the use of highly
educated workers. Belarus is less clearly a country specialised in the use of skilled manual labour than
with the UK requirements but nonetheless remains one of the countries more heavily specialised in
exporting goods using these workers. With the US data Russia and the Ukraine tend to be more
specialised in exports intensive in the services of these workers. Azerbaijan is again one of the

countries with the strongest specialisation with respect to semi-skilled process workers (plant and
machine operators).
Table 7
Overall, the main purpose in providing an analysis using factor requirements from two
different countries is to allow a basis for assessing the robustness of our findings with respect to
variation in the factor requirements matrix used. This is admittedly both an informal and a limited
check on robustness. Nonetheless, the broad similarity in our findings based on both UK and US
requirements does provide some grounds to suppose that the results are not dominated by the choice of
factor requirements matrix.
6. ECONOMETRIC ANALYSIS OF A GRAVITY TYPE MODEL OF EXPORT
SIMILARITY
In this section the determinants of the degree of export similarity of this sample of CIS countries is
examined, both with each other and with a sample of countries from the rest of the world. This serves
two main purposes. Firstly, the analysis is intended to identify the key characteristics that determine
both common and divergent patterns of comparative advantage between each of the sample countries
and other trading partners. Secondly, by including a dummy variable for other CIS countries the
analysis is intended to
The findings of Tumbarello (2005) are of particular relevance to this paper. Simulations from
this gravity model suggests that the CIS countries do not trade enough relatively to other transition
economies. This result reflects specific constraints and obstacles to trade in the CIS: economic
structure (some of the CIS countries rely mainly on natural resources); geographic conditions (e.g.,
Belarus, the Kyrgyz Republic, Tajikistan, Turkmenistan, and Uzbekistan are landlocked); unresolved
external and internal conflicts (e.g., between Armenia and Azerbaijan, within Georgia, and within the
Russian Federation); the cost of transit trade; the existence of unofficial payments; and excessive
regulation. Moreover, the large number of free trade agreements in the region and the plethora of
inconsistent rules of origin represent additional barriers, not only because of the increased scope for
corruption but also because uncertainty about the rules creates trade disputes, retaliation and a climate
of distrust among the CIS members.
This analysis of the determinants of export similarity has much in common with a gravity
model. The traditional gravity model relates bilateral trade flows to a series of distance variables. In
this respect the approach here intentionally shares much common ground with a gravity model. In
particular, an equation is specified in which export similarity indices, a bilateral comparison in two
countries export patterns with the world, depends on a series of differences between the two countries
in key determinants. In general form the specification is:
XSIMjk = βXjk + θCIS + ujk (9)

where XSIMjk is the export similarity index between CIS country j and country k, X is a matrix of
observations of m explanatory variables, measured as the difference (“distance”) between country j
and country k in each variable, CIS is a dummy variable taking the value of 1 when the comparison
country is another CIS country and 0 otherwise and where ujk is an appropriate disturbance term.
For the purposes of estimation the sample is treated as an undated panel comprising one cross
section for each of the CIS countries in the sample. Data for the explanatory variables were taken
from the World Bank’s World Development Indicators database. The list of variables is given in Table
8. Due to missing observations for some variables and countries two samples were used. Sample 1 was
designed to maximise the number of reporting countries included and omits some variables for which
observations were missing. This resulted in a sample comprising all 7 of the CIS countries covered
elsewhere in the analysis, each with a cross-section of 83 comparison countries, 581 observations in
total. Sample 2 was designed to maximise the number of variables included and, in consequence,
resulted in countries with missing observations being excluded. This resulted in a sample of 6 CIS
countries (Azerbaijan being excluded), each with a cross-section of 43 comparison countries, 258
observations in total.
Table 8
Estimation was by panel least squares estimators and results are in Table 9 for both samples.
In each case the general equation was estimated followed by a restricted model with a number of
apparently statistically insignificant variables excluded. Thus, for each sample au unrestricted and
restricted model are reported, together with appropriate tests for the exclusion of the relevant
variables. Table 9 also reports the (fixed) cross section effects for each of the CIS countries in the
sample. Note that the interpretation of the results presented in Table 9 requires some care. The
specification states the degree of export similarity between two countries depends on the extent of
differences between them in a series of explanatory variables. A positive sign for the relevant
coefficient would suggest that the greater the difference between the two countries in the variable
concerned, the higher the degree of export similarity between the two countries. Conversely, a
negative sign would suggest the lower the difference in the particular variable the greater the
similarity.
Two variables were included to capture the effects of technological differences between
countries – high technology exports as a percentage of total exports (HITECH) and research and
development expenditure as a percentage of GDP (RES). These were intended to reflect underlying
Ricardian features, in which comparative advantage depends on differences between countries in
technology and, ultimately, labour productivity. These variables could only be included in sample 2
due to missing observations. Differences between countries in R&D expenditure were found to be
statistically insignificant but differences in the importance of high technology exports were found to
be statistically significant (at 95%) in Sample 2, with a positive sign. Although this is the opposite of
the expected sign this variable is of marginal statistical significance in the unrestricted version for
sample 2. Given also the comparatively small value of the coefficient it is reasonable to conclude that
our evidence suggests that technological differences are not an important determinant of similarities
between CIS countries and others in the pattern of comparative advantage. Differences between
countries in per capita GDP were intended to capture Linder effects, representing the degree of
dissimilarity in demand. The corresponding coefficients were found to be statistically insignificant in
both sample 1 and sample 2.
Table 9
The remaining explanatory variables were intended to capture underlying differences in factor
endowments between each of the samples of CIS countries and their comparison countries. For natural
resources per capita differences in arable land, forests and energy production were used. Differences in
gross fixed capital formation in relation to GDP (INVEST) were used to capture different capital
endowments. In sample 1 differences in gross fixed capital formation were found to be statistically
significant but of small magnitude and with a positive sign. In sample 2 these effects were statistically
insignificant. Differences in endowments of arable land were found to be statistically significant in
sample 2 but with a positive sign but statistically insignificant in sample 1. Differences in
endowments of forests were of more marginal statistical significance in sample 1 (significant at 90%
but not 95% confidence), again with a positive sign. However, the results are dominated by the effect
of differences in per capita energy production. The relevant coefficients are statistically significant in
both samples 1 and 2 and of a magnitude several times larger than any of the other variables. The signs
are negative in all cases; the higher the differences between countries in energy endowments the less
the degree of export similarity, as expected. Thus, these results confirm the importance of energy in
determining the pattern of export specialisation, supporting the analysis in earlier sections. Indeed the
magnitude of the coefficients concerned suggests that these results are dominated by such differences.
Differences in labour endowments and, in particular, those in human capital were addressed
by a further group of explanatory variables. To capture educational differences two variables were
used – the primary school enrolment ratio (SCHOOL1) and the tertiary school enrolment ratio
(SCHOOL2). Differences in the birth rate, life expectancy, urbanisation and in the labour participation
rate were also included to capture differences between countries in long run labour supply. These
variables proved to be statistically insignificant in either or both sample 1 and 2. An important
exception to this was urbanisation, statistically significant at 90% confidence in sample 2 and at 95%
confidence in sample 1, in both cases with the expected negative sign. A further exception was the
labour participation rate, statistically significant in both sample 1 and 2 but with a positive sign.
The dummy for CIS countries was statistically significant in both sample 1 and 2. This
variable differs from the other explanatory variable in that it is not a measure of economic distance
(i.e. the difference between two countries). Its expected sign is positive – that common ground
between CIS countries would make them more not less similar. In sample 1 it has the expected
positive sign but in sample 2 the relevant coefficient is negative.
The final set of explanatory variables capture differences between countries in “trade friction”:
those institutional, policy and cultural variables likely to distort underlying patterns of comparative
advantage. These comprised differences in the indices of the ease of doing business (EASE), of legal
rights (LEGAL), taxes on goods and services as a percentage of value added (TAX1), the total tax rate
on business (TAX2), and the trade weighted average of applied import tariffs (TARIFF). Of these
only differences in import tariffs and in the total tax rate were found to have statistically significant
effects in both sample 1 and sample 2. Whether these are positive or negative is unclear in theory.
Differences in policy and institutional barriers to trade are clearly capable of affecting patterns of
specialisation but there is no particular reason to presume that they would make them more or less
similar. Thus, the results suggest that such barriers do indeed play a pattern in shaping the pattern of
export specialisation of CIS countries.
7. CONCLUSION
This paper finds some common patterns of comparative advantage and, hence, export specialisation
within a sample of countries that includes several former Soviet states. The most significant is a
common reliance on oil and gas, in particular, by Azerbaijan, Kazakhstan and Russia. This is both in
terms of direct exports and in the export of goods intensive in these natural resources. A further
common pattern of specialisation is in the export of other raw materials, especially minerals, both
directly and embodied in the exports of goods that make intensive use of them. Otherwise, there exists
only a small range of manufactures (certain types of chemicals, some iron and steel products and some
food products) for which there are common patterns of advantage. The research suggests that these
tend to be in goods that are comparatively intensive in professional and technical labour.
The bilateral factor content of trade between each of the countries in the sample is also
examined. The analysis suggests there are important variations in this sample of countries such that it
is doubtful that many are directly competitive with each other. Based on the predictions of Venables
(2003) it is also likely that Russia, in particular, has an extreme rather than intermediate comparative
advantage based on several factors of production and might not gain from a Customs Union.
With respect to WTO membership it is likely that any subsequent expansion of trade would be
similarly focused upon natural resources and natural resource intensive products. For the possible
economic gains from a Customs Union, such as trade creation and greater competition, these results
suggest some scepticism. Superficially, the similarities between countries with respect to the export of
natural resources and goods intensive in their use does indeed suggest some overlapping between the
countries in this sample. However, this leaves the vast majority of consumer goods and many producer
goods for which there currently is little effective competition between member states in export
markets. This may limit the potential economic benefits from the Customs Union for both current and
potential members. Clearly, the political benefits are an entirely different matter which may be far
greater but while recognised are not considered here.

The econometric analysis of export similarity indices further strengthens the conclusion that
patterns of comparative advantage in CIS countries are dominated by whether or not the country is an
oil and gas producer. The results also suggest that there is a common, unspecified “CIS” influence
that results in increased export similarity but this is of far less economic significance than oil and gas.
Finally, there is evidence that differences between these countries in variables capturing institutional
friction, such as ease of doing business, import tariffs, taxes, etc has had an influence on differences in
their patterns of export specialisation.
REFERENCES
Allen, C, Gasoriek, M and A Smith, 1998. The Competition Effects of the Single Market in Europe,
Economic Policy, 13, 439-486
Balassa, B, 1965. Trade Liberalisation and Revealed Comparative Advantage, The Manchester School,
33, 99-123
Baldwin, R.E. and A.J. Venables, 1995. Regional economic integration., in G. Grossman and K.
Rogoff (eds.), Handbook of International Economics, vol. 3, North-Holland, Amsterdam.
Clausing, KA, 2001, Trade Creation and Trade Diversion in the Canada-United States Free Trade
Agreement, Canadian Journal of Economics, 34, 677-696.
Donald R. Davis, David E. Weinstein, 2003, Market Access, Economic Geography and Comparative
Advantage: an Empirical Test, Journal of International Economics, 59, 1–23
Finger, JM, and Kreinin, M, 1979, An Index of Export Similarity and its Possible Uses, Economic
Journal, 85, 905-912.
Helpman, E., 1981. International trade in the presence of product differentiation, economies of scale
and monopolistic competition: a Chamberlin–Heckscher–Ohlin approach, Journal of International
Economics 11 (3).
Krishna, P., 1998, Regionalism and Multilateralism: A Political Economy Approach, Quarterly
Journal of Economics, Vol. 113 (No. 1, February).
Krugman, P.R., 1979. Increasing returns, monopolistic competition, and international trade. Journal of
International Economics 9 (4), 469–479.
Krugman, P.R., 1980. Scale economies, product differentiation, and the pattern of trade. American
Economic Review 70, 950–959.
Krugman, P, 2000, Technology, Trade and Factor Prices, Journal of International Economics, 50, 51-
71.
Krugman, P.R., Venables, A.J., 1995. Globalization and the inequality of nations. Quarterly Journal
of Economics 110 (4), 857–880.
Lancaster, K., 1980. Intra-industry trade under perfect monopolistic competition. Journal of
International Economics 10 (2), 151–175.
Leamer, EE, 1980, The Leontief Paradox Reconsidered, Journal of Political Economy, 8, 495-503.

Leamer, EE, 2000, What’s the Use of Factor Contents?, Journal of International Economics, 50, 17-
49.
Leontief, W, 1953, Domestic Production and Foreign Trade: The American Capital Position Re-
examined, Proceedings of the American Philosophical Society, 97, 332-349.
Lissovolik, B., and L. Lissovolik, 2004. Russia and the WTO: The Gravity of Outsider Status, IMF
Working Paper No. 04/159 (Washington: International Monetary Fund).
Maskus, K E and A Webster, 1999, Estimating the HOV Model with Technology Differences Using
Disaggregated Labor Skills for the United States and the United Kingdom, Review of International
Economics, Vol. 7, 8-19.
Schott, Jeffrey J. 1991. Trading Blocs and the World Trading System, The World Economy 14: 1-18.
Trefler, D, 1995. The Case of the Missing Trade and Other Mysteries, American Economic Review,
85, 1029-1046.
Tumbarello P, 2005. Regional Trade Integration and WTO Accession: Which Is the Right
Sequencing? An Application to the CIS, IMF Working paper WP/05/94
Vanek, J, 1968. The Factor Proportions Theory: the N-Factor Case, Kyklos, 21, 749-756.
Venables A, 2003. Winners and Losers from Regional Integration Agreements, The Economic
Journal, 113, 747-61.
Viner, J, 1950. The Customs Union Issue, New York: Carnegie Endowment for International Peace.
Wonnacott, Paul and Mark Lutz. 1989. Is There a Case for Free Trade Areas? and Comments by
Isaiah Frank and Martin Wolf, in Jeffrey J. Schott (ed.), Free Trade Areas and U.S. Trade Policy.
Washington, D. C.: Institute for International Economics.
Yu, R, Cai, J and P Leung, 2009. The Normalized Revealed Comparative Advantage Index, The
Annals of Regional Science, 43, 267-282.

Table 1. Trade Regime Indicators in the CIS (selected countries) - 2003
Number
of bands
Min tariff
(%)
Max tariff
(%)
Mean tariff
(%)
Custom fees
(%)
Armenia 2 0 10 4.0 0.00
Azerbaijan 3 0 15 10.8 0.15
Belarus 8 0 100 11.0 0.15
Georgia 22 0 30 8.2 0.15
Kazakhstan 10 1 100 7.4 0.20
Kyrgyz Republic 5 0 20 4.5 0.15
Moldova 6 0 15 6.9 0.00
Russia 10 0 100 11.1 0.00
Tajikistan 6 10 15 7.6 0.00
Turkmenistan 6 0 100 5.1 0.50
Ukraine 5 0 70 12.7 0.00
Uzbekistan 3 0 30 15.3 0.20
Source: Country authorities and IMF calculations (Tumbarello, 2003)

TABLE 2: EXPORT SIMILARITY INDICES
A. MAJOR OIL AND GAS EXPORTERS
Azerbaijan Kazakhstan Russia
WORLD 9.6% WORLD 21.5% WORLD 30.4%
Venezuela 90.2% Saudi Arabia 68.0% Algeria 56.5%
Yemen 90.2% Iran 67.9% Oman 56.5%
Nigeria 87.6% Venezuela 67.5% Kuwait 53.8%
Sudan 87.4% Kuwait 67.4% Qatar 52.9%
Saudi Arabia 86.6% Oman 66.0% Venezuela 50.2%
Iran 82.6% Azerbaijan 65.7% UAE 49.8%
Kuwait 73.6% Yemen 65.1% Saudi Arabia 48.3%
Oman 66.7% Sudan 64.4% Kazakhstan 47.4%
Kazakhstan 65.7% Nigeria 63.3% Trinidad 47.1%
Algeria 62.5% Algeria 59.8% Egypt 46.1%
Qatar 51.5% Qatar 53.5% Azerbaijan 44.1%
UAE 46.0% Russia 47.4% Syria 42.9%
Russia 44.1% UAE 41.5% Yemen 42.8%
Syria 42.6% Syria 40.6% Iran 41.6%
Colombia 30.8% Colombia 33.6% Canada 39.4%
Cote d Ivoire 25.4% Canada 28.3% Colombia 37.6%
Trinidad 23.5% Vietnam 24.0% Cote d Ivoire 35.8%
Vietnam 21.2% Australia 22.9% Sudan 35.8%
Egypt 20.8% Trinidad 22.2% Nigeria 35.6%
Mexico 17.6%
Canada 17.5%
Tunisia 17.3%
B. OTHERS
Armenia Belarus Georgia
WORLD 9.6% WORLD 33.0% WORLD 23.4%
Georgia 37.0% Bahrain 36.7% Armenia 37.0%
Namibia 26.7% Senegal 35.7% South Africa 25.8%
Chile 23.3% Egypt 35.2% Canada 25.6%
Israel 22.3% Kuwait 34.5% France 24.4%
Dom Rep 19.7% Bulgaria 33.2%
India 16.3% Ukraine
South Africa 16.2% WORLD 34.2%
Bulgaria 15.3% Romania 35.6%
Bhutan 14.0%
UK 10.5%
Colombia 10.4%
Turkey 10.3%
UAE 10.0%
Thailand 9.9%
Hong Kong 9.8%
USA 9.8%
Jordan 9.7%


TABLE 3: BALASSA REVEALED COMPARATIVE ADVANTAGE INDICES (where 3 or more countries reveal an advantage)
HS Code Description BALASSA RCA INDICES
Armenia Azerbaijan Belarus Georgia KazakhstanRussia Ukraine2006-9 2006-9 2006-9 2006-8 2006-9 2006-9 2008-9
A. PRODUCTS FOR WHICH FIVE COUNTRIES EXHIBIT A REVEALED ADVANTAGE
1512 Sunflower-seed, safflower or cotton-seed oi l and fractions thereof. 1.028 2.591 0.005 2.041 0.728 4.099 83.494
2302 Bran, sharps and other res idues ,from working of cerea ls etc. 1.683 5.894 0.003 2.697 2.005 0.474 10.943
2849 Carbides , whether or not chemica l ly defined. 352.390 0.000 0.000 3.698 43.439 19.995 72.569
7202 Ferro-a l loys . 100.321 0.000 0.001 66.709 15.378 1.861 10.535
7204 Ferrous waste and scrap; remelting scrap ingots of i ron or s teel . 2.336 0.002 0.175 24.798 2.051 1.494 1.574
8606 Rai lway or tramway goods vans and wagons, not sel f-propel led. 7.678 0.306 1.133 1.827 0.955 1.808 89.068
B. PRODUCTS FOR WHICH FOUR COUNTRIES EXHIBIT A REVEALED ADVANTAGE
0407 Birds ' eggs , in shel l , fresh, preserved or cooked. 3.172 0.046 6.293 1.342 0.001 0.235 3.215
1001 Wheat and mes l in. 0.000 0.010 0.001 1.787 7.395 2.949 12.495
1101 Wheat or mes l in flour. 0.000 0.994 0.167 1.552 33.415 1.120 5.148
2306 Oi l -cake and other sol id res idues from vegetable fats or oi l s . 0.000 0.364 0.037 16.137 2.473 1.635 26.844
2508 Other clays , andalus ite, kyani te and s i l l imanite, mul l i te etc. 0.289 1.104 0.003 2.570 1.721 0.060 20.640
2523 Portland cement, a luminous cement, s lag cement, etc. 37.642 0.003 1.807 61.123 0.075 0.594 1.607
2619 Slag, dros s , sca l ings and other waste from iron or s teel . 0.000 0.008 1.244 59.038 0.011 4.278 3.335
2839 Si l i cates ; commercia l a lka l i meta l s i l i cates . 61.746 0.509 140.808 0.000 0.927 11.681 182.149
3102 Minera l or chemica l ferti l i sers , ni trogenous. 0.000 0.007 4.552 44.900 0.332 4.971 19.537
6811 Articles of asbestos-cement, of cel lulos e fibre-cement or the l ike. 0.000 0.000 1.675 0.007 1.587 3.275 4.916
7010 Carboys , bottles , flas ks , jars , pots , phials etyc. of glass . 15.339 0.004 1.708 6.930 0.035 0.524 2.390
7207 Semi-finished products of i ron or non-a l loy s teel . 0.002 0.184 4.879 0.155 2.811 7.935 47.750
7217 Wire of i ron or non-a l loy s teel . 0.000 0.001 10.389 2.902 0.003 1.011 4.916
8601 Rai l locomotives powered by electrici ty. 1.571 0.004 0.000 205.109 0.688 1.320 4.051
C. PRODUCTS FOR WHICH THREE COUNTRIES EXHIBIT A REVEALED ADVANTAGE
0507 Ivory, tortois e-s hel l , whalebone and whalebone ha i r, horns , etc 0.000 0.018 1.112 0.002 2.269 1.816 0.108
0511 Animal products not elsewhere specified. 0.774 0.009 1.387 0.000 3.109 3.270 0.852
0802 Other nuts , fres h or dried, whether or not shel led or peeled. 0.001 4.254 0.002 74.955 0.001 0.063 3.552
0811 Frui t and nuts , uncooked or cooked 1.036 0.000 5.234 0.193 0.001 0.367 3.782
1003 Barley. 0.000 0.002 0.004 0.559 4.086 2.247 47.593
1204 Linseed, whether or not broken. 0.000 0.000 0.609 0.000 1.532 1.502 3.602
1701 Cane or beet sugar and chemica l ly pure sucros e, in sol id form. 0.000 3.454 4.795 10.702 0.246 0.140 0.117
1703 Molasses resul ting from the extraction or refining of s ugar. 0.000 0.520 1.845 0.000 0.002 1.327 6.909
2001 Vegetables , frui t, nuts etc, prepared or preserved by vinegar etc. 3.605 0.083 1.903 0.193 0.007 0.042 5.151
2007 Jams, frui t jel l ies , marmalades , frui t or nut purée, frui t or nut pas tes . 17.667 0.302 1.026 2.686 0.003 0.108 0.391
2009 Frui t juices (including grape must) and vegetable juices . 1.246 0.956 0.053 6.391 0.128 0.068 1.194
2202 Waters , including minera l waters and aerated waters . 1.542 0.011 0.237 17.107 0.156 0.219 1.461
2208 Undenatured ethyl a lcohol , s piri ts , l iqueurs etc. 56.587 0.485 0.529 24.812 0.018 0.234 2.513
2403 "homogenised" or "reconsti tuted" tobacco; tobacco extracts . 1.688 0.161 0.007 0.000 0.007 1.515 3.630
2501 Sal t (including table sa l t and denatured sa l t) 2.738 0.029 13.601 0.001 0.042 0.045 9.5602503 Sulphur of a l l kinds , other than subl imed sulphur 0.000 0.000 0.003 0.000 15.121 4.949 1.564

TABLE 3: BALASSA REVEALED COMPARATIVE ADVANTAGE INDICES (where 3 or more countries reveal an advantage), continued
HS Code Description BALASSA RCA INDICES
Armenia Azerbaijan Belarus Georgia KazakhstanRussia Ukraine2006-9 2006-9 2006-9 2006-8 2006-9 2006-9 2008-9
C. PRODUCTS FOR WHICH THREE COUNTRIES EXHIBIT A REVEALED ADVANTAGE (continued)
2516 Granite, bas al t, s ands tone and other monumenta l or bui lding s tone 3.866 0.017 0.019 1.878 0.310 0.041 1.914
2517 Pebbles , gravel , broken or crushed stone for concrete aggregates 1.161 0.001 1.916 0.213 0.234 0.119 22.333
2601 Iron ores and concentrates , including roasted i ron pyri tes . 0.000 0.000 0.000 0.000 5.105 1.009 8.464
2603 Copper ores and concentrates . 51.153 0.000 0.000 33.675 2.632 0.010 0.000
2618 Granulated s lag (s lag sand) from the manufacture of i ron or s teel . 3.628 0.000 0.000 1.334 0.030 0.005 17.725
2701 Coal ; briquettes , ovoids and s ol id fuels manufactured from coal . 0.000 0.000 0.000 0.051 2.566 3.809 1.834
2709 Petroleum oi ls and oi l s obta ined from bi tuminous mi nera ls , crude. 0.000 11.299 0.377 0.284 8.112 4.342 0.001
2710 Petroleum oi ls , other than crude. 0.000 1.948 7.263 0.029 0.625 3.420 0.751
2716 Electrica l energy. 3.730 0.437 0.273 3.755 0.328 0.794 2.570
2814 Ammonia , anhydrous or in aqueous solution. 0.000 0.000 0.679 1.313 0.014 7.119 19.132
2818 Arti fi cia l corundum, a luminium oxide; a luminium hydroxide. 0.364 3.415 0.001 0.010 8.535 0.060 7.247
2833 Sulphates ; a lums; peroxosulphates (persulphates). 0.000 0.002 0.460 0.219 1.489 1.144 1.295
2841 Sal ts of oxometal l i c or peroxometal l i c acids . 39.492 0.000 0.334 0.000 24.969 7.525 0.107
3105 Minera l or chemica l ferti l i sers . 0.000 0.007 1.661 0.000 0.265 6.132 1.661
3305 Preparations for us e on the ha i r. 0.003 0.001 1.862 4.088 0.108 0.292 1.257
3602 Prepared explos ives , other than propel lent powders . 0.000 0.000 0.000 4.714 0.040 1.376 1.273
4104 Tanned or crus t hides and skins of bovine or equine animals . 0.027 0.556 1.870 0.065 13.753 0.466 7.005
4401 Fuel wood, in logs , in bi l lets , in twigs , in faggots etc. 0.000 0.000 1.464 0.027 0.000 1.046 2.410
4403 Wood in the rough or roughly squared. 0.342 0.000 3.885 0.299 0.000 10.269 2.952
4406 Rai lway or tramway s leepers (cross -ties ) of wood. 0.000 0.260 0.209 3.548 0.000 4.353 3.003
4407 Wood sawn or chipped lengthwis e 0.058 0.008 0.990 6.018 0.000 3.034 1.713
6305 Sacks and bags , of a kind used for the packing of goods . 1.114 2.569 0.225 0.002 0.082 0.053 1.334
6809 Articles of plaster or of compos i tions based on plaster. 0.002 0.000 1.989 0.033 1.073 0.154 1.506
7108 Gold unwrought or in s emi-manufactured forms. 3.214 0.000 0.000 10.862 1.828 0.000 0.000
7208 Flat-rol led products of i ron or s teel , of a width of 600 mm or more 0.006 0.000 0.003 0.011 2.228 1.795 14.146
7209 Flat-rol led products of i ron or s teel , of a width of 600 mm or more 0.000 0.002 0.008 0.193 4.910 1.832 5.777
7214 Other bars and rods of i ron or non-al loy s teel 0.086 0.065 10.938 1.514 0.100 0.792 14.400
7224 Other al loy s teel in primary forms; semi-finished products . 0.000 0.000 3.675 0.050 0.009 1.426 4.203
7228 Angles , shapes and sections , bars and rods ,of other a l loy s teel 0.000 0.000 1.904 0.001 0.018 1.473 4.727
7305 Other tubes and pipes of i ron or s teel exceeding 406.4 mm diameter. 0.216 0.113 0.062 0.379 1.204 2.279 14.695
7317 Nai ls , tacks , corrugated na i ls , s taples etc, of i ron or s teel . 0.028 0.000 6.945 3.925 0.002 0.337 2.227
7601 Unwrought a luminium. 0.046 1.028 0.005 0.413 0.675 4.691 1.051
7801 Unwrought lead. 0.000 0.079 0.096 3.809 8.882 0.943 1.188
8108 Titanium and articles thereof, including waste and scrap. 0.043 0.000 0.022 0.327 6.186 4.567 4.454
8412 Other engines and motors . 0.000 0.006 1.641 2.392 0.163 0.426 1.679
8607 Parts of ra i lway or tramway locomotives or rol l ing-stock. 0.131 0.000 0.356 7.058 0.034 1.083 9.792
8608 Signal l ing, s afety or traffi c control equipment for ra i lways , roads , etc. 0.012 0.000 3.015 0.365 0.018 1.780 7.8698904 Tugs and pusher craft. 0.000 2.997 0.023 0.000 0.216 1.773 1.403

TABLE 4: FACTOR CONTENTS OF NET EXPORTS*, using UK production techniques
Factor of Production Armenia Azerbaijan Belarus Georgia
Value Rank Value Rank Value Rank Value Rank
Forestry -13.469 9 -17.572 10 225.553 2 -7.754 2
Fishing -4.324 2 -1.747 5 -109.138 18 -12.554 4
Oi l and gas -19.473 17 228.879 1 416.348 1 -33.298 18
Other minera ls 6.711 1 -27.643 15 -37.488 11 2.811 1
Machinery (including rental of) -14.615 14 -13.817 8 -68.425 17 -17.874 12
Offi ce machinery & computers -11.736 6 -19.267 11 -47.354 12 -19.233 15
Electri ca l equipment -15.647 15 -39.484 17 -51.988 14 -25.024 17
Transport equipment -9.155 3 -24.383 13 34.937 3 -16.097 9
Rea l estate -14.140 10 -11.380 7 -26.285 8 -14.159 7
Legis lators , s enior officia ls , managers -14.502 12 -14.239 9 -27.118 9 -18.830 13
Profes s ionals -10.710 5 22.147 3 -53.410 15 -14.432 8
Techncians , ass ociate profess ional s -9.787 4 13.370 4 22.703 4 -13.175 6
Clerks , administrators -13.404 8 90.477 2 -24.615 7 -17.861 11
Service, shop, sa les workers -11.822 7 -27.191 14 -6.639 6 -16.993 10
Ski l led agricultura l and fi shery workers -24.721 18 -20.273 12 -59.111 16 -12.637 5
Craft and related workers -14.162 11 -39.617 18 16.188 5 -11.245 3
Plant & machine operators , ass emblers -14.574 13 -9.314 6 -33.908 10 -19.793 16
Elementary occupations -16.839 16 -28.639 16 -47.664 13 -19.031 14
Factor of Production Kazakhstan Russia Ukraine
Value Rank Value Rank Value Rank
Forestry -107.458 16 7489.281 1 202.898 3
Fishing -38.326 8 -872.881 16 -128.235 17
Oi l and gas 250.549 2 4961.642 2 -126.267 16
Other minera ls 275.010 1 1358.546 3 242.694 2
Machinery (including rental of) -92.659 14 219.196 5 -64.708 13
Offi ce machinery & computers -83.409 13 -798.724 15 -19.911 9
Electri ca l equipment -196.556 18 -1538.440 18 -71.092 15
Transport equipment -118.408 17 -898.882 17 -141.894 18
Rea l estate -35.292 7 -217.692 10 9.151 6
Legis lators , s enior officia ls , managers -73.489 12 -64.796 8 -35.961 10
Profes s ionals 11.845 5 133.487 7 -16.047 7
Techncians , ass ociate profess ional s -46.270 11 168.813 6 -48.553 11
Clerks , administrators 73.488 4 1138.415 4 -63.659 12
Service, shop, sa les workers -26.378 6 -501.942 12 -18.370 8
Ski l led agricultura l and fi shery workers 125.069 3 -698.573 14 278.183 1
Craft and related workers -106.588 15 -255.351 11 31.802 5
Plant & machine operators , ass emblers -40.192 9 -168.242 9 -68.229 14
Elementary occupations -44.789 10 -694.720 13 46.186 4
*Factor contents of each country's net exports, relative to those of UK consumption

TABLE 5: FACTOR CONTENTS OF NET EXPORTS*, using US production techniques
Factor of Production Armenia Azerbaijan Belarus Georgia
Value Rank Value Rank Value Rank Value Rank
Forestry & Fishing -1.377 18 -1.623 14 -1.481 13 -1.191 15
Oil and gas -1.136 17 14.731 1 22.334 1 -1.908 18
Mining 0.000 1 -2.265 16 -4.378 15 -0.402 9
Real Estate -0.091 4 0.228 6 -0.310 4 -0.097 3
Machinery -1.013 16 -1.038 13 -6.785 18 -1.264 17
Computers & Electronic Equipment -0.674 12 -1.857 15 -1.140 11 -0.976 12
Electrical Equipment -0.881 15 -3.504 18 -4.196 14 -1.049 14
Transport Equipment -0.692 13 -2.483 17 2.217 2 -1.232 16
Renting & leasing (other than real estate) -0.396 11 10.017 2 -6.222 17 -0.407 10
Legislators, senior officials, managers -0.323 9 0.441 4 -1.063 10 -0.343 6
Professionals -0.176 6 0.929 3 -0.885 9 -0.210 5
Techncians, associate professionals -0.081 3 0.262 5 -0.327 5 -0.096 2
Clerks, administrators -0.143 5 0.119 7 -0.415 6 -0.159 4
Service, shop, sales workers -0.065 2 -0.059 8 -0.143 3 -0.071 1
Skil led agricultural and fishery workers -0.221 7 -0.464 11 -5.376 16 -1.020 13
Craft and related workers -0.349 10 -0.451 10 -0.723 7 -0.402 8
Plant and machine operators, assemblers -0.699 14 -0.691 12 -1.233 12 -0.854 11
Elementary occupations -0.269 8 -0.312 9 -0.725 8 -0.372 7
Factor of Production Kazakhstan Russia Ukraine
Value Rank Value Rank Value Rank
Forestry & Fishing -1.257 12 28.253 5 5.483 2
Oil and gas 17.595 2 297.872 1 -7.909 17
Mining 16.751 3 108.005 3 17.904 1
Real Estate 0.234 6 1.845 11 -0.151 4
Machinery -9.923 16 -47.486 15 -6.548 15
Computers & Electronic Equipment -6.686 15 -51.876 16 -1.010 11
Electrical Equipment -13.629 18 -59.651 17 -1.090 12
Transport Equipment -12.297 17 -93.828 18 -8.537 18
Renting & leasing (other than real estate) 19.049 1 105.088 4 -4.312 14
Legislators, senior officials, managers 0.532 5 2.797 8 -0.222 6
Professionals 1.073 4 6.495 7 -0.880 10
Techncians, associate professionals 0.154 7 1.766 12 -0.329 7
Clerks, administrators -0.217 8 2.030 10 -0.417 8
Service, shop, sales workers -0.346 9 -0.644 13 -0.151 5
Skil led agricultural and fishery workers -0.726 11 110.265 2 -6.960 16
Craft and related workers -1.604 13 2.093 9 0.200 3
Plant and machine operators, assemblers -2.996 14 -7.491 14 -1.269 13
Elementary occupations -0.537 10 10.558 6 -0.429 9
*Factor contents of each country's net exports, relative to those of US consumption

TABLE 6: BILATERAL FACTOR CONTENT OF NET EXPORTS, 2008, using UK factor requirements, US $ 000
Factor Bilateral factor content - Armenia compared to:
Azerbaijan Belarus Georgia Kazakhstan Russia Ukraine
Forestry -6 120 -39 488 -4 276 -2 651 -45 856 -18 392
Fishing -4 508 19 873 8 573 -1 049 2 229 4 827
Oil and gas -3534 522 -4557 016 519 995 -1885 779 -2475 882 -501 550
Other minerals 117 842 119 809 34 871 -152 056 -25 567 -79 441
Machinery (including rental of) -200 907 -21 737 36 926 -115 222 -294 063 -187 894
Office machinery & computers -33 697 -12 184 30 735 -21 331 -29 982 -51 847
Electrical equipment -63 932 -63 651 89 419 22 248 -54 284 -127 847
Transport equipment -70 007 -389 970 142 209 34 576 -66 486 5 373
Real estate -47 413 -38 008 -4 031 -46 482 -53 231 -62 372
Legislators, senior officials, managers -511 450 -433 558 143 273 -374 813 -662 747 -572 448
Professionals -189 744 -2 723 31 572 -136 023 -134 826 -111 541
Techncians, associate professionals -131 969 -142 024 24 767 -56 406 -109 653 -65 621
Clerks, administrators -200 887 -46 930 17 681 -109 257 -117 878 -50 329
Service, shop, sales workers -16 920 -36 949 14 064 -33 249 -28 920 -37 259
Skil led agricultural and fishery workers -39 377 -26 513 -26 156 -72 480 -39 839 -87 043
Craft and related workers -95 234 -417 312 -88 790 -111 774 -296 954 -391 474
Plant and machine operators etc. -326 057 -212 224 103 373 -294 190 -358 103 -269 582
Elementary occupations -95 666 -75 750 8 956 -129 823 -120 049 -201 122
Factor Bilateral factor content - Azerbaijan compared to:
Belarus Georgia Kazakhstan Russia Ukraine
Forestry -129 531 7 157 13 466 -154 249 -47 638
Fishing 94 644 50 779 13 427 26 152 36 238
Oil and gas -3969 154 15738 971 6400 153 4109 470 11773 502
Other minerals 7 634 -322 080 -1047 700 -556 690 -765 821
Machinery (including rental of) 695 509 923 227 332 616 -361 616 50 512
Office machinery & computers 83 509 250 114 48 004 14 420 -70 455
Electrical equipment 1 094 595 284 334 537 37 453 -248 107
Transport equipment -1242 042 823 788 405 975 13 669 292 613
Real estate 36 510 168 402 3 615 -22 583 -58 066
Legislators, senior officials, managers 302 364 2541 527 530 403 -587 312 -236 783
Professionals 725 983 859 111 208 537 213 181 303 572
Techncians, associate professionals -39 030 608 424 293 325 86 628 257 554
Clerks, administrators 597 637 848 445 355 694 322 226 584 440
Service, shop, sales workers -77 750 120 274 -63 385 -46 579 -78 952
Skil led agricultural and fishery workers 49 937 51 322 -128 499 -1 792 -185 032
Craft and related workers -1250 256 25 013 -64 206 -783 044 -1149 956
Plant and machine operators, assemblers 441 879 1666 976 123 699 -124 397 219 225
Elementary occupations 77 314 406 129 -132 589 -94 648 -409 360

TABLE 6 (CONTINUED): Bilateral Factor Contents 2008, using UK requirements, US $ 000
Factor Belarus compared with : Russia with :
Georgia Kazakhstan Russia Ukraine
Forestry 179 551 187 838 -32 468 107 573
Fishing -57 620 -106 685 -89 969 -76 721
Oil and gas 25888 070 13620 846 10611 865 20679 134
Other minerals -433 103 -1386 258 -741 280 -1015 989
Machinery (including rental of) 299 124 -476 687 -1388 612 -847 251
Office machinery & computers 218 849 -46 638 -90 753 -202 243
Electrical equipment 780 512 438 002 47 760 -327 344
Transport equipment 2713 620 2164 792 1649 469 2015 882
Real estate 173 251 -43 209 -77 623 -124 232
Legislators, senior officials, managers 2941 305 299 546 -1168 654 -708 210
Professionals 174 873 -679 704 -673 603 -554 868
Techncians, associate professionals 850 478 436 572 165 061 389 585
Clerks, administrators 329 454 -317 810 -361 772 -17 335
Service, shop, sales workers 260 119 18 868 40 945 -1 580
Skil led agricultural and fishery workers 1 820 -234 388 -67 949 -308 649
Craft and related workers 1675 159 1557 964 613 717 131 751
Plant and machine operators etc. 1609 254 -417 953 -743 846 -292 473
Elementary occupations 431 923 -275 723 -225 884 -639 282
Factor Georgia with: Kazakhstan with:
Kazakhstan Russia Ukraine Russia Ukraine
Forestry 1 745 -44 645 -15 156 -483 810 -176 269
Fishing -10 332 -6 812 -4 022 36 710 65 804
Oil and gas -2583 125 -3216 730 -1096 852 -6607 967 15500 577
Other minerals -200 707 -64 893 -122 739 1416 425 813 142
Machinery (including rental of) -163 364 -355 389 -241 394 -2002 662 -813 789
Office machinery & computers -55 904 -65 193 -88 670 -96 879 -341 720
Electrical equipment -72 123 -154 297 -233 283 -857 002 -1680 762
Transport equipment -115 567 -224 080 -146 924 -1131 691 -327 017
Real estate -45 580 -52 827 -62 641 -75 575 -177 933
Legislators, senior officials, managers -556 279 -865 440 -768 483 -3224 289 -2213 115
Professionals -179 949 -178 665 -153 662 13 399 274 151
Techncians, associate professionals -87 157 -144 329 -97 051 -596 260 -103 187
Clerks, administrators -136 295 -145 552 -73 024 -96 544 659 869
Service, shop, sales workers -50 800 -46 152 -55 106 48 482 -44 906
Skil led agricultural and fishery workers -49 739 -14 692 -65 376 365 512 -163 084
Craft and related workers -24 678 -223 509 -324 997 -2073 643 -3132 079
Plant and machine operators etc. -426 872 -495 495 -400 449 -715 687 275 565
Elementary occupations -149 010 -138 515 -225 565 109 449 -798 404
3257 313
Ukraine
3841 803
363 445
276179 709
-7536 210
14851 389
-3058 549
-10290 400
10051 974
-1278 650
12631 575
-11340 902
6159 468
9449 108
-1166 600
-6603 217
-13221 974
12382 711

TABLE 7: BILATERAL FACTOR CONTENT OF NET EXPORTS, 2008, using US factor requirements, US $ 000
Factor Bilateral factor content - Armenia compared to:
Azerbaijan Belarus Georgia Kazakhstan Russia Ukraine
Forestry & Fishing -59 793 -67 755 -16 701 -78 874 -98 479 -108 479
Oil and gas -3628 964 -2962 281 471 895 -1992 546 -2403 294 -451 626
Mining 49 092 37 370 31 519 -125 902 -64 988 -99 564
Real Estate -107 325 -97 244 - 577 -80 071 -74 557 -57 939
Machinery -113 781 -123 521 25 099 -19 310 -102 763 -88 534
Computers & Electronic Equipment -48 588 -76 924 58 210 -19 151 -75 279 -150 727
Electrical Equipment 2 036 -17 829 8 908 31 008 -41 869 -74 536
Transport Equipment -15 839 -62 341 138 665 123 791 -6 365 -38 864
Renting & leasing (not real estate) -701 849 -556 574 -3 975 -494 444 -270 446 -26 102
Legislators, senior officials, managers -363 129 -340 568 -2 701 -308 167 -285 273 -256 418
Professionals -623 775 -538 058 29 276 -408 539 -334 387 -177 412
Techncians, associate professionals -116 078 -103 528 5 957 -74 220 -73 346 -46 557
Clerks, administrators -156 222 -149 667 3 846 -111 393 -141 800 -103 989
Service, shop, sales workers -60 472 -64 874 1 452 -41 401 -73 334 -66 810
Skil led agricultural, fishery workers - 727 - 932 5 228 -1 119 -7 234 1 713
Craft and related workers -159 642 -178 630 17 118 -141 032 -249 433 -248 226
Plant and machine operators etc -339 739 -367 469 62 969 -281 403 -420 969 -401 209
Elementary occupations -40 881 -45 045 16 836 -47 915 -74 704 -52 177
Factor Bilateral factor content - Azerbaijan compared to:
Belarus Georgia Kazakhstan Russia Ukraine
Forestry & Fishing -30 906 167 275 -74 069 -150 174 -188 989
Oil and gas -1671 612 15918 864 6352 307 4757 850 12333 907
Mining 89 846 -68 216 -679 298 -442 842 -577 059
Real Estate 333 277 414 379 105 796 127 200 191 709
Machinery 630 159 539 109 366 719 42 768 98 001
Computers & Electronic Equipment -245 488 414 571 114 272 -103 611 -396 485
Electrical Equipment -28 559 26 678 112 467 -170 431 -297 240
Transport Equipment -1270 149 599 760 542 022 36 777 -89 377
Renting & leasing (not real estate) 3479 410 2709 035 805 115 1674 637 2623 141
Legislators, senior officials, managers 1041 059 1399 124 213 355 302 223 414 235
Professionals 2405 387 2535 038 835 512 1123 360 1732 710
Techncians, associate professionals 398 424 473 722 162 486 165 879 269 868
Clerks, administrators 390 465 621 359 174 019 55 984 202 757
Service, shop, sales workers 59 986 240 377 74 031 -49 927 -24 603
Skil led agricultural and fishery workers 26 013 23 117 -1 521 -25 260 9 471
Craft and related workers 68 126 686 157 72 242 -348 551 -343 866
Plant and machine operators, assemblers 161 207 1563 245 226 449 -315 322 -238 617
Elementary occupations 52 000 224 047 -27 304 -131 296 -43 850

TABLE 7 (CONTINUED): Bilateral Factor Contents 2008, using US requirements, US $ 000
Factor Belarus compared with : Russia with :
Georgia Kazakhstan Russia Ukraine
Forestry & Fishing 260 326 -56 698 -156 667 -207 653
Oil and gas 23106 382 10540 007 8445 571 18397 278
Mining -207 627 -1010 327 -699 725 -876 029
Real Estate 106 534 -298 812 -270 697 -185 959
Machinery -119 600 -346 047 -771 581 -699 028
Computers & Electronic Equipment 867 036 472 571 186 366 -198 346
Electrical Equipment 72 557 185 248 -186 360 -352 932
Transport Equipment 2456 263 2380 420 1716 743 1551 031
Renting & leasing (not real estate) -1011 944 -3512 883 -2370 702 -1124 772
Legislators, senior officials, managers 470 345 -1087 250 -970 514 -823 379
Professionals 170 306 -2062 147 -1684 037 -883 611
Techncians, associate professionals 98 909 -309 921 -305 465 -168 867
Clerks, administrators 303 295 -284 319 -439 366 -246 568
Service, shop, sales workers 236 958 18 450 -144 379 -111 113
Skil led agricultural, fishery workers -3 804 -36 168 -67 351 -21 729
Craft and related workers 811 828 5 407 -547 337 -541 183
Plant and machine operators etc 1841 680 85 700 -625 955 -525 198
Elementary occupations 225 996 -104 172 -240 773 -125 906
Factor Georgia with: Kazakhstan with:
Kazakhstan Russia Ukraine Russia Ukraine
Forestry & Fishing -66 756 -87 807 -98 543 -219 541 -331 510
Oil and gas -2646 118 -3087 146 -991 602 -4599 553 17255 208
Mining -169 026 -103 622 -140 746 682 107 294 930
Real Estate -85 354 -79 434 -61 591 61 744 247 834
Machinery -47 683 -137 288 -122 011 -934 507 -775 176
Computers & Electronic Equipment -83 063 -143 330 -224 339 -628 529 -1473 388
Electrical Equipment 23 729 -54 521 -89 596 -816 080 -1181 887
Transport Equipment -15 970 -155 722 -190 616 -1457 488 -1821 406
Renting & leasing (not real estate) -526 626 -286 115 -23 758 2508 323 5244 487
Legislators, senior officials, managers -327 985 -303 404 -272 421 256 360 579 482
Professionals -470 090 -390 471 -221 925 830 360 2588 160
Techncians, associate professionals -86 088 -85 150 -56 386 9 785 309 766
Clerks, administrators -123 735 -156 383 -115 785 -340 497 82 903
Service, shop, sales workers -46 011 -80 299 -73 294 -357 585 -284 532
Skil led agricultural, fishery workers -6 815 -13 381 -3 774 -68 481 31 708
Craft and related workers -169 809 -286 201 -284 905 -1213 870 -1200 354
Plant and machine operators etc -369 759 -519 613 -498 397 -1562 854 -1341 582
Elementary occupations -69 524 -98 288 -74 101 -299 987 -47 731
21958424
Ukraine
-1398723
273009461
-4836612
2324635
1990362
-10553962
-4569660
-4546056
34180133
4036433
3151178
3747354
5289105
912587
1251563
168837
2764126
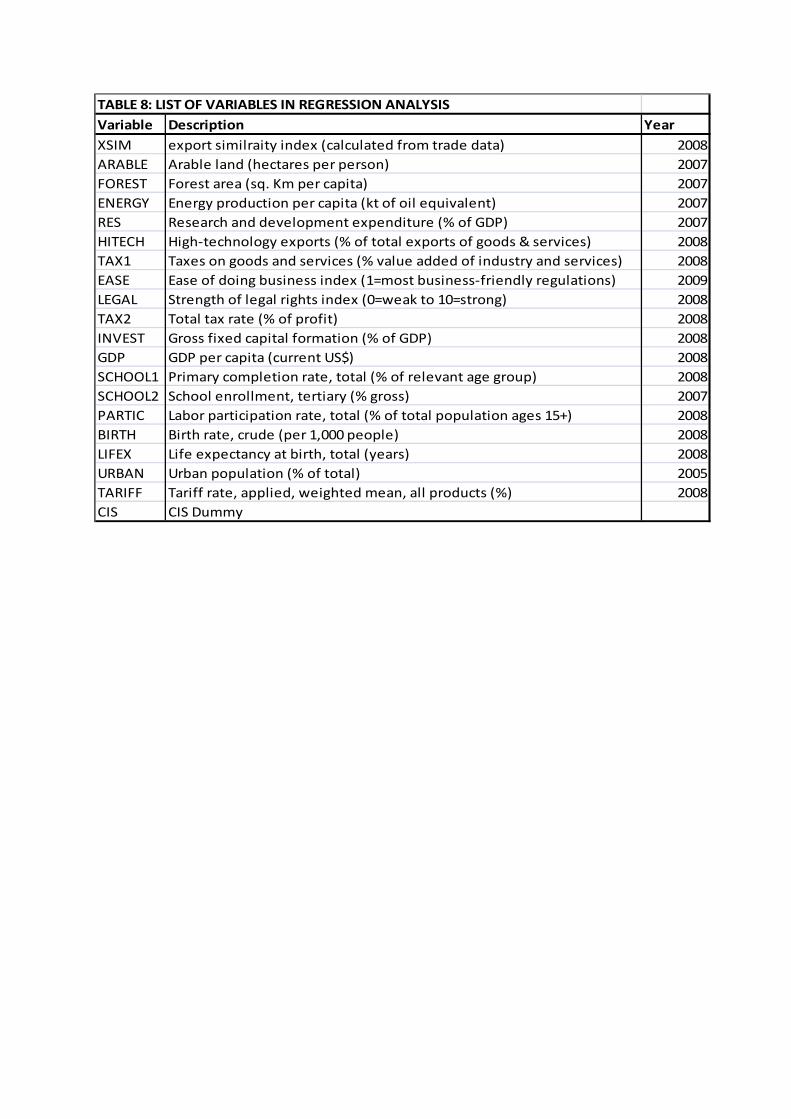
TABLE 8: LIST OF VARIABLES IN REGRESSION ANALYSIS
Variable Description Year
XSIM export similraity index (calculated from trade data) 2008
ARABLE Arable land (hectares per person) 2007
FOREST Forest area (sq. Km per capita) 2007
ENERGY Energy production per capita (kt of oil equivalent) 2007
RES Research and development expenditure (% of GDP) 2007
HITECH High-technology exports (% of total exports of goods & services) 2008
TAX1 Taxes on goods and services (% value added of industry and services) 2008
EASE Ease of doing business index (1=most business-friendly regulations) 2009
LEGAL Strength of legal rights index (0=weak to 10=strong) 2008
TAX2 Total tax rate (% of profit) 2008
INVEST Gross fixed capital formation (% of GDP) 2008
GDP GDP per capita (current US$) 2008
SCHOOL1 Primary completion rate, total (% of relevant age group) 2008
SCHOOL2 School enrollment, tertiary (% gross) 2007
PARTIC Labor participation rate, total (% of total population ages 15+) 2008
BIRTH Birth rate, crude (per 1,000 people) 2008
LIFEX Life expectancy at birth, total (years) 2008
URBAN Urban population (% of total) 2005
TARIFF Tariff rate, applied, weighted mean, all products (%) 2008
CIS CIS Dummy

TABLE 9: REGRESSION ANALYSIS (PANEL LEAST SQUARES) - DEPENDENT VARIABLE - EXPORT SIMILARITY INDICE
SAMPLE 2 SAMPLE 2 SAMPLE 1 SAMPLE 1
258 Observations, 6 CIS Restricted equation 581 Observations, 7 CIS Restricted equation
countries countries
Variable Coeff.
Std.
Error t-Stat. Coeff.
Std.
Error t-Stat. Coeff.
Std.
Error t-Stat. Coeff.
Std.
Error t-Stat.
C 0.2485 0.0198 12.5679 0.2415 0.0178 13.5957 0.1589 0.0156 10.1754 0.1480 0.0081 18.2382
ARABLE 0.0818 0.0308 2.6568 0.0837 0.0284 2.9515 -0.0247 0.0257 -0.9593
BIRTH 0.0059 0.0020 2.9800 0.0046 0.0015 2.9627 -0.0015 0.0012 -1.2984 -0.0014 0.0010 -1.4631
CIS -0.0734 0.0258 -2.8523 -0.0665 0.0242 -2.7491 0.0362 0.0258 1.4028 0.0477 0.0222 2.1491
EASE 0.0001 0.0002 0.6291 0.0000 0.0002 -0.2071
ENERGY -20.2489 4.8941 -4.1374 -23.2816 4.2971 -5.4180 -3.8590 0.7447 -5.1817 -4.0115 0.5648 -7.1020
FOREST 0.6882 0.5403 1.2737 0.8729 0.4755 1.8356 0.1209 0.4764 0.2538
GDP 0.0000 0.0000 -1.6596 0.0000 0.0000 -0.3058
HITECH 0.0026 0.0014 1.8737 0.0033 0.0012 2.7576 n/a n/a n/a
INVEST -0.0006 0.0014 -0.4061 0.0019 0.0010 1.8936 0.0019 0.0010 1.9678
LEGAL -0.0001 0.0034 -0.0388 -0.0005 0.0031 -0.1569
LIFEX 0.0130 0.0030 4.2814 0.0071 0.0018 3.8703 0.0006 0.0012 0.5446
PARTIC 0.0021 0.0010 2.1461 0.0014 0.0009 1.6085 0.0033 0.0008 4.3081 0.0032 0.0006 4.8822
RES 0.0228 0.0237 0.9645 n/a n/a n/a
SCHOOL1 -0.0006 0.0009 -0.6148 -0.0006 0.0006 -0.9939
SCHOOL2 0.0005 0.0005 0.8280 n/a n/a n/a
TARIFF 0.0059 0.0028 2.1336 0.0047 0.0022 2.1540 -0.0026 0.0018 -1.4113 -0.0026 0.0016 -1.6147
TAX1 0.0025 0.0016 1.5426 n/a n/a n/a
TAX2 -0.0008 0.0004 -1.9623 -0.0009 0.0003 -2.7571 -0.0007 0.0004 -1.6431 -0.0008 0.0003 -2.3567
URBAN -0.0011 0.0007 -1.6664 -0.0005 0.0004 -1.4023 -0.0007 0.0003 -2.1801
Diagnostics :
R-squared 0.3541 0.3354 0.2164 0.2131
Adjusted R-squared 0.2876 0.2943 0.1869 0.1936
S.E. of regression 0.0904 0.0900 0.1331 0.1326
Sum squared resids. 1.9033 1.9583 9.9094 9.9508
Log likelihood
F-statistic 5.3233 8.1436 7.3490 10.9471
Mean dependent var 0.1676 0.1676 0.1658 0.1658
S.D. dependent var 0.1071 0.1071 0.1477 0.1477
Akaike info criterion -1.8777 -1.9190 -1.1577 -1.1776
Schwarz criterion -1.5334 -1.6986 -0.9924 -1.0649
Hannan-Quinn criter. -1.7393 -1.8304 -1.0932 -1.1337
Cross-section effects
(fixed) :
Armenia -0.1461 Value df -0.1614 Value df
Azerbaijan n/a F-statistic 0.74923 (9, 233) 0.0284 0.3334 (7, 559)
Belarus 0.0469 Likelihood ratio 7.3607 9 0.0523 2.4206 7.0000
Georgia -0.0473 -0.0764
Kazakhstan 0.0181 0.0340
Russian Federation 0.1059 0.0825
Ukraine 0.0223 0.0406
F-statistic
Likelihood ratio
358.2997 357.0894267.2255 263.5451
Redundant variables tests:
Cross-section
effects (fixed) : Redundant variables tests:

APPENDIX 1: EXPORT SIMILARITY INDICES
Comparison Country Former Soviet Country:
Armenia Azerbaijan Belarus Georgia Kazakhstan Russia Ukraine
WORLD 9.6% 16.4% 33.0% 23.4% 21.5% 30.4% 34.2%
Algeria 0.6% 62.5% 13.2% 3.0% 59.8% 56.5% 4.9%
Argentina 8.3% 12.0% 25.5% 22.1% 17.7% 20.9% 28.1%
Armenia N/A 0.9% 3.5% 37.0% 7.1% 4.1% 9.1%
Australia 9.2% 8.6% 15.4% 22.3% 22.9% 22.8% 22.5%
Austria 7.3% 3.9% 27.7% 20.7% 8.1% 14.1% 29.9%
Azerbaijan 0.9% N/A 14.5% 5.0% 65.7% 44.1% 7.1%
Bahrain 1.3% 10.1% 36.7% 5.2% 5.5% 20.1% 11.1%
Bangladesh 2.4% 2.4% 6.3% 4.6% 3.7% 4.1% 7.3%
Belarus 3.5% 14.5% N/A 10.4% 9.5% 29.0% 24.7%
Bhutan 14.0% 0.8% 4.3% 15.1% 5.1% 3.4% 7.8%
Bolivia 5.3% 7.2% 8.1% 9.4% 11.9% 22.0% 7.0%
Brazil 6.7% 12.2% 25.7% 19.4% 20.1% 23.4% 30.3%
Bulgaria 15.3% 12.0% 33.2% 17.4% 15.4% 25.0% 33.4%
Canada 8.7% 17.5% 28.2% 25.6% 28.3% 39.4% 30.0%
Chile 23.3% 3.3% 8.7% 18.9% 12.2% 9.6% 11.4%
China 5.7% 3.7% 21.4% 9.9% 6.5% 12.2% 24.6%
Colombia 10.4% 30.8% 23.7% 19.4% 33.6% 37.6% 22.4%
Costa Rica 6.7% 2.3% 14.0% 9.3% 3.5% 6.0% 14.1%
Cote d Ivoire 2.9% 25.4% 29.4% 10.7% 21.1% 35.8% 11.5%
Cyprus 6.7% 10.4% 28.4% 18.4% 7.0% 21.9% 16.5%
Czech Republic 7.2% 3.2% 24.8% 19.5% 6.5% 13.2% 30.5%
Dom Rep 19.7% 3.3% 12.2% 20.5% 7.6% 6.4% 16.9%
Egypt 4.3% 20.8% 35.2% 11.1% 18.8% 46.1% 22.6%
France 8.7% 6.2% 28.3% 24.4% 10.8% 16.6% 32.6%
Georgia 37.0% 5.0% 10.4% N/A 11.3% 10.3% 18.5%
Germany 7.3% 4.7% 26.2% 21.1% 7.6% 14.4% 29.3%
Ghana 4.6% 2.0% 5.3% 11.4% 3.6% 5.4% 5.9%
Greece 9.6% 13.4% 30.3% 15.1% 9.6% 22.0% 28.6%
Hong Kong 9.8% 1.7% 12.0% 8.6% 4.2% 6.7% 14.5%
Hungary 6.3% 4.2% 21.8% 17.0% 6.2% 11.6% 26.0%
India 16.3% 13.1% 32.4% 12.6% 13.4% 27.8% 28.1%
Iran 3.0% 82.6% 9.2% 7.8% 67.9% 41.6% 8.3%
Ireland 4.9% 2.1% 12.0% 8.4% 3.3% 6.0% 13.1%
Israel 22.3% 2.3% 10.6% 7.8% 2.5% 7.2% 12.2%
Italy 8.5% 6.7% 29.3% 16.8% 8.2% 14.3% 31.4%
Jamaica 6.6% 10.9% 20.1% 11.6% 5.9% 19.1% 10.7%
Japan 5.4% 3.1% 18.1% 14.4% 7.8% 12.9% 21.9%
Jordan 9.7% 3.1% 24.2% 19.8% 4.5% 9.0% 20.3%
Kazakhstan 7.1% 65.7% 9.5% 11.3% N/A 47.4% 18.3%
Kenya 8.0% 7.6% 17.3% 14.0% 7.7% 12.1% 18.8%
Kuwait 0.9% 73.6% 34.5% 5.0% 67.4% 53.8% 6.7%
Malawi 1.7% 1.7% 4.9% 6.2% 1.5% 2.8% 7.3%
Malaysia 5.5% 12.2% 22.4% 9.8% 14.9% 24.6% 20.7%
Mauritius 6.6% 1.6% 8.1% 8.3% 2.7% 4.5% 8.3%
Mexico 7.5% 17.6% 25.2% 19.0% 21.2% 24.1% 23.8%

APPENDIX 1: EXPORT SIMILARITY INDICES (CONTINUED)Comparison CountryFormer Soviet Country:
Armenia Azerbaijan Belarus Georgia Kazakhstan Russia Ukraine
WORLD 9.6% 16.4% 33.0% 23.4% 21.5% 30.4% 34.2%
Morocco 5.7% 3.8% 12.1% 8.7% 7.1% 8.2% 13.9%Namibia 26.7% 1.9% 8.4% 8.2% 6.7% 5.5% 8.6%Nepal 2.5% 1.4% 6.7% 6.0% 4.3% 3.1% 10.0%Netherlands 7.7% 12.6% 29.8% 13.8% 9.3% 21.2% 27.8%New Zealand 7.0% 6.8% 21.0% 17.2% 10.4% 15.7% 18.3%Nigeria 0.5% 87.6% 6.0% 3.2% 63.3% 35.6% 3.1%Oman 2.2% 66.7% 15.7% 7.3% 66.0% 56.5% 12.0%Pakistan 6.0% 7.3% 12.8% 8.3% 6.5% 9.0% 12.1%Panama 6.0% 1.8% 7.3% 11.4% 3.6% 3.6% 7.7%Paraguay 3.0% 1.8% 7.2% 7.0% 4.6% 4.8% 13.8%Philippines 5.3% 4.0% 12.9% 7.8% 8.7% 9.0% 15.2%Poland 7.6% 4.7% 30.6% 19.6% 9.5% 15.7% 32.1%Portugal 9.2% 8.0% 28.9% 20.4% 7.8% 14.4% 27.2%Qatar 0.5% 51.5% 9.5% 4.9% 53.5% 52.9% 7.1%Romania 7.1% 10.3% 29.5% 19.5% 10.2% 20.9% 35.6%Russia 4.1% 44.1% 29.0% 10.3% 47.4% N/A 22.4%South Korea 4.8% 9.8% 24.0% 13.5% 9.6% 17.7% 22.5%Saudi Arabia 1.8% 86.6% 16.3% 6.0% 68.0% 48.3% 9.0%Senegal 9.4% 11.6% 35.7% 19.2% 9.6% 23.9% 17.2%Seychelles 0.6% 0.3% 1.4% 1.2% 0.4% 0.7% 1.1%Singapore 5.9% 11.4% 26.9% 9.4% 6.9% 23.2% 18.9%Slovakia 6.6% 7.5% 27.6% 17.7% 10.5% 17.4% 31.6%Spain 7.4% 8.4% 31.1% 21.8% 8.7% 16.8% 30.8%Sri Lanka 7.6% 1.5% 9.1% 5.4% 2.5% 4.2% 8.6%South Africa 16.2% 6.6% 18.4% 25.8% 17.2% 20.0% 28.3%Sudan 0.9% 87.4% 6.0% 3.3% 64.4% 35.8% 3.6%Sweden 6.6% 7.8% 27.3% 18.8% 9.2% 18.0% 30.1%Switzerland 9.3% 1.7% 15.3% 11.6% 3.5% 8.8% 19.7%Syria 3.5% 42.6% 19.9% 8.8% 40.6% 42.9% 15.2%Taiwan 4.9% 7.7% 20.0% 6.3% 8.3% 15.0% 20.1%Tanzania 6.2% 3.2% 8.9% 15.2% 6.3% 8.5% 12.9%Thailand 9.9% 7.9% 28.2% 15.1% 8.6% 14.0% 23.3%Trinidad and Tobago 2.4% 23.5% 31.9% 8.2% 22.2% 47.1% 14.8%Tunisia 5.3% 17.3% 19.2% 10.6% 18.0% 21.6% 18.7%Turkey 10.3% 7.7% 31.6% 20.9% 10.3% 15.1% 31.7%UAE 10.0% 46.0% 23.5% 16.0% 41.5% 49.8% 14.9%Uganda 8.4% 5.5% 12.0% 19.4% 7.1% 8.3% 15.7%Ukraine 9.1% 7.1% 24.7% 18.5% 18.3% 22.4% N/AUK 10.5% 12.8% 27.6% 21.9% 14.7% 23.0% 27.1%Uruguay 5.3% 4.1% 17.4% 9.4% 8.3% 9.7% 16.9%USA 9.8% 6.6% 24.7% 20.2% 11.7% 17.2% 29.3%Venezuela 1.3% 90.2% 16.6% 4.8% 67.5% 50.2% 9.0%Vietnam 4.8% 21.2% 18.0% 8.8% 24.0% 27.5% 16.9%Yemen 2.0% 90.2% 13.6% 6.4% 65.1% 42.8% 8.1%