bowen manager, project services - pubmanitoba.ca · aace estimate classification system hydropower...
TRANSCRIPT
Dave Bowen
Manager, Project Services

Outline
• Capital Cost Estimate Process– Base Cost– Treatment of uncertainty– In‐Service Cost
• Development of IFF12/CEF12 Budget– Stress Test
M t R– Management Reserves– Results
• Project Execution/Lessons Learnedj• Application to NFAT
2

Estimate Development Process
Capital Cost Estimate Process
Estimate Development ProcessSTEP 1: Estimate Development
STEP 2: Budget Scenario Development
Point Estimate Contingency
Management Reserve Fund 1
Management Reserve Fund 2
MANAGEMENT RESERVE
SCENARIO 1:No Reserves
SCENARIO 2:with Reserve Fund 1
SCENARIO 2:with all Reserve Funds
SCENARIO 2:with Reserve Fund 2
3
Estimate Development Process
Capital Cost Estimate Process
Estimate Development Process
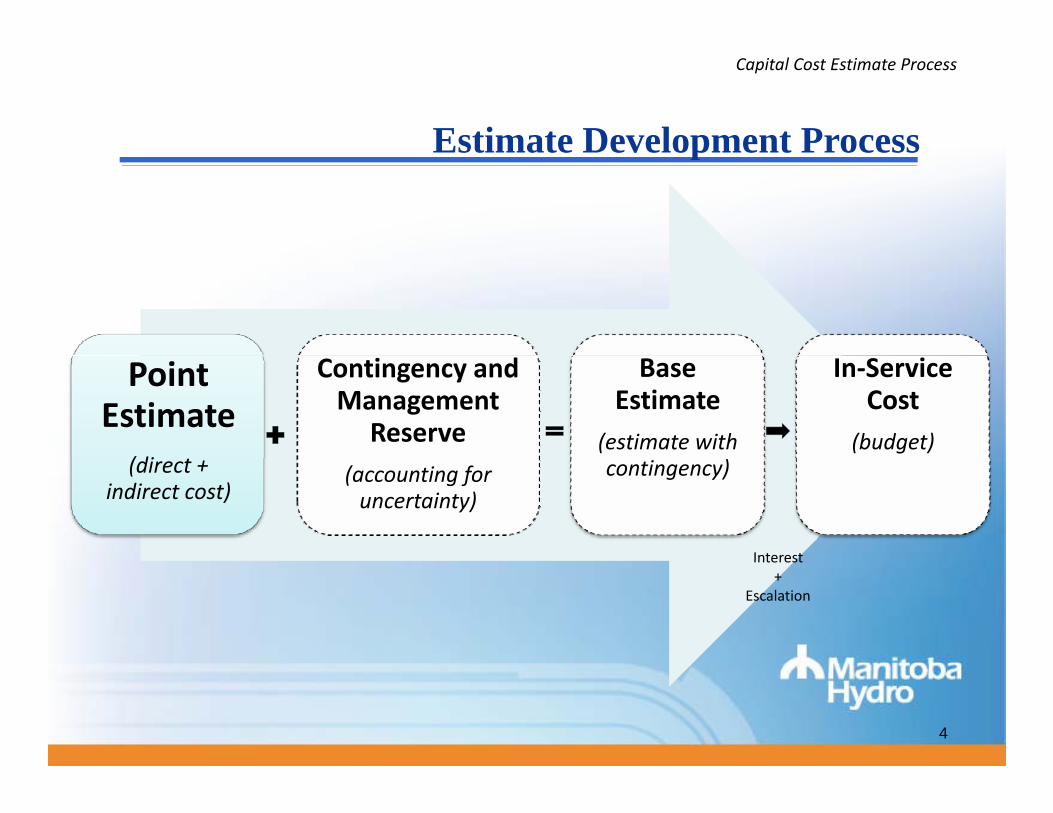
Point Estimate
(di
Contingency and Management
Reserve
Base Estimate
(estimate with
In‐Service Cost
(budget)(direct +
indirect cost)(accounting for uncertainty)
contingency)
InterestInterest+
Escalation
4
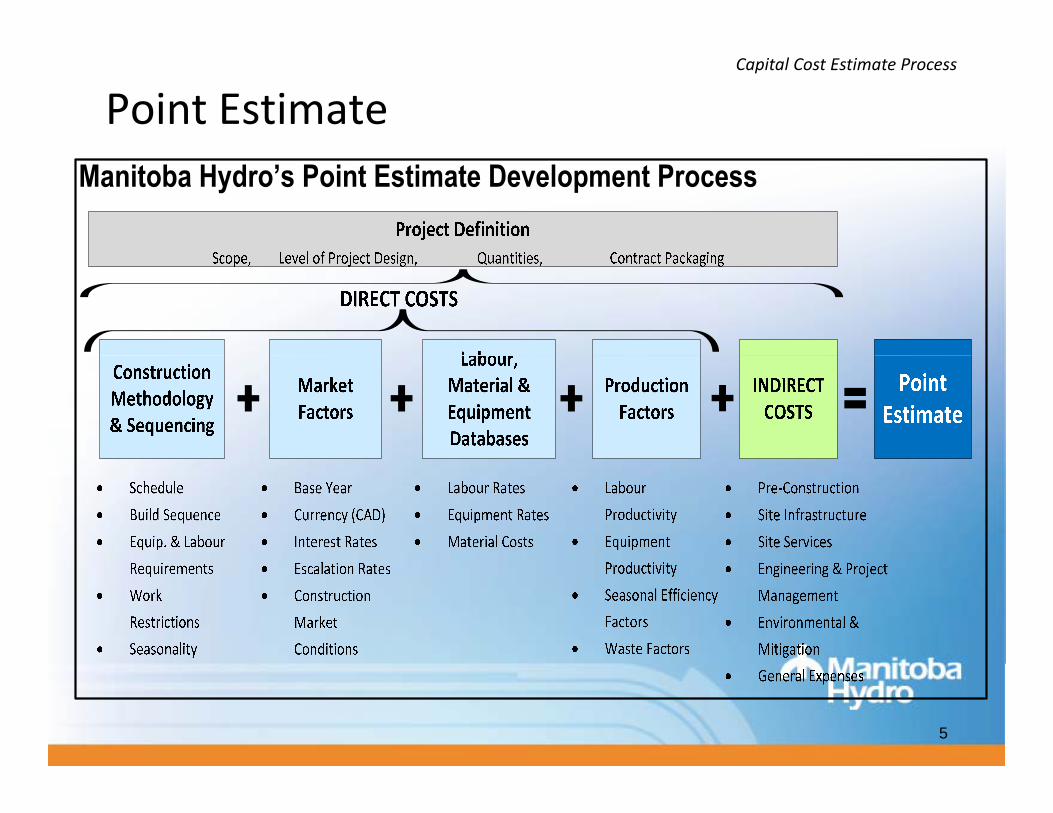
Point EstimateCapital Cost Estimate Process
5
6

Indirect CostsCapital Cost Estimate Process
7

Contingency
Capital Cost Estimate Process
Contingency
Point Estimate
(direct + indirect cost)
Contingency and Management
Reserve
Base Estimate(estimate with contingency)
In‐Service Cost
(budget)cost)
(accounting for uncertainty)
Interest+
Escalation
8

What is Contingency?
Capital Cost Estimate Process
What is Contingency?• Meant to address uncertainty & risks associated with the
estimateestimate– Based on the current project scope
– Risks & opportunities in assumptions of Point Estimate
– One step of larger risk management process
• Developed with expectation it will be spent– Proven time and again that, due to uncertainties involved,
major construction projects never go exactly as planned
• Developed as range of amounts for different desired levels of confidence in achieving a budget under run
9

Contingency Curve
Capital Cost Estimate Process
g y
10

What is Management Reserve?
Capital Cost Estimate Process
What is Management Reserve?
• Next step, after contingency in risk management processprocess
• Amount added to cover uncertainty items with very high impacts but lower likelihood of occurrence &high impacts but lower likelihood of occurrence & substantial risk items not appropriate to be covered with contingency (major market shifts, etc.)g y ( j f , )
• Typically includes items related to regulatory requirements, future market conditions and significant risk items
11
What is Management Reserve?
Capital Cost Estimate Process
What is Management Reserve?
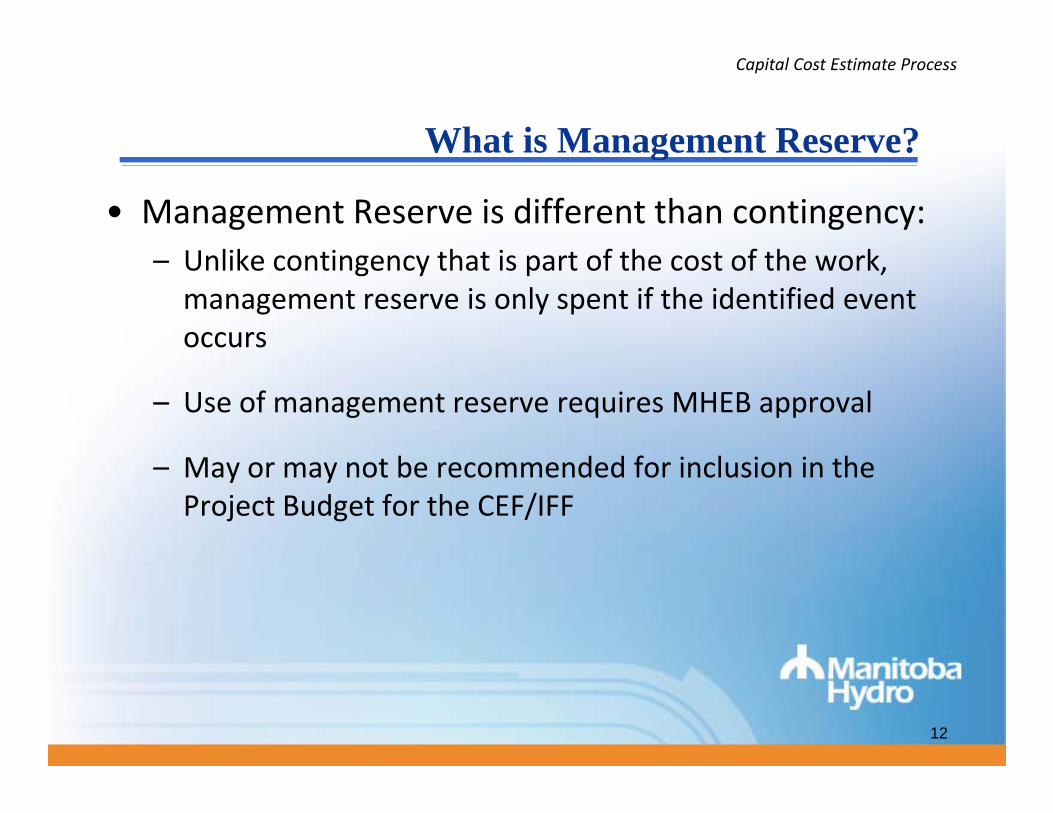
• Management Reserve is different than contingency:U lik ti th t i t f th t f th k– Unlike contingency that is part of the cost of the work, management reserve is only spent if the identified event occurs
– Use of management reserve requires MHEB approval
M b d d f i l i i h– May or may not be recommended for inclusion in the Project Budget for the CEF/IFF
12

What is In-Service Cost?
Capital Cost Estimate Process
What is In Service Cost?
• Interest and escalation on major projects, like Keeyask & Conawapa add several Billions of dollarsKeeyask & Conawapa, add several Billions of dollars to the estimate– Approximately 30% of Keeyask In‐Service Cost, 40% of Conawapa In‐
service Cost
Keeyask – For Comparative Purposes
13
Capital Cost Estimate Process
Capital Cost Estimate Summary
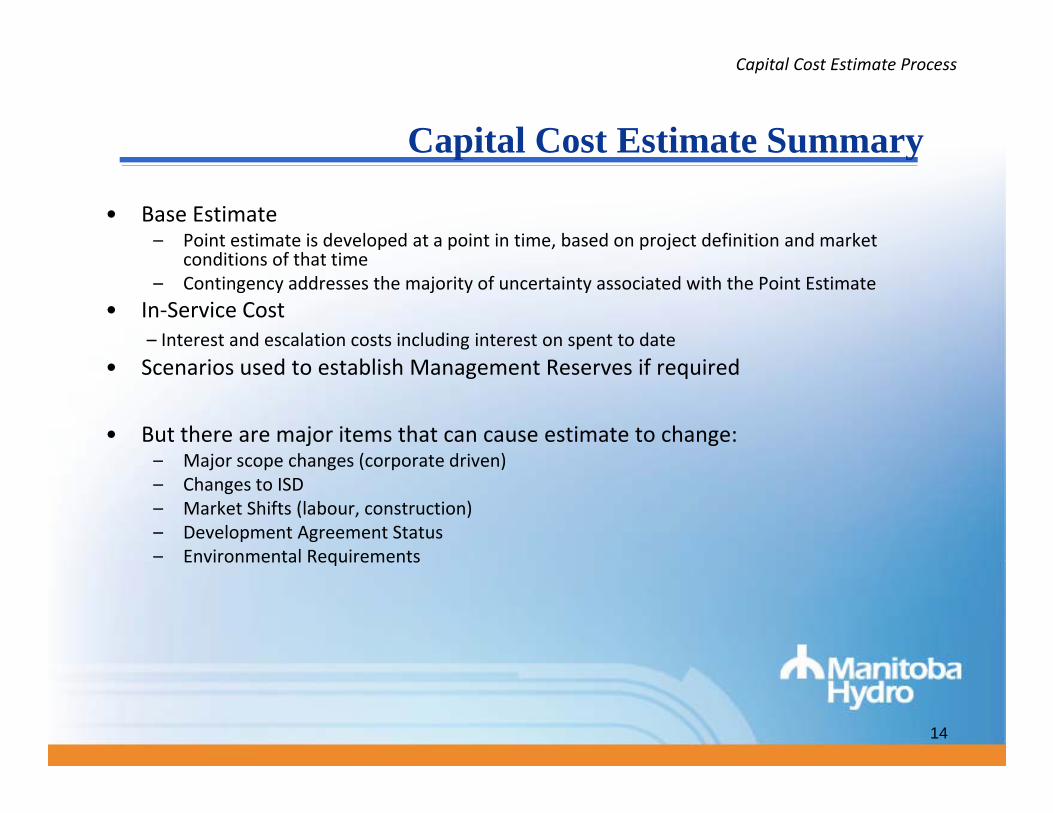
• Base Estimate– Point estimate is developed at a point in time, based on project definition and market
di i f h i
Capital Cost Estimate Summary
conditions of that time– Contingency addresses the majority of uncertainty associated with the Point Estimate
• In‐Service Cost– Interest and escalation costs including interest on spent to date
• Scenarios used to establish Management Reserves if required
• But there are major items that can cause estimate to change:Major scope changes (corporate driven)– Major scope changes (corporate driven)
– Changes to ISD– Market Shifts (labour, construction)– Development Agreement Status– Environmental RequirementsEnvironmental Requirements
14
2012 Review of K&C Estimates
Development of IFF/CEF12 Budget
2012 Review of K&C Estimates
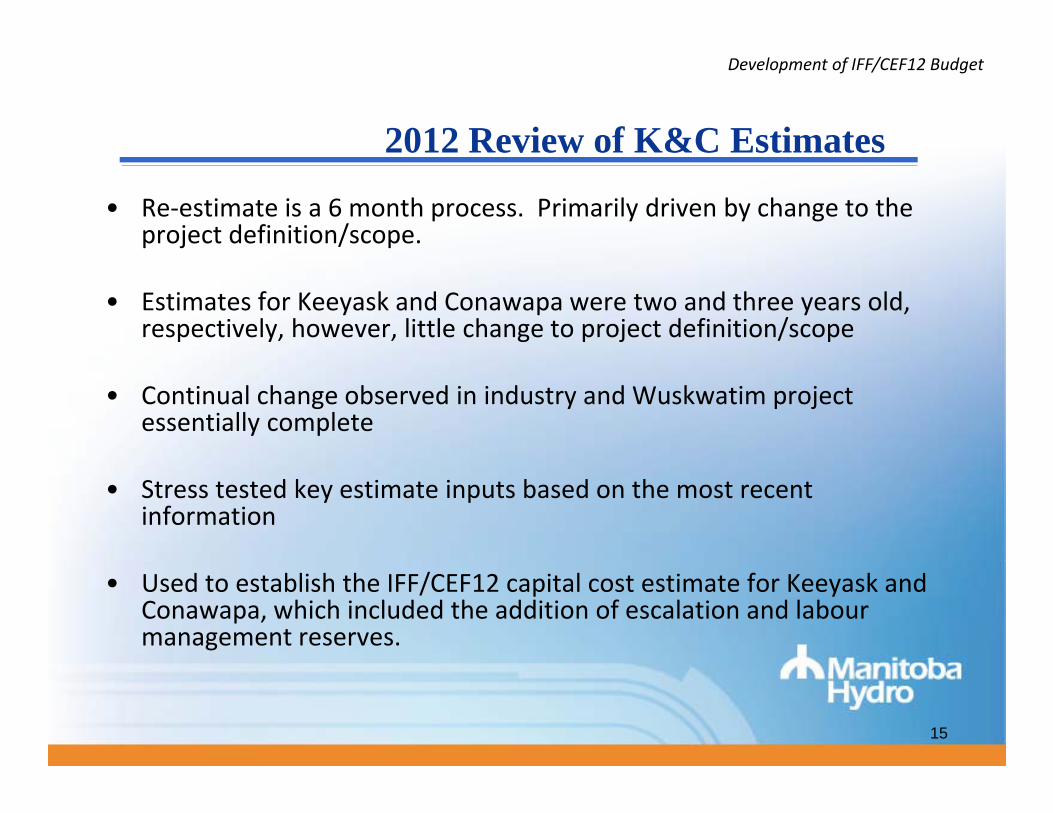
• Re‐estimate is a 6 month process. Primarily driven by change to the project definition/scope.
• Estimates for Keeyask and Conawapa were two and three years old, respectively, however, little change to project definition/scope
• Continual change observed in industry and Wuskwatim project essentially complete
• Stress tested key estimate inputs based on the most recent information
• Used to establish the IFF/CEF12 capital cost estimate for Keeyask and Conawapa, which included the addition of escalation and labourmanagement reserves.
15
Stress Test Results - Budget Scenarios
Development of IFF/CEF12 Budget
Stress Test Results Budget Scenarios
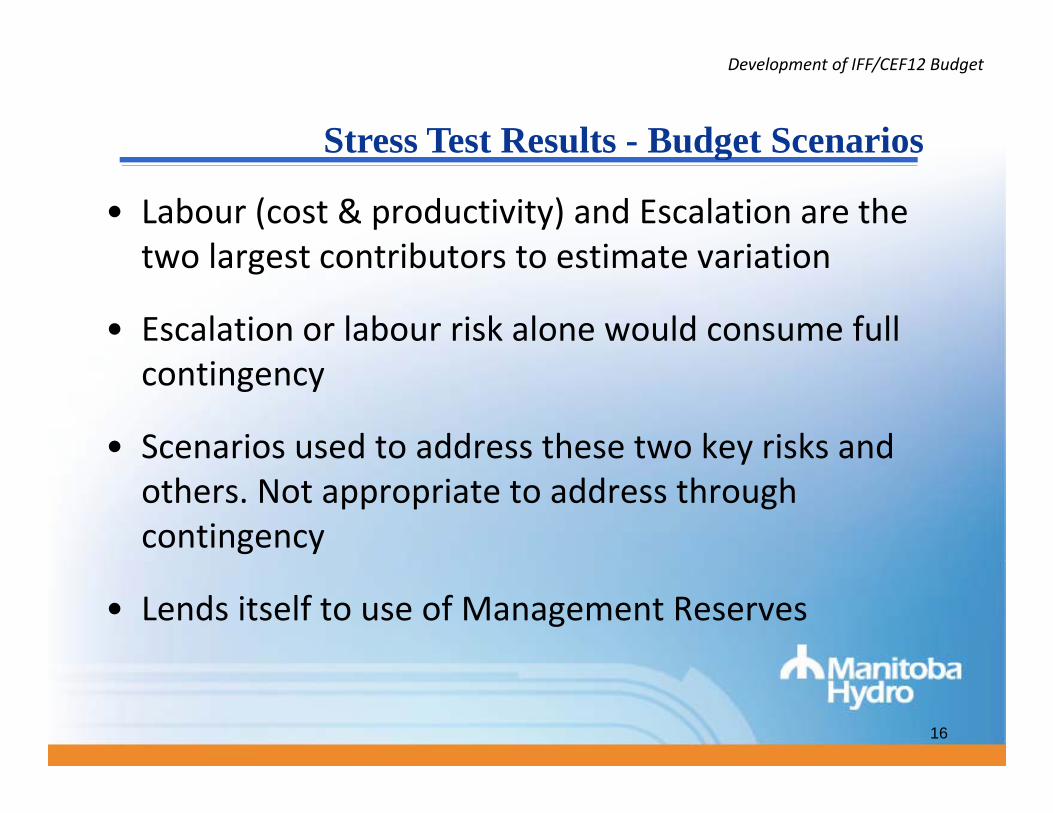
• Labour (cost & productivity) and Escalation are the two largest contributors to estimate variationtwo largest contributors to estimate variation
• Escalation or labour risk alone would consume full contingency
• Scenarios used to address these two key risks andScenarios used to address these two key risks and others. Not appropriate to address through contingency
• Lends itself to use of Management Reserves
16
Budget Scenarios – Labour Risk
Development of IFF/CEF12 Budget
Budget Scenarios Labour Risk
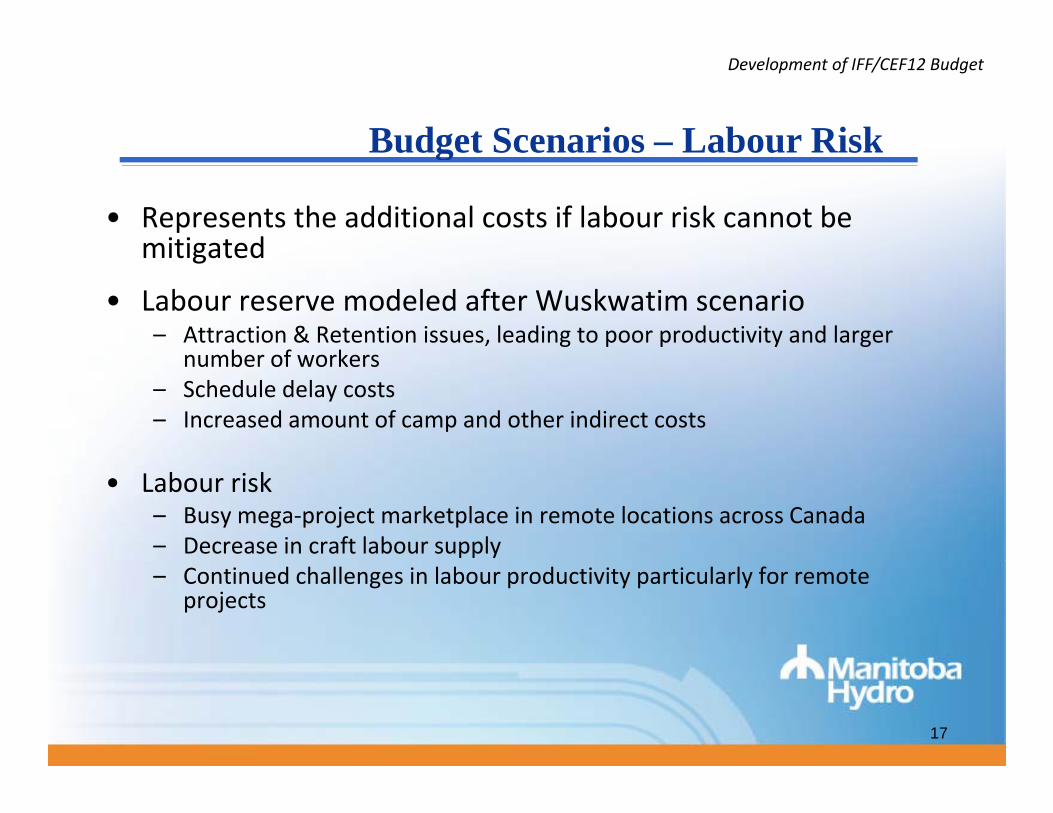
• Represents the additional costs if labour risk cannot be mitigatedmitigated
• Labour reserve modeled after Wuskwatim scenario– Attraction & Retention issues, leading to poor productivity and larger
number of workersnumber of workers– Schedule delay costs– Increased amount of camp and other indirect costs
• Labour risk– Busy mega‐project marketplace in remote locations across Canada– Decrease in craft labour supply– Continued challenges in labour productivity particularly for remote
projects
17

Budget Scenarios - Escalation Risk
Development of IFF/CEF12 Budget
Budget Scenarios Escalation RiskStart of Wuskwatim Construction
Recession Today Current Forecast
18

Estimate Development Process
Development of IFF/CEF12 Budget
Estimate Development ProcessSTEP 1: Estimate Development
STEP 2: Budget Scenario Development – Included 2012 Stress Test
Point Estimate Contingency
Management Reserve Fund 1
Management Reserve Fund 2
MANAGEMENT RESERVE
SCENARIO 1:No Reserves
SCENARIO 2:with Reserve Fund 1
SCENARIO 2:with all Reserve Funds
SCENARIO 2:with Reserve Fund 2
19
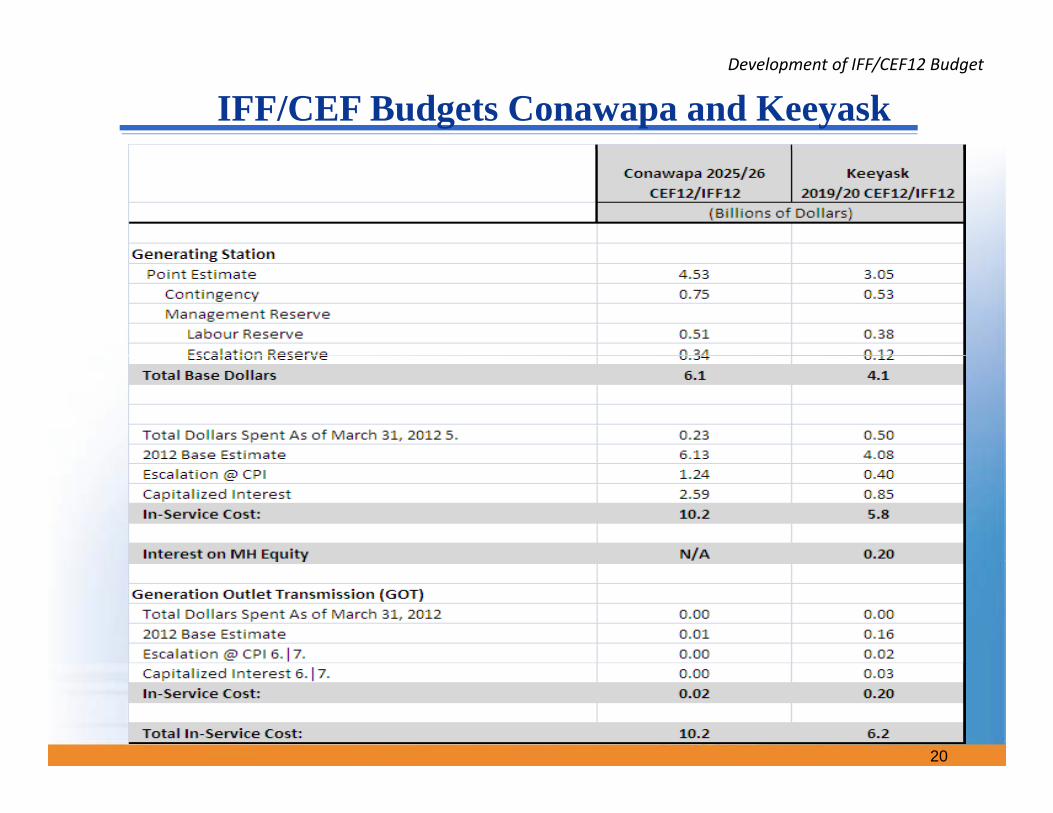
IFF/CEF Budgets Conawapa and KeeyaskDevelopment of IFF/CEF12 Budget
20
Key Lessons Learned from Wuskwatim
Project Execution/Lessons Learned
• Early Start for Infrastructure
Key Lessons Learned from Wuskwatim
• Engineering– Early Completion, earlier constructability inputs
• Human Resources– Attract & Retain Project Staff and Craft Labour
• Appropriate Project Delivery Strategy
• Project Management Practices
21

Project Execution/Lessons Learned
Project Execution
• Sound Project Delivery Strategy
• Comprehensive Project ScheduleComprehensive Project Schedule
• Project Team– World class consultants
– Top tier suppliers
• Mitigation strategy for labourg gy• Premier Camp
• Early General Civil Contractor Involvement
• Investigate Modifying work Schedule• Investigate Modifying work Schedule
• Changes to BNA
• Incorporate Wuskwatim Lessons Learnedp
22

Capital Costs for NFAT Analysis
Application to NFAT
Capital Costs for NFAT Analysis
What’s not specifically included in the Capital Cost Estimate?
‐ Change to:‐ Change to:‐ In‐service date
‐ Major change to scope
‐ Changes to escalation /interestg /
‐ Uncertainties with these items are addressed in the NFAT analysis
23

Capital Costs for NFAT Analysis
Application to NFAT
Capital Costs for NFAT Analysis
• To consider the full range of risks, three cases have been defined for the NFAT economic and financial analysis which are low, reference and high– Low value represents a low extreme that has a reasonable likelihood of occurrence– Reference represents the “most likely”– High value represents a high extreme that has a reasonable likelihood of
occurrence
• These apply to all inputs (key variables) in the NFAT analysis
Adj t t t th K k d C C it l C t t d i th• Adjustments to the Keeyask and Conawapa Capital Costs to derive the low, reference and high cases were to the amounts of:– Contingency– Escalation– Labour reserve– Interest
24
Capital Costs for NFAT Analysis
Application to NFAT
Capital Costs for NFAT Analysis
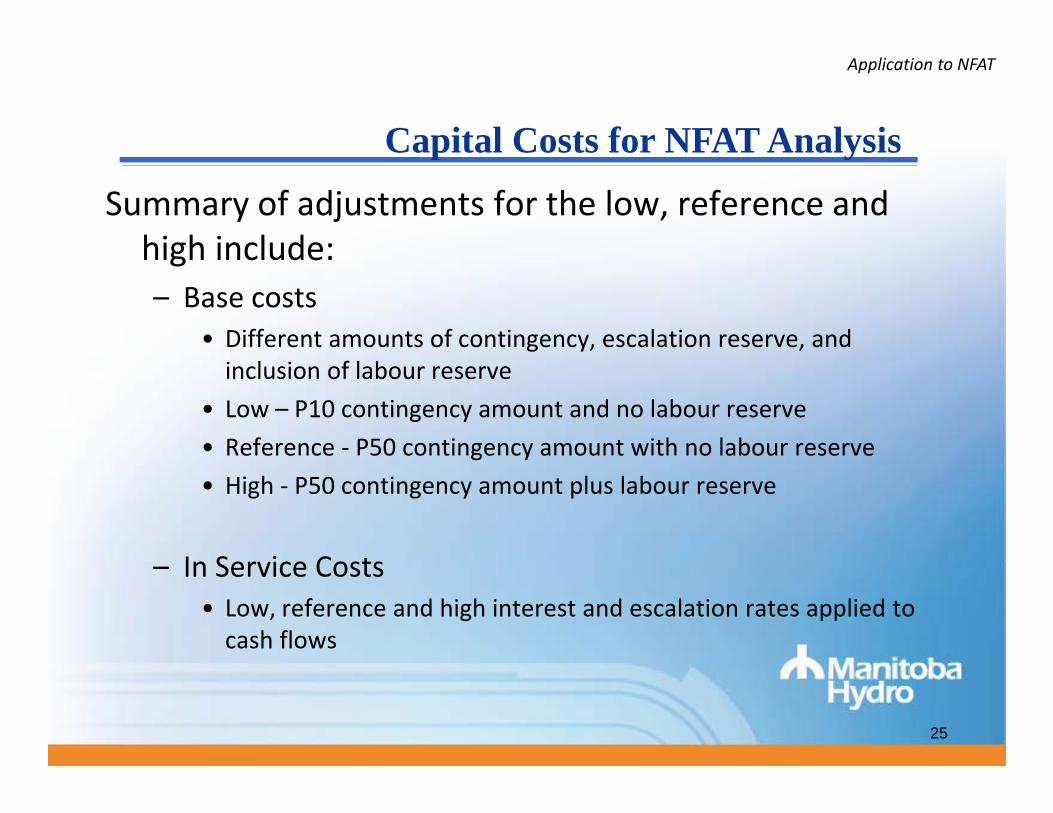
Summary of adjustments for the low, reference and high include:high include:– Base costs
• Different amounts of contingency, escalation reserve, and inclusion of labour reserve
• Low – P10 contingency amount and no labour reserve
• Reference ‐ P50 contingency amount with no labour reserveg y
• High ‐ P50 contingency amount plus labour reserve
I S i C t– In Service Costs• Low, reference and high interest and escalation rates applied to cash flows
25
Summary of Keeyask Capital Costs
Application to NFAT
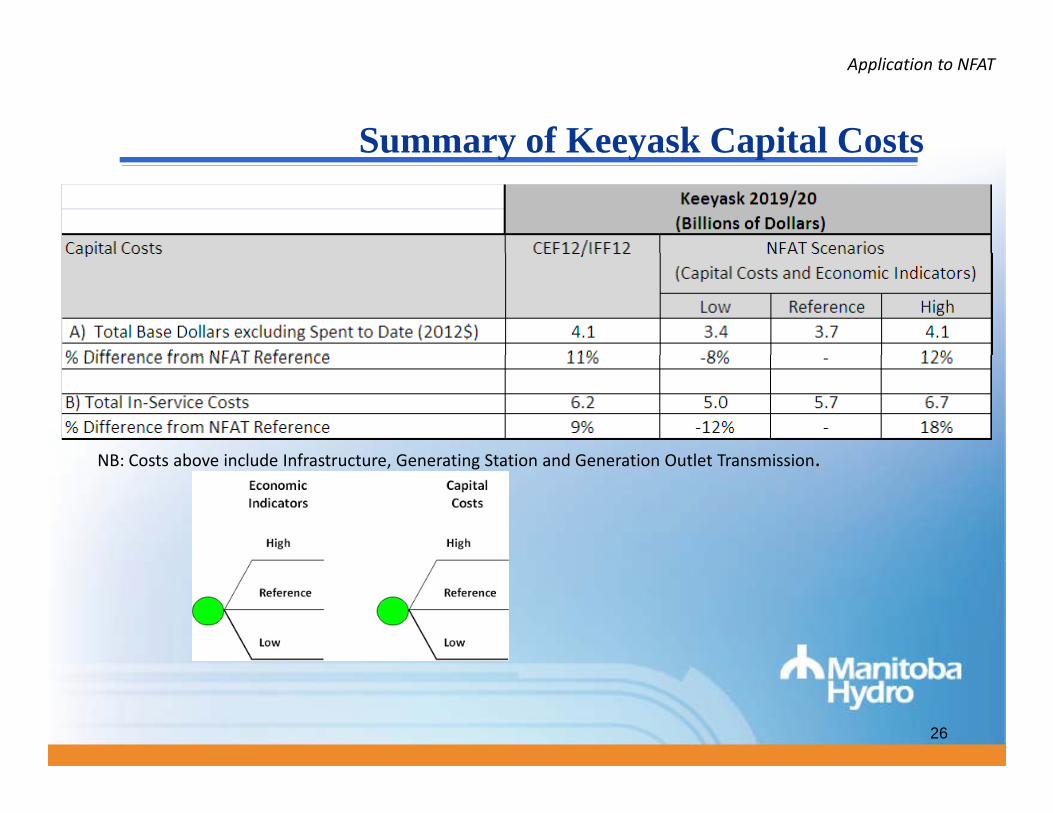
Summary of Keeyask Capital Costs
NB: Costs above include Infrastructure Generating Station and Generation Outlet TransmissionNB: Costs above include Infrastructure, Generating Station and Generation Outlet Transmission.
26

AACE Estimate Classification System HydroPower
Application to NFAT
Primary Characteristics
Secondary Characteristics
Estimate Class Maturity Level of Protection Definition
End UseageTypical purpose of
estimate
MethodologyTypical estimating
method
Expected Accuracy Range Typical variation in
Deliverables Expressed as % of complete definition
low and high ranges*
Class 5 0% ‐ 2% Concept Screening Capacity factored, parametric models, judgment,
L: ‐20% to ‐50%H: +30% to +100%
, j g ,or analogy
Class 4 1% to 15% Study or feasibility Equipment factored or parametric models
L: ‐15% to ‐30%H: +20% to +50%
Class 3 10% to 40% Budget authorization or
Semi‐detailed unit costs with
L: ‐10% to ‐20%H +10% to +30%authorization or
control costs with assembly level line items
H: +10% to +30%
Class 2 30% to 75% Control or bid/tender
Detailed unit cost with forced detailed take‐off
L: ‐5% to ‐15%H: +5% to +20%
Class 1 65% to 100% Check estimate or bid/tender
Detailed unit cost with forced detailed take‐off
L: ‐3% to ‐10%H: +3% to 15%
27

Summary of Conawapa Capital Costs
Application to NFAT
Summary of Conawapa Capital Costs
NB: Costs above include Infrastructure, Generating Station and Generation Outlet Transmission.NB: Costs above include Infrastructure, Generating Station and Generation Outlet Transmission.
28

Thank youThank you
29