box and whisker, cumulative frequency, standard deviation
TRANSCRIPT

Copyright©AndrewChambers(2021).Allrightsreserved.
Boxandwhisker,Cumulativefrequency,Standarddeviation
Name……………………………
(1) Thescoresthatstudentsgetonatestoutof15arerecordedinaboxandwhiskerplotshownbelow:
(a) Findtheinterquartilerange(b) Whatpercentageofstudentsgotlessthan8marks?(c) Ascoregreaterthankwouldbeclassifiedasanoutlier.Findk.Explainwhytherecan
benooutliersforthisdata.(2) Thenumberofcupsofcoffeestudentsdrinkeachweekisrecordedbelow:
0,0,1,1,1,2,2,2,2,3,3,4,5,8,12,15
(a) Findthemedian,lowerquartile,upperquartileandinterquartilerange.(b) Findthestandarddeviation.(c) Findanyoutliersforthisdata.(d) Drawtheboxandwhiskerplotofthisdata:

Copyright©AndrewChambers(2021).Allrightsreserved.
(3) Asurveyofteachers’sleepobtainedthefollowingresults:
Hours sleep 0 ≤ ℎ < 5 5 ≤ ℎ < 7 7 ≤ ℎ < 9 9 ≤ ℎ < 11 Frequency 2 9 12 2
(a) Findanestimationforthemean.(b) Drawacumulativefrequencycurveonthegraphbelow.
(c) Findthemedianandinterquartilerangefromyourcurve.(ii) Approximatelywhatpercentageofteachersgotmorethan8hourssleep?(d) Iftheteacherwiththeleasthourssleephad4hourssleeptherangewas6hours,
sketchaboxandwhiskerplotbeneathyourcumulativefrequencycurve.
Copyright©AndrewChambers(2021).Allrightsreserved.
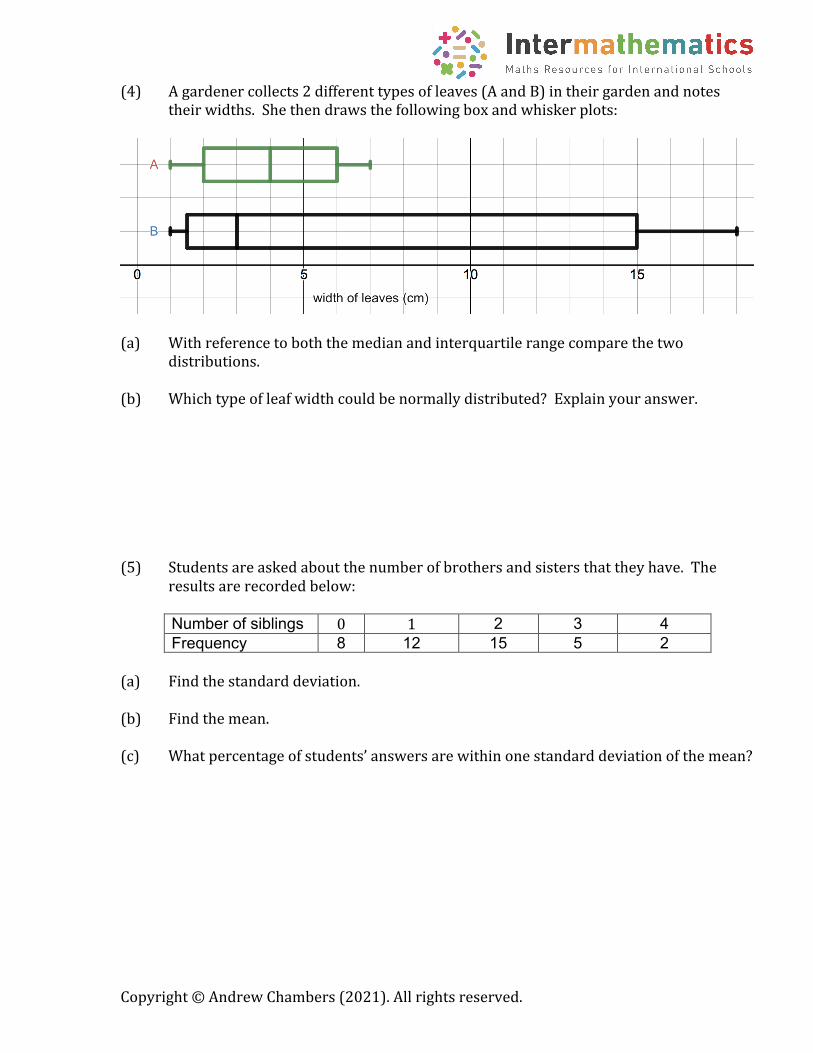
(4) Agardenercollects2differenttypesofleaves(AandB)intheirgardenandnotestheirwidths.Shethendrawsthefollowingboxandwhiskerplots:
(a) Withreferencetoboththemedianandinterquartilerangecomparethetwodistributions.
(b) Whichtypeofleafwidthcouldbenormallydistributed?Explainyouranswer.(5) Studentsareaskedaboutthenumberofbrothersandsistersthattheyhave.The
resultsarerecordedbelow:
Number of siblings 0 1 2 3 4 Frequency 8 12 15 5 2
(a) Findthestandarddeviation.(b) Findthemean.(c) Whatpercentageofstudents’answersarewithinonestandarddeviationofthemean?
Copyright©AndrewChambers(2021).Allrightsreserved.
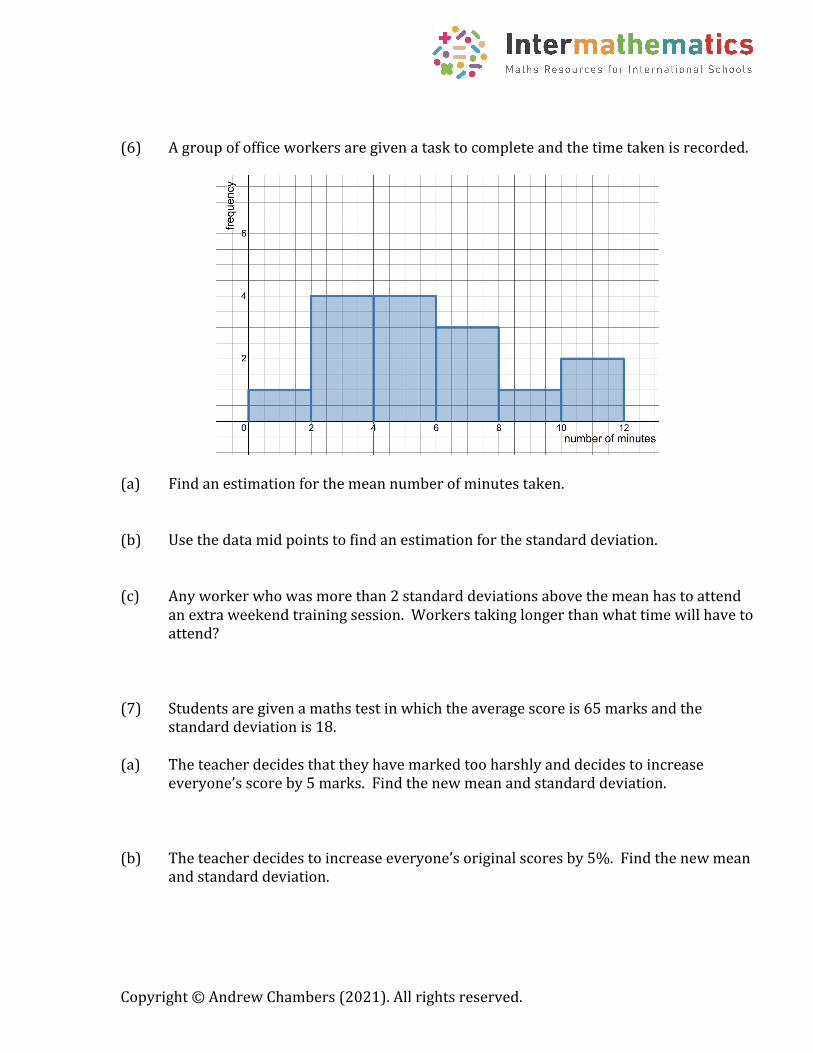
(6) Agroupofofficeworkersaregivenatasktocompleteandthetimetakenisrecorded.
(a) Findanestimationforthemeannumberofminutestaken.(b) Usethedatamidpointstofindanestimationforthestandarddeviation.(c) Anyworkerwhowasmorethan2standarddeviationsabovethemeanhastoattend
anextraweekendtrainingsession.Workerstakinglongerthanwhattimewillhavetoattend?
(7) Studentsaregivenamathstestinwhichtheaveragescoreis65marksandthe
standarddeviationis18.(a) Theteacherdecidesthattheyhavemarkedtooharshlyanddecidestoincrease
everyone’sscoreby5marks.Findthenewmeanandstandarddeviation.(b) Theteacherdecidestoincreaseeveryone’soriginalscoresby5%.Findthenewmean
andstandarddeviation.