boykin.jen12047
DESCRIPTION
Bactrocera EvolutionTRANSCRIPT

Seediscussions,stats,andauthorprofilesforthispublicationat:http://www.researchgate.net/publication/237075725
Multi-genephylogeneticanalysisofsouth-eastAsianpestmembersoftheBactroceradorsalisspeciescomplex(Diptera:Tephritidae)doesnotsupportcurrenttaxonomy
ARTICLEinJOURNALOFAPPLIEDENTOMOLOGY·MARCH2013
ImpactFactor:1.65·DOI:10.1111/jen.12047
CITATIONS
11
READS
207
10AUTHORS,INCLUDING:
LauraMBoykin
UniversityofWesternAustralia
38PUBLICATIONS1,363CITATIONS
SEEPROFILE
MatthewN.Krosch
QueenslandUniversityofTechnology
22PUBLICATIONS199CITATIONS
SEEPROFILE
AnastasijaChomic
LincolnUniversityNewZealand
6PUBLICATIONS73CITATIONS
SEEPROFILE
Allin-textreferencesunderlinedinbluearelinkedtopublicationsonResearchGate,
lettingyouaccessandreadthemimmediately.
Availablefrom:LauraMBoykin
Retrievedon:26November2015

ORIGINAL CONTRIBUTION
Multi-gene phylogenetic analysis of south-east Asian pestmembers of the Bactrocera dorsalis species complex (Diptera:Tephritidae) does not support current taxonomyL. M. Boykin1,2, M. K. Schutze1,3, M. N. Krosch1,3, A. Chomi�c1,2, T. A. Chapman1,4, A. Englezou1,4,K. F. Armstrong1,2, A. R. Clarke1,3, D. Hailstones1,4 & S. L. Cameron1,3
1 CRC for National Plant Biosecurity, Bruce, ACT, Australia
2 Bio-Protection Research Centre, Lincoln University, Lincoln, Christchurch, New Zealand
3 School of Earth, Environmental and Biological Sciences, Queensland University of Technology, Brisbane, Qld, Australia
4 NSW Department of Primary Industries, Elizabeth Macarthur Agricultural Institute, Menangle, NSW, Australia
Keywords
biosecurity, fruit fly, multi-gene phylogeny,
species delimitation
Correspondence
Laura M. Boykin (corresponding author), Plant
Energy Biology, ARC Centre of Excellence, The
University of Western Australia, M316
Crawley, WA 6009, Australia.
E-mail: [email protected]
Received: November 12, 2012; accepted:
February 18, 2013.
doi: 10.1111/jen.12047
Abstract
Bactrocera dorsalis sensu stricto, B. papayae, B. philippinensis and B. carambo-
lae are serious pest fruit fly species of the B. dorsalis complex that predomi-
nantly occur in south-east Asia and the Pacific. Identifying molecular
diagnostics has proven problematic for these four taxa, a situation that
cofounds biosecurity and quarantine efforts and which may be the result
of at least some of these taxa representing the same biological species. We
therefore conducted a phylogenetic study of these four species (and clo-
sely related outgroup taxa) based on the individuals collected from a wide
geographic range; sequencing six loci (cox1, nad4-3′, CAD, period, ITS1,ITS2) for approximately 20 individuals from each of 16 sample sites. Data
were analysed within maximum likelihood and Bayesian phylogenetic
frameworks for individual loci and concatenated data sets for which we
applied multiple monophyly and species delimitation tests. Species mono-
phyly was measured by clade support, posterior probability or bootstrap
resampling for Bayesian and likelihood analyses respectively, Rosenberg’s
reciprocal monophyly measure, P(AB), Rodrigo’s (P(RD)) and the genea-
logical sorting index, gsi. We specifically tested whether there was phylo-
genetic support for the four ‘ingroup’ pest species using a data set of
multiple individuals sampled from a number of populations. Based on our
combined data set, Bactrocera carambolae emerges as a distinct monophy-
letic clade, whereas B. dorsalis s.s., B. papayae and B. philippinensis are
unresolved. These data add to the growing body of evidence that B. dor-
salis s.s., B. papayae and B. philippinensis are the same biological species,
which poses consequences for quarantine, trade and pest management.
Introduction
The Tephritidae (true fruit flies) is one of the most
species-rich families within the order Diptera. While
non-fruit feeding tephritids are rarely pestiferous
(Headrick and Goeden 1998), the frugivorous tephrit-
ids contain many genera of major economic impor-
tance, including Ceratitis, Rhagoletis and Anastrepha
(White and Elson-Harris 1992). Mature female
frugivorous tephritids oviposit into fleshy fruits and
vegetables, where resultant larvae emerge and feed
on the fruit pulp. Production losses and costs of field
control are the direct impacts of fruit fly attack, while
indirect losses result from the implementation of reg-
ulatory controls and lost market opportunities (Clarke
et al. 2011). Bactrocera Macquart contains over 500
described species and is the dominant genus of fruit
flies in the Asia/Pacific region (Drew 1989, 2004).
© 2013 Blackwell Verlag, GmbH 1
J. Appl. Entomol.

Within this genus, the Bactrocera dorsalis species com-
plex contains 75 species and includes some of the
most pestiferous species of the genus, especially the
Oriental fruit fly, B. dorsalis s.s. (Hendel), and the
Asian papaya fruit fly, B. papayae Drew and Hancock
(1994); Clarke et al. 2005). The B. dorsalis complex is
a monophyletic group of species of relatively recent
evolutionary origin, with an estimated age of 6.2 mil-
lion years to their most recent common ancestor
(Krosch et al. 2012a).
Bactrocera dorsalis s.s., B. papayae, B. philippinensis
Drew & Hancock and B. carambolae Drew &
Hancock are found predominately in south-east
Asia and the Pacific, and are the members of the
B. dorsalis complex which are of most concern to
pest managers and plant biosecurity officials in the
region. These four species form a true sibling spe-
cies complex for which both morphological and
molecular diagnostics have proven problematic
(Clarke et al. 2005). The initial taxonomic work
that separated these taxa relied on very subtle char-
acter state differences (Drew and Hancock 1994),
but many of these character states have since been
shown to be variable and continuous between the
taxa (Krosch et al. 2012b; Schutze et al. 2012a). All
four species are polyphagous pests (Allwood et al.
1999; Clarke et al. 2001) that have invaded regions
beyond their natural ranges (Smith 2000; Cantrell
et al. 2001; Duyck et al. 2004), hence accurate
diagnosis for quarantine and field management is
critical.
Diagnostic development for these species has been
confounded by their close genetic, morphological,
behavioural and physiological similarities (Clarke
et al. 2005; Schutze et al. 2012b). While some
researchers have identified morphological and molec-
ular markers considered to be diagnostic of different
species (Drew and Hancock 1994; Iwahashi 1999;
Muraji and Nakahara 2002; Naeole and Haymer 2003;
Drew et al. 2008), others have found no such mark-
ers, or markers which separate some but not all of the
four species (Medina et al. 1998; Tan 2000, 2003;
Wee and Tan 2000a,b, 2005). Consequently, the
debate continues as to whether these four taxa repre-
sent good biological species for which species-specific
diagnostic markers exist but which are yet to be iden-
tified and universally agreed upon; or whether they
may in fact represent a group where one biological
species has been incorrectly taxonomically split, in
which case species-level diagnostic markers simply do
not exist and any observed variation reflects popula-
tion level differences (Harrison 1998; Sites and
Marshall 2004).
Attempts to identify DNA markers for these four
species of the B. dorsalis complex have met with
mixed success. An early study of the 18S rDNA, Cu/
Zn superoxide dismutase enzyme and 12S rDNA cod-
ing genes found these loci could not differentiate
B. dorsalis s.s., B. carambolae and B. papayae (White,
1996). Similarly, while within the larger B. dorsalis
complex, the species B. occipitalis (Bezzi) and B. kandi-
ensis Drew & Hancock could be resolved as separate
species using the 16S gene, B. dorsalis s.s., B. papayae,
B. carambolae and B. philippinensis could not be sepa-
rated (Muraji and Nakahara 2002). In contrast, the
nDNA regions 18S + ITS1, and ITS1 and ITS2 were
found to reliably distinguish B. carambolae from
B. dorsalis s.s. (Armstrong et al. 1997; Armstrong and
Cameron 2000). A series of papers by Nakahara and
colleagues (Nakahara et al. 2000, 2001, 2002; Muraji
and Nakahara 2002) targeting the mitochondrial DNA
D-loop + 12S and 16S suggested the four species
could be distinguished from each other, although the
different target sites did not distinguish all species
equally (e.g. B. papayae and B. carambolae were poorly
or not separated using 16S). Other tightly focused
procedures, for example, a microarray test developed
from EPIC (exon primed intron crossing)-RFLP of
muscle actin can distinguish B. dorsalis s.s., B. papayae
and B. carambolae (Naeole and Haymer 2003).
One common feature – and weakness – for nearly
all of the above studies is a failure to separate what
may be variation at the intra- vs. inter-specific level.
Taxa are often represented by very small sample sizes,
sometimes as few as one individual, rarely more than
five or six (e.g. Muraji and Nakahara 2002); or in
cases where sample sizes are greater they are gener-
ally drawn from only one geographic population (e.g.
Nakahara et al. 2001). As a result, it remains impossi-
ble to determine whether such diagnostic markers are
resolving species or population level differences, as
already recognized: for example, ‘In order to confirm
the genetic interrelationship among the B. dorsalis
complex species, analyses of field populations using
many other genetic markers are needed’ (Muraji and
Nakahara 2002). We specifically address this issue in
this study.
As part of a larger project investigating the species
limits of the target taxa within the B. dorsalis species
complex (i.e. B. dorsalis s.s., B. papayae, B. philippinen-
sis and B. carambolae = ingroup taxa) (Krosch et al.
2012b; Schutze et al. 2012a,b), we undertook new
field collections of specimens from multiple sites
across the geographic ranges of the four taxa. We also
included outgroup taxa from within the complex
[B. cacuminata (Hering), B. opiliae (Drew & Hardy),
© 2013 Blackwell Verlag, GmbH2
Phylogeny of B. dorsalis pest flies L. M. Boykin et al.

B. occipitalis (Bezzi)] and outside the complex [B. mu-
sae (Tryon), B. tryoni (Froggatt)]. We sequenced six
loci (cox1, nad4-3′, CAD, period, ITS1, ITS2) for approx-imately 20 individuals from each of 16 sample sites,
including two or more sites for each of the ingroup
taxa. Data were analysed within maximum likelihood
and Bayesian phylogenetic frameworks for both the
individual loci and concatenated data sets for which
we applied multiple monophyly and species delimita-
tion tests. Using this data set of multiple individuals
sampled from a number of populations, we specifi-
cally tested whether there was phylogenetic support
for the four described pest species: B. dorsalis s.s.,
B. papayae, B. philippinensis and B. carambolae.
Materials and Methods
Target species and outgroup selection
The aim of this study was to use phylogenetic meth-
ods to resolve species limits among the following four
target species of the B. dorsalis species complex: B. dor-
salis s.s., B. papayae, B. philippinensis and B. carambolae
(Sites and Marshall 2004). For the purposes of this
study, we refer to these four taxa as the ‘ingroup spe-
cies’. We also selected a number of species to repre-
sent ‘outgroups’, which were chosen because: (i) they
are related to varying degrees to the ingroup species
(they are either in the B. dorsalis species complex or
otherwise closely related) but are unambiguously
regarded as different species and (ii) they are taxa that
are morphologically similar and may be confused with
the target species for quarantine purposes (and hence
further resolving their molecular relationships with
the ingroup taxa is of wider benefit). The outgroup
species consisted of three B. dorsalis complex flies: two
Australian species B. cacuminata and B. opiliae, and the
Philippine species B. occipitalis (which occurs sympat-
rically with B. philippinensis); and B. musae which,
while not belonging to the B. dorsalis complex per se, is
closely related to the complex as demonstrated by pre-
vious molecular studies (Armstrong and Cameron
2000; Krosch et al. 2012a). Finally, we included
B. tryoni as an outgroup species for tree rooting, as
while it is of the same genus it unambiguously
belongs to a different species complex, the B. tryoni
species complex (Krosch et al. 2012b).
Study sites and specimen collection
To obtain as many representative samples from across
as broad a geographic area as possible, we collected
in-group species from multiple locations across their
known distributions. As discrimination amongst in-
group species is difficult due to high morphological
similarity, we made collections of in-group species
from locations where each is regarded as allopatric to
the other three based on the descriptions provided in
Drew and Hancock (1994). For collection sites where
more than one of the in-group taxa occur sympatri-
cally (primarily B. papayae and B. carambolae), we
identified species based on published descriptions
(Drew and Hancock 1994) and host use data (Clarke
et al. 2001).
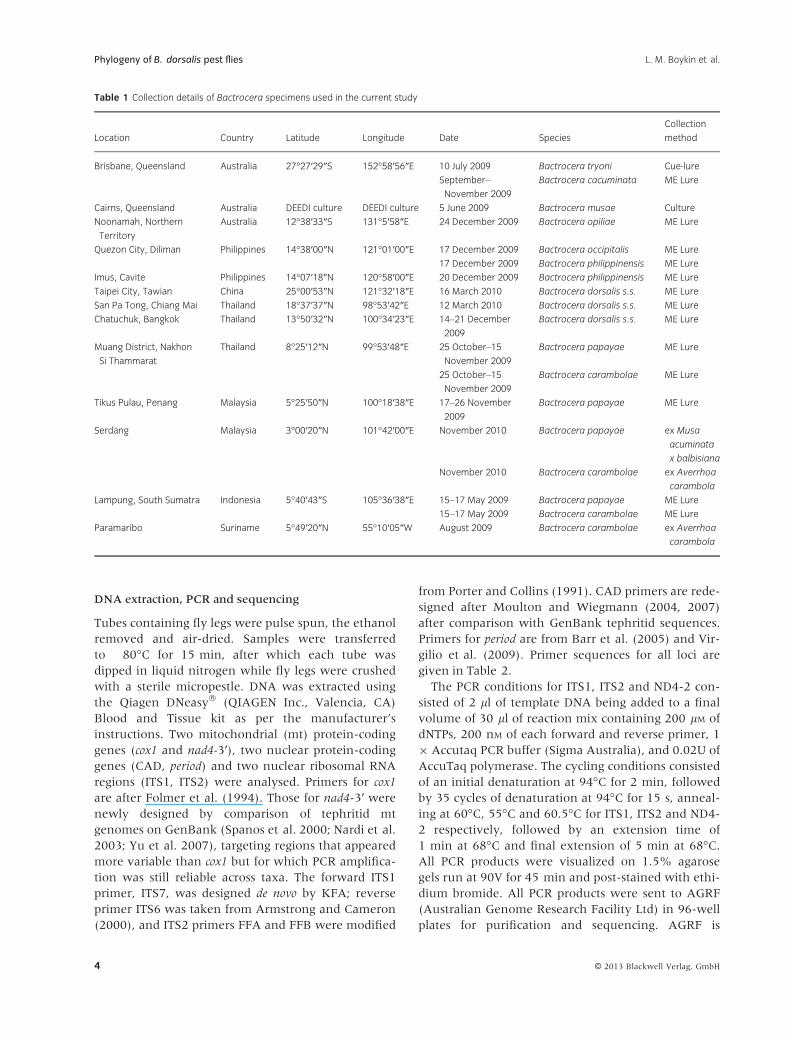
Samples of male flies were collected from 2009 to
2010 from 13 locations across seven countries
(Table 1). The principle method of collection con-
sisted of luring male flies into methyl eugenol (ME)
insecticide-baited hanging traps containing propylene
glycol as a preserving agent (Vink et al. 2005; Thomas
2008). These traps were either distributed as part of
‘collection parcels’ to collaborators throughout south-
east Asia who placed the traps in the field, or deployed
during collection trips undertaken by MKS in Decem-
ber 2010.
Exceptions to above collection methods are as fol-
lows. Bactrocera tryoni were collected using the same
technique as above, but using Cue-lure instead of
ME as the male attractant. Bactrocera musae were
sourced from a culture maintained by the Queens-
land Government Department of Agriculture, Fisher-
ies and Forestry (DAFF) in Cairns, Queensland
(Australia). Flies from Serdang (Malaysia) were
reared from Musa acuminata x balbisiana hybrids, vars.
Mas, Berangan and Lemak bananas (which yielded
B. papayae) and Averrhoa carambola fruit (which
yielded B. carambolae) collected from the field in
November 2010. Samples from Lampung (Indonesia)
were collected into dry ME lure traps placed in the
field, and flies were promptly preserved in 70% etha-
nol. Bactrocera carambolae from Paramaribo (Suri-
name) were reared from A. carambola fruit placed in
the field.
All samples were returned to the Queensland Uni-
versity of Technology (QUT), Brisbane (Australia), for
transfer into absolute ethanol, preliminary morpho-
logical identification and preparation for DNA extrac-
tion. Three legs of each fly (fore, mid and hind) were
removed and stored in absolute ethanol in new
Eppendorf � tubes for shipment to the Elizabeth Mac-
Arthur Agricultural Institute (New South Wales
Department of Primary Industries) for genomic DNA
extraction. When numbers allowed, 30 samples per
collection site were sent for extraction (Table 1). The
remainder of all flies are stored as vouchers in abso-
lute ethanol at QUT.
© 2013 Blackwell Verlag, GmbH 3
L. M. Boykin et al. Phylogeny of B. dorsalis pest flies
DNA extraction, PCR and sequencing
Tubes containing fly legs were pulse spun, the ethanol
removed and air-dried. Samples were transferred
to �80°C for 15 min, after which each tube was
dipped in liquid nitrogen while fly legs were crushed
with a sterile micropestle. DNA was extracted using
the Qiagen DNeasy� (QIAGEN Inc., Valencia, CA)
Blood and Tissue kit as per the manufacturer’s
instructions. Two mitochondrial (mt) protein-coding
genes (cox1 and nad4-3′), two nuclear protein-coding
genes (CAD, period) and two nuclear ribosomal RNA
regions (ITS1, ITS2) were analysed. Primers for cox1
are after Folmer et al. (1994). Those for nad4-3′ were
newly designed by comparison of tephritid mt
genomes on GenBank (Spanos et al. 2000; Nardi et al.
2003; Yu et al. 2007), targeting regions that appeared
more variable than cox1 but for which PCR amplifica-
tion was still reliable across taxa. The forward ITS1
primer, ITS7, was designed de novo by KFA; reverse
primer ITS6 was taken from Armstrong and Cameron
(2000), and ITS2 primers FFA and FFB were modified
from Porter and Collins (1991). CAD primers are rede-
signed after Moulton and Wiegmann (2004, 2007)
after comparison with GenBank tephritid sequences.
Primers for period are from Barr et al. (2005) and Vir-
gilio et al. (2009). Primer sequences for all loci are
given in Table 2.
The PCR conditions for ITS1, ITS2 and ND4-2 con-
sisted of 2 ll of template DNA being added to a final
volume of 30 ll of reaction mix containing 200 lM of
dNTPs, 200 nM of each forward and reverse primer, 1
9 Accutaq PCR buffer (Sigma Australia), and 0.02U of
AccuTaq polymerase. The cycling conditions consisted
of an initial denaturation at 94°C for 2 min, followed
by 35 cycles of denaturation at 94°C for 15 s, anneal-
ing at 60°C, 55°C and 60.5°C for ITS1, ITS2 and ND4-
2 respectively, followed by an extension time of
1 min at 68°C and final extension of 5 min at 68°C.All PCR products were visualized on 1.5% agarose
gels run at 90V for 45 min and post-stained with ethi-
dium bromide. All PCR products were sent to AGRF
(Australian Genome Research Facility Ltd) in 96-well
plates for purification and sequencing. AGRF is
Table 1 Collection details of Bactrocera specimens used in the current study
Location Country Latitude Longitude Date Species
Collection
method
Brisbane, Queensland Australia 27°27′29″S 152°58′56″E 10 July 2009 Bactrocera tryoni Cue-lure
September–
November 2009
Bactrocera cacuminata ME Lure
Cairns, Queensland Australia DEEDI culture DEEDI culture 5 June 2009 Bactrocera musae Culture
Noonamah, Northern
Territory
Australia 12°38′33″S 131°5′58″E 24 December 2009 Bactrocera opiliae ME Lure
Quezon City, Diliman Philippines 14°38′00″N 121°01′00″E 17 December 2009 Bactrocera occipitalis ME Lure
17 December 2009 Bactrocera philippinensis ME Lure
Imus, Cavite Philippines 14°07′18″N 120°58′00″E 20 December 2009 Bactrocera philippinensis ME Lure
Taipei City, Tawian China 25°00′53″N 121°32′18″E 16 March 2010 Bactrocera dorsalis s.s. ME Lure
San Pa Tong, Chiang Mai Thailand 18°37′37″N 98°53′42″E 12 March 2010 Bactrocera dorsalis s.s. ME Lure
Chatuchuk, Bangkok Thailand 13°50′32″N 100°34′23″E 14–21 December
2009
Bactrocera dorsalis s.s. ME Lure
Muang District, Nakhon
Si Thammarat
Thailand 8°25′12″N 99°53′48″E 25 October–15
November 2009
Bactrocera papayae ME Lure
25 October–15
November 2009
Bactrocera carambolae ME Lure
Tikus Pulau, Penang Malaysia 5°25′50″N 100°18′38″E 17–26 November
2009
Bactrocera papayae ME Lure
Serdang Malaysia 3°00′20″N 101°42′00″E November 2010 Bactrocera papayae ex Musa
acuminata
x balbisiana
November 2010 Bactrocera carambolae ex Averrhoa
carambola
Lampung, South Sumatra Indonesia 5°40′43″S 105°36′38″E 15–17 May 2009 Bactrocera papayae ME Lure
15–17 May 2009 Bactrocera carambolae ME Lure
Paramaribo Suriname 5°49′20″N 55°10′05″W August 2009 Bactrocera carambolae ex Averrhoa
carambola
© 2013 Blackwell Verlag, GmbH4
Phylogeny of B. dorsalis pest flies L. M. Boykin et al.

accredited by NATA to the ISO/IEC17025:2005 Qual-
ity Standard. Australian Genome Research Facility Ltd
operates the AB3730xl 96-capillary sequencer for low
to high throughput DNA sequencing.
Polymerase chain reaction conditions for cox1, CAD
and period consisted of 1 ll DNA template in a final
volume of 20 ll containing 100 nM each forward and
reverse primer 10 ll Go Taq Green enzyme master
mix (ProMega, Sydney, Australia) and 7 ll of steril-ized water. PCR cycling conditions consisted of an ini-
tial denaturation step at 94°C for 2 min, followed by
40 cycles of denaturation at 95°C for 30 s, annealing
at 50°C (for cox1 and period) or 54°C (for CAD) for
30 s. and extension at 72°C for 1 min.; there was a
final run-out extension step at 72°C for 7 min. All
PCR products were visualized on 1% agarose gels con-
taining 10X dilution of SYBER Safe (Life Technolo-
gies, Victoria, Australia) and run at 80V for 30 min.
Sequencing was performed using ABI BigDye� ver. 3
dye terminator chemistry and run on an ABI 3130xl
capillary sequencer. Chromatograms were checked
and sequence contigs assembled with SEQUENCHER ver
4.2 (Gene Codes Corporation 2004) to produce com-
pleted sequences.
Analytical strategy
The following series of five data sets were analysed to
test the phylogenetic signal of different loci and to
account for the failure to sequence all loci for all spec-
imens:
Datasets #1.1–1.4 Each linked inheritance groups as
a separate alignment; 1.1: mitochondrial genes
(cox1 + nad4-3′), 1.2: ribosomal RNA genes (ITS1
+ ITS2), 1.3: CAD; 1.4: period. The two mitochondrial
and two ribosomal loci are concatenated as they are
coinherited. For the ITS data sets, indels were treated
as missing. For ease of comparison, these data sets are
limited to specimens for which all six loci have been
successfully sequenced (235 specimens, 1219, 1002,
528 and 686 bp respectively).
Dataset #2 A concatenated data set including only
specimens for which all six loci were successfully
sequenced (235 specimens, 3435 bp alignment).
Dataset #3 Dataset #2 with heterozygous sites
removed from CAD and period alignments (235 speci-
mens, 3094 bp)
Dataset #4 Dataset #2 with CAD and period removed
from alignment altogether (235 specimens, 2221 bp)
Dataset #5 Specimens for which at least two of the
four loci (i.e. excluding CAD and period) were success-
fully sequenced (313 specimens, 2221 bp)
Dataset #1 was designed to allow testing of the varia-
tion between loci and to apply a species-tree recons-
truction approach (Edwards 2008); however, due to
the poor resolution in Datasets #1.2–1.4, the additi-
onal, concatenation-based data sets were produced
(after Gatesy et al. 1999; Gatesy and Baker 2005).
Dataset #2 includes a large number of heterozygous
sites in the CAD and period gene partitions, which may
have resulted in artefactual results. Datasets #3 and #4
are attempts to correct for this potential problem by
removing the heterozygous sites either on a site by site
basis (#3) or by removing the CAD and period gene par-
titions entirely (#4). Dataset #5 tests how significant
missing partitions were for the inferred phylogeny.
Alignment and analysis
Sequences for each locus were aligned by eye (pro-
tein-coding genes) or using ClustalX (rRNA regions)
(Thompson et al. 1997). For the ITS 1 and ITS2 data
set, indels were treated as missing due to the
constraints of Bayesian and RAxML analyses. Hetero-
Table 2 Primer sequences used in the current study
Gene Name Direction Sequence Reference
cox1 LCO1490 F GGT CAA CAA ATC ATA AAG ATA TTG G Folmer et al. (1994)
HCO2198 R TAA ACT TCA GGG TGA CCA AAA AAT CA Folmer et al. (1994)
nad4-3′ Teph_ND4F1 F TAG AGT WTG TGA AGG TGC TTT RGG Herein
Teph_ND4R1 R AGC WAC WGA WGA ATA AGC AAT TAA WGC C Herein
ITS1 ITS7 F GAA TTT CGC ATA CAT TGT AT Herein
ITS6 R AGC CGA GTG ATC CAC CGC T
ITS2 FFA F TGT GAA CTG CAGG ACA CAT
Shortened FFB R TCG CTA TTT TAA AGA AAC AT Herein
CAD CAD-Bd-F F CCG GTA AAT TTT GAA TGG TTC Moulton and Wiegmann (2004, 2007)
CAD-Bd-R R GCR GTK GCG AGC ARY TGA TG Moulton and Wiegmann (2004, 2007)
period F2508 F CAA CGA CGA AAT GGA GAA ATT C Barr et al. (2005)
R3270 R AGG TGT GAT CGA GTG GAA GG Virgilio et al. (2009)
© 2013 Blackwell Verlag, GmbH 5
L. M. Boykin et al. Phylogeny of B. dorsalis pest flies

zygous sites in the CAD and period loci, observed
clearly as two bases in the forward and reverse
sequences, were labelled according to the IUPAC
code. Models of molecular evolution for each loci, and
each codon position within each protein-coding gene,
were determined using MODELTEST ver. 3.6 (Posada
and Crandall 1998). Concatenations for multilocus
data sets were done in MACCLADE ver. 4.06 (Maddison
and Maddison 2003). For each data set, phylogenetic
trees were inferred in parallel by both Maximum
Likelihood and Bayesian analyses. Likelihood analy-
ses were conducted using RAxML ver 7.2.8 imple-
mented on the RAxML BlackBox webserver (http://
phylobench.vital-it.ch/raxml-bb/index.php) (Stamat-
akis et al. 2008). Data were analysed with a Gamma
model of rate heterogeneity, the proportion of invari-
able sites was estimated, and for concatenated, mul-
tilocus data sets, the alignment was partitioned and
branch lengths optimized on a per locus basis. Bayes-
ian analyses were conducted using MRBAYES ver 3.2
(Ronquist et al. 2012) using parallel implementation
on the BeSTGRID computer cluster (Jones et al.
2011), or using direct implementation on local desk-
top computers. Analyses were run for 10 (Datasets #1,
3, 4, 5) or 50 million generations (Dataset #2, due to a
longer time for independent runs to converge) with
sampling every 1000 generations, partitioned data sets
and parameter estimation for each partition unlinked.
Each analysis consisted of two independent runs, each
utilizing four chains, three cold and one hot. Conver-
gence between runs was monitored by finding a pla-
teau in the likelihood score (standard deviation of
split frequencies <0.0015) and the potential scale
reduction factor (PSRF) approaching one. Conver-
gence of other parameters within the runs was also
checked using TRACER v1.5.4 (Rambaut and Drum-
mond 2010), with ESS values above 200 for each run.
The first 12.5% of each run was discarded as burnin
for the estimation of consensus topology and the pos-
terior probability of each node. Bayesian & RAxML
run files are available from the authors upon request.
Phylogenetic trees generated from Datasets #2 and
#5 were used as input in the species monophyly
and delimitation analyses. Species delimitation was
addressed using the standard Kimura two-parameter
(K2P) inter-species distance and Rodrigo’s P (ran-
domly distinct) (Rodrigo et al. 2008) measure. Spe-
cies monophyly was measured by clade support,
posterior probability or bootstrap resampling for
Bayesian and likelihood analyses respectively,
Rosenberg’s reciprocal monophyly measure, P (AB)
(Rosenberg 2007) and the genealogical sorting index
(gsi) (Cummings et al. 2008). The species delimita-
tion plugin (Masters et al. 2010) for Geneious
(Drummond et al. 2010) was used to calculate
Rosenberg’s reciprocal monophyly, P (AB) (Rosen-
berg 2007) and Rodrigo’s P (RD) (Rodrigo et al.
2008) measures. The (Cummings et al. 2008) statis-
tic was calculated in R based on the estimated tree
and the assignment file that contains user specified
groups (see http://www.genealogicalsorting.org/).
Two different assignment files were generated for
the gsi for each data set: one based on previously
defined taxonomic groups and the other containing
groups within those as determined using the tip to
root approach of species delimitation (Boykin et al.
2012). Each of the assignment files was run with
the known phylogeny and an R script that specifies
the number of permutations (100 000 permutations
across four processors). All of the gsi analyses were
run using R on the BeSTGRID computer cluster
(Jones et al. 2011). To assess the significance of the
gsi P-values, the Bonferroni correction was used.
Results
Sequence data collection
The six loci (cox1, nad4-3′, ITS1, ITS2, CAD and per-
iod) were successfully amplified for the majority of
specimens examined across all species. Success/fail-
ure of sequencing individual loci for each specimen,
along with their GenBank accession numbers, are
shown in Table S1. Of these, nad4-3′ was the only
one of five additional mt genes (data not shown) tri-
alled in this study that was successfully amplified
across the range of species here. Due to the low lev-
els of molecular variation previously found within
the dorsalis complex for cox1 (Armstrong and Ball
2005), the additional mitochondrial genes trialled
were chosen in an effort to maximize variability
based on the previous analyses of dipteran mt ge-
nomes (Cameron et al. 2007; Nelson et al. 2012).
The trade-off for gene variability is primer reliability,
whereby sequence variability at the priming sites
causes mismatches and loss of efficacy. Thus, finding
only one more variable mt gene, which could be
reliably amplified, is not surprising. The nad4-3′ generegion was confirmed here to be more variable, hav-
ing 104 of 577 positions parsimony informative
compared to 101 of 642 parsimony informative for
cox1.
The ribosomal ITS loci each had significant indels
(33–84 bp in ITS1, 31–40 bp in ITS2), but there were
few heterozygous sites, consistent with the concerted
evolution previously found for these loci (e.g.
© 2013 Blackwell Verlag, GmbH6
Phylogeny of B. dorsalis pest flies L. M. Boykin et al.

Eickbush and Eickbush 2007). In contrast, both
nuclear protein-coding genes had a large proportion
of heterozygous sites; 179 of 528 bp in CAD and 162
of 686 bp in period. These sites unfortunately made up
almost all of the variable sites within these two genes,
with only 10 of the remaining 349 homozygous sites
in CAD and 15 of 524 in period being parsimony infor-
mative. Intraspecific variation for each gene is shown
in Table 3.
Phylogenetic analyses
For each data set, Bayesian (BA) and likelihood analy-
ses (ML) yielded similar topologies; however, nodal
support was much greater for the set of Bayesian anal-
yses. Of the single linkage group analyses (Datasets
#1.1–1.4), only the mitochondrial gene trees (Dataset
#1.1) were well resolved, with each species other than
B. dorsalis, B. philippinensis, B. papyae and B. carambo-
lae monophyletic with significant nodal supported
(BA pp = 0.9–1.0; ML bs >70%) (Fig. S1). For the
ribosomal ITS loci (Dataset #1.2), several species were
monophyletic, for example, B. musae, B. occipitalis,
B. opiliae, B. carambolae, whereas B. cacuminata and
B. dorsalis s.s., formed paraphyletic combs with respect
to other species (Fig. S2). For example, in the Bayes-
ian analysis of Dataset #1.2, B. cacuminata specimens
formed 17 of 19 branches in a polytomy with a mono-
phyletic B. opiliae (node support not significant in BA
or ML) and a single significantly supported clade
which included all B. dorsalis s.s., B. philippinensis,
B. papaya and B. carambolae specimens. The trees
inferred for each of the nuclear protein-coding genes
were almost totally unresolved (Figs S3–4). For CAD
(Dataset #1.3), only B. musae (BA & ML) and B. cac-
uminata (ML only) were monophyletic whereas for
period (Dataset #1.4), B. musae (BA & ML), B. cacumi-
nata (BA only) and B. opiliae (BA only) were mono-
phyletic. The majority of specimens of the remaining
species formed unresolved combs. Due to the poor
resolution across these four data sets, species-tree
reconstruction based on individual gene trees was not
attempted.
Analyses of concatenated data sets were conducted
to determine whether larger data sets would be bet-
ter resolved and display higher nodal support than
was achieved analysing each linkage group separately
(Datasets #1.1–1.4). Further, due to the high propor-
tion of heterozygous sites within CAD and period,
and the significant number of individuals for which
one or more genes failed to amplify/sequence (57
specimens, approximately 25%), a series of different
concatenation data sets were analysed to determine
whether either factor resulted in artefactual relation-
ships. The same species boundaries were inferred for
all four concatenated data sets, and the interspecies
relationships were also quite constant. The heterozy-
gous positions within CAD and period had a limited
effect on inferred species relationships, as the only
difference was in the position of a single specimen,
Bd413 an unidentifiable member of the dorsalis-
group complex. This specimen was sister to all the
dorsalis-group flies with inclusion of these gene
regions (#2-BA) or the sister-group of B. occipitalis
with their exclusion (#2-ML, #3-#5-BA & ML)
(fig. 1; Figs S5–7). Similarly, the inclusion of speci-
mens for which up to half of the loci were missing
(#5) did not result in a different topology from those
inferred from specimens where all genes were pres-
ent (#3–#4).Below the species level, there was significant vari-
ability in topology and nodal support across the dif-
ferent concatenated data sets with few clades larger
than 2–3 specimens shared between analyses. The
only notable exception is the clade containing B. cara-
mbolae specimens from Paramaribo (Suriname, South
America). This invasive population forms a strongly
supported, monophyletic clade to the exclusion of
the SE Asian specimens of B. carambolae in Datasets
#1.1, 3–5 (both BA & ML analyses). In Datasets #1.4
and 2, this clade is still recovered however several SE
Asian B. carambolae specimens were included within
it also. As Datasets #1.1, 3–5 either omit the nuclear
protein-coding genes altogether (#1.1, 4, 5) or
remove all ambiguous sites (#3), it is likely that the
monophyly of the B. carambolae specimens from Suri-
name reflects a genetic bottleneck associated with its
Table 3 The average intraspecific distances for each gene shown in %
calculated using MEGA
Species ITS1 ITS2 ND4 CO1 per CAD
Bactrocera tryoni 0.000 0.000 1.284 0.809 0.275 0.210
Bactrocera musae 0.000 0.000 0.127 0.031 0.033 0.038
Bactrocera
cacuminata
0.000 0.000 0.101 0.051 0.047 0.000
Bactrocera occipitalis 0.000 0.000 0.972 0.329 0.244 0.682
Bactrocera opiliae 0.000 0.000 0.604 0.603 0.291 0.101
Bactrocera
carambolae
0.158 0.093 0.924 0.611 0.597 2.294
Bactrocera dorsalis
(sensu stricto)
0.203 0.081 0.765 0.568 0.505 1.471
Bactrocera
philippinensis
0.216 0.094 0.602 0.641 0.413 1.259
Bactrocera papayae 0.261 0.071 0.595 0.513 0.157 2.471
Bactrocera dorsalis
(sensu lato)
0.224 0.081 0.806 0.632 0.472 1.680
© 2013 Blackwell Verlag, GmbH 7
L. M. Boykin et al. Phylogeny of B. dorsalis pest flies

establishment in South America and/or that the
source population for this invasion was not present in
this study.
The combined phylogeny thus supports the mono-
phyly of the dorsalis-group and sister-group relation-
ships between B. cacuminata and B. opiliae and
between B. dorsalis s.l. and B. carambolae. The mono-
phyly of B. musae, B. occipitalis, B. opiliae, B. cacumi-
nata and B. carambolae is each very strongly
supported (BA pp = 1.0 for each), whereas the
monophyly of the remaining B. dorsalis s.l. (B. dor-
salis/papayae/philippinensis) is slightly weaker
(pp = 0.93). Bactrocera papayae and B. philippinensis
were never monophyletic and were essentially indis-
tinguishable from B. dorsalis s.s. in the tree. Speci-
mens morphologically identified as B. papayae and
B. philippinensis occurred in, respectively, 8–17 and 2
–26 different subclades of the B. dorsalis clade/grade
depending on the combination of data set and infer-
ence method.
Species delimitation analysis and subclade groupings
The use of species delimitation analyses within our
phylogenetic framework revealed a number of statisti-
cally well-resolved groupings for (i) each of the out-
group species, (ii) B. carambolae and (iii) B. dorsalis s.l.
(B. dorsalis/papayae/philippinensis) (Tables 3–5; figs 1
and 4). Each of the six clades is statistically supported
by at least four of the five species delimitation
measures; especially in the case of ‘Dataset #5′ (forwhich all individuals are represented by at least two
loci) (fig. 4). Notably, B. carambolae resolves as a taxo-
nomically distinct clade, rating 5/5 for all analyses in
both Datasets #2 and #5, while unambiguous species
(B. occipitalis, B. cacuminata and B. opiliae) achieve 4/5
Figure 1 Dataset #2. Phylogenetic reconstruction based on sequence data for specimens for which all six loci were sequenced for Bactrocera spp.
in the current study (236 specimens, 3435 bp alignment). Bayesian posterior probabilities are listed above each branch, maximum likelihood boot-
strap values below. For clarity only supports for backbone nodes are shown; in cases where actual nodal support is absent, posterior probability sup-
port values are >0.5 except for those marked with an asterisk (>0.95). All nodes <0.5 are collapsed. Results of clade monophyly statistics are shown
as boxes (1–5 = a priori group analysis; a–g = root-to tip analysis), with only those achieving 4/5 (orange) or 5/5 (red) shown. A priori taxonomic iden-
tifications of individual specimens within the dorsalis complex ‘ingroup’ have been colour coded [i.e. B. dorsalis s.s. (purple), B. papayae (dark blue),
B. philippinensis (light blue) and B. carambolae (green)]. See supplementary files for all nodal supports and all individual specimen data.
© 2013 Blackwell Verlag, GmbH8
Phylogeny of B. dorsalis pest flies L. M. Boykin et al.

in at least one of the datasets; a result which we
believe lends greater support to the ongoing specific
status of B. carambolae.
Species delimitation statistical analyses undertaken
for Dataset #2 revealed considerable support for
each of the six a priori defined groups: B. musae (5/5
statistically significant), B. occipitalis (4/5), B. cacumi-
nata (4/5), B. opiliae (4/5), B. carambolae (5/5) and
B. dorsalis s.l. (i.e. B. dorsalis/papayae/philippinensis) (4/
5) (Table 4). Tip-to-root analysis (examining all
resolved clades) demonstrated a limited number of
subclades which were statistically significant for at
least four of the five statistics applied, with three subc-
lades resolved within B. carambolae and four in the
B. dorsalis s.l. clade (Table 5; fig. 1).
A priori groups and subclade support increased fol-
lowing analysis of Dataset #5, with all five statistical
analyses significant for four of the a priori defined
clades (B. musae, B. occipitalis, B. opiliae and B. cara-
mbolae) and 4/5 for the remaining two (B. cacuminata
and B. dorsalis s.l.). Meanwhile, tip-to-root analysis
revealed nine subclades to have 4/5 support measures
statistically significant, with three occurring in the
B. carambolae clade (one of which consisted exclu-
sively of all Suriname individuals), five occurring in
the B. dorsalis s.l. clade (including one subclade which
consisted exclusively of B. philippinensis individuals),
and one in B. musae (Table 6; fig. 4).
Discussion
This study represents the most comprehensive
phylogenetic analysis undertaken to-date for four
pestiferous and morphologically cryptic members of
the B. dorsalis species complex. The study incorpo-
rates individuals collected from a broad geographic
distribution and likely represents a range of intra-
specific populations for these species. Six indepen-
dent loci have been targeted and subsequently
examined using a range of analyses, with a clear
signal emerging: B. carambolae is a distinct mono-
phyletic clade, whereas B. dorsalis s.s., B. papayae
and B. philippinensis form a single sister clade to
B. carambolae.
Phylogenetic analyses and species delimitation
The individual gene trees in this study were unre-
solved and therefore prevented the use of the species-
tree software (e.g.,Ane et al. 2007; Liu 2008; Liu et al.
2009; Kubatko 2009; Kubatko et al. 2009; Heled and
Drummond 2010; Than and Nakhleh 2009; Than
et al. 2008; Huang et al. 2010; Knowles and Kubatko
2010). We recognize the caveats of using concate-
nated DNA sequence data to generate a species-tree
hypothesis (Degnan and Salter 2005; Kubatko and
Degnan 2007; Kubatko et al. 2011); however, as
Table 4 The hypothesized species of the Bactrocera dorsalis species complex were tested for species distinctiveness as measured by the Geneious
species delimitation plugin (Masters et al. 2010) and the genealogical sorting index (gsi) (Cummings et al.2008). The species delimitation plugin gener-
ates: average pairwise tree distance between members of the group of interest and its sister taxa (K2Pdistance), P (Randomly Distinct), Clade Support:
Bayesian posterior probability (PP), and Rosenberg’s PAB: Reciprocal monophyly and lastly, the gsi statistic and associated P-value are included. Bold
Values indicates significance, and this was determined by: >1% difference (K2P)/>0.05 [P (Randomly Distinct)]/>0.80 (PP)/>0.008 (gsi). Dataset 2 con-
tained a concatenation of all specimens for which all six loci were successfully sequenced �235 specimens, 3435 bp alignment. Dataset 5 consisted
of specimens for which at least two of the four loci (i.e. excluding CAD and period) were successfully sequenced (313 specimens, 2221 bp)
Inter dist - Closest (K2P) P (randomly distinct) Clade support Rosenberg’s P (AB) gsi P-value
Dataset 2
Clade 1: musae Bd51/67 2.263 0.05 1 1.40E-11 1 1.00E-04
Clade 2: occipitalis 739/800 1.653 0.77 1 1.40E-11 0.952 1.00E-04
Clade 3: cacuminata 231/244 0.858 0.05 1 1.40E-11 1 1.00E-04
Clade 4: opiliae 1080/1082 0.858 0.05 1 1.40E-11 1 1.00E-04
Clade 5: carambolae 1111/189 1.575 0.05 1 3.00E-42 1 1.00E-04
Clade 6: dorsalis 818/399 1.368 0.9 85 3.00E-42 1 1.00E-04
Dataset 5
Clade 1: musae Bd51/67 2.914 0.05 1 1.50E-12 0.886 1.00E-04
Clade 2: occipitalis 739/800 2.531 0.05 87 3.95E-03 0.944 1.00E-04
Clade 3: cacuminata 231/244 1.117 0.16 100 1.50E-12 1 1.00E-04
Clade 4: opiliae 1080/1082 1.117 0.05 100 1.50E-12 1 1.00E-04
Clade 5: carambolae 1111/189 1.542 0.05 100 1.50E-12 1 1.00E-04
Clade 6: dorsalis 818/399 1.542 0.39 93 1.50E-12 1 1.00E-04
© 2013 Blackwell Verlag, GmbH 9
L. M. Boykin et al. Phylogeny of B. dorsalis pest flies
there was no conflict among individual gene tree phy-
logenies, the benefit of using a single multilocus phy-
logeny to confidently delimit species was considered
appropriate (Rokas et al. 2003; Belfiore et al. 2008;
Sanderson et al. 2011).
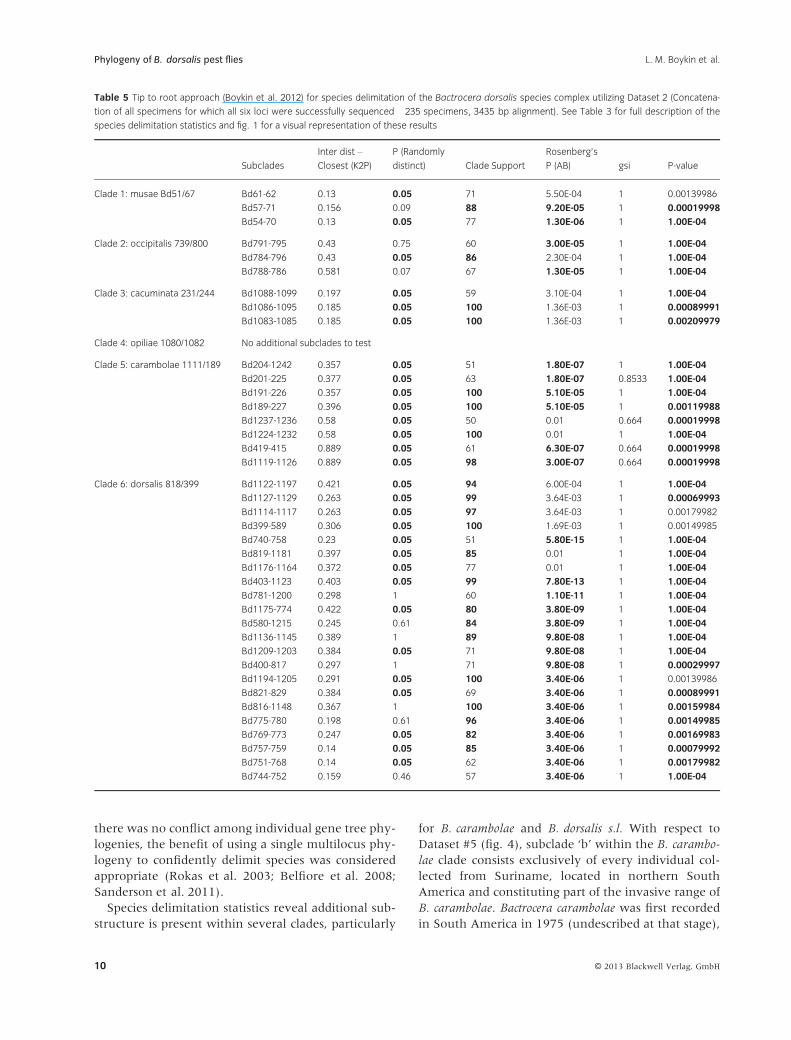
Species delimitation statistics reveal additional sub-
structure is present within several clades, particularly
for B. carambolae and B. dorsalis s.l. With respect to
Dataset #5 (fig. 4), subclade ‘b’ within the B. carambo-
lae clade consists exclusively of every individual col-
lected from Suriname, located in northern South
America and constituting part of the invasive range of
B. carambolae. Bactrocera carambolae was first recorded
in South America in 1975 (undescribed at that stage),
Table 5 Tip to root approach (Boykin et al. 2012) for species delimitation of the Bactrocera dorsalis species complex utilizing Dataset 2 (Concatena-
tion of all specimens for which all six loci were successfully sequenced �235 specimens, 3435 bp alignment). See Table 3 for full description of the
species delimitation statistics and fig. 1 for a visual representation of these results
Subclades
Inter dist –
Closest (K2P)
P (Randomly
distinct) Clade Support
Rosenberg’s
P (AB) gsi P-value
Clade 1: musae Bd51/67 Bd61-62 0.13 0.05 71 5.50E-04 1 0.00139986
Bd57-71 0.156 0.09 88 9.20E-05 1 0.00019998
Bd54-70 0.13 0.05 77 1.30E-06 1 1.00E-04
Clade 2: occipitalis 739/800 Bd791-795 0.43 0.75 60 3.00E-05 1 1.00E-04
Bd784-796 0.43 0.05 86 2.30E-04 1 1.00E-04
Bd788-786 0.581 0.07 67 1.30E-05 1 1.00E-04
Clade 3: cacuminata 231/244 Bd1088-1099 0.197 0.05 59 3.10E-04 1 1.00E-04
Bd1086-1095 0.185 0.05 100 1.36E-03 1 0.00089991
Bd1083-1085 0.185 0.05 100 1.36E-03 1 0.00209979
Clade 4: opiliae 1080/1082 No additional subclades to test
Clade 5: carambolae 1111/189 Bd204-1242 0.357 0.05 51 1.80E-07 1 1.00E-04
Bd201-225 0.377 0.05 63 1.80E-07 0.8533 1.00E-04
Bd191-226 0.357 0.05 100 5.10E-05 1 1.00E-04
Bd189-227 0.396 0.05 100 5.10E-05 1 0.00119988
Bd1237-1236 0.58 0.05 50 0.01 0.664 0.00019998
Bd1224-1232 0.58 0.05 100 0.01 1 1.00E-04
Bd419-415 0.889 0.05 61 6.30E-07 0.664 0.00019998
Bd1119-1126 0.889 0.05 98 3.00E-07 0.664 0.00019998
Clade 6: dorsalis 818/399 Bd1122-1197 0.421 0.05 94 6.00E-04 1 1.00E-04
Bd1127-1129 0.263 0.05 99 3.64E-03 1 0.00069993
Bd1114-1117 0.263 0.05 97 3.64E-03 1 0.00179982
Bd399-589 0.306 0.05 100 1.69E-03 1 0.00149985
Bd740-758 0.23 0.05 51 5.80E-15 1 1.00E-04
Bd819-1181 0.397 0.05 85 0.01 1 1.00E-04
Bd1176-1164 0.372 0.05 77 0.01 1 1.00E-04
Bd403-1123 0.403 0.05 99 7.80E-13 1 1.00E-04
Bd781-1200 0.298 1 60 1.10E-11 1 1.00E-04
Bd1175-774 0.422 0.05 80 3.80E-09 1 1.00E-04
Bd580-1215 0.245 0.61 84 3.80E-09 1 1.00E-04
Bd1136-1145 0.389 1 89 9.80E-08 1 1.00E-04
Bd1209-1203 0.384 0.05 71 9.80E-08 1 1.00E-04
Bd400-817 0.297 1 71 9.80E-08 1 0.00029997
Bd1194-1205 0.291 0.05 100 3.40E-06 1 0.00139986
Bd821-829 0.384 0.05 69 3.40E-06 1 0.00089991
Bd816-1148 0.367 1 100 3.40E-06 1 0.00159984
Bd775-780 0.198 0.61 96 3.40E-06 1 0.00149985
Bd769-773 0.247 0.05 82 3.40E-06 1 0.00169983
Bd757-759 0.14 0.05 85 3.40E-06 1 0.00079992
Bd751-768 0.14 0.05 62 3.40E-06 1 0.00179982
Bd744-752 0.159 0.46 57 3.40E-06 1 1.00E-04
© 2013 Blackwell Verlag, GmbH10
Phylogeny of B. dorsalis pest flies L. M. Boykin et al.

where it was first reared from Syzygium samarangense
(Java apple) in Suriname and thought to have been
accidentally introduced from south-east Asia (van
Sauers-Muller 1991). The emergence of a well-sup-
ported ‘Suriname subclade’ within the more diverse
south-east Asian B. carambolae clade is not unex-
pected given such a recent introduction for which a
‘genetic bottleneck’ is likely to exist. Similarly, sub-
group ‘d’ in the B. dorsalis s.l. clade consists of all
B. philippinensis individuals collected from one of two
geographically proximate locations in the Philippines
(Quezon City and Imus) (fig. 4). Philippine flies may
be expected to be genetically divergent from other
members of the B. dorsalis s.l. clade considering the
increased geographic separation between Philippine
flies relative to those from among mainland south-
east Asia and western Indonesian archipelago sites
(however, human-mediated movement may limit
this). Indeed, significant isolation-by-distance effects
for flies from the Philippines vs. flies from mainland
south-east Asia have been demonstrated (Schutze
et al. 2012a). Contrary to the Suriname B. carambolae
sub-clade, not all individuals from the Philippines
occur within this group, as six individuals fall outside
subclade ‘d’ (all from Imus; fig. 4) and are unresolved
from other B. dorsalis s.s. and B. papayae; emphasizing
the low resolution within the B. dorsalis s.l. clade as a
whole.
Four of five measures were used to identify four
sub-groupings within the B. dorsalis s.l. clade in
Dataset #2 (fig. 1; Clade 6): ‘d’, ‘e’, ‘f’ and ‘g’. For
example, clade ‘e’ consists of four individuals from
each of the three species in the larger B. dorsalis s.l.
clade, these being: B. papayae from Penang (Malay-
sia); B. philippinensis (two individuals from Imus, Phil-
ippines); and B. dorsalis s.s. from San Pa Tong
(northern Thailand). In this case, conspecific repre-
sentatives for each of these species are also repre-
Figure 2 Dataset #3. Phylogenetic reconstruction based on sequence data for specimens for which all six loci (cox1, nad4-3′, ITS1, ITS2, CAD and
per) were sequenced for Bactrocera spp. in the current study. Ambiguous sites removed from CAD and per alignments (236 specimens, 3094 bp).
Node supports and tree annotation as per fig. 1.
© 2013 Blackwell Verlag, GmbH 11
L. M. Boykin et al. Phylogeny of B. dorsalis pest flies

sented throughout the remainder of the B. dorsalis s.l.
clade. The clades identified using the tip-to-root
method provide a basis for further biological research.
In the difficult Bemisia tabaci species complex, for
example, the discovery of previously unrecognized
clades through similar analytical approaches has pro-
ven a basis for deeper taxonomic and biological
research, which is helping to elucidate this equally
difficult group (Boykin et al. 2012).
Relationships of outgroup species
Bactrocera musae and three members of the B. dorsalis
complex: B. occipitalis, B. opiliae and B. cacuminata
resolve as taxonomically distinct groups and sister to
the ingroup taxa according to all analyses (figs 1–4).Bactrocera musae, while taxonomically a member of a
different species complex (the B. musae complex), has
historically demonstrated a very close relationship to
dorsalis complex flies. An earlier phylogenetic analysis
of COI and COII genes of Bactrocera species revealed B.
musae to occur within the dorsalis complex clade: sister
to B. occipitalis, B. philippinensis, B. dorsalis s.s.,
B. papayae and B. carambolae, with B. kandiensis Drew
& Hancock (a ‘true’ dorsalis complex fly) sister to all of
these species (Nakahara and Muraji 2008; Krosch
et al. 2012a). Furthermore, restriction enzyme analy-
sis of 25 species of Bactrocera revealed B. musae to
exhibit the least degree of differentiation between it
and B. dorsalis s.s., B. papayae and B. philippinensis
(and a non-dorsalis fly, B. curvipennis (Froggatt)) as
compared to all other species (B. dorsalis s.s., B. papa-
yae and B. philippinensiswere indistinguishable) (Arm-
strong and Cameron 2000). Indeed it appears the
main distinguishing morphological character separat-
ing B. musae from B. dorsalis s.l. is the occasional
absence of the medial longitudinal band on the abdo-
men for some individuals (Drew 1989); the presence
of which is typical of dorsalis complex species (Drew
and Hancock 1994). We therefore recommend further
Figure 3 Dataset #4. Phylogenetic reconstruction based on sequence data for specimens for which four loci were sequenced (cox1, nad4-3′, ITS1
and ITS2) for Bactrocera spp. in the current study (236 specimens, 2221 bp). Node supports and tree annotation as per fig. 1.
© 2013 Blackwell Verlag, GmbH12
Phylogeny of B. dorsalis pest flies L. M. Boykin et al.

work on B. musae be undertaken towards fully resolv-
ing its association with the B. dorsalis complex.
Our results show B. occipitalis (a species occurring in
sympatry with B. philippinensis in the Philippines) is more
distantly related to the ingroup taxa relative to the Aus-
tralian species B. opiliae and B. cacuminata (figs 1–4).While B. occipitalis has been regarded a closely related
species of B. dorsalis (Muraji and Nakahara 2002; Naka-
hara andMuraji 2008; Krosch et al. 2012a), it is morpho-
logically distinct in having significantly shorter genitalia
with colour markings distinct as from B. philippinensis
(Drew and Hancock 1994; Iwahashi 1999). Bactrocera cac-
uminata and B. opiliae have rarely been directly compared
with pest species of the dorsalis complex as they are
innocuous and exist in allopatry with respect to the all
known pests from the complex; however, B. opiliae is at
least very similar to B. dorsalis s.s., having been described
in 1981 from northern Australian samples and initially
regarded as Dacus (Bactrocera) dorsalis due to high mor-
phological similarity with this species (Drew and Hardy
1981). Bactrocera opiliae and B. dorsalis s.s.were only sepa-
rable using ecological, physiological and genetic mea-
sures, for which colour variation was the only visual
difference subsequently observed between the two, with
fine-scale differences in ovipositor and egg morphology
also diagnostic (Drew and Hardy 1981). In contrast,
B. cacuminata is morphologically distinct, possessing a
characteristic black lanceolate pattern on the mesonotum
and thereby rendering it easily identifiable from pest
members of the dorsalis complex (Drew 1989). However,
as species-level diagnoses are often required for juvenile
stages (hence adult characters are absent), the genetic
resolution of these non-pest Australian species obtained
here is of practical use for quarantine and plant protec-
tion officers.
The unusual case of specimen #413
We cannot explain the unusual placement of spec-
imen #413 in any of our phylogenetic reconstruc-
Figure 4 Dataset #5. Phylogenetic reconstruction based on sequence data for specimens for which at least two of four loci (cox1, nad4-3′, ITS1 and
ITS2) were sequenced for Bactrocera spp. in the current study (315 specimens, 2221 bp). Node supports and tree annotation as per fig. 1.
© 2013 Blackwell Verlag, GmbH 13
L. M. Boykin et al. Phylogeny of B. dorsalis pest flies

tions (figs 1–4). For Datasets #2, this specimen
emerges as sister to the entire B. dorsalis s.l. clade,
and in Datasets #3, #4 and #5, it is sister to B. oc-
cipitalis. Specimen #413 was collected from Nakhon
Si Thammarat (southern Thailand) and hence
occurred where B. dorsalis s.s. and B. papayae geo-
graphically abut or overlap according to recorded
geographic distributions for these species (e.g.
Drew and Hancock 1994). Morphologically, #413
identifies as either B. dorsalis s.s. or B. papayae
based on existing keys, and examination by Prof.
R.A.I. Drew confirmed it as one of these two spe-
cies and likely to be B. papayae (pers. comm.).
However, our study included only four economi-
cally important and three additional out-group spe-
cies from the B. dorsalis complex, and the inclusion
of more members from the complex may help to
resolve the placement of specimen #413.
Table 6 Tip to root approach (Boykin et al. 2012) for species delimitation of the Bactrocera dorsalis species complex utilizing Dataset 5 consisted of
specimens for which at least two of the four loci (i.e. excluding CAD and period) were successfully sequenced (313 specimens, 2221 bp). See Table 3
for full description of the species delimitation statistics and fig. 4 for a visual representation of these results
Subclades
Inter Dist –
closest (K2P) P (Randomly Distinct)
Clade
support Rosenberg’s P (AB) gsi P-value
Clade 1: musae Bd51/67 Bd61-62 0.234 0.05 59 5.50E-04 1 0.00059994
Bd56-71 0.309 0.42 51 2.10E-05 1 1.00E-04
Bd54-70 0.234 0.05 85 1.30E-06 1 1.00E-04
Clade 2: occipitalis 739/800 Bd783&786 0.331 0.05 61 0.05 1 0.00089991
Bd794&799 0.331 0.05 91 0.05 1 0.00059994
Clade 3: cacuminata 231/244 No additional subclades to test
Clade 4: opiliae 1080/1082 Bd1081&88 0.279 0.05 88 6.40E-04 1 0.00069993
Bd1083&85 0.258 0.05 90 6.40E-04 1 0.00119988
Bd1086&95 0.345 0.05 100 6.40E-04 1 0.00029997
Bd1089&90 0.258 0.05 86 6.40E-04 1 0.00069993
Clade 5: carambolae 1111/189 Bd405&1241 0.364 0.05 68 1.90E-05 1 0.00069993
Bd1255-1262 0.345 0.05 100 1.90E-05 1 1.00E-04
Bd1238&58 0.256 0.05 77 6.90E-08 1 0.00069993
Bd1234-1121 0.55 0.05 73 6.20E-09 1 1.00E-04
Bd419-1263 0.256 0.05 70 6.70E-10 1 1.00E-04
Bd1225-1239 0.543 0.05 99 1.90E-15 1 1.00E-04
Bd191-216 0.343 0.05 100 8.00E-18 1 1.00E-04
Clade 6: dorsalis 818/399 Bd818&1168 0.596 0.05 92 9.50E-07 1 0.00129987
Bd1195-1200 0.344 0.06 100 1.90E-08 0.498 0.0009999
Bd418&827 0.345 0.05 87 1.00E-06 1 0.0009999
Bd579&1179 0.303 1 64 1.00E-06 1 0.00139986
Bd580&1164 0.284 0.09 50 1.00E-06 1 0.00109989
Bd583&1142 0.292 0.71 57 1.00E-06 1 0.00039996
Bd772&775 0.254 0.13 82 1.00E-06 1 0.00079992
Bd816&1148 0.333 0.05 100 1.00E-06 1 0.00039996
Bd823&1181 0.377 0.05 100 1.00E-06 1 0.00079992
Bd1143&1145 0.4 0.05 100 1.00E-06 1 0.00049995
Bd1206&1210 0.224 0.05 72 1.00E-06 1 0.00069993
Bd1211&1253 0.404 0.05 55 1.00E-06 1 0.00079992
Bd1244&1250 0.231 0.41 64 1.00E-06 1 0.00069993
Bd1202-1215 0.269 1 92 2.00E-08 1 1.00E-04
Bd1246-1249 0.224 0.16 54 2.00E-08 1 1.00E-04
Bd825-1209 0.401 1 63 5.40E-10 1 1.00E-04
Bd1194-1205 0.263 1 99 5.40E-10 1 1.00E-04
Bd585-1183 0.426 0.94 80 1.70E-11 1 1.00E-04
Bd744-781 0.361 0.05 100 1.10E-30 0.953 1.00E-04
Bd593-1123 0.37 1 55 6.80E-36 1 1.00E-04
© 2013 Blackwell Verlag, GmbH14
Phylogeny of B. dorsalis pest flies L. M. Boykin et al.

Implications and future studies for B. dorsalis taxonomy
A number of previous studies have failed to find reso-
lution between B. dorsalis s.s, B. papayae and B. philip-
pinensis based on molecular (cox1 and microsatellites)
morphological (wing shape and aedeagus length) or
behavioural (mating and chemical ecology) data
(Medina et al. 1998; Tan 2000, 2003; Wee and Tan
2000a,b, 2005; Krosch et al. 2012b; Schutze et al.
2012a). The results of the current study do not contra-
dict this, and in addition, the design here overcomes
the potential weaknesses of earlier studies by sam-
pling much larger numbers of individuals across a
wider geographic range. However, while this body of
evidence fails to reject the hypothesis, that these three
‘species’ are in fact one, it also fails to distinguish
between this as a result of inappropriate diagnostics or
incorrect taxonomy (Drew et al. 2008; Schutze et al.
2012b). While the former was tested here by use of
loci that could clearly distinguish other well-recog-
nized and closely related biological species within the
dorsalis complex, that is, B. cacuminata, B. opiliae and
B. carambolae, as well as B. musae for which a number
of previous studies have found problematic (White
1996; Muraji and Nakahara 2002), there are still some
methodological issues. Given concerted evolution of
the rDNA loci, one might expect these three taxa to
share a common ITS sequence, but this was not the
case and much of the phylogenetic information in the
CAD and period loci was obscured by the inability to
produce true sequence from the many combinations
of heterozygous alleles. The main source of distinc-
tion, or lack of for B. dorsalis s.s, B. papayae and B. phi-
lippinensis, came from two linked mitochondrial loci.
However, mitochondrial DNA is characterized by
complex evolutionary dynamics. For example, selec-
tive sweeps that help to differentiate taxa can in the
case of recently diverged taxa be offset by the homog-
enizing effect of hybrid introgression (Galtier et al.
2009). Certainly, this has been found in wild popula-
tions of very closely related dipteran species (e.g.
Bachtrog et al. 2006), such that any correlation with
other taxonomic distinctions are lost. Of course there
may be other nuclear genes that might support the
current taxonomy, and this may become more feasi-
ble to test as genomic data continues to accumulate.
Nonetheless, we stress that this work should be exam-
ined in the broader context of integrative taxonomy,
where final taxonomic conclusions are not based on
one line of evidence but on several integrated lines of
independent evidence (Dayrat 2005; Schlick-Steiner
et al. 2010). In this context, there is a growing body
of international, multidisciplinary literature (Fletcher
and Kitching 1995; Yong 1995; Iwahashi 2000, 2001;
Muraji and Nakahara 2002; Smith et al. 2003; Tan
2003; Armstrong and Ball 2005; Tan et al. 2011;
Krosch et al. 2012b; Schutze et al. 2012a) that can all
be considered to date as supporting, or at least not
refuting, the possibility that these cryptic species,
namely B. dorsalis s.s., B. papayae and B. philippinensis
are the same biological species. However, given the
risk that severe quarantine and trade implications
could result from changes to the taxonomic delimita-
tion of species relevant to global biosecurity (Boykin
et al. 2012), it is critical that there is a high level of
scientific support for a revision such as that implicated
here for pest species in the B. dorsalis complex.
Acknowledgements
We wish to sincerely thank the following colleagues
who assisted us with supplying specimens for this
study: Mary Finlay-Doney, Richard Bull, Yuvarin
Boontop, Keng-Hong Tan, Sotero Resilva, Ju-Chun
Hsu, Alies van Sauers-Muller, Vijay Shanmugam,
Hanifah Yahaya, Wigunda Rattanapun and Peter
Leach. Vladimir Mencl, Markus Binsteiner and Yuriy
Halytskyy at the New Zealand eScience Infrastructure
(NeSi- http://www.nesi.org.nz) were instrumental in
the HPC analyses. LMB and KFA were funded by the
Tertiary Education Council of New Zealand. The paper
was produced with research support through CRC
National Plant Biosecurity projects 20115 and 20183.
The authors would like to acknowledge the support of
the Insect Pest Control Laboratory (Seibersdorf) of the
Joint FAO/IAEA Division of Nuclear Techniques in
Food and Agriculture and the Australian Govern-
ment’s Cooperative Research Centres Program.
Acknowledgement also goes to an anonymous
reviewer who helped to significantly improve the
manuscript.
References
Allwood AJ, Chinajariyawong A, Drew RAI, Hamacek EL,
Hancock DL, Hengsawad C, Jinapin JC, Jirasurat M,
Kong Krong C, Kritsaneepaiboon S, Leong CTS,
Vijaysegaran S, 1999. Host plant records for fruit flies
(Diptera: Tephritidae) in South-East Asia. Raffles Bullet.
Zool. (Suppl. 7), 92 pp.
Ane C, Larget B, Baum DA, Smith SD, Rokas A, 2007.
Bayesian estimation of concordance among gene trees.
Mol. Biol. Evol. 24, 412–426.
Armstrong KF, Ball SL, 2005. DNA barcodes for bio-
secuirty: Invasive species identification. Philos. Trans.
Royal Soc. London B 360, 1813–1823.
© 2013 Blackwell Verlag, GmbH 15
L. M. Boykin et al. Phylogeny of B. dorsalis pest flies

Armstrong KF, Cameron CM, 2000. Species identifica-
tion of Tephritids across a broad taxonomic range. In:
Area-wide control of fruit flies and other insect pests.
Ed. by Tan KH, CABI Publishing, Penang, Malaysia,
703–710.
Armstrong KF, Cameron CM, Frampton ER, 1997. Fruit
fly (Diptera: Tephritidae) species identification: a rapid
molecular diagnostic technique for quarantine applica-
tion. Bull. Entomol. Res. 87, 111–118.
Bachtrog D, Thornton K, Clark A, Andolfatto P, 2006.
Extensive introgression of mitochondrial dna relative to
nuclear genes in the Drosophila yakuba species group.
Evolution 60, 292–302.
Barr NB, Cui L, McPheron BA, 2005. Molecular systemat-
ics of nuclear gene period in genus Anastrepha (Tephriti-
dae). Annals Entomol. Soc. Am. 98, 173–180.
Belfiore NM, Liu L, Moritz C, 2008. Multilocus phyloge-
netics of a rapid radiation in the genus Thomomys (Rod-
entia: Geomyidae). Syst. Biol. 57, 294–310.
Boykin LM, Armstrong KF, Kubatko L, De Barro P, 2012.
Species delimitation and global biosecurity. Evolut. Bio-
informat. 8, 1–37.
Cameron SL, Lambkin CL, Barker SC, Whiting MF, 2007.
Utility of mitochondrial genomes as phylogenetic mark-
ers for insect intraordinal relationships – A case study
from flies (Diptera). Syst. Entomol. 32, 40–59.
Cantrell B, Chadwick B, Cahill A, 2001. Fruit fly fighters:
eradication of the papaya fruit fly. CSIRO Publishing,
Collingwood.
Clarke AR, Allwood A, Chinajariyawong A, Drew RAI,
Hengsawad C, Jirasurat M, Krong CK, Kritsaneepaiboon
S, Vijaysegaran S, 2001. Seasonal abundance and host
use patterns of seven Bactrocera Macquart species (Dip-
tera: Tephritidae) in Thailand and Peninsular Malaysia.
Raffles Bullet. Zool. 49, 207–220.
Clarke AR, Armstrong KF, Carmichael AE, Milne JR,
Raghu S, Roderick GK, Yeates DK, 2005. Invasive
phytophagous pests arising through a recent tropical
evolutionary radiation: The Bactrocera dorsalis complex of
fruit flies. Annu. Rev. Entomol. 50, 293–319.
Clarke AR, Powell KS, Weldon CW, Taylor PW, 2011. The
ecology of Bactrocera tryoni (Froggatt) (Diptera: Tephriti-
dae): what do we know to assist pest management?
Annals Appl. Biol. 158, 26–54.
Cummings MP, Neel MC, Shaw KL, 2008. A genealogical
approach to quantifying lineage divergence. Evolution
62, 2411–2422.
Dayrat B, 2005. Towards integrative taxonomy. Biol. J.
Linn. Soc. 85, 407–415.
Degnan JH, Salter LA, 2005. Gene tree distributions under
the coalescent process. Evolution 59, 24–37.
Drew RAI, 1989. The tropical fruit flies (Diptera: Tephriti-
dae: Dacinae) of the Australasian and Oceanian regions.
Mem. Queensland Mus. 26, 1–521.
Drew RAI, 2004. Biogeography and speciation in the
Dacini (Diptera: Tephritidae: Dacinae). Bishop Mus.
Bullet. Entomol. 12, 165–178.
Drew RAI, Hancock DL, 1994. The Bactrocera dorsalis
complex of fruit flies in Asia. Bull. Entomol. Res.
(Suppl. 2), CAB International, Wallingford, UK.
Drew RAI, Hardy DE, 1981. Dacus (Bactrocera) opiliae, a
new sibling species of the dorsalis complex of fruit flies
from northern Australia (Diptera: Tephritidae). J. Aust.
Ent. Soc. 20, 131–137.
Drew RAI, Raghu S, Halcoop P, 2008. Bridging the mor-
phological and biological species concepts: studies on the
Bactrocera dorsalis (Hendel) complex (Diptera: Tephriti-
dae: Dacinae) in South-east Asia. Biol. J. Linn. Soc. 93,
217–226.
Drummond AJ, Ashton B, Buxton S, CheungM, Cooper A,
Heled J, Kearse M, Moir R, Stones-Havas S, Sturrock S,
Thierer T, Wilson A, 2010. Geneious v5.1. URL http://
www.geneious.com.
Duyck P-F, David P, Quilici S, 2004. A review of relation-
ships between interspecific competition and invasions in
fruit flies (Diptera: Tephritidae). Ecol. Entomol. 29, 511–
520.
Edwards SV, 2008. Is a new and general theory of molecu-
lar systematics emerging? Evolution 63, 1–19.
Eickbush TH, Eickbush DG, 2007. Finely orchestrated
movements: evolution of the ribosomal RNA genes.
Genetics 175, 477–485.
Fletcher MT, Kitching W, 1995. Chemistry of fruit flies.
Chem. Rev. 95, 789–828.
Folmer O, Black M, Hoeh W, Lutz R, Vrijenhoek R, 1994.
DNA primers for amplification of mitochondrial cyto-
chrome c oxidase subunit I from diverse metazoan
invertebrates. Mol. Mar. Biol. Biotech. 3, 294–299.
Galtier N, Nabholz B, Gl�emin S, Hurst GDD, 2009. Mito-
chondrial DNA as a marker of molecular diversity: a
reappraisal. Mol. Ecol. 18, 4541–4550.
Gatesy J, Baker R, 2005. Hidden likelihood support in
genomic data: Can forty-five wrongs make a right? Syst.
Biol. 54, 483–492.
Gatesy J, O’Grady P, Baker R, 1999. Corroboration among
data sets in simultaneous analysis: Hidden support for
phylogenetic relationships among higher level artiodac-
tyl taxa. Cladistics 15, 271–313.
Gene Codes Corporation, 2004. Sequencher 4.2. Gene
Codes Corporation, Inc., Madison, Wisconsin.
Harrison RG, 1998. Linking evolutionary patterns and pro-
cess: the relvance of species concepts for the study of
speciation. In: Endless forms: species & speciation. Ed.
by Howard DJ, Berlocher SH, Oxford University Press,
Oxford, 19–31.
Headrick DH, Goeden RD, 1998. The biology of nonfrugiv-
orous tephritid fruit flies. Annu. Rev. Entomol. 43: 217–
241.
© 2013 Blackwell Verlag, GmbH16
Phylogeny of B. dorsalis pest flies L. M. Boykin et al.

Heled J, Drummond AJ, 2010. Bayesian inference of spe-
cies trees from multilocus data. Mol. Biol. Evol. 27, 570–
580.
Huang H, He Q, Kubatko LS, Knowles LL, 2010. Sources of
error inherent in species-tree estimation: impact of
mutational and coalescent effects on accuracy and impli-
cations for choosing among different methods. Syst. Biol.
59, 573–583.
Iwahashi O, 1999. Distinguishing between two sympatric
species, Bactrocera occipitalis and B. philippinensis (Diptera:
Tephritidae), based on aedeagal length. Ann. Entomol.
Soc. Am. 92, 182–187.
Iwahashi O, 2000. Speciation of Bactrocera dorsalis complex
based on aedeagal length. In: Area-wide control of fruit
flies and other insect pests. Ed. by Tan KH, Penerbit Uni-
versiti Sains Malaysia, Palau Pinang, 591–594.
Iwahashi O, 2001. Aedeagal length of the Oriental fruit
fly, Bactrocera dorsalis (Hendel) (Diptera: Tephritidae),
and its sympatric species in Thailand and the evolu-
tion of a longer and shorter aedeagus in the parapat-
ric species of B. dorsalis. Appl. Entomol. Zool. 36, 289–
297.
Jones ND, Gahegan M, Black M, Hine J, Mencl V, Charters
S, Halytskyy Y, Kharuk AF, Hicks A, Binsteiner M,
Soudlenkov G, Kloss G, Buckley K, 2011. BeSTGRID
Distributed Computational Services. Available from
http://www.bestgrid.org/, Auckland, New Zealand: The
University of Auckland.
Knowles LL, Kubatko LS, 2010. Estimating species trees.
Practical and theoretical aspects. Wiley-Blackwell,
Hoboken, NJ.
Krosch MN, Schutze MK, Armstrong KF, Graham GC,
Yeates DK, Clarke AR, 2012a. A molecular phylogeny
for the Tribe Dacini (Diptera: Tephritidae): systematic
and biogeographic implications. Mol. Phylogenet. Evol.
64, 513–523.
Krosch MN, Schutze MK, Armstrong KF, Boontop Y,
Boykin L, Chapman TA, Englezou A, Cameron SL,
Hailstones D, Clarke AR, 2012b. Microsatellite, wing
shape and aedeagus length analysis of Bactrocera dorsalis
s.l. from a north-south transect across the Thai/Malay
Peninsula: no evidence of multiple lineages. Syst. Ento-
mol. 38, 2–13. doi: 10.1111/j.1365-3113.2012.00643.x
Kubatko LS, 2009. Identifying hybridization events in the
presence of coalescence via model selection. Syst. Biol.
58, 478–488.
Kubatko LS, Degnan JH, 2007. Inconsistency of phyloge-
netic estimates from concatenated data under coales-
cence. Syst. Biol. 56, 17–24.
Kubatko LS, Carstens BC, Knowles LL, 2009. STEM:
species tree estimation using maximum likelihood for
gene trees under coalescence. Bioinformatics 25, 971–
973.
Kubatko LS, Gibbs HL, Bloomquist EW, 2011. Inferring
species-level phylogenies and taxonomic distinctiveness
using multilocus data in Sistrurus Rattlesnakes. Syst.
Biol. 60, 393–409.
Liu L, 2008. BEST: Bayesian estimation of species trees
under the coalescent model. Bioinformatics 24, 2542–
2543.
Liu L, Yu L, Pearl DK, Edwards SV, 2009. Estimating
species phylogenies using coalescence times among
sequences. Syst. Biol. 58, 468–477.
Maddison W, Maddison D, 2003. MacClade ver 4.06.
Sinauer Associates, Sunderland.
Masters BC, Fan V, Ross HA, 2010. Species delimitation – a
Geneious plugin for the exploration of species bound-
aries. Mol. Ecol. Resourc. 11, 154–157.
Medina FIS, Carillo PAV, GregorioJS , Aguilar CP, 1998.
The mating compatibility between Bactrocera philippinen-
sis and Bactrocera dorsalis. In: Fifth International Sympo-
sium on Fruit Flies of Economic Importance. Ed. by Tan
KH, 1-5 June. Penang, Malaysia.
Moulton JK, Wiegmann BM, 2004. Evolution and phylo-
genetic utility of CAD (rudimentary) among Mesozoic-
aged Eremoneuran Diptera (Insecta). Mol. Phylogenet.
Evol. 31, 363–378.
Moulton JK, Wiegmann BM, 2007. The phylogenetic rela-
tionships of flies in the superfamily Empidoidea (Insecta:
Diptera). Mol. Phylogenet. Evol. 43, 701–713.Muraji M, Nakahara S, 2002. Discrimination among pest
species of Bactrocera (Diptera: Tephritidae) based on
PCR-RFLP of the mitochondrial DNA. Appl. Entomol.
Zool. 37, 437–446.
Naeole CKM, Haymer DS, 2003. Use of oligonucleotide
arrays for molecular taxonomic studies of closely related
species in the oriental fruit fly (Bactrocera dorsalis) com-
plex. Mol. Ecol. Notes 3, 662–665.
Nakahara S, Muraji M, 2008. Phylogenetic analysis of Bac-
trocera fruit flies (Diptera: Tephritidae) based on nucleo-
tide sequences of the mitochondrial COI and COII genes.
Res. Bull. Pl. Prot. Japan 44, 1–12.
Nakahara S, Masaki M, Kaneda M, Sugimoto T, Muraji M,
2000. Identification of Bactrocera dorsalis complex species
(Diptera: Tephritidae: Dacinae) by PCR-RFLP analysis. I.
A study of variation in Mitochondrial DNA D-loop
region. Res. Bullet. Plant Prot. Ser. Japan 36, 37–41.
Nakahara S, Kato H, Kaneda M, Sugimoto T, Muraji M,
2001. Identification of Bactrocera dorsalis complex species
(Diptara: Tephritidae) by PCR-RFLP Analysis II. A study
of genetic variation in B. dorsalis complex (Philippines
population) and B. dorsalis (Taiwan population). Res.
Bullet. Plant Prot. Ser. Japan 37, 69–73.
Nakahara S, Kato H, Kaneda M, Sugimoto T, Muraji M,
2002. Identification of the Bactrocera dorsalis complex
(Diptera: Tephritidae) by PCR-RFLP analysis: III. Dis-
crimination between B. philippinensis and B. occipitalis.
Res. Bullet. Plant Prot. Ser. Japan 38, 73–80.
Nardi F, Carapelli A, Dallai R, Frati F, 2003. The mitochon-
drial genome of the olive fly Bactrocera oleae: two haplo-
© 2013 Blackwell Verlag, GmbH 17
L. M. Boykin et al. Phylogeny of B. dorsalis pest flies
types from distant geographic locations. Insect Mol. Biol.
12, 605–611.
Nelson LA, Lambkin CL, Batterham P, Wallman JF,
Dowton M, Whiting MF, Yeates DK, Cameron SL, 2012.
Beyond barcoding: genomic approaches to molecular
diagnostics in blowflies (Diptera: Calliphoridae). Gene
511, 131–142.
Porter CH, Collins FH, 1991. Species-diagnostic differences
in a ribosomal DNA internal transcribed spacer from the
sibling species Anopheles freeborn; and Anopheles berms;
(Diptera: Culicidae). Am. J. Trop. Med. Hyg. 45, 271–
279.
Posada D, Crandall KA, 1998. MODELTEST: Testing the
model of DNA substitution. Bioinformatics 14, 817–818.
Rambaut A, Drummond AJ, 2010. Tracer v1.5.4 [Online].
URL http://beast.bio.ed.ac.uk/Tracer.
Rodrigo A, Bertels F, Heled J, Noder R, Shearman H, Tsai
P, 2008. The perils of plenty: what are we going to do
with all these genes? Philos. Trans. R Soc. Lond. B Biol.
Sci. 363, 3893–3902.
Rokas A, William BL, King N, Carroll SB, 2003. Genome-
scale approaches to resolving incongruence in molecular
phylogenies. Nature 425, 798–804.
Ronquist F, Teslenko M, van der Mark P, Ayres DL,
Darling A, Hohna S, Larget B, Liu L, Suchard MA,
Huelsenbeck JP, 2012. MrBayes 3.2: Efficient Bayesian
phylogenetic inference and model choice across a large
model space. Syst. Biol. 61, 539–542.
Rosenberg NA, 2007. Statistical tests for taxonomic distinc-
tiveness from observations of monophyly. Evolution 61,
317–323.
Sanderson MJ, McMahon MM, Steel M, 2011. Terraces in
phylogenetic tree space. Science 33, 448–450.
van Sauers-Muller A, 1991. An overview of the Carambola
fruit fly Bactrocera species (Diptera: Tephritidae), found
recently in Suriname. Fla. Entomol. 74, 432–440.
Schlick-Steiner BC, Steiner FM, Seifert B, Stauffer C,
Christian E, Crozier RH, 2010. Integrative taxonomy: a
multisource approach to exploring biodiversity. Annu.
Rev. Entomol. 55, 421–438.
Schutze MK, Krosch MN, Armstrong KF, Chapman TA,
Englezou A, Chomi�c A, Cameron SL, Hailstones D,
Clarke AR, 2012a. Population structure of Bactrocera dor-
salis s.s., B. papayae and B. philippinensis (Diptera: Tephri-
tidae) in southeast Asia: evidence for a single species
hypothesis using mitochondrial DNA and wing-shape
data. BMC Evol. Biol. 12, 130. doi:10.1186/1471-2148-
12-130.
Schutze MK, Jessup A, Clarke AR, 2012b. Wing shape
as a potential discriminator of morphologically similar
pest taxa within the Bactrocera dorsalis species com-
plex (Diptera: Tephritidae). Bull. Entomol. Res. 102,
103–111.
Sites JW, Marshall JC, 2004. Operational criteria for delim-
iting species. Annu. Rev. Ecol. Evol. Syst. 35, 199–227.
Smith ESC, 2000. Detection and eradication of the exotic
fruit fly Bactrocera philippinensis from Australia. In: Pro-
ceedings of the Indian Ocean Commission, Regional
Fruit Fly Symposium. Ed. by Price NS, Seewooruthun I,
Flic en Flac, Mauritius, 5th–9th June, 2000, 201–205
Smith PT, Kambhampati S, Armstrong KA, 2003. Phylog-
entic relationships among Bactrocera species (Diptera:
Tephritidae) inferred from mitochondrial DNA
sequences. Mol. Phylogenet. Evol. 26, 8–17.
Spanos L, Koutroumbas K, Kotsyfakis M, Louis C, 2000.
The mitochondrial genome of the Mediterranean fruit
fly, Ceratitis capitata. Insect Mol. Biol. 9, 139–144.
Stamatakis A, Hoover P, Rougemont J, 2008. A rapid boot-
strap algorithm for the RAxML webservers. Syst. Biol.
75, 758–771.
Tan KH, 2000. Behaviour and chemical ecology of fruit
flies. In: Area-wide control of fruit flies and other insect
pests. Ed. by Tan KH, Penerbit Universiti Sains Malaysia,
Penang.
Tan KH, 2003. Interbreeding and DNA analysis of sibling
species within the Bactrocera dorsalis complex. Recent
trends on sterile insect technique and area-wide inte-
grated pest management - economic feasibility, control
projects, farmer organization and Bactrocera dorsalis com-
plex control study. Research Institute for subtropics,
Okinawa.
Tan KH, Tokushima I, Ono H, Nishida R, 2011. Compari-
son of phenylpropanoid volatiles in male rectal and
pheromone gland after methyl eugenol consumptions,
and molecular phylogenetic relationship of four global
pest fruit fly species: Bactrocera invadens, B. dorsalis, B. cor-
recta and B. zonata. Chemoecology 21, 25–33.
Than C, Nakhleh L, 2009. Species tree inference by mini-
mizing deep coalescences. PLoS Comput. Biol. 5,
e1000501.
Than C, Ruths D, Nakhleh L, 2008. PhyloNet: a software
package for analyzing and reconstructing reticulate evo-
lutionary relationships. BMC Bioinformat. 9, 322.
Thomas DB, 2008. A safe and efective propylene glycol
based capture liquid for fruit fly (Diptera:Tehphritidae)
traps baited with synthetic lures. Florida Entomol. 91,
210–213.
Thompson JD, Gibson TJ, Plewniak F, Jeanmougin F,
Higgins DG, 1997. The ClustalX windows interface:
flexible strategies for multiple sequence alignment
aided by quality analysis tools. Nucleic Acids Res. 24,
4876–4882.
Vink C, Thomas SM, Paquin P, Hayashi CY, Hedin M,
2005. The effects of preservatives and temperature on
arachnid DNA. Invert. Systemat. 19, 99–104.
Virgilio M, De Meyer M, White IM, Backeljau T, 2009.
African Dacus (Diptera: Tephritidae: molecular data and
host plant associations do not corroborate morphology
based classifications. Mol. Phylogenet. Evol. 51, 531–
539.
© 2013 Blackwell Verlag, GmbH18
Phylogeny of B. dorsalis pest flies L. M. Boykin et al.

Wee SL, Tan KH, 2000a. Interspecific mating of two sibling
species of the Bactrocera dorsalis complex in a field cage.
In: Area-wide control of fruit flies and other insect pests.
Ed. by Tan KH, Penerbit Universiti Sains Malaysia,
Penang Malaysia.
Wee SL, Tan KH, 2000b. Sexual maturity and intraspecific
mating success of two sibling species of the Bactrocera dor-
salis complex. Entomol. Exp. Appl. 94, 133–139.
Wee SL, Tan KH, 2005. Evidence of natural hybridization
between two sympatric sibling species of Bactrocera dor-
salis complex based on pheromone analysis. J. Chem.
Ecol. 31, 845–858.
White IM, Elson-Harris MM, 1992. Fruit flies of economic
significance: their identification and bionomics. C.A.B
International in association with ACIAR, Wallingford,
Oxon.
White IM, 1996. Fruit fly taxonomy: recent advances and
new approaches. In: Fruit fly pests. A world assessment
of their biology and management. Ed. by McPheron BA,
Steck GJ. St Lucie Press, Delray Beach, FL, 253–258.
Yong HS, 1995. Genetic differentiation and relationships
in five taxa of the Bactrocera dorsalis complex (Insecta:
Diptera: Tephritidae). Bull. Entomol. Res. 85, 431–435.
Yu DJ, Xu L, Nardi F, Li JG, Zhang RJ, 2007. The complete
nucleotide sequence of the mitochondrial genome of the
oriental fruit fly, Bactrocera dorsalis (Diptera: Tephriti-
dae). Gene 396, 66–74.
Supporting Information
Additional Supporting Information may be found in
the online version of this article:
Figure S1. Dataset #1.1. Bayesian phylogenetic
reconstruction based on sequence data for specimens
for which mtDNA (cox1and nad4-3′) were sequenced
for Bactrocera spp. in the current study.
Figure S2. Dataset 1.2. Phylogenetic reconstruction
based on sequence data for specimens for which ribo-
somal DNA (ITS1 and ITS2) were sequenced for Bac-
trocera spp. in the current study.
Figure S3. Dataset 1.3. Phylogenetic reconstruction
based on sequence data for specimens for which
nuclear DNA (CAD gene) was sequenced for Bactrocera
spp. in the current study.
Figure S4. Dataset 1.4. Phylogenetic reconstruction
based on sequence data for specimens for which
nuclear DNA (period gene) was sequenced for Bactro-
cera spp. in the current study.
Figure S5. Dataset #2. Phylogenetic reconstruction
based on sequence data for specimens for which all
six loci were sequenced for Bactrocera spp. in the cur-
rent study (236 specimens, 3435 bp alignment).
Figure S6. Dataset #3. Phylogenetic reconstruction
based on sequence data for specimens for which all
six loci (cox1, nad4-3′, ITS1, ITS2, CAD and per) were
sequenced for Bactrocera spp. in the current study.
Figure S7. Dataset #4. Phylogenetic reconstruction
based on sequence data for specimens for which four
loci were sequenced (cox1, nad4-3′, ITS1 and ITS2) for
Bactrocera spp. in the current study (236 specimens,
2221 bp).
Figure S8. Dataset #5. Phylogenetic reconstruction
based on sequence data for specimens for which at
least two of four loci (cox1, nad4-3′, ITS1 and ITS2)
were sequenced for Bactrocera spp. in the current
study (315 specimens, 2221 bp).
Table S1. Collection and GenBank accession infor-
mation for the samples included in this study.
© 2013 Blackwell Verlag, GmbH 19
L. M. Boykin et al. Phylogeny of B. dorsalis pest flies