bp-20 rate case workshop: transmission rates€¦ · bo n n e v i l l e po w er ad m i n i st r at...
TRANSCRIPT

BP-20 Rate Case Workshop: Transmission Rates
June 14, 2018

B O N N E V I L L E P O W E R A D M I N I S T R A T I O N
• May 30 Workshop Follow-up Items • Load Forecasting Overview • Overview of Unauthorized Increase Charge • Segmentation: Future Plant • Proposed Rate Schedule Changes • Next Steps
2 June 14, 2018 Pre-Decisional. For Discussion Purposes Only
Agenda

May 30 Workshop Follow-up Items

B O N N E V I L L E P O W E R A D M I N I S T R A T I O N
Description Where it will be Addressed Due Date
Reconciliation of Total Plant with Segmented Historical Investment
Addressed in current presentation 6/14/2018
Direct labor costs by segment in the segmentation study
The detailed direct labor costs by segment were not studied and would take extensive resources to produce. We have provided the detail used to develop the O&M table. See the BP-20 Meetings and Workshops page.
6/14/2018
Detailed segmentation investment See BP-20 Meetings and Workshops page 6/14/2018
Detailed segmented O&M costs See BP-20 Meetings and Workshops page 6/14/2018
Comparison of Future Plant FY 17 Forecast to Actuals
Addressed in current presentation 6/14/2018
FY 17 Tag Data for Scheduling, System Control and Dispatch (schedule data)
See BP-20 Meetings and Workshops page. Customers will have until June 28 to submit SCD rate design alternatives for consideration.
SCD rate design alternatives due 6/28/2018
4 June 14, 2018 Pre-Decisional. For Discussion Purposes Only
Follow-up Items from May 30 Meeting

B O N N E V I L L E P O W E R A D M I N I S T R A T I O N
Segmentation Follow-up: Segmentation Components
June 14, 2018 Pre-Decisional. For Discussion Purposes Only 5
Description $ in
Millions Non-Transmission Plant 193 Land 221 Assets not used for investment allocation factor for segements Gen Plan (unsegmented) 1,091 Funded in Advance 191 Segmented Lines and Substations 7,623 ====>>>>> Used for as the total then segmented to get allocation factors by segments Ancillary Services 213 ====>>>>>> Stand alone investment segment not used for allocation Transmission Plant (unsegmented) 179 ====>>>>>> Allocated based on Segmented Lines and Substation allocation factors Total BPA Transmission Plant $ 9,711

B O N N E V I L L E P O W E R A D M I N I S T R A T I O N
• Currently we do not have O&M direct labor by segment.
• The direct labor is included in the program costs – It would take extensive resources to produce
and analyze this information – We do not use the direct labor detail by
segment in our study • We have included the O&M cost details on the
rate case website for customer review
6 June 14, 2018 Pre-Decisional. For Discussion Purposes Only
O&M Direct Labor Costs by Segment
B O N N E V I L L E P O W E R A D M I N I S T R A T I O N
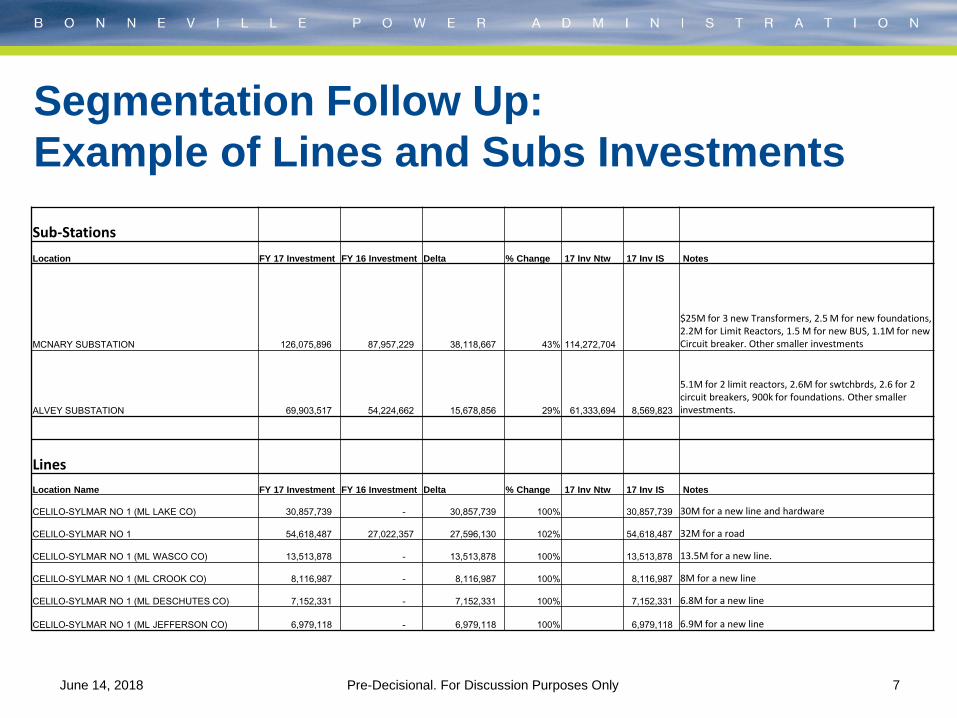
Sub-Stations
Location FY 17 Investment FY 16 Investment Delta % Change 17 Inv Ntw 17 Inv IS Notes
MCNARY SUBSTATION 126,075,896 87,957,229 38,118,667 43% 114,272,704
$25M for 3 new Transformers, 2.5 M for new foundations, 2.2M for Limit Reactors, 1.5 M for new BUS, 1.1M for new Circuit breaker. Other smaller investments
ALVEY SUBSTATION 69,903,517 54,224,662 15,678,856 29% 61,333,694 8,569,823
5.1M for 2 limit reactors, 2.6M for swtchbrds, 2.6 for 2 circuit breakers, 900k for foundations. Other smaller investments.
Lines
Location Name FY 17 Investment FY 16 Investment Delta % Change 17 Inv Ntw 17 Inv IS Notes
CELILO-SYLMAR NO 1 (ML LAKE CO) 30,857,739 - 30,857,739 100% 30,857,739 30M for a new line and hardware
CELILO-SYLMAR NO 1 54,618,487 27,022,357 27,596,130 102% 54,618,487 32M for a road
CELILO-SYLMAR NO 1 (ML WASCO CO) 13,513,878 - 13,513,878 100% 13,513,878 13.5M for a new line.
CELILO-SYLMAR NO 1 (ML CROOK CO) 8,116,987 - 8,116,987 100% 8,116,987 8M for a new line
CELILO-SYLMAR NO 1 (ML DESCHUTES CO) 7,152,331 - 7,152,331 100% 7,152,331 6.8M for a new line
CELILO-SYLMAR NO 1 (ML JEFFERSON CO) 6,979,118 - 6,979,118 100% 6,979,118 6.9M for a new line
7 June 14, 2018 Pre-Decisional. For Discussion Purposes Only
Segmentation Follow Up: Example of Lines and Subs Investments

B O N N E V I L L E P O W E R A D M I N I S T R A T I O N
Generation Integration Network
Southern Intertie
Eastern Intertie
Utility Delivery DSI Delivery
Segmented Total
FY16 Actuals Lines & Subs Total 111,279 6,203,536 989,009 123,264 13,691 8,297 7,449,074
Generation Integration Network
Southern Intertie
Eastern Intertie
Utility Delivery DSI Delivery
Segmented Total
FY17 Actuals Lines & Subs Total 131,505 6,416,142 1,106,924 123,398 15,024 8,581 7,801,574
FY17 Additions
20,226
212,606
117,915
134
1,333
284
352,500
PIS Forecast Generation Integration Network
Southern Intertie
Eastern Intertie
Utility Delivery DSI Delivery Total
Lines & Subs BP16 RC for FY17 - 307,620 322,753 87 46 - 630,506
Delta
(20,226)
95,014
204,838
(47)
(1,287)
(284)
278,006
8 June 14, 2018 Pre-Decisional. For Discussion Purposes Only
Segmentation Follow Up: Plant in Service Forecast vs. Actuals

B O N N E V I L L E P O W E R A D M I N I S T R A T I O N
• The FY 2017 tag data for SCD is posted • Customers will have until June 28, 2018 (two week
extension) to review the data and suggest SCD rate design alternatives for us to consider.
• Customers are encouraged to suggest other alternatives. • Staff aims to present the customer impact and evaluation
of each rate design alternative, along with staff’s leaning for the Initial Proposal at the July 18, 2018 workshop. – Customers are welcome to present their alternatives and their
own evaluation. Please contact Rebecca Fredrickson at [email protected] if you would like time on the July 18 workshop agenda.
9 June 14, 2018 Pre-Decisional. For Discussion Purposes Only
Scheduling, System Control and Dispatch Data

Load Forecasting Overview

B O N N E V I L L E P O W E R A D M I N I S T R A T I O N
11 June 14, 2018 Pre-Decisional. For Discussion Purposes Only
Transmission Peak Types (graph referenced throughout the presentation)

B O N N E V I L L E P O W E R A D M I N I S T R A T I O N
• What does Coincident Peak (CP) load mean? – Generally, coincident peak is a measure of load at the same time
(coincident) that another measure is highest. – For Rate purposes, a customer’s CP load is the sum of the customer’s
individual meters, integrated over the hour of the Federal Columbia River Transmission System (FCRTS) Monthly Transmission System Peak Load. (point D on graph)
• What is the Monthly Transmission System Peak Load? – The peak load on the FCRTS during the designated billing month,
determined by the largest hourly integrated demand produced from the sum of the Federal and non-Federal generating plants in BPA’s Control Area and net metered flow into BPA’s Control Area (aka Total Transmission System Load or TTSL). (red vertical line on graph)
• What does Non-Coincident Peak (NCP) load mean? – For Rate purposes, any method that looks at customer metered load at a
time other than (non-coincidental with) the Monthly Transmission System Peak Load. (any of points A, B, C’s, E)
12 June 14, 2018 Pre-Decisional. For Discussion Purposes Only
Terminology – Keeping All the Terms Straight

B O N N E V I L L E P O W E R A D M I N I S T R A T I O N
13 June 14, 2018 Pre-Decisional. For Discussion Purposes Only
Peak Forecasts used by Transmission The Forecasts used in Rates and Planning are developed at the POD or WECC Bus level. • Non-coincidental peak POD load forecast models are developed from
historical meter detail. (points A & B) • The sum of the Non-coincidental peak POD load forecasts for a customer is
represented by the dashed horizontal blue line on the Peak Types chart on the previous slide. (point E)
Meter POD Customer
Meter
Meter
Meter
Meter Meter
POD/Bus
BUS
BUS

B O N N E V I L L E P O W E R A D M I N I S T R A T I O N
14 June 14, 2018 Pre-Decisional. For Discussion Purposes Only
Peak Forecasts used by Transmission, continued
• Each Non-coincidental POD forecast is scaled to reflect the POD load at the time of the Customer Peak as represented by the points where the POD load crosses the vertical black line on the chart. (points C1 and C2)
– The sum of these POD loads for a customer is the Non-coincident Customer Peak (point C)
• Each Non-coincidental POD forecast is also scaled to reflect the POD load at the time of the Transmission System Peak Load as represented by the points where the POD load crosses the vertical red line on the chart. (points D1 and D2) – The sum of these POD loads for a customer is the Customer
Peak coincident with the transmission system peak (CP). (point D)

B O N N E V I L L E P O W E R A D M I N I S T R A T I O N
15 June 14, 2018 Pre-Decisional. For Discussion Purposes Only
Overarching Forecast Assumptions • Normal weather conditions exist
– 34 year average value • Continuation of trends with known changes
– Known changes identified through customer visits • Numerous elements are forecasted from the same
assumptions – kWh – customer peak – Generation System Peak (GSP) – Transmission System Peak (TSP) – Control Area (CA) peak – Etc.

B O N N E V I L L E P O W E R A D M I N I S T R A T I O N
16 June 14, 2018 Pre-Decisional. For Discussion Purposes Only
Load Forecasting Process • Forecasts are developed within the Agency Load
Forecasting tool (ALF) • Updates are prepared annually • Each customer/POD/Bus element is individually
forecasted – Statistical based regression models using up to 10 years of
historical data – All Energy models are independent models – Non-coincidental customer peak and POD non-coincidental
peaks each have their own independent model (points A, B, C)
– Customer non-coincidental POD peaks and all Coincidental peaks are dependent on Customer non-coincident peak model using historical factors (points C1, C2, D1, D2, D)
B O N N E V I L L E P O W E R A D M I N I S T R A T I O N
17 June 14, 2018 Pre-Decisional. For Discussion Purposes Only
Load Forecasting Process, continued • Preliminary forecast reviewed by Customer, and other
interested parties – Regional economic conditions
• Migration patterns • Individual industrial plant activity • Changing consumer behavior
– Demographic conditions • Birth and Death Rates • Age and Gender
– Off trend growth is added to trend – Off trend examples
• New large industrial or commercial loads • New large subdivision additions

B O N N E V I L L E P O W E R A D M I N I S T R A T I O N
• Positive GDP growth is still expected for the nation • Regional unemployment has improved slightly • Load continues small growth • World economic concerns continue
18 June 14, 2018 Pre-Decisional. For Discussion Purposes Only
Forecasted Economic Conditions Continue from Last Year

B O N N E V I L L E P O W E R A D M I N I S T R A T I O N
• Demand models are performing well after compensating for the ups and downs of the weather.
19 June 14, 2018 Pre-Decisional. For Discussion Purposes Only
Current Models - Peaks

B O N N E V I L L E P O W E R A D M I N I S T R A T I O N
• Downward bias in forecast adjustments – ~55% of the customers increased forecast over last year levels, ~45%
reduced forecasts – Average change about 1aMW per customer
• Bulk of changes are the results of anticipated specific large customer adjustments with most of the change coming from a few customers
20 June 14, 2018 Pre-Decisional. For Discussion Purposes Only
Forecasted Agency Loads Continue as Planned Last Year
Mwa2018 2019 2020 2021 2022
Prior Forecast (April 2017) 9,133 9,248 9,441 9,598 9,732Current Forecast (April 2018) 8,974 9,171 9,272 9,514 9,711
change -159 -77 -169 -84 -21% change -1.7% -0.8% -1.8% -0.9% -0.2%

Overview of Unauthorized Increase Charge

B O N N E V I L L E P O W E R A D M I N I S T R A T I O N
• BPA imposes an Unauthorized Increase Charge (UIC) whenever a Point-To-Point
customer’s schedule exceeds its capacity reservation at any Point of Receipt (POR) or Point of Delivery (POD). The UIC is assessed as defined in Section II.F.1.a of the BPA Transmission Services GRSPs, which states:
The UIC rate shall be the lesser of (i) 100 mills per kilowatthour plus the price cap established by FERC for spot market sales of energy in the WECC, or (ii) 1000 mills per kilowatthour. If FERC eliminates the price cap, the rate will be 500 mills per kilowatthour.
• Prior to the current rate, customers were charged based on the duration of their
transmission reservation. This could result in the long-term firm rate being applied for one UIC while a daily rate was applied for another.
• The motivation to change the rate was to create a more consistent UIC and to ensure customers have no economic incentive to schedule in excess of their reserved capacity. The current rate was adopted in the 2010 Transmission Rate Case Settlement.
• Since the implementation of the current UIC rate design, BPA continues to see some customers scheduling in excess of their reserved capacity.
• The WECC price cap is still $1000/MWh.
• The UIC still creates an important economic incentive for customers to not schedule beyond their reserved transmission capacity.
22 June 14, 2018 Pre-Decisional. For Discussion Purposes Only
UIC Current Status

B O N N E V I L L E P O W E R A D M I N I S T R A T I O N
23 June 14, 2018 Pre-Decisional. For Discussion Purposes Only
UIC Historical Volumes by Fiscal Year
• Fiscal Year 2018 is a partial year through April.
2006 2007 2008 2009 2010 2011 2012 2013 2014 2015 2016 2017 2018IS UIC MWh 240 340 2 - - - 24 - 54 - 4 558 585 PTP UIC MWh 127 171 158 47 - 97 - 242 1,131 178 530 1,110 180 NT UIC MWh 1 2 0 6 - 3 - - - - - - -
IS Relief MWh - 25 227 - - - - - - - - 200 - PTP Relief MWh - 72 6 31 - - - 155 479 8 - 794 1
Net UIC MWh 368 417 (73) 22 - 100 24 87 706 170 534 674 764
Fiscal Year

Segmentation: Future Plant in Service

B O N N E V I L L E P O W E R A D M I N I S T R A T I O N
• The Segmentation Study and Revenue Requirement reflect historical plant in service through FY 2017.
• A future Plant in Service forecast is used for FY 2018-21 in the Initial Proposal to project segmented net plant investment during the rate period.
• Segmented net plant is used to allocate capital related costs in the revenue requirement to specific segments.
• The Plant in Service forecast is based on initial capital spending levels currently being discussed in the 2018 IPR.
25 June 14, 2018 Pre-Decisional. For Discussion Purposes Only
Segmentation – Future Plant in Service

B O N N E V I L L E P O W E R A D M I N I S T R A T I O N
• Consistent with past practices, the Final Proposal will be updated to reflect plant placed into service and retirements that occurred in FY 2018. – The Plant in Service forecast will also be updated to
reflect any updates in proposed capital spending for FY 20-21.
26 June 14, 2018 Pre-Decisional. For Discussion Purposes Only
Future Plant in Service Forecast

B O N N E V I L L E P O W E R A D M I N I S T R A T I O N
27 June 14, 2018 Pre-Decisional. For Discussion Purposes Only
Future Plant in Service ($000)
A B C D E F G H
Generation Integration Network Southern Intertie Eastern Intertie Utility Delivery DSI Delivery Total
Stations FY 2018 - 148,076 2,829 - - 150,906 FY 2019 - 194,978 2,403 - - 197,381 FY 2020 - 251,696 2,109 - - 253,805 FY 2021 - 201,128 2,265 - - 203,393
Lines FY 2018 - 81,715 70 - - - 81,784 FY 2019 - 82,954 58 - - - 83,012 FY 2020 - 116,330 3 - - - 116,332 FY 2021 127,012 37 127,049
Lines & Subs FY 2018 - 229,791 2,899 - - 232,690 FY 2019 - 277,932 2,461 - - 280,393 FY 2020 - 368,025 2,112 - - 370,137 FY 2021 - 328,140 2,303 - - 330,442
Other Ancillary Services General Plant
FY 2018 25,489 95,871 FY 2019 43,941 122,690 FY 2020 34,583 115,083 FY 2021 34,966 105,557

Proposed Rate Schedule Changes

B O N N E V I L L E P O W E R A D M I N I S T R A T I O N
• A draft redline version of the proposed changes to the BP-20 Transmission Rate Schedules is posted on the BP-20 Rate Case Meetings and Workshops page. – Changes to the NT SDD language to limit the SDD to
be no more than the power load – Reliability Services name change – Reference to the correct website for the operating
reserves
29 June 14, 2018 Pre-Decisional. For Discussion Purposes Only
Proposed Rate Schedule Changes

Next Steps

B O N N E V I L L E P O W E R A D M I N I S T R A T I O N
• Please send comments on the proposed rate schedule changes or additional rate case topics you’d like to discuss during the workshops by June 28, 2018.
31 June 14, 2018 Pre-Decisional. For Discussion Purposes Only
Comment Period

B O N N E V I L L E P O W E R A D M I N I S T R A T I O N
• The Next BP-20 Rate Case workshop will be on July 18, 2018. Transmission rates topics will include: – LGIA Forecast – Sales Forecast – SCD
32 June 14, 2018 Pre-Decisional. For Discussion Purposes Only
Upcoming Workshops

Appendix

B O N N E V I L L E P O W E R A D M I N I S T R A T I O N
Date BP-20 Rate Case Workshops Other Meetings June 18-21 • 2018 IPR
June 26 (T) • TC-20 Tariff Workshop
June 27 (W)
Cancelled
Jul 18 (W) • Transmission Rates o LGIA o Sales o SCD
• ACS Practices Workshop
34
Future Customer Meetings
June 14, 2018 Pre-Decisional. For Discussion Purposes Only

B O N N E V I L L E P O W E R A D M I N I S T R A T I O N
Date BP-20 Rate Case Workshops Other Meetings July 23 (M) • TC-20 Tariff Workshop July 25 (W) • Power Rates
o Tier 2 pricing o Transmission Scheduling Service
• Transmission Rates o Rates Model o Rate Schedule Changes
• Revenue Requirements
• RHWM Process (9am-10am)
Aug 8 (W) • Risk • Power Rates • ACS Practices Workshop (tentative)
Aug 22 (W) • BP-20 Rate Case (if needed)
35
Future Customer Meetings, continued
Workshop dates and topics are subject to change. Please check the BPA Event Calendar for the most up-to-date information.
June 14, 2018 Pre-Decisional. For Discussion Purposes Only

B O N N E V I L L E P O W E R A D M I N I S T R A T I O N
• Segmentation is a categorization of BPA’s transmission assets into groups (called segments) to develop allocation factors based on gross investment and historical operations and maintenance (O&M) expenses.
• These allocation factors are then used to assign the total transmission revenue requirement to the various segments.
• This results in the segmented revenue requirement that is used to calculate transmission rates.
36
What is Segmentation?
June 14, 2018 Pre-Decisional. For Discussion Purposes Only

B O N N E V I L L E P O W E R A D M I N I S T R A T I O N
37
Segments
June 14, 2018 Pre-Decisional. For Discussion Purposes Only

B O N N E V I L L E P O W E R A D M I N I S T R A T I O N
• Generation Integration – Transmission facilities that connect Federal generation to BPA’s transmission facilities.
• Network – Core of BPA’s transmission system. Transmission facilities that transmit power from Federal and non-federal generation sources or interties to the load centers of BPA’s transmission customers in the PNW or other segments.
• Southern Intertie – Transmission facilities used primarily to transmit energy between the PNW and California.
• Eastern Intertie – Transmission facilities connecting network facilities in the PNW to Eastern Montana, primarily to transfer energy from Colstrip to the PNW (these facilities were constructed pursuant to the Montana Intertie Agreement).
• Utility Delivery – Low voltage transmission lines and substation equipment associated with supplying power directly to utility customers’ distribution systems.
• DSI Delivery – Transformers and low-side switching equipment and protection equipment necessary to step down power to DSI customers at industrial voltages (6.9 or 13.8 kV).
• Ancillary Service – Communications and control equipment necessary for BPA to provide Scheduling, System Control and Dispatch (SCD) service.
38
Description of Segments
June 14, 2018 Pre-Decisional. For Discussion Purposes Only

B O N N E V I L L E P O W E R A D M I N I S T R A T I O N
• BPA is proposing no methodology changes from the BP-18 final proposal or segment definitions.
• The Segmentation Study assigns plant investment to segments based on their function.
• Existing plant in service is updated with actuals through FY 2017 for the BP-20 Initial Proposal. – The final proposal will be updated through FY 2018
• Future plant in service will be forecasted for FY 2018 – FY 2021 for the BP-20 Initial Proposal.
39
BP-20 Segmentation Investment
June 14, 2018 Pre-Decisional. For Discussion Purposes Only

B O N N E V I L L E P O W E R A D M I N I S T R A T I O N
40
Segmented Lines and Substations Investment
($000)
A B C D E F G H IGeneration Integration Network
Southern Intertie Eastern Intertie
Utility Delivery
DSI Delivery
Segmented Total
Ancillary Services
Stations 92,969 3,111,799 784,841 28,412 13,383 8,297 4,039,701 Lines 18,310 3,091,737 204,168 94,851 308 - 3,409,374 Sub Total 111,279 6,203,536 989,009 123,264 13,691 8,297 7,449,074 185,654
% of Segmented Total 1.5% 83.3% 13.3% 1.7% 0.2% 0.1% .
A B C D E F G H IGeneration Integration Network
Southern Intertie Eastern Intertie
Utility Delivery
DSI Delivery
Segmented Total
Ancillary Services
Stations 100,634 3,269,967 803,783 28,552 14,707 8,581 4,226,223 Lines 30,872 3,146,175 303,141 94,846 318 - 3,575,351 Sub Total 131,505 6,416,142 1,106,924 123,398 15,024 8,581 7,801,574 212,601
% of Segmented Total 1.7% 82.2% 14.2% 1.6% 0.2% 0.1% 100.0%
Plant Investment Through September 30, 2016 (BP18 Final)
Plant Investment Through September 30,2017 (BP20 Initial Proposal)
June 14, 2018 Pre-Decisional. For Discussion Purposes Only

B O N N E V I L L E P O W E R A D M I N I S T R A T I O N
• Consistent with BP-18 Final Proposal Methodology • Based on a 7 year historical average • Direct O&M are historical O&M costs associated with a
specific asset – The O&M is directly charged to the asset. – The O&M is then assigned to the different segments based on
the segmented investments • Non-direct O&M are historical O&M costs not
associated with a specific asset – These costs are allocated to Lines, Substations, and Metering
stations in proportion to the direct O&M in each respective group – Transmission Line and Right-of-way Maintenance, and
Vegetation Management (all non-direct) are allocated to Lines only
41
O&M Segmentation Methodology
June 14, 2018 Pre-Decisional. For Discussion Purposes Only

B O N N E V I L L E P O W E R A D M I N I S T R A T I O N
42
Segmented Historical O&M ($000)
A B C D E F G H I IGeneration Integration Network
Southern Intertie
Eastern Intertie
Utility Delivery
DSI Delivery
Segmented Total
Ancillary Services Overhead
Stations 2,822 95,923 16,064 593 788 491 116,681 Lines 468 45,547 2,369 1,956 9 - 50,349 Sub Total 3,290 141,470 18,433 2,549 797 491 167,030 52,418 48,688
% of Segmented Total 2.0% 84.7% 11.0% 1.5% 0.5% 0.3% 100.0%
A B C D E F G H I IGeneration Integration Network
Southern Intertie
Eastern Intertie
Utility Delivery
DSI Delivery
Segmented Total
Ancillary Services Overhead
Stations 2,983 100,123 17,243 628 843 476 122,296 Lines 471 46,265 2,454 1,915 15 51,120 Sub Total 3,454 146,388 19,697 2,543 858 476 173,416 55,579 50,993
% of Segmented Total 2.0% 84.4% 11.4% 1.5% 0.5% 0.3% 100.0%
Historical O&M FY2010-2016 (BP18 Final)
Historical O&M FY2011-2017 (BP20 Initial Proposal)
June 14, 2018 Pre-Decisional. For Discussion Purposes Only