bp statistical-reviewofworldenergy 2011
TRANSCRIPT

bp.com/statisticalreview
© BP 2011
BP Statistical Review of World EnergyJune 2011
2010 – Energy Rebounds
Kevin Goodwin, Head Refining Analysis

BP Statistical Review of World Energy© BP 2011
Outline
• Introduction
• Energy and the economy
• Fuel by fuel
• Conclusion

BP Statistical Review of World Energy© BP 2011
-2%
0%
2%
4%
6%
2006 2008 2010
RenewablesHydroNuclearCoal
GasOil
The economy and energy demand
Energy
-6%
-2%
2%
6%
10%
2000 2002 2004 2006 2008 2010
WorldOECDNon-OECD
GDP
Annual change, %Annual change, %
Source: includes data from Oxford Economics. GDP growth is expressed in real purchasing power parity (PPP) terms.
10-year average

BP Statistical Review of World Energy© BP 2011
-2%
0%
2%
4%
6%
2007 2008 2009 2010
GDPEnergy
-16%
-8%
0%
8%
16%
Trade Industry Energy GDP
Recession and recovery
2010
2009
Source: includes data from Oxford Economics, CPB Netherlands Bureau for Economic Policy Analysis.
Annual change, % Annual change, %

BP Statistical Review of World Energy© BP 2011
0%
2%
4%
6%
8%
10%
2007 2008 2009 2010
-5%
-3%
-1%
1%
3%
5%
2007 2008 2009 2010
GDPEnergy
GDP and energy growth
Source: includes data from Oxford Economics.
OECD Non-OECD
Annual change, % Annual change, %

BP Statistical Review of World Energy© BP 2011
100
140
180
220
260
300
1990 1994 1998 2002 2006 2010
WorldOECDNon-OECD
2009 2010-6
-4
-2
0
2
4
98-03 03-08
Change in energy intensity
Effect of increased non-OECD weight
Net change
Energy intensity
Toe/$Million
Energy intensity level Change in energy intensity
Toe/$Million per year
Source: includes data from Oxford Economics.

BP Statistical Review of World Energy© BP 2011
0%
10%
20%
30%
40%
50%
Jan-09 Jan-10 Jan-11
Dated Brent
0
30
60
90
120
150
2003 2005 2007 2009 2011
Dated BrentAnnual averages
Crude oil prices
$/bbl
Source: includes data from Platts.
Lowest since March 1995
12-month moving average volatility, %
BP Statistical Review of World Energy© BP 2011
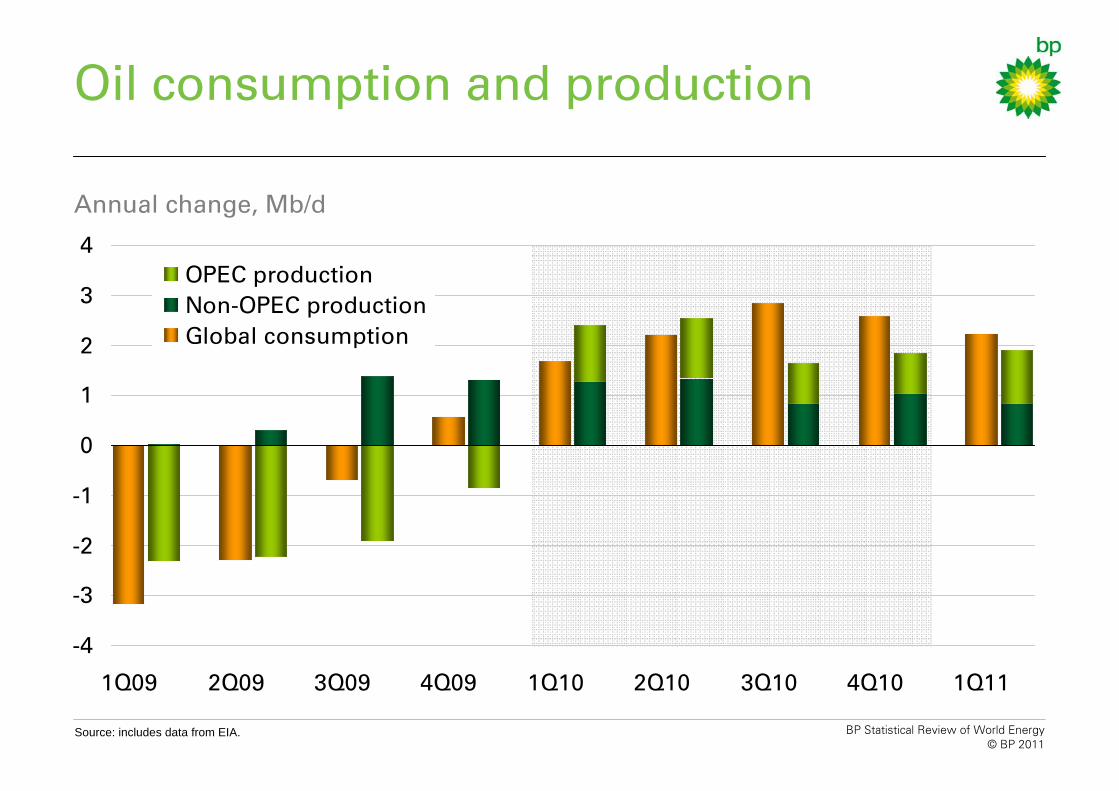
-4
-3
-2
-1
0
1
2
3
4
1Q09 2Q09 3Q09 4Q09 1Q10 2Q10 3Q10 4Q10 1Q11
OPEC productionNon-OPEC productionGlobal consumption
Annual change, Mb/d
Source: includes data from EIA.
Oil consumption and production

BP Statistical Review of World Energy© BP 2011
Oil consumption growth in 2010
-200 0 200 400 600 800
France
Canada
India
Singapore
Saudi Arabia
Brazil
Russia
US
China
Kb/d
Largest changes Regional growth by fuel type
-100 0 100 200 300 400
Africa
Middle East
Eur. & Eurasia
S&C America
N. America
Asia Pacific
Gasoil
Gasoline
Kb/d
BP Statistical Review of World Energy© BP 2011
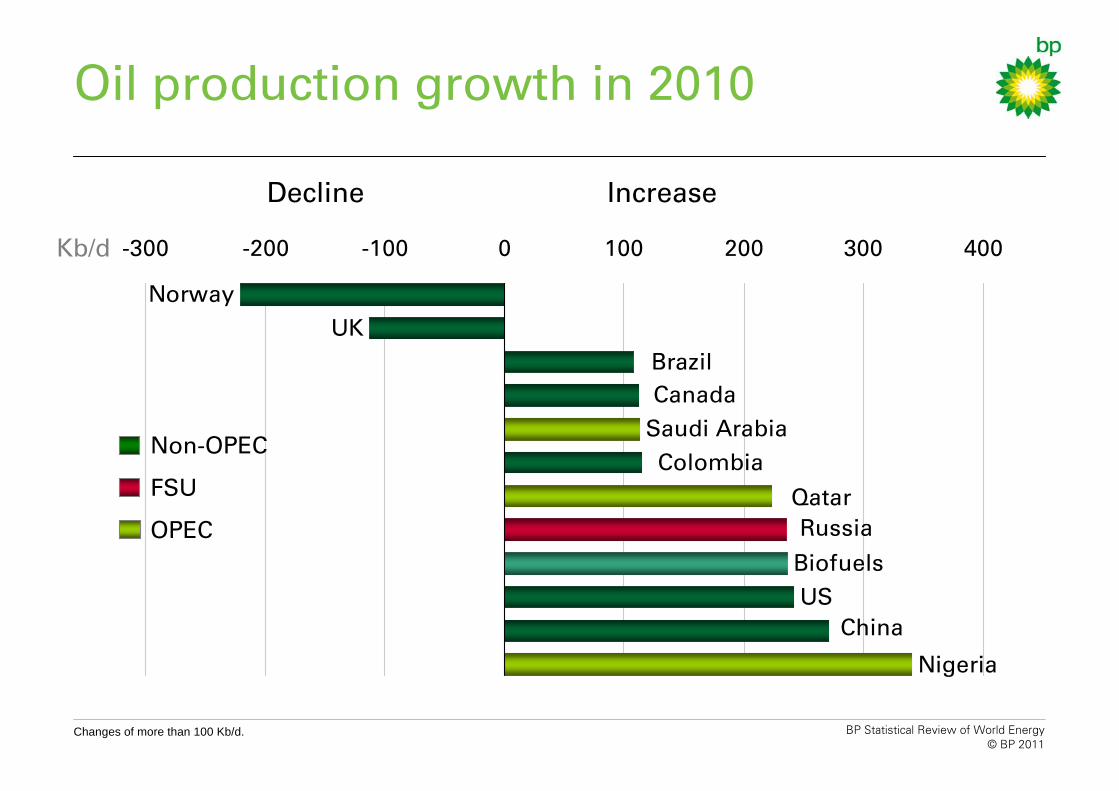
USBiofuels
Saudi Arabia
UK
Nigeria
China
RussiaQatar
Colombia
CanadaBrazil
Norway
-300 -200 -100 0 100 200 300 400
Non-OPEC
FSU
OPEC
Oil production growth in 2010
Changes of more than 100 Kb/d.
Kb/d
Decline Increase
BP Statistical Review of World Energy© BP 2011
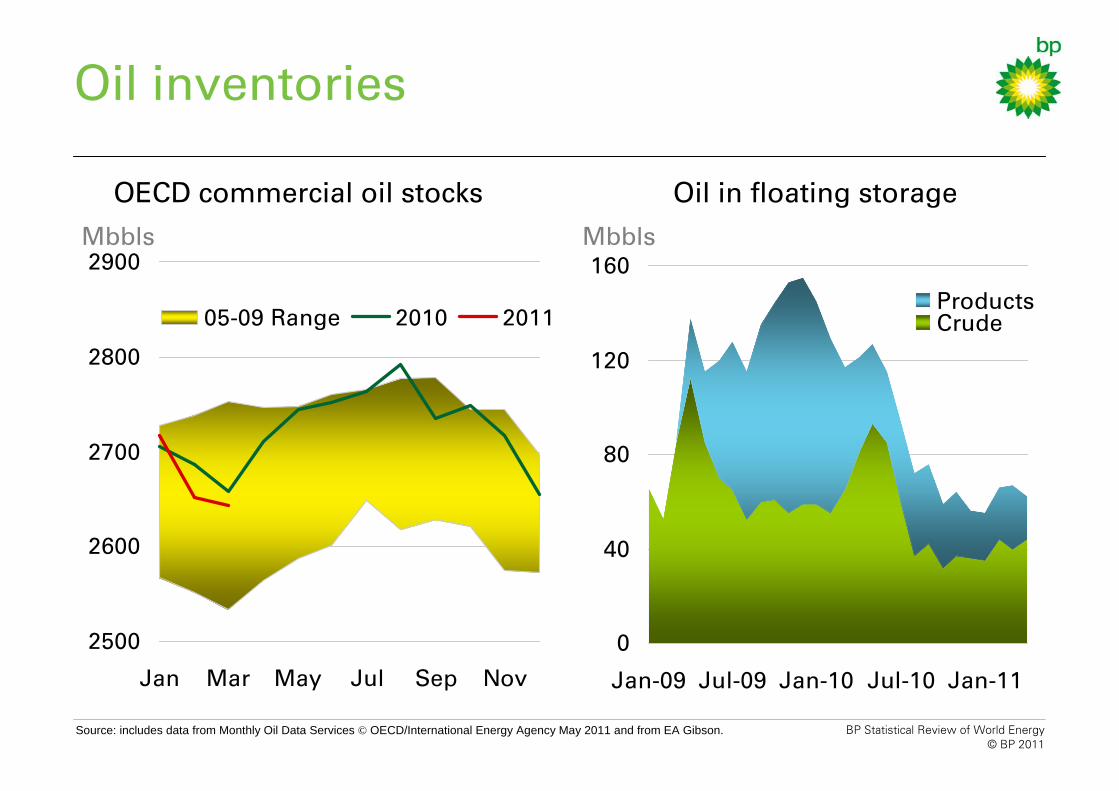
0
40
80
120
160
Jan-09 Jul-09 Jan-10 Jul-10 Jan-11
ProductsCrude
Oil inventories
2500
2600
2700
2800
2900
Jan Mar May Jul Sep Nov
05-09 Range 2010 2011
Mbbls
OECD commercial oil stocks Oil in floating storage
Mbbls
Source: includes data from Monthly Oil Data Services © OECD/International Energy Agency May 2011 and from EA Gibson.

BP Statistical Review of World Energy© BP 2011
-4
-2
0
2
4
6
8
Consumption Production
Cumulative demand and production
Mb/d
Changes since 2005
0
100
200
300
400
Jan-05 Jan-07 Jan-09 Jan-11
OPECNon-OPEC
Oil rig count and oil price
Index: Jan 2005 = 100
OECD
Non-OECD
OPEC-11 Crude
Biofuels
OPEC NGLs
Non-OPEC
Iraq Brent price
Source: includes data from Platts, Baker-Hughes.

BP Statistical Review of World Energy© BP 2011
Refining margins
Refining capacity and margins
Source: includes data from Parpinelli-Technon, Platts.
0
5
10
15
20
2005 2007 2009 2011
BP RMM10-yr. Av.
$/bbl
ytd
40
42
44
46
48
2005 2006 2007 2008 2009 2010
OECDNon-OECD
Refining capacity
Mb/d
BP Statistical Review of World Energy© BP 2011
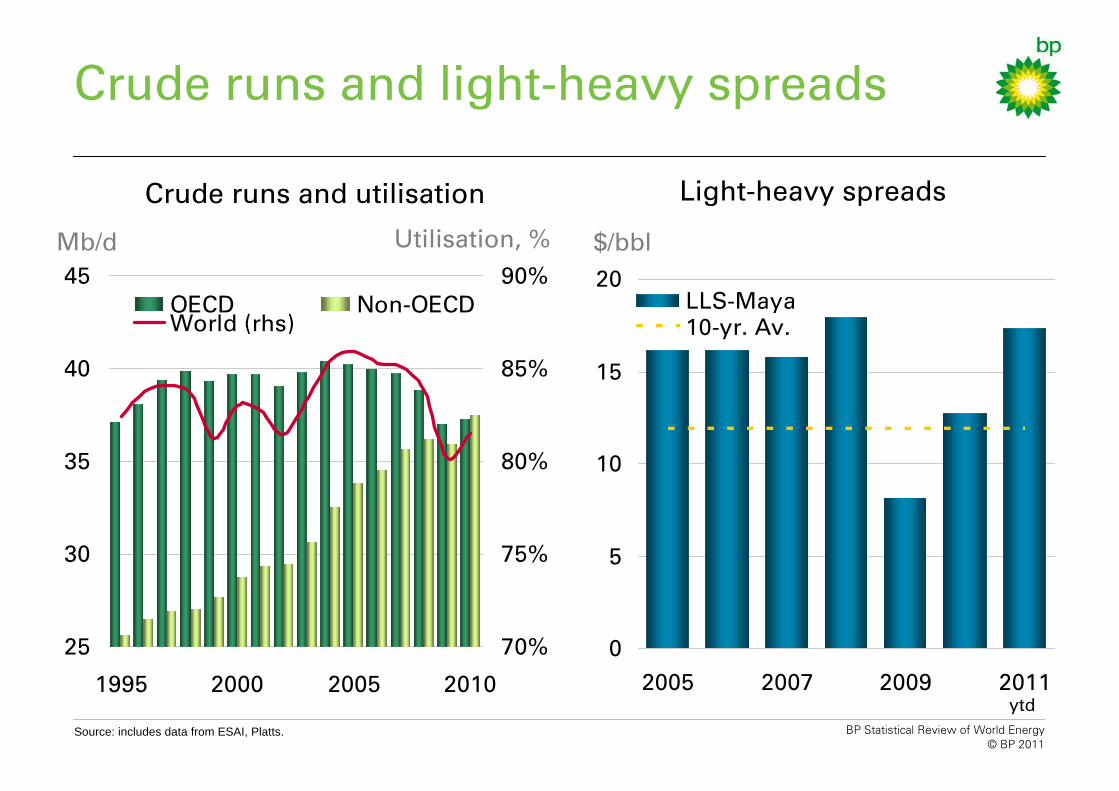
25
30
35
40
45
1995 2000 2005 2010
70%
75%
80%
85%
90%OECD Non-OECDWorld (rhs)
Light-heavy spreads
Crude runs and light-heavy spreads
Source: includes data from ESAI, Platts.
Crude runs and utilisation
Mb/d
0
5
10
15
20
2005 2007 2009 2011
LLS-Maya10-yr. Av.
$/bbl
ytd
Utilisation, %
BP Statistical Review of World Energy© BP 2011
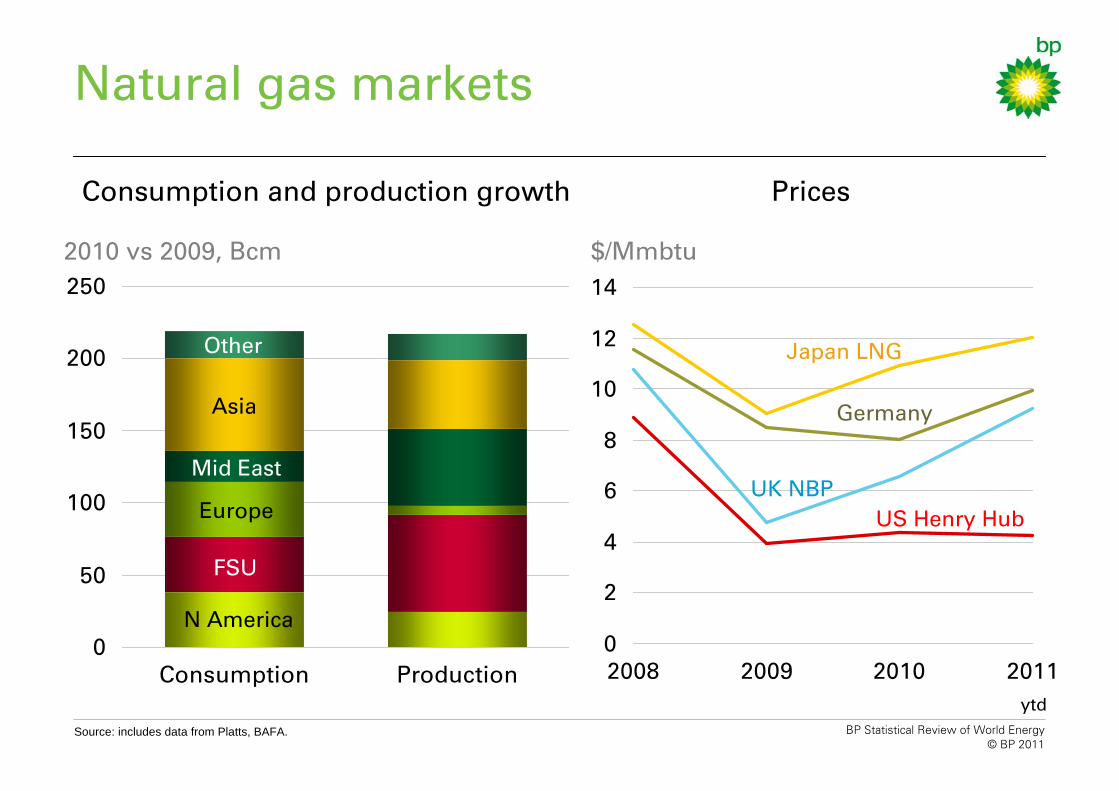
0
50
100
150
200
250
Consumption Production0
2
4
6
8
10
12
14
2008 2009 2010 2011
Natural gas markets
PricesConsumption and production growth
$/Mmbtu
Source: includes data from Platts, BAFA.
Germany
Japan LNG
UK NBPUS Henry Hub
2010 vs 2009, Bcm
N America
FSU
Europe
Mid East
Asia
Other
ytd
BP Statistical Review of World Energy© BP 2011
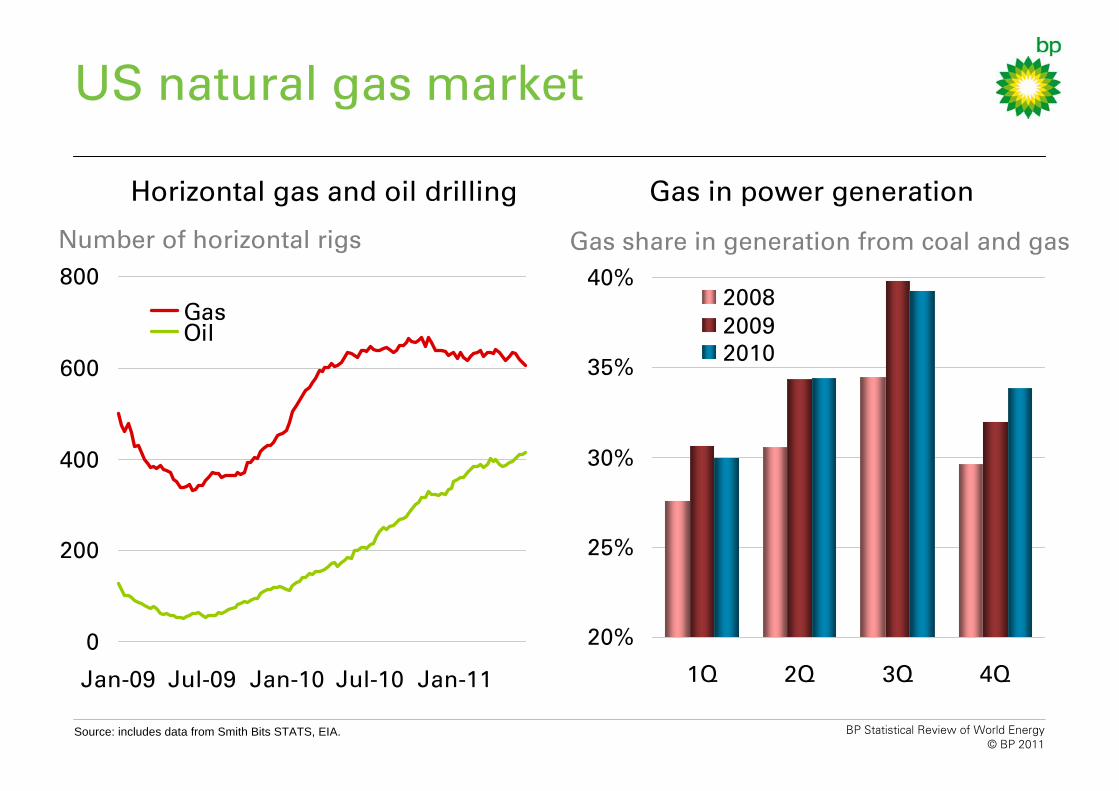
0
200
400
600
800
Jan-09 Jul-09 Jan-10 Jul-10 Jan-11
GasOil
Horizontal gas and oil drilling Gas in power generation
Number of horizontal rigs
US natural gas market
Source: includes data from Smith Bits STATS, EIA.
20%
25%
30%
35%
40%
1Q 2Q 3Q 4Q
200820092010
Gas share in generation from coal and gas
BP Statistical Review of World Energy© BP 2011
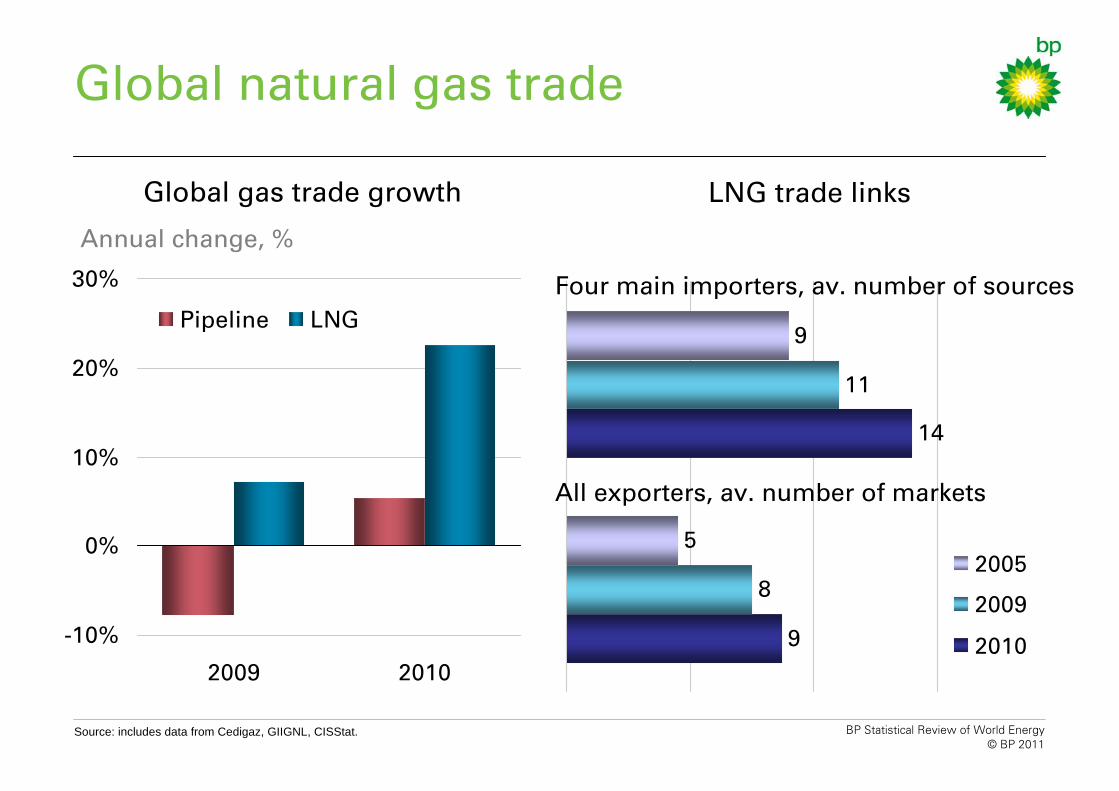
-10%
0%
10%
20%
30%
2009 2010
Pipeline LNG
Global gas trade growth LNG trade links
9
14
8
11
5
9
2005
2009
2010
Four main importers, av. number of sources
Annual change, %
Global natural gas trade
Source: includes data from Cedigaz, GIIGNL, CISStat.
All exporters, av. number of markets

BP Statistical Review of World Energy© BP 2011
0
3
6
9
12
15
1Q07 1Q08 1Q09 1Q10 1Q11
Av. German Import PriceUK NBP
-20%
-10%
0%
10%
20%
30%
40%
1Q07 1Q08 1Q09 1Q10
LNG Pipeline
OECD Europe natural gas market
Source: includes data from Platts, BAFA, Monthly Gas Data Service © OECD/International Energy Agency May 2011.
Annual change, %$/Mmbtu
Prices Import growth

BP Statistical Review of World Energy© BP 2011
0
10
20
30
40
1Q09 3Q09 1Q10 3Q10 1Q11
0
8
16
24
32RoWIndonesiaAustralia
-200
-100
0
100
200
300
2006 2008 2010
RoW
EU
US
India
China
Mtoe
Consumption changes China’s imports
Coal consumption and imports
Mtes $/te
Price spread* (rhs)
Source: includes data from IHS CERA, IHS McCloskey. *Spread between China’s Qinhuangdao and Australia’s Newcastle coal prices.
BP Statistical Review of World Energy© BP 2011
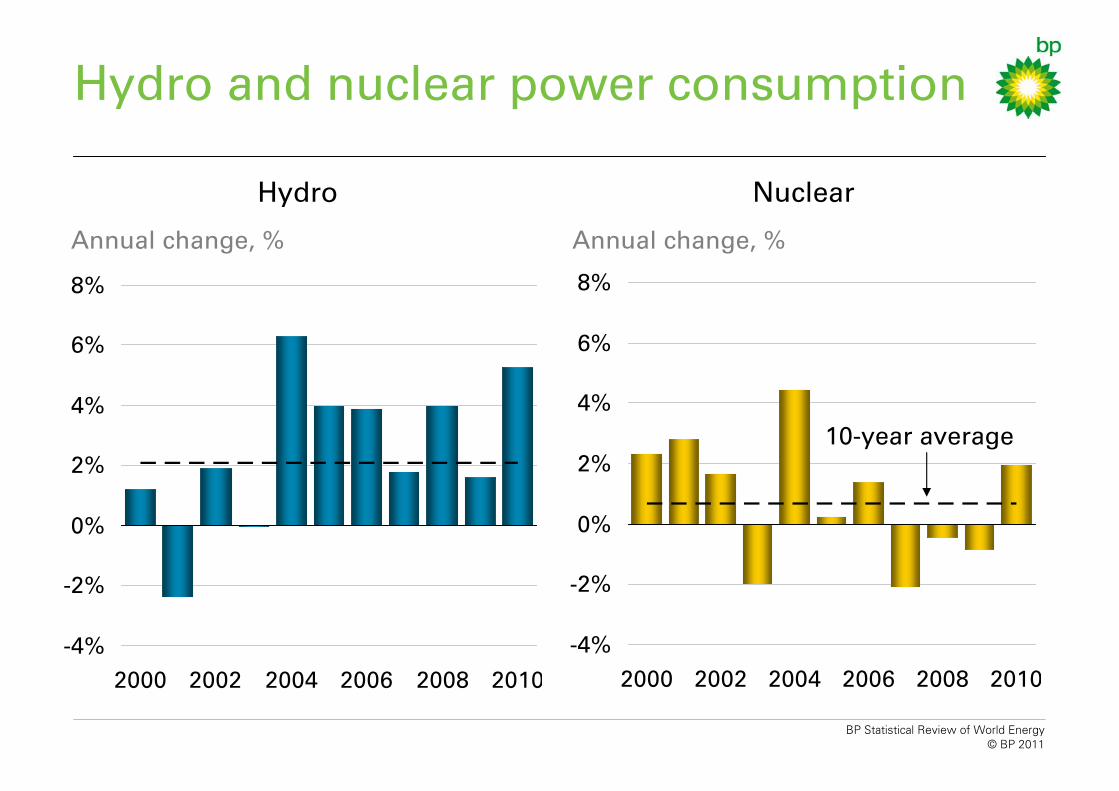
-4%
-2%
0%
2%
4%
6%
8%
2000 2002 2004 2006 2008 2010-4%
-2%
0%
2%
4%
6%
8%
2000 2002 2004 2006 2008 2010
Hydro and nuclear power consumption
Hydro Nuclear
Annual change, % Annual change, %
10-year average
BP Statistical Review of World Energy© BP 2011
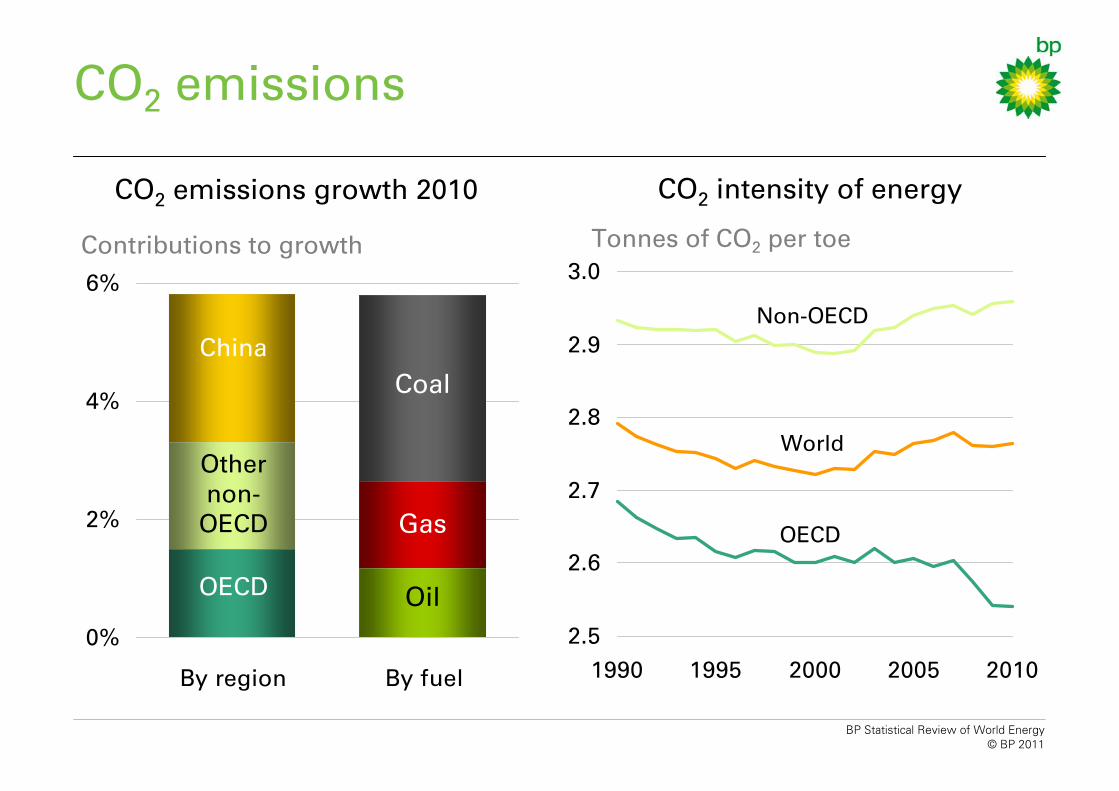
0%
2%
4%
6%
By region By fuel
CO2 emissions
Contributions to growth
CO2 emissions growth 2010
Coal
Gas
Oil
China
OECD
Other non-
OECD
2.5
2.6
2.7
2.8
2.9
3.0
1990 1995 2000 2005 2010
CO2 intensity of energy
Tonnes of CO2 per toe
Non-OECD
World
OECD
BP Statistical Review of World Energy© BP 2011
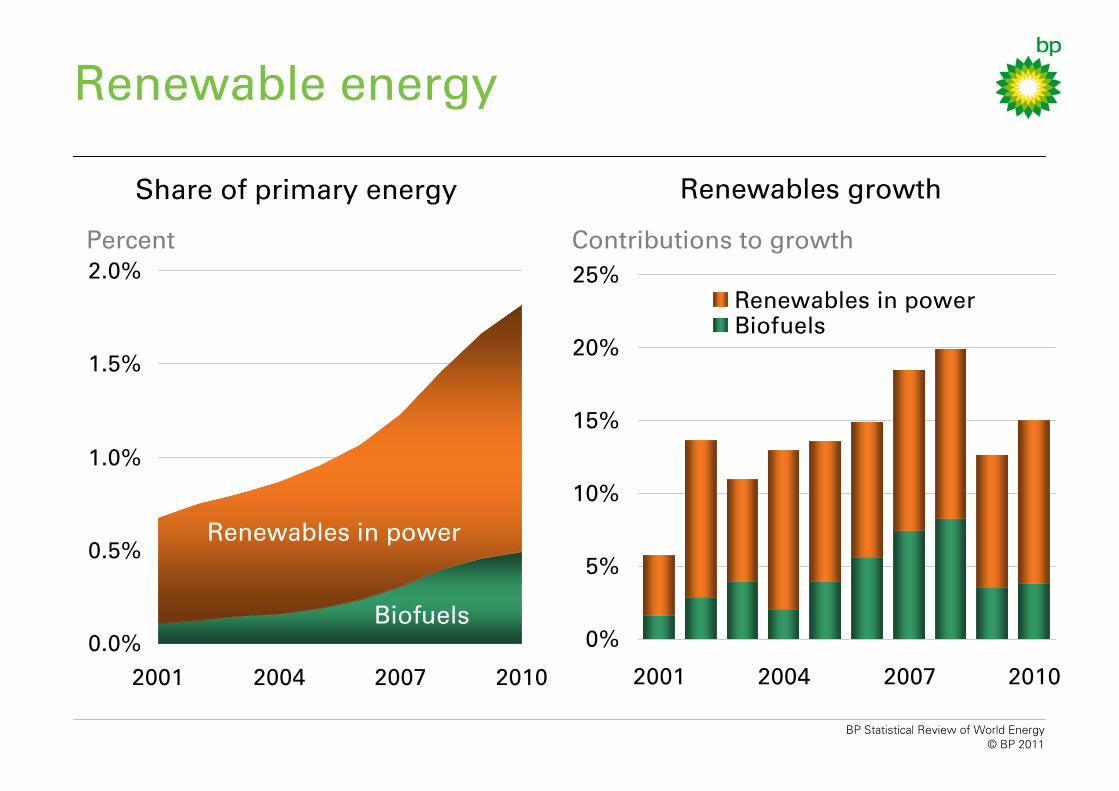
0%
5%
10%
15%
20%
25%
2001 2004 2007 2010
Renewables in powerBiofuels
0.0%
0.5%
1.0%
1.5%
2.0%
2001 2004 2007 2010
Renewable energy
Percent Contributions to growth
Renewables in power
Biofuels
Share of primary energy Renewables growth

BP Statistical Review of World Energy© BP 2011
0%
2%
4%
6%
2000 2002 2004 2006 2008 2010
WorldOECDNon-OECD
Renewables in power
Percent0% 10% 20% 30%
Denmark
Portugal
NewZealand
Spain
Philippines
Germany
Percent
Share of power generation Share of power generation in 2010
BP Statistical Review of World Energy© BP 2011
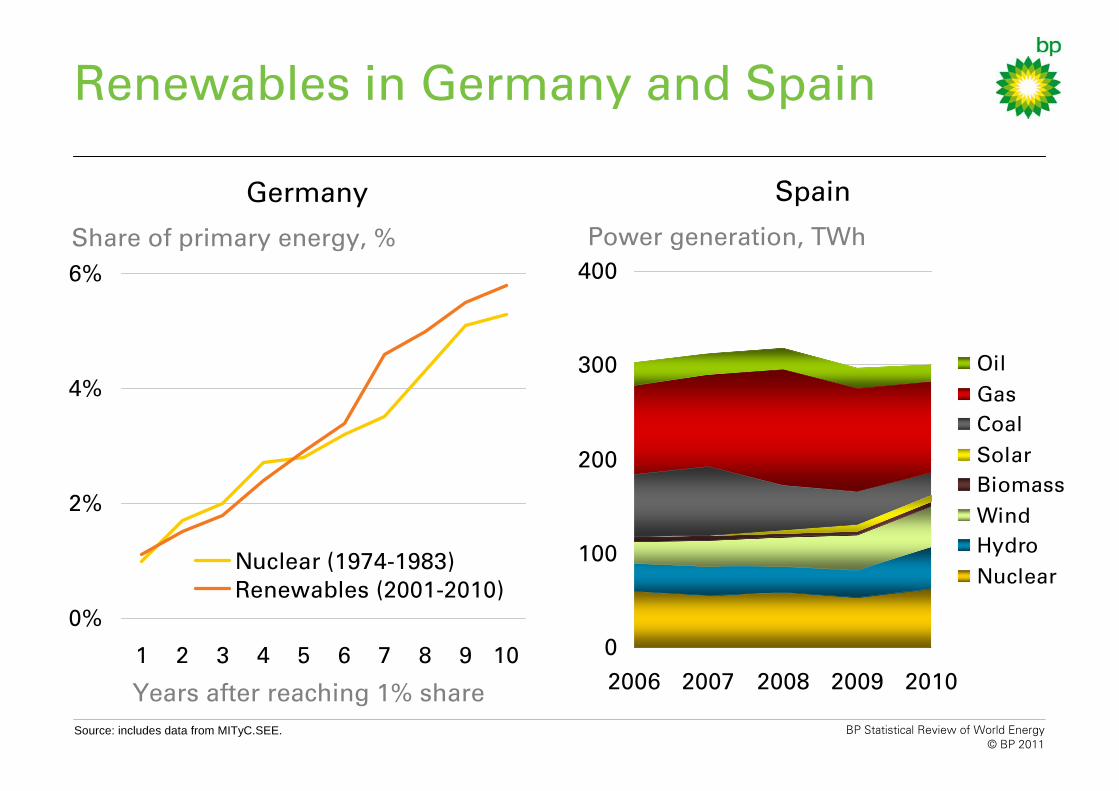
0%
2%
4%
6%
1 2 3 4 5 6 7 8 9 10
Nuclear (1974-1983)Renewables (2001-2010)
Renewables in Germany and Spain
Share of primary energy, %
Germany
Years after reaching 1% shareSource: includes data from MITyC.SEE.
0
100
200
300
400
2006 2007 2008 2009 2010
OilGasCoalSolarBiomassWindHydroNuclear
Power generation, TWh
Spain
BP Statistical Review of World Energy© BP 2011
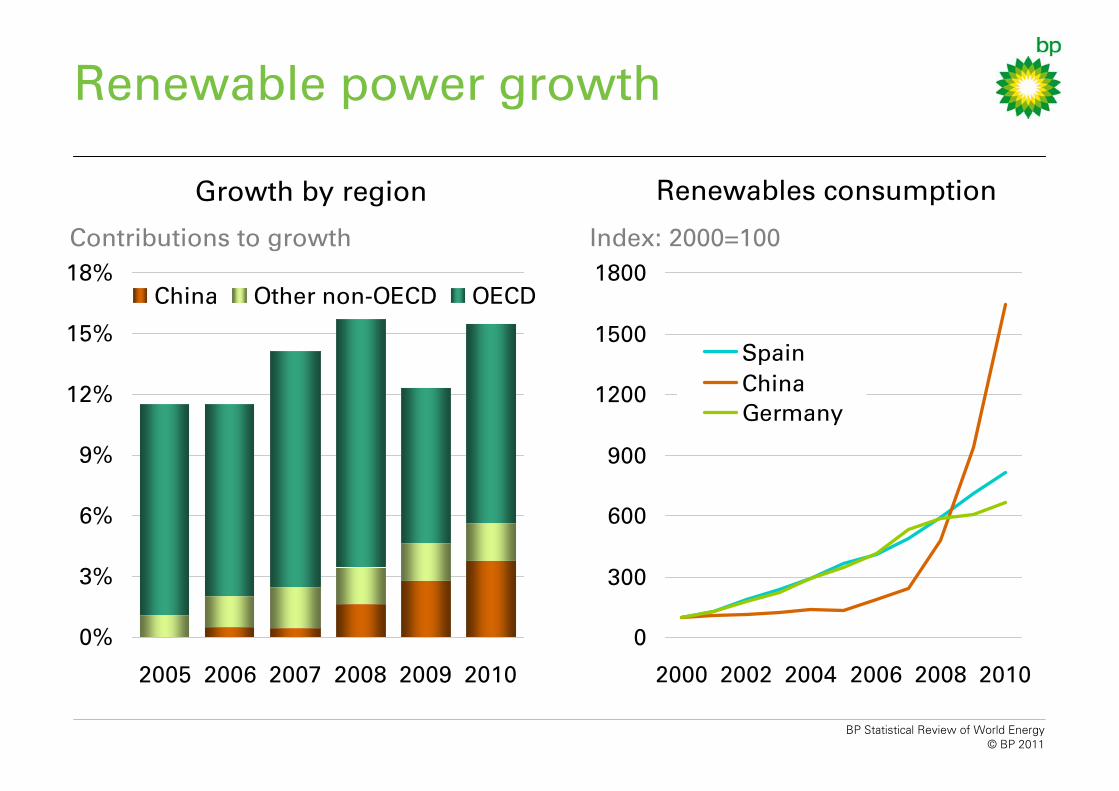
0%
3%
6%
9%
12%
15%
18%
2005 2006 2007 2008 2009 2010
China Other non-OECD OECD
Renewable power growth
Contributions to growth
Growth by region
0
300
600
900
1200
1500
1800
2000 2002 2004 2006 2008 2010
SpainChinaGermany
Index: 2000=100
Renewables consumption

BP Statistical Review of World Energy© BP 2011
100
400
700
1000
1950 1970 1990 2010
GDPEnergyCO2
60 years of energy
Percent Index: 1950=100
World GDP, energy and emissions
0%
20%
40%
60%
1950 1970 1990 2010
OilCoalGasHydroNuclearRenew
World fuel shares
Source: includes data from Oxford Economics; Etemad, Luciani, Bairoch, and Toutain, 1991; Maddison, 2009.

bp.com/statisticalreview
© BP 2011
2010 – Energy Rebounds
60 years
BP Statistical Review of World EnergyJune 2011
Q & A: Kevin Goodwin

© BP 201160 yearsBP Statistical Review
Thank you