bpc presentation 2014 -...
TRANSCRIPT

Presentation 4th December 2014
1

Executive summary
Banco de Poupança e Crédito SA (“BPC”), 75% owned by the government of Angola, is the second largest bank in Angola by gross loans with lending activities focused on SMEs (circa 2/3 of the loan book) and retail (1/3)
BPC has a very strong franchise (16% market share in banking sector wide deposits), and the largest banking network in the country covering the entire territory of Angola with 359 branches (#1 position) and 6.844 counters (#2 position)
BPC’s credit strength is underpinned by its solid profitability, access to stable funding mainly consistent of deposits, as well as an adequate risk-adjusted capitalization
BPC is not rated, but benefits from a track record of Angolan government (BA3/BB-/BB-) support. Over 80% of salaries of Angolan civil servants are paid into BPC accounts
2
_________________________________________________________________________

Agenda
3
_________________________________________________________________________
Executive Summary1
BPC Overview and Strategy3
Angolan Economy and Banking Sector Overview 2
Key Investment Highlights4
Financial Highlights5

Angola Economy Overview (1/3)
Angola, rated BA3/BB-/BB- (Moody’s/S&P/Fitch), is the thirdlargest oil producer in Africa (globally16th) at 1.8m bbl/day andthird largest diamond producer in the world
The oil price collapse in late 2008 led to a sharp fall in real GDPgrowth. But the economy has since rebounded: with the recoveryin oil prices and expenditure restraints, Angola now appears to bein full recovery mode and back to its impressive growth rates
Angola’s external finances are a key strength with usable FXreserves and current account receipts entirely covering grossfinancing needs• The Banco Nacional de Angola’s (BNA) net international reserves
fell from around $20bn in 2008 to $13.2bn in 2009 but have sincerecovered to $30.9bn
• Current account balance is expected to be 4.1% of GDP by year end Angola has a good reputation within the oil industry, primarily for
maintaining existing oil contracts, and a good degree of political stability
4
_________________________________________________________________________
Overview of the Angolan economy: Key macroeconomic indicators:
Economy is on a path of strong recovery... … And has benefited from a positive credit momentum in 2011
2011 2012 2013 2014 E 2015 E 2016 E
Population (m) 19.6 20.2 20.8 21.4 22.1 22.8
Real GDP Growth Rate 3.9% 5.2% 6.8% 3.9% 5.9% 6.2%
GDP / Capita ($) 5,305 5,706 5,964 6,128 6,418 6,682
Inflation Rate 13.5% 10.3% 8.8% 7.3% 7.3% 7.0%
Current Account Balance / GDP 12.6% 11.6% 5.5% 4.1% 2.0% -0.1%
Gvt. Gross Debt / GDP 32.2% 29.6% 34.6% 38.4% 37.8% 37.4%
Oil Exports / GDP 64.8% 69.3% 66.7% 64.9% 65.4% 64.6%
Investment / GDP 12.9% 14.9% 14.7% 14.8% 14.6% 14.1%
Angola Gabon Mozambique Nigeria
Real GDP growth (y-o-y % change)
Angola(BA3 /BB-/BB-)
Gabon(NR/BB-/BB-)
Mozambique (B1/B/B+)
Nigeria(BA3/BB-/BB-)
Rating upgrades 2013
Source: IMF Database, Oct 14 and BNA
1.0
1.0
1.0
0.0
0.0
0.0
0.0
0.0
0.0
1.0
1.0
1.0
0.00.20.40.60.81.01.2
Moo
dy`s
S&P
Fitch
Moo
dy`s
S&P
Fitch
Moo
dy`s
S&P
Fitch
Moo
dy`s
S&P
Fitch
3.9%
5.2%
6.8%
3.9%
6.9%
5.5%
5.6%
5.1%
7.3%
7.2%
7.1% 8.
3%
4.9%
4.3% 5.
4%
7.0%
0.0%
2.0%
4.0%
6.0%
8.0%
10.0%
2011
2012
2013
2014E
2011
2012
2013
2014E
2011
2012
2013
2014E
2011
2012
2013
2014E

Angola Economy Overview (2/3)
5
_________________________________________________________________________
Government finances highlights: Low government gross debt (% of GDP)
The current account balance has strengthened... … As oil exports have rebounded
Current account balance as % GDP
Government revenues rely heavily on oil, with around 75% ofrevenues coming from oil and oil-related activities
The country ran healthy current account surplus since 2010, before turned into deficit in 2009 owing to lower oil prices.
In addition to a current account surplus, the financial account islikely to yield an ample supply of foreign exchange in the years ahead
The financial account has been rising public sector external borrowing from commercial and bilateral lenders, but this has been complemented by FDI
Gross general government debt is relatively low at an estimated 38% of GDP in 2014
Source: OPEC, BNA and IMF Database
Debt % lower than peer average in 2012
Angola(BA3 /BB-/BB-)
Gabon(NR/BB-/BB-)
Mozambique (B1/B/B+)
Nigeria(BA3/BB-/BB-)
Total oil exports and average Angolan oil price
12.6%11.6%
5.5%4.1%
2.0%
0.0%
2.0%
4.0%
6.0%
8.0%
10.0%
12.0%
14.0%
2011 2012 2013 2014E 2015E
32.2%29.6%34.6%
38.4%
17.3%18.5%18.8%18.5%
39.6%42.7%
47.8%51.4%
10.2%10.4%10.4%10.6%
2011
2012
2013
2014E
2011
2012
2013
2014E
2011
2012
2013
2014E
2011
2012
2013
2014E
$40,8bn $50,6bn $65,7bn $70,9bn $65,4bn
$110 $111 $107 $108 $106
$‐
$20.0
$40.0
$60.0
$80.0
$100.0
$120.0
2011 2012 2013 2014E 2015E
Angola Economy Overview (3/3)
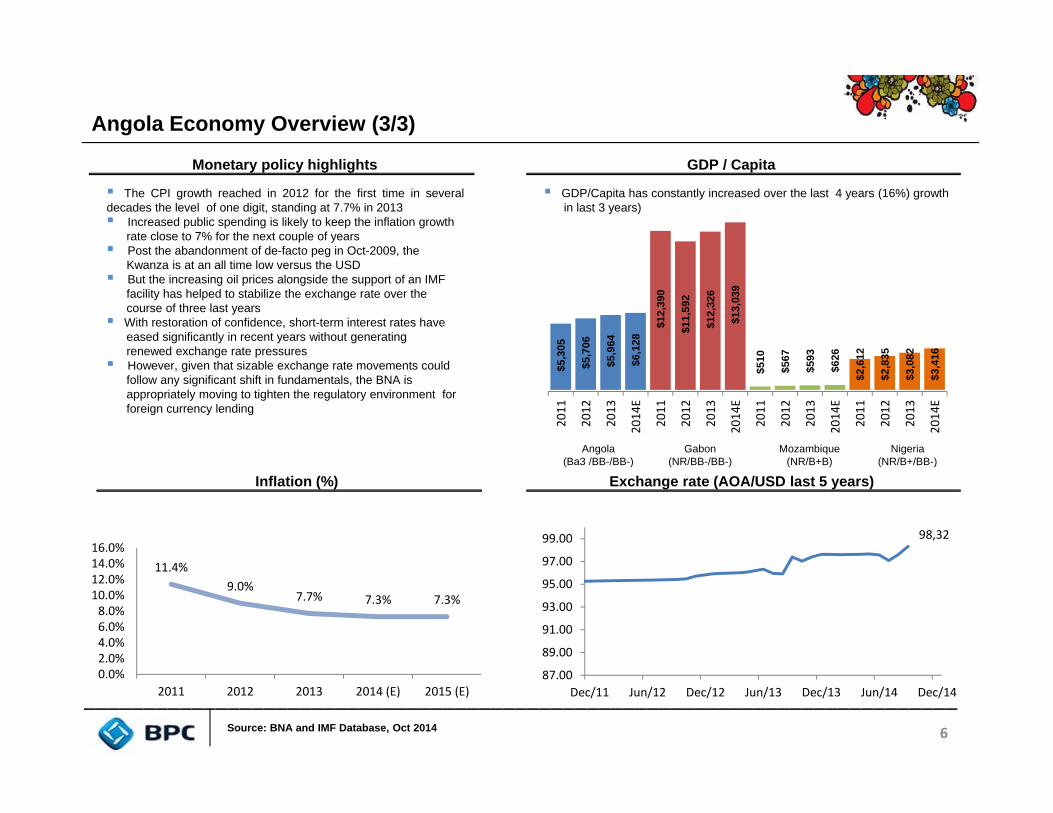
The CPI growth reached in 2012 for the first time in severaldecades the level of one digit, standing at 7.7% in 2013 Increased public spending is likely to keep the inflation growth
rate close to 7% for the next couple of years Post the abandonment of de-facto peg in Oct-2009, the
Kwanza is at an all time low versus the USD But the increasing oil prices alongside the support of an IMF
facility has helped to stabilize the exchange rate over thecourse of three last years
With restoration of confidence, short-term interest rates haveeased significantly in recent years without generatingrenewed exchange rate pressures
However, given that sizable exchange rate movements couldfollow any significant shift in fundamentals, the BNA isappropriately moving to tighten the regulatory environment forforeign currency lending
6
_________________________________________________________________________
Monetary policy highlights GDP / Capita
Inflation (%) Exchange rate (AOA/USD last 5 years)
Source: BNA and IMF Database, Oct 2014
GDP/Capita has constantly increased over the last 4 years (16%) growth in last 3 years)
Angola(Ba3 /BB-/BB-)
Gabon(NR/BB-/BB-)
Mozambique (NR/B+B)
Nigeria(NR/B+/BB-)
98,32
87.00
89.00
91.00
93.00
95.00
97.00
99.00
Dec/11 Jun/12 Dec/12 Jun/13 Dec/13 Jun/14 Dec/14
11.4%9.0%
7.7% 7.3% 7.3%
0.0%2.0%4.0%6.0%8.0%
10.0%12.0%14.0%16.0%
2011 2012 2013 2014 (E) 2015 (E)
$5,3
05
$5,7
06
$5,9
64
$6,1
28 $1
2,39
0
$11,
592
$12,
326
$13,
039
$510
$567
$593
$626
$2,6
12
$2,8
35
$3,0
82
$3,4
16
2011
2012
2013
2014E
2011
2012
2013
2014E
2011
2012
2013
2014E
2011
2012
2013
2014E

Angolan banking sector overview
The Angolan economy holds limited financial risk as the bankingsector is till relatively small through rapidly expanding• Around 52% of the population have a bank account• The bank’s deposit to GDP ratio is currently a little over 35%
7
_________________________________________________________________________
Low penetration leaves significant room for growth… Overview of the banking landscape
Demanding regulatory environment… The regulatory framework in Angola is demanding:
• The Central Bank requests high capitalisation levels (10% minimum)• The banks have transitioned into a Basel II capital framework• The regulatory supervision in the market is quite advanced with
a tight control on liquidity, interest and credit risk (reviewed on a monthly basis)
The regulatory Capital to Risk-Weighted Assets ratio was around19.5% in 2013
There are a total of 24 commercial banks currently operating in Angola• Three banks are state-owned and accounting for 20% of assets• One of the three state-owned banks is a development bank, Banco
de Desenvolvimento de Angola (BDA)• There are seven foreign-owned banks, accounting for 39% of total
banking sector assets• The five largest banks – irrespective of ownership – account for
roughly 73% of total deposits and loans With regards to where BPC is positioned in the Angolan market, its main
competitors in the corporate and retail segments are:• BAI (Banco Africano de Investimentos)• BFA (Banco de Fomento Angola)• BIC (Banco Internacional de Credito)• BESA (Banco Espírito Santo Angola)
Loans / Deposits 59% 56%
Source BPC, Banca em Análise Sep 2014 and Moody`s Credit Analysis - Angola
60% 58%
1,018 1,312 1,508
1,784
2011 2012 2013 sep‐14
Number of funcioningcards
1,503 1,851
2,173 2,362
2011 2012 2013 sep‐14
Number of ATMs
2,781 3,716 3,971 4,637
1,633 2,065 2,374 2,711
2010 2011 2012 2013Aggregate Deposits (AOA bn)Aggregate Loans (AOA bn)

Agenda
8
_________________________________________________________________________
Executive Summary1
BPC Overview and Strategy3
Angolan Economy and Banking Sector Overview2
Key Investment Highlights4
Financial Highlights5

BPC overview
9
_________________________________________________________________________
Bank history and overview: Banco de Poupança e Crédito is 100% owned by government and
government affiliates (pension and insurance funds) BPC was established in 1956 under the name “Banco Comercial de
Angola” Following the Angolan independence, the financial sector became the
responsibility of the State. From 1991, the Government started toimplement a reform of the financial sector, creating a two level systemthrough the Central Bank and independent financial institutions, leadingto the end of Banco Popular de Angola´s monopoly
The name Banco de Poupança e Crédito was established in 1991 in the context of such reforms, and at the same time the second state owned bank was established (Banco de Comércio e Industria or “BCI”)
BPC was the first bank to be granted the status of national private commercial company in post-Independence Angola
Main areas of operation:
BPC has strong ties with and holds a high exposure to the public sector,although it is increasing the diversification of its business and client base
Its customers include public corporates, small and medium size corporates, civilservants and State employees (80% of State employees bank with BPC) BPC is the principal operator of government budget, processing major
payments of goods & services BPC main segments of activity are as follows:
• Retail Lending: Lending to retail customers represents c.1/3 of portfolio• Corporate Lending: Credit extended to corporate customer represents
c.2/3 of portfolio• Investment Securities: BPC’s total investment securities portfolio
stood at $476m in 2013, of which $349m was made up of long termsecurities (of maturities of over 1 year)
Name Position Background
PaixãoAntonio Chairman and CEOJunior
Mr. Paixão has been in the Angolan banking sector since 1975. He became a board member of BPC in 1992 and was appointed as Chairman of the board and CEO in 2000
JoãoAntónio Board memberFreire
Mr. João has over 15 years dedicated banking experience, having worked in several divisionswithin the BPC. He is a board member since 2011.
Mariade Fatima Board memberHenriquesSilveira
Mrs. Fatima started her career in finance in 1978 at BNA. In 2000, she moved to BPC as Board member responsible for finance, controls and accounting
RosaSilveiroCorreiaVictor
Board memberMrs. Rosa has over 35 years dedicated banking experience, having worked in several divisionswithin the BPC. She is a board member since 2011.
RosárioSimãoJacinto
Board memberMr. Rosário was a board member at the oil company “Sonangol” for 8 years. He is a member of the board of BPC since 2011.
Key financial:
Top management and board members:
Sep-14 Dec-13 Dec-12 Dec-11Balance sheetAssets US$12.2bn US$10.1bn US$9.6bn US$7.9bnLoans US$9.1bn US$6.9bn US$6.4bn US$4.8bnDeposits US$8.8bn US$7.5bn US$6.6bn US$6.1bnIncome statementNet Income US$60m US$74m US$82m US$140mROE 6.1% 8.1% 9.4% 18.0%ROA 0.5% 0.8% 0.9% 1.9%Capital CAR (Total) 10,0% 11.0% 13.6% 14.1%
Source BPC

BPC`s organization chart
10
_________________________________________________________________________
Board ofDirectors
Paixão A. Júnior
(Chairman)
HumanResources
Audit andInspection
Treasury andMarkets
International
Marketing e Image
Regional Units
João A. Freire (Director)
Corporate
SMEs
Individuals
Micro-Finance
InvestmentBanking
Maria de Fátima D. H. da
Silveira (Director)
Organizationand Quality
InformationTechnology
ElectronicServices
Rosa J. Silvério
(Director)
Global Risk
Operations
Foreign
General Services
Rosário S. Jacinto
(Director)
Planning andManagement
Control
Accounting
Legal andLitigation
Compliance
The organizationstrucutre of BPC andthe distribution oftasks:
BPC’s mission, vision and values
11
_________________________________________________________________________
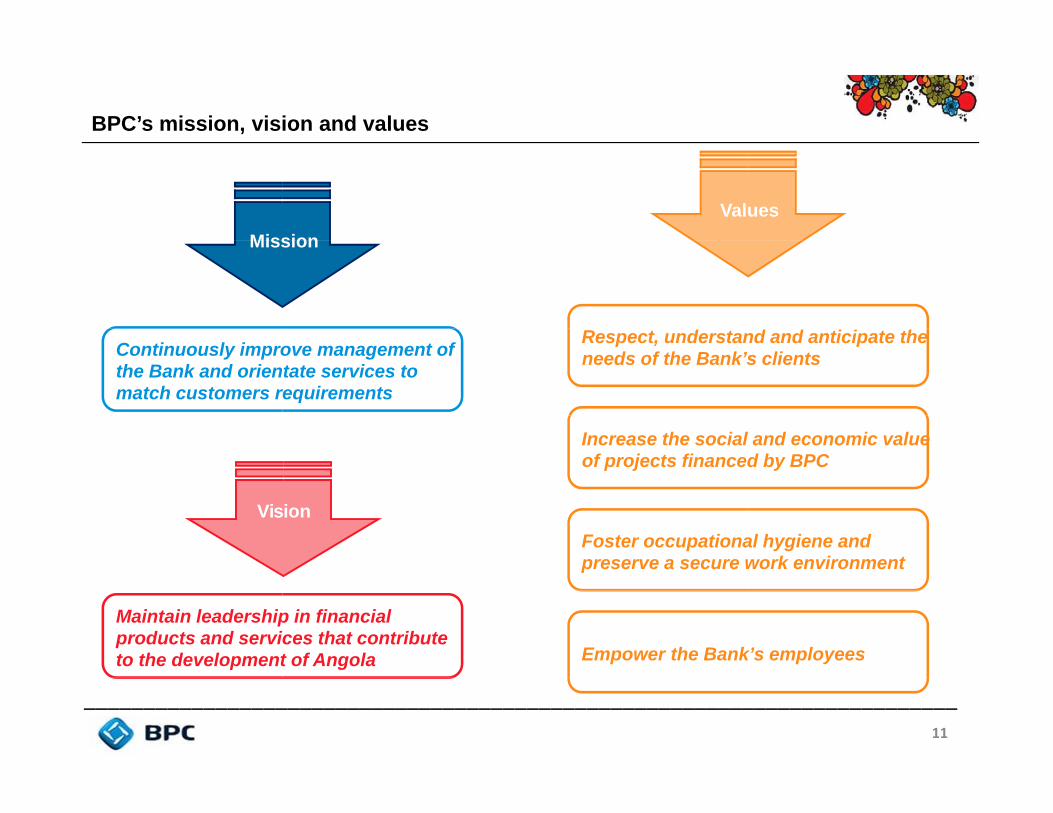
Values Mission
Respect, understand and anticipate the needs of the Bank’s clients Continuously improve management of
the Bank and orientate services to match customers requirements
Increase the social and economic value of projects financed by BPC
Foster occupational hygiene and preserve a secure work environment
Vision
Empower the Bank’s employees
Maintain leadership in financial products and services that contribute to the development of Angola
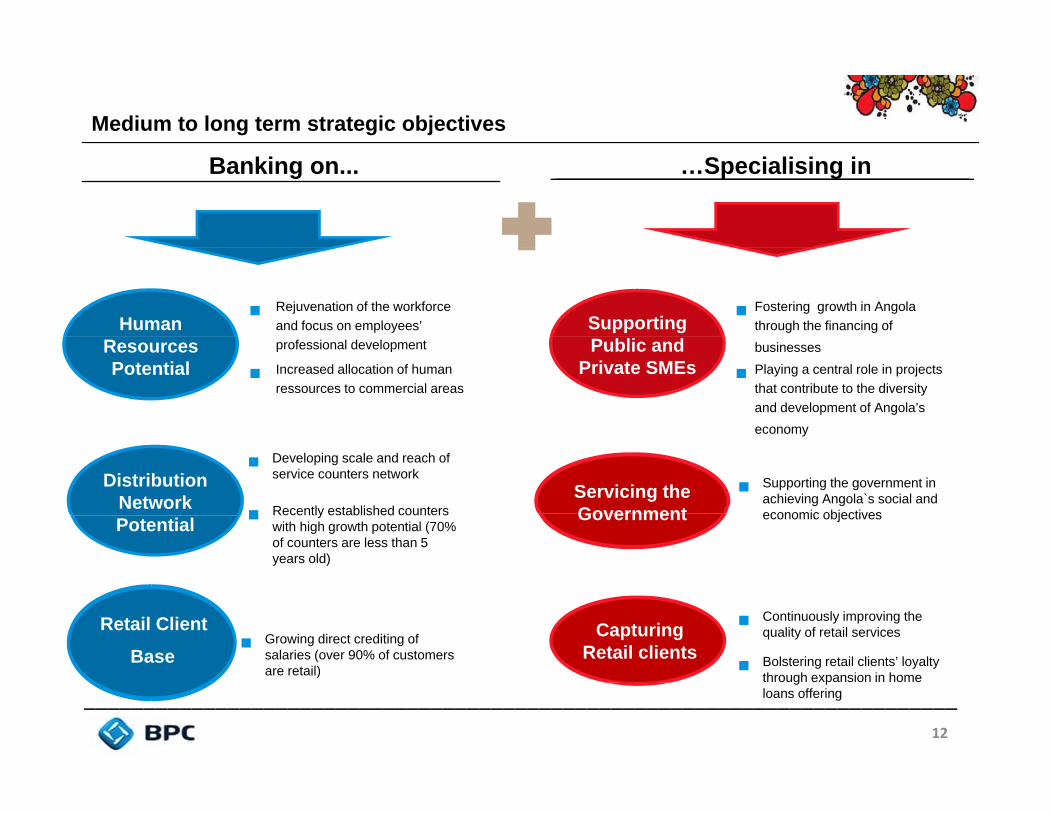
Medium to long term strategic objectives
12
_________________________________________________________________________
DistributionNetwork Potential
Retail Client
Base
Servicing theGovernment
CapturingRetail clients
Banking on... …Specialising in
Human Supporting Fostering growth in Angola through the financing of
Rejuvenation of the workforceand focus on employees’
ResourcesPotential
Public and Private SMEs
businesses
Playing a central role in projectsthat contribute to the diversityand development of Angola’s
professional development
Increased allocation of humanressources to commercial areas
economy
Developing scale and reach ofservice counters network
Recently established counterswith high growth potential (70% of counters are less than 5 years old)
Growing direct crediting ofsalaries (over 90% of customersare retail)
Supporting the government in achieving Angola`s social andeconomic objectives
Continuously improving thequality of retail services
Bolstering retail clients’ loyalty through expansion in home loans offering

BPC’s Projects
13
_________________________________________________________________________
Internationaliza-tion of the BPC
• BPC set as a priority target for its internationalization process, the Republic of Namibia
Getting Rating
• BPC has been evaluating the possibility of hiring advisory services of financial institutions with high experience in the field, to be convened later a rating agency
Factoring andLeasing
• In order to diversify its range of financial products and its portfolio of assets, the BPC intends to implement Leasing and Factoring
Creation of Bankof Micro-Finance
• With a view to ensure greater involvement in the government programs against poverty and to reduce regional asymmetries, BPC intends to create a Bank of Micro‐Finance in 2015
ContractingForeign
Financing Lines
• BPC is negotiating a set of financing lines with: AfDB - USD 325 million for financing SMEs; VTB Capital - USD 620 million
Bond Issue
• BPC elected a strategy for issuing bonds at an amount not less than USD 30 million

BPC role in the development of economy
14
_________________________________________________________________________
BPC as the largest public bank in the country plays an important role in providing financial services to institutional, corporate and private clients, and is assumed to be social partner of the state in the increase of productive capacity, regulation of economic life and improving quality of life.
The Bank's operating strategy in the market is based on three main axes:
• The business sector, and in particular small and medium enterprises;
• Individuals, because they represent more than 95% of the Bank's customer base;
• The Angolan State, supporting the achievement of economic and social policies, especially those relating to economic diversification, the development of the national business and combating poverty, where the activity of micro-credit has a particular importance (Loans granted by BPC under micro-credit programs reached in September 2014 around $300 million).

15
_________________________________________________________________________
To promote the business class and raise production levels, BPC signed with the Angolan government, the memo for operationalization of subsidized credit line and guarantee fund under the development programme of micro, small and medium enterprises, designated "Angola Invest“.
Breakdown of Microcredit by Programme
BPC role in the development of economy

Agenda
16
_________________________________________________________________________
Executive Summary 1
BPC Overview and Strategy 3
Angolan Economy and Banking Sector Overview 2
Key Investment Highlights 4
Financial Highlights 5

17
_________________________________________________________________________
State bank benefiting from government support but the independence of a private financial institution
The government has a track record of providing support through capital injections to facilitate the bank`sexpansion…
BPC underwent a capital increase in August 2010, where Instituto de Segurança Social increased its stake from 1% to 15% • Instituto Nacional de Segurança Social (“INSS”) provides social security payments to Angolan citizens, including pensions• The INSS provides payments to more than 83,000 pensioners and 700,000 other claimants
As a result of the 2010 capital increase the Army Pension Fund increased its stake to 10%• The Army Pension Fund falls under the remit of the Ministry of Defence. It was established to provide support for retired and
fighters (and family members). As at August 2010 it provided support to 300,000 ex-military personnel and their families The government has start to collect dividends only from 2011
Social Security Institute15%
Angola State75%
Army Pension Fund10%
…While BPC follows stringent regulatory requirements and maintains the independence of a private institution
Governed by BNA rules: • The role of the BNA is similar to that of any developed country Central Bank, whereby
it imposes stringent rules on concentration risk, limit risk and credit risk• BPC is not only positioned as a leading bank in Angola but is also subject to the
regulatory framework in line with banking practices of an international standard BPC operates an independent underwriting process:
• Underwriting mandates are entirely at the discretion of the Bank as opposed to being governed or forced by other external factors
BPC aims to further reduce exposure to and reliance on the public sector and initiate a shift towards private sector focus• In this respect, BPC has decreased the proportion of deposits due to public sector from
53% in 2008 to 35% in September 2014 (largely by attracting private deposits )
Source: BPC

18
_________________________________________________________________________
Extensive network: largest country-wide branch network with leading market position (1/2)
BPC’s strength as one of the leading banks in Angola is underpinned by the largest banking network in thecountry
The Bank has a market share of 23% in terms of lending, 359 branches (#1 position) and 6.844 banking counters (#2 position) is one of a few institutions covering the entire territory of Angola
359
Branches
6.844BankingCounters
Source: BPC and peer banks latest annual report
Geographical Distribution of NetworkTrend in Distribuition Network
6 9
18
13
7
13
8
17
30
1613
813
7
141
16
6 9
6

19
_________________________________________________________________________
Extensive network: largest country-wide branch network with leading market position (2/2)
Gross loans (Dec 13) Bank Total ($bn) Market Share
Deposits (Dec 13) Bank Total ($bn) Market Share
Strong position on Angolan market
9,1%
7,3%
22,9%
23,5%
9,3%
Source: BPC and peer banks latest annual report
19,5%$9.2bn
$7.6bn
$7.5bn
$6.2bn
$3.6bn
BAI
BFA
BPC
BIC
BESA
16,5%
15,8%
13,3%
5,8%
$7.8bn.
$6.9bn
$5.5bn
$1.5bn
$2.5bn
BESA
BPC
BIC
BFA
BAI

20
_________________________________________________________________________
Delivering on loan growth while maintaining prudent coverage through deposits…
Loans represent 69% of assetscompared to peer average of 36%
Key features of loans extented: Breakdown of Loans by Maturity and Sector (Sep-14):
Focus on lending with potential for significant growth
Loans / DepositsRatio
Lending to corporates mainly encompasses semi and fully state-owned companies or companies that are dependent on public contracts (outsourcing partners for the government / state) • Exposure per client is limited to 25% of the capital, while debt
the 20 largest borrowers should not exceed 300% of capital• Lending to retail customers includes small accounts• BPC does not lend more than a third of total salary (a maximum
internal cap)• The majority of customers represent civil servants and
significant proportion have part of their salary directly pledged with employee
• These loans will also typically include a mandatory insurance policy to cover for basic needs (accident, illness, unemploymentetc)
• BPC has the ability to check the debt profile of each individual it considers lending to through the national database
79% 97% 92% 103%
Source: BPC and peer banks latest annual report
Loans as % ofAssets (Dec-13)
29%
10%8%
53%
1Up to 1 year
1 to 3 years
3 to 5 Years
Over 5 Year
40%
26%
13%9%
3%4%
Sep‐14IndividualsTradeServicesConstructionTransportIndustryAgriculture, FisheriesHotel and Turism
19%59%
47%69%
40%40%
34%36%
24%17%
51%37%
70%50%
28%
BCABMFBNI
BPC (Sep-14)BRK
FinibancoBIC
BMABAI
BFABPASOL
BESABCI
Banc
$4,8bn
$6,4bn $6,9bn
$9,1bn
2011 2012 2013 Sep‐14

Approximately 81% of NPLs are from corporate and haveresources on public entities given most of BPC counterparties aregenerally working for government owned entities
NPLs are mostly driven by late payment of the administration/publicsector. NPLs are substantially reduced after 3 months
The NPL ratio increased up to 20.3% in September 2014 due todelayed payments from the Angolan Government
21
_________________________________________________________________________
NPLs mainly driven by public sector delays… Additional cushion created by Basel II rules…
Solid asset quality coupled with a conservative provisioning policy
Source: BPC
BPC introduced general provisioning following theimplementation of new Basel II rules which has created anadditional cushion of coverage against NPLs
NPL ratio over time
Coverage ratio evolution
Evolution of stock of provisions
11.3% 11.3%
8.0%7.1%
2011 2012 2013 Sep-14
$538m
$721m
$555m$642 m
2011 2012 2013 Sep‐14
8.5%
16.1% 17.6%20.3%
2.8%
8.2%10.2%
15.4%
0.0%
5.0%
10.0%
15.0%
20.0%
25.0%
2011 2012 2013 Sep-14
NPL Ratio NPL Ratio less 90dpd loans

BPC is largely self-funded and does not rely on wholesale funding through it has access to debt capital markets
22
_________________________________________________________________________
Deposits account for 68% of liabilities …And strong deposit growth projected to continue
Lengthening maturity of deposits… …And diversified deposit base including captive public clients
Self-funded through a sticky and continuously growing deposit base
Deposits developement
BPC had an increase in its deposit base of 17% in September 2014, largely due an increase in penetration
Over 80% of salaries of Angolan civil servants are paid into BPC accounts
BPC is implementing a new tax efficient deposit products with maturities from 6m to 3 years that contribute to extending local currency funding duration
Breakdown of liabilities (Sep-14)
Breakdown of deposits by client type (Sep-14)
Total: $12.2bn
Breakdown of deposits by maturity
Source: BPC
$6,1bn $6,6bn $7,5bn
$8,8bn
$‐
$2.0
$4.0
$6.0
$8.0
$10.0
2011 2012 2013 Sep‐14
Total Net Equity 9% Interbank
Funding 9%
Obligations on the payment
Systems 4%Deposits 68%
Other Liabilities 9%
59% 53% 48% 44%
41% 47% 52% 56%
2011 2012 2013 Sep-14
Demand Term
Individuals, 18%
Business Pub. Sector,
22%
Business Priv. Sector,
26%
Administrative Pub.
Sector, 35%

23
_________________________________________________________________________
strong links in the international financial market

24
_________________________________________________________________________
strong links in the international financial market
Direct Financing Amount
Firstrand Bank U$ 100 MDeutsche Bank U$ 15 M + € 16.5 M
Credit Facilities with Payment to the ExporterSantander € 250 MBHF Bank € 56 M
Lines of CreditFNB $ 200 MHSBC $ 110 MDeutche Bank € 20 MByblos Bank € 17.5 M
Government Credit Lines (Intermediation)Ex‐Im Bank China $ 4 BBBVA € 200 MBanesto € 100 MBNP Paribas Fortis € 525 MStandard Bank $ 200 MSocieté General $ 300 MStandard Bank $ 55.6 MDBSA $ 30 M

25
_________________________________________________________________________
Strong risk management policies and approach
The process of risk management in BPC's main objectives legal compliance and protection of solvency and profitability of the institution
In 2013, the BPC has completed the draft of the Diagnostic Function Risk Management, which aims not only involve a degree of maturity to the risk function, but set a desirable position and prepare the implementation plan for the evolving needs
In functional terms, BPC has a Department of Global Risk Management, which assists decision makers in identifying, evaluating, monitoring and controlling risks
In lending, BPC is governed by the Normative of Central Bank and has a formally approved General Regulation of Credit
The Exposure to credit risk is governed by BNA Notice No. 03/12 of 28th
March and the Statutes and Internal Regulations of the BPC The limits of competence for each decision level are previously defined Is nearing the completion of a Rating and Scoring System for the assessment
of credit risk of companies and individuals During the year 2012, the Bank created the Department of Credit Recovery
BPC focuses its activity in foreign exchange exposure limits set by Notice No. 05/2010 of 10th November of Central Bank
The supervision and monitoring of the currency position is done by examining the Foreign Exchange Exposure Report, sent on a daily basis to the BNA
On 31st December 2013, the BPC recorded a long exposure equal to 19.0% of Regulatory Capital, within the limit of 20% set by the Regulator
To mitigate the risk, the Bank made during the year 2013 the surveyprocedures in critical areas in order to define and implement operational controls in these areas
BPC created the Compliance Division on 25th November with the mandate to implement compliance policies and combating Money Laundering
Credit Risk
Foreign Exchange Risk Operational Risk
Overview
Level of risk A - Null B - Very Low C - Reduced D - Moderate E - High F - Very High G - Loss
% of Provision 0% 1% 3% 10% 20% 50% 100%
Time after entry into DefaultOperations w ith a maturityof less than tw o years
15 to 30 days 1 to 2 months 2 to 3 months 3 to 5 months 5 to 6 months more than 6 months
Operations w ith a maturityof more than tw o years 30 to 60 days 2 to 4 months 4 to 6 months 6 to 10 months 10 to 12 months more than 12 months

Agenda
26
_________________________________________________________________________
Executive Summary1
BPC Overview and Strategy3
Angolan Economy and Banking Sector Overview 2
Key Investment Highlights4
Financial Highlights 5
Summary Overview of Financials
27
_________________________________________________________________________
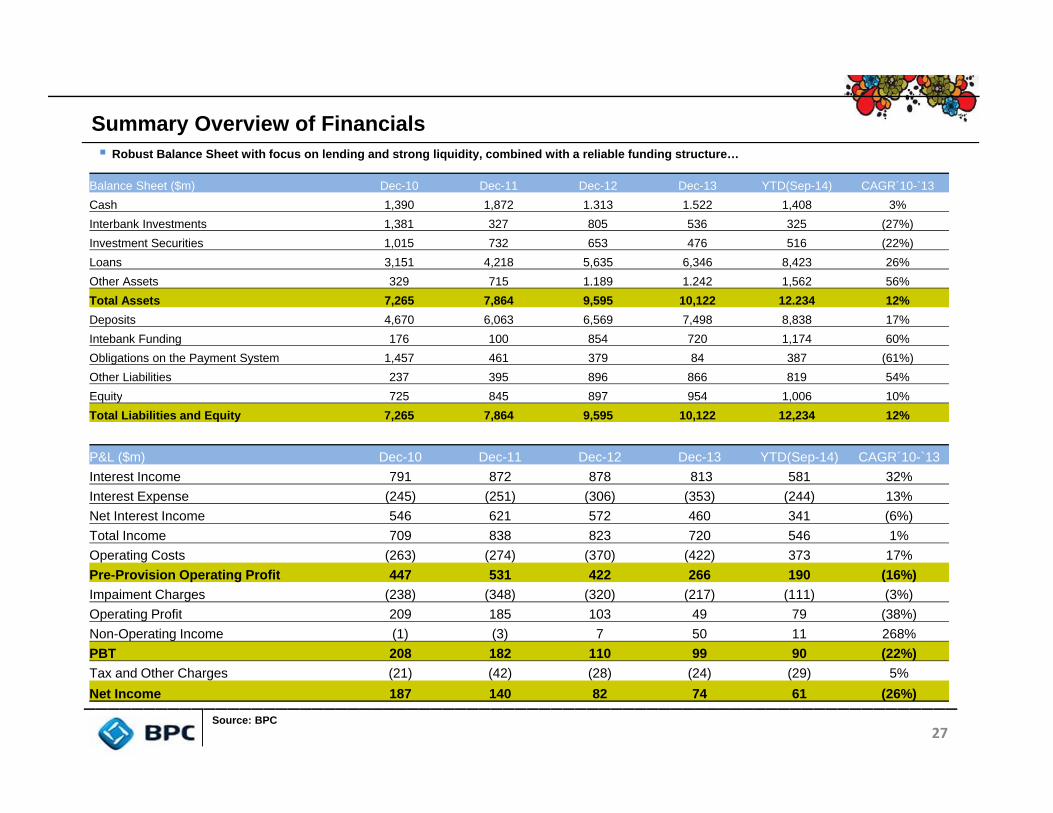
Balance Sheet ($m) Dec-10 Dec-11 Dec-12 Dec-13 YTD(Sep-14) CAGR´10-`13Cash 1,390 1,872 1.313 1.522 1,408 3%Interbank Investments 1,381 327 805 536 325 (27%)Investment Securities 1,015 732 653 476 516 (22%)Loans 3,151 4,218 5,635 6,346 8,423 26%Other Assets 329 715 1.189 1.242 1,562 56%Total Assets 7,265 7,864 9,595 10,122 12.234 12%Deposits 4,670 6,063 6,569 7,498 8,838 17%Intebank Funding 176 100 854 720 1,174 60%Obligations on the Payment System 1,457 461 379 84 387 (61%)Other Liabilities 237 395 896 866 819 54%Equity 725 845 897 954 1,006 10%Total Liabilities and Equity 7,265 7,864 9,595 10,122 12,234 12%
P&L ($m) Dec-10 Dec-11 Dec-12 Dec-13 YTD(Sep-14) CAGR´10-`13Interest Income 791 872 878 813 581 32%Interest Expense (245) (251) (306) (353) (244) 13%Net Interest Income 546 621 572 460 341 (6%)Total Income 709 838 823 720 546 1%Operating Costs (263) (274) (370) (422) 373 17%Pre-Provision Operating Profit 447 531 422 266 190 (16%)Impaiment Charges (238) (348) (320) (217) (111) (3%)Operating Profit 209 185 103 49 79 (38%)Non-Operating Income (1) (3) 7 50 11 268%PBT 208 182 110 99 90 (22%)Tax and Other Charges (21) (42) (28) (24) (29) 5%Net Income 187 140 82 74 61 (26%)
Source: BPC
Robust Balance Sheet with focus on lending and strong liquidity, combined with a reliable funding structure…

Historical Overview of Key Ratios and Metrics
28
_________________________________________________________________________
Dec-10 Dec-11 Dec-12 Dec-13 YTD(Sep-14) CAGR´10-`13
Profitability
Cost/Income 32,1% 32,7% 45,0% 58,4% 59,8% 22%
ROE 29,7% 18,0% 9,4% 8,1% 6,1% (35%)
ROA 3,0% 1,9% 0,9% 0,8% 0,5% (36%)
Funding
Loans/Deposits 76,7% 78,5% 96,8% 92,0% 102,6% 6%
Asset Quality
NPL Ratio 10,5% 8,5% 16,1% 17,6% 20,3% 19%
Coverage Ratio 12,1% 11,3% 11,3% 8,0% 7,1% (13%)
Capital
Regulatory Capital 709 831 872 925 969 9%
RWA 4.190 5.752 5.797 7.925 9.377 24%
Capital Adequacy Ratio 16,1% 14,1% 13,6% 11,0% 10,0% (12%)
Source: BPC

Summary of PSGRS Evaluation
29
_________________________________________________________________________Source: BPC
Total Points Raw Score Total Points Raw Score Total Points Raw ScoreGovernance Standards (40% weighting) 78 59 78 61 78 62Sufficient Independence from Government 12 10 12 10 12 10Management Independence and Incentives 12 5 12 5 12 4Operating in Accord with Reasonable Commercial Principles 8 6 8 6 8 6Accounting and Auditing 18 18 18 18 18 18Management Information Systems and Procedures 12 8 12 8 12 9Corporate Citizen Governance Standards 16 12 16 14 16 15Financial Prudential Standards (40% weighting) 60 42 60 48 60 50Capital Adequacy 6 5 6 5 6 6Profitability and Efficiency 10 8 10 9 10 9Asset Quality 12 10 12 12 12 11Asset Diversity and Safety 14 9 14 12 14 12Liquidity 12 5 12 5 12 7Funding 6 5 6 5 6 5Operational Standards (20% weighting) 62 48 62 46 62 51Risk Management Policies 10 8 10 8 10 9Lending Policies 16 13 16 12 16 13Loan Appraisal and Disbursement Policies and Procedures 18 14 18 13 18 13Supervision and Collection Policies 14 9 14 9 14 12Operations Strategy Policies 4 4 4 4 4 4Summary score sheet before weightingGovernance Standards (40% weighting) 78 59 78 61 78 62Financial Prudential Standards (40% weighting) 60 42 60 48 60 50Operational Standards (20% weighting) 62 48 62 46 62 51Overall Rating 200 149 200 155 200 163Summary score sheet after weightingGovernance Standards 46,2% 34,9% 46,2% 36,4% 46,2% 36,7%Financial Prudential Standards 35,5% 24,9% 35,5% 28,4% 35,5% 29,6%Operational Standards 18,3% 14,2% 18,3% 13,6% 18,3% 15,1%Overall Weighted Rating 100% 74,0% 100% 78,4% 100% 81,4%
2011 2012 2013The Standard or Guideline