bpmon data collector generic table entry counter - … data collector generic table entry counter...
TRANSCRIPT

Business Process Monitoring
Set-up and User Guide
BPMon Data Collector
Generic Table Entry Counter
Version: 1.10
Last Change: 20.09.2017 10:50

Table of Contents
1 The monitor “Table Entry Counter” (BOTABCNT) ......................................................... 2 1.1 Purpose ........................................................................................................................ 2 1.2 Technical Prerequisites ................................................................................................ 2
1.3 Setup Procedure ........................................................................................................... 3 1.3.1 Example use-case ................................................................................................. 3 1.3.2 Simulate data collector result in managed system................................................ 3 1.3.3 Setup Procedure for the Table Entry Counter ...................................................... 4
1.4 Result in Monitoring .................................................................................................. 10
1.4.1 Alert Display in SAP Solution Manager ............................................................ 10 1.4.2 Detail Display call into the managed system ..................................................... 11
1.5 Appendix ................................................................................................................... 12
1.5.1 Performance Warning ........................................................................................ 12 1.5.2 Technical Information on the SQL Queries ....................................................... 12 1.5.3 Relative Date Filtering ....................................................................................... 13 1.5.4 Required Authorizations .................................................................................... 16
1 The monitor “Table Entry Counter” (BOTABCNT)
1.1 Purpose
The generic Table Entry Counter provides the possibility to run dynamic database queries to
count the number of entries (or the number of distinct values) in any database table of a
managed ABAP system. It supports a flexible filtering based on select-options on three fields
of a table.
This monitor is therefore a substitute or workaround for areas, where no specific application
monitor is available. Furthermore, this monitor can help to avoid implementing the
application monitoring customer-exit, if the collector result can be calculated by a simple
SELECT statement.
This application monitor is part of the Business Process Monitoring framework within SAP
Solution Manager.
1.2 Technical Prerequisites
The Table Entry Counter is delivered with the add-on ST-A/PI since release 01L. The
technical name of this monitor is BOTABCNT.
All SAP Basis (NetWeaver ABAP) releases starting from 6.10 and later are supported.
This Monitor is meant to access tables in an SAP ABAP database schema only, using Remote
Function Calls to the managed system and reading the data via the ABAP stack with
OpenSQL.
If you intend to read data from a non-ABAP database schema, there is special version of this
Monitor, called “Generic Table Entry Counter for remote DB” (NATABCNX), using a direct
database connection with native SQL.
Please see further details in the “BPMon for non-ABAP Setup Guide”:
https://wiki.scn.sap.com/wiki/download/attachments/396690076/Setup_Guide_non_ABAP.pd
f?version=2&modificationDate=1460135367000&api=v2

1.3 Setup Procedure
1.3.1 Example use-case
To demonstrate the setup of the Table Entry Counter we choose a simple use-case: Goal is to
count the total number of short dumps (runtime errors) in the managed system. Additionally
we want to know the number of affected users. For simplicity reasons we do not filter by date,
so we always get total numbers.
1.3.2 Simulate data collector result in managed system
You can use transaction SE16 to clarify the selection parameters (like table name and filter
criteria). In our example, the short dumps are stored in table SNAP. As every single dump can
have multiple lines in table SNAP, we need to filter on the first entry only, which is sequence
number SEQNO=’000’.
So we get 837 short dumps from different users (field UNAME). Unfortunately, SE16 does
not allow counting the distinct values in column UNAME, but if you are interested you could
do it with transaction TAANA.

1.3.3 Setup Procedure for the Table Entry Counter
For setting up this application monitor in the Business Process Monitoring Setup, choose the
monitor “Table Entry Counter” (technical name BOTABCNT) from Application Area “Cross
Application”.
For general information, how to work in the BPMon Setup, depending on the Solution
Manager release and infrastructure used, please refer to the Setup Guides, available on
Business Process Monitoring WIKI at
https://wiki.scn.sap.com/wiki/display/SM/Business+Process+Monitoring => Media Library
=> Technical Information.

In the following description, there are screenshots from the BPMon Setup and actual
Monitoring, for SAP Solution Manager 7.1 with its WebDynpro-based user interface for
classic BPMon.
Note: If you use SAP Solution Manager 7.2 with MAI (Monitoring and Alerting
Infrastructure), the user interface looks different!
The Table Entry Counter can be assigned to a business process step or an interface step. It is
not enabled for Business Process Analytics.
[Setup in Solution Manager 7.1]

Please specify the following selection criteria:
• Table Name for the entries to be counted (it can also be a database view)
• Field Name for filtering and corresponding select-options for the actual Filter Values
o this is available three times and will be used to generate a WHERE clause
o as of ST-A/PI release 01M there are five filters available
o always use a pair of Field Name plus Filter Value(s)
1. As first parameter, enter the Table Name. The search help displays tables for a certain
wildcard pattern, which you need to input mandatorily.
As second parameter, enter the Field Name for the first filter, which obviously must be a
valid field of the selected database table. Also here a value help is available, which shows
all fields of the selected table. In our example this is field ‘SEQNO’.
In the third line, enter the select-options for the first filter. In our example, this is just one
single value ‘000’, but could also be a more complex selection, including patterns, ranges,
etc. When you have already entered the table name and the field name for filtering, the
system tries to determine an entry help from the Data Dictionary. If no search help dialog
exists, the system tries to select distinct values from the respective database table column
and offers them as entry help. If this also fails, you must enter the filter value(s) manually.
Please note to enter all values in the database format, for example the date 2008/09/24
must be entered as 20080924. Be careful when looking at values with an Application UI or
with transaction SE16, as there might be some output conversion, which does not reflect
the real storage format on the database. The Table Entry Counter is not able to apply
conversion exits (e.g. material number patterns or alpha conversions), user-specific
conversions like date and time formats or time zone calculations.
Repeat these steps for further filters if required.
Please see the appendix on how to implement a relative date filtering, using calculated
dates instead of absolute values.
[Setup in Solution Manager 7.1]
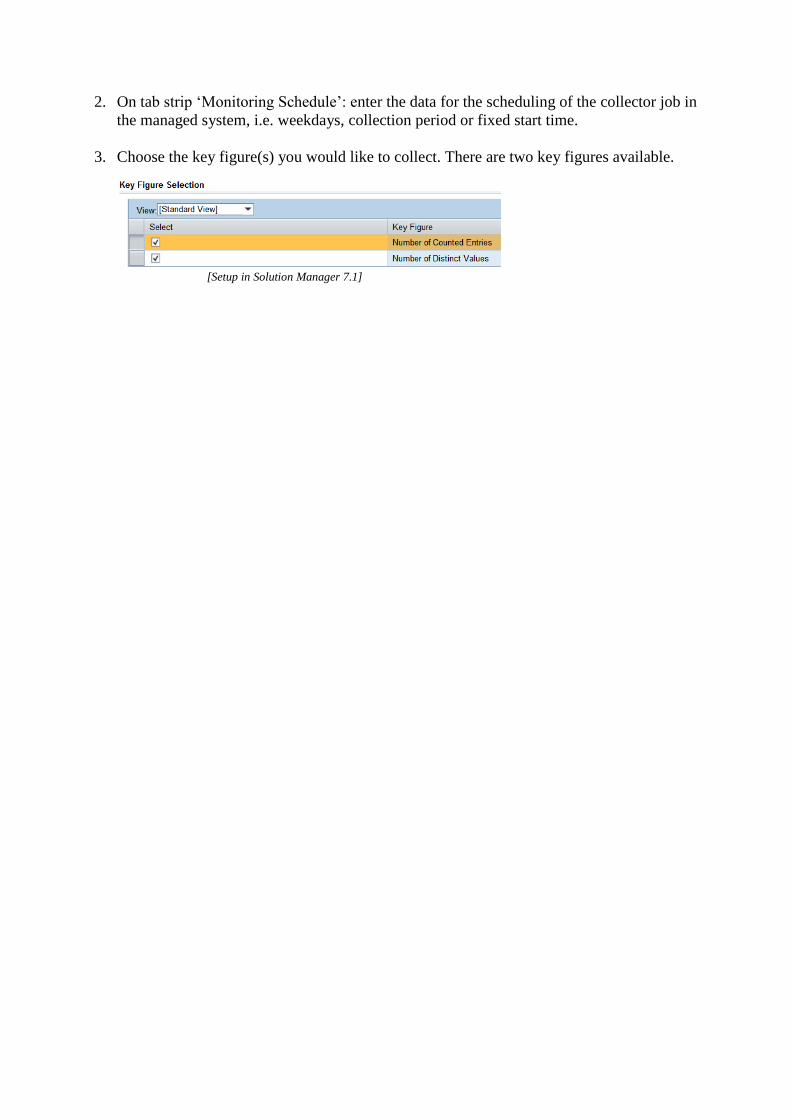
2. On tab strip ‘Monitoring Schedule’: enter the data for the scheduling of the collector job in
the managed system, i.e. weekdays, collection period or fixed start time.
3. Choose the key figure(s) you would like to collect. There are two key figures available.
[Setup in Solution Manager 7.1]

4. After selecting them, you can do additional customizing on key figure level.
• “Number of Counted Entries” (with given filter criteria)
• “Number of Distinct Values” (on single field name and with given filter criteria)
a. Enter the parameter “Distinction Fieldname”, which is the name of the
table field for which the different values are to be counted. Please make use
of the value help, which only displays valid fields of the selected.
• For each key figure, you can customize an alternative alert text, using certain
placeholder variables.
a. The standard key figure alert texts return a rather technical alert message
- “Number of entries in table <table> = <counter>”
- “Number of distinct values in field <field> of table <table> = <counter>”
This is automatically proposed if you leave the parameter “Alternative
Alerttext” empty.
b. You can use any free text together with the following placeholders to
overwrite the standard alert text with your own alert text:
- $COUNT returns the measured value from the selection
- $TABLE returns the database table name
- $FIELD returns the table’s field name
Example for our use-case
- “There are $COUNT short dumps stored in table $TABLE”
- “There are $COUNT users affected by short dumps”
[Setup in Solution Manager 7.1]
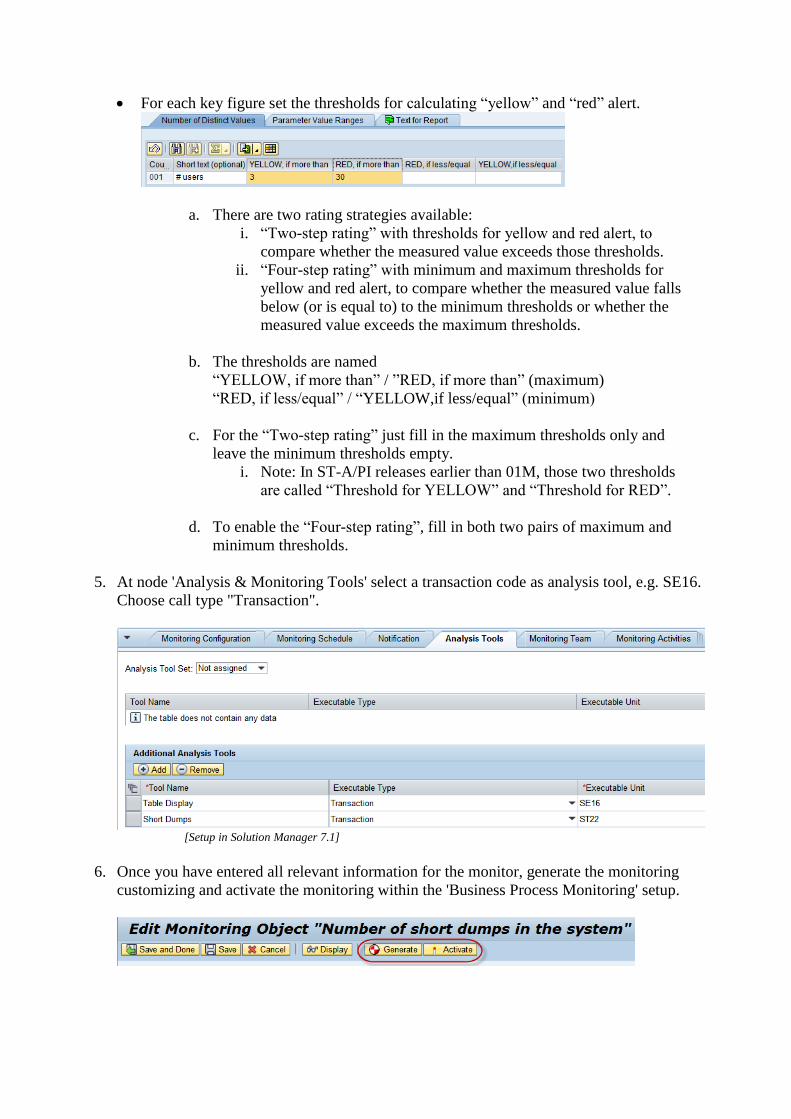
• For each key figure set the thresholds for calculating “yellow” and “red” alert.
a. There are two rating strategies available:
i. “Two-step rating” with thresholds for yellow and red alert, to
compare whether the measured value exceeds those thresholds.
ii. “Four-step rating” with minimum and maximum thresholds for
yellow and red alert, to compare whether the measured value falls
below (or is equal to) to the minimum thresholds or whether the
measured value exceeds the maximum thresholds.
b. The thresholds are named
“YELLOW, if more than” / ”RED, if more than” (maximum)
“RED, if less/equal” / “YELLOW,if less/equal” (minimum)
c. For the “Two-step rating” just fill in the maximum thresholds only and
leave the minimum thresholds empty.
i. Note: In ST-A/PI releases earlier than 01M, those two thresholds
are called “Threshold for YELLOW” and “Threshold for RED”.
d. To enable the “Four-step rating”, fill in both two pairs of maximum and
minimum thresholds.
5. At node 'Analysis & Monitoring Tools' select a transaction code as analysis tool, e.g. SE16.
Choose call type "Transaction".
[Setup in Solution Manager 7.1]
6. Once you have entered all relevant information for the monitor, generate the monitoring
customizing and activate the monitoring within the 'Business Process Monitoring' setup.
1.4 Result in Monitoring
1.4.1 Alert Display in SAP Solution Manager
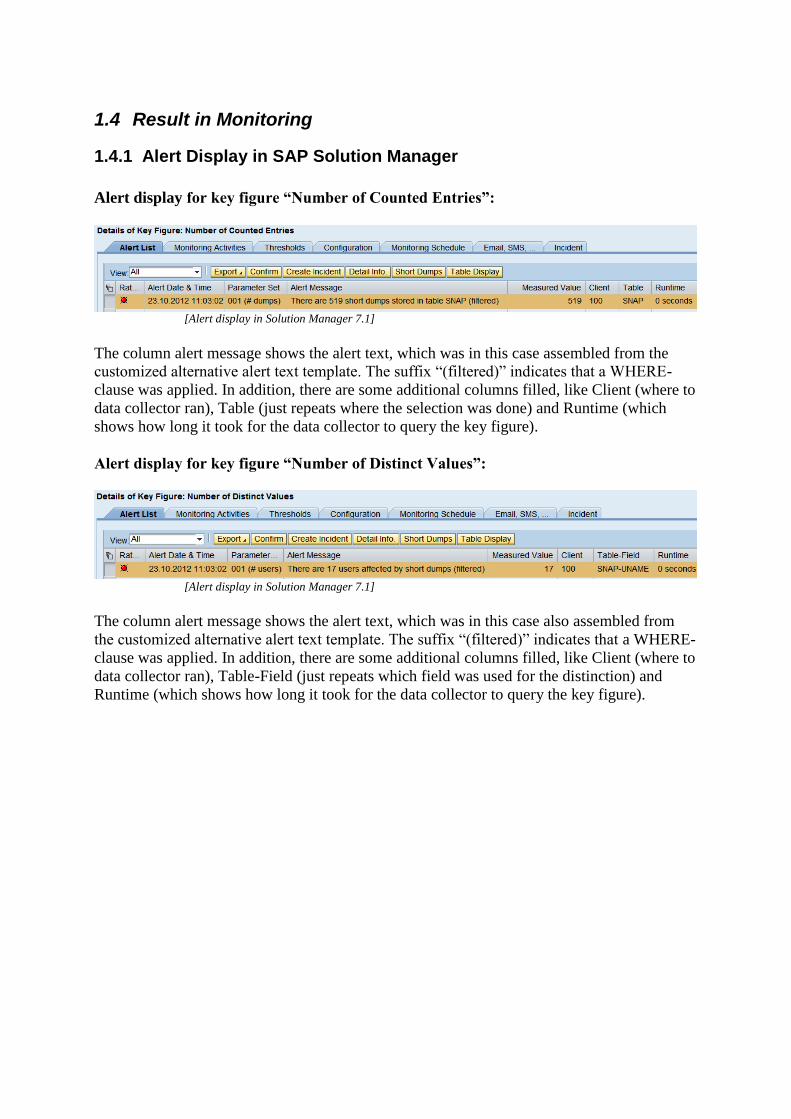
Alert display for key figure “Number of Counted Entries”:
[Alert display in Solution Manager 7.1]
The column alert message shows the alert text, which was in this case assembled from the
customized alternative alert text template. The suffix “(filtered)” indicates that a WHERE-
clause was applied. In addition, there are some additional columns filled, like Client (where to
data collector ran), Table (just repeats where the selection was done) and Runtime (which
shows how long it took for the data collector to query the key figure).
Alert display for key figure “Number of Distinct Values”:
[Alert display in Solution Manager 7.1]
The column alert message shows the alert text, which was in this case also assembled from
the customized alternative alert text template. The suffix “(filtered)” indicates that a WHERE-
clause was applied. In addition, there are some additional columns filled, like Client (where to
data collector ran), Table-Field (just repeats which field was used for the distinction) and
Runtime (which shows how long it took for the data collector to query the key figure).

1.4.2 Detail Display call into the managed system
Mark an alert and press push button “Detail Info”. This navigates you into the managed
system and displays detail information, depending on the selected key figure.
Please note that you always see the current selection result, even if you have selected an older
alert. Reason is that the selection result for the regular key figure calculation is not stored, but
rather re-selected during the detail display call.
If in the meantime the entries in the monitored table have changed, the detail info will show
some result different to the alert!
Detail information for key figure “Number of Counted Entries”
The detailed info for the number of counted entries just displays an SE16-like table rows
display with the affected entries (applying the same filtering as the data collector). Please note
that a maximum of 10,000 rows is shown.
Detail information for key figure “Number of Distinct Values”
The detailed info for the number of distinct values displays an overview with each distinct
field value and its number of occurrences (applying the same filtering as the data collector).
Obviously, the sum of all occurrences should be equal to the value of key figure “Number of
Counted Entries”.

1.5 Appendix
1.5.1 Performance Warning
Because the data collector can query any table, it is in the responsibility of the user to avoid
selections on large tables. Keep in mind that the necessary SQL selection aggregates for
COUNT and DISTINCT create expensive database selects, including full table scans and
bypassing SAP buffering!
Using this application monitor without care, can cause severe performance degradation on the
managed system.
Please consider your setup carefully and follow these golden rules:
• Avoid using this application monitor on large database tables
• Avoid running the data collection with a high monitoring frequency
• Avoid complex filtering, especially with patterns, ranges and exclusions
• Avoid filters on fields which are not supported by an index.
If you are in doubt, try to simulate the query with transaction SE16, to get an idea about the
possible runtime. Furthermore, monitor the data collection runtime which is logged into a
special column of the alert list (see chapter “Alert Display”).
1.5.2 Technical Information on the SQL Queries
The key figure "Number of Counted Entries" creates an SQL query in the following format:
SELECT COUNT(*)
FROM table
WHERE field1 IN filterrange1
AND field2 IN filterrange2
AND field3 IN filterrange3...
The key figure "Number of Distinct Values" creates an SQL query in the following format:
SELECT COUNT( DISTINCT field )
FROM table
WHERE field1 IN filterrange1
AND field2 IN filterrange2
AND field3 IN filterrange3...
This key figure does not work with Pooled and Cluster Tables, because they do not
support a DISTINCT aggregate in the SELECT-clause! At data collection, you would
get an error message "Error: Dynamic database selection failed" (due to exception
CX_SY_DYNAMIC_OSQL_SEMANTICS with SAPSQL_ILLEGAL_DISTINCT).

1.5.3 Relative Date Filtering
There are many use cases, where the result of a table count is time-dependent. For our used
example, we might be interested only in the number of short dumps created on the current day.
However, inside the BPMon Setup there are only static filter values available, like a fixed day
entry for a date field. To achieve a relative date filtering, which means calculating relative
dates instead of absolute dates, the Table Entry Counter provides a special syntax on how
define fix points and offsets for relative dates.
Syntax for Relative Dates
Instead of a fixed (absolute) date, you can enter a special keyword for the start date (prefixed
by a $ character) and optionally an additional offset as difference in days.
Syntax = <StartDate>[<Difference>]
For <StartDate> the following keywords are available:
Keyword for
<StartDate>
Description Example for
2013/04/25
Minimum
ST-A/PI release
$TODAY current date today 2013/04/25 01L
$FDOCW first day of current week 2013/04/22 01Q SP1
$LDOCW last day of current week 2013/04/28 01Q SP1
$FDOCM first day of current month 2013/04/01 01L
$LDOCM last day of current month 2013/04/30 01L
$FDOCQ first day of current quarter 2013/04/01 01Q SP2
$LDOCQ last day of current quarter 2013/06/30 01Q SP2
$FDOCY first day of current year 2013/01/01 01L
$LDOCY last day of current year 2013/12/31 01L
$FDOPW first day of previous week 2013/04/15 01Q SP1
$LDOPW last day of previous week 2013/04/21 01Q SP1
$FDOPM first day of previous month 2013/03/01 01L
$LDOPM last day of previous month 2013/03/31 01L
$FDOPQ first day of previous quarter 2013/01/01 01Q SP2
$LDOPQ last day of previous quarter 2013/03/31 01Q SP2
$FDOPY first day of previous year 2012/01/01 01L
$LDOPY last day of previous year 2012/12/31 01L
$FDONW first day of next week 2013/04/29 01Q SP1
$LDONW last day of next week 2013/05/05 01Q SP1
$FDONM first day of next month 2013/05/01 01L
$LDONM last day of next month 2013/05/31 01L
$FDONQ first day of next quarter 2013/07/01 01Q SP2
$LDONQ last day of next quarter 2013/09/30 01Q SP2
$FDONY first day of next year 2014/01/01 01L
$LDONY last day of next year 2014/12/31 01L

These additional keywords are meant for full timestamps only:
Keyword for
<StartDate>
Description Example for
2013/04/25
at 08:21:47
with offset -2
Minimum
ST-A/PI release
$TIMES timestamp now (offset in seconds) 2013/04/25
08:21:45
01Q SP1
$TIMEM timestamp now (offset in minutes) 2013/04/25
08:19:47
01Q SP1
$TIMEN timestamp now (offset in minutes) 2013/04/25
08:19:47
01Q / obsolete
(use $TIMEM)
$TIMEH timestamp now (offset in hours) 2013/04/25
06:21:47
01Q SP1
$TIMED timestamp now (offset in days) 2013/04/23
08:21:47
01Q SP1
$HOURA absolute hour (+=today / -=yesterday) 2013/04/24
02:00:00
01Q SP2
$HOURR current full hour (offset in hours) 2013/04/25
06:00:00
01Q SP2
$DELTA delta mode (timestamp of last run,
optional offset in seconds)
n/a 01Q
(these keywords are also available as value help, if you enter a $ into the filter field before)
The optional <Difference> is entered as positive or negative offset in days
• using '+' increments days (= move start date into the future)
• using '-' decrements days (= move start date into the past)
Note: On certain frontend UIs, entering a ‘+’ (plus sign) may be interpreted as a wildcard
character. This can even change the selection option from ‘equal’ to ‘contains pattern’.
To avoid this, you can also use the ‘#’ (number/hash sign) instead of ‘+’.
Examples:
• $TODAY-2 = day before yesterday
• $TODAY+2 = day after tomorrow
The relative date selection can be combined in ranges (using the LOW and HIGH fields of the
selection criteria), e.g. to define "between" intervals.
Example: You want to count the number of documents which have a creation date in last
month. The selection criteria would be <FieldName> = $FDOPM to $LDOPM.

Back to our example: With the following setting, you would select short dumps that have
been created since yesterday only (note the operator “Greater Equal” to select on yesterday
and later).
Supported Data Types
Filter fields of the following data types can respond to this special syntax:
DDic Data Type ABAP Data Type Date Format
DATS D YYYYMMDD
CHAR 10 / NUMC 10* C 10 / N 10* YYYYMMDD
CHAR 14 / NUMC 14* C 14 / N 14* YYYYMMDDhhmmss
CHAR 15 / NUMC 15** C 15 / N 15** 0YYYYMMDDhhmmss
CHAR 16 / NUMC 16*** C 16 / N 16*** YYYYMMDDhhmmss00
DEC 15 P 8 YYYYMMDDhhmmss
DEC 21 P 11 YYYYMMDDhhmmss,mmmuuun
TIMS C 6 hhmmss
Legend:YYYY = year, MM = month, DD = day
hh = hour, mm = minute, ss = second, mmmuuun = milliseconds/microseconds/nanoseconds
* NUMC is available with ST-A/PI 01Q SP2 (or in SP1 with SAP Note 1912878).
** CHAR 15 / NUMC 15 is available with ST-A/PI 01R SP1
*** CHAR 16 / NUMC 16 is available with ST-A/PI 01S SP1
Please note: In data types that include time stamps ("hhmmss"), these are defaulted with zeros
("000000"), except for the start date keywords using a "Last day" option, which sets a
maximum time stamp ("235959"). For keywords $TIMEx and $DELTA such time stamps are
populated with exact values.
Working with exact timestamps
(available with ST-A/PI 01Q or later)
For the keywords $TIMEx and $DELTA the Table Entry Counter calculates an exact time,
not only a date.
$TIMEx just takes the current system timestamp at the time of data collection.
$DELTA uses the stored timestamp of the previous run of the data collector.
Both also support an additional <Difference> offset.
The timestamp calculation is always based on UTC time! If the used database table stores the
timestamp in some local time zone format, you may use the <Difference> operator to adjust it.
If the stored timestamp is in system time, you can use the appendix _SYSTEM to convert
UTC into system time (e.g. $TIMEH-2_SYSTEM), according to the setting in table TTZCU.

• $TIMES, $TIMEM, $TIMEH, $TIMED ("Time now") calculate exact timestamps.
They work for real timestamps (=combined date and time fields) with data types like
DEC15 and DEC21. You can easily use different time units for the offset, like
Seconds, Minutes, Hours, Days, depending on the chosen relative date keyword.
• $HOURA, $HOURR ("full hour buckets") allow to work with exact time buckets
of full hours. For example, if the current time is 08:21, the low value is set to 08:00:00
and the high value is set to 08:59:59.
$HOURR allows specifying a relative time offset in hours, e.g. $HOURR-2 would
change above example into 06:00:00 to 06:59:59.
$HOURA allows specifying an absolute number of the wished hour, e.g. $HOURA+2
would be 02:00:00 to 02:59:59 (today) and $HOURA-2 would be 02:00:00 to
02:59:59 (yesterday). Please note that the +/- sign has a different meaning here, as it
just affects the date belonging to the hour bucket to be either today or yesterday.
• $DELTA ("delta mode") stores the timestamp of each data collector run, and at next
run you can select everything since that last run, by simply putting a >=$DELTA in
your timestamp field filter. An additional offset in seconds (+-<Difference>) is
possible as well, however, does not make much sense here.
1.5.4 Required Authorizations
The usage of the Table Entry Counter requires additional authorizations, which may not be
part of the general BPMon users for setup and runtime. Please see also SAP Note 784752.
BPMon Action Used RFC type Authorization type
Value Help LOGIN or TRUSTED DDIC
Validation Check LOGIN or TRUSTED DDIC
Data Collection READ DATA
Detail Information LOGIN or TRUSTED DATA
Authorization type “DDIC”
• Within the BPMon Setup this monitor offers search helps for database table names and
table fields. Therefore, the dialog user needs authorization for the ABAP Data
Dictionary transaction SE12 in the managed system, during remote logon via a trusted
or login RFC destination.
• Checked Authorization Object = S_TCODE
with value TCD = SE12
Authorization type “DATA”
• At runtime, the monitor accesses data from database tables. Therefore, it needs to
check whether the user has authorization for transaction SE16 and the corresponding
table authorization group of the customized table name.
• In case of the data collection for alerting, “user” refers to the logon user maintained in
the Read RFC destination, and in case of the detail information display, “user” refers
to the dialog user during remote logon via a Trusted or Login RFC destination.
• Starting ST-A/PI 01S, this authorization check is exclusively performed by calling the
standard function module VIEW_AUTHORITY_CHECK. Internally it will check for
o S_TABU_CLI, if table is client-independent
o S_TABU_DIS, if authorizations are assigned via table authorization groups
▪ You can find out the used table authorization group in transaction SE11
(menu “Utilities -> Assign Authorization Group”) or by looking up
table TDDAT.
o S_TABU_NAM, if authorizations are assigned via individual table names