bptc key statistics 2020 an analysis of students over
TRANSCRIPT

BPTC Key Statistics
2020
An analysis of students over three academic years

Bar Standards Board: BPTC Key Statistics Introduction
June 2020 Page ii Bar Standards Board
Executive Summary
Demographics
• Overall enrolment: 1753 students enrolled on the BPTC in
2018/19. This was the highest figure for enrolment since the BPTC
course began in 2011 and an increase of 134 students compared to
2017/18, the second largest year on year increase in enrolment
since 2011. Of the 2018/19 enrolled students, 1591 were full-time
and 162 were part-time on the course. The number of part-time
students was down year on year (there were 13 fewer part-time
students enrolled in 2018/19) and has shown a downward trend
since 2011 when 255 part-time students enrolled on the course.
• Domicile: The number of UK/EU domiciled students and overseas
students both showed an increase from 2017/18 to 2018/19 (from
768 to 824 for overseas students, and from 851 to 928 for UK/EU
students). The number of UK/EU students who enrolled in the
2018/19 academic year is almost back up to levels last seen in
2013/14. Overall, around 52 per cent of BPTC students enrolled in
2018/19 were domiciled in the UK prior to enrolment, around one
per cent were domiciled in the EU, and 47 per cent were domiciled
outside the UK or EU. When the BPTC started in 2011/12, overseas
students made up around a third of those on the course.
• Gender: The percentage of female BPTC students by year of
enrolment has increased since the BPTC was introduced in 2011/12
from 52 per cent to 56.5 per cent in 2018/19 (55 per cent of
overseas students, and 58 per cent of UK/EU students).
• Ethnicity: There was a slight increase in the percentage of UK/EU
domiciled Black, Asian and Minority Ethnic (BAME) students on the
BPTC in comparison to white UK/EU domiciled students for
2018/19. 40 per cent of UK/EU students who enrolled in 2018/19 of
the 93 per cent who provided information on ethnicity were from a
BAME background. This was up by around three percentage points
compared to 2017/18, and around 10 percentage points higher than
that seen from 2012/13 to 2014/15. The majority of 2018/19
overseas domiciled students were from an Asian background
(around eighty per cent of overseas domiciled students).
• Disability: Around 14 per cent of UK/EU domiciled students and
five per cent of overseas domiciled students who enrolled on the
BPTC in 2018/19 had declared a disability.
• First degree classification: Around 30 per cent of UK/EU
domiciled students who provided information on degree
classification and enrolled on the BPTC in 2018/19 had gained a
first-class degree; 54 per cent of them had gained an upper-second
class degree; 11 per cent had gained a lower-second class degree,
and around five per cent had another degree classification.
• The proportion of UK/EU students with a first-class degree enrolling
on the BPTC has increased by around 10 percentage points since
2011/12, and the proportion with a lower second class degree has
decreased year on year over the same period by around five
percentage points.
• Around 11 per cent of overseas domiciled students who enrolled on
the BPTC in 2018/19 had a first class degree (compared to two per
cent in 2011/12). The proportion of overseas students with a lower
second class degree upon enrolment has decreased from around a
half in 2011/12 to around a quarter in 2018/19.
BPTC outcomes: as of January 2020
• UK/EU students: Around 70 per cent of full-time UK/EU domiciled
students that enrolled in 2018/19 had passed the BPTC as of
January 2020; with the remainder mostly yet to complete the course.
Around nine per cent received an Outstanding, around 50 per cent
received a Very Competent, and around 10 per cent received a
Competent overall grade.
• For 2017/18 enrolled UK/EU domiciled students (including part-
time), just under 80 per cent had passed the course, just under 14
per cent were yet to complete it, and around 5 per cent had failed
the course; an additional 4 per cent had withdrawn from the BPTC.
Bar Standards Board: BPTC Key Statistics Introduction
June 2020 Page iii Bar Standards Board
• Overseas students: Around 60 per cent of full-time overseas
domiciled students that enrolled in 2018/19 had passed the course
as of January 2020; with the remainder mostly yet to complete the
course. Around two per cent received an Outstanding, around 40
per cent received a Very Competent, and around 18 per cent
received a Competent grade overall. For 2017/18 enrolled students
(including part-time), around 80 per cent had passed the course, 10
per cent were yet to complete it, and around 9 per cent had failed it.
BPTC graduates who have commenced pupillage: as of March 2020
• Overall, around 43 per cent of UK/EU domiciled BPTC graduates
who enrolled on the course from 2014/15-2018/19 (2014-2018) had
commenced pupillage. The relevant figure increases to around 47
per cent when looking at those enrolled from 2014-2017 only, as it
can take some time for more recent graduates to gain pupillage. The
likelihood of gaining pupillage varies widely by degree class and
BPTC overall grade in particular, with ethnicity and first degree
institution also appearing to be influencing factors.
• Those with an Outstanding overall BPTC grade were the most likely
to have commenced pupillage. Around 85 per cent of such UK/EU
domiciled graduates with a first-class degree and 79 per cent with
an upper-second class degree had commenced pupillage. For
UK/EU BPTC graduates with a Very Competent overall BPTC
grade; around half of them with a first-class degree, 40 per cent of
them with an upper-second class degree, and around 22 per cent of
them with a lower-second class degree had commenced pupillage.
The proportion of UK/EU domiciled graduates with a Competent
overall grade who had commenced pupillage were far lower (12 per
cent or less for all degree classifications).
• Domicile: 1375 out of the 1420 BPTC graduates (around 97%) from
2014-2018 cohorts that had commenced pupillage as of 31 March
2020 were domiciled in the UK/EU prior to BPTC enrolment.
• Gender: Around 55 per cent of all UK/EU BPTC graduates enrolled
from 2014-2018 were female, and 45 per cent were male. Of those
from this cohort that went on to commence pupillage, around 53 per
cent were female, and around 47 per cent were male. Males with a
first-class degree appeared to be slightly more likely than females to
gain pupillage when controlling for BPTC grade. The opposite was
seen for those with an upper-second class degree.
• Ethnicity: When controlling for degree class and BPTC grade,
UK/EU BPTC graduates from BAME backgrounds who enrolled
from 2014-2018 were less likely to have commenced pupillage than
those from white backgrounds. For example, of UK/EU domiciled
BPTC graduates with an upper-second class degree and Very
Competent overall BPTC grade, 45 per cent of them from white
backgrounds had commenced pupillage, compared to around 25 per
cent of the BAME cohort with the same degree class/BPTC grade.
• Disability: Overall it seems that similar proportions of those with a
declared disability and those without a declared disability gain
pupillage once degree class/BPTC grade are taken into account.
• First degree institution: When controlling for BPTC overall grade
and first-degree classification, those who attended universities
classified in the Top 10 in the UK according to The Times and
Sunday Times Good University Guide, were more likely to have
commenced pupillage compared to attendees of universities
classified in the next forty; who were in turn more likely to have
commenced pupillage than those attending other universities.
• For example, 55 per cent of those with an upper second class
degree and Very Competent BPTC grade who went to a UK
university ranked in the top 10 had commenced pupillage. In
comparison around 48 per cent of those with a first class degree
and a Very Competent overall grade on the BPTC who went to a
university ranked 11-50 in the UK had commenced pupillage.

Bar Standards Board: BPTC Key Statistics Introduction
June 2020 Page iv Bar Standards Board
Introduction to the BPTC Key Statistics report
This report provides key statistics relating to students enrolled on the Bar Professional Training Course (BPTC), which is the vocational stage of training
for the Bar, at the time of writing in April 2020. The BPTC is delivered at a number of universities across England and Wales, and the data in this report
reflect data submitted to the Bar Standards Board by these BPTC providers as at February 2020.
The BPTC is delivered in a range of ways:
- full-time over one academic year, or part-time over two academic years;
- as a stand-alone qualification or integrated with a qualifying law degree (as offered by the University of Northumbria at Newcastle).
From September 2020, the BPTC will no longer exist in its current format as it will be replaced by a number of different courses authorised by the Bar
Standards Board which all lead to Call to the Bar. Details about the BPTC and training to become a barrister in England and Wales, including details on
the future of training for the Bar can be found on our website. Details on which providers have been authorised to provide training to become a barrister
in England and Wales from September 2020 can be found here.
This report is divided into four parts:
Part 1 Key statistics aggregated for all providers (full-time and part-time BPTC students);
Part 2 Key statistics by provider (full-time BPTC students);
Part 3 Key statistics by provider (part-time BPTC students);
Part 4 BPTC graduate progression statistics - both aggregated and by provider (full-time and part-time BPTC students).
The BPTC cohorts included in Parts 1-3 are as follows:
- 2016/17, 2017/18, 2018/19 full-time students;
- 2016/18, 2017/19, 2018/20 part-time students, with data on student demographics only for those in the 2018/20 cohort, as results are not yet
available for this cohort.
In Part 4 the 2014/15 and 2015/16 full-time and 2014/16 and 2015/17 part-time cohorts are also included in order to give a more detailed picture of
statistics on pupillage for those who have graduated from the BPTC.

Bar Standards Board: BPTC Key Statistics Introduction
June 2020 Page v Bar Standards Board
Important notes regarding data use and interpretation
In some instances, we have not been provided with information on some students regarding their characteristics and/or BPTC outcomes. Such cases are
not represented in charts throughout the report if applicable. Including instances where there is no information on a characteristic/outcome can make it
difficult to compare between years and cohorts for the categories being presented.
From 2016/17 the rules on the number of re-sits allowed per student for each module on the BPTC changed. Previously students were only allowed one
re-sit per module, but from 2016/17 students have been allowed two. This means as of the time the data for this report were collected, there had not
been enough sits for it to be possible for any 2018/19 students to fail the entire course via failing exam sittings. This affects the comparison between
years for the charts on BPTC outcomes.
Please take into consideration the difficulty in comparing data between years; the data refer to cohorts enrolled at different points in time and this affects
the proportion of students yet to complete the BPTC and the relative proportions of those achieving each overall grade, withdrawing from, or failing the
BPTC, as well as the amount of time those that have passed the course have had in which to gain pupillage.
It should also be noted that it is worthwhile to refer to the x-axis of the charts representing student numbers in order to get a better context of the size of
the cohort being represented.
Please also take into consideration the difficulty in drawing inferences from these data, as there are many factors involved in determining student
success on the BPTC as well as progression onto pupillage following completion of the course.
Owing to a discrepancy in the data, throughout the report the domicile data used for 2017 enrolled students at BPP institutions are that which was
provided to us by students when taking the BCAT.
Data presentation
The data in the main body of the report (Parts 1-4) are presented in charts with most measures indicating both numbers and percentages of BPTC
students. Providing both helps to illustrate population size and give greater context to the percentages displayed.
The raw data can be found in the appendices in an anonymised form, in compliance with the anonymisation code of practice outlined below. In the
appendices, where we do not have data (either because the provider did not collect the data, or the student did not provide the data) we have used the
words “Not provided”. However, in the charts, we have not included individuals where data on one or more characteristics have not been provided, as
including it would lead to greater difficulty in making direct comparisons between groups.
In this report “Not yet complete” means the student has either not taken all the assessments, not passed all the assessments, deferred one or more
assessments to a future year, or been permitted to suspend their studies and resume at a specified point. Students who have withdrawn from the course
have not completed all the assessments and therefore have no overall grade; in some cases, these students may re-enrol. A student who has failed the
BPTC may re-enrol to take the entire course again. In cases where charts relate to students domiciled in the UK/EU or overseas only, this refers to the
Bar Standards Board: BPTC Key Statistics Introduction
June 2020 Page vi Bar Standards Board
region in which the student was domiciled prior to enrolment on the BPTC. The domicile codes used in the aggregation of the data are taken from the
Higher Education Statistics Agency (HESA). The terminology used in chart titles regarding domicile is as follows:
- UK/EU domiciled students;
- Overseas domiciled students;
- Students from all domiciles.
Regarding changes to this report, Chart 2.A.6.2 has been taken out this year, owing to small numbers of UK/EU students with a lower second class
degree at the majority of BPTC providers. In addition, a new chart in Part 4 has been included (4. A. 7. 2), showing proportions of UK/EU domiciled BPTC
graduates gaining pupillage by degree class, university attended, BPTC grade and ethnicity.
Data sources
The data in the report were collected from:
- Individual BPTC providers;
- the BPTC online applications system, BarSAS, and
- pupillage registration data from our database.
Validation has been carried out on returned data based on comparisons against data already held by the Bar Standards Board and by asking BPTC providers to verify the information that was provided.
We have taken considerable care and attention in the compilation of the data provided to us and we have sought to provide a purely objective presentation of the data. Missing data and/or new information received may affect the representation of the data presented in this report and efforts will be made to incorporate any such data in future reports. Despite our best efforts and quality control procedures, mistakes can happen. When they do, corrections will be made in a timely manner, announced and clearly explained to users.
Data protection and confidentiality
We take our responsibilities for data protection very seriously and have made every attempt to make sure that individual students cannot be identified
from the data included in this publication. We have adhered to the Anonymisation: managing data protection risk code of practice report from the
Information Commissioner's Office, (November 2012) and applied anonymisation techniques where appropriate.
An outline of the anonymisation process is given in Appendix II.
The data in this report were compiled by staff of the Bar Standards Board. Providers were given the opportunity to validate the data they submitted.
Acknowledgements
We are grateful to BPTC providers for their cooperation in providing the majority of data used in this report.

Bar Standards Board: BPTC Key Statistics Introduction
June 2020 Page vii Bar Standards Board
Key to providers of the BPTC
Code Name of provider Law school webpage Notes
BPP BPP Law School https://www.bpp.com/courses/law In 2018/19, BPP offered the BPTC at five sites: Birmingham, Bristol, Leeds, London and Manchester.
The course at BPP Birmingham started in September 2015, and the delivery of the BPTC at BPP's Bristol site commenced in September 2017.
CAR Cardiff Law School www.cardiff.ac.uk/law-politics
CLS City Law School, The https://www.city.ac.uk/about/schools/law
MMU Manchester Metropolitan University www2.mmu.ac.uk/law/
NTU Nottingham Law School https://www.ntu.ac.uk/study-and-courses/academic-schools/nottingham-law-school
UNN University of Northumbria at Newcastle
https://www.northumbria.ac.uk/about-us/academic-departments/northumbria-law-school
UOL University of Law, The https://www.law.ac.uk/ The University of Law offered the BPTC at three sites, London, Birmingham and Leeds. The course offered at Leeds started in September 2016.
UWE University of the West of England www1.uwe.ac.uk/bl/bls

Bar Standards Board: BPTC Key Statistics Introduction
June 2020 Page viii Bar Standards Board
Contents
EXECUTIVE SUMMARY II
INTRODUCTION TO THE BPTC KEY STATISTICS REPORT IV
Key to providers of the BPTC vii
CONTENTS VIII
PART 1: KEY STATISTICS AGGREGATED FOR ALL PROVIDERS (FULL-TIME AND PART-TIME BPTC STUDENTS) 1
1. A. BPTC results and outcomes for full-time and part-time students 2 1. A. 1. BPTC applications and enrolments: students from all domiciles 2 1. A. 2. BPTC results obtained by students: students from all domiciles 3 1. A. 3. 1. Grades obtained by, and outcomes for, full-time and part-time BPTC students, by year and first degree classification: students from all domiciles 4 1. A. 3. 2. Grades obtained by, and outcomes for, full-time and part-time BPTC students by first degree classification: UK/EU domiciled students – 2016-2017 aggregated 5 1. A. 4. Grades obtained by full-time and part-time BPTC students (indicating whether all BPTC assessments were passed at the first attempt): students from all domiciles 6 1. A. 5. 1. Grades obtained by, and outcomes for, full-time and part-time BPTC students, by first degree classification: students from all domiciles 7 1. A. 5. 2. Grades obtained by, and outcomes for, full-time and part-time BPTC students, by first degree classification: UK/EU domiciled students 8 1. A. 5. 3. Grades obtained by, and outcomes for, full-time and part-time BPTC students, by first degree classification: overseas domiciled students 9 1. A. 6. Grades obtained by, and outcomes for, full-time and part-time BPTC students, by domicile 10 1. A. 7. 1. Grades obtained by, and outcomes for, full-time and part-time BPTC students, by ethnicity: students from all domiciles 11 1. A. 7. 2. Grades obtained by, and outcomes for, full-time and part-time BPTC students, by ethnicity and first degree classification: UK/EU domiciled students - 2016-2018 aggregated 12 1. A. 7. 3. Grades obtained by, and outcomes for, full-time and part-time BPTC students, by ethnicity and first degree classification: Overseas domiciled students - 2016-2018 aggregated 13 1. A. 8. 1. Grades obtained by, and outcomes for, full-time and part-time BPTC students, by gender: students from all domiciles 14 1. A. 8. 2. Grades obtained by, and outcomes for, full-time and part-time BPTC students, by gender and first degree classification: UK/EU domiciled students - 2016-2018 aggregated 15 1. A. 8. 3. Grades obtained by, and outcomes for, full-time and part-time BPTC students, by gender and first degree classification: overseas domiciled students - 2016-2018 aggregated 16 1. A. 9. 1. Grades obtained by, and outcomes for, full-time and part-time BPTC students, by disability: students from all domiciles 17 1. A. 9. 2. Grades obtained by, and outcomes for, full-time and part-time BPTC students, by disability and first degree classification: UK/EU domiciled students - 2016-2018 aggregated 18 1. A. 9. 3. Grades obtained by, and outcomes for, full-time and part-time BPTC students, by disability and first degree classification: Overseas domiciled students - 2016-2018 aggregated 19
1. B. Profile of full-time and part-time BPTC students 20 1. B. 1. Age of full-time and part-time students (as at 1 October in the year of enrolling on the BPTC): students from all domiciles 20

Bar Standards Board: BPTC Key Statistics Introduction
June 2020 Page ix Bar Standards Board
1. B. 2. Domicile of full-time and part-time BPTC students 21 1. B. 3. First degree classification of full-time and part-time BPTC students: students from all domiciles 22 1. B. 4. First degree classification of full-time and part-time BPTC students, by domicile 23 1. B. 5. Ranking of university at which full-time and part-time BPTC students studied for first degree: students from all domiciles 24 1. B. 6. Full-time and part-time BPTC students who completed a law degree or Graduate Diploma in Law (GDL): students from all domiciles 25 1. B. 7. Ethnicity of full-time and part-time BPTC students by domicile 26 1. B. 8. Gender of full-time and part-time BPTC students by domicile 27 1. B. 9. Declared disability of full-time and part-time BPTC students: students from all domiciles 28
PART 2: KEY STATISTICS BY PROVIDER (FULL-TIME BPTC STUDENTS) 29
2. A. BPTC results and outcomes of full-time students 30 2. A. 1. BPTC enrolments: students from all domiciles 30 2. A. 2. 1. BPTC results obtained by full-time students: students from all domiciles 31 2. A. 2. 2. BPTC results obtained by full-time students (grades of BPTC graduates only): students from all domiciles 32 2. A. 3. Percentage of enrolled full-time students who have completed the BPTC as of summer 2019: students from all domiciles 33 2. A. 4. Number and percentage of full-time students who passed all BPTC assessments at first or second attempt by provider: students from all domiciles 34 2. A. 5. 1. Grades obtained by, and outcomes for, full-time BPTC students, by first degree classification: students from all domiciles – 2016-2018 aggregated 35 2. A. 5. 2. Grades obtained by, and outcomes for, full-time BPTC graduates, by first degree classification: students from all domiciles – 2016-2018 aggregated 36
36
36 2. A. 5. 3. Grades obtained by, and outcomes for, full-time BPTC students, by first degree classification: UK/EU domiciled students – 2016-2018 aggregated 37 2. A. 5. 4. Grades obtained by, and outcomes for, full-time BPTC graduates, by first degree classification: UK/EU domiciled students – 2016-2018 aggregated 38 2. A. 5. 5. Grades obtained by, and outcomes for, full-time BPTC students, by first degree classification: Overseas domiciled students – 2016-2018 aggregated 39 2. A. 5. 6. Grades obtained by, and outcomes for, full-time BPTC graduates, by first degree classification: Overseas domiciled students – 2016-2018 aggregated 40 2. A. 6. Grades obtained by, and outcomes for, full-time BPTC students, by domicile: those with an upper second-class first-degree classification only – 2016-2018 aggregated 41 2. A. 7. 1. Grades obtained by, and outcomes for, full-time BPTC students, by ethnicity: students from all domiciles – 2016-2018 aggregated 42 2. A. 7. 2. Grades obtained by, and outcomes for, full-time BPTC students, by ethnicity: UK/EU domiciled students - 2016-2018 aggregated 43 2. A. 7. 3. Grades obtained by, and outcomes for, full-time BPTC students, by ethnicity: overseas domiciled students - 2016-2018 aggregated 44 2. A. 8. 1. Grades obtained by, and outcomes for, full-time BPTC students, by gender: students from all domiciles - 2016-2018 aggregated 45 2. A. 8. 2. Grades obtained by, and outcomes for, full-time BPTC students, by gender: UK/EU domiciled students - 2016-2018 aggregated 46 2. A. 8. 3. Grades obtained by, and outcomes for, full-time BPTC students, by gender: overseas domiciled students - 2016-2018 aggregated 47 2. A. 9. 1. Grades obtained by, and outcomes for, full-time BPTC students, by disability: students from all domiciles - 2016-2018 aggregated 48 2. A. 9. 2. Grades obtained by, and outcomes for, full-time BPTC students, by disability: UK/EU domiciled students – 2016-2018 aggregated 49
2. B. Profile of full-time BPTC students 50 2. B. 1. Age of full-time students (as at 1 October in the year of enrolling on a BPTC): students from all domiciles 50 2. B. 2. Domicile of full-time BPTC students 51 2. B. 3. First degree classification of BPTC full-time students: students from all domiciles 52 2. B. 4. First degree classification of full-time BPTC students, by domicile: 2016-2018 aggregated 53
Bar Standards Board: BPTC Key Statistics Introduction
June 2020 Page x Bar Standards Board
2. B. 5. Ranking of university at which full-time BPTC students studied for first degree: students from all domiciles 54 2. B. 6. Full-time BPTC students who completed a law degree or Graduate Diploma in Law (GDL): students from all domiciles 55 2. B. 7. 1. Ethnicity of full-time BPTC students: students from all domiciles – 2016-2018 aggregated 56 2. B. 7. 2. Ethnicity of full-time BPTC students: UK/EU domiciled students – 2016-2018 aggregated 57 2. B. 7. 3. Ethnicity of full-time BPTC students: overseas domiciled students only – 2016-2018 aggregated 58 2. B. 8. Gender of full-time BPTC students: students from all domiciles – 2016-2018 aggregated 59 2. B. 9. Declared disability of full-time BPTC students: students from all domiciles - 2016-2018 aggregated 60
PART 3: KEY STATISTICS BY PROVIDER (PART-TIME BPTC STUDENTS) 61
3. A. BPTC results and outcomes for part-time students 62 3. A. 1. BPTC enrolments: students from all domiciles 62 3. A. 2. BPTC results obtained by part-time students: students from all domiciles – 2016 and 2017 enrolled students aggregated 63 3. A. 3. Percentage of enrolled part-time students who have completed the BPTC as of summer 2019: students from all domiciles – 2016 and 2017 enrolled students aggregated 64 3. A. 4. Part-time students who passed all BPTC assessments at first attempt: students from all domiciles – 2016 and 2017 enrolled students aggregated 65 3. A. 5. Comparison in BPTC outcomes by provider between full-time and part-time students: students from all domiciles – 2016 and 2017 enrolled students aggregated for part-time students, and 2017-2018 aggregated for full-time students (comparison at time of graduation based upon course length) 66 3. A. 6. Comparison in BPTC outcomes by provider between full-time and part-time students: UK/EU domiciled – 2016 and 2017 enrolled students aggregated for part-time students, and 2017-2018 aggregated for full-time students (comparison at time of graduation based upon course length) 67
3. B. Profile of part-time BPTC students 68 3. B. 1. Age of part-time students (as at 1 October in the year of enrolling on a BPTC): students from all domiciles – 2016-2018 aggregated 68 3. B. 2. Domicile of part-time BPTC students: students from all domiciles – 2016-2018 aggregated 69 3. B. 3. First degree classification of part-time BPTC students: students from all domiciles – 2016-2018 aggregated 70 3. B. 4. First degree classification of part-time BPTC students: UK/EU domiciled - 2016-2018 aggregated 71 3. B. 5. Ranking of university at which part-time BPTC students studied for first degree: students from all domiciles – 2016-2018 aggregated 72 3. B. 6. Part-time BPTC students who completed a law degree or Graduate Diploma in Law (GDL): students from all domiciles – 2016-2018 aggregated 73 3. B. 7. Ethnicity of part-time BPTC students: students from all domiciles – 2016-2018 aggregated 74 3. B. 8. Gender of part-time BPTC students: students from all domiciles – 2016-2018 aggregated 75 3. B. 9. Declared disability of part-time BPTC students: students from all domiciles – 2016-2018 aggregated 76
PART 4: BPTC GRADUATE PROGRESSION STATISTICS 77
4. A. BPTC graduate progression of full-time and part-time BPTC students 79 4. A. 1. Domicile of full-time and part-time BPTC graduates commencing first six pupillage 79 4. A. 2. BPTC graduates commencing pupillage within 6 months, 6 - 18 months, and over 18 months following completion of the BPTC: UK/EU domiciled students 80 4. A. 3. BPTC grades of graduates commencing first six pupillage, by time taken to gain pupillage following completion of the BPTC: UK/EU domiciled students 81 4. A. 4. Pupillage rate of BPTC graduates, by part-time and full-time mode of study: UK/EU domiciled students 82 4. A. 5. 1. First degree classification and BPTC grade of full-time and part-time BPTC graduates commencing first six pupillage: UK/EU domiciled students - percentage of those with pupillage – 2014-2018 aggregated 83 4. A. 5. 2. First degree classification and BPTC grade of full-time and part-time BPTC graduates commencing first six pupillage: UK/EU domiciled students only – number of BPTC graduates in each grouping that have gained pupillage, by year of BPTC enrolment 84

Bar Standards Board: BPTC Key Statistics Introduction
June 2020 Page xi Bar Standards Board
4. A. 5. 3. First degree classification and BPTC grade of full-time and part-time BPTC graduates commencing first six pupillage: UK/EU domiciled students only – percentage of BPTC graduates in each grouping that have gained pupillage, by year of BPTC enrolment 85 4. A. 6. Time taken to commence pupillage following completion of the BPTC, by first degree classification and BPTC grade: UK/EU domiciled graduates that have gained pupillage – 2014-2018 aggregated 86 4. A. 7. 1. Ethnicity, first degree classification and BPTC overall grade of full-time and part-time BPTC graduates commencing first six pupillage: UK/EU domiciled students – 2014-2018 aggregated 87 4. A. 7. 2. Ethnicity, first degree classification, university attended and BPTC overall grade of full-time and part-time BPTC graduates commencing first six pupillage: UK/EU domiciled students – 2014-2018 aggregated 88 4. A. 8. Gender, first degree classification and BPTC overall grade of full-time and part-time BPTC graduates commencing first six pupillage: UK/EU domiciled students – 2014-2018 aggregated 89 4. A. 9. Disability status, first degree classification and BPTC overall grade of full-time and part-time BPTC graduates commencing first six pupillage: UK/EU domiciled students – 2014-2018 aggregated 90 4. A. 10. Ranking of first degree institution, first degree classification and BPTC overall grade of full-time and part-time BPTC graduates commencing first six pupillage: UK/EU domiciled students – 2014-2018 aggregated 91 4. A. 11. Age at enrolment, first degree classification and BPTC overall grade of full-time and part-time BPTC graduates commencing first six pupillage: UK/EU domiciled students – 2014-2018 aggregated 92
4. B. BPTC graduate progression of full-time and part-time BPTC students, by provider 93 4. B. 1. Domicile of BPTC graduates commencing first six pupillage – 2014-2018 aggregated 93 4. B. 2. BPTC graduates commencing pupillage within 6 months, 6 - 18 months, and over 18 months following completion of the BPTC: UK/EU domiciled graduates 94 4. B. 3. Pupillage rate of BPTC graduates, by provider: UK/EU domiciled students 95 4. B. 4. Percentage of graduates with each BPTC grade commencing first six pupillage, by provider: UK/EU domiciled students – 2014-2018 aggregated 96 4. B. 5. First degree classification of BPTC graduates commencing first six pupillage: students from all domiciles – 2014-2018 aggregated 97
APPENDICES 98
APPENDIX I: ANONYMISATION PROCESS 99
APPENDIX II – ANONYMISED DATA TABLES 100
Anonymised Data - Part 1 100
1. A. BPTC results and outcomes for full-time and part-time students 100 1. A. 1. BPTC applications and enrolments: students from all domiciles 100 1. A. 2. BPTC results obtained by students: students from all domiciles 100 1. A. 3. 1. Grades obtained by, and outcomes for, full-time and part-time BPTC students, by year and first degree classification: students from all domiciles 101 1. A. 3. 2. Grades obtained by, and outcomes for, full-time and part-time BPTC students by first degree classification: UK/EU domiciled students – 2016-2017 aggregated 102 1. A. 4. Grades obtained by full-time and part-time BPTC students (indicating whether all BPTC assessments were passed at the first attempt): students from all domiciles 102 1. A. 5. Grades obtained by, and outcomes for, full-time and part-time BPTC students, by first degree classification 103 1. A. 6. Grades obtained by, and outcomes for, full-time and part-time BPTC students, by domicile 103

Bar Standards Board: BPTC Key Statistics Introduction
June 2020 Page xii Bar Standards Board
1. A. 7. 1. Grades obtained by, and outcomes for, full-time and part-time BPTC students, by ethnicity: students from all domiciles 104 1. A. 7. 2. Grades obtained by, and outcomes for, full-time and part-time BPTC students, by ethnicity and first degree classification: UK/EU domiciled students - 2016-2018 aggregated (full time students only for 2018) 104 1. A. 7. 3. Grades obtained by, and outcomes for, full-time and part-time BPTC students, by ethnicity and first degree classification: overseas domiciled students - 2016-2018 aggregated (full time students only for 2018) 105 1. A. 8. 1. Grades obtained by, and outcomes for, full-time and part-time BPTC students, by gender: students from all domiciles (full time students only for 2018) 105 1. A. 8. 2 & 3. Grades obtained by, and outcomes for, full-time and part-time BPTC students, by gender and first degree classification- 2016-2018 aggregated (full time students only for 2018) 106 1. A. 9. 1. Grades obtained by, and outcomes for, full-time and part-time BPTC students, by disability: students from all domiciles 107 1. A. 9. 2. Grades obtained by, and outcomes for, full-time and part-time BPTC students, by disability and first degree classification: UK/EU domiciled students - 2016-2018 aggregated (full time students only for 2018) 107
1. B. Profile of full-time and part-time BPTC students 108 1. B. 1. Age of full-time and part-time students (as at 1 October in the year of enrolling on the BPTC): students from all domiciles 108 1. B. 2. Domicile of full-time and part-time BPTC students 108 1. B. 3. First degree classification of full-time and part-time BPTC students: students from all domiciles 109 1. B. 4. First degree classification of full-time and part-time BPTC students, by domicile 109 1. B. 5. Ranking of university at which full-time and part-time BPTC students studied for first degree: students from all domiciles 109 1. B. 6. Full-time and part-time BPTC students who completed a law degree or Graduate Diploma in Law (GDL): students from all domiciles 110 1. B. 7. Ethnicity of full-time and part-time BPTC students by domicile 110 1. B. 8. Gender of full-time and part-time BPTC students by domicile 111 1. B. 9. Declared disability of full-time and part-time BPTC students: students from all domiciles 111
Anonymised Data - Part 2 112
2. A. BPTC results and outcomes of full-time students 112 2. A. 1. BPTC enrolments: students from all domiciles 112 2. A. 2. BPTC results obtained by full-time students: students from all domiciles 113 2. A. 4. Whether full-time BPTC graduates passed all assessments at first or second/third attempt by provider: students from all domiciles 114 2. A. 5. 3 & 4. Grades obtained by, and outcomes for, full-time BPTC students, by first degree classification: UK/EU domiciled students – 2016-2018 aggregated 115 2. A. 5. 5 & 6. Grades obtained by, and outcomes for, full-time BPTC students, by first degree classification: Overseas domiciled students – 2016-2018 aggregated 116 2. A. 7. Grades obtained by, and outcomes for, full-time BPTC students, by ethnicity: students from all domiciles – 2016-2018 aggregated 117 2. A. 8. Grades obtained by, and outcomes for, full-time BPTC students, by gender: students from all domiciles - 2016-2018 aggregated 120 2. A. 9. 1. Grades obtained by, and outcomes for, full-time BPTC students, by disability: students from all domiciles - 2016-2018 aggregated 121 2. A. 9. 2. Grades obtained by, and outcomes for, full-time BPTC students, by disability: UK/EU domiciled students – 2016-2018 aggregated 122
2. B. Profile of full-time BPTC students 123 2. B. 1. Age of full-time students (as at 1 October in the year of enrolling on a BPTC): students from all domiciles 123 2. B. 2. Domicile of full-time BPTC students 124 2. B. 3. First degree classification of BPTC full-time students: students from all domiciles 125 2. B. 4. First degree classification of BPTC full-time students, by domicile 126 2. B. 5. Ranking of university at which full-time BPTC students studied for first degree: students from all domiciles 127
Bar Standards Board: BPTC Key Statistics Introduction
June 2020 Page xiii Bar Standards Board
2. B. 6. Full-time BPTC students who completed a law degree or Graduate Diploma in Law (GDL): students from all domiciles 128 2. B. 7. Ethnicity of full-time BPTC students: students from all domiciles – 2016-2018 aggregated 129 2. B. 8. Gender of full-time BPTC students: students from all domiciles – 2016-2018 aggregated 130 2. B. 9. Declared disability of full-time BPTC students: students from all domiciles - 2016-2018 aggregated 130
Anonymised Data - Part 3 130 3. A. BPTC results and outcomes for part-time students 130 3. A. 1. BPTC enrolments: students from all domiciles 130
Anonymised Data - Part 4 131
4. A. BPTC graduate progression of full-time and part-time BPTC students 131 4. A. 1. Domicile of full-time and part-time BPTC graduates commencing first six pupillage 131 4. A. 2. BPTC graduates commencing pupillage within 6 months, 6 - 18 months, and over 18 months following completion of the BPTC: UK/EU domiciled students 131 4. A. 3. BPTC grades of graduates commencing first six pupillage, by time taken to commence pupillage following completion of the BPTC: UK/EU domiciled students 131 4. A. 4. Pupillage rate of BPTC graduates, by part-time and full-time mode of study: UK/EU domiciled students 132 4. A. 5. First degree classification and BPTC grade of full-time and part-time BPTC graduates commencing first six pupillage: UK/EU domiciled students - number of those with pupillage 132 4. A. 6. Time taken to commence pupillage following completion of the BPTC, by first degree classification and BPTC grade: UK/EU domiciled students – 2014-2018 aggregated 133 4. A. 7. 1. Ethnicity, first degree classification and BPTC overall grade of full-time and part-time BPTC graduates commencing first six pupillage: UK/EU domiciled students – 2014-2018 aggregated 133 4. A. 7. 2. Ethnicity, first degree classification, university attended and BPTC overall grade of full-time and part-time BPTC graduates commencing first six pupillage: UK/EU domiciled students – 2014-2018 aggregated 134 4. A. 8. Gender, first degree classification and BPTC overall grade of full-time and part-time BPTC graduates commencing first six pupillage: UK/EU domiciled students – 2014-2018 aggregated 135 4. A. 9. Disability status, first degree classification and BPTC overall grade of full-time and part-time BPTC graduates commencing first six pupillage: UK/EU domiciled students – 2014-2018 aggregated 135 4. A. 10. Ranking of first degree institution, first degree classification and BPTC overall grade of full-time and part-time BPTC graduates commencing first six pupillage: UK/EU domiciled students – 2014-2018 aggregated 136 4. A. 11. Age at enrolment, first degree classification and BPTC overall grade of full-time and part-time BPTC graduates commencing first six pupillage: UK/EU domiciled students – 2014-2018 aggregated 136
4. B. BPTC graduate progression of full-time and part-time BPTC students by provider 137 4. B. 1. Domicile of BPTC graduates commencing first six pupillage – 2014-2018 aggregated 137 4. B. 3. BPTC graduates commencing pupillage within 6 months, 6 - 18 months, and over 18 months following completion of the BPTC: UK/EU domiciled graduates 137 4. B. 4. Percentage of graduates with each BPTC grade commencing first six pupillage, by provider: UK/EU domiciled students – 2014-2018 aggregated 138 4. B. 5. First degree classification of BPTC graduates commencing first six pupillage: students from all domiciles – 2014-2018 aggregated 138

Bar Standards Board: BPTC Key Statistics Part 1: Key statistics aggregated for all providers
June 2020 Page 1 Bar Standards Board
BPTC Key Statistics
2020
Part 1: Key statistics aggregated for all providers (full-time and part-time BPTC students)

Bar Standards Board: BPTC Key Statistics Part 1: Key statistics aggregated for all providers
June 2020 Page 2 Bar Standards Board
1. A. BPTC results and outcomes for full-time and part-time students
1. A. sets out an overview of the results and outcomes obtained by full-time and part-time students enrolled on the BPTC.
1. A. 1. BPTC applications and enrolments: students from all domiciles
Notes
1. The data on enrolments are those reported and validated by providers in the collection of key statistics.
2. The data above cover part-time and full-time students enrolled in October 2016, 2017 and 2018.
3. Enrolment numbers for previous years may differ from previous publications, as updated information is received from providers of the BPTC.

Bar Standards Board: BPTC Key Statistics Part 1: Key statistics aggregated for all providers
June 2020 Page 3 Bar Standards Board
1. A. 2. BPTC results obtained by students: students from all domiciles
The following charts show the percentage of enrolled students in a given academic year who obtained the overall grade outcomes of Outstanding/Very
Competent/Competent or the non-grade outcomes of Not Yet Complete/Fail/Withdrawn. A detailed description of the criteria for each grade (including
the percentages assigned to the pass grades) can be found in the BPTC Handbook.
Students enrolled in 2016 Students enrolled in 2017 Students enrolled in 2018
Notes
1. The data above cover the following cohorts: 2016-17 full-time, 2017-18 full-time, 2018-19 full-time, 2016-18 part-time and 2017-19 part-time.
2. Up until 2016/17, a student who failed an assessment was usually permitted one further opportunity to re-take the failed assessment). From 2016/17 this
was changed to two further opportunities. As of when these data were collected, students who enrolled in 2018/19 who undertook a re-sit and did not pass
would be yet to undertake their third sit, meaning these students could not have yet failed the course other than in exceptional circumstances.

Bar Standards Board: BPTC Key Statistics Part 1: Key statistics aggregated for all providers
June 2020 Page 4 Bar Standards Board
1. A. 3. 1. Grades obtained by, and outcomes for, full-time and part-time BPTC students, by year and first degree classification: students from all domiciles
Rates of failure, withdrawal and those yet to complete the course Outcomes for BPTC graduates
Note
1. The data above cover the following cohorts: 2016-17 full-time, 2017-18 full-time, 2016-18 part-time and 2017-19 part-time.
Bar Standards Board: BPTC Key Statistics Part 1: Key statistics aggregated for all providers
June 2020 Page 5 Bar Standards Board
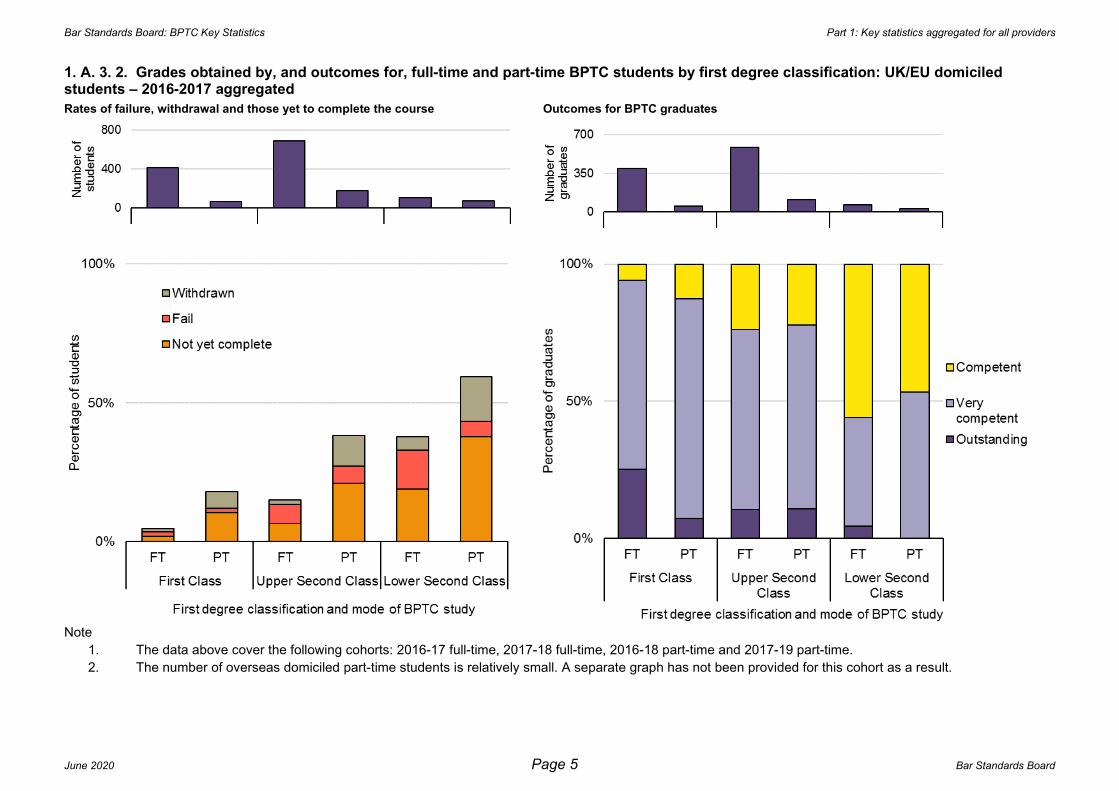
1. A. 3. 2. Grades obtained by, and outcomes for, full-time and part-time BPTC students by first degree classification: UK/EU domiciled students – 2016-2017 aggregated
Rates of failure, withdrawal and those yet to complete the course Outcomes for BPTC graduates
Note
1. The data above cover the following cohorts: 2016-17 full-time, 2017-18 full-time, 2016-18 part-time and 2017-19 part-time.
2. The number of overseas domiciled part-time students is relatively small. A separate graph has not been provided for this cohort as a result.
Bar Standards Board: BPTC Key Statistics Part 1: Key statistics aggregated for all providers
June 2020 Page 6 Bar Standards Board
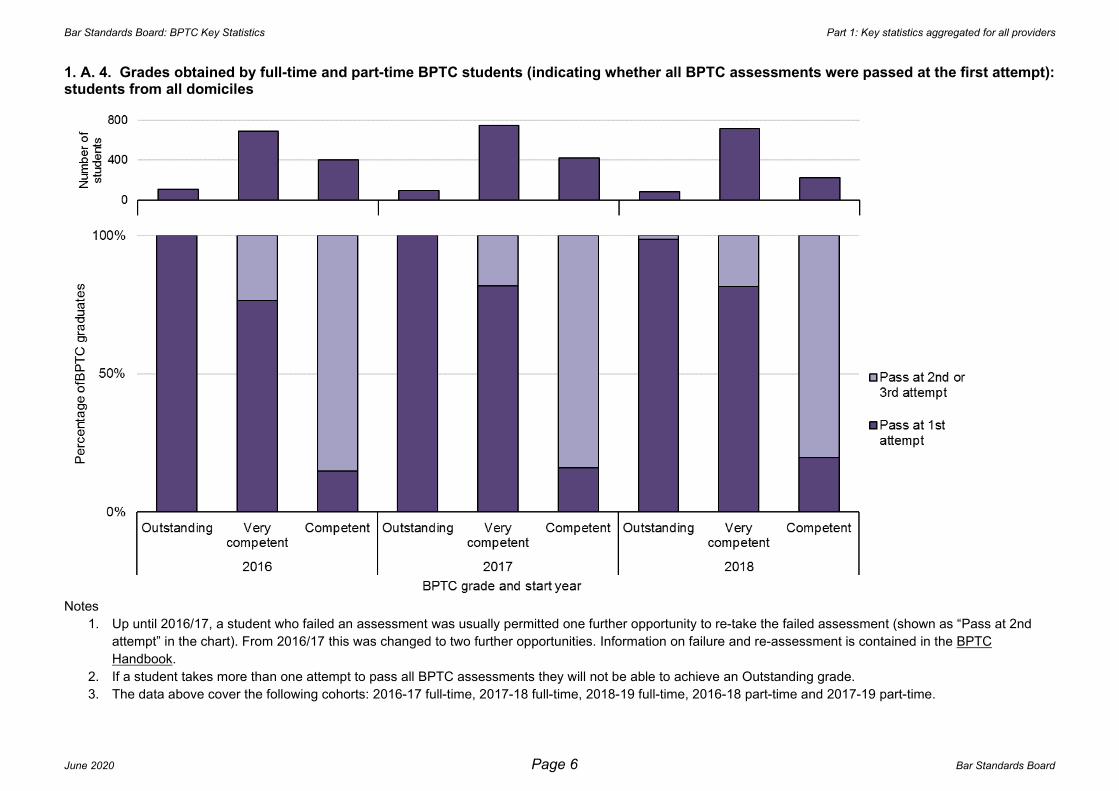
1. A. 4. Grades obtained by full-time and part-time BPTC students (indicating whether all BPTC assessments were passed at the first attempt): students from all domiciles
Notes
1. Up until 2016/17, a student who failed an assessment was usually permitted one further opportunity to re-take the failed assessment (shown as “Pass at 2nd
attempt” in the chart). From 2016/17 this was changed to two further opportunities. Information on failure and re-assessment is contained in the BPTC
Handbook.
2. If a student takes more than one attempt to pass all BPTC assessments they will not be able to achieve an Outstanding grade.
3. The data above cover the following cohorts: 2016-17 full-time, 2017-18 full-time, 2018-19 full-time, 2016-18 part-time and 2017-19 part-time.
Bar Standards Board: BPTC Key Statistics Part 1: Key statistics aggregated for all providers
June 2020 Page 7 Bar Standards Board
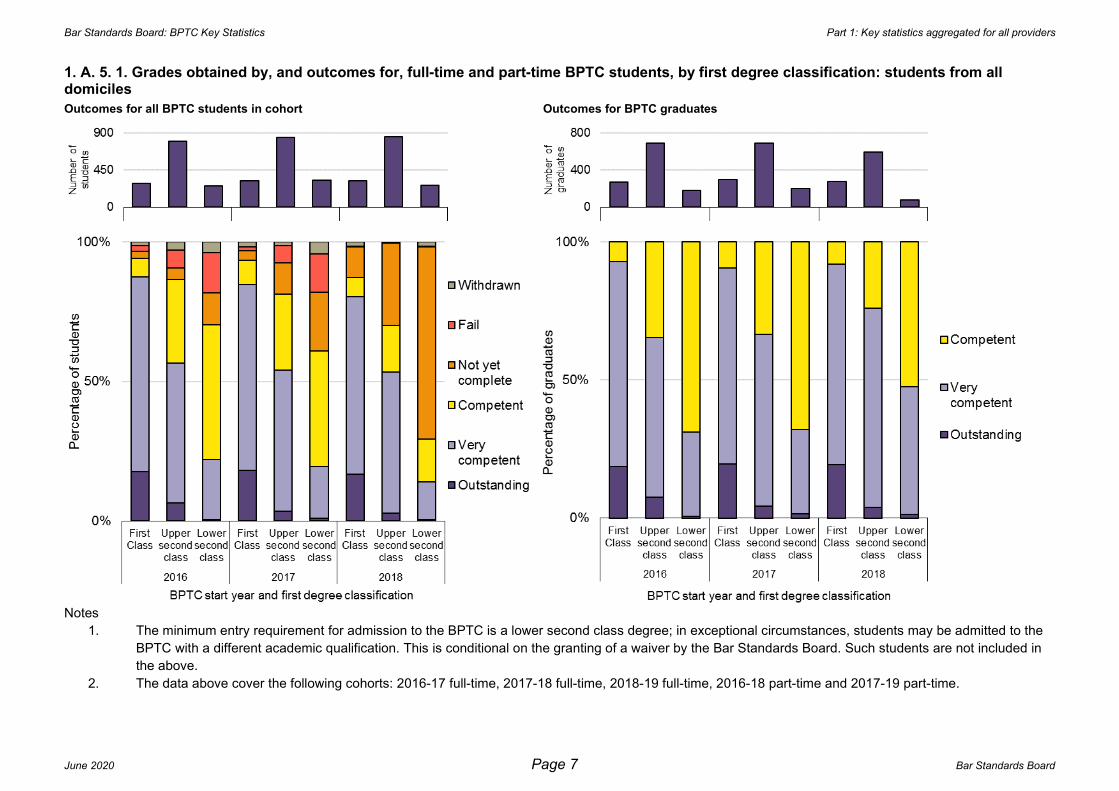
1. A. 5. 1. Grades obtained by, and outcomes for, full-time and part-time BPTC students, by first degree classification: students from all domiciles
Outcomes for all BPTC students in cohort Outcomes for BPTC graduates
Notes
1. The minimum entry requirement for admission to the BPTC is a lower second class degree; in exceptional circumstances, students may be admitted to the
BPTC with a different academic qualification. This is conditional on the granting of a waiver by the Bar Standards Board. Such students are not included in
the above.
2. The data above cover the following cohorts: 2016-17 full-time, 2017-18 full-time, 2018-19 full-time, 2016-18 part-time and 2017-19 part-time.

Bar Standards Board: BPTC Key Statistics Part 1: Key statistics aggregated for all providers
June 2020 Page 8 Bar Standards Board
1. A. 5. 2. Grades obtained by, and outcomes for, full-time and part-time BPTC students, by first degree classification: UK/EU domiciled students
Outcomes for all BPTC students in cohort Outcomes for BPTC graduates
Notes
1. The minimum entry requirement for admission to the BPTC is a lower second class degree; in exceptional circumstances, students may be admitted to the
BPTC with a different academic qualification. This is conditional on the granting of a waiver by the Bar Standards Board. Such students are not included in
the above.
2. The data above cover the following cohorts: 2016-17 full-time, 2017-18 full-time, 2018-19 full-time, 2016-18 part-time and 2017-19 part-time.
Bar Standards Board: BPTC Key Statistics Part 1: Key statistics aggregated for all providers
June 2020 Page 9 Bar Standards Board
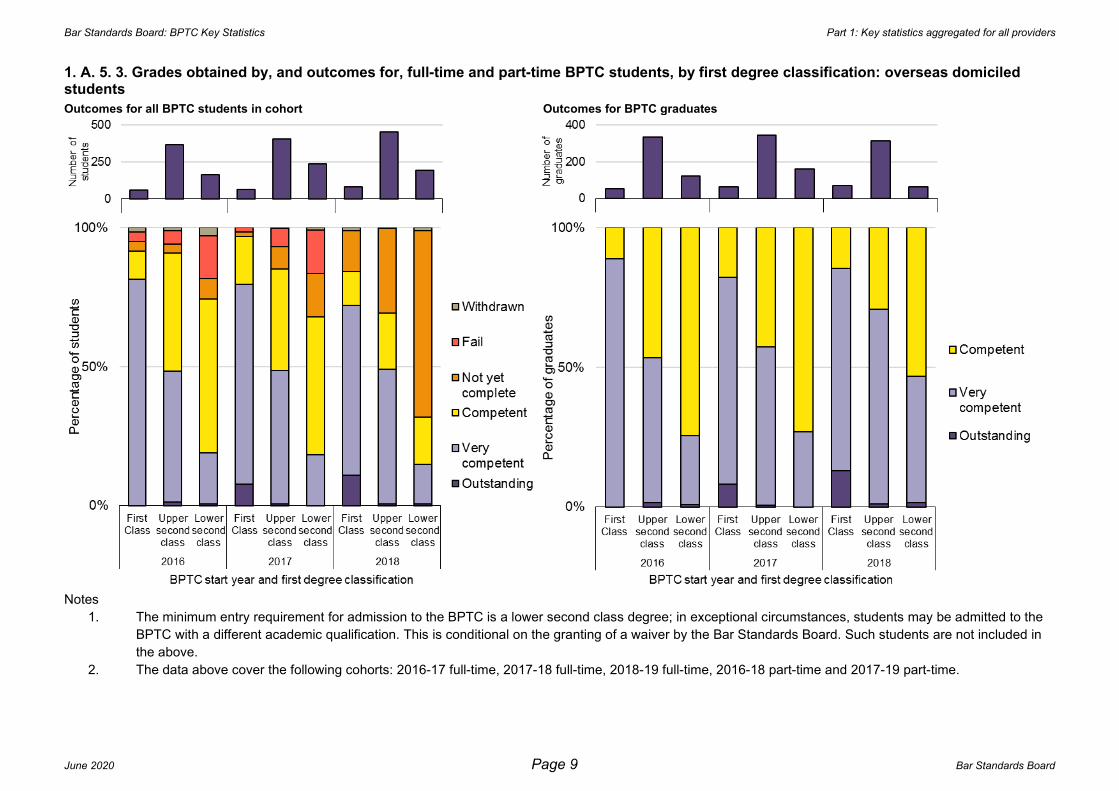
1. A. 5. 3. Grades obtained by, and outcomes for, full-time and part-time BPTC students, by first degree classification: overseas domiciled students
Outcomes for all BPTC students in cohort Outcomes for BPTC graduates
Notes
1. The minimum entry requirement for admission to the BPTC is a lower second class degree; in exceptional circumstances, students may be admitted to the
BPTC with a different academic qualification. This is conditional on the granting of a waiver by the Bar Standards Board. Such students are not included in
the above.
2. The data above cover the following cohorts: 2016-17 full-time, 2017-18 full-time, 2018-19 full-time, 2016-18 part-time and 2017-19 part-time.

Bar Standards Board: BPTC Key Statistics Part 1: Key statistics aggregated for all providers
June 2020 Page 10 Bar Standards Board
1. A. 6. Grades obtained by, and outcomes for, full-time and part-time BPTC students, by domicile
Outcomes for all BPTC students in cohort Outcomes for BPTC graduates
Notes
1. This chart shows domicile, ie the student's place of permanent residence prior to starting the course.
2. Data for students from the United Kingdom and the European Union have been merged.
3. The data above cover the following cohorts: 2016-17 full-time, 2017-18 full-time, 2018-19 full-time, 2016-18 part-time and 2017-19 part-time.

Bar Standards Board: BPTC Key Statistics Part 1: Key statistics aggregated for all providers
June 2020 Page 11 Bar Standards Board
Tables A7, A8 and A9 set out data on protected characteristics in line with the Bar Standards Board equality and diversity guidelines.
The requirement to retain and provide diversity data applies to all publicly funded higher education institutions in the United Kingdom; not all BPTC providers are governed by this requirement.
1. A. 7. 1. Grades obtained by, and outcomes for, full-time and part-time BPTC students, by ethnicity: students from all domiciles
Notes
1. Students are not required to declare their ethnicity but around 94 per cent of all 2016-2018 enrolled students have done so. Data for those where
information on ethnicity has not been provided are not included in the above.
2. The data above cover the following cohorts: 2016-17 full-time, 2017-18 full-time, 2018-19 full-time, 2016-18 part-time and 2017-19 part-time.

Bar Standards Board: BPTC Key Statistics Part 1: Key statistics aggregated for all providers
June 2020 Page 12 Bar Standards Board
1. A. 7. 2. Grades obtained by, and outcomes for, full-time and part-time BPTC students, by ethnicity and first degree classification: UK/EU domiciled students - 2016-2018 aggregated
Notes
1. Students are not required to declare their ethnicity, but around 94 per cent of all 2016-2018 enrolled students have done so. Data for those where
information on ethnicity has not been provided are not included in the above.
2. The data above cover the following cohorts: 2016-17 full-time, 2017-18 full-time, 2018-19 full-time, 2016-18 part-time and 2017-19 part-time.

Bar Standards Board: BPTC Key Statistics Part 1: Key statistics aggregated for all providers
June 2020 Page 13 Bar Standards Board
1. A. 7. 3. Grades obtained by, and outcomes for, full-time and part-time BPTC students, by ethnicity and first degree classification: Overseas domiciled students - 2016-2018 aggregated
Notes
1. Students are not required to declare their ethnicity, but around 94 per cent of all 2016-2018 enrolled students have done so. Data for those where
information on ethnicity has not been provided are not included in the above.
2. The data above cover the following cohorts: 2016-17 full-time, 2017-18 full-time, 2018-19 full-time, 2016-18 part-time and 2017-19 part-time.
3. The number of overseas domiciled students with a first-class degree was too small to provide meaningful statistics.

Bar Standards Board: BPTC Key Statistics Part 1: Key statistics aggregated for all providers
June 2020 Page 14 Bar Standards Board
1. A. 8. 1. Grades obtained by, and outcomes for, full-time and part-time BPTC students, by gender: students from all domiciles
Outcomes for all BPTC students in cohort Outcomes for BPTC graduates
Notes
1. Students are not required to declare their gender, but almost 100 per cent of all 2016-2018 enrolled students have done so. Data for those where
information on gender has not been provided are not included in the above.
2. The data above cover the following cohorts: 2016-17 full-time, 2017-18 full-time, 2018-19 full-time, 2016-18 part-time and 2017-19 part-time.
Bar Standards Board: BPTC Key Statistics Part 1: Key statistics aggregated for all providers
June 2020 Page 15 Bar Standards Board
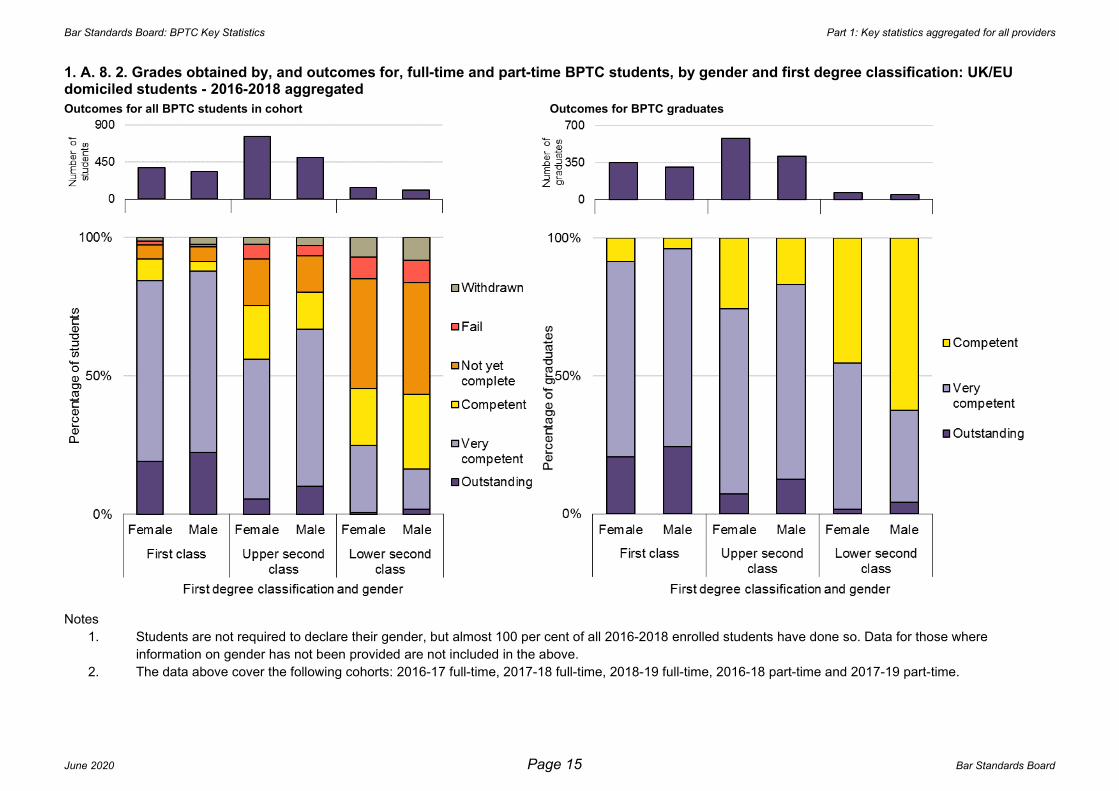
1. A. 8. 2. Grades obtained by, and outcomes for, full-time and part-time BPTC students, by gender and first degree classification: UK/EU domiciled students - 2016-2018 aggregated
Outcomes for all BPTC students in cohort Outcomes for BPTC graduates
Notes
1. Students are not required to declare their gender, but almost 100 per cent of all 2016-2018 enrolled students have done so. Data for those where
information on gender has not been provided are not included in the above.
2. The data above cover the following cohorts: 2016-17 full-time, 2017-18 full-time, 2018-19 full-time, 2016-18 part-time and 2017-19 part-time.

Bar Standards Board: BPTC Key Statistics Part 1: Key statistics aggregated for all providers
June 2020 Page 16 Bar Standards Board
1. A. 8. 3. Grades obtained by, and outcomes for, full-time and part-time BPTC students, by gender and first degree classification: overseas domiciled students - 2016-2018 aggregated
Outcomes for all BPTC students in cohort Outcomes for BPTC graduates
Notes
1. Students are not required to declare their gender, but almost 100 per cent of all 2016-2018 enrolled students have done so. Data for those where
information on gender has not been provided are not included in the above.
2. The data above cover the following cohorts: 2016-17 full-time, 2017-18 full-time, 2018-19 full-time, 2016-18 part-time and 2017-19 part-time.

Bar Standards Board: BPTC Key Statistics Part 1: Key statistics aggregated for all providers
June 2020 Page 17 Bar Standards Board
1. A. 9. 1. Grades obtained by, and outcomes for, full-time and part-time BPTC students, by disability: students from all domiciles
Outcomes for all BPTC students in cohort Outcomes for BPTC graduates
Notes
1. Students are not required to declare their disability status, but almost 100 per cent of all 2016-2018 enrolled students have done so. Data for those where
information on disability status has not been provided are not included in the above.
2. The data above cover the following cohorts: 2016-17 full-time, 2017-18 full-time, 2018-19 full-time, 2016-18 part-time and 2017-19 part-time.

Bar Standards Board: BPTC Key Statistics Part 1: Key statistics aggregated for all providers
June 2020 Page 18 Bar Standards Board
1. A. 9. 2. Grades obtained by, and outcomes for, full-time and part-time BPTC students, by disability and first degree classification: UK/EU domiciled students - 2016-2018 aggregated
Outcomes for all BPTC students in cohort Outcomes for BPTC graduates
Notes
1. Students are not required to declare their disability status, but almost 100 per cent of all 2016-2018 enrolled students have done so. Data for those where
information on disability status has not been provided are not included in the above.
2. The data above cover the following cohorts: 2016-17 full-time, 2017-18 full-time, 2018-19 full-time, 2016-18 part-time and 2017-19 part-time.

Bar Standards Board: BPTC Key Statistics Part 1: Key statistics aggregated for all providers
June 2020 Page 19 Bar Standards Board
1. A. 9. 3. Grades obtained by, and outcomes for, full-time and part-time BPTC students, by disability and first degree classification: Overseas domiciled students - 2016-2018 aggregated
Notes
1. Students are not required to declare their disability status, but almost 100 per cent of all 2016-2018 enrolled students have done so. Data for those where
information on disability status has not been provided are not included in the above.
2. The data above cover the following cohorts: 2016-17 full-time, 2017-18 full-time, 2018-19 full-time, 2016-18 part-time and 2017-19 part-time.
Bar Standards Board: BPTC Key Statistics Part 1: Key statistics aggregated for all providers
June 2020 Page 20 Bar Standards Board
1. B. Profile of full-time and part-time BPTC students
1. B. sets out an overview of key profile data for full-time and part-time students enrolled on the BPTC.
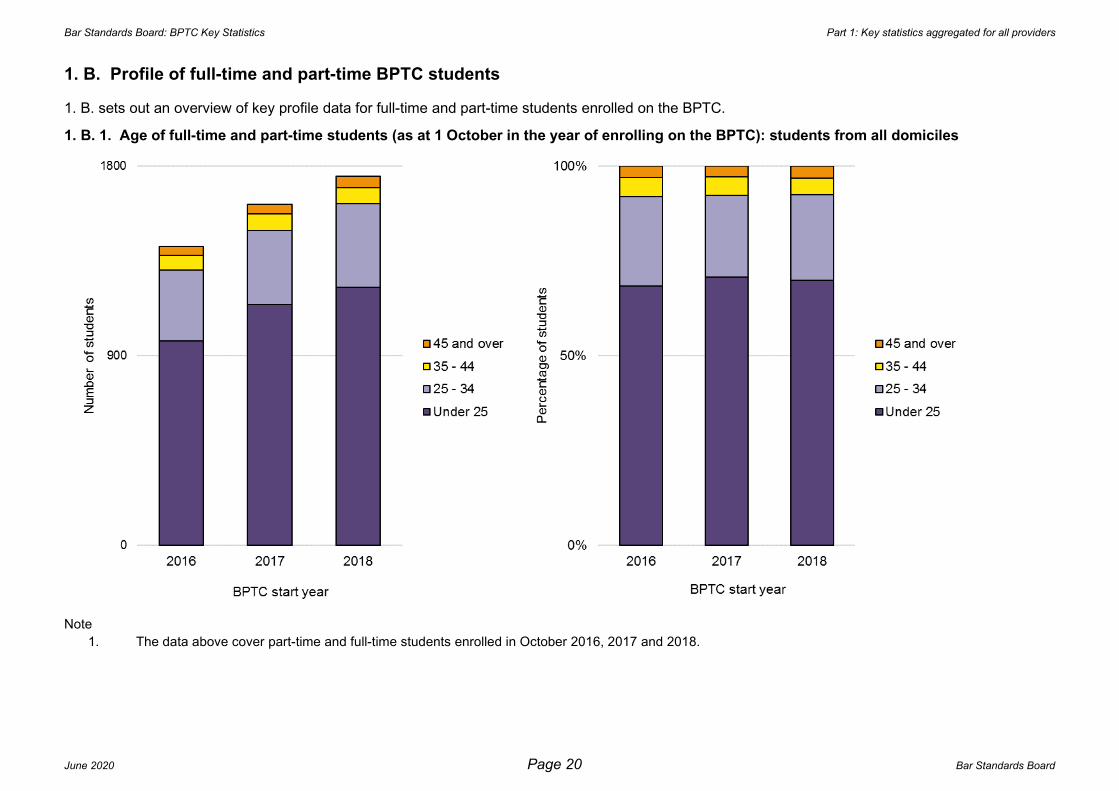
1. B. 1. Age of full-time and part-time students (as at 1 October in the year of enrolling on the BPTC): students from all domiciles
Note
1. The data above cover part-time and full-time students enrolled in October 2016, 2017 and 2018.

Bar Standards Board: BPTC Key Statistics Part 1: Key statistics aggregated for all providers
June 2020 Page 21 Bar Standards Board
1. B. 2. Domicile of full-time and part-time BPTC students
Notes
1. This chart shows domicile i.e. the student's place of permanent residence prior to starting the course.
2. Data for students from the United Kingdom and the European Union have been merged.
3. The data above cover part-time and full-time students enrolled in October 2016, 2017 and 2018.
Bar Standards Board: BPTC Key Statistics Part 1: Key statistics aggregated for all providers
June 2020 Page 22 Bar Standards Board
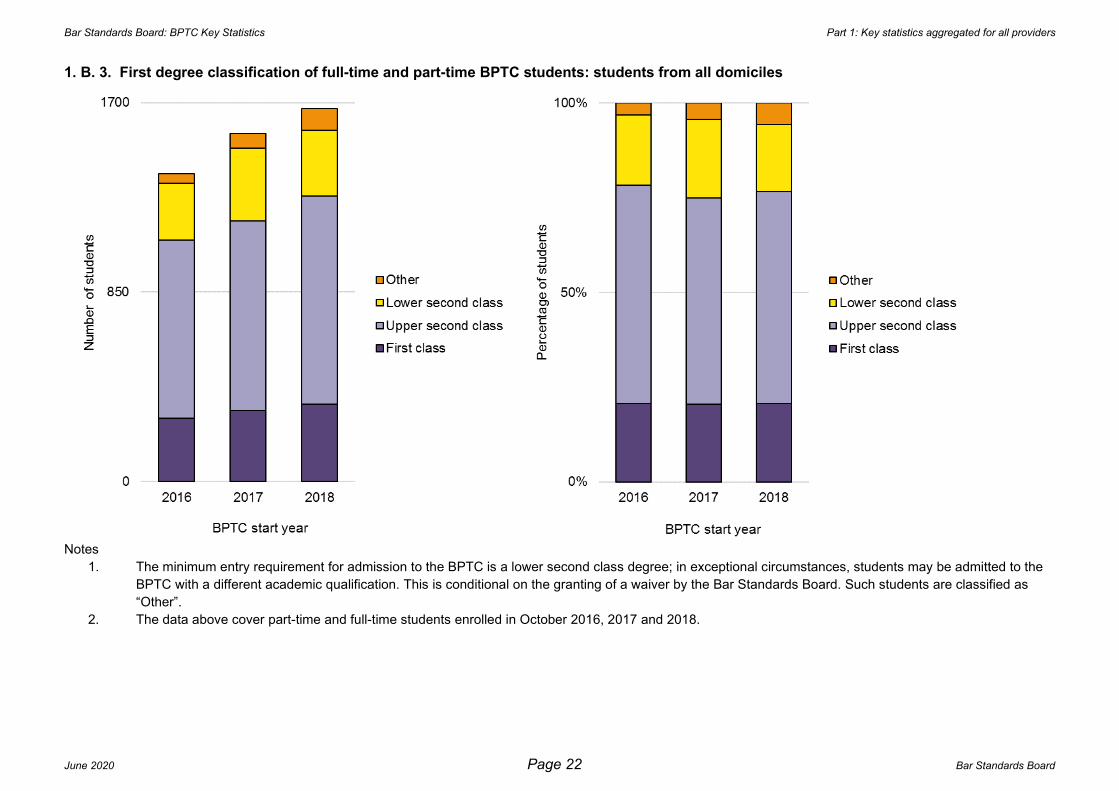
1. B. 3. First degree classification of full-time and part-time BPTC students: students from all domiciles
Notes
1. The minimum entry requirement for admission to the BPTC is a lower second class degree; in exceptional circumstances, students may be admitted to the
BPTC with a different academic qualification. This is conditional on the granting of a waiver by the Bar Standards Board. Such students are classified as
“Other”.
2. The data above cover part-time and full-time students enrolled in October 2016, 2017 and 2018.

Bar Standards Board: BPTC Key Statistics Part 1: Key statistics aggregated for all providers
June 2020 Page 23 Bar Standards Board
1. B. 4. First degree classification of full-time and part-time BPTC students, by domicile
Notes
1. This table shows the distribution of first degree classifications grouped by domicile.
2. Not all BPTC providers have provided students' domicile and first degree classification.
3. Students who did not gain a first class, upper second class or lower second class degree and were admitted to the BPTC with a different academic
qualification are classified as “Other”.
4. The data above cover part-time and full-time students enrolled in October 2016, 2017 and 2018.

Bar Standards Board: BPTC Key Statistics Part 1: Key statistics aggregated for all providers
June 2020 Page 24 Bar Standards Board
1. B. 5. Ranking of university at which full-time and part-time BPTC students studied for first degree: students from all domiciles
Notes
1. The top fifty universities for each year have been taken from the Times and Sunday Times Good University Guide (for each academic year).
2. The data above cover part-time and full-time students enrolled in October 2016, 2017 and 2018.

Bar Standards Board: BPTC Key Statistics Part 1: Key statistics aggregated for all providers
June 2020 Page 25 Bar Standards Board
1. B. 6. Full-time and part-time BPTC students who completed a law degree or Graduate Diploma in Law (GDL): students from all domiciles
Notes
1. The specific entry requirements for the BPTC are contained in the BPTC Handbook.
2. The GDL is also known as the Common Professional Examination.
3. The data above cover part-time and full-time students enrolled in October 2016, 2017 and 2018.

Bar Standards Board: BPTC Key Statistics Part 1: Key statistics aggregated for all providers
June 2020 Page 26 Bar Standards Board
Tables B7, B8 and B9 set out data on protected characteristics in line with the Bar Standards Board equality and diversity guidelines.
The requirement to retain and provide diversity data applies to all publicly funded higher education institutions in the United Kingdom; not all BPTC providers are
governed by this requirement.
1. B. 7. Ethnicity of full-time and part-time BPTC students by domicile
Notes
1. Students are not required to declare their ethnicity, but around 94 per cent of all 2016-2018 enrolled students have done so. Data for those where information on ethnicity has not been provided are not included in the above.
2. The data above cover part-time and full-time students enrolled in October 2016, 2017 and 2018.

Bar Standards Board: BPTC Key Statistics Part 1: Key statistics aggregated for all providers
June 2020 Page 27 Bar Standards Board
1. B. 8. Gender of full-time and part-time BPTC students by domicile
Notes
1. Students are not required to declare their gender, but almost 100 per cent of all 2016-2018 enrolled students have done so. Data for those where
information on gender has not been provided are not included in the above.
2. The data above cover part-time and full-time students enrolled in October 2016, 2017 and 2018.

Bar Standards Board: BPTC Key Statistics Part 1: Key statistics aggregated for all providers
June 2020 Page 28 Bar Standards Board
1. B. 9. Declared disability of full-time and part-time BPTC students: students from all domiciles
Notes
1. Students are not required to declare their disability status, but almost 100 per cent of all 2016-2018 enrolled students have done so. Data for those where
information on disability status has not been provided, are not included in the above.
2. The data above cover part-time and full-time students enrolled in October 2016, 2017 and 2018.

Bar Standards Board: BPTC Key Statistics Part 2: Key statistics by provider (full-time BPTC students)
June 2020 Page 29 Bar Standards Board
BPTC Key Statistics
2020
Part 2: Key statistics by provider (full-time BPTC students)

Bar Standards Board: BPTC Key Statistics Part 2: Key statistics by provider (full-time BPTC students)
June 2020 Page 30 Bar Standards Board
2. A. BPTC results and outcomes of full-time students
2. A. sets out an overview of the results and outcomes obtained by full-time students enrolled on the BPTC.
2. A. 1. BPTC enrolments: students from all domiciles
Note
1. The number of enrolments are those reported and validated by providers in the collection of key statistics.
Bar Standards Board: BPTC Key Statistics Part 2: Key statistics by provider (full-time BPTC students)
June 2020 Page 31 Bar Standards Board
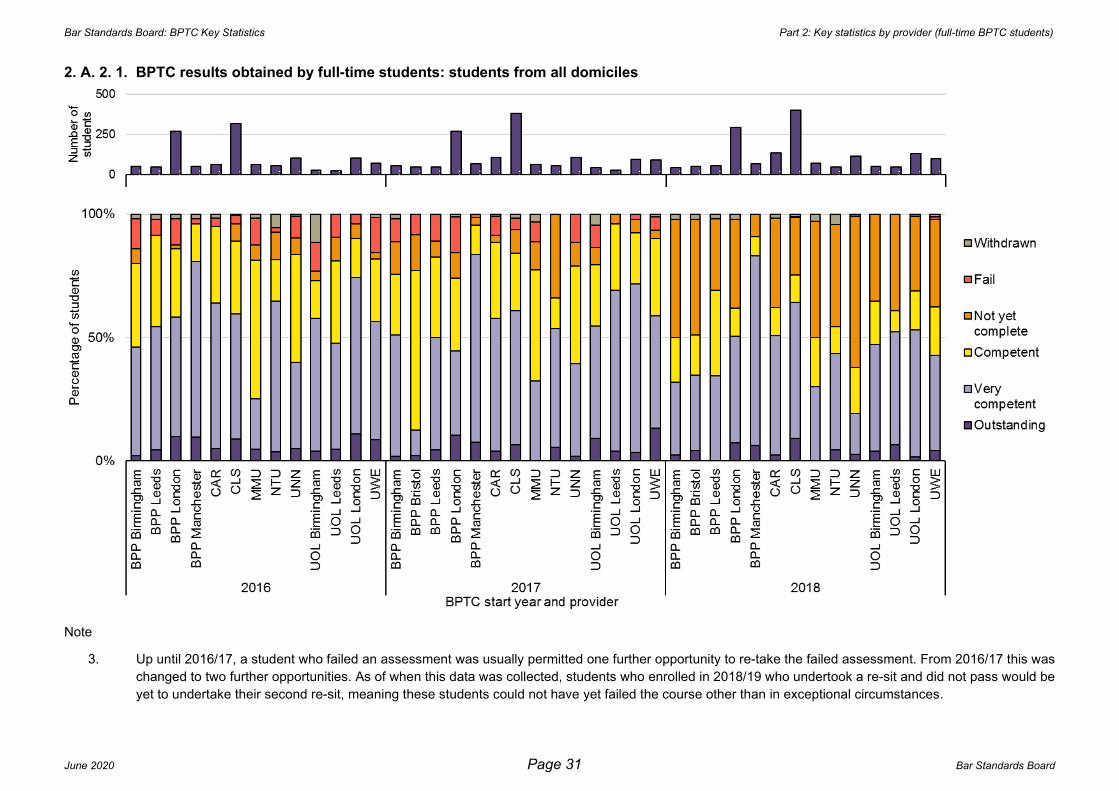
2. A. 2. 1. BPTC results obtained by full-time students: students from all domiciles
Note
3. Up until 2016/17, a student who failed an assessment was usually permitted one further opportunity to re-take the failed assessment. From 2016/17 this was
changed to two further opportunities. As of when this data was collected, students who enrolled in 2018/19 who undertook a re-sit and did not pass would be
yet to undertake their second re-sit, meaning these students could not have yet failed the course other than in exceptional circumstances.

Bar Standards Board: BPTC Key Statistics Part 2: Key statistics by provider (full-time BPTC students)
June 2020 Page 32 Bar Standards Board
2. A. 2. 2. BPTC results obtained by full-time students (grades of BPTC graduates only): students from all domiciles

Bar Standards Board: BPTC Key Statistics Part 2: Key statistics by provider (full-time BPTC students)
June 2020 Page 33 Bar Standards Board
2. A. 3. Percentage of enrolled full-time students who have completed the BPTC as of summer 2019: students from all domiciles

Bar Standards Board: BPTC Key Statistics Part 2: Key statistics by provider (full-time BPTC students)
June 2020 Page 34 Bar Standards Board
2. A. 4. Number and percentage of full-time students who passed all BPTC assessments at first or second attempt by provider: students from all domiciles
Notes
1. Previously, a student who failed an assessment was usually permitted one further opportunity to re-take the failed assessment (shown as “Pass at 2nd
attempt” in the chart). From 2016/17 this was changed to two further opportunities. Information on failure and re-assessment is contained in the BPTC
Handbook.
2. If a student takes more than one attempt to pass all BPTC assessments they will not be able to achieve an “Outstanding” grade.

Bar Standards Board: BPTC Key Statistics Part 2: Key statistics by provider (full-time BPTC students)
June 2020 Page 35 Bar Standards Board
2. A. 5. 1. Grades obtained by, and outcomes for, full-time BPTC students, by first degree classification: students from all domiciles – 2016-2018 aggregated
Notes
1. The minimum entry requirement for admission to the BPTC is a lower second class degree; in exceptional circumstances, students may be admitted to the
BPTC with a different academic qualification. This is conditional on the granting of a waiver by the Bar Standards Board. Such students are not included in
these charts.
2. The results of several providers are not represented in the above owing to a small number of students (<20).

Bar Standards Board: BPTC Key Statistics Part 2: Key statistics by provider (full-time BPTC students)
June 2020 Page 36 Bar Standards Board
2. A. 5. 2. Grades obtained by, and outcomes for, full-time BPTC graduates, by first degree classification: students from all domiciles – 2016-2018 aggregated
Notes
1. The minimum entry requirement for admission to the BPTC is a lower second class degree; in exceptional circumstances, students may be admitted to the
BPTC with a different academic qualification. This is conditional on the granting of a waiver by the Bar Standards Board. Such students are not included in
these charts.
2. The results of several providers are not represented in the above owing to a small number of students (<20).

Bar Standards Board: BPTC Key Statistics Part 2: Key statistics by provider (full-time BPTC students)
June 2020 Page 37 Bar Standards Board
2. A. 5. 3. Grades obtained by, and outcomes for, full-time BPTC students, by first degree classification: UK/EU domiciled students – 2016-2018 aggregated
Notes
1. The minimum entry requirement for admission to the BPTC is a lower second class degree; in exceptional circumstances, students may be admitted to the
BPTC with a different academic qualification. This is conditional on the granting of a waiver by the Bar Standards Board. Such students are not included in
these charts.
2. The results of several providers are not represented in the above owing to a small number of students (<20).
Bar Standards Board: BPTC Key Statistics Part 2: Key statistics by provider (full-time BPTC students)
June 2020 Page 38 Bar Standards Board
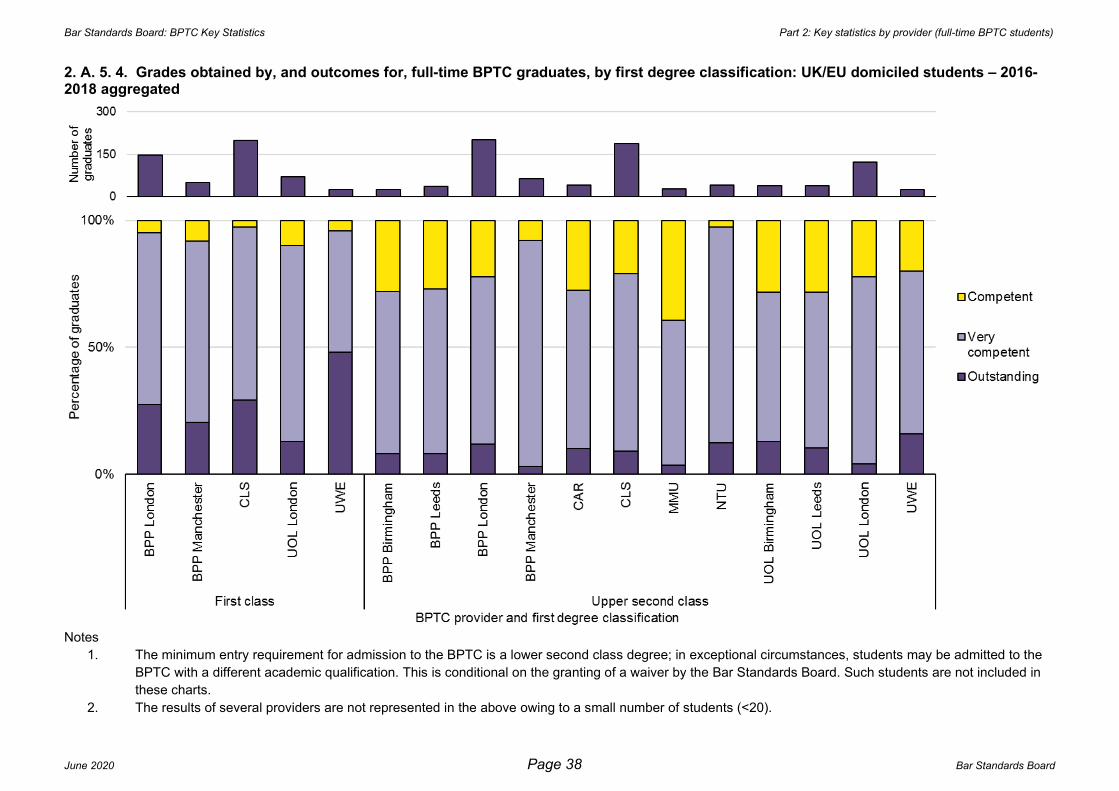
2. A. 5. 4. Grades obtained by, and outcomes for, full-time BPTC graduates, by first degree classification: UK/EU domiciled students – 2016-2018 aggregated
Notes
1. The minimum entry requirement for admission to the BPTC is a lower second class degree; in exceptional circumstances, students may be admitted to the
BPTC with a different academic qualification. This is conditional on the granting of a waiver by the Bar Standards Board. Such students are not included in
these charts.
2. The results of several providers are not represented in the above owing to a small number of students (<20).

Bar Standards Board: BPTC Key Statistics Part 2: Key statistics by provider (full-time BPTC students)
June 2020 Page 39 Bar Standards Board
2. A. 5. 5. Grades obtained by, and outcomes for, full-time BPTC students, by first degree classification: Overseas domiciled students – 2016-2018 aggregated
Notes
1. The minimum entry requirement for admission to the BPTC is a lower second class degree; in exceptional circumstances, students may be admitted to the
BPTC with a different academic qualification. This is conditional on the granting of a waiver by the Bar Standards Board. Such students are not included in
these charts.
2. The results of several providers are not represented in the above owing to a small number of students (< 20).
Bar Standards Board: BPTC Key Statistics Part 2: Key statistics by provider (full-time BPTC students)
June 2020 Page 40 Bar Standards Board
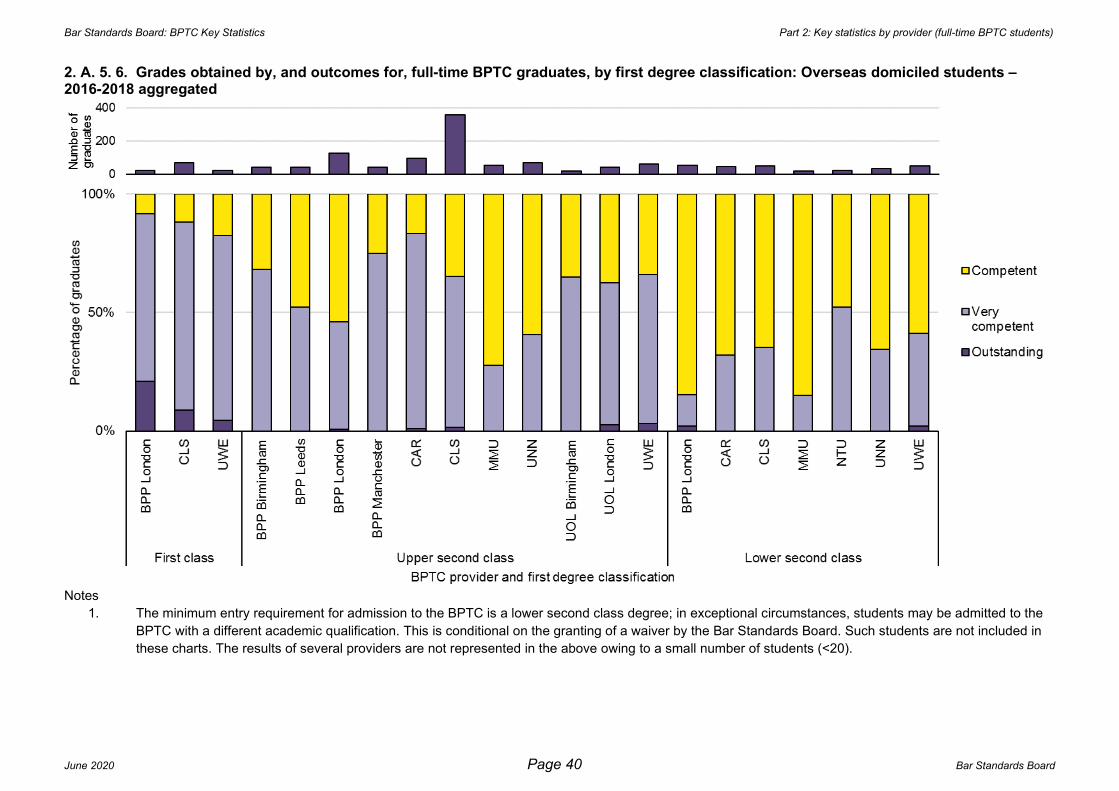
2. A. 5. 6. Grades obtained by, and outcomes for, full-time BPTC graduates, by first degree classification: Overseas domiciled students – 2016-2018 aggregated
Notes
1. The minimum entry requirement for admission to the BPTC is a lower second class degree; in exceptional circumstances, students may be admitted to the
BPTC with a different academic qualification. This is conditional on the granting of a waiver by the Bar Standards Board. Such students are not included in
these charts. The results of several providers are not represented in the above owing to a small number of students (<20).

Bar Standards Board: BPTC Key Statistics Part 2: Key statistics by provider (full-time BPTC students)
June 2020 Page 41 Bar Standards Board
2. A. 6. Grades obtained by, and outcomes for, full-time BPTC students, by domicile: those with an upper second-class first-degree classification only – 2016-2018 aggregated
Notes
1. This chart shows domicile i.e. the student's place of permanent residence prior to starting the course.
2. Data for students from the United Kingdom and the European Union have been merged.
3. The results of several providers are not represented in the above owing to a small number of students (<20).
4. Chart 2.A.6.2 has not been included this year owing to there only being three providers with 20 or more UK/EU students with a lower second class degree.
Bar Standards Board: BPTC Key Statistics Part 2: Key statistics by provider (full-time BPTC students)
June 2020 Page 42 Bar Standards Board
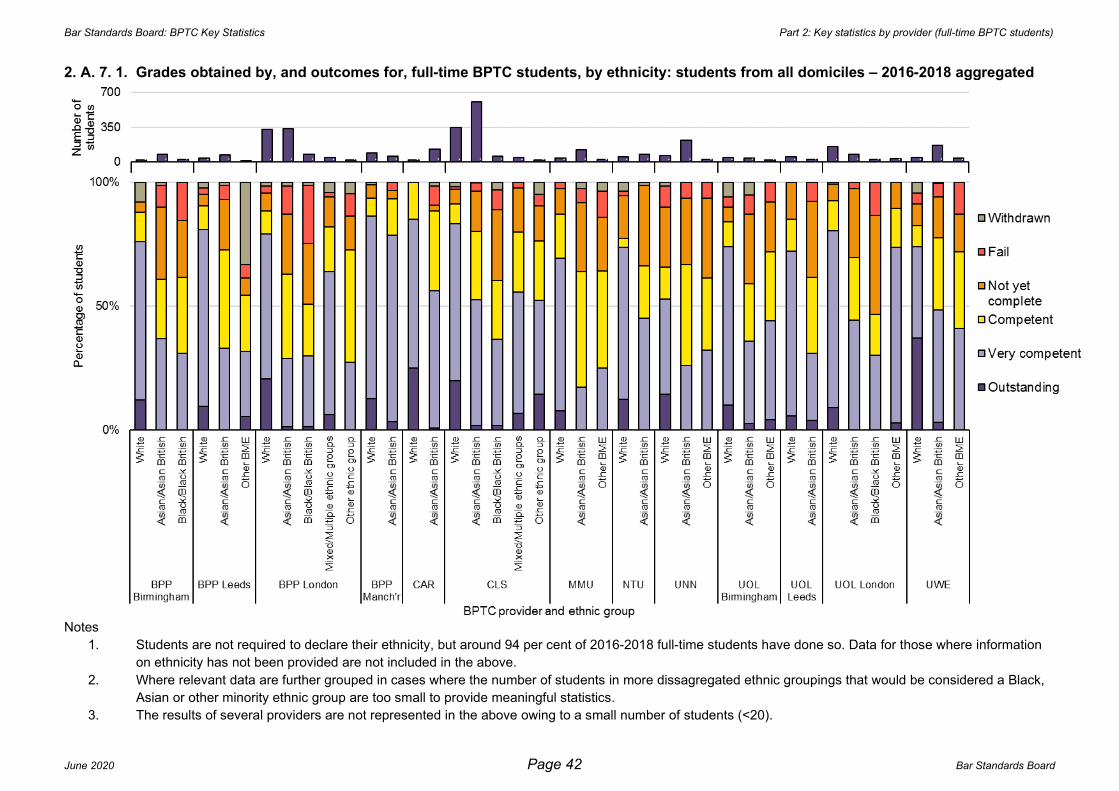
2. A. 7. 1. Grades obtained by, and outcomes for, full-time BPTC students, by ethnicity: students from all domiciles – 2016-2018 aggregated
Notes
1. Students are not required to declare their ethnicity, but around 94 per cent of 2016-2018 full-time students have done so. Data for those where information
on ethnicity has not been provided are not included in the above.
2. Where relevant data are further grouped in cases where the number of students in more dissagregated ethnic groupings that would be considered a Black,
Asian or other minority ethnic group are too small to provide meaningful statistics.
3. The results of several providers are not represented in the above owing to a small number of students (<20).
Bar Standards Board: BPTC Key Statistics Part 2: Key statistics by provider (full-time BPTC students)
June 2020 Page 43 Bar Standards Board
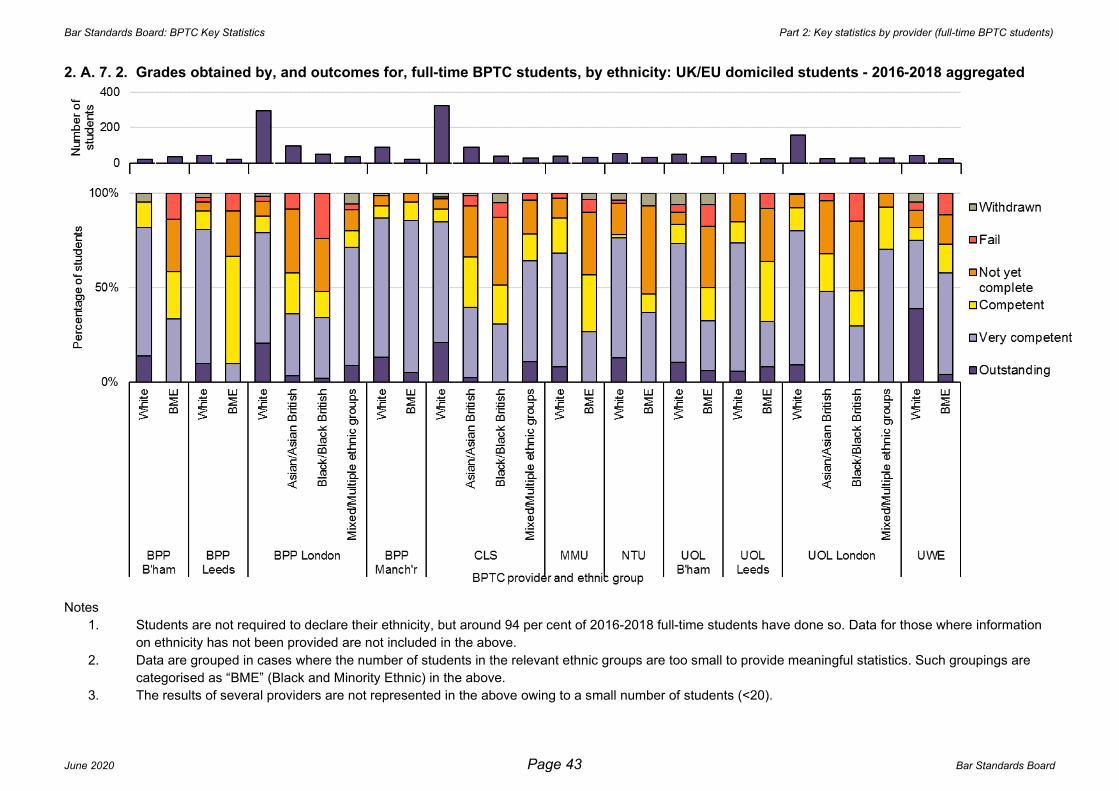
2. A. 7. 2. Grades obtained by, and outcomes for, full-time BPTC students, by ethnicity: UK/EU domiciled students - 2016-2018 aggregated
Notes
1. Students are not required to declare their ethnicity, but around 94 per cent of 2016-2018 full-time students have done so. Data for those where information
on ethnicity has not been provided are not included in the above.
2. Data are grouped in cases where the number of students in the relevant ethnic groups are too small to provide meaningful statistics. Such groupings are
categorised as “BME” (Black and Minority Ethnic) in the above.
3. The results of several providers are not represented in the above owing to a small number of students (<20).
Bar Standards Board: BPTC Key Statistics Part 2: Key statistics by provider (full-time BPTC students)
June 2020 Page 44 Bar Standards Board
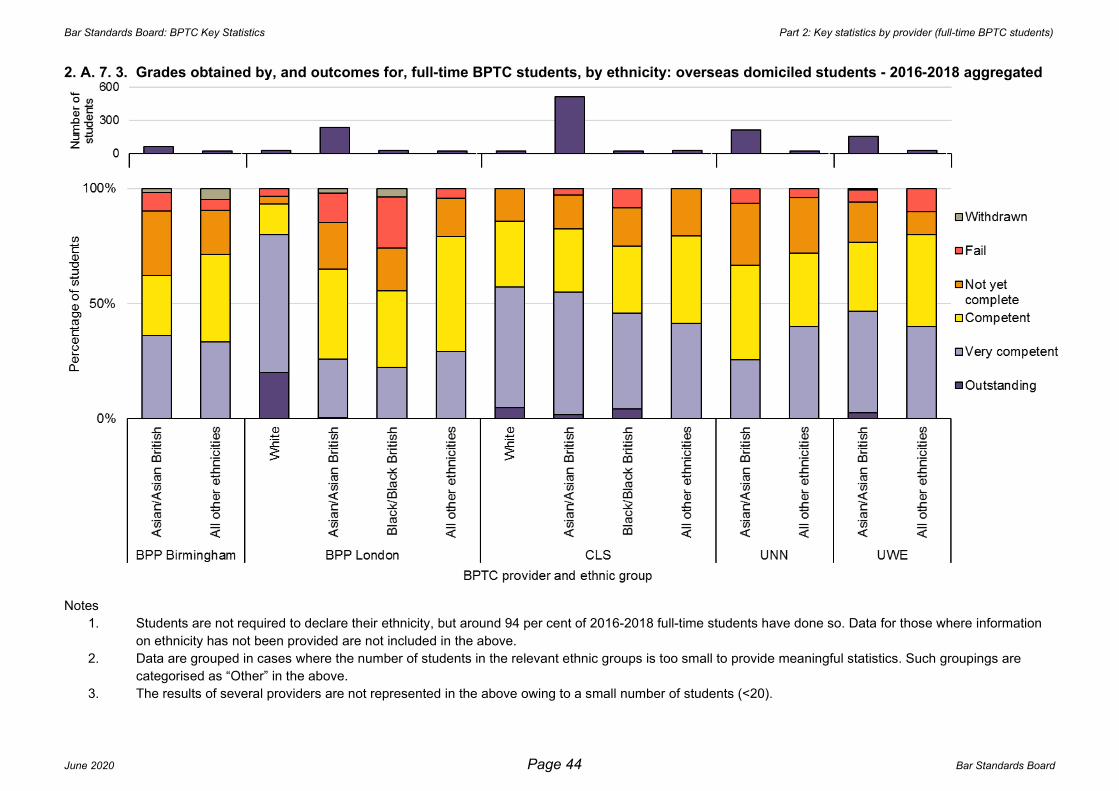
2. A. 7. 3. Grades obtained by, and outcomes for, full-time BPTC students, by ethnicity: overseas domiciled students - 2016-2018 aggregated
Notes
1. Students are not required to declare their ethnicity, but around 94 per cent of 2016-2018 full-time students have done so. Data for those where information
on ethnicity has not been provided are not included in the above.
2. Data are grouped in cases where the number of students in the relevant ethnic groups is too small to provide meaningful statistics. Such groupings are
categorised as “Other” in the above.
3. The results of several providers are not represented in the above owing to a small number of students (<20).
Bar Standards Board: BPTC Key Statistics Part 2: Key statistics by provider (full-time BPTC students)
June 2020 Page 45 Bar Standards Board
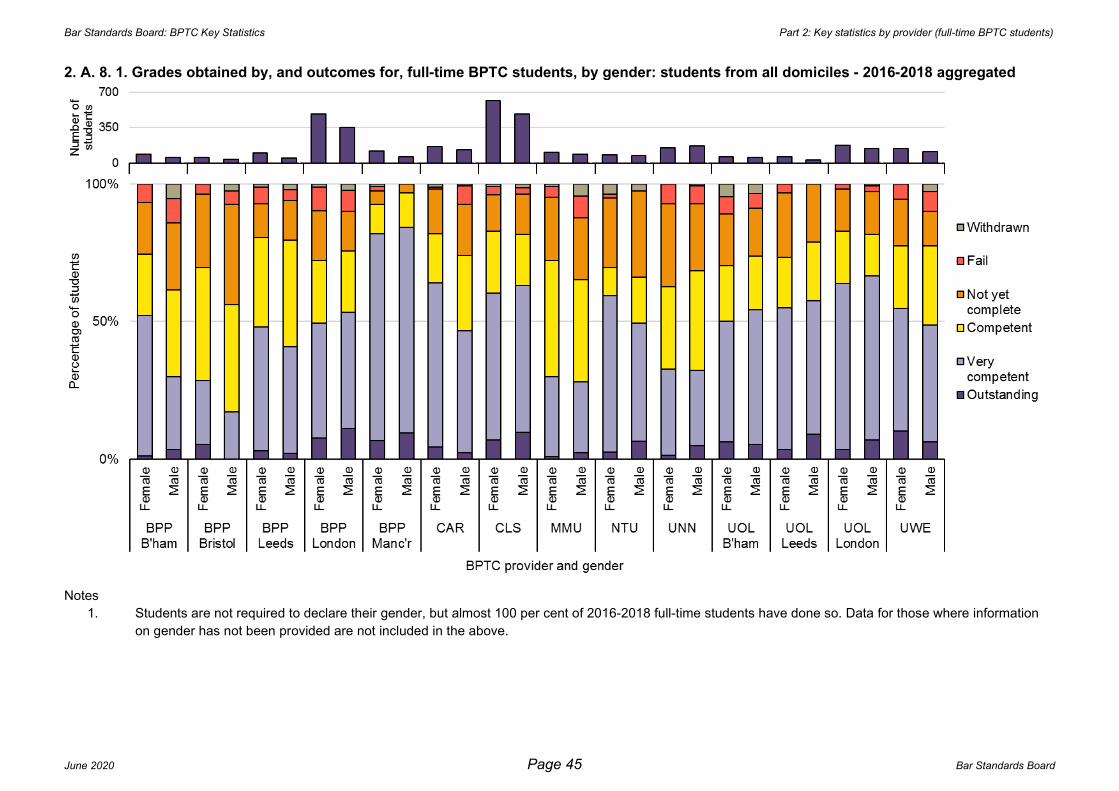
2. A. 8. 1. Grades obtained by, and outcomes for, full-time BPTC students, by gender: students from all domiciles - 2016-2018 aggregated
Notes
1. Students are not required to declare their gender, but almost 100 per cent of 2016-2018 full-time students have done so. Data for those where information
on gender has not been provided are not included in the above.

Bar Standards Board: BPTC Key Statistics Part 2: Key statistics by provider (full-time BPTC students)
June 2020 Page 46 Bar Standards Board
2. A. 8. 2. Grades obtained by, and outcomes for, full-time BPTC students, by gender: UK/EU domiciled students - 2016-2018 aggregated
Notes
1. Students are not required to declare their gender, but almost 100 per cent of 2016-2018 full-time students have done so. Data for those where information on
gender has not been provided are not included in the above.
2. Results for BPP Bristol have not been included in the above owing to small cohort size (<20) for males and females.

Bar Standards Board: BPTC Key Statistics Part 2: Key statistics by provider (full-time BPTC students)
June 2020 Page 47 Bar Standards Board
2. A. 8. 3. Grades obtained by, and outcomes for, full-time BPTC students, by gender: overseas domiciled students - 2016-2018 aggregated
Notes
1. Students are not required to declare their gender, but almost 100 per cent of 2016-2018 full-time students have done so. Data for those where information on
gender has not been provided are not included in the above.
2. Results for UOL Birmingham and UOL Leeds have not been included in the above owing to small cohort size (<20) for males and females.
Bar Standards Board: BPTC Key Statistics Part 2: Key statistics by provider (full-time BPTC students)
June 2020 Page 48 Bar Standards Board
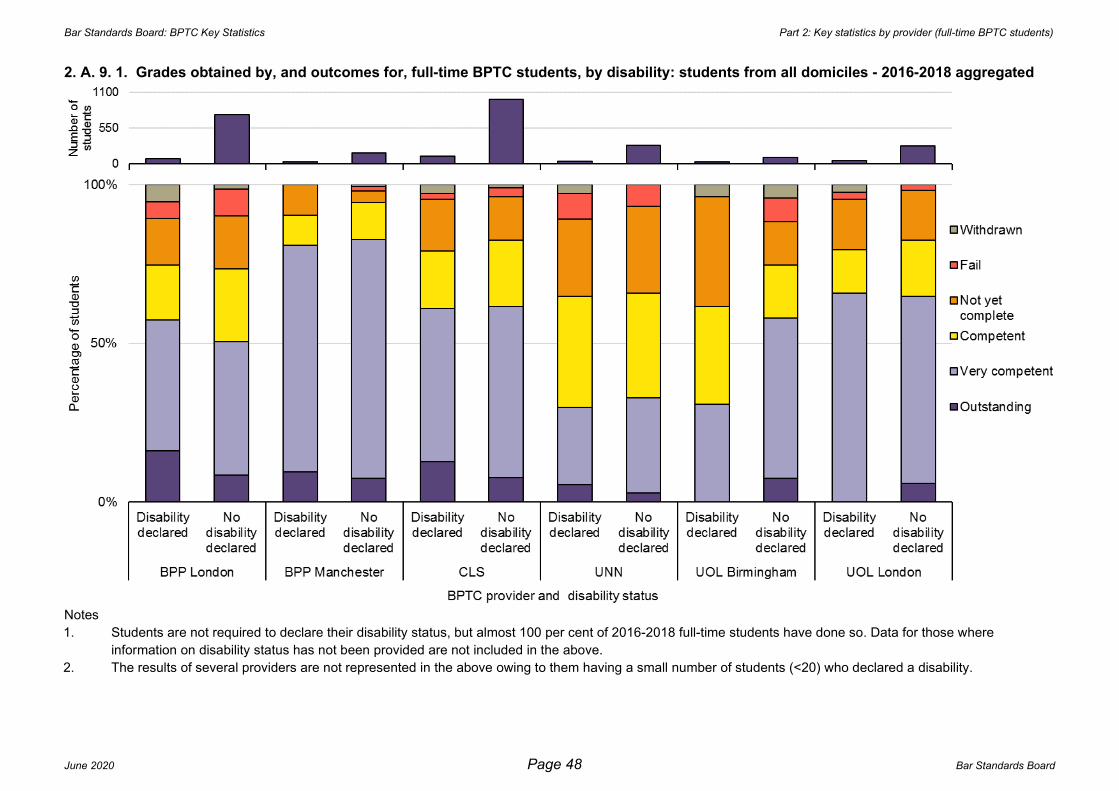
2. A. 9. 1. Grades obtained by, and outcomes for, full-time BPTC students, by disability: students from all domiciles - 2016-2018 aggregated
Notes
1. Students are not required to declare their disability status, but almost 100 per cent of 2016-2018 full-time students have done so. Data for those where
information on disability status has not been provided are not included in the above.
2. The results of several providers are not represented in the above owing to them having a small number of students (<20) who declared a disability.
Bar Standards Board: BPTC Key Statistics Part 2: Key statistics by provider (full-time BPTC students)
June 2020 Page 49 Bar Standards Board
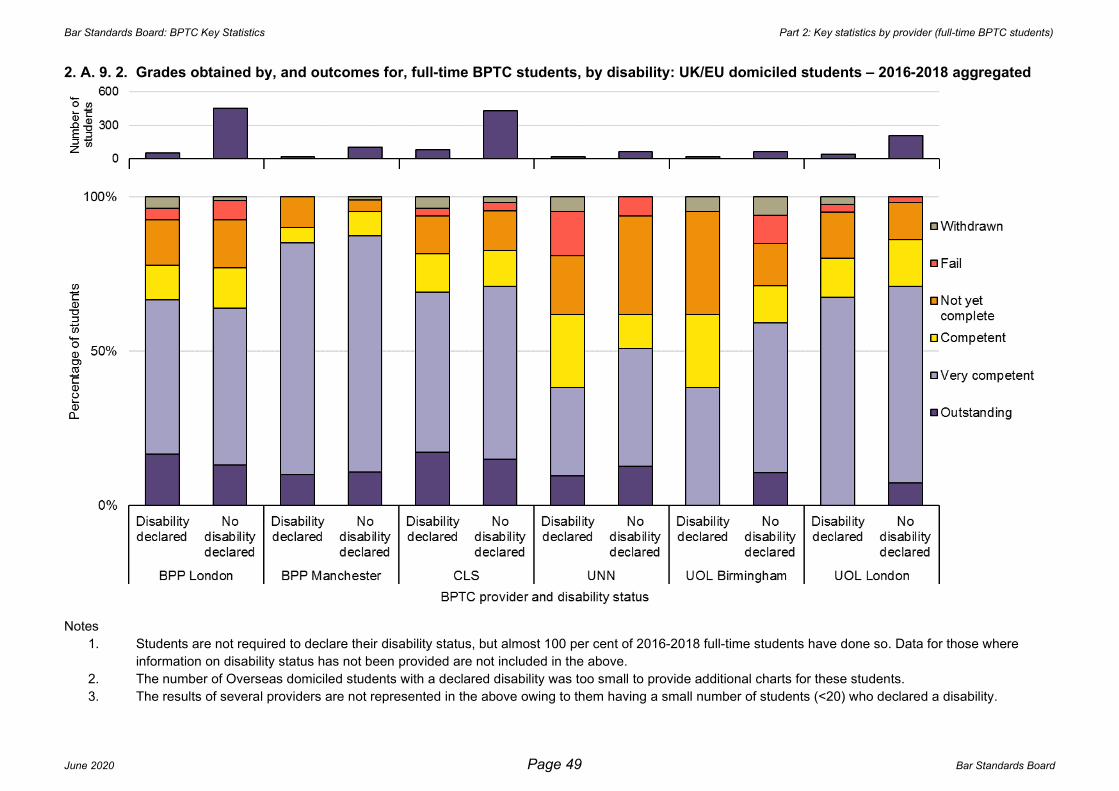
2. A. 9. 2. Grades obtained by, and outcomes for, full-time BPTC students, by disability: UK/EU domiciled students – 2016-2018 aggregated
Notes
1. Students are not required to declare their disability status, but almost 100 per cent of 2016-2018 full-time students have done so. Data for those where
information on disability status has not been provided are not included in the above.
2. The number of Overseas domiciled students with a declared disability was too small to provide additional charts for these students.
3. The results of several providers are not represented in the above owing to them having a small number of students (<20) who declared a disability.

Bar Standards Board: BPTC Key Statistics Part 2: Key statistics by provider (full-time BPTC students)
June 2020 Page 50 Bar Standards Board
2. B. Profile of full-time BPTC students
2. B. sets out an overview of key profile data for full-time students enrolled on the BPTC.
2. B. 1. Age of full-time students (as at 1 October in the year of enrolling on a BPTC): students from all domiciles
Bar Standards Board: BPTC Key Statistics Part 2: Key statistics by provider (full-time BPTC students)
June 2020 Page 51 Bar Standards Board
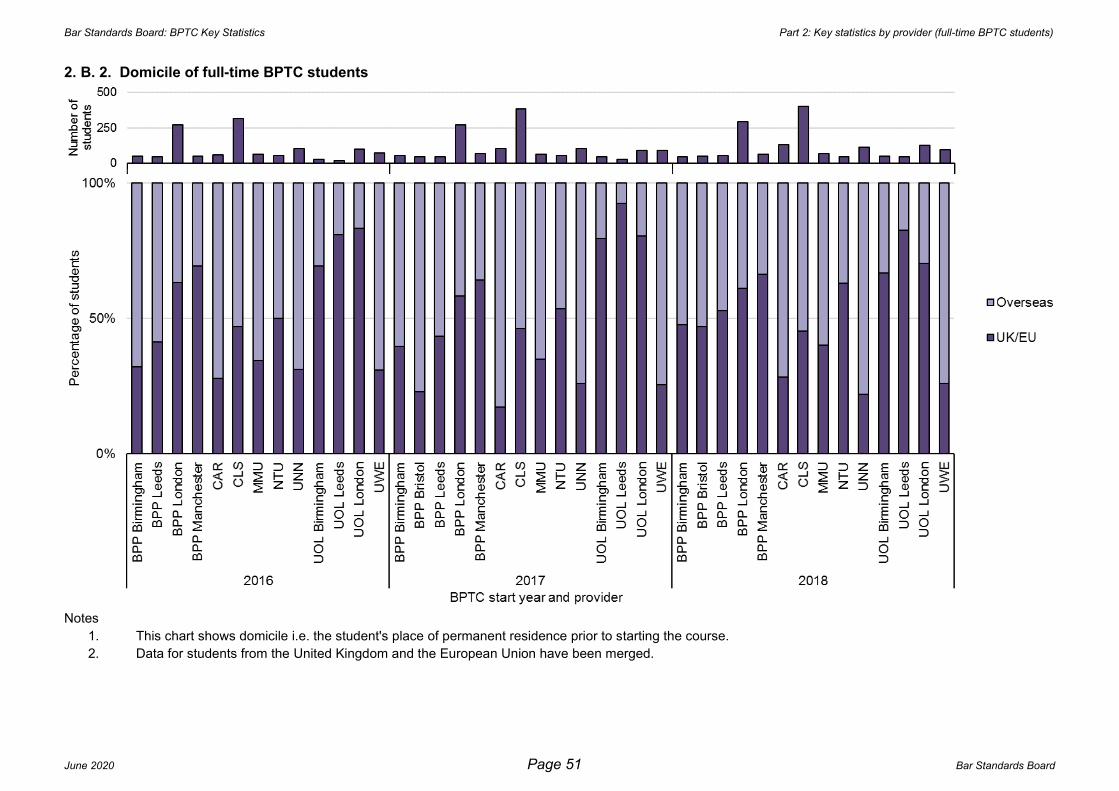
2. B. 2. Domicile of full-time BPTC students
Notes
1. This chart shows domicile i.e. the student's place of permanent residence prior to starting the course.
2. Data for students from the United Kingdom and the European Union have been merged.

Bar Standards Board: BPTC Key Statistics Part 2: Key statistics by provider (full-time BPTC students)
June 2020 Page 52 Bar Standards Board
2. B. 3. First degree classification of BPTC full-time students: students from all domiciles
Notes
1. The minimum entry requirement for admission to the BPTC is a lower second class degree; in exceptional circumstances, students may be admitted to the
BPTC with a different academic qualification. This is conditional on the granting of a waiver by the Bar Standards Board. Such students are classified as “Other”.

Bar Standards Board: BPTC Key Statistics Part 2: Key statistics by provider (full-time BPTC students)
June 2020 Page 53 Bar Standards Board
2. B. 4. First degree classification of full-time BPTC students, by domicile: 2016-2018 aggregated
Notes
1. This table shows the distribution of first degree classifications grouped by domicile.
2. Not all providers have provided domicile and first-degree classification for all students.
3. Students who did not gain a first class, upper second class or lower second class degree and were admitted to the BPTC with a different academic
qualification are classified as “Other”.
4. Data for UOL Leeds have not been included in the above owing to small cohort size (<20) when broken down by domicile.

Bar Standards Board: BPTC Key Statistics Part 2: Key statistics by provider (full-time BPTC students)
June 2020 Page 54 Bar Standards Board
2. B. 5. Ranking of university at which full-time BPTC students studied for first degree: students from all domiciles
Note
1. The top fifty universities for each year have been taken from The Times and Sunday Times Good University Guide (for each academic year).

Bar Standards Board: BPTC Key Statistics Part 2: Key statistics by provider (full-time BPTC students)
June 2020 Page 55 Bar Standards Board
2. B. 6. Full-time BPTC students who completed a law degree or Graduate Diploma in Law (GDL): students from all domiciles
Notes
1. The specific entry requirements for the BPTC are contained in the BPTC Handbook.
2. The GDL is also known as the Common Professional Examination.
3. The data for MMU for 2018 are not represented in the above owing missing data for qualifying law degree (<20).

Bar Standards Board: BPTC Key Statistics Part 2: Key statistics by provider (full-time BPTC students)
June 2020 Page 56 Bar Standards Board
Tables B7, B8 and B9 set out data on protected characteristics in line with the Bar Standards Board equality and diversity guidelines
2. B. 7. 1. Ethnicity of full-time BPTC students: students from all domiciles – 2016-2018 aggregated
Note
1. Students are not required to declare their ethnicity, but around 94 per cent of 2016-2018 full-time students have done so. Data for those where information
on ethnicity has not been provided are not included in the above.

Bar Standards Board: BPTC Key Statistics Part 2: Key statistics by provider (full-time BPTC students)
June 2020 Page 57 Bar Standards Board
2. B. 7. 2. Ethnicity of full-time BPTC students: UK/EU domiciled students – 2016-2018 aggregated
Note
1. Students are not required to declare their ethnicity, but around 94 per cent of 2016-2018 full-time students have done so. Data for those where information
on ethnicity has not been provided are not included in the above.

Bar Standards Board: BPTC Key Statistics Part 2: Key statistics by provider (full-time BPTC students)
June 2020 Page 58 Bar Standards Board
2. B. 7. 3. Ethnicity of full-time BPTC students: overseas domiciled students only – 2016-2018 aggregated
Note
1. Students are not required to declare their ethnicity, but around 94 per cent of 2016-2018 full-time students have done so. Data for those where information
on ethnicity has not been provided are not included in the above.

Bar Standards Board: BPTC Key Statistics Part 2: Key statistics by provider (full-time BPTC students)
June 2020 Page 59 Bar Standards Board
2. B. 8. Gender of full-time BPTC students: students from all domiciles – 2016-2018 aggregated
Note
1. Students are not required to declare their gender, but almost 100 per cent of 2016-2018 full-time students have done so. Data for those where information
on gender has not been provided are not included in the above.

Bar Standards Board: BPTC Key Statistics Part 2: Key statistics by provider (full-time BPTC students)
June 2020 Page 60 Bar Standards Board
2. B. 9. Declared disability of full-time BPTC students: students from all domiciles - 2016-2018 aggregated
Note
1. Students are not required to declare their disability status, but almost 100 per cent of 2016-2018 full-time students have done so. Data for those where
information on disability status has not been provided are not included in the above.

Bar Standards Board: BPTC Key Statistics Part 3: Key statistics by provider (part-time BPTC students)
June 2020 Page 61 Bar Standards Board
BPTC Key Statistics
2020
Part 3: Key statistics by provider (part-time BPTC students)

Bar Standards Board: BPTC Key Statistics Part 3: Key statistics by provider (part-time BPTC students)
June 2020 Page 62 Bar Standards Board
3. A. BPTC results and outcomes for part-time students
3. A. sets out an overview of the results and outcomes obtained by part-time students enrolled on the BPTC.
3. A. 1. BPTC enrolments: students from all domiciles
Notes
1. The number of enrolments are those reported and validated by providers in the collection of key statistics.
2. UOL Birmingham did not run the BPTC part-time for the 2016-17 academic year, and MMU did not run the BPTC part-time for the 2018-19 academic year.

Bar Standards Board: BPTC Key Statistics Part 3: Key statistics by provider (part-time BPTC students)
June 2020 Page 63 Bar Standards Board
3. A. 2. BPTC results obtained by part-time students: students from all domiciles – 2016 and 2017 enrolled students aggregated
Outcomes for all BPTC students in cohort Outcomes for BPTC graduates
Note
1. Due to a small cohort (<20), data for MMU, UNN and UOL Birmingham have not been included in the above.
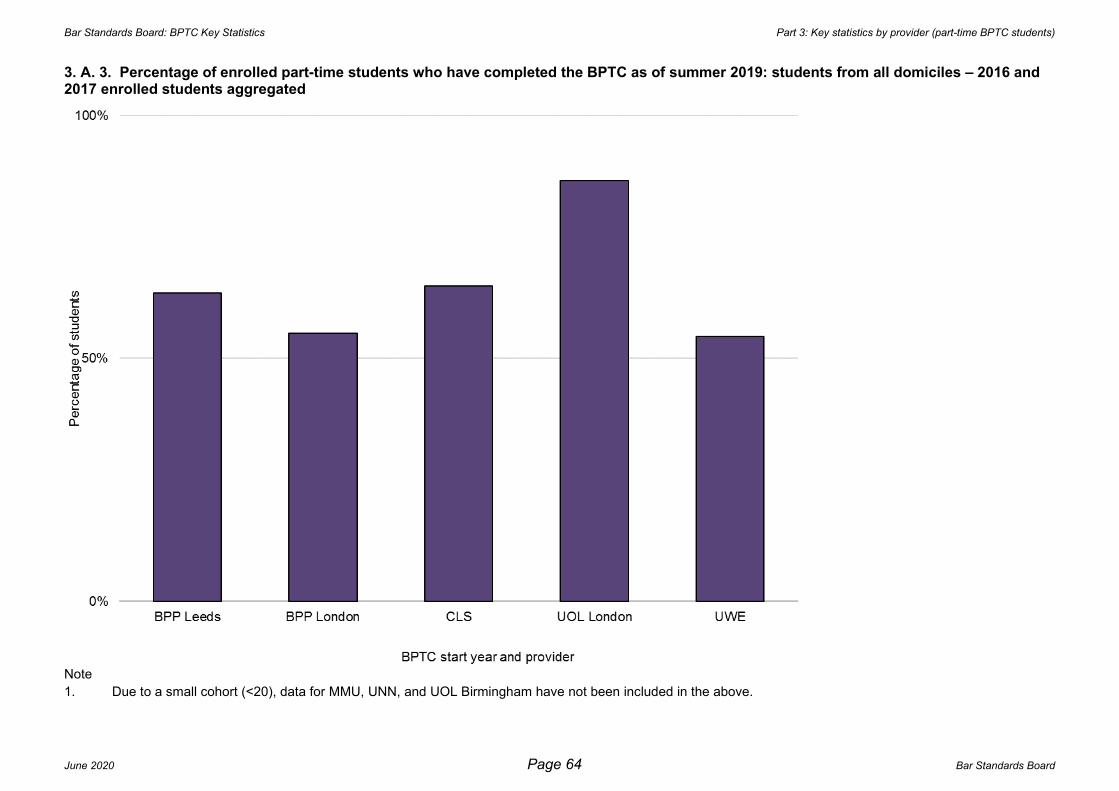
Bar Standards Board: BPTC Key Statistics Part 3: Key statistics by provider (part-time BPTC students)
June 2020 Page 64 Bar Standards Board
3. A. 3. Percentage of enrolled part-time students who have completed the BPTC as of summer 2019: students from all domiciles – 2016 and 2017 enrolled students aggregated
Note
1. Due to a small cohort (<20), data for MMU, UNN, and UOL Birmingham have not been included in the above.

Bar Standards Board: BPTC Key Statistics Part 3: Key statistics by provider (part-time BPTC students)
June 2020 Page 65 Bar Standards Board
3. A. 4. Part-time students who passed all BPTC assessments at first attempt: students from all domiciles – 2016 and 2017 enrolled students aggregated
Notes
1. Up until 2016/17, a student who failed an assessment was usually permitted one further opportunity to re-take the failed assessment (shown as “Pass at 2nd
attempt” in the chart). From 2016/17 this was changed to two further opportunities. Information on failure and re-assessment is contained in the BPTC
Handbook.
2. If a student has to re-sit any BPTC assessments due to failing an attempt at a module they will not be able to achieve an “Outstanding” grade.
3. Due to a small cohort (<20), data for MMU, UNN, and UOL Birmingham have not been included in the above.
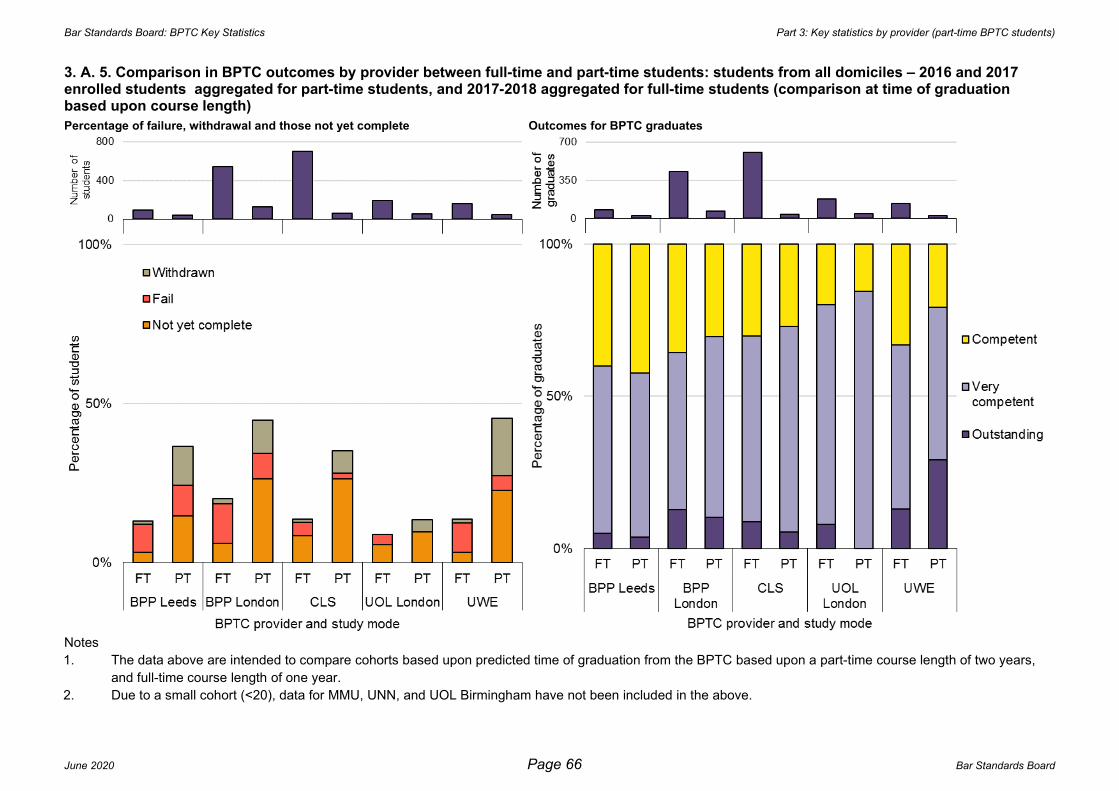
Bar Standards Board: BPTC Key Statistics Part 3: Key statistics by provider (part-time BPTC students)
June 2020 Page 66 Bar Standards Board
3. A. 5. Comparison in BPTC outcomes by provider between full-time and part-time students: students from all domiciles – 2016 and 2017 enrolled students aggregated for part-time students, and 2017-2018 aggregated for full-time students (comparison at time of graduation based upon course length)
Percentage of failure, withdrawal and those not yet complete Outcomes for BPTC graduates
Notes
1. The data above are intended to compare cohorts based upon predicted time of graduation from the BPTC based upon a part-time course length of two years,
and full-time course length of one year.
2. Due to a small cohort (<20), data for MMU, UNN, and UOL Birmingham have not been included in the above.

Bar Standards Board: BPTC Key Statistics Part 3: Key statistics by provider (part-time BPTC students)
June 2020 Page 67 Bar Standards Board
3. A. 6. Comparison in BPTC outcomes by provider between full-time and part-time students: UK/EU domiciled – 2016 and 2017 enrolled students aggregated for part-time students, and 2017-2018 aggregated for full-time students (comparison at time of graduation based upon course length)
Percentage of failure, withdrawal and those not yet complete Outcomes for BPTC graduates
Notes
1. The data above is intended to compare cohorts based upon predicted time of graduation from the BPTC based upon a part-time course length of two years, and
full-time course length of one year.
2. Due to a small cohort (<20), data for MMU, UNN, and UOL Birmingham have not been included in the above.

Bar Standards Board: BPTC Key Statistics Part 3: Key statistics by provider (part-time BPTC students)
June 2020 Page 68 Bar Standards Board
3. B. Profile of part-time BPTC students
3. B. sets out an overview of key profile data for part-time students enrolled on the BPTC.
3. B. 1. Age of part-time students (as at 1 October in the year of enrolling on a BPTC): students from all domiciles – 2016-2018 aggregated
Note
1. Due to a small cohort (<20), data for UNN, and UOL Birmingham have not been included in the above.
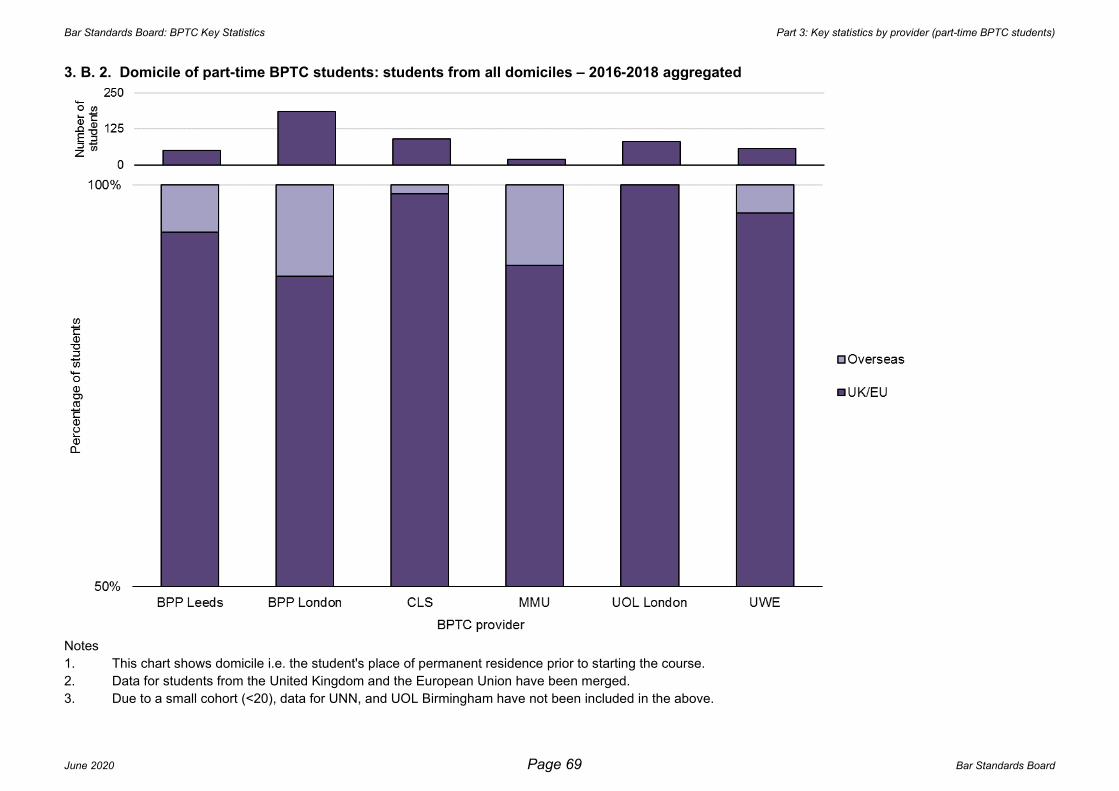
Bar Standards Board: BPTC Key Statistics Part 3: Key statistics by provider (part-time BPTC students)
June 2020 Page 69 Bar Standards Board
3. B. 2. Domicile of part-time BPTC students: students from all domiciles – 2016-2018 aggregated
Notes
1. This chart shows domicile i.e. the student's place of permanent residence prior to starting the course.
2. Data for students from the United Kingdom and the European Union have been merged.
3. Due to a small cohort (<20), data for UNN, and UOL Birmingham have not been included in the above.
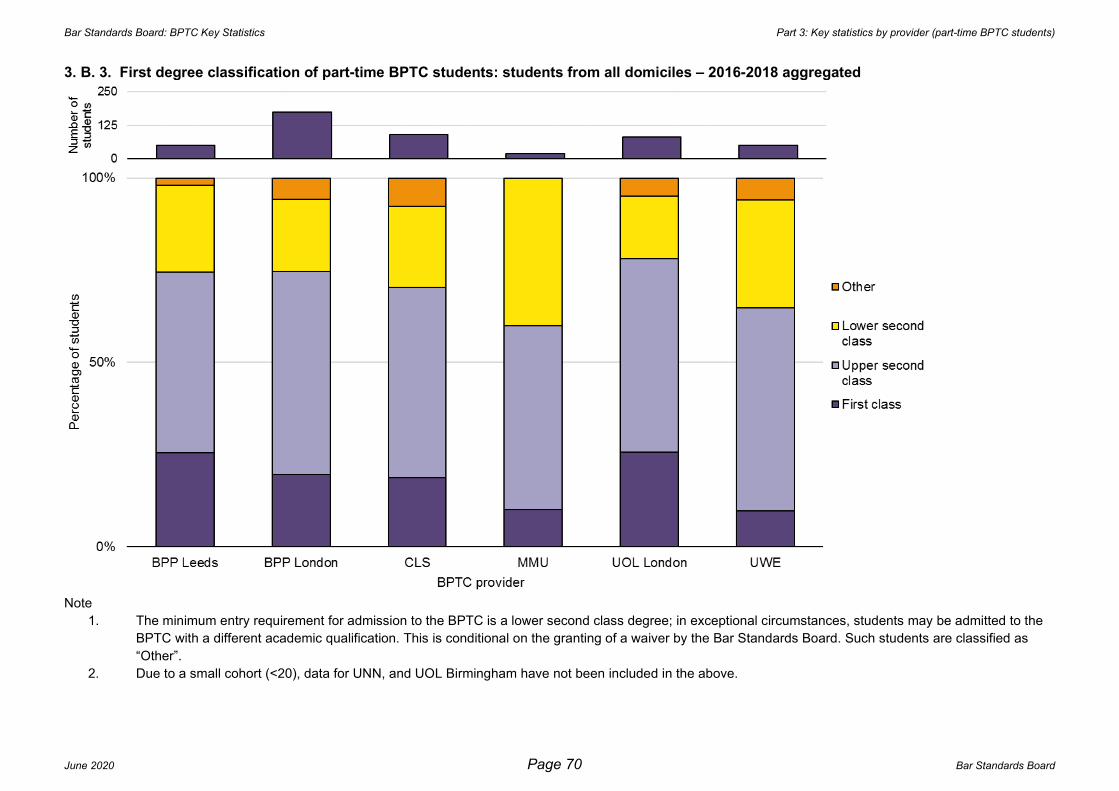
Bar Standards Board: BPTC Key Statistics Part 3: Key statistics by provider (part-time BPTC students)
June 2020 Page 70 Bar Standards Board
3. B. 3. First degree classification of part-time BPTC students: students from all domiciles – 2016-2018 aggregated
Note
1. The minimum entry requirement for admission to the BPTC is a lower second class degree; in exceptional circumstances, students may be admitted to the
BPTC with a different academic qualification. This is conditional on the granting of a waiver by the Bar Standards Board. Such students are classified as
“Other”.
2. Due to a small cohort (<20), data for UNN, and UOL Birmingham have not been included in the above.

Bar Standards Board: BPTC Key Statistics Part 3: Key statistics by provider (part-time BPTC students)
June 2020 Page 71 Bar Standards Board
3. B. 4. First degree classification of part-time BPTC students: UK/EU domiciled - 2016-2018 aggregated
Notes
1. Not all BPTC providers have provided students' domicile and first degree classification. Students with missing information on either are not included in the above
chart.
2. Students who did not gain a first class, upper second class or lower second class degree and were admitted to the BPTC with a different academic qualification
are classified as “Other”.
3. Due to a small cohort (<20), data for UNN, and UOL Birmingham have not been included in the above.
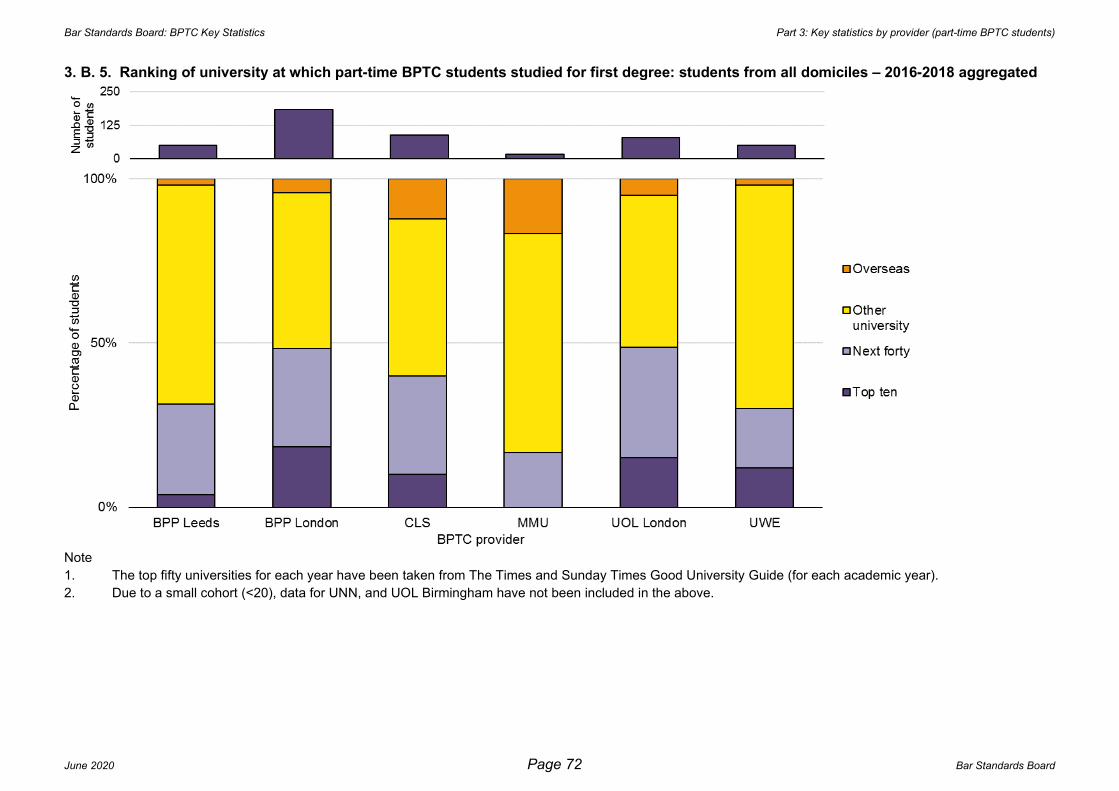
Bar Standards Board: BPTC Key Statistics Part 3: Key statistics by provider (part-time BPTC students)
June 2020 Page 72 Bar Standards Board
3. B. 5. Ranking of university at which part-time BPTC students studied for first degree: students from all domiciles – 2016-2018 aggregated
Note
1. The top fifty universities for each year have been taken from The Times and Sunday Times Good University Guide (for each academic year).
2. Due to a small cohort (<20), data for UNN, and UOL Birmingham have not been included in the above.
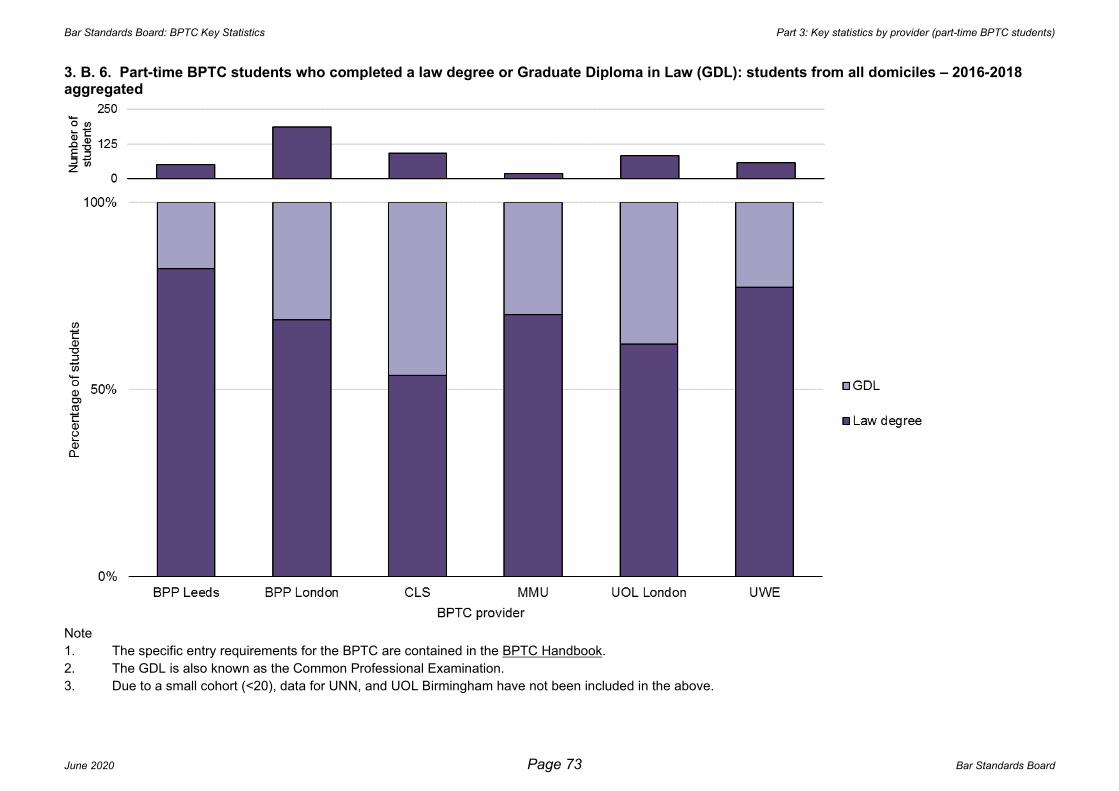
Bar Standards Board: BPTC Key Statistics Part 3: Key statistics by provider (part-time BPTC students)
June 2020 Page 73 Bar Standards Board
3. B. 6. Part-time BPTC students who completed a law degree or Graduate Diploma in Law (GDL): students from all domiciles – 2016-2018 aggregated
Note
1. The specific entry requirements for the BPTC are contained in the BPTC Handbook.
2. The GDL is also known as the Common Professional Examination.
3. Due to a small cohort (<20), data for UNN, and UOL Birmingham have not been included in the above.

Bar Standards Board: BPTC Key Statistics Part 3: Key statistics by provider (part-time BPTC students)
June 2020 Page 74 Bar Standards Board
Tables B7, B8 and B9 set out data on protected characteristics in line with the Bar Standards Board equality and diversity guidelines
3. B. 7. Ethnicity of part-time BPTC students: students from all domiciles – 2016-2018 aggregated
Note
1. Students are not required to declare their ethnicity, but around 94 per cent of 2016-2018 part-time students have done so. Data for those where information on
ethnicity has not been provided are not included in the above.
2. Due to a small cohort (<20), data for UNN, and UOL Birmingham have not been included in the above.

Bar Standards Board: BPTC Key Statistics Part 3: Key statistics by provider (part-time BPTC students)
June 2020 Page 75 Bar Standards Board
3. B. 8. Gender of part-time BPTC students: students from all domiciles – 2016-2018 aggregated
Note
1. Students are not required to declare their gender, but all 2016-2018 part-time students have done so. Data for those where information on gender has not been
provided are not included in the above.
2. Due to a small cohort (<20), data for UNN, and UOL Birmingham have not been included in the above.

Bar Standards Board: BPTC Key Statistics Part 3: Key statistics by provider (part-time BPTC students)
June 2020 Page 76 Bar Standards Board
3. B. 9. Declared disability of part-time BPTC students: students from all domiciles – 2016-2018 aggregated
Note
1. Students are not required to declare their disability status, but all 2016-2018 part-time students have done so. Data for those where information on disability
status has not been provided, are not included in the above.
2. Due to a small cohort (<20), data for UNN, and UOL Birmingham have not been included in the above.

Bar Standards Board: BPTC Key Statistics Part 4: BPTC graduate progression statistics
June 2020 Page 77 Bar Standards Board
BPTC Key Statistics
2020
Part 4: BPTC graduate progression statistics
Bar Standards Board: BPTC Key Statistics Part 4: BPTC graduate progression statistics
June 2020 Page 78 Bar Standards Board
Part 4: BPTC graduate progression statistics: both aggregated and by provider (full-time and part-
time BPTC students) The charts in Part 4 are based on first six pupillages commencing between 1 October 2014 and 31 March 2020 inclusive. Graduates in the cohorts
covered by this report who have secured pupillage since 31 March 2020 will be included in the next publication.
Students may start pupillage up to five years after successfully completing the BPTC. These charts do not include pupils who either passed the BPTC
prior to 2015 or were exempted, for example by virtue of having passed the Bar Transfer Test.
Full details of overall pupillage rates (including those who took alternative routes to pupillage) can be found at:
https://www.barstandardsboard.org.uk/media-centre/research-and-statistics/statistics/pupillage-statistics/
Not all students taking the BPTC will wish to undertake pupillage, or wish to remain domiciled in the UK. There are relatively few overseas domiciled
BPTC graduates that have gained pupillage in the UK following completion of the course, and for this reason, the majority of the charts in Part 4 contain
data on UK/EU domiciled BPTC graduates only. Of the BPTC graduates enrolling in the academic years commencing 2014-2018, 45 BPTC graduates
who were domiciled overseas prior to enrolling on the course have commenced first six pupillage as of 31 March 2020, in comparison to 1375 UK/EU
domiciled BPTC graduates.

Bar Standards Board: BPTC Key Statistics Part 4: BPTC graduate progression statistics
June 2020 Page 79 Bar Standards Board
4. A. BPTC graduate progression of full-time and part-time BPTC students
4. A. 1. Domicile of full-time and part-time BPTC graduates commencing first six pupillage
Number of graduates gaining pupillage Percentage of graduates of each domicile gaining pupillage
Notes
1. The charts above show the number and percentage of students who successfully completed the BPTC during the report period who commenced first six
pupillage between 1 October 2014 and 31 March 2020.
2. Many students are domiciled outside the United Kingdom and do not intend to practise in England and Wales upon completion of the BPTC.

Bar Standards Board: BPTC Key Statistics Part 4: BPTC graduate progression statistics
June 2020 Page 80 Bar Standards Board
4. A. 2. BPTC graduates commencing pupillage within 6 months, 6 - 18 months, and over 18 months following completion of the BPTC: UK/EU domiciled students
Notes
1. The charts above show the number and percentage of students who successfully completed the BPTC during the report period who commenced first six
pupillage between 1 October 2014 and 31 March 2020. They are categorised by the length of time passed following completion of the BPTC and
commencement of first six pupillage.
2. Application for pupillage can be made before commencing the BPTC.
3. In the absence of data on the date of award for completion of the BPTC, if a student passed the BPTC at first attempt, the length of time between
completion of the BPTC and the commencement of pupillage was calculated from 31 July in the year of graduation. The period was calculated for other
students from 31 October in the year of graduation.

Bar Standards Board: BPTC Key Statistics Part 4: BPTC graduate progression statistics
June 2020 Page 81 Bar Standards Board
4. A. 3. BPTC grades of graduates commencing first six pupillage, by time taken to gain pupillage following completion of the BPTC: UK/EU domiciled students
Notes
1. The chart above shows the number and percentage of students who successfully completed the BPTC during the report period who commenced first six
pupillage between 1 October 2014 and 31 March 2020. They are categorised by the length of time passed following completion of the BPTC and
commencement of first six pupillage.
2. In the absence of data on the date of award for completion of the BPTC, if a student passed the BPTC at first attempt, the length of time between
completion of the BPTC and the commencement of pupillage was calculated from 31 July in the year of graduation. The period was calculated for other
students from 31 October in the year of graduation.

Bar Standards Board: BPTC Key Statistics Part 4: BPTC graduate progression statistics
June 2020 Page 82 Bar Standards Board
4. A. 4. Pupillage rate of BPTC graduates, by part-time and full-time mode of study: UK/EU domiciled students
Notes
1. The data in the chart above are intended to compare cohorts based upon predicted time of graduation from the BPTC based upon a part-time course length
of two years, and full-time course length of one year.
2. The chart above shows the percentage of students who successfully completed the BPTC during the report period who commenced first six pupillage
between 1 October 2014 and 31 March 2020.

Bar Standards Board: BPTC Key Statistics Part 4: BPTC graduate progression statistics
June 2020 Page 83 Bar Standards Board
4. A. 5. 1. First degree classification and BPTC grade of full-time and part-time BPTC graduates commencing first six pupillage: UK/EU domiciled students - percentage of those with pupillage – 2014-2018 aggregated
Notes
1. The chart above shows the number of students who successfully completed the BPTC during the report period who commenced first six pupillage between
1 October 2014 and 31 March 2020.
2. Not all course providers were able to provide the first degree classifications for all of their students: these instances and instances of students with other first
degree classifications have not been included in the chart.

Bar Standards Board: BPTC Key Statistics Part 4: BPTC graduate progression statistics
June 2020 Page 84 Bar Standards Board
4. A. 5. 2. First degree classification and BPTC grade of full-time and part-time BPTC graduates commencing first six pupillage: UK/EU domiciled students only – number of BPTC graduates in each grouping that have gained pupillage, by year of BPTC enrolment
Notes
1. The chart above shows the percentage of students who successfully completed the BPTC during the report period who commenced first six pupillage
between 1 October 2014 and 31 March 2020. They are grouped by BPTC grade and first degree classification.
2. Not all course providers were able to provide the first degree classifications for all of their students: these instances and instances of students with other first
degree classifications have not been included in the chart.

Bar Standards Board: BPTC Key Statistics Part 4: BPTC graduate progression statistics
June 2020 Page 85 Bar Standards Board
4. A. 5. 3. First degree classification and BPTC grade of full-time and part-time BPTC graduates commencing first six pupillage: UK/EU domiciled students only – percentage of BPTC graduates in each grouping that have gained pupillage, by year of BPTC enrolment
Notes
1. The chart above shows the percentage of students who successfully completed the BPTC during the report period who commenced first six pupillage
between 1 October 2014 and 31 March 2020. They are grouped by BPTC grade and first degree classification.
2. Not all course providers were able to provide the first degree classifications for all of their students: these instances and instances of students with other first
degree classifications have not been included in the chart.

Bar Standards Board: BPTC Key Statistics Part 4: BPTC graduate progression statistics
June 2020 Page 86 Bar Standards Board
4. A. 6. Time taken to commence pupillage following completion of the BPTC, by first degree classification and BPTC grade: UK/EU domiciled graduates that have gained pupillage – 2014-2018 aggregated
Note
1. In the absence of data on the date of award for completion of the BPTC, if a student passed the BPTC at first attempt, the length of time between
completion of the BPTC and the commencement of pupillage was calculated from 31 July in the year of graduation. The period was calculated for other
students from 31 October in the year of graduation.
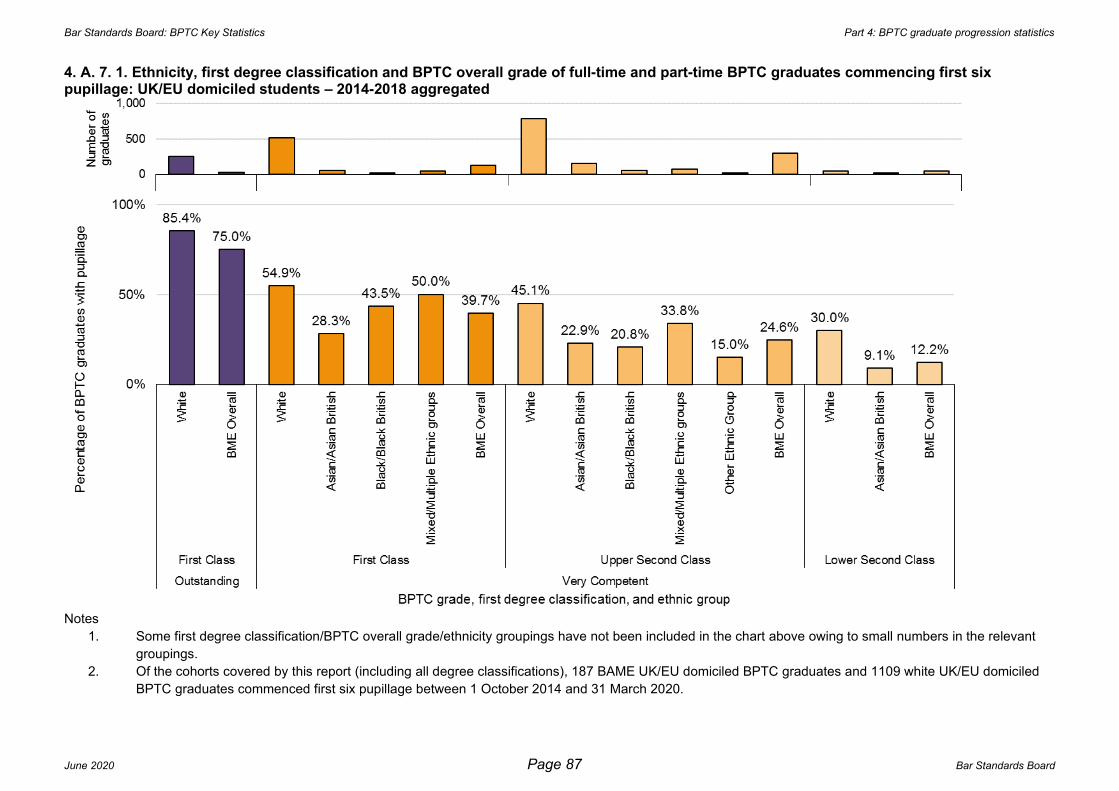
Bar Standards Board: BPTC Key Statistics Part 4: BPTC graduate progression statistics
June 2020 Page 87 Bar Standards Board
4. A. 7. 1. Ethnicity, first degree classification and BPTC overall grade of full-time and part-time BPTC graduates commencing first six pupillage: UK/EU domiciled students – 2014-2018 aggregated
Notes
1. Some first degree classification/BPTC overall grade/ethnicity groupings have not been included in the chart above owing to small numbers in the relevant
groupings. 2. Of the cohorts covered by this report (including all degree classifications), 187 BAME UK/EU domiciled BPTC graduates and 1109 white UK/EU domiciled
BPTC graduates commenced first six pupillage between 1 October 2014 and 31 March 2020.
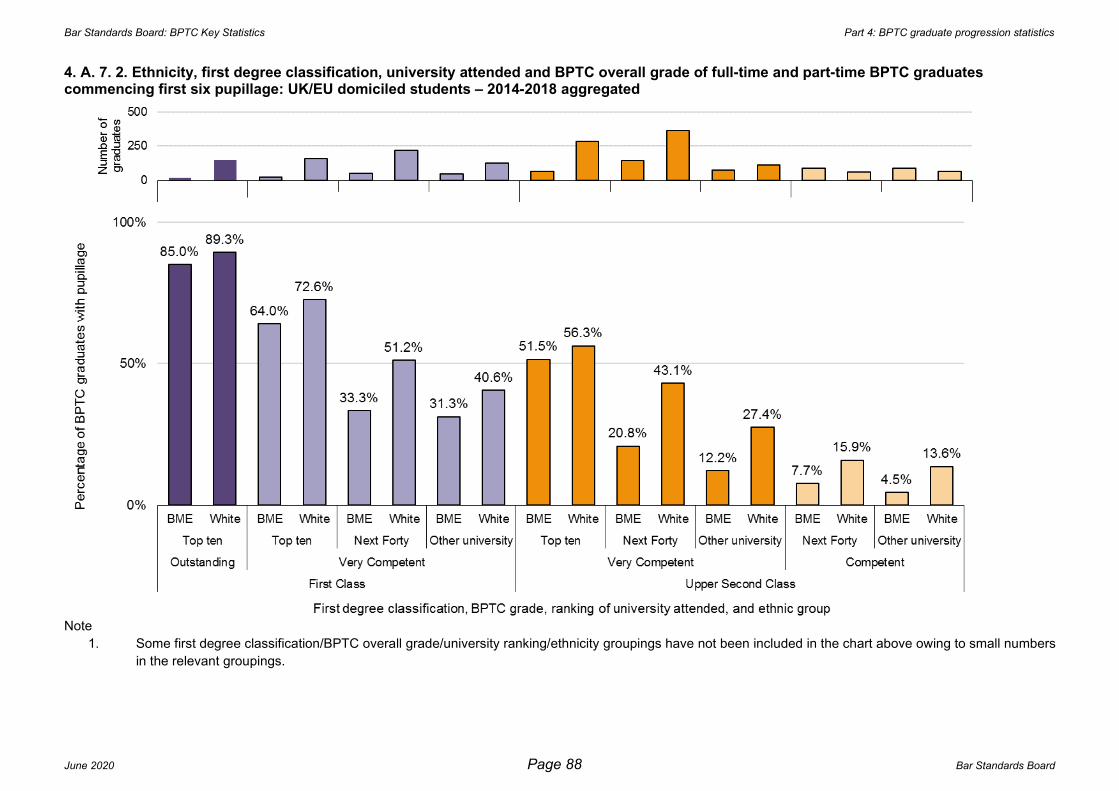
Bar Standards Board: BPTC Key Statistics Part 4: BPTC graduate progression statistics
June 2020 Page 88 Bar Standards Board
4. A. 7. 2. Ethnicity, first degree classification, university attended and BPTC overall grade of full-time and part-time BPTC graduates commencing first six pupillage: UK/EU domiciled students – 2014-2018 aggregated
Note
1. Some first degree classification/BPTC overall grade/university ranking/ethnicity groupings have not been included in the chart above owing to small numbers
in the relevant groupings.
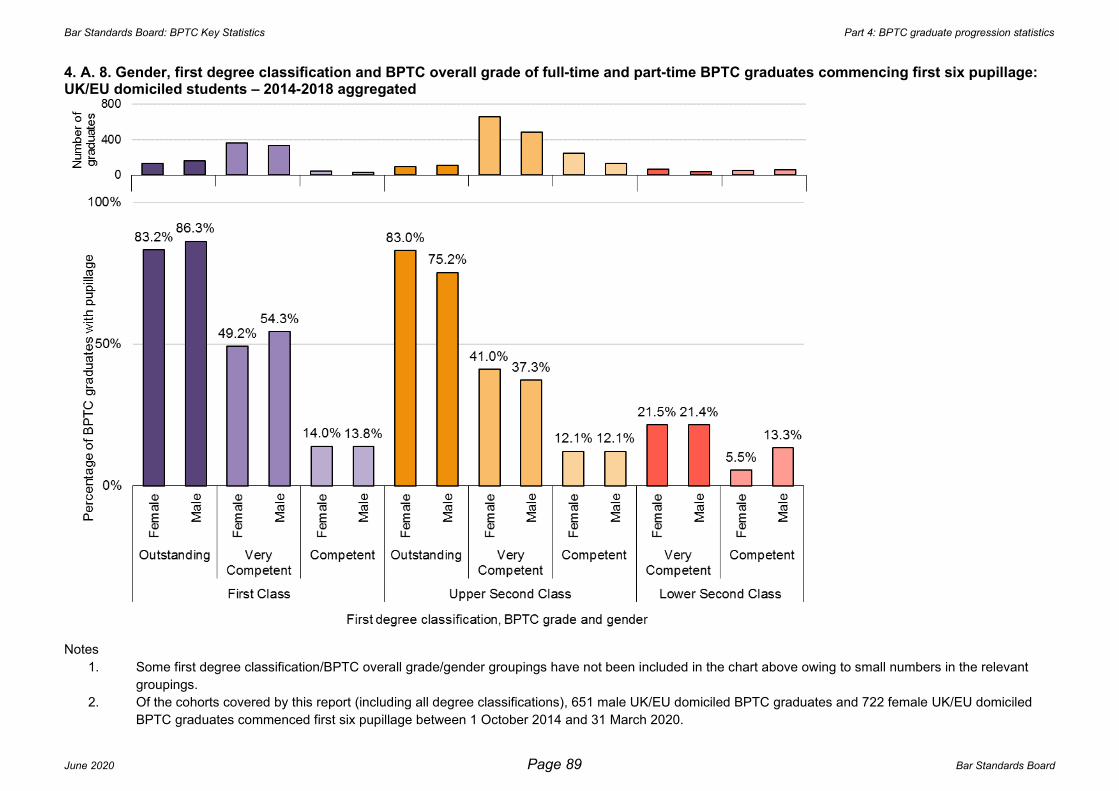
Bar Standards Board: BPTC Key Statistics Part 4: BPTC graduate progression statistics
June 2020 Page 89 Bar Standards Board
4. A. 8. Gender, first degree classification and BPTC overall grade of full-time and part-time BPTC graduates commencing first six pupillage: UK/EU domiciled students – 2014-2018 aggregated
Notes
1. Some first degree classification/BPTC overall grade/gender groupings have not been included in the chart above owing to small numbers in the relevant
groupings.
2. Of the cohorts covered by this report (including all degree classifications), 651 male UK/EU domiciled BPTC graduates and 722 female UK/EU domiciled
BPTC graduates commenced first six pupillage between 1 October 2014 and 31 March 2020.
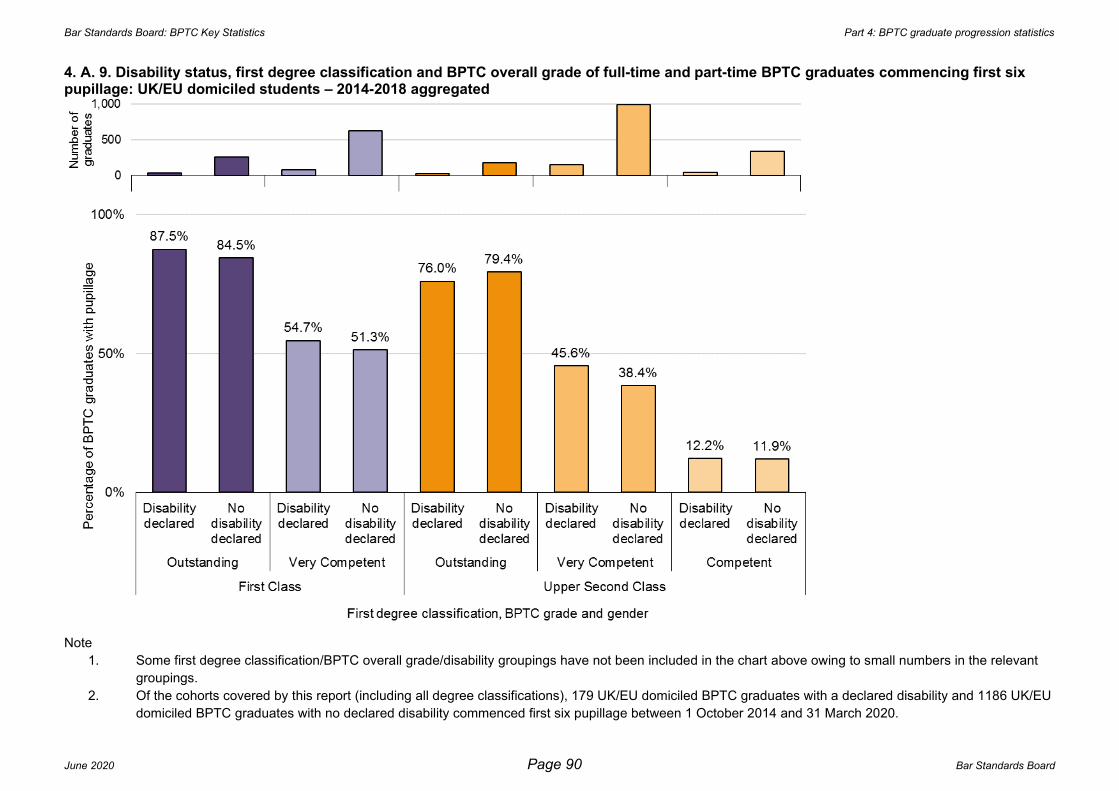
Bar Standards Board: BPTC Key Statistics Part 4: BPTC graduate progression statistics
June 2020 Page 90 Bar Standards Board
4. A. 9. Disability status, first degree classification and BPTC overall grade of full-time and part-time BPTC graduates commencing first six pupillage: UK/EU domiciled students – 2014-2018 aggregated
Note
1. Some first degree classification/BPTC overall grade/disability groupings have not been included in the chart above owing to small numbers in the relevant
groupings. 2. Of the cohorts covered by this report (including all degree classifications), 179 UK/EU domiciled BPTC graduates with a declared disability and 1186 UK/EU
domiciled BPTC graduates with no declared disability commenced first six pupillage between 1 October 2014 and 31 March 2020.
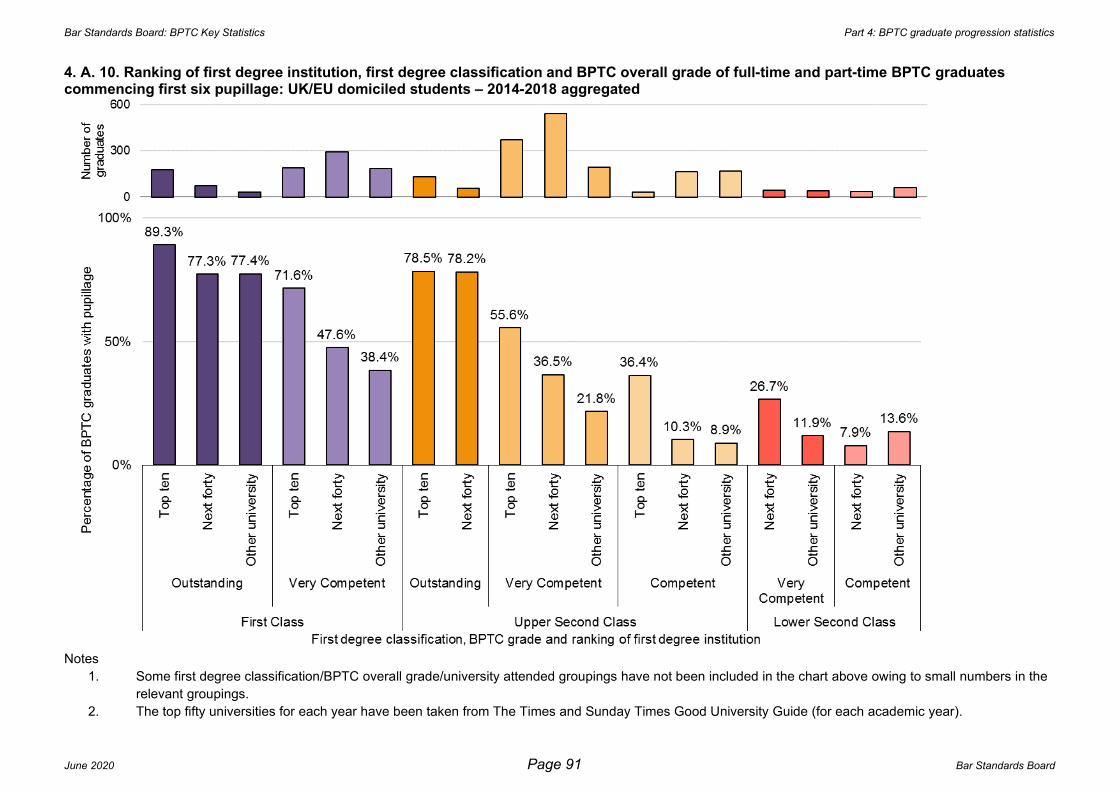
Bar Standards Board: BPTC Key Statistics Part 4: BPTC graduate progression statistics
June 2020 Page 91 Bar Standards Board
4. A. 10. Ranking of first degree institution, first degree classification and BPTC overall grade of full-time and part-time BPTC graduates commencing first six pupillage: UK/EU domiciled students – 2014-2018 aggregated
Notes
1. Some first degree classification/BPTC overall grade/university attended groupings have not been included in the chart above owing to small numbers in the
relevant groupings.
2. The top fifty universities for each year have been taken from The Times and Sunday Times Good University Guide (for each academic year).

Bar Standards Board: BPTC Key Statistics Part 4: BPTC graduate progression statistics
June 2020 Page 92 Bar Standards Board
4. A. 11. Age at enrolment, first degree classification and BPTC overall grade of full-time and part-time BPTC graduates commencing first six pupillage: UK/EU domiciled students – 2014-2018 aggregated
Notes
1. Some first degree classification/BPTC overall grade/age groupings have not been included in the chart above owing to small numbers in the relevant
groupings.
2. The age at enrolment is taken as of 1 October in the year of enrolling on the BPTC.

Bar Standards Board: BPTC Key Statistics Part 4: BPTC graduate progression statistics
June 2020 Page 93 Bar Standards Board
4. B. BPTC graduate progression of full-time and part-time BPTC students, by provider
4. B. 1. Domicile of BPTC graduates commencing first six pupillage – 2014-2018 aggregated
Notes
1. The chart above shows the number and percentage of students who successfully completed the BPTC during the report period who commenced first six
pupillage between 1 October 2014 and 31 March 2020.
2. Many students are domiciled outside the United Kingdom and do not intend to practise in England and Wales upon completion of the BPTC.

Bar Standards Board: BPTC Key Statistics Part 4: BPTC graduate progression statistics
June 2020 Page 94 Bar Standards Board
4. B. 2. BPTC graduates commencing pupillage within 6 months, 6 - 18 months, and over 18 months following completion of the BPTC: UK/EU domiciled graduates
Notes
1. The chart above highlights the percentage of students who successfully completed the BPTC during the report period who commenced first six pupillage
between 1 October 2014 and 31 March 2020. They are categorised by the length of time passed following completion of the BPTC and commencement of
first six pupillage.
2. The “Less than 6 months” category is an aggregation of all cohorts (2014-2018). “6 -18 months” refers to students commencing the BPTC 2014-2017 only,
and “More than 18 months” refers to students commencing the BPTC in 2014-2016 only. Application for pupillage can be made before commencing the
BPTC.
3. In the absence of data on the date of award for completion of the BPTC, if a student passed the BPTC at first attempt, the length of time between
completion of the BPTC and the commencement of pupillage was calculated from 31 July in the year of graduation. The period was calculated for other
students from 31 October in the year of graduation.

Bar Standards Board: BPTC Key Statistics Part 4: BPTC graduate progression statistics
June 2020 Page 95 Bar Standards Board
4. B. 3. Pupillage rate of BPTC graduates, by provider: UK/EU domiciled students
Notes
1. The chart above shows the percentage of students who successfully completed the BPTC during the report period who commenced first six pupillage
between 1 October 2014 and 31 March 2020. They are categorised by the length of time passed following completion of the BPTC and commencement of
first six pupillage.
2. In the absence of data on the date of award for completion of the BPTC, if a student passed the BPTC at first attempt, the length of time between
completion of the BPTC and the commencement of pupillage was calculated from 31 July in the year of graduation. The period was calculated for other
students from 31 October in the year of graduation.
3. Data for students at several providers are not represented in the above owing to a small number of graduates by year (<20).
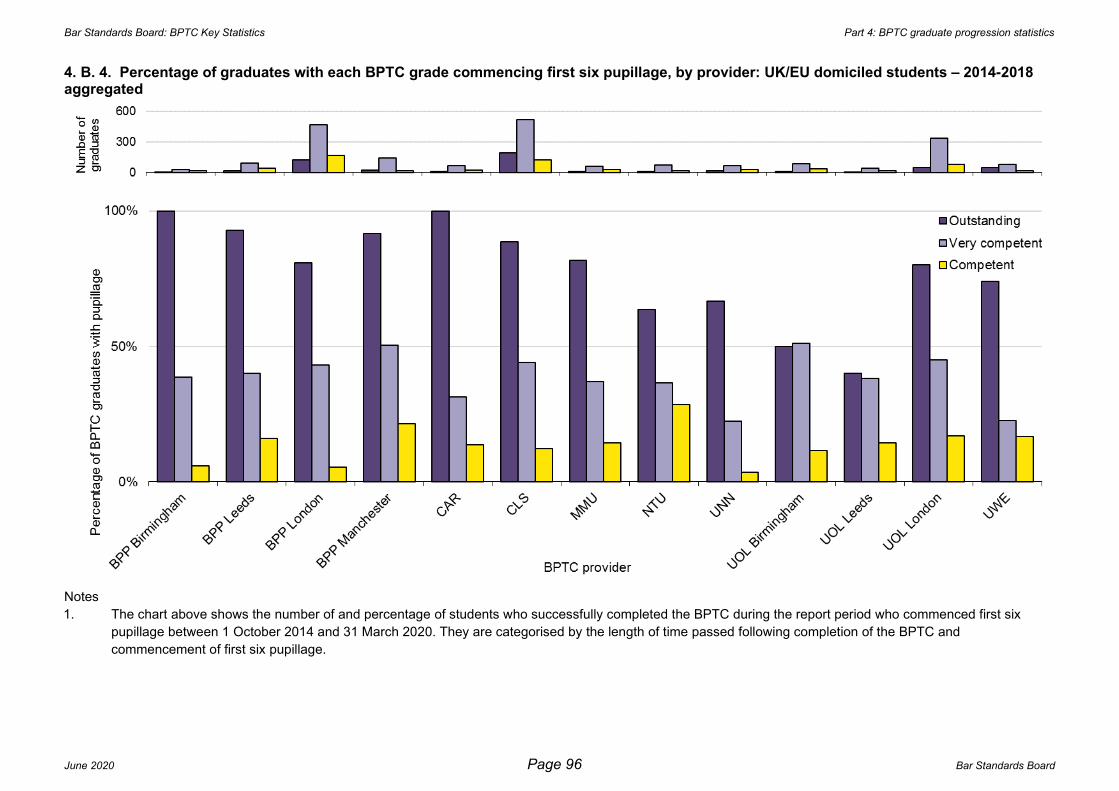
Bar Standards Board: BPTC Key Statistics Part 4: BPTC graduate progression statistics
June 2020 Page 96 Bar Standards Board
4. B. 4. Percentage of graduates with each BPTC grade commencing first six pupillage, by provider: UK/EU domiciled students – 2014-2018 aggregated
Notes
1. The chart above shows the number of and percentage of students who successfully completed the BPTC during the report period who commenced first six
pupillage between 1 October 2014 and 31 March 2020. They are categorised by the length of time passed following completion of the BPTC and
commencement of first six pupillage.

Bar Standards Board: BPTC Key Statistics Part 4: BPTC graduate progression statistics
June 2020 Page 97 Bar Standards Board
4. B. 5. First degree classification of BPTC graduates commencing first six pupillage: students from all domiciles – 2014-2018 aggregated
Notes
1. The chart above shows the number and percentage of students who successfully completed the BPTC during the report period who commenced first six
pupillage between 1 October 2014 and 31 March 2020.
2. Not all course providers were able to provide the first degree classifications for all of their students: these instances and instances of students with other first
degree classifications have not been included in the chart.
3. Data for BPP B’ham, BPP Bristol, and UNN have not been included in the above due to small cohorts (<20).

Bar Standards Board: BPTC Key Statistics Appendices
June 2020 Page 98 Bar Standards Board
BPTC Key Statistics
2020
Appendices
Bar Standards Board: BPTC Key Statistics Appendices
June 2020 Page 99 Bar Standards Board
Appendix I: Anonymisation process
To protect the identity of individual students, data have been anonymised in line with recommendations and guidelines laid out in ‘Anonymisation:
managing data protection risk code of practice’ (Information Commissioner's Office, November 2012).
- A combination of the following anonymisation techniques have been carried out in order to prevent single individuals being identified from the data
in the charts:some of the data have been aggregated, particularly sensitive demographic data and instances of small cohorts;
- as part-time cohorts are significantly smaller than full-time cohorts the number of charts have been reduced significantly and only one data table
has been provided;
- by anonymising the data in parts 1-3, we have been able to leave some of the data intact in part 4 (the anonymisation of demographic data in the
earlier parts of the report means that it is not possible to identify individuals in part 4 with any degree of accuracy);
- in the data tables found in the appendices, values have been banded automatically if they are fewer than 5 (< 5 is displayed), and fewer than 10
(< 10 is displayed);
- in a column, if only one value fewer than five or fewer than ten is present, then the next lowest value is banded to the next multiple of five, e.g.
110 becomes < 115, and 21 becomes < 25;
- totals in the data tables are not provided in most cases, particularly for individual providers;
- percentages are not provided in the data tables.
We have decided not to include in any graphs on student outcomes (Parts 1A, 2A, 3A, 4A and 4B) in instances where there are fewer than 20 students in
each overall cohort. For example, if the number of students from a certain provider with a first class degree is fewer than 20, it has not been included in
the relevant chart.
This is to ensure greater validity in the data presented, as smaller cohorts are more likely to be affected by outliers in terms of student outcomes and can
lead to misinterpretation of the data. This means that in many cases, data on individual providers are not found in a chart.

Bar Standards Board: BPTC Key Statistics Appendices
June 2020 Page 100 Bar Standards Board
Appendix II – Anonymised data tables
Anonymised Data - Part 1
1. A. BPTC results and outcomes for full-time and part-time students
1. A. 1. BPTC applications and enrolments: students from all domiciles
BPTC applications and enrolments
2016 2017 2018
Applications 2917 2977 3031
Enrolments 1421 1620 1753
1. A. 2. BPTC results obtained by students: students from all domiciles
BPTC results 2016 2017 2018 (FT only)
Outstanding 105 98 83
Very competent 691 751 713
Competent 400 428 225
Not yet complete 80 195 545
Fail 103 112 < 5
Withdrawn 41 33 < 25

Bar Standards Board: BPTC Key Statistics Appendices
June 2020 Page 101 Bar Standards Board
1. A. 3. 1. Grades obtained by, and outcomes for, full-time and part-time BPTC students, by year and first degree classification: students from all domiciles
First degree classification
BPTC results 2016 2017 2018
FT PT FT PT FT
First class
Outstanding 48 < 5 56 < 5 53
Very competent 175 24 191 21 200
Competent 14 < 10 26 < 5 22
Not yet complete < 5 < 5 < 10 < 5 34
Fail < 10 - < 5 < 5 < 5
Withdrawn < 5 < 5 < 5 < 5 < 10
Upper second class
Outstanding 44 < 10 < 25 < 10 < 25
Very competent 361 38 393 37 431
Competent 221 17 220 11 143
Not yet complete 26 < 10 64 31 251
Fail 42 < 10 50 < 5 -
Withdrawn 11 13 < 5 < 10 < 5
Lower second class
Outstanding < 5 - < 5 - < 5
Very competent 43 12 55 < 10 36
Competent 113 11 130 < 5 41
Not yet complete 18 11 48 20 184
Fail 33 < 5 43 < 5 < 5
Withdrawn < 10 < 10 < 10 < 10 < 5

Bar Standards Board: BPTC Key Statistics Appendices
June 2020 Page 102 Bar Standards Board
1. A. 3. 2. Grades obtained by, and outcomes for, full-time and part-time BPTC students by first degree classification: UK/EU domiciled students – 2016-2017 aggregated
BPTC results First class Upper second class Lower second class
FT PT FT PT FT PT
Outstanding 99 < 5 61 12 < 5 -
Very competent 273 44 385 75 26 16
Competent 23 < 10 139 25 37 < 15
Not yet complete < 10 < 10 45 38 20 28
Fail < 10 < 5 47 11 15 < 5
Withdrawn < 10 < 5 11 20 < 10 < 15
1. A. 4. Grades obtained by full-time and part-time BPTC students (indicating whether all BPTC assessments were passed at the first attempt): students from all domiciles
Number of attempts to pass BPTC
2016 2017 2018
Outstanding Very
competent Competent Outstanding
Very competent
Competent Outstanding Very
competent Competent
Passes all assessment at 1st attempt
105 528 59 98 610 67 < 85 581 44
Took a 2nd or 3rd attempt in one or more
assessments - 163 341 - 136 352 - 131 181
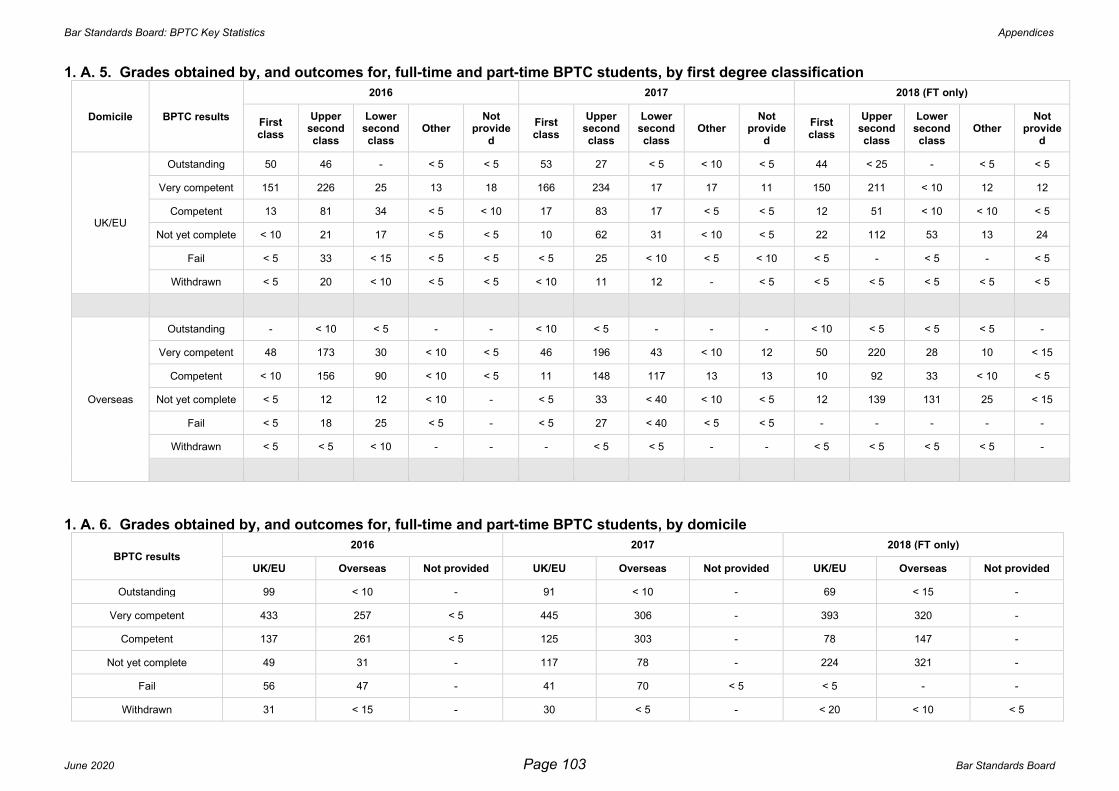
Bar Standards Board: BPTC Key Statistics Appendices
June 2020 Page 103 Bar Standards Board
1. A. 5. Grades obtained by, and outcomes for, full-time and part-time BPTC students, by first degree classification
Domicile BPTC results
2016 2017 2018 (FT only)
First class
Upper second class
Lower second class
Other Not
provided
First class
Upper second class
Lower second class
Other Not
provided
First class
Upper second class
Lower second class
Other Not
provided
UK/EU
Outstanding 50 46 - < 5 < 5 53 27 < 5 < 10 < 5 44 < 25 - < 5 < 5
Very competent 151 226 25 13 18 166 234 17 17 11 150 211 < 10 12 12
Competent 13 81 34 < 5 < 10 17 83 17 < 5 < 5 12 51 < 10 < 10 < 5
Not yet complete < 10 21 17 < 5 < 5 10 62 31 < 10 < 5 22 112 53 13 24
Fail < 5 33 < 15 < 5 < 5 < 5 25 < 10 < 5 < 10 < 5 - < 5 - < 5
Withdrawn < 5 20 < 10 < 5 < 5 < 10 11 12 - < 5 < 5 < 5 < 5 < 5 < 5
Overseas
Outstanding - < 10 < 5 - - < 10 < 5 - - - < 10 < 5 < 5 < 5 -
Very competent 48 173 30 < 10 < 5 46 196 43 < 10 12 50 220 28 10 < 15
Competent < 10 156 90 < 10 < 5 11 148 117 13 13 10 92 33 < 10 < 5
Not yet complete < 5 12 12 < 10 - < 5 33 < 40 < 10 < 5 12 139 131 25 < 15
Fail < 5 18 25 < 5 - < 5 27 < 40 < 5 < 5 - - - - -
Withdrawn < 5 < 5 < 10 - - - < 5 < 5 - - < 5 < 5 < 5 < 5 -
1. A. 6. Grades obtained by, and outcomes for, full-time and part-time BPTC students, by domicile
BPTC results 2016 2017 2018 (FT only)
UK/EU Overseas Not provided UK/EU Overseas Not provided UK/EU Overseas Not provided
Outstanding 99 < 10 - 91 < 10 - 69 < 15 -
Very competent 433 257 < 5 445 306 - 393 320 -
Competent 137 261 < 5 125 303 - 78 147 -
Not yet complete 49 31 - 117 78 - 224 321 -
Fail 56 47 - 41 70 < 5 < 5 - -
Withdrawn 31 < 15 - 30 < 5 - < 20 < 10 < 5

Bar Standards Board: BPTC Key Statistics Appendices
June 2020 Page 104 Bar Standards Board
1. A. 7. 1. Grades obtained by, and outcomes for, full-time and part-time BPTC students, by ethnicity: students from all domiciles
Ethnicity
2016 2017 2018 (FT only)
White Asian/Asian British
Black/Black British
Mixed/Multipl
e ethnic groups
Other ethnic group
Not provide
d White
Asian/Asian British
Black/Black British
Mixed/Multipl
e ethnic groups
Other ethnic group
Not provide
d White
Asian/Asian British
Black/Black British
Mixed/Multipl
e ethnic groups
Other ethnic group
Not provide
d
Outstanding 89 < 10 < 5 < 5 - < 5 85 < 10 < 5 < 5 - - 62 < 10 < 5 < 5 < 5 < 5
Very competent 329 258 29 31 < 10 35 314 324 31 49 14 19 291 259 38 36 11 78
Competent 63 252 30 22 10 23 63 283 32 22 15 13 26 140 15 18 < 10 21
Not yet complete 13 45 12 < 5 < 5 < 5 43 100 28 < 10 < 5 11 82 317 54 23 < 10 60
Fail 15 54 23 < 10 < 5 < 5 15 69 < 25 < 5 < 5 < 5 < 5 - < 5 - - -
Withdrawn 15 < 20 < 10 < 5 - < 5 19 < 10 - < 5 < 5 < 5 < 10 < 5 < 10 < 5 < 5 < 5
1. A. 7. 2. Grades obtained by, and outcomes for, full-time and part-time BPTC students, by ethnicity and first degree classification: UK/EU domiciled students - 2016-2018 aggregated (full time students only for 2018)
Ethnicity
First class Upper second class Lower second class
White Asian/Asian British
Black/Black British
Mixed/Multipl
e ethnic groups
Other ethnic group
Not provide
d White
Asian/Asian British
Black/Black British
Mixed/Multipl
e ethnic groups
Other ethnic group
Not provide
d White
Asian/Asian British
Black/Black British
Mixed/Multipl
e ethnic groups
Other ethnic group
Not provide
d
Outstanding 130 < 10 - < 10 < 5 < 5 81 < 5 < 5 < 5 - < 5 < 5 - - - - -
Very competent 345 44 12 34 < 10 26 463 87 28 46 14 33 24 10 11 < 5 < 5 -
Competent 24 < 10 < 5 < 5 - < 5 84 63 30 18 < 10 13 19 29 < 10 < 5 - < 5
Not yet complete 25 < 10 < 5 < 5 - - 63 71 40 < 10 < 5 < 10 11 50 22 < 10 < 5 12
Fail < 5 < 5 < 5 - < 5 - 16 16 22 < 5 - < 5 < 5 < 10 < 10 < 5 < 5 < 5
Withdrawn < 15 < 5 - - - < 5 19 < 10 < 10 < 5 - < 5 < 10 < 10 < 5 < 5 < 5 < 5

Bar Standards Board: BPTC Key Statistics Appendices
June 2020 Page 105 Bar Standards Board
1. A. 7. 3. Grades obtained by, and outcomes for, full-time and part-time BPTC students, by ethnicity and first degree classification: overseas domiciled students - 2016-2018 aggregated (full time students only for 2018)
Ethnicity
First class Upper second class Lower second class
White Asian/Asian British
Black/Black British
Mixed/Multipl
e ethnic groups
Other ethnic group
Not provide
d White
Asian/Asian British
Black/Black British
Mixed/Multipl
e ethnic groups
Other ethnic group
Not provide
d White
Asian/Asian British
Black/Black British
Mixed/Multipl
e ethnic groups
Other ethnic group
Not provide
d
Outstanding < 5 < 10 < 5 - - < 5 < 5 < 10 - < 5 - - < 5 < 5 - - - -
Very competent 14 103 < 10 10 - 10 25 470 28 15 < 10 45 < 5 81 < 10 < 5 < 5 < 10
Competent < 5 19 < 5 < 5 < 5 < 5 10 315 13 23 13 22 < 5 199 16 < 10 < 5 < 15
Not yet complete < 5 < 10 - < 5 < 5 < 5 < 10 144 < 10 < 10 < 10 13 < 5 130 < 10 < 5 < 5 35
Fail - < 5 < 5 - - - - 40 < 5 < 5 < 5 - < 5 51 < 10 < 5 < 5 -
Withdrawn < 5 < 5 - - - - - < 5 < 5 - - - - < 10 < 5 - - -
1. A. 8. 1. Grades obtained by, and outcomes for, full-time and part-time BPTC students, by gender: students from all domiciles (full time students only for 2018)
BPTC results 2016 2017 2018
Female Male Not provided Female Male Not provided Female Male Not provided
Outstanding 52 53 - 48 50 - 42 41 -
Very competent 393 297 < 5 442 309 - 420 293 -
Competent 225 174 < 5 244 184 - 116 109 -
Not yet complete 44 36 - 100 95 - 309 236 -
Fail 63 40 - 57 54 < 5 < 5 < 5 -
Withdrawn 20 21 - 18 15 - < 10 < 15 -

Bar Standards Board: BPTC Key Statistics Appendices
June 2020 Page 106 Bar Standards Board
1. A. 8. 2 & 3. Grades obtained by, and outcomes for, full-time and part-time BPTC students, by gender and first degree classification- 2016-2018 aggregated (full time students only for 2018)
Domicile BPTC results First class Upper second class Lower second class
Female Male Not provided Female Male Not provided Female Male Not provided
UK/EU
Outstanding 72 75 - 42 51 - < 5 < 5 -
Very competent 247 220 - 385 286 - 34 16 -
Competent 30 12 - 147 68 - 29 30 -
Not yet complete 19 18 - 129 66 - 56 45 -
Fail < 10 < 5 - 40 18 - < 15 < 10 -
Withdrawn < 10 < 10 - 19 15 - < 15 < 10 -
Overseas
Outstanding < 10 < 10 - < 10 < 5 - < 5 < 5 -
Very competent 92 52 - 373 216 - 54 47 -
Competent 16 11 - 218 178 - 103 137 -
Not yet complete < 15 < 5 - 98 86 - 85 95 -
Fail - < 5 - 26 19 - 28 34 -
Withdrawn - < 5 - < 5 < 5 - < 5 < 10 -
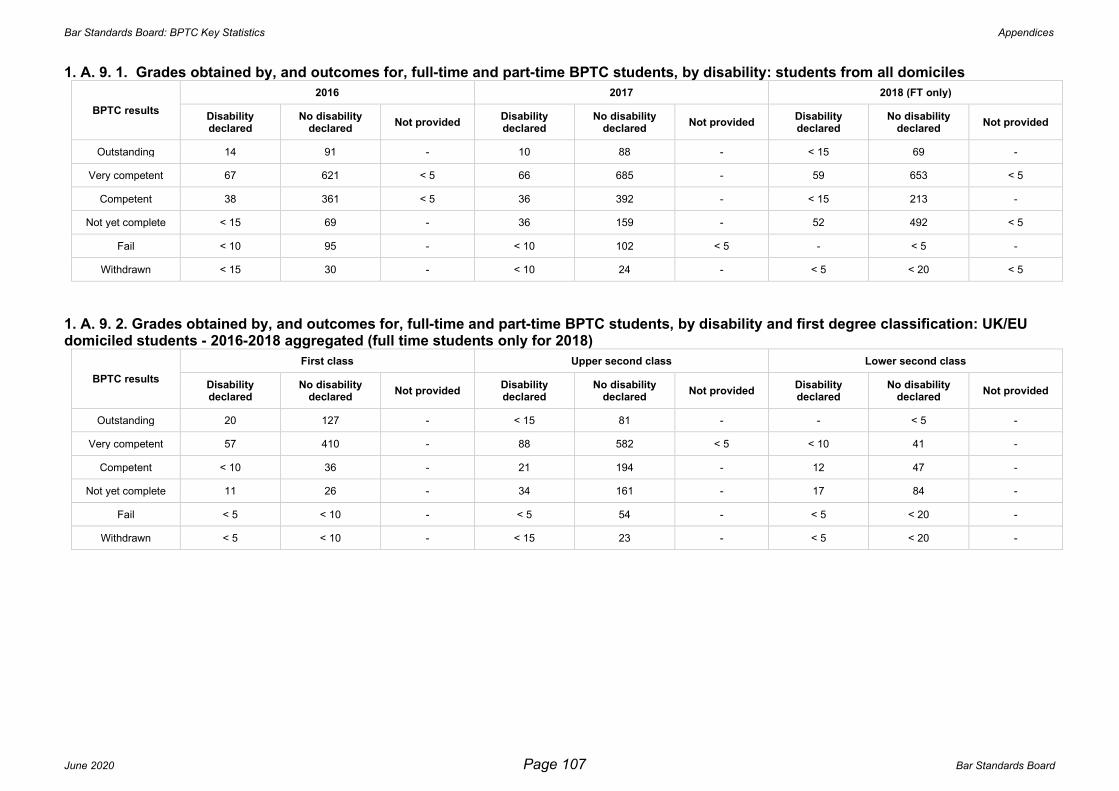
Bar Standards Board: BPTC Key Statistics Appendices
June 2020 Page 107 Bar Standards Board
1. A. 9. 1. Grades obtained by, and outcomes for, full-time and part-time BPTC students, by disability: students from all domiciles
BPTC results
2016 2017 2018 (FT only)
Disability declared
No disability declared
Not provided Disability declared
No disability declared
Not provided Disability declared
No disability declared
Not provided
Outstanding 14 91 - 10 88 - < 15 69 -
Very competent 67 621 < 5 66 685 - 59 653 < 5
Competent 38 361 < 5 36 392 - < 15 213 -
Not yet complete < 15 69 - 36 159 - 52 492 < 5
Fail < 10 95 - < 10 102 < 5 - < 5 -
Withdrawn < 15 30 - < 10 24 - < 5 < 20 < 5
1. A. 9. 2. Grades obtained by, and outcomes for, full-time and part-time BPTC students, by disability and first degree classification: UK/EU domiciled students - 2016-2018 aggregated (full time students only for 2018)
BPTC results
First class Upper second class Lower second class
Disability declared
No disability declared
Not provided Disability declared
No disability declared
Not provided Disability declared
No disability declared
Not provided
Outstanding 20 127 - < 15 81 - - < 5 -
Very competent 57 410 - 88 582 < 5 < 10 41 -
Competent < 10 36 - 21 194 - 12 47 -
Not yet complete 11 26 - 34 161 - 17 84 -
Fail < 5 < 10 - < 5 54 - < 5 < 20 -
Withdrawn < 5 < 10 - < 15 23 - < 5 < 20 -

Bar Standards Board: BPTC Key Statistics Appendices
June 2020 Page 108 Bar Standards Board
1. B. Profile of full-time and part-time BPTC students
1. B. 1. Age of full-time and part-time students (as at 1 October in the year of enrolling on the BPTC): students from all domiciles
BPTC start year 2016 2017 2018
Under 25 971 1144 1224
25 - 34 334 350 397
35 - 44 72 79 75
45 and over 42 46 56
Not provided < 5 < 5 < 5
1. B. 2. Domicile of full-time and part-time BPTC students
Domicile 2016 2017 2018
UK/EU 806 851 928
Overseas 612 768 824
Not provided < 5 < 5 < 5

Bar Standards Board: BPTC Key Statistics Appendices
June 2020 Page 109 Bar Standards Board
1. B. 3. First degree classification of full-time and part-time BPTC students: students from all domiciles
First degree classification 2016 2017 2018
First class 285 319 346
Upper second class 797 851 935
Lower second class 256 324 295
Other 43 67 97
Not provided 40 56 80
1. B. 4. First degree classification of full-time and part-time BPTC students, by domicile
First degree classification by domicile
2016 2017 2018
UK/EU Overseas Not provided UK/EU Overseas Not provided UK/EU Overseas Not provided
First class 226 59 - 255 64 - 262 84 -
Upper second class 428 368 < 5 444 407 - 473 462 -
Lower second class 93 163 - 87 237 - 98 197 -
Other 25 18 - 36 31 - 48 49 -
Not provided 34 < 5 < 5 28 27 < 5 47 32 < 5
1. B. 5. Ranking of university at which full-time and part-time BPTC students studied for first degree: students from all domiciles
University of first degree 2016 2017 2018
Top ten 271 227 263
Next forty 536 629 694
Other university 511 613 632
Overseas 54 81 72
Not provided 49 70 92
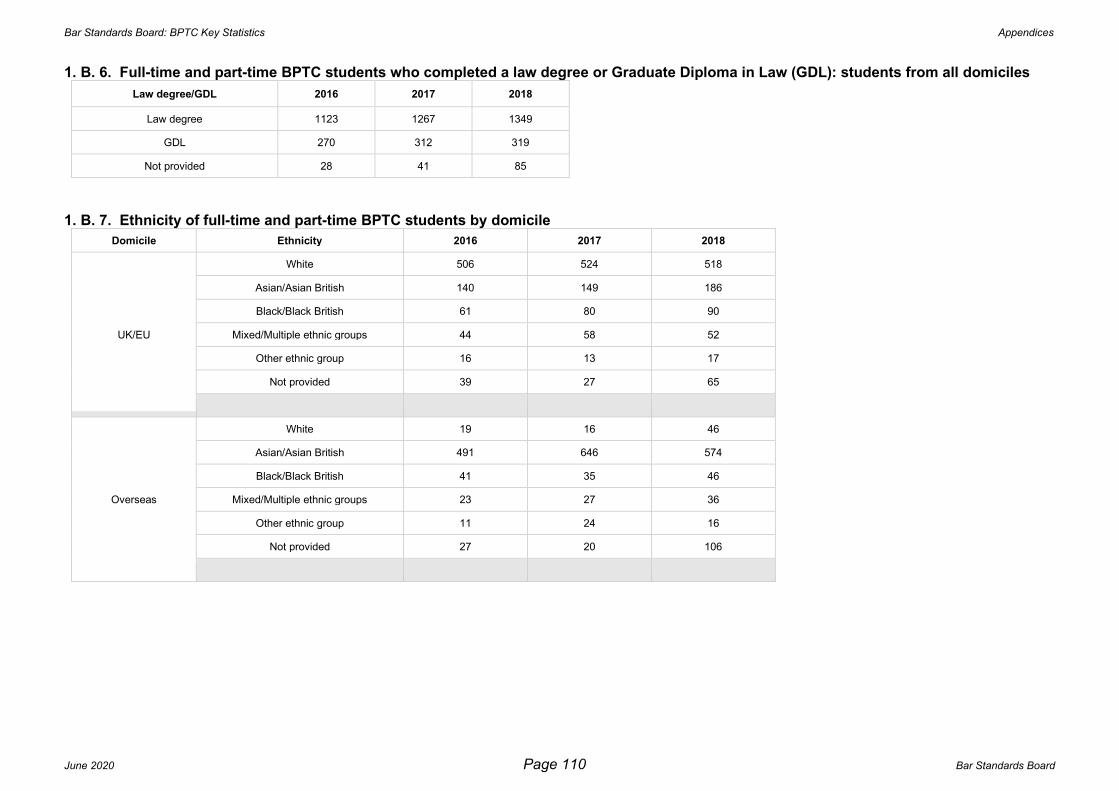
Bar Standards Board: BPTC Key Statistics Appendices
June 2020 Page 110 Bar Standards Board
1. B. 6. Full-time and part-time BPTC students who completed a law degree or Graduate Diploma in Law (GDL): students from all domiciles
Law degree/GDL 2016 2017 2018
Law degree 1123 1267 1349
GDL 270 312 319
Not provided 28 41 85
1. B. 7. Ethnicity of full-time and part-time BPTC students by domicile
Domicile Ethnicity 2016 2017 2018
UK/EU
White 506 524 518
Asian/Asian British 140 149 186
Black/Black British 61 80 90
Mixed/Multiple ethnic groups 44 58 52
Other ethnic group 16 13 17
Not provided 39 27 65
Overseas
White 19 16 46
Asian/Asian British 491 646 574
Black/Black British 41 35 46
Mixed/Multiple ethnic groups 23 27 36
Other ethnic group 11 24 16
Not provided 27 20 106

Bar Standards Board: BPTC Key Statistics Appendices
June 2020 Page 111 Bar Standards Board
1. B. 8. Gender of full-time and part-time BPTC students by domicile
Domicile Gender 2016 2017 2018
UK/EU
Female 459 483 537
Male 347 368 391
Not provided - - -
Overseas
Female 339 429 454
Male 273 339 370
Not provided - - -
1. B. 9. Declared disability of full-time and part-time BPTC students: students from all domiciles
Declared disability 2016 2017 2018
Disability declared 149 167 173
No disability declared 1268 1452 1577
Not provided < 5 < 5 < 5

Bar Standards Board: BPTC Key Statistics Appendices
June 2020 Page 112 Bar Standards Board
Anonymised Data - Part 2
2. A. BPTC results and outcomes of full-time students
2. A. 1. BPTC enrolments: students from all domiciles
BPTC start year BPP B’ham
BPP Bristol
BPP Leeds
BPP London
BPP Manch’r
CAR CLS MMU NTU UNN UOL B’ham
UOL Leeds
UOL London
UWE
2016 50 0 46 271 52 61 318 64 54 103 26 21 101 71
2017 53 48 46 269 67 104 382 64 56 104 44 26 92 90
2018 44 49 55 293 65 132 402 70 46 114 51 46 128 96

Bar Standards Board: BPTC Key Statistics Appendices
June 2020 Page 113 Bar Standards Board
2. A. 2. BPTC results obtained by full-time students: students from all domiciles
BPTC start year
Overall BPTC results BPP B’ham
BPP Bristol
BPP Leeds
BPP London
BPP Manch'r
CAR CLS MMU NTU UNN UOL B'ham
UOL Leeds
UOL London
UWE
2016
Outstanding < 5 - < 5 27 < 10 < 5 28 < 5 < 5 < 10 < 5 < 5 11 < 10
Very competent 22 - 23 131 37 36 161 13 33 36 14 < 10 64 34
Competent 17 - 17 75 < 10 19 94 36 < 10 45 < 5 < 10 16 18
Not yet complete < 5 - - < 5 - - 22 < 5 < 10 < 10 < 5 < 5 < 10 < 5
Fail < 10 - < 5 29 < 5 < 5 < 15 < 10 < 5 < 10 < 5 < 5 < 5 10
Withdrawn < 5 - < 5 < 10 < 5 < 5 < 5 < 5 < 5 < 5 < 5 - - < 5
2017
Outstanding < 5 < 5 < 5 < 30 < 10 < 5 25 - < 5 < 5 < 5 < 5 < 5 12
Very competent 26 < 10 21 92 51 56 207 20 27 39 20 17 63 41
Competent 13 31 15 79 < 10 32 89 28 < 10 41 11 < 10 19 28
Not yet complete < 10 < 10 < 5 < 30 < 5 < 5 37 < 10 19 < 15 < 5 < 5 < 10 < 5
Fail < 10 < 5 < 10 39 < 5 < 10 < 20 < 10 - < 15 < 5 - < 5 < 10
Withdrawn < 5 - - < 5 - < 5 < 10 < 5 - - < 5 - - < 5
2018
Outstanding < 5 < 5 - < 25 < 5 < 5 36 - < 5 < 5 < 5 < 5 < 5 < 5
Very competent 13 15 19 127 50 64 221 21 18 19 22 21 66 37
Competent < 10 < 10 19 33 < 10 15 45 < 15 < 10 21 < 10 < 5 20 19
Not yet complete 21 23 < 20 106 < 10 48 94 33 19 70 18 18 39 34
Fail - - - - - - < 5 - - < 5 - - - < 5
Withdrawn < 5 < 5 < 5 < 10 - < 5 < 5 < 5 < 5 - - - < 5 < 5

Bar Standards Board: BPTC Key Statistics Appendices
June 2020 Page 114 Bar Standards Board
2. A. 4. Whether full-time BPTC graduates passed all assessments at first or second/third attempt by provider: students from all domiciles
BPTC start year
Number of attempts to pass BPTC
BPP B’ham
BPP Bristol
BPP Leeds
BPP London
BPP Manch'r
CAR CLS MMU NTU UNN UOL B'ham
UOL Leeds
UOL London
UWE
2016
Pass at 1st attempt 15 - 20 141 37 30 164 12 19 56 14 12 61 32
Pass at 2nd or 3rd attempt 25 - 22 92 13 28 119 40 25 30 5 5 30 26
2017
Pass at 1st attempt 14 5 19 105 46 53 222 14 24 54 26 17 60 52
Pass at 2nd or 3rd attempt 26 32 19 94 18 39 99 25 13 26 9 8 25 29
2018
Pass at 1st attempt 13 13 20 122 50 56 233 20 17 20 15 21 71 36
Pass at 2nd or 3rd attempt 9 12 18 59 9 26 69 14 8 23 18 7 17 24
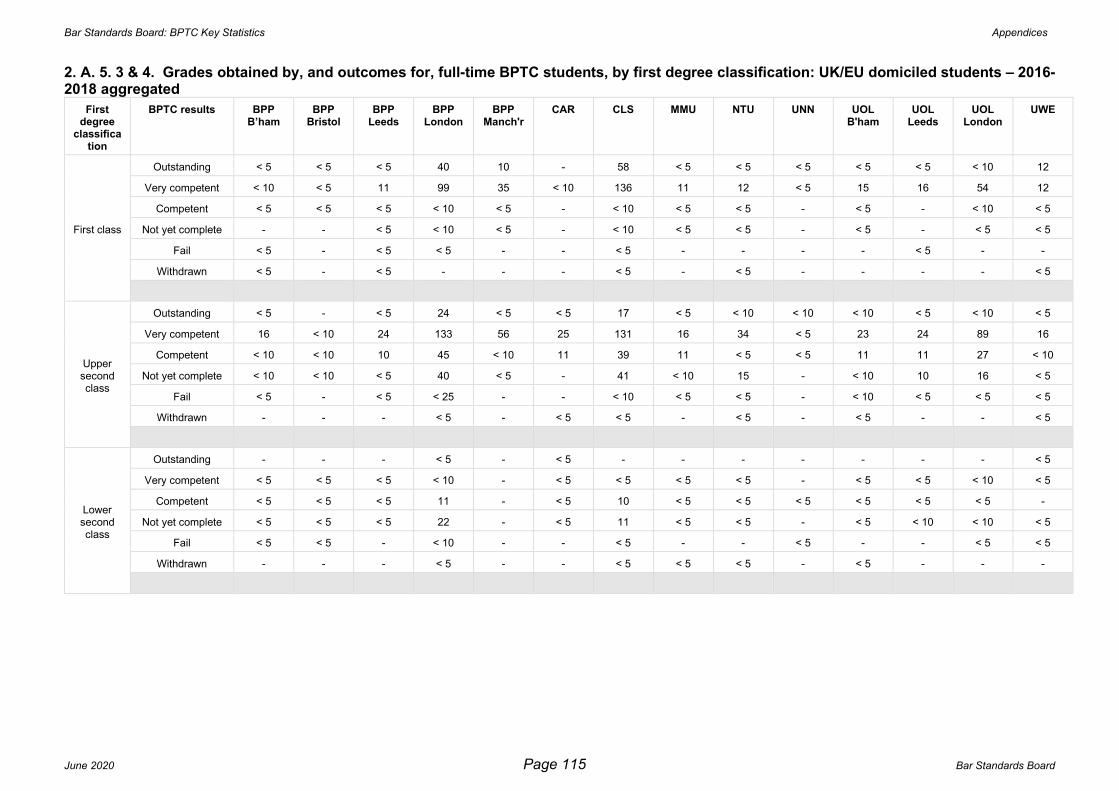
Bar Standards Board: BPTC Key Statistics Appendices
June 2020 Page 115 Bar Standards Board
2. A. 5. 3 & 4. Grades obtained by, and outcomes for, full-time BPTC students, by first degree classification: UK/EU domiciled students – 2016-2018 aggregated
First degree
classification
BPTC results BPP B’ham
BPP Bristol
BPP Leeds
BPP London
BPP Manch'r
CAR CLS MMU NTU UNN UOL B'ham
UOL Leeds
UOL London
UWE
First class
Outstanding < 5 < 5 < 5 40 10 - 58 < 5 < 5 < 5 < 5 < 5 < 10 12
Very competent < 10 < 5 11 99 35 < 10 136 11 12 < 5 15 16 54 12
Competent < 5 < 5 < 5 < 10 < 5 - < 10 < 5 < 5 - < 5 - < 10 < 5
Not yet complete - - < 5 < 10 < 5 - < 10 < 5 < 5 - < 5 - < 5 < 5
Fail < 5 - < 5 < 5 - - < 5 - - - - < 5 - -
Withdrawn < 5 - < 5 - - - < 5 - < 5 - - - - < 5
Upper second class
Outstanding < 5 - < 5 24 < 5 < 5 17 < 5 < 10 < 10 < 10 < 5 < 10 < 5
Very competent 16 < 10 24 133 56 25 131 16 34 < 5 23 24 89 16
Competent < 10 < 10 10 45 < 10 11 39 11 < 5 < 5 11 11 27 < 10
Not yet complete < 10 < 10 < 5 40 < 5 - 41 < 10 15 - < 10 10 16 < 5
Fail < 5 - < 5 < 25 - - < 10 < 5 < 5 - < 10 < 5 < 5 < 5
Withdrawn - - - < 5 - < 5 < 5 - < 5 - < 5 - - < 5
Lower second class
Outstanding - - - < 5 - < 5 - - - - - - - < 5
Very competent < 5 < 5 < 5 < 10 - < 5 < 5 < 5 < 5 - < 5 < 5 < 10 < 5
Competent < 5 < 5 < 5 11 - < 5 10 < 5 < 5 < 5 < 5 < 5 < 5 -
Not yet complete < 5 < 5 < 5 22 - < 5 11 < 5 < 5 - < 5 < 10 < 10 < 5
Fail < 5 < 5 - < 10 - - < 5 - - < 5 - - < 5 < 5
Withdrawn - - - < 5 - - < 5 < 5 < 5 - < 5 - - -

Bar Standards Board: BPTC Key Statistics Appendices
June 2020 Page 116 Bar Standards Board
2. A. 5. 5 & 6. Grades obtained by, and outcomes for, full-time BPTC students, by first degree classification: Overseas domiciled students – 2016-2018 aggregated
First degree
classification
BPTC results BPP B’ham
BPP Bristol
BPP Leeds
BPP London
BPP Manch'r
CAR CLS MMU NTU UNN UOL B'ham
UOL Leeds
UOL London
UWE
First class
Outstanding - - - < 10 < 5 < 5 < 10 - - - - - - < 5
Very competent < 5 < 5 < 5 17 14 15 54 < 5 < 10 < 10 < 5 - < 10 18
Competent < 5 < 5 < 5 < 5 < 5 < 5 < 10 < 5 < 5 < 5 - - - < 5
Not yet complete < 5 - - < 5 - - < 5 < 5 - < 5 - - - < 5
Fail - - - < 5 - < 5 < 5 - - - - - - -
Withdrawn < 5 - - < 5 - - - - - - - - - -
Upper second class
Outstanding - - - < 5 - < 5 < 10 - - - - - < 5 < 5
Very competent 28 < 10 22 58 30 79 229 15 14 28 13 - 24 39
Competent 13 11 20 69 10 16 124 39 < 10 41 < 10 - 15 21
Not yet complete < 15 12 < 10 26 < 5 < 10 60 14 < 10 < 15 < 5 - 11 11
Fail < 5 < 5 < 5 14 < 5 < 5 < 10 < 5 - < 5 - - < 5 < 10
Withdrawn - - < 5 < 5 - - < 5 < 5 - - - - - -
Lower second class
Outstanding - - - < 5 - - - - - - - - - < 5
Very competent < 5 < 5 < 5 < 10 < 5 15 < 20 < 5 12 < 15 < 5 - < 5 20
Competent 12 16 13 44 < 5 32 33 17 11 21 < 5 < 5 < 5 30
Not yet complete 10 10 < 10 23 - 38 25 11 13 19 < 5 < 5 < 10 11
Fail < 5 < 5 < 5 22 < 5 < 10 < 10 < 5 - < 10 < 5 - - < 10
Withdrawn < 5 - - < 5 - < 5 - - < 5 - - - - < 5
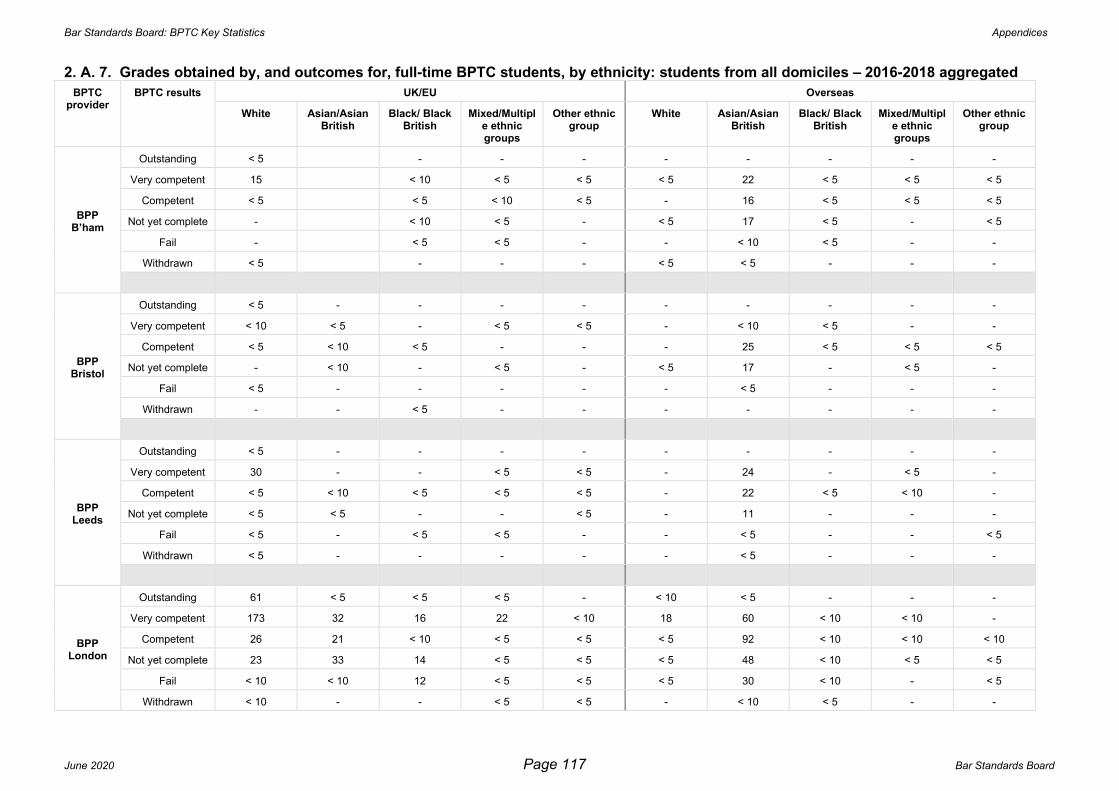
Bar Standards Board: BPTC Key Statistics Appendices
June 2020 Page 117 Bar Standards Board
2. A. 7. Grades obtained by, and outcomes for, full-time BPTC students, by ethnicity: students from all domiciles – 2016-2018 aggregated
BPTC provider
BPTC results UK/EU Overseas
White Asian/Asian British
Black/ Black British
Mixed/Multiple ethnic groups
Other ethnic group
White Asian/Asian British
Black/ Black British
Mixed/Multiple ethnic groups
Other ethnic group
BPP B’ham
Outstanding < 5 - - - - - - - -
Very competent 15 < 10 < 5 < 5 < 5 22 < 5 < 5 < 5
Competent < 5 < 5 < 10 < 5 - 16 < 5 < 5 < 5
Not yet complete - < 10 < 5 - < 5 17 < 5 - < 5
Fail - < 5 < 5 - - < 10 < 5 - -
Withdrawn < 5 - - - < 5 < 5 - - -
BPP Bristol
Outstanding < 5 - - - - - - - - -
Very competent < 10 < 5 - < 5 < 5 - < 10 < 5 - -
Competent < 5 < 10 < 5 - - - 25 < 5 < 5 < 5
Not yet complete - < 10 - < 5 - < 5 17 - < 5 -
Fail < 5 - - - - - < 5 - - -
Withdrawn - - < 5 - - - - - - -
BPP Leeds
Outstanding < 5 - - - - - - - - -
Very competent 30 - - < 5 < 5 - 24 - < 5 -
Competent < 5 < 10 < 5 < 5 < 5 - 22 < 5 < 10 -
Not yet complete < 5 < 5 - - < 5 - 11 - - -
Fail < 5 - < 5 < 5 - - < 5 - - < 5
Withdrawn < 5 - - - - - < 5 - - -
BPP London
Outstanding 61 < 5 < 5 < 5 - < 10 < 5 - - -
Very competent 173 32 16 22 < 10 18 60 < 10 < 10 -
Competent 26 21 < 10 < 5 < 5 < 5 92 < 10 < 10 < 10
Not yet complete 23 33 14 < 5 < 5 < 5 48 < 10 < 5 < 5
Fail < 10 < 10 12 < 5 < 5 < 5 30 < 10 - < 5
Withdrawn < 10 - - < 5 < 5 - < 10 < 5 - -

Bar Standards Board: BPTC Key Statistics Appendices
June 2020 Page 118 Bar Standards Board
BPTC provider
BPTC results UK/EU Overseas
White Asian/Asian British
Black/ Black British
Mixed/Multiple ethnic groups
Other ethnic group
White Asian/Asian British
Black/ Black British
Mixed/Multiple ethnic groups
Other ethnic group
BPP Manch'r
Outstanding 12 < 5 - - - - < 5 - - -
Very competent 67 10 < 5 < 10 - < 5 36 < 5 - < 5
Competent < 10 < 5 - - - < 5 < 10 - < 5 -
Not yet complete < 10 < 5 - - - - < 5 - < 5 -
Fail - - - - - - < 5 - - -
Withdrawn < 5 - - - - - - - - -
CAR
Outstanding < 10 - - - - - < 5 - < 5 -
Very competent 12 < 10 - < 5 - - 64 < 5 < 5 -
Competent < 5 < 10 - < 5 < 5 < 5 37 < 5 < 5 < 5
Not yet complete - - - - - - < 5 - - -
Fail - - - - - - 10 - - -
Withdrawn - - - - - - < 5 - - -
CLS
Outstanding 67 < 5 - < 5 < 5 < 5 < 10 < 5 - -
Very competent 208 33 12 15 < 5 11 274 10 < 10 < 10
Competent 22 24 < 10 < 5 < 5 < 10 142 < 10 < 10 < 5
Not yet complete 17 24 14 < 10 - < 5 75 < 5 < 5 < 5
Fail < 5 < 10 < 5 < 5 < 5 - 14 < 5 - -
Withdrawn < 10 < 5 < 5 - < 5 - < 5 - - -
MMU
Outstanding < 5 - - - - - - - - -
Very competent 23 < 5 < 5 < 5 - < 5 18 < 5 < 5 -
Competent < 10 < 10 < 5 < 5 - - 52 < 5 < 5 < 5
Not yet complete < 5 < 10 < 5 < 5 - - 26 < 5 - < 5
Fail < 5 < 5 < 5 - - - < 10 < 5 < 5 -
Withdrawn - < 5 - - - - < 5 < 5 - -

Bar Standards Board: BPTC Key Statistics Appendices
June 2020 Page 119 Bar Standards Board
BPTC provider
BPTC results UK/EU Overseas
White Asian/Asian British
Black/ Black British
Mixed/Multiple ethnic groups
Other ethnic group
White Asian/Asian British
Black/ Black British
Mixed/Multiple ethnic groups
Other ethnic group
NTU
Outstanding < 10 - - - - - - - - -
Very competent 35 11 - - - - 25 < 10 - -
Competent < 5 < 5 < 5 < 5 - < 5 16 - - -
Not yet complete < 10 < 10 < 5 < 5 < 5 < 5 19 - - < 5
Fail < 5 - - - - - - - - -
Withdrawn < 5 < 5 < 5 - - - - < 5 - -
UNN
Outstanding 10 - - - - - - - - -
Very competent 24 < 5 - < 5 - < 5 54 < 10 - < 5
Competent < 10 < 5 < 5 - - - 87 < 5 < 5 < 5
Not yet complete 17 < 5 < 5 < 5 - - 57 < 5 < 5 < 5
Fail < 10 - < 5 - - - 14 - - < 5
Withdrawn < 5 - - - - - - - - -
UOL B'ham
Outstanding < 10 < 5 - < 5 - - - - - -
Very competent 31 < 10 < 5 < 5 - < 5 < 10 < 10 - -
Competent < 10 < 5 < 5 < 5 - - < 10 < 5 - -
Not yet complete < 5 < 10 < 5 < 5 - - < 5 < 5 - -
Fail < 5 < 5 < 5 - - - - < 5 - -
Withdrawn < 5 < 5 - - - - - - - -
UOL Leeds
Outstanding < 5 < 5 - < 5 - - - - - -
Very competent 36 < 5 < 5 < 5 - - < 10 - - -
Competent < 10 < 10 - < 5 - < 5 < 5 < 5 - < 5
Not yet complete < 10 < 10 < 5 - - - < 5 < 5 < 5 -
Fail - < 5 - - - - - - - -
Withdrawn - - - - - - - - - -

Bar Standards Board: BPTC Key Statistics Appendices
June 2020 Page 120 Bar Standards Board
BPTC provider
BPTC results UK/EU Overseas
White Asian/Asian British
Black/ Black British
Mixed/Multiple ethnic groups
Other ethnic group
White Asian/Asian British
Black/ Black British
Mixed/Multiple ethnic groups
Other ethnic group
UOL London
Outstanding 14 - - - - - - - < 5 -
Very competent 111 12 < 10 19 < 5 < 5 23 < 5 < 5 < 5
Competent 19 < 10 < 10 < 10 - - < 20 - - -
Not yet complete 11 < 10 10 < 5 < 5 - < 20 < 5 - < 5
Fail - < 5 < 5 - - - < 5 - - -
Withdrawn < 5 - - - - - - - - -
UWE
Outstanding 17 < 5 - - - - < 5 - - -
Very competent 16 < 10 - < 5 < 5 < 5 68 < 5 < 10 -
Competent < 5 < 5 < 5 - - < 5 46 < 5 < 10 < 5
Not yet complete < 5 < 5 < 5 - - - 27 < 5 < 5 -
Fail < 5 < 5 < 5 - - - < 10 < 5 < 5 < 5
Withdrawn < 5 - - - - - < 5 - - -
2. A. 8. Grades obtained by, and outcomes for, full-time BPTC students, by gender: students from all domiciles - 2016-2018 aggregated
Domicile BPTC results
BPP B’ham
BPP Bristol
BPP Leeds
BPP Londo
n
BPP Manch'
r
CAR CLS MMU NTU UNN UOL B'ham
UOL Leeds
UOL Londo
n
UWE
UK/EU
Female
Outstanding < 5 < 5 < 5 32 < 10 < 10 34 < 5 < 5 < 5 < 5 < 5 < 10 12
Very competent 23 < 10 20 148 59 21 131 18 28 20 19 28 87 18
Competent < 10 < 10 12 49 < 10 < 10 37 < 10 < 5 < 10 < 10 < 10 25 < 5
Not yet complete < 5 < 10 < 5 56 < 5 < 10 39 < 10 14 18 < 10 10 17 < 10
Fail < 5 < 5 < 5 < 25 - - < 10 - < 5 < 10 < 5 < 5 < 5 < 5
Withdrawn - - - < 10 < 5 < 5 < 5 < 5 < 5 - < 5 - - -
Male Outstanding < 5 - < 5 36 < 10 < 5 44 < 5 < 10 < 10 < 5 < 5 10 < 10
Very competent < 5 < 5 16 109 34 23 149 14 19 10 21 14 73 12
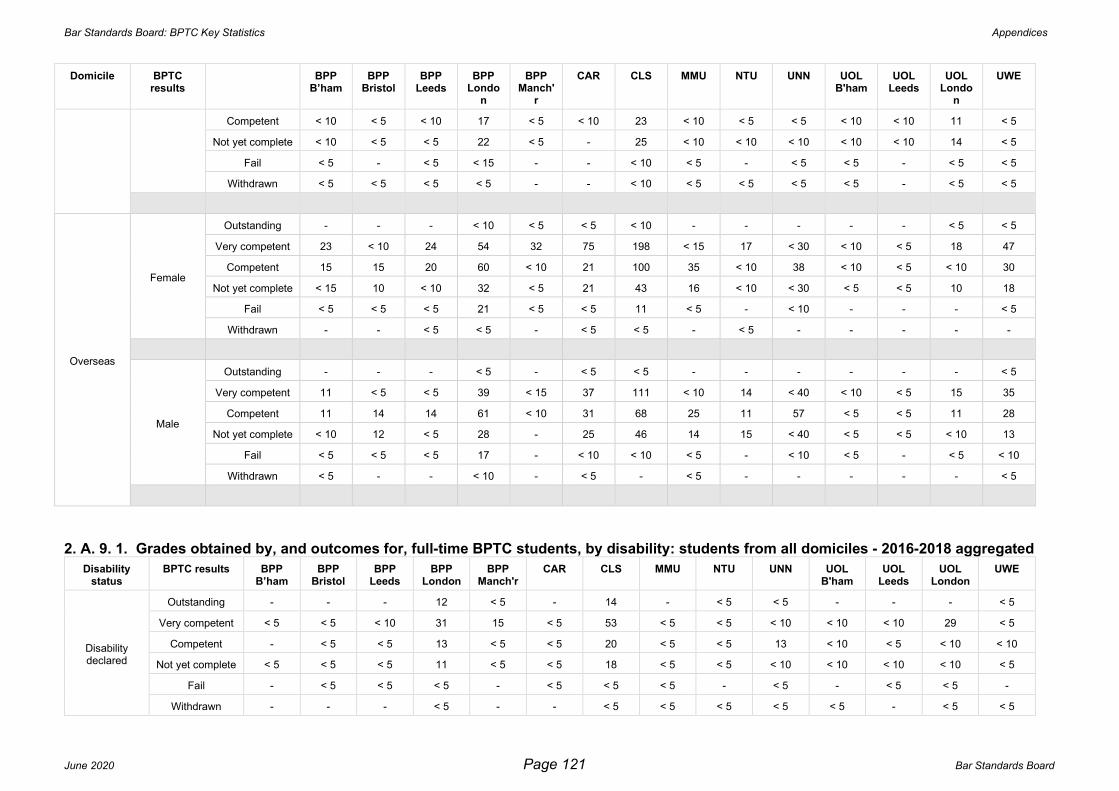
Bar Standards Board: BPTC Key Statistics Appendices
June 2020 Page 121 Bar Standards Board
Domicile BPTC results
BPP B’ham
BPP Bristol
BPP Leeds
BPP Londo
n
BPP Manch'
r
CAR CLS MMU NTU UNN UOL B'ham
UOL Leeds
UOL Londo
n
UWE
Competent < 10 < 5 < 10 17 < 5 < 10 23 < 10 < 5 < 5 < 10 < 10 11 < 5
Not yet complete < 10 < 5 < 5 22 < 5 - 25 < 10 < 10 < 10 < 10 < 10 14 < 5
Fail < 5 - < 5 < 15 - - < 10 < 5 - < 5 < 5 - < 5 < 5
Withdrawn < 5 < 5 < 5 < 5 - - < 10 < 5 < 5 < 5 < 5 - < 5 < 5
Overseas
Female
Outstanding - - - < 10 < 5 < 5 < 10 - - - - - < 5 < 5
Very competent 23 < 10 24 54 32 75 198 < 15 17 < 30 < 10 < 5 18 47
Competent 15 15 20 60 < 10 21 100 35 < 10 38 < 10 < 5 < 10 30
Not yet complete < 15 10 < 10 32 < 5 21 43 16 < 10 < 30 < 5 < 5 10 18
Fail < 5 < 5 < 5 21 < 5 < 5 11 < 5 - < 10 - - - < 5
Withdrawn - - < 5 < 5 - < 5 < 5 - < 5 - - - - -
Male
Outstanding - - - < 5 - < 5 < 5 - - - - - - < 5
Very competent 11 < 5 < 5 39 < 15 37 111 < 10 14 < 40 < 10 < 5 15 35
Competent 11 14 14 61 < 10 31 68 25 11 57 < 5 < 5 11 28
Not yet complete < 10 12 < 5 28 - 25 46 14 15 < 40 < 5 < 5 < 10 13
Fail < 5 < 5 < 5 17 - < 10 < 10 < 5 - < 10 < 5 - < 5 < 10
Withdrawn < 5 - - < 10 - < 5 - < 5 - - - - - < 5
2. A. 9. 1. Grades obtained by, and outcomes for, full-time BPTC students, by disability: students from all domiciles - 2016-2018 aggregated
Disability status
BPTC results BPP B’ham
BPP Bristol
BPP Leeds
BPP London
BPP Manch'r
CAR CLS MMU NTU UNN UOL B'ham
UOL Leeds
UOL London
UWE
Disability declared
Outstanding - - - 12 < 5 - 14 - < 5 < 5 - - - < 5
Very competent < 5 < 5 < 10 31 15 < 5 53 < 5 < 5 < 10 < 10 < 10 29 < 5
Competent - < 5 < 5 13 < 5 < 5 20 < 5 < 5 13 < 10 < 5 < 10 < 10
Not yet complete < 5 < 5 < 5 11 < 5 < 5 18 < 5 < 5 < 10 < 10 < 10 < 10 < 5
Fail - < 5 < 5 < 5 - < 5 < 5 < 5 - < 5 - < 5 < 5 -
Withdrawn - - - < 5 - - < 5 < 5 < 5 < 5 < 5 - < 5 < 5

Bar Standards Board: BPTC Key Statistics Appendices
June 2020 Page 122 Bar Standards Board
Disability status
BPTC results BPP B’ham
BPP Bristol
BPP Leeds
BPP London
BPP Manch'r
CAR CLS MMU NTU UNN UOL B'ham
UOL Leeds
UOL London
UWE
No disability declared
Outstanding < 5 < 5 < 5 64 12 10 75 < 5 < 5 < 10 < 10 < 10 < 20 21
Very competent 59 18 57 319 123 151 536 50 75 85 48 41 163 109
Competent 38 38 47 174 19 64 208 73 20 94 16 17 49 60
Not yet complete 28 26 15 127 < 10 50 135 42 40 78 13 15 43 37
Fail 11 < 5 < 10 64 < 5 < 10 < 30 10 < 5 < 20 < 10 < 5 < 10 < 20
Withdrawn < 5 < 5 < 5 10 < 5 < 5 < 10 < 5 < 5 - < 5 - - < 5
2. A. 9. 2. Grades obtained by, and outcomes for, full-time BPTC students, by disability: UK/EU domiciled students – 2016-2018 aggregated
Disability status
BPTC results BPP B’ham
BPP Bristol
BPP Leeds
BPP London
BPP Manch'r
CAR CLS MMU NTU UNN UOL B'ham
UOL Leeds
UOL London
UWE
Disability declared
Outstanding - - - < 10 < 5 - 14 - < 5 < 5 - - - < 5
Very competent < 5 < 5 < 10 27 15 - 42 < 5 < 5 < 10 < 10 < 10 27 < 5
Competent - - < 5 < 10 < 5 < 5 10 < 5 < 5 < 10 < 10 < 5 < 10 < 5
Not yet complete < 5 - < 5 < 10 < 5 - 10 < 5 < 5 < 5 < 10 < 10 < 10 < 5
Fail - - < 5 < 5 - - < 5 < 5 - < 5 - < 5 < 5 -
Withdrawn - - - < 5 - - < 5 - < 5 < 5 < 5 - < 5 < 5
No disability declared
Outstanding < 5 < 5 < 5 59 11 < 10 64 < 5 < 5 < 10 < 10 < 10 < 20 17
Very competent 25 < 10 30 230 78 44 238 29 44 24 32 36 132 28
Competent 12 10 16 60 < 10 13 50 12 < 5 < 10 < 10 13 31 < 10
Not yet complete < 10 < 10 < 10 70 < 5 < 10 54 12 20 20 < 10 11 25 < 10
Fail < 10 < 5 < 5 < 30 - - < 15 < 5 < 5 < 5 < 10 < 5 < 5 < 10
Outstanding < 5 < 5 < 5 < 10 < 5 < 5 < 10 < 5 < 5 - < 5 - - < 5

Bar Standards Board: BPTC Key Statistics Appendices
June 2020 Page 123 Bar Standards Board
2. B. Profile of full-time BPTC students
2. B. 1. Age of full-time students (as at 1 October in the year of enrolling on a BPTC): students from all domiciles
BPTC start year
Student age range at start of BPTC
BPP B’ham
BPP Bristol
BPP Leeds
BPP London
BPP Manch'r
CAR CLS MMU NTU UNN UOL B'ham
UOL Leeds
UOL London
UWE
2016
Under 25 42 - < 40 207 43 48 236 41 35 77 17 15 61 47
25 - 34 < 5 - < 10 51 < 10 13 66 16 17 22 < 10 < 10 30 19
35 - 44 < 5 - - < 15 < 5 - < 15 < 5 < 5 < 5 < 5 < 5 < 10 < 5
45 and over < 5 - - < 5 - - < 10 < 5 < 5 < 5 < 5 - < 5 < 5
Unknown - - - - - - - < 5 - - - - - -
2017
Under 25 36 31 34 203 57 85 283 47 40 84 31 22 61 69
25 - 34 11 12 10 57 < 10 < 20 79 11 11 17 < 10 < 5 26 17
35 - 44 < 5 < 5 < 5 < 5 < 5 < 5 < 20 < 5 < 5 < 5 < 5 - < 5 < 5
45 and over < 5 < 5 < 5 < 10 - - < 10 < 5 < 5 < 5 < 5 < 5 < 5 < 5
Unknown - - - - - - - < 5 - - - - - -
2018
Under 25 32 38 37 206 54 102 305 47 29 82 38 38 93 75
25 - 34 < 10 < 15 16 66 < 10 27 81 20 13 20 < 15 < 10 24 18
35 - 44 < 5 < 5 < 5 < 15 < 5 < 5 < 10 < 5 < 5 < 10 < 5 < 5 < 10 < 5
45 and over < 5 - < 5 < 10 < 5 < 5 < 15 < 5 < 5 < 10 - < 5 < 10 < 5
Unknown - - - - - < 5 - - - - - - - -

Bar Standards Board: BPTC Key Statistics Appendices
June 2020 Page 124 Bar Standards Board
2. B. 2. Domicile of full-time BPTC students
BPTC start year
Domicile BPP B’ham
BPP Bristol
BPP Leeds
BPP London
BPP Manch'r
CAR CLS MMU NTU UNN UOL B'ham
UOL Leeds
UOL London
UWE
2016
UK/EU 16 - 19 171 36 17 149 < 25 27 32 < 20 < 20 84 22
Overseas 34 - 27 100 16 44 169 40 27 71 < 10 < 5 17 49
Not provided - - - - - - - < 5 - - - - - -
2017
UK/EU 21 11 20 157 43 18 177 < 25 30 27 < 40 < 25 74 23
Overseas 32 37 26 112 24 86 205 41 26 77 < 10 < 5 18 67
Not provided - - - - - - - < 5 - - - - - -
2018
UK/EU 21 23 29 179 43 < 40 182 28 29 25 34 < 40 90 25
Overseas 23 26 26 114 22 94 220 42 17 89 17 < 10 38 71
Not provided - - - - - < 5 - - - - - - - -

Bar Standards Board: BPTC Key Statistics Appendices
June 2020 Page 125 Bar Standards Board
2. B. 3. First degree classification of BPTC full-time students: students from all domiciles
BPTC start year
First degree classification
BPP B’ham
BPP Bristol
BPP Leeds
BPP London
BPP Manch'r
CAR CLS MMU NTU UNN UOL B'ham
UOL Leeds
UOL London
UWE
2016
First class < 5 - < 10 71 21 < 10 75 < 10 10 < 5 < 10 < 10 27 < 10
Upper second class 25 - 36 152 28 36 200 41 28 40 16 10 56 37
Lower second class 19 - < 10 38 < 5 13 < 40 13 16 26 < 5 < 10 12 24
Other < 5 - - < 10 < 5 < 5 < 10 < 5 - < 15 < 5 - < 10 < 5
Not provided - - - < 5 - < 5 - < 5 - 23 - < 5 < 5 -
2017
First class < 10 < 10 < 5 56 22 < 10 102 < 10 < 5 10 < 10 < 10 30 21
Upper second class 33 16 30 136 41 48 218 32 36 25 29 19 52 41
Lower second class 11 26 12 67 < 5 44 42 19 < 20 10 < 10 < 5 < 5 24
Other - - < 5 < 10 - < 5 20 - - 21 - < 5 < 10 < 5
Not provided < 5 < 5 - < 10 < 5 - - < 5 - 38 - - < 5 < 5
2018
First class < 10 < 10 11 55 25 14 107 11 < 15 < 5 10 11 21 24
Upper second class 27 30 29 147 40 63 249 40 20 28 37 27 84 31
Lower second class 10 12 15 43 - 47 33 14 < 15 26 < 5 < 10 18 27
Other < 5 < 5 - 10 - < 10 13 < 5 < 5 42 < 5 < 5 < 5 -
Not provided < 5 - - 38 - < 5 - < 5 - < 20 - - < 5 14
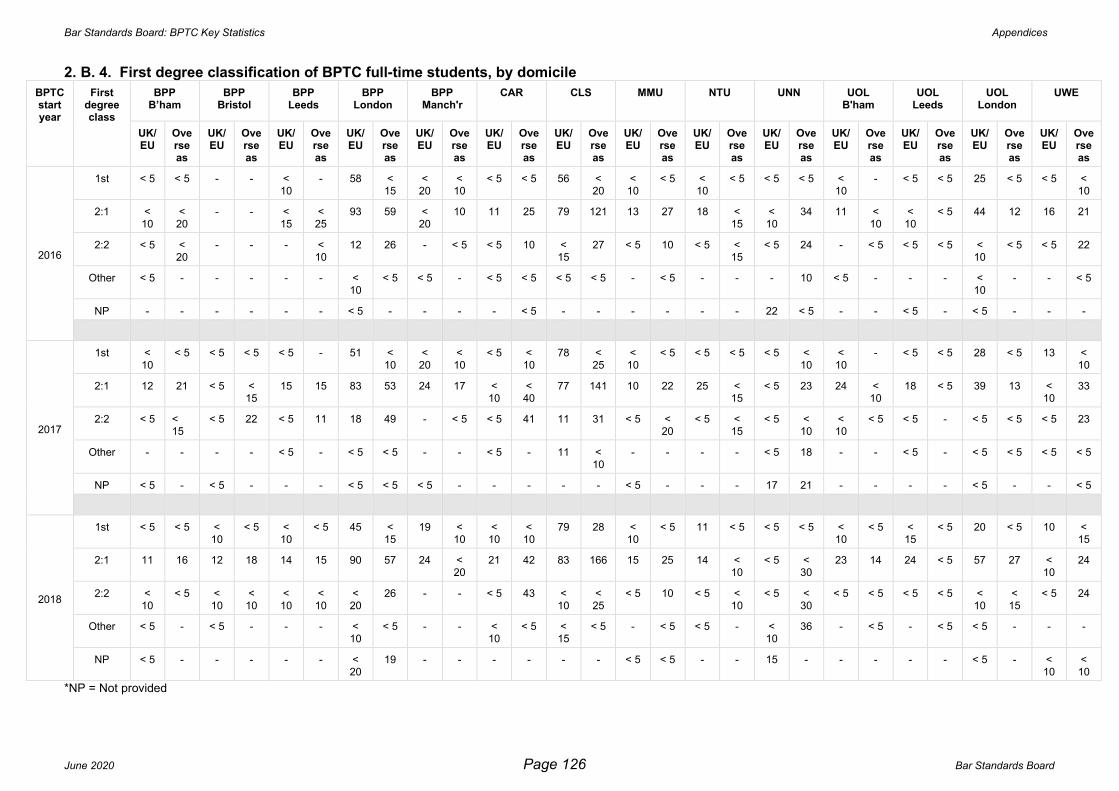
Bar Standards Board: BPTC Key Statistics Appendices
June 2020 Page 126 Bar Standards Board
2. B. 4. First degree classification of BPTC full-time students, by domicile
BPTC start year
First degree class
BPP B’ham
BPP Bristol
BPP Leeds
BPP London
BPP Manch'r
CAR CLS MMU NTU UNN UOL B'ham
UOL Leeds
UOL London
UWE
UK/EU
Overseas
UK/EU
Overseas
UK/EU
Overseas
UK/EU
Overseas
UK/EU
Overseas
UK/EU
Overseas
UK/EU
Overseas
UK/EU
Overseas
UK/EU
Overseas
UK/EU
Overseas
UK/EU
Overseas
UK/EU
Overseas
UK/EU
Overseas
UK/EU
Overseas
2016
1st < 5 < 5 - - < 10
- 58 < 15
< 20
< 10
< 5 < 5 56 < 20
< 10
< 5 < 10
< 5 < 5 < 5 < 10
- < 5 < 5 25 < 5 < 5 < 10
2:1 < 10
< 20
- - < 15
< 25
93 59 < 20
10 11 25 79 121 13 27 18 < 15
< 10
34 11 < 10
< 10
< 5 44 12 16 21
2:2 < 5 < 20
- - - < 10
12 26 - < 5 < 5 10 < 15
27 < 5 10 < 5 < 15
< 5 24 - < 5 < 5 < 5 < 10
< 5 < 5 22
Other < 5 - - - - - < 10
< 5 < 5 - < 5 < 5 < 5 < 5 - < 5 - - - 10 < 5 - - - < 10
- - < 5
NP - - - - - - < 5 - - - - < 5 - - - - - - 22 < 5 - - < 5 - < 5 - - -
2017
1st < 10
< 5 < 5 < 5 < 5 - 51 < 10
< 20
< 10
< 5 < 10
78 < 25
< 10
< 5 < 5 < 5 < 5 < 10
< 10
- < 5 < 5 28 < 5 13 < 10
2:1 12 21 < 5 < 15
15 15 83 53 24 17 < 10
< 40
77 141 10 22 25 < 15
< 5 23 24 < 10
18 < 5 39 13 < 10
33
2:2 < 5 < 15
< 5 22 < 5 11 18 49 - < 5 < 5 41 11 31 < 5 < 20
< 5 < 15
< 5 < 10
< 10
< 5 < 5 - < 5 < 5 < 5 23
Other - - - - < 5 - < 5 < 5 - - < 5 - 11 < 10
- - - - < 5 18 - - < 5 - < 5 < 5 < 5 < 5
NP < 5 - < 5 - - - < 5 < 5 < 5 - - - - - < 5 - - - 17 21 - - - - < 5 - - < 5
2018
1st < 5 < 5 < 10
< 5 < 10
< 5 45 < 15
19 < 10
< 10
< 10
79 28 < 10
< 5 11 < 5 < 5 < 5 < 10
< 5 < 15
< 5 20 < 5 10 < 15
2:1 11 16 12 18 14 15 90 57 24 < 20
21 42 83 166 15 25 14 < 10
< 5 < 30
23 14 24 < 5 57 27 < 10
24
2:2 < 10
< 5 < 10
< 10
< 10
< 10
< 20
26 - - < 5 43 < 10
< 25
< 5 10 < 5 < 10
< 5 < 30
< 5 < 5 < 5 < 5 < 10
< 15
< 5 24
Other < 5 - < 5 - - - < 10
< 5 - - < 10
< 5 < 15
< 5 - < 5 < 5 - < 10
36 - < 5 - < 5 < 5 - - -
NP < 5 - - - - - < 20
19 - - - - - - < 5 < 5 - - 15 - - - - - < 5 - < 10
< 10
*NP = Not provided

Bar Standards Board: BPTC Key Statistics Appendices
June 2020 Page 127 Bar Standards Board
2. B. 5. Ranking of university at which full-time BPTC students studied for first degree: students from all domiciles
BPTC start year
Classification of university at which student studied for
first degree
BPP B’ham
BPP Bristol
BPP Leeds
BPP London
BPP Manch'r
CAR CLS MMU NTU UNN UOL B'ham
UOL Leeds
UOL London
UWE
2016
Top ten < 10 - < 5 87 < 10 < 5 82 < 5 < 10 < 5 < 5 < 5 35 < 5
Next forty < 25 - 37 95 31 38 135 34 19 11 10 < 10 39 12
Other university < 25 - < 10 82 < 10 < 25 91 21 23 56 11 10 < 20 52
Overseas - - - < 10 < 5 - 10 < 5 < 5 < 5 < 5 < 5 < 10 < 10
Not provided - - < 5 < 5 < 5 - - < 5 - 33 - - - < 5
2017
Top ten < 5 < 5 < 10 55 < 10 < 5 98 < 5 < 5 < 5 < 10 < 5 < 25 < 5
Next forty 29 15 26 101 48 36 164 43 17 < 10 19 17 47 12
Other university < 25 28 15 100 11 38 104 17 34 36 14 < 10 < 25 70
Overseas - < 5 - < 15 < 5 < 30 16 < 5 < 5 - < 5 < 5 < 5 < 5
Not provided - < 5 - < 5 - - - < 5 - 60 < 5 - - < 5
2018
Top ten < 5 < 5 15 59 < 10 < 10 104 < 5 < 5 < 5 < 5 < 10 24 < 5
Next forty 22 21 22 123 47 60 174 29 23 < 10 29 19 55 < 10
Other university 16 22 14 98 < 10 49 111 34 20 45 17 14 41 70
Overseas < 5 < 5 < 5 < 15 < 5 16 13 < 5 < 5 - < 5 < 5 < 5 -
Not provided - - < 5 < 5 - < 5 - < 5 - 61 - < 5 < 5 13
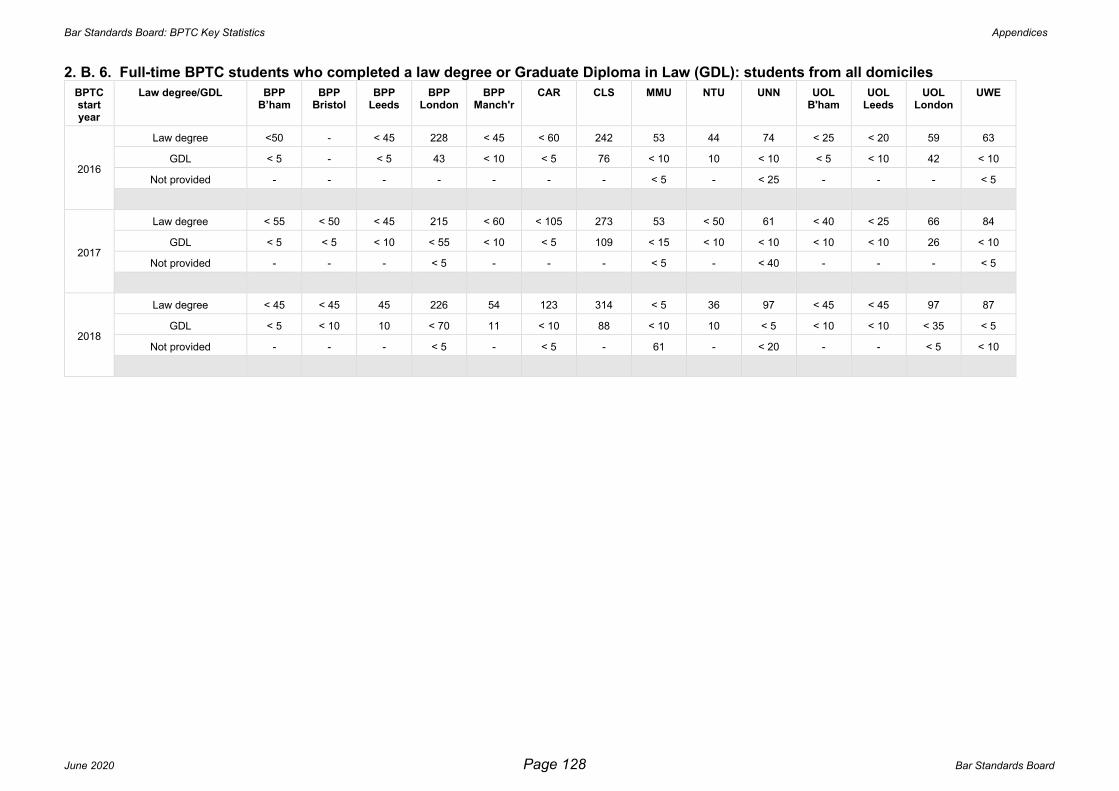
Bar Standards Board: BPTC Key Statistics Appendices
June 2020 Page 128 Bar Standards Board
2. B. 6. Full-time BPTC students who completed a law degree or Graduate Diploma in Law (GDL): students from all domiciles
BPTC start year
Law degree/GDL BPP B’ham
BPP Bristol
BPP Leeds
BPP London
BPP Manch'r
CAR CLS MMU NTU UNN UOL B'ham
UOL Leeds
UOL London
UWE
2016
Law degree <50 - < 45 228 < 45 < 60 242 53 44 74 < 25 < 20 59 63
GDL < 5 - < 5 43 < 10 < 5 76 < 10 10 < 10 < 5 < 10 42 < 10
Not provided - - - - - - - < 5 - < 25 - - - < 5
2017
Law degree < 55 < 50 < 45 215 < 60 < 105 273 53 < 50 61 < 40 < 25 66 84
GDL < 5 < 5 < 10 < 55 < 10 < 5 109 < 15 < 10 < 10 < 10 < 10 26 < 10
Not provided - - - < 5 - - - < 5 - < 40 - - - < 5
2018
Law degree < 45 < 45 45 226 54 123 314 < 5 36 97 < 45 < 45 97 87
GDL < 5 < 10 10 < 70 11 < 10 88 < 10 10 < 5 < 10 < 10 < 35 < 5
Not provided - - - < 5 - < 5 - 61 - < 20 - - < 5 < 10

Bar Standards Board: BPTC Key Statistics Appendices
June 2020 Page 129 Bar Standards Board
2. B. 7. Ethnicity of full-time BPTC students: students from all domiciles – 2016-2018 aggregated
Domicile Ethnicity BPP B’ham
BPP Bristol
BPP Leeds
BPP Londo
n
BPP Manch'
r
CAR CLS MMU NTU UNN UOL B'ham
UOL Leeds
UOL Londo
n
UWE
UK/EU
White 22 16 42 296 91 19 324 39 55 67 49 53 156 44
Asian/Asian British < 20 13 11 97 14 13 90 18 20 < 10 21 17 25 15
Black/Black British < 20 < 5 < 5 50 < 5 - 39 < 10 < 10 < 5 < 10 < 5 27 < 10
Mixed/Multiple ethnic groups < 5 < 5 < 5 35 < 10 < 5 28 < 10 < 5 < 10 < 10 < 10 27 < 5
Other ethnic group - < 5 < 5 13 - < 5 < 10 - < 5 - - - < 10 < 5
Not provided - - < 10 16 10 37 < 20 < 5 < 5 < 5 < 5 < 5 < 10 -
Overseas
White < 5 < 5 - 30 < 5 < 5 21 < 5 < 5 < 5 < 5 < 5 < 5 < 5
Asian/Asian British 61 53 62 236 47 117 515 105 60 212 18 < 10 54 154
Black/Black British 10 < 5 < 5 27 < 5 < 5 24 < 10 < 10 < 10 12 < 5 < 5 < 10
Mixed/Multiple ethnic groups < 10 < 10 < 10 15 < 5 < 5 17 < 5 - < 5 - < 5 < 5 19
Other ethnic group < 5 < 5 < 5 < 10 < 5 < 5 < 15 < 5 < 5 11 - < 5 < 5 < 5
Not provided < 10 < 5 < 10 < 10 < 10 100 < 10 < 5 - - < 5 - < 10 < 5
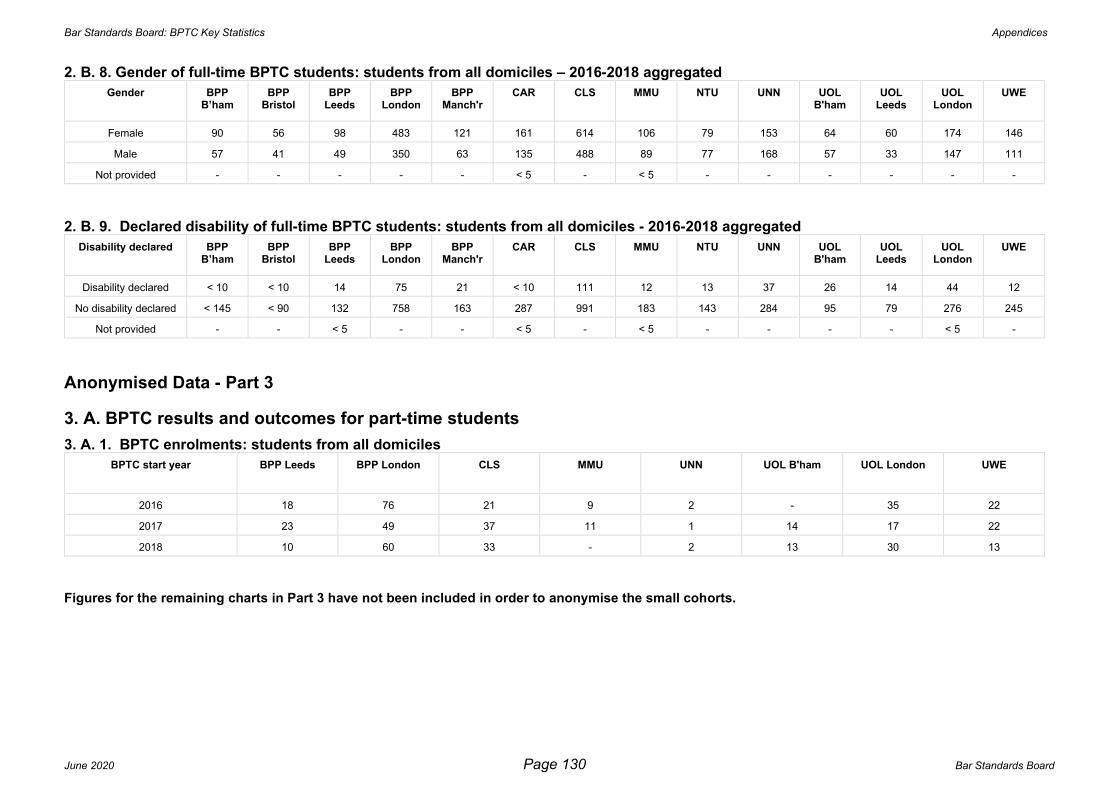
Bar Standards Board: BPTC Key Statistics Appendices
June 2020 Page 130 Bar Standards Board
2. B. 8. Gender of full-time BPTC students: students from all domiciles – 2016-2018 aggregated
Gender BPP B’ham
BPP Bristol
BPP Leeds
BPP London
BPP Manch'r
CAR CLS MMU NTU UNN UOL B'ham
UOL Leeds
UOL London
UWE
Female 90 56 98 483 121 161 614 106 79 153 64 60 174 146
Male 57 41 49 350 63 135 488 89 77 168 57 33 147 111
Not provided - - - - - < 5 - < 5 - - - - - -
2. B. 9. Declared disability of full-time BPTC students: students from all domiciles - 2016-2018 aggregated
Disability declared BPP B’ham
BPP Bristol
BPP Leeds
BPP London
BPP Manch'r
CAR CLS MMU NTU UNN UOL B'ham
UOL Leeds
UOL London
UWE
Disability declared < 10 < 10 14 75 21 < 10 111 12 13 37 26 14 44 12
No disability declared < 145 < 90 132 758 163 287 991 183 143 284 95 79 276 245
Not provided - - < 5 - - < 5 - < 5 - - - - < 5 -
Anonymised Data - Part 3
3. A. BPTC results and outcomes for part-time students
3. A. 1. BPTC enrolments: students from all domiciles
BPTC start year BPP Leeds BPP London CLS MMU UNN UOL B'ham UOL London UWE
2016 18 76 21 9 2 - 35 22
2017 23 49 37 11 1 14 17 22
2018 10 60 33 - 2 13 30 13
Figures for the remaining charts in Part 3 have not been included in order to anonymise the small cohorts.
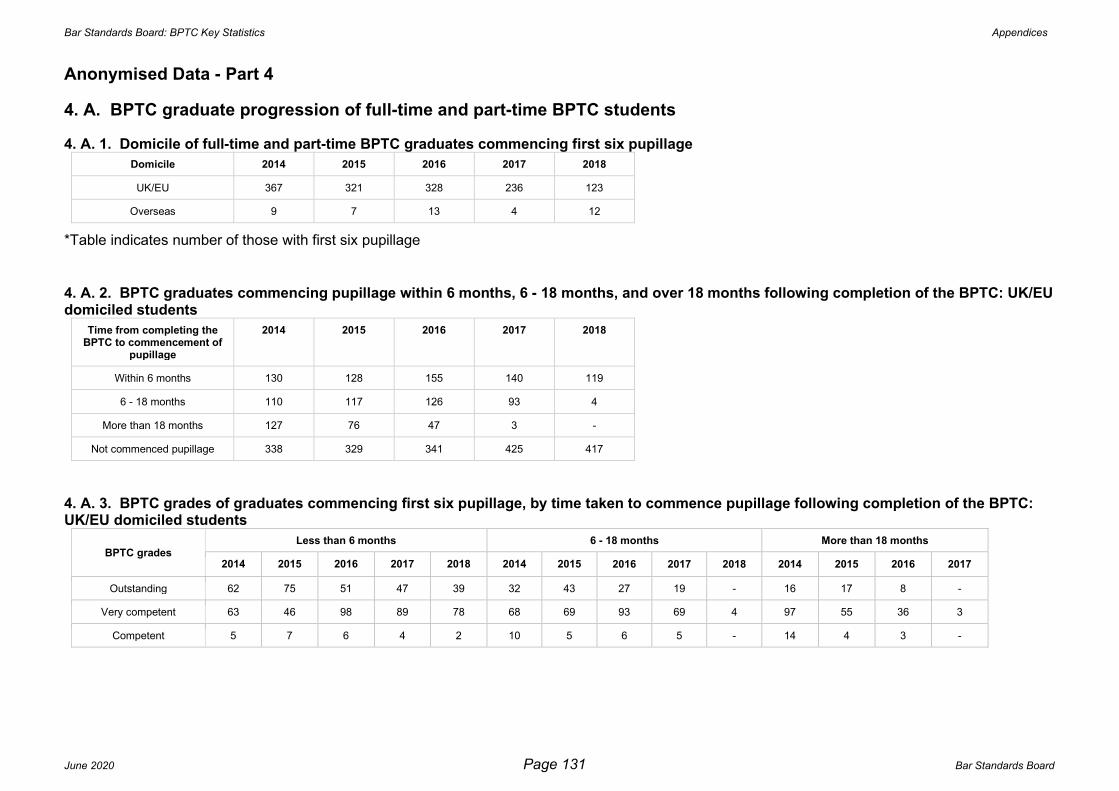
Bar Standards Board: BPTC Key Statistics Appendices
June 2020 Page 131 Bar Standards Board
Anonymised Data - Part 4
4. A. BPTC graduate progression of full-time and part-time BPTC students
4. A. 1. Domicile of full-time and part-time BPTC graduates commencing first six pupillage
Domicile 2014 2015 2016 2017 2018
UK/EU 367 321 328 236 123
Overseas 9 7 13 4 12
*Table indicates number of those with first six pupillage
4. A. 2. BPTC graduates commencing pupillage within 6 months, 6 - 18 months, and over 18 months following completion of the BPTC: UK/EU domiciled students
Time from completing the BPTC to commencement of
pupillage
2014 2015 2016 2017 2018
Within 6 months 130 128 155 140 119
6 - 18 months 110 117 126 93 4
More than 18 months 127 76 47 3 -
Not commenced pupillage 338 329 341 425 417
4. A. 3. BPTC grades of graduates commencing first six pupillage, by time taken to commence pupillage following completion of the BPTC: UK/EU domiciled students
BPTC grades Less than 6 months 6 - 18 months More than 18 months
2014 2015 2016 2017 2018 2014 2015 2016 2017 2018 2014 2015 2016 2017
Outstanding 62 75 51 47 39 32 43 27 19 - 16 17 8 -
Very competent 63 46 98 89 78 68 69 93 69 4 97 55 36 3
Competent 5 7 6 4 2 10 5 6 5 - 14 4 3 -

Bar Standards Board: BPTC Key Statistics Appendices
June 2020 Page 132 Bar Standards Board
4. A. 4. Pupillage rate of BPTC graduates, by part-time and full-time mode of study: UK/EU domiciled students
4. A. 5. First degree classification and BPTC grade of full-time and part-time BPTC graduates commencing first six pupillage: UK/EU domiciled students - number of those with pupillage
Student status
First degree classification
2014 2015 2016 2017 2018
Outstanding
Very compet
ent
Competent
Outstanding
Very compe
tent
Competent
Outstanding
Very compe
tent
Competent
Outstanding
Very compe
tent
Competent
Outstanding
Very compe
tent
Competent
Those with pupillage
First class 62 80 5 71 66 1 46 98 2 42 79 2 26 36 -
Upper second class 43 135 21 54 88 8 37 116 9 16 73 7 10 39 1
Lower second class 3 8 1 1 5 6 - 6 4 2 4 - - 1 -
Other - - 1 2 3 - 2 6 - 4 3 - 2 5 1
Not provided 2 5 1 7 8 1 1 1 - 2 2 - 1 1 -
Total number of graduates
First class 68 120 18 76 108 12 50 151 13 53 166 17 44 150 12
Upper second class 48 259 94 62 212 70 46 226 81 27 234 83 20 211 51
Lower second class 4 29 30 1 29 27 - 25 34 3 17 17 - 8 8
Other - 6 5 2 10 5 2 13 4 5 17 4 3 12 5
Not provided 3 14 7 7 20 9 1 18 5 3 11 4 2 12 2
BPTC start year Study Mode
Year of graduation (based upon course timespan)
Number of BPTC graduates
Number with first six pupillage
2015 Full-time Completing BPTC in 2016 540 296
2014 Part-time 116 41
2016 Full-time Completing BPTC in 2017 550 295
2015 Part-time 110 25
2017 Full-time Completing BPTC in 2018 571 221
2016 Part-time 119 33
2018 Full-time Completing BPTC in 2019 540 123
2017 Part-time 90 15
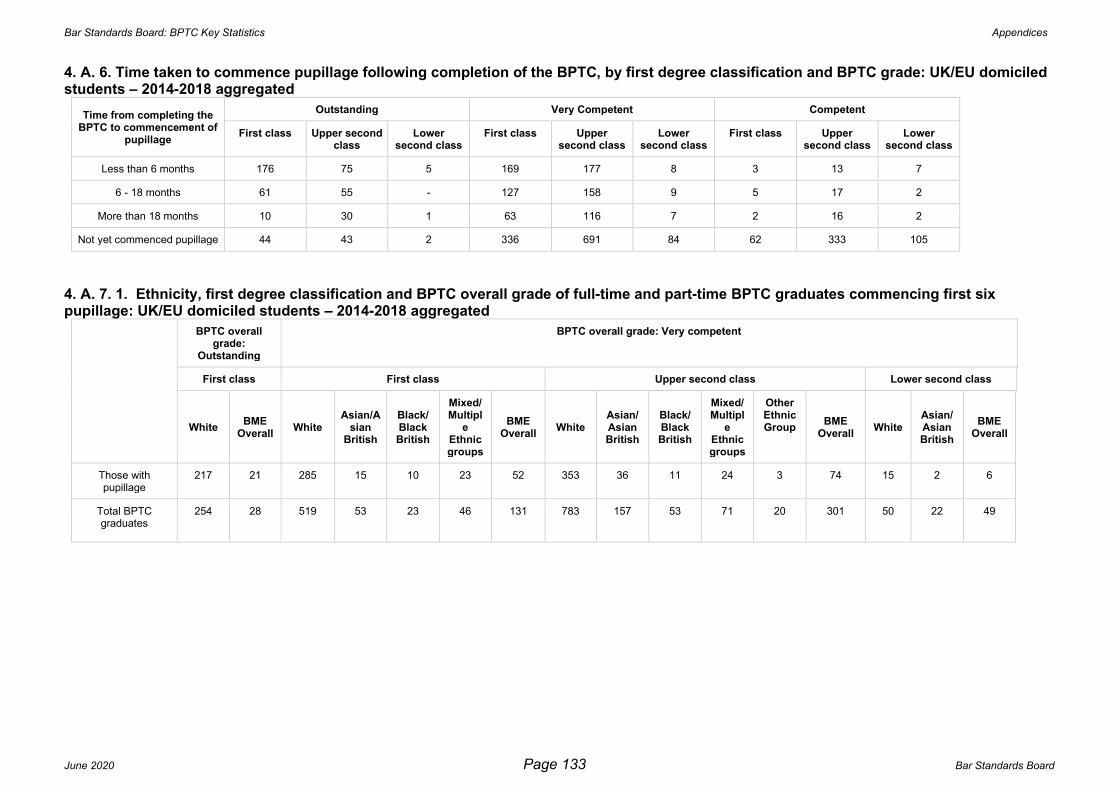
Bar Standards Board: BPTC Key Statistics Appendices
June 2020 Page 133 Bar Standards Board
4. A. 6. Time taken to commence pupillage following completion of the BPTC, by first degree classification and BPTC grade: UK/EU domiciled students – 2014-2018 aggregated
Time from completing the BPTC to commencement of
pupillage
Outstanding Very Competent Competent
First class Upper second class
Lower second class
First class Upper second class
Lower second class
First class Upper second class
Lower second class
Less than 6 months 176 75 5 169 177 8 3 13 7
6 - 18 months 61 55 - 127 158 9 5 17 2
More than 18 months 10 30 1 63 116 7 2 16 2
Not yet commenced pupillage 44 43 2 336 691 84 62 333 105
4. A. 7. 1. Ethnicity, first degree classification and BPTC overall grade of full-time and part-time BPTC graduates commencing first six pupillage: UK/EU domiciled students – 2014-2018 aggregated
BPTC overall grade:
Outstanding
BPTC overall grade: Very competent
First class First class Upper second class Lower second class
White BME
Overall White
Asian/Asian
British
Black/Black British
Mixed/Multipl
e Ethnic groups
BME Overall
White Asian/Asian British
Black/Black British
Mixed/Multipl
e Ethnic groups
Other Ethnic Group
BME Overall
White Asian/Asian British
BME Overall
Those with pupillage
217 21 285 15 10 23 52 353 36 11 24 3 74 15 2 6
Total BPTC graduates
254 28 519 53 23 46 131 783 157 53 71 20 301 50 22 49
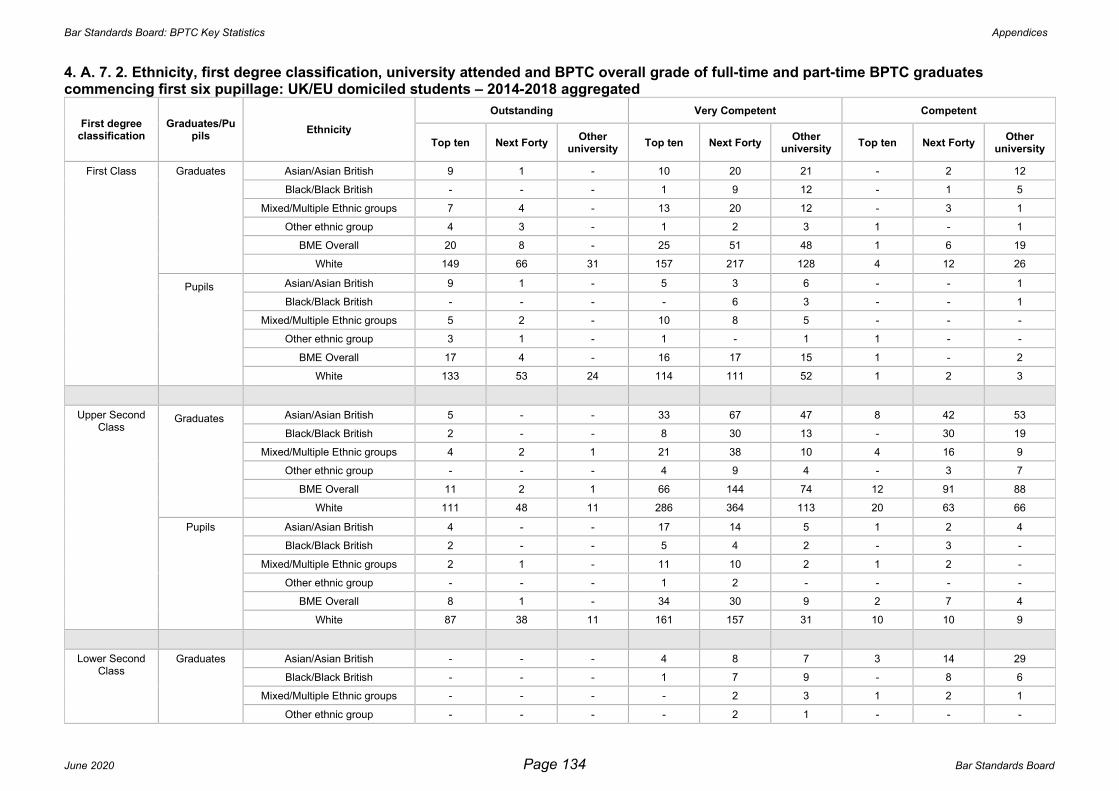
Bar Standards Board: BPTC Key Statistics Appendices
June 2020 Page 134 Bar Standards Board
4. A. 7. 2. Ethnicity, first degree classification, university attended and BPTC overall grade of full-time and part-time BPTC graduates commencing first six pupillage: UK/EU domiciled students – 2014-2018 aggregated
First degree classification
Graduates/Pupils
Ethnicity
Outstanding Very Competent Competent
Top ten Next Forty Other
university Top ten Next Forty
Other university
Top ten Next Forty Other
university
First Class Graduates Asian/Asian British 9 1 - 10 20 21 - 2 12
Black/Black British - - - 1 9 12 - 1 5
Mixed/Multiple Ethnic groups 7 4 - 13 20 12 - 3 1
Other ethnic group 4 3 - 1 2 3 1 - 1
BME Overall 20 8 - 25 51 48 1 6 19
White 149 66 31 157 217 128 4 12 26
Pupils Asian/Asian British 9 1 - 5 3 6 - - 1
Black/Black British - - - - 6 3 - - 1
Mixed/Multiple Ethnic groups 5 2 - 10 8 5 - - -
Other ethnic group 3 1 - 1 - 1 1 - -
BME Overall 17 4 - 16 17 15 1 - 2
White 133 53 24 114 111 52 1 2 3
Upper Second Class
Graduates Asian/Asian British 5 - - 33 67 47 8 42 53
Black/Black British 2 - - 8 30 13 - 30 19
Mixed/Multiple Ethnic groups 4 2 1 21 38 10 4 16 9
Other ethnic group - - - 4 9 4 - 3 7
BME Overall 11 2 1 66 144 74 12 91 88
White 111 48 11 286 364 113 20 63 66
Pupils Asian/Asian British 4 - - 17 14 5 1 2 4
Black/Black British 2 - - 5 4 2 - 3 -
Mixed/Multiple Ethnic groups 2 1 - 11 10 2 1 2 -
Other ethnic group - - - 1 2 - - - -
BME Overall 8 1 - 34 30 9 2 7 4
White 87 38 11 161 157 31 10 10 9
Lower Second Class
Graduates Asian/Asian British - - - 4 8 7 3 14 29
Black/Black British - - - 1 7 9 - 8 6
Mixed/Multiple Ethnic groups - - - - 2 3 1 2 1
Other ethnic group - - - - 2 1 - - -

Bar Standards Board: BPTC Key Statistics Appendices
June 2020 Page 135 Bar Standards Board
BME Overall - - - 5 19 20 4 24 36
White 1 3 4 9 23 18 4 11 19
Pupils
Asian/Asian British - - - 1 - 1 - 1 2
Black/Black British - - - 1 1 - - 1 -
Mixed/Multiple Ethnic groups - - - - 1 - - - -
Other ethnic group - - - - 1 - - - -
BME Overall - - - 2 3 1 - 2 2
White - 3 3 4 8 3 - 1 5
4. A. 8. Gender, first degree classification and BPTC overall grade of full-time and part-time BPTC graduates commencing first six pupillage: UK/EU domiciled students – 2014-2018 aggregated
First class Upper second class Lower second class
Outstanding Very competent Competent Outstanding Very competent Competent Very competent Competent
Female Male Female Male Female Male Female Male Female Male Female Male Female Male Female Male
Those with pupillage 109 138 177 182 6 4 78 82 270 180 30 16 14 9 3 8
Total BPTC graduates 131 160 360 335 43 29 94 109 658 483 247 132 65 42 55 60
4. A. 9. Disability status, first degree classification and BPTC overall grade of full-time and part-time BPTC graduates commencing first six pupillage: UK/EU domiciled students – 2014-2018 aggregated
First class Upper second class
Outstanding Very competent Competent Outstanding Very competent Competent
Disability declared
No disability declared
Disability declared
No disability declared
Disability declared
No disability declared
Disability declared
No disability declared
Disability declared
No disability declared
Disability declared
No disability declared
Those with pupillage 28 218 41 318 1 8 19 139 68 380 5 40
Total BPTC graduates 32 258 75 620 10 61 25 175 149 989 41 335

Bar Standards Board: BPTC Key Statistics Appendices
June 2020 Page 136 Bar Standards Board
4. A. 10. Ranking of first degree institution, first degree classification and BPTC overall grade of full-time and part-time BPTC graduates commencing first six pupillage: UK/EU domiciled students – 2014-2018 aggregated
First class Upper second class Lower Second Class
Outstanding Very competent Competent Outstanding Very competent Competent Very Competent
Competent
Top ten
Next forty
Other
university
Top ten
Next forty
Other
university
Top ten
Next forty
Other university
Top ten
Next forty
Other
university
Top ten
Next forty
Other
university
Top ten
Next forty
Other
university
Next forty
Other
university
Next forty
Other university
Those with pupillage
158 58 24 136 139 71 2 3 5 102 43 12 207 197 42 12 17 15 12 5 3 8
Total BPTC graduates
177 75 31 190 292 185 5 19 47 130 55 13 372 539 193 33 165 168 45 42 38 59
4. A. 11. Age at enrolment, first degree classification and BPTC overall grade of full-time and part-time BPTC graduates commencing first six pupillage: UK/EU domiciled students – 2014-2018 aggregated
First degree classification
Student status
Outstanding Very competent Competent
Under 25 25 – 34 35 and over
Under 25 25 – 34 35 and over
Under 25 25 – 34 35 and over
First class Those with pupillage 160 81 6 244 94 21 5 4 1
Total BPTC graduates 186 98 7 468 177 50 40 15 17
Upper second class
Those with pupillage 100 48 12 344 98 9 31 11 4
Total BPTC graduates 127 62 14 830 268 44 273 72 34
Lower second class
Those with pupillage 1 4 1 11 8 5 4 7 -
Total BPTC graduates 1 5 2 52 34 22 67 35 14
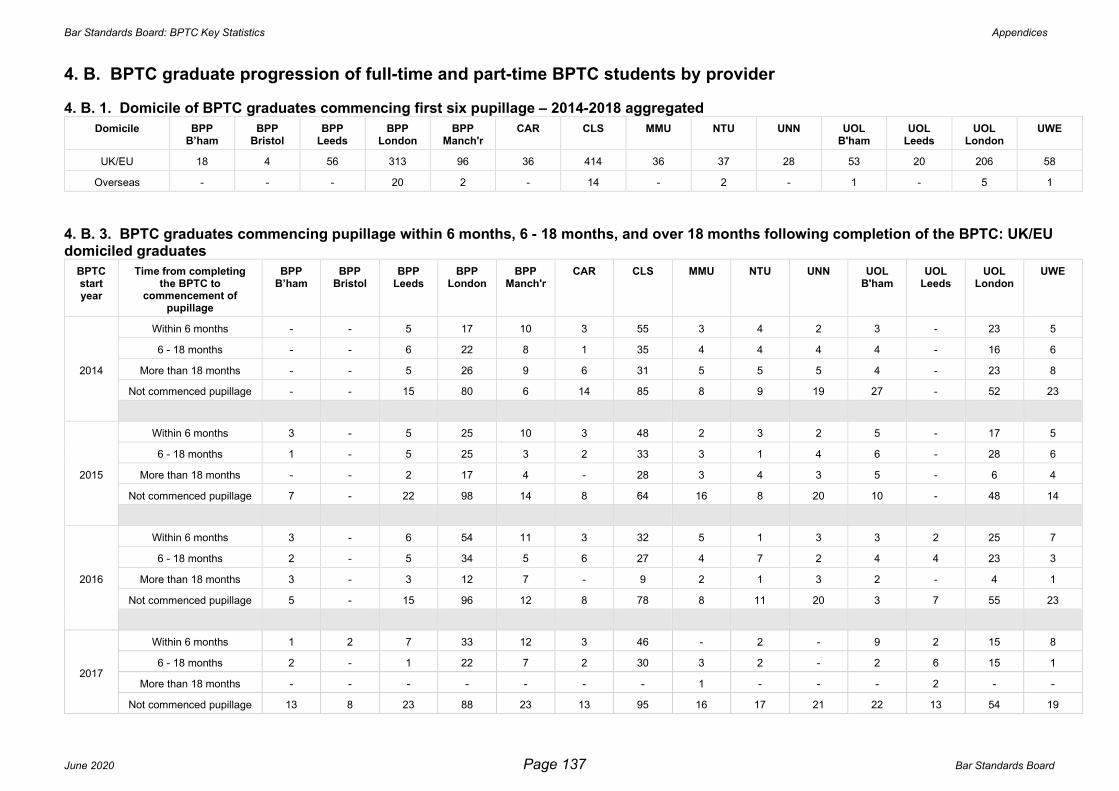
Bar Standards Board: BPTC Key Statistics Appendices
June 2020 Page 137 Bar Standards Board
4. B. BPTC graduate progression of full-time and part-time BPTC students by provider
4. B. 1. Domicile of BPTC graduates commencing first six pupillage – 2014-2018 aggregated
Domicile BPP B’ham
BPP Bristol
BPP Leeds
BPP London
BPP Manch'r
CAR CLS MMU NTU UNN UOL B'ham
UOL Leeds
UOL London
UWE
UK/EU 18 4 56 313 96 36 414 36 37 28 53 20 206 58
Overseas - - - 20 2 - 14 - 2 - 1 - 5 1
4. B. 3. BPTC graduates commencing pupillage within 6 months, 6 - 18 months, and over 18 months following completion of the BPTC: UK/EU domiciled graduates
BPTC start year
Time from completing the BPTC to
commencement of pupillage
BPP B’ham
BPP Bristol
BPP Leeds
BPP London
BPP Manch'r
CAR CLS MMU NTU UNN UOL B'ham
UOL Leeds
UOL London
UWE
2014
Within 6 months - - 5 17 10 3 55 3 4 2 3 - 23 5
6 - 18 months - - 6 22 8 1 35 4 4 4 4 - 16 6
More than 18 months - - 5 26 9 6 31 5 5 5 4 - 23 8
Not commenced pupillage - - 15 80 6 14 85 8 9 19 27 - 52 23
2015
Within 6 months 3 - 5 25 10 3 48 2 3 2 5 - 17 5
6 - 18 months 1 - 5 25 3 2 33 3 1 4 6 - 28 6
More than 18 months - - 2 17 4 - 28 3 4 3 5 - 6 4
Not commenced pupillage 7 - 22 98 14 8 64 16 8 20 10 - 48 14
2016
Within 6 months 3 - 6 54 11 3 32 5 1 3 3 2 25 7
6 - 18 months 2 - 5 34 5 6 27 4 7 2 4 4 23 3
More than 18 months 3 - 3 12 7 - 9 2 1 3 2 - 4 1
Not commenced pupillage 5 - 15 96 12 8 78 8 11 20 3 7 55 23
2017
Within 6 months 1 2 7 33 12 3 46 - 2 - 9 2 15 8
6 - 18 months 2 - 1 22 7 2 30 3 2 - 2 6 15 1
More than 18 months - - - - - - - 1 - - - 2 - -
Not commenced pupillage 13 8 23 88 23 13 95 16 17 21 22 13 54 19
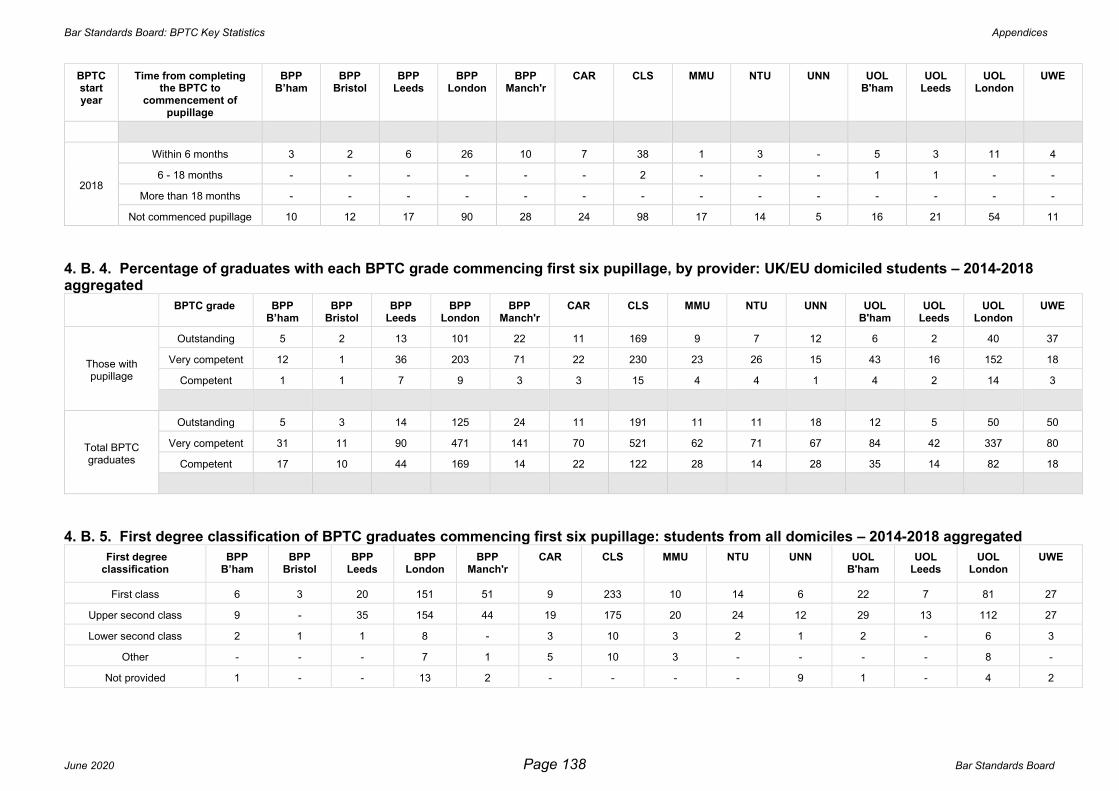
Bar Standards Board: BPTC Key Statistics Appendices
June 2020 Page 138 Bar Standards Board
BPTC start year
Time from completing the BPTC to
commencement of pupillage
BPP B’ham
BPP Bristol
BPP Leeds
BPP London
BPP Manch'r
CAR CLS MMU NTU UNN UOL B'ham
UOL Leeds
UOL London
UWE
2018
Within 6 months 3 2 6 26 10 7 38 1 3 - 5 3 11 4
6 - 18 months - - - - - - 2 - - - 1 1 - -
More than 18 months - - - - - - - - - - - - - -
Not commenced pupillage 10 12 17 90 28 24 98 17 14 5 16 21 54 11
4. B. 4. Percentage of graduates with each BPTC grade commencing first six pupillage, by provider: UK/EU domiciled students – 2014-2018 aggregated
BPTC grade BPP B’ham
BPP Bristol
BPP Leeds
BPP London
BPP Manch'r
CAR CLS MMU NTU UNN UOL B'ham
UOL Leeds
UOL London
UWE
Those with pupillage
Outstanding 5 2 13 101 22 11 169 9 7 12 6 2 40 37
Very competent 12 1 36 203 71 22 230 23 26 15 43 16 152 18
Competent 1 1 7 9 3 3 15 4 4 1 4 2 14 3
Total BPTC graduates
Outstanding 5 3 14 125 24 11 191 11 11 18 12 5 50 50
Very competent 31 11 90 471 141 70 521 62 71 67 84 42 337 80
Competent 17 10 44 169 14 22 122 28 14 28 35 14 82 18
4. B. 5. First degree classification of BPTC graduates commencing first six pupillage: students from all domiciles – 2014-2018 aggregated
First degree classification
BPP B’ham
BPP Bristol
BPP Leeds
BPP London
BPP Manch'r
CAR CLS MMU NTU UNN UOL B'ham
UOL Leeds
UOL London
UWE
First class 6 3 20 151 51 9 233 10 14 6 22 7 81 27
Upper second class 9 - 35 154 44 19 175 20 24 12 29 13 112 27
Lower second class 2 1 1 8 - 3 10 3 2 1 2 - 6 3
Other - - - 7 1 5 10 3 - - - - 8 -
Not provided 1 - - 13 2 - - - - 9 1 - 4 2

Bar Standards Board: BPTC Key Statistics Appendices
June 2020 Page 139 Bar Standards Board
Bar Standards Board 289 – 293 High Holborn LONDON