bracken: estimating species abundance in … departments of computer science and biostatistics, ......
TRANSCRIPT

Submitted 7 July 2016Accepted 28 November 2016Published 2 January 2017
Corresponding authorJennifer Lu, [email protected]
Academic editorJames Procter
Additional Information andDeclarations can be found onpage 13
DOI 10.7717/peerj-cs.104
Copyright2017 Lu et al.
Distributed underCreative Commons CC-BY 4.0
OPEN ACCESS
Bracken: estimating species abundance inmetagenomics dataJennifer Lu1,2, Florian P. Breitwieser2, Peter Thielen3 and Steven L. Salzberg1,2,4
1Department of Biomedical Engineering, Johns Hopkins University, Baltimore, MD, United States2Center for Computational Biology, McKusick-Nathans Institute of Genetic Medicine, Johns Hopkins Schoolof Medicine, Baltimore, MD, United States
3Applied Physics Laboratory, Johns Hopkins University, Laurel, MD, United States4Departments of Computer Science and Biostatistics, Johns Hopkins University, Baltimore, MD, United States
ABSTRACTMetagenomic experiments attempt to characterize microbial communities usinghigh-throughput DNA sequencing. Identification of the microorganisms in a sampleprovides information about the genetic profile, population structure, and role ofmicroorganisms within an environment. Until recently, most metagenomics studiesfocused on high-level characterization at the level of phyla, or alternatively sequencedthe 16S ribosomal RNAgene that is present in bacterial species. As the cost of sequencinghas fallen, though,metagenomics experiments have increasingly used unbiased shotgunsequencing to capture all the organisms in a sample. This approach requires a methodfor estimating abundance directly from the raw read data. Here we describe a fast,accurate new method that computes the abundance at the species level using thereads collected in a metagenomics experiment. Bracken (Bayesian Reestimation ofAbundance after Classification with KrakEN) uses the taxonomic assignments madeby Kraken, a very fast read-level classifier, along with information about the genomesthemselves to estimate abundance at the species level, the genus level, or above. Wedemonstrate that Bracken can produce accurate species- and genus-level abundanceestimates even when a sample contains multiple near-identical species.
Subjects Bioinformatics, Computational BiologyKeywords Metagenomics, Species abundance, Microbiome, Bayesian estimation
INTRODUCTIONMetagenomics is a rapidly growing field of study, driven in part by our ability to generateenormous amounts of DNA sequence rapidly and inexpensively. Since the human genomewas first published in 2001 (The International Human Genome Sequencing Consortium,2001; Venter et al., 2001), sequencing technology has become approximately one milliontimes faster and cheaper,making it possible for individual labs to generate asmuch sequencedata as the entire HumanGenome Project in just a few days. In the context ofmetagenomicsexperiments, this makes it possible to sample a complex mixture of microbes by ‘‘shotgun’’sequencing, which involves simply isolating DNA, preparing the DNA for sequencing, andsequencing the mixture as deeply as possible. Shotgun sequencing is relatively unbiasedcompared to targeted sequencing methods (Venter et al., 2004), including widely-used 16Sribosomal RNA sequencing, and it has the additional advantage that it captures any species
How to cite this article Lu et al. (2017), Bracken: estimating species abundance in metagenomics data. PeerJ Comput. Sci. 3:e104; DOI10.7717/peerj-cs.104

with a DNA-based genome, including eukaryotes that lack a 16S rRNA gene. Because it isunbiased, shotgun sequencing can also be used to estimate the abundance of each taxon(species, genus, phylum, etc.) in the original sample, by counting the number of readsbelonging to each taxon.
Along with the technological advances, the number of finished and draft genomes hasalso grown exponentially over the past decade. At present there are thousands of completebacterial genomes, 20,000 draft bacterial genomes, and 80,000 full or partial virus genomesin the public GenBank archive (Benson et al., 2015). This rich resource of sequencedgenomes now makes it possible to sequence uncultured, unprocessed microbial DNA fromalmost any environment, ranging from soil to the deep ocean to the human body, and usecomputational sequence comparisons to identify many of the formerly hidden species inthese environments (Riesenfeld, Schloss & Handelsman, 2004). Several accurate methodshave appeared that can align a sequence ‘‘read’’ to a database of microbial genomes rapidlyand accurately (see below), but this step alone is not sufficient to estimate how much of aspecies is present. Complications arise when closely related species are present in the samesample–a situation that arises quite frequently–because many reads align equally well tomore than one species. This requires a separate abundance estimation algorithm to resolve.In this paper, we describe a new method, Bracken, that goes beyond simply classifyingindividual reads and computes the abundance of species, genera, or other taxonomiccategories from the DNA sequences collected in a metagenomics experiment.
When it was first published in 2014, the Kraken metagenomics classifier representeda major enhancement in the speed with which large metagenomics sequence data couldbe processed (Wood & Salzberg, 2014), running over 900 times faster than MegaBlast(Morgulis et al., 2008), the closest competitor at the time. Kraken’s success and accuracyrely on its use of a very large, efficient index of short sequences of length k, which it buildsinto a specialized database. If k is chosen appropriately, then most sequences of length k inthe database will be unique to a single species, and many will also be unique to a particularstrain or genome. Larger values of k will yield a database in which even more of eachgenome is uniquely covered by k-mers; obviously, though, k should not be longer than thelength of a sequencing read, and metagenomics projects currently generate reads as shortas 75–100 base pairs (bp). Longer k-mers are also more likely to contain errors, meaningthat more reads will be left unclassified if k is too long. Smaller k-mers, in contrast, willyield higher sensitivity because the minimum match length is shorter.
When used to identify the taxonomic label of metagenomics sequences, the Krakensystem for classification of metagenomics sequences is extremely fast and accurate (Wood& Salzberg, 2014). When classifying raw sequence reads, though, many reads correspondto identical regions between two or more genomes. (The number of such ambiguous readsdecreases as reads get longer.) Kraken solves this problem by labeling the sequence withthe lowest common ancestor (LCA) of all species that share that sequence, as discussedfurther below.
Lu et al. (2017), PeerJ Comput. Sci., DOI 10.7717/peerj-cs.104 2/17
Ambiguity among microbial species and strainsAs the database of bacterial genomes has grown, an increasing number of genomes sharelarge portions of their sequence with other genomes. In many cases, these genomes arenearly identical; indeed, sequencing has revealed to scientists that many formerly distinctspecies and genera are far closer than were known prior to sequencing. Many species havebeen renamed as a result, in a process that is continual and ongoing, but many other specieshave retained their old names, often for historical or other reasons.
For example, the speciesMycobacterium bovis is over 99.95% identical toMycobacteriumtuberculosis (Garnier et al., 2003), and many cases of human tuberculosis are caused byM. bovis (which also infects cows) rather than M. tuberculosis (Grange, 2001). Their highsequence identity indicates that they should be considered as two strains of a single species,but they retain different species names. As a compromise, taxonomists have created thecategory Mycobacterium tuberculosis complex (Brosch et al., 2002) to represent a collectionof taxa that now includes more than 100 strains of five different species. This category sitsabove the species level but below the genus level in the current microbial taxonomy, but itcan best be described as a species.
Other examples are numerous and still growing. The three species Bacillus anthracis (thecausative agent of anthrax), Bacillus cereus, and Bacillus thuringiensis are well over 99%identical and should all be designated as a single species (Helgason et al., 2000), althoughtheir names have not been changed despite their near-identity revealed by sequencing. Asa compromise, taxonomists created the category Bacillus cereus group, between the level ofspecies and genus, to include these three species and at least five others (Liu et al., 2015), allof which are extremely similar to one another. In some cases, two organisms that should becalled the same species may even have different genus names. For example, Escherichia coliand Shigella flexneri are classified in different genera, but we know from sequence analysisthat they represent the same species (Lan & Reeves, 2002).
Failure to recognize the mutability of the bacterial taxonomy can lead to erroneousconclusions about the performance of metagenomic classifiers. For example, one recentstudy (Peabody et al., 2015) created a mock community of 11 species, one of which wasAnabaena variabilis ATCC 29413, not realizing that this genome had been renamed andwas synonymous with species in the genus Nostoc (Thiel et al., 2014). When Anabaena wasremoved from the database, Kraken correctly identified the reads as Nostoc, but Peabodyet al. erroneously considered all these reads to be misclassified.
Classification versus abundance estimationKraken attempts to assign a taxonomy label to every read in a metagenomics sample usinga custom-built database that may contain any species the user chooses. Among the currentset of finished bacterial and archaeal genomes, hundreds of species can be found forwhich large fractions of their sequence are identical to other genomes belonging to distinctstrains, species, or even genera. The reads arising from common regions in these speciesresult in a tie when analyzed with Kraken’s classification algorithm, so Kraken correctlyreports only the lowest common ancestor (LCA) (Wood & Salzberg, 2014). It follows thatfor well-populated clades with low genome diversity, Kraken only reports species-level
Lu et al. (2017), PeerJ Comput. Sci., DOI 10.7717/peerj-cs.104 3/17

assignments for reads from unique regions, and a true indication of total abundance canonly be made by taking both species and genus (or higher) level assignments into account.This implies that for some species, the majority of reads might be classified at a higherlevel of the taxonomy. Kraken thus leaves many reads ‘‘stranded’’ above the species level,meaning that the number of reads classified directly to a species may be far lower than theactual number present.
Therefore, any assumption that Kraken’s raw read assignments can be directly translatedinto species- or strain-level abundance estimates (e.g., Schaeffer et al., 2015) is flawed, asignoring reads at higher levels of the taxonomy will grossly underestimate some species,and creates the erroneous impression that Kraken’s assignments themselves were incorrect.
Nonetheless, metagenomics analysis often involves estimating the abundance of thespecies in a particular sample. Although we cannot unambiguously assign each read toa species, we would like to estimate how much of each species is present, specifically byestimating the number or percentage of reads in the sample. Several software tools havebeen developed to estimate species abundances in metagenomics samples [MetaPhlAn,ConStrains, GAAS, GASiC, TAEC, GRAMMy] (Angly et al., 2009; Lindner & Renard, 2012;Luo et al., 2015; Segata et al., 2012; Sohn et al., 2014; Xia et al., 2011). These tools, however,employ different strategies for read-level classification which are not always as accurateand efficient as Kraken’s k-mer approach (Lindgreen, Adair & Gardner, 2016). Rather thanre-engineer Kraken to address the ambiguous read classification issue and to provideabundance estimates directly, we decided to implement the new species-level abundanceestimation method described here as a separate program. This preserves both backwardscompatibility for existing Kraken users, and offers the ability to generate more accuratespecies abundance estimates for datasets already processed by Kraken. Note that if Krakenfails to identify a species (e.g., if the species was missing from the Kraken database), Brackentoo will not identify that species.
MATERIALS AND METHODSOur new method, Bracken (Bayesian Reestimation of Abundance after Classification withKrakEN), estimates species abundances in metagenomics samples by probabilisticallyre-distributing reads in the taxonomic tree. Reads assigned to nodes above the specieslevel are distributed down to the species nodes, while reads assigned at the strain level arere-distributed upward to their parent species. For example, in Fig. 1 we would distributereads assigned to the Mycobacteriaceae family and the Mycobacterium genus down to M.marinum andM. avium, and reads assigned to eachM. marinum strain would be reassignedto the M. marinum species. As we show below, Bracken can easily reestimate abundancesat other taxonomic levels (e.g., genus or phylum) using the same algorithm.
In order to re-assign reads classified at higher-level nodes in the taxonomy, we needto compute a probabilistic estimate of the number of reads that should be distributed tothe species below that node. To illustrate using the nodes in Fig. 1, we need to allocateall reads assigned to Mycobacterium (G1) to M. marinum (S1) and M. avium (S2) below
Lu et al. (2017), PeerJ Comput. Sci., DOI 10.7717/peerj-cs.104 4/17
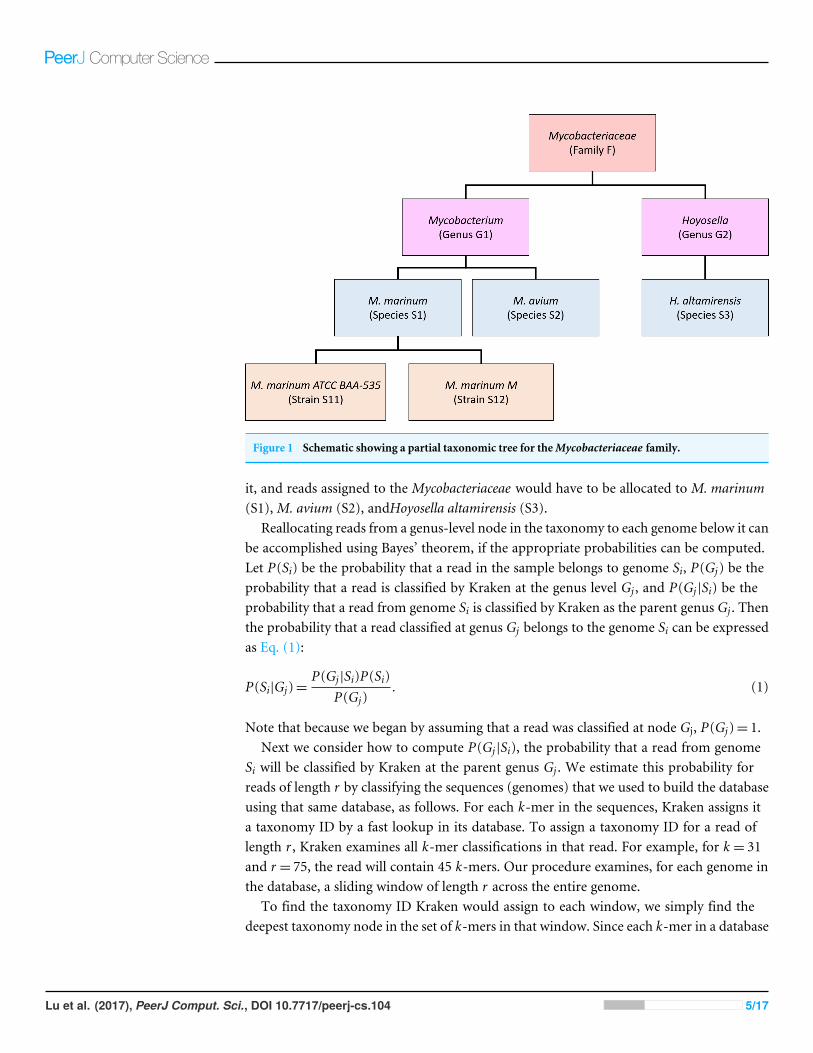
Figure 1 Schematic showing a partial taxonomic tree for theMycobacteriaceae family.
it, and reads assigned to the Mycobacteriaceae would have to be allocated to M. marinum(S1),M. avium (S2), andHoyosella altamirensis (S3).
Reallocating reads from a genus-level node in the taxonomy to each genome below it canbe accomplished using Bayes’ theorem, if the appropriate probabilities can be computed.Let P(Si) be the probability that a read in the sample belongs to genome Si, P(Gj) be theprobability that a read is classified by Kraken at the genus level Gj , and P(Gj |Si) be theprobability that a read from genome Si is classified by Kraken as the parent genus Gj . Thenthe probability that a read classified at genus Gj belongs to the genome Si can be expressedas Eq. (1):
P(Si|Gj)=P(Gj |Si)P(Si)
P(Gj). (1)
Note that because we began by assuming that a read was classified at node Gj, P(Gj)= 1.Next we consider how to compute P(Gj |Si), the probability that a read from genome
Si will be classified by Kraken at the parent genus Gj . We estimate this probability forreads of length r by classifying the sequences (genomes) that we used to build the databaseusing that same database, as follows. For each k-mer in the sequences, Kraken assigns ita taxonomy ID by a fast lookup in its database. To assign a taxonomy ID for a read oflength r , Kraken examines all k-mer classifications in that read. For example, for k = 31and r = 75, the read will contain 45 k-mers. Our procedure examines, for each genome inthe database, a sliding window of length r across the entire genome.
To find the taxonomy ID Kraken would assign to each window, we simply find thedeepest taxonomy node in the set of k-mers in that window. Since each k-mer in a database
Lu et al. (2017), PeerJ Comput. Sci., DOI 10.7717/peerj-cs.104 5/17
sequence is assigned to a taxonomy ID somewhere along the path from the genome’staxonomy ID to the root, the highest-weighted root-to-leaf path (and thus the Krakenclassification) corresponds to the deepest node.
For each genome Si of length Li we thus generate (Li− r+1) mappings to taxonomicalIDs. For node Gj , we then count the number of reads from Si that are assigned to it,NGj (Si).P(Gj |Si) is then the proportion of reads from Si that were assigned to the genus node Gj ;i.e., P(Gj |Si)=NGj(Si)/(Li− r+1). We also calculate the proportion of reads from Si thatwere assigned to every node from genome Si to the root node of the taxonomy tree.
The final term that we must calculate from Eq. (1) is P(Si), the probability that a read inthe sample belongs to genome Si, which is computed in relation to other genomes from thesame genus. For example, if the sample contains three genomes in the same genus, and if30% of all reads from those three genomes belong to Si, then P(Si)= 0.3. We estimate thisprobability using the reads that are uniquely assigned by Kraken to genome Si, as follows.
If we let USi be the proportion of genome Si that is unique, then
USi =NSi
Li− r+1(2)
where NSi is the number of k-mers of length r that are uniquely assigned to genome Si byKraken, and Li is the genome length. For example, if Li= 1 Mbp and only 250,000 k-mersare unique to genome Si, then USi= 0.25.
Then, using the number of reads KSi from a sample that Kraken actually assigns to Si,we can estimate the number of reads that likely derive from Si as:
K̂Si =K Si
U Si. (3)
For example, if Kraken classifies 1,000 reads as genome Si and 25% of the reads from Si areunique, then we would estimate that 4,000 reads (1,000/0.25) from Si are contained in thesample.
If genus Gj contains n genomes, we estimate the number of reads K̂S for each of the ngenomes and then calculate P(Si) by:
P (Si)=K̂Si∑na=1 K̂Sa
. (4)
Using this result in Eq. (1) above allows us to compute P(Si|Gj) for each genome Si. Eachprobability P(Si|Gj) is then used to estimate the proportion of the reads assigned to genusGj that belong to each of the genomes below it.
These calculations are repeated for each taxonomic level above the genus level (family,class, etc.), with read distribution at each level going to all genomes classified within thattaxonomic subtree.
To compute species abundance, any genome-level (strain-level) reads are simply addedtogether at the species level. In cases where only one genome from a given species is detectedby Kraken in the dataset, we simply add the reads distributed downward from the genuslevel (and above) to the reads already assigned by Kraken to the species level. In cases
Lu et al. (2017), PeerJ Comput. Sci., DOI 10.7717/peerj-cs.104 6/17

where multiple genomes exist for a given species, the reads distributed to each genome arecombined and added to the Kraken-assigned species level reads. The added reads give thefinal species-level abundance estimates.
This method can also estimate abundance for other taxonomic levels. In such cases,only higher nodes within the taxonomy tree undergo read distribution. After distributingreads downward, we estimate abundance for a node at the level specified by combining thedistributed reads across all genomes within that node’s subtree.
Software and data availabilityBracken is written in Perl and Python and is freely available for download at http://ccb.jhu.edu/software/bracken/. The reads from the skin microbiome experiment arefreely available from NCBI under BioProject PRJNA316735.
RESULTS AND DISCUSSIONWe applied the statistical re-assignment method described here to create species-levelabundance estimates for several metagenomics data sets. The overall procedure works asfollows. First, we compute a set of probabilities from the Kraken database by computing,for every sequence of length R in every genome, where it will be assigned in the taxonomy(see ‘Methods’). For our experiments, we set R= 75 as our datasets contain 75-bp reads.Bracken can use these probabilities for any metagenomics data set, including data withdifferent read lengths, although the estimates might be slightly improved by re-computingwith a read length that matches the experimental data.
Second, we run Kraken on the dataset to produce read-level taxonomic classifications.We then apply our abundance estimator, Bracken, which uses the numbers of reads assignedby Kraken at every level of the taxonomy to estimate the abundances at a single level (e.g.,species). Note that to exclude false positives, Bracken ignores species with counts below auser-adjustable threshold. In our experiments, we selected a threshold of 10 reads.
Experiments on a 100-genome metagenomics data setFor our first experiments, we used a data set containing simulated Illumina reads from100 genomes. This data, which we call here the i100 dataset, was used previously in acomparison of metagenomic assembly algorithms (Mende et al., 2012). The data contains53.3 million paired reads (26.7M pairs) from 100 genomes representing 85 species.The reads have error profiles based on quality values found in real Illumina reads(Mende et al., 2012). The i100 dataset includes several very challenging genomes forthis task, including multiple strains and species in the genera Bacillus and Mycobacteria,some of which are nearly identical to one another. The i100 data are freely available athttp://www.bork.embl.de/~mende/simulated_data.
The difficulty of estimating species abundance increases as the database itself containsmore species. For example, it would clearly be easier to estimate abundances in the i100dataset if we used a Kraken database containing only the 100 genomes in that dataset. Tomake the problemmore realistic, we built two different databases and estimated abundanceusing both. The first (‘‘small’’) database contains 693 genomes including the i100 genomes;
Lu et al. (2017), PeerJ Comput. Sci., DOI 10.7717/peerj-cs.104 7/17

Figure 2 Estimates of species abundance in the i100 metagenomics dataset computed by Kraken (blue) and Bracken (blue+ orange). For thisresult, the Kraken database contained 693 genomes that included the i100 genomes. The smaller graph displays results for the subset of species forwhich Bracken made the largest adjustments. The black line shows the true number of reads from each species. Precise numbers for the Kraken clas-sification, true read counts, and Bracken estimates are contained in Table S2A.
this is the full database from the simulation study byMende et al. (2012). The results whenusing the small database for classification are shown in Fig. 2. For several species, the initialKraken numbers (reads assigned to a particular species) are far too low, because many ofthe reads (for some genomes, a large majority) were assigned labels at the genus level orabove. After reestimation with Bracken, these reads were redistributed to the species level,with the result that almost all the abundance estimates were 98–99% correct, as shown inthe figure.
The second (‘‘large’’) database contains all genomes used in the synthetic and spike-inexperiments, as well as a broad background of bacterial genomes. In particular, it includesall complete bacterial and archaeal genomes from RefSeq as of 25 July 2014 (archived atftp://ftp.ncbi.nlm.nih.gov/genomes/archive/old_refseq), which total 2596 distinct taxa,plus those i100 genomes that were not present in the RefSeq data. (We excluded draftgenomes because they often contain vector sequences or other contaminants.) We alsoadded the nine genomes used in our skin bacteria spike-in experiment (described below)resulting in a total of 2635 distinct taxa. The complete list of sequences in the large databasecan be found in Table S1. The resulting Kraken database has a size of 74 GB.
Lu et al. (2017), PeerJ Comput. Sci., DOI 10.7717/peerj-cs.104 8/17

Figure 3 Estimates of species abundance computed by Kraken (blue) and Bracken (blue+ orange) for the i100 metagenomics data. For this re-sult, the Kraken database contained 2,635 distinct bacterial and archaeal taxa. The black line shows the true number of reads from each species. Thesmaller graph displays results for the subset of species for which Bracken made the largest adjustments. Precise numbers for the Kraken classifica-tion, true read counts, and Bracken estimates are contained in Table S2B.
Figure 3 shows results when using the large database to estimate abundance for thei100 genomes. This test is much more difficult because of the large number of similarand near-identical genomes in the database. Many more reads are ambiguous, mappingidentically to two or more species, which means that Kraken assigns them to the LCA ofthose species. Nonetheless, Bracken brings the estimated abundance of all species within4% of the true abundance, and most fall within 1%. Note that when the re-estimationprocedure distributes reads from higher nodes in the taxonomy down to multiple specieswithin a single genus, it may over-estimate one species and underestimate its sister speciesif the re-allocation is imperfect.
Tables S2A–S2B contains the detailed numbers for all species in Figs. 2 and 3, along withan error rate for each species in the i100 data, expressed as the difference between the trueand estimated proportions. We calculated the average error as:
1n
n∑i=1
∣∣∣R(i)true−R
(i)est
∣∣∣R(i)true
(5)
Lu et al. (2017), PeerJ Comput. Sci., DOI 10.7717/peerj-cs.104 9/17

Figure 4 Number of reads within theMycobacterium genus as assigned by Kraken (blue), estimated byBracken (purple) and compared to the true read counts (green). Initially, Kraken assigned only 325,073reads toMycobacterium sp. JLS although 722,880 reads originated from this species. Bracken reassigned370,601 reads from theMycobacterium genus toM. sp. JLS. Bracken’s re-estimated abundance forM. sp.JLS is much closer to the true read count. Table S3 contains precise numbers for all species shown here.
where n is the number of species in the i100 data, R(i)true is the true number of reads for
species i, and R(i)est is the Bracken estimate of the number of reads for species i. When using
the small database, the average relative error of Bracken is 1.75% across all 85 species in thei100 data. For the larger database, the average relative error is 1.89%. We also calculatedfalse positive rates for the i100 data as the percentage of total reads incorrectly classifiedafter Bracken abundance estimation. For the small database, the false positive rate is 0.13%and for the large database, the false positive rate is 0.24%.
Within the i100 genomes, the five species belonging to the Mycobacterium genus (M.tuberculosis, M. bovis, M. avium, M. marinum, and M. sp. JLS) pose a particular challengefor abundance estimation due to the similarities among their individual genomes. Forexample, Kraken classified only 9,733M. tuberculosis reads at the species level, and classifiedthe remaining 285,414 reads as eitherMycobacterium (a genus) orM. tuberculosis complex (ataxonomic class intermediate between genus and species), as shown in Fig. 4 and Table S3.For theseMycobacteria genomes, Bracken reallocated the reads from higher-level nodes toyield species abundance estimates within 4% of the true abundance. Figure 4 and Table S3show the number of reads assigned to each species by Kraken, the true number of reads,and the number of reads assigned to each species by Bracken after abundance reestimation.
The five species of the Mycobacterium genus also provide an example of potentialoverestimation by Bracken. Bracken apportions all ambiguous reads classified by Krakenat the genus level (and above) to the existing species identified by Kraken. Because Brackenuses a probabilistic method in distributing the reads, one species may receive too manyreads while another may receive too few. For example, Kraken assigned 543,916 reads toM. tuberculosis complex. Bracken re-allocated 296,543 of these reads to M. tuberculosis andthe remaining 247,453 reads to M. bovis. When added to Kraken’s original assignments,Bracken estimated that 306,792 reads belonged toM. tuberculosis (11,645 reads more thanthe true number) that 256,927 reads belonged to M. bovis (31,473 reads less than the truenumber). It is likely that some of the additional reads Bracken allocated to M. tuberculosisoriginated from M. bovis instead. However, despite the over- and under-estimation,Bracken’s estimates fell within 4% of the true number of reads for both species.
If M. bovis were excluded from the database, the 8,965 reads unique to M. bovis,as identified by Kraken, would be unclassified, while all 543,916 reads assigned to the
Lu et al. (2017), PeerJ Comput. Sci., DOI 10.7717/peerj-cs.104 10/17

M. tuberculosis complex would assigned to M. tuberculosis by Kraken. These reads wouldno longer be ambiguous because no other Mycobacterium species from the M. tuberculosiscomplex would be present in the database. In general, reads belonging to species excludedfrom the database will either be assigned to species with very high similarity to the missingspecies or will remain unclassified.
Experiments on a real metagenomics sample created fromknown speciesFor a more realistic evaluation of the performance of Bracken, we generated new sequencedata using a set of bacteria that are commonly found on healthy human skin. Thismock community was assembled by combining purified DNA from nine isolates thatwere identified and sequenced during the initial phase of the Human MicrobiomeProject (Human Microbiome Project, 2012): Acinetobacter radioresistens strain SK82,Corynebacterium amycolatum strain SK46, Micrococcus luteus strain SK58, Rhodococcuserythropolis strain SK121, Staphylococcus capitis strain SK14, Staphylococcus epidermidisstrain SK135, Staphylococcus hominis strain SK119, Staphylococcus warneri strain SK66,and Propionibacterium acnes strain SK137. To generate the skin microbiome community,purified DNA was obtained from the Biodefense and Emerging Infections ResearchResources Repository (BEI Resources). Each of the nine bacterial isolates was grown underconditions recommended by BEI Resources, collected by centrifugation during log growthphase at a 600nm optical density (OD600) of 0.8–1.2, and genomic DNA was isolated usingMasterPure DNA isolation reagents (Epicentre). Purified genomic DNA was quantifiedusing the high sensitivity picogreen assay (Invitrogen), pooled in equal amounts by mass,and prepared for sequencing using Nextera XT library preparation reagents (Illumina). Thesample was then sequenced on a HiSeq sequencer, generating a total of 78,439,985 millionread pairs (157 million reads), all of them 100 bp in length. These were then classified aspairs by Kraken, which concatenates the two reads from each pair and assigns them to asingle taxonomic category.
We used Bracken to estimate both species and genus-level abundance in the skinmicrobiome community. In the Bracken results, the nine true species comprise over 99%of the species-level abundance estimates. The mixture was created with approximatelyequal amounts of each of the nine genomes, so the expectation was that each species wouldaccount for∼11% of the total. However, as shown in Fig. 5, the estimates varied from 7.3%to 14.8%. Details for the exact number of reads assigned by Kraken and the abundanceestimates by Bracken are shown in Table S4.
Deviations from the expected abundance could arise from a variety of factors. Theprocess of quantifying DNA and mixing in equal amounts can be influenced by pipettingconsistency. Second, library amplification by PCR, an integral step in the Nextera librarypreparation process, can exaggerate small differences in quantities and lead to significantbiases in abundance (Bowers et al., 2015). We examined a sample of the classified readsby hand, and could find no evidence that Kraken mis-classified reads from M. luteus (thesmallest portion of the community, estimated at 7.3%) to any of the other species or
Lu et al. (2017), PeerJ Comput. Sci., DOI 10.7717/peerj-cs.104 11/17

Figure 5 Estimates of species abundance made by Bracken for the metagenomics community contain-ing isolates of nine bacterial species commonly found on human skin. Precise numbers can be found inTable S4.
genera. The abundances found in this data, therefore, may correspond fairly closely withthe true abundances.
The genus-level abundance estimates computed by Bracken also correspond closely tothe expected abundances for the six genera included in the sample. Four of the nine speciesbelong to the genus Staphylococcus, which was thus expected to comprise 44% (4 × 11%)of the sample. The Bracken estimate was 43.3%. Each of the other genus classificationshas only one species present, and their abundance estimates are the same for both genusand species.
The comparison between the Kraken classification of reads and Bracken’s reassignmentrevealed that the nine species are sufficiently distinct to allow Kraken to classify a largemajority of reads at the species level, with very few reads being classified at higher levels ofthe taxonomy. Specifically, Kraken classified 76.4 million reads to the nine species includedin the sample. Only 1.3 million reads out of the 78.2 million total (1.6%) were classified byKraken at the genus level or above. (The remaining reads were unclassified.) In this caseBracken does not provide a substantial benefit, because reassignment of the 1.3 millionreads could yield at most a 1.6% change in the estimated composition of the sample.
Abundance estimation timing and resource requirementsIn the i100 data experiment with the small database, we used 188 gigabytes (GB) of RAMwith 10 threads to build the Kraken database and generate the k-mer distribution filerequired by Bracken. In total, these steps completed in about 2 h and yielded files that canbe used across multiple datasets. The resulting Kraken database and distribution files use53 GB of space. Kraken classification of the i100 dataset took 18 min, using 10 threads and107 GB of RAM. This step is limited by the size of the database, which is loaded into RAMduring classification. Bracken alone runs in under a second, using 35 MB of RAM. TheKraken classification file for the i100 data is 1.6 GB, while Bracken abundance estimation
Lu et al. (2017), PeerJ Comput. Sci., DOI 10.7717/peerj-cs.104 12/17

files require∼65 KB of space. Table S5 lists detailed timing, RAM, and space requirementsfor each file and step of the Bracken abundance estimation algorithm.
CONCLUSIONEstimating the abundance of species, genera, phyla, or other taxonomic groups is a centralstep in the analysis of many metagenomics datasets. Metagenomics classifiers like Krakenprovide a very fast and accurate way to label individual reads, and at higher taxonomiclevels such as phyla, these assignments can be directly translated to abundance estimates.However, many reads cannot be unambiguously assigned to a single strain or species, forat least two reasons. First, many bacterial species are nearly identical, meaning that a readcan match identically to two or more distinct species. Second, the bacterial taxonomyitself is undergoing constant revisions and updates, as genome sequencing reveals theneed to re-assign species to new names. These revisions sometimes create new taxa thatshare near-identical sequence with a distinct species. In these situations, Kraken correctlyassigns the read to a higher-level taxonomic category such as genus or family. This createsa problem in that Kraken’s classifications cannot be used directly for species abundanceestimation.
Bracken addresses this problem by probabilistically re-assigning reads from intermediatetaxonomic nodes to the species level or above. As we have shown here, these re-assignmentsproduce species-level abundance estimates that are very accurate, typically 98% corrector higher. For genus-level abundance, accuracy is even higher because fewer reads haveambiguous assignments at that level. For abundance estimation at higher levels, rangingfrom family up to phylum, Kraken’s original read assignments can be used directly to createabundance estimates.
ACKNOWLEDGEMENTSWe would like to thank Derrick Wood for valuable suggestions on the implementation ofthe algorithm, and Kasper Hansen for helpful comments and feedback on a draft versionof this manuscript.
ADDITIONAL INFORMATION AND DECLARATIONS
FundingThis work was supported in part by the US National Institutes of Health R01-HG006677and R01-GM083873 and by the US Army Research Office W911NF-1410490. The fundershad no role in study design, data collection and analysis, decision to publish, or preparationof the manuscript.
Grant DisclosuresThe following grant information was disclosed by the authors:US National Institutes of Health: R01-HG006677, R01-GM083873.US Army Research Office: W911NF-1410490.
Lu et al. (2017), PeerJ Comput. Sci., DOI 10.7717/peerj-cs.104 13/17

Competing InterestsSteven L. Salzberg is currently serving as an Academic Editor for PeerJ.
Author Contributions• Jennifer Lu and Florian P. Breitwieser conceived and designed the experiments,performed the experiments, analyzed the data, contributed reagents/materials/analysistools, wrote the paper, prepared figures and/or tables, performed the computation work,reviewed drafts of the paper.
• Peter Thielen performed the experiments, analyzed the data, wrote the paper, revieweddrafts of the paper.
• Steven L. Salzberg conceived and designed the experiments, analyzed the data, wrote thepaper, reviewed drafts of the paper.
Data AvailabilityThe following information was supplied regarding data availability:
Bracken is written in Perl and Python and is freely available for download athttp://ccb.jhu.edu/software/bracken/. The reads from the skin microbiome experimentare freely available from NCBI under BioProject PRJNA316735.
Supplemental InformationSupplemental information for this article can be found online at http://dx.doi.org/10.7717/peerj-cs.104#supplemental-information.
REFERENCESAngly FE,Willner D, Prieto-Davo A, Edwards RA, Schmieder R, Vega-Thurber R,
Antonopoulos DA, Barott K, Cottrell MT, Desnues C, Dinsdale EA, FurlanM,Haynes M, HennMR, Hu Y, Kirchman DL, McDole T, McPherson JD, Meyer F,Miller RM,Mundt E, Naviaux R, Rodriguez B, Stevens RK,Wegley L, Zhang L, ZhuB, Rohwer F. 2009. The GAAS metagenomic tool and its estimations of viral andmicrobial average genome size in four major biomes. PLos Computational Biology5:e1000593 DOI 10.1371/journal.pcbi.1000593.
Benson DA, Clark K, Karsch-Mizrachi I, Lipman DJ, Ostell J, Sayers EW. 2015.GenBank. Nucleic Acids Research 43:D30–D35 DOI 10.1093/nar/gku1216.
Bowers RM, Clum A, Tice H, Lim J, Singh K, Ciobanu D, Ngan CY, Cheng JF, TringeSG,Woyke T. 2015. Impact of library preparation protocols and template quantityon the metagenomic reconstruction of a mock microbial community. BMC Ge-nomics 16:856 DOI 10.1186/s12864-015-2063-6.
Brosch R, Gordon SV, Marmiesse M, Brodin P, Buchrieser C, Eiglmeier K, GarnierT, Gutierrez C, Hewinson G, Kremer K, Parsons LM, Pym AS, Samper S, VanSoolingen D, Cole ST. 2002. A new evolutionary scenario for theMycobacteriumtuberculosis complex. Proceedings of the National Academy of Sciences of the UnitedStates of America 99:3684–3689 DOI 10.1073/pnas.052548299.
Lu et al. (2017), PeerJ Comput. Sci., DOI 10.7717/peerj-cs.104 14/17

Garnier T, Eiglmeier K, Camus JC, Medina N, Mansoor H, Pryor M, Duthoy S,Grondin S, Lacroix C, Monsempe C, Simon S, Harris B, Atkin R, Doggett J, MayesR, Keating L,Wheeler PR, Parkhill J, Barrell BG, Cole ST, Gordon SV, HewinsonRG. 2003. The complete genome sequence ofMycobacterium bovis. Proceedings ofthe National Academy of Sciences of the United States of America 100:7877–7882DOI 10.1073/pnas.1130426100.
Grange JM. 2001.Mycobacterium bovis infection in human beings. Tuberculosis 81:71–77DOI 10.1054/tube.2000.0263.
Helgason E, Okstad OA, Caugant DA, Johansen HA, Fouet A, MockM, Hegna I, KolstoAB. 2000. Bacillus anthracis, Bacillus cereus, and Bacillus thuringiensis–one species onthe basis of genetic evidence. Applied and Environmental Microbiology 66:2627–2630DOI 10.1128/AEM.66.6.2627-2630.2000.
HumanMicrobiome Project C. 2012. Structure, function and diversity of the healthyhuman microbiome. Nature 486:207–214 DOI 10.1038/nature11234.
Lan R, Reeves PR. 2002. Escherichia coli in disguise: molecular origins of Shigella.Microbes and Infection 4:1125–1132 DOI 10.1016/S1286-4579(02)01637-4.
Lindgreen S, Adair KL, Gardner PP. 2016. An evaluation of the accuracy and speed ofmetagenome analysis tools. Scientific Reports 6:Article 19233 DOI 10.1038/srep19233.
Lindner MS, Renard BY. 2012.Metagenomic abundance estimation and diagnostictesting on species level. Nucleic Acids Research 41:e10 DOI 10.1093/nar/gks803.
Liu Y, Lai Q, Göker M, Meier-Kolthoff JP, WangM, Sun Y,Wang L, Shao Z. 2015.Genomic insights into the taxonomic status of the Bacillus cereus group. ScientificReports 5:Article 14082 DOI 10.1038/srep14082.
Luo C, Knight R, Siljander H, KnipM, Xavier RJ, Gevers D. 2015. ConStrains identifiesmicrobial strains in metagenomic datasets. Nature Biotechnology 33:1045–1052DOI 10.1038/nbt.3319.
Mende DR,Waller AS, Sunagawa S, Jarvelin AI, ChanMM, ArumugamM, Raes J, BorkP. 2012. Assessment of metagenomic assembly using simulated next generationsequencing data. PLoS ONE 7:e31386 DOI 10.1371/journal.pone.0031386.
Morgulis A, Coulouris G, Raytselis Y, Madden TL, Agarwala R, Schaffer AA.2008. Database indexing for production MegaBLAST searches. Bioinformatics24:1757–1764 DOI 10.1093/bioinformatics/btn322.
PeabodyMA, Van Rossum T, Lo R, Brinkman FS. 2015. Evaluation of shotgunmetagenomics sequence classification methods using in silico and in vitro simulatedcommunities. BMC Bioinformatics 16:363 DOI 10.1186/s12859-015-0788-5.
Riesenfeld CS, Schloss PD, Handelsman J. 2004.Metagenomics: genomic analysis ofmicrobial communities. Annual Review of Genetics 38:525–552DOI 10.1146/annurev.genet.38.072902.091216.
Schaeffer L, Pimentel H, Bray N, Melsted P, Pachter L. 2015. Pseudoalignment formetagenomic read assignment. ArXiv preprint. arXiv:1510.07371v07372.
Segata N,Waldron L, Ballarini A, Narasimhan V, Jousson O, Huttenhower C. 2012.Metagenomic microbial community profiling using unique clade-specific markergenes. Nature Methods 9:811–814 DOI 10.1038/nmeth.2066.
Lu et al. (2017), PeerJ Comput. Sci., DOI 10.7717/peerj-cs.104 15/17
SohnM, An L, Pookhao N, Li Q. 2014. Accurate genome relative abundance estimationfor closely related species in a metagnomic sample. BMC Bioinformatics 15:Article242 DOI 10.1186/1471-2105-15-242.
The International Human Genome Sequencing Consortium. 2001. Initial sequencingand analysis of the human genome. Nature 409:860–921 DOI 10.1038/35057062.
Thiel T, Pratte BS, Zhong J, Goodwin L, Copeland A, Lucas S, Han C, PitluckS, LandML, Kyrpides NC,Woyke T. 2014. Complete genome sequence ofAnabaena variabilis ATCC 29413. Standards in Genomic Sciences 9:562–573DOI 10.4056/sigs.3899418.
Venter JC, AdamsMD,Myers EW, Li PW,Mural RJ, Sutton GG, Smith HO, Yandell M,Evans CA, Holt RA, Gocayne JD, Amanatides P, Ballew RM, Huson DH,WortmanJR, Zhang Q, Kodira CD, Zheng XH, Chen L, Skupski M, Subramanian G, ThomasPD, Zhang J, GaborMiklos GL, Nelson C, Broder S, Clark AG, Nadeau J, McKusickVA, Zinder N, Levine AJ, Roberts RJ, SimonM, Slayman C, Hunkapiller M,Bolanos R, Delcher A, Dew I, Fasulo D, FlaniganM, Florea L, Halpern A, Han-nenhalli S, Kravitz S, Levy S, Mobarry C, Reinert K, Remington K, Abu-ThreidehJ, Beasley E, Biddick K, Bonazzi V, Brandon R, Cargill M, Chandramouliswaran I,Charlab R, Chaturvedi K, Deng Z, Di Francesco V, Dunn P, Eilbeck K, EvangelistaC, Gabrielian AE, GanW, GeW, Gong F, Gu Z, Guan P, Heiman TJ, Higgins ME,Ji RR, Ke Z, KetchumKA, Lai Z, Lei Y, Li Z, Li J, Liang Y, Lin X, Lu F, MerkulovGV, Milshina N, Moore HM, Naik AK, Narayan VA, Neelam B, Nusskern D,Rusch DB, Salzberg S, ShaoW, Shue B, Sun J, Wang Z,Wang A,Wang X,WangJ, Wei M,Wides R, Xiao C, Yan C, Yao A, Ye J, ZhanM, ZhangW, Zhang H, ZhaoQ, Zheng L, Zhong F, ZhongW, Zhu S, Zhao S, Gilbert D, Baumhueter S, SpierG, Carter C, Cravchik A,Woodage T, Ali F, An H, Awe A, Baldwin D, Baden H,BarnsteadM, Barrow I, Beeson K, BusamD, Carver A, Center A, ChengML, CurryL, Danaher S, Davenport L, Desilets R, Dietz S, Dodson K, Doup L, Ferriera S, GargN, Gluecksmann A, Hart B, Haynes J, Haynes C, Heiner C, Hladun S, Hostin D,Houck J, Howland T, IbegwamC, Johnson J, Kalush F, Kline L, Koduru S, Love A,Mann F, May D, McCawley S, McIntosh T, McMullen I, MoyM,Moy L, MurphyB, Nelson K, Pfannkoch C, Pratts E, Puri V, Qureshi H, ReardonM, RodriguezR, Rogers YH, Romblad D, Ruhfel B, Scott R, Sitter C, SmallwoodM, Stewart E,Strong R, Suh E, Thomas R, Tint NN, Tse S, Vech C,Wang G,Wetter J, WilliamsS, WilliamsM,Windsor S, Winn-Deen E,Wolfe K, Zaveri J, Zaveri K, Abril JF,Guigo R, Campbell MJ, Sjolander KV, Karlak B, Kejariwal A, Mi H, Lazareva B,Hatton T, Narechania A, et al. 2001. The sequence of the human genome. Science291:1304–1351 DOI 10.1126/science.1058040.
Venter JC, Remington K, Heidelberg JF, Halpern AL, Rusch D, Eisen JA,WuD,Paulsen I, Nelson KE, NelsonW, Fouts DE, Levy S, Knap AH, LomasMW, NealsonK,White O, Peterson J, Hoffman J, Parsons R, Baden-Tillson H, Pfannkoch C,Rogers YH, Smith HO. 2004. Environmental genome shotgun sequencing of theSargasso Sea. Science 304:66–74 DOI 10.1126/science.1093857.
Lu et al. (2017), PeerJ Comput. Sci., DOI 10.7717/peerj-cs.104 16/17

WoodDE, Salzberg SL. 2014. Kraken: ultrafast metagenomic sequence classification us-ing exact alignments. Genome Biology 15:Article R46 DOI 10.1186/gb-2014-15-3-r46.
Xia LC, Cram JA, Chen T, Fuhrman JA, Fengzhu S. 2011. Accurate genome relativeabundance estimation based on shotgun metgenomic reads. PLoS ONE 6:e27992DOI 10.1371/journal.pone.0027992.
Lu et al. (2017), PeerJ Comput. Sci., DOI 10.7717/peerj-cs.104 17/17