brain -...
TRANSCRIPT
BRAINA JOURNAL OF NEUROLOGY
Efficient mitochondrial biogenesis drivesincomplete penetrance in Leber’s hereditaryoptic neuropathyCarla Giordano,1 Luisa Iommarini,2 Luca Giordano,3 Alessandra Maresca,2,4 Annalinda Pisano,1
Maria Lucia Valentino,2,4 Leonardo Caporali,2,4 Rocco Liguori,2,4 Stefania Deceglie,3
Marina Roberti,3 Francesca Fanelli,3 Flavio Fracasso,3 Fred N. Ross-Cisneros,5 Pio D’Adamo,6,7
Gavin Hudson,8 Angela Pyle,8 Patrick Yu-Wai-Man,8 Patrick F. Chinnery,8 Massimo Zeviani,9,10
Solange R. Salomao,11 Adriana Berezovsky,11 Rubens Belfort Jr,11 Dora Fix Ventura,12
Milton Moraes,11 Milton Moraes Filho,11 Piero Barboni,13 Federico Sadun,14 Annamaria DeNegri,15 Alfredo A. Sadun,5 Andrea Tancredi,16 Massimiliano Mancini,1,17 Giulia d’Amati,1
Paola Loguercio Polosa,3 Palmiro Cantatore3 and Valerio Carelli2,4
1 Department of Radiology, Oncology and Pathology, Sapienza, University of Rome, Rome, Italy
2 Department of Biomedical and NeuroMotor Sciences (DIBINEM), University of Bologna, Bologna, Italy
3 Department of Biosciences, Biotechnologies and Biopharmaceutics, University of Bari, Bari, Italy
4 IRCCS Istituto delle Scienze Neurologiche di Bologna, Bellaria Hospital, Bologna, Italy
5 Departments of Ophthalmology and Neurosurgery, Keck School of Medicine at USC, Los Angeles, CA, USA
6 Medical Genetics, Department of Reproductive Sciences, Development and Public Health
7 IRCCS-Burlo Garofolo Children Hospital, University of Trieste, Trieste, Italy
8 Institute of Genetic Medicine, Newcastle University, Newcastle upon Tyne, UK
9 Unit of Molecular Neurogenetics, Fondazione Istituto Neurologico “Carlo Besta” - IRCCS, Milano, Italy
10 MRC-Mitochondrial Biology Unit, Cambridge, UK
11 Department of Ophthalmology, Federal University of Sao Paulo – UNIFESP, Sao Paulo, Brazil
12 Department of Experimental Psychology, Institute of Psychology, University of Sao Paulo, Sao Paulo, Brazil
13 Studio Oculistico d’Azeglio, Bologna, Italy
14 Ospedale San Giovanni Evangelista, Tivoli, Italy
15 Azienda Ospedaliera San Camillo-Forlanini, Roma, Italy
16 Dipartimento di Metodi e Modelli per l’Economia la Finanza e il Territorio, Sapienza, Universita di Roma, Roma, Italy
17 Department of Molecular Medicine, Sapienza, University of Rome
Correspondence to: Carla Giordano, MD,
Department of Radiology, Oncology and Pathology,
Policlinico Umberto I,
Viale Regina Elena 324,
00161 Roma, Italy
E-mail: [email protected]
Correspondence may also be addressed to: Valerio Carelli, MD, PhD IRCCS Istituto delle Scienze Neurologiche di Bologna, Bellaria Hospital, Via Altura
3, 40139, Bologna, Italy E-mail: [email protected]
Leber’s hereditary optic neuropathy is a maternally inherited blinding disease caused as a result of homoplasmic point mutations
in complex I subunit genes of mitochondrial DNA. It is characterized by incomplete penetrance, as only some mutation carriers
become affected. Thus, the mitochondrial DNA mutation is necessary but not sufficient to cause optic neuropathy.
Environmental triggers and genetic modifying factors have been considered to explain its variable penetrance. We measured
doi:10.1093/brain/awt343 Brain 2014: 137; 335–353 | 335
Received June 30, 2013. Revised September 6, 2013. Accepted October 21, 2013. Advance Access publication December 24, 2013� The Author (2013). Published by Oxford University Press on behalf of the Guarantors of Brain.
This is an Open Access article distributed under the terms of the Creative Commons Attribution License (http://creativecommons.org/licenses/by/3.0/), which permits unrestricted reuse,
distribution, and reproduction in any medium, provided the original work is properly cited.
the mitochondrial DNA copy number and mitochondrial mass indicators in blood cells from affected and carrier individuals,
screening three large pedigrees and 39 independently collected smaller families with Leber’s hereditary optic neuropathy, as well
as muscle biopsies and cells isolated by laser capturing from post-mortem specimens of retina and optic nerves, the latter being
the disease targets. We show that unaffected mutation carriers have a significantly higher mitochondrial DNA copy number and
mitochondrial mass compared with their affected relatives and control individuals. Comparative studies of fibroblasts from
affected, carriers and controls, under different paradigms of metabolic demand, show that carriers display the highest capacity
for activating mitochondrial biogenesis. Therefore we postulate that the increased mitochondrial biogenesis in carriers may
overcome some of the pathogenic effect of mitochondrial DNA mutations. Screening of a few selected genetic variants in
candidate genes involved in mitochondrial biogenesis failed to reveal any significant association. Our study provides a valuable
mechanism to explain variability of penetrance in Leber’s hereditary optic neuropathy and clues for high throughput genetic
screening to identify the nuclear modifying gene(s), opening an avenue to develop predictive genetic tests on disease risk and
therapeutic strategies.
Keywords: LHON penetrance; mitochondrial biogenesis; mtDNA copy number
Abbreviations: LHON = Leber’s hereditary optic neuropathy; RNFL = retinal nerve fibre layer; SNP = single nucleotide polymorphism
IntroductionLeber’s hereditary optic neuropathy (LHON) is the prototypic mito-
chondrial optic neuropathy and the most frequent mitochondrial
disease (Chinnery et al., 2000; Carelli et al., 2004). The primary
role for mitochondrial aetiology is revealed by maternal inheritance
and association with specific mitochondrial DNA point mutations
affecting complex I subunit genes MT-ND4 (m.11778G4A), MT-
ND1 (m.3460G4A), and MT-ND6 (m.14484T4C) (Newman,
2005). The classical presentation of LHON includes the rapid loss
of central vision, predominantly in young males, with the estab-
lishment of optic atrophy �1 year after onset (Newman, 2005;
Barboni et al., 2010). In most cases, pathogenic LHON mutations
are homoplasmic (100% mutant mitochondrial DNA) in all mater-
nally-related individuals, but only a subset of them will express the
disease. Thus, the mitochondrial DNA mutation is necessary but
not sufficient to cause optic neuropathy and disease penetrance
may vary in different families with the same mutation, and even
within the same family in different branches (Howell and Mackey,
1998; Carelli et al., 2003). Unexplained questions regarding LHON
include the incomplete penetrance, the male prevalence and the
tissue-specific targeting of retinal ganglion cells. The first two
issues might be addressed by the existence of modifying genes
in the nuclear genome. A leading hypothesis for male prevalence
suggests the involvement of chromosome X and different loci were
reported by linkage and association studies in LHON families, but
no significant variants have been identified to date (Hudson et al.,
2005; Shankar et al., 2008; Ji et al., 2010). A genome-wide scan
of Asian LHON families suggested the existence of multiple loci,
finding a significant association with two single nucleotide poly-
morphisms (SNPs) in the presenilin-associated rhomboid-like
(PARL) gene (Phasukkijwatana et al., 2010). However, a subse-
quent study on a large cohort of patients with LHON from China
failed to reproduce this association (Zhang et al., 2010).
A compensatory strategy to mitochondrial dysfunction com-
monly observed in mitochondrial diseases is the increase of mito-
chondrial biogenesis, as exemplified by the massive proliferation of
mitochondria in skeletal muscle fibres (DiMauro and Schon, 2003).
The ragged-red fibres have been reproduced in mouse by disrupt-
ing the expression of TFAM and the increased mitochondrial mass
partly compensated for the reduced function of the respiratory
chain by maintaining overall ATP production in skeletal muscle
(Wredenberg et al., 2002). Thus, within certain limits, an increase
of mitochondrial mass can be a successful compensatory strategy.
In skeletal muscle from patients with LHON a relative increase in
mitochondrial mass is indicated by subsarcolemmal enhancement
of succinic dehydrogenase staining as a result of parcellar accu-
mulations of mitochondria (Larsson et al., 1991; Iommarini et al.,
2012). Increases of the matrix enzyme citrate synthase and succi-
nic dehydrogenase activities, both good indicators of mitochon-
drial mass, have also been described in LHON (Larsson et al.,
1991; Yen et al., 1996). A few small studies reported that there
was an increase in mitochondrial DNA content in blood cells from
patients with LHON (Yen et al., 2002; Iommarini et al., 2012), as
well as in unaffected mutation carriers (Nishioka et al., 2004),
compared with controls, suggesting the activation of mitochondrial
biogenesis. Interestingly, the mitochondrial DNA content was
slightly higher in carriers. Furthermore, anti-retroviral therapy,
which reduces mitochondrial DNA content, apparently triggered
optic neurpathy in a few cases of patients with LHON infected
with HIV (Mackey et al., 2003). Finally, studies on neuronal NT2
cybrids carrying the homoplasmic m.11778G4A mutation showed
a pathological phenotype with increased oxidative stress only after
neuronal differentiation, which remarkably reduced by 3-fold the
mitochondrial DNA:nuclear DNA ratio (Wong et al., 2002). Thus,
we postulate that mitochondrial DNA copy number per cell
and mitochondrial biogenesis may be important factors in
LHON, possibly involved in protecting from or promoting the
disease process.
In the present study, we show that a higher mitochondrial DNA
content and increased mitochondrial biogenesis in multiple tissues
differentiates the unaffected mutation carriers from LHON af-
fected patients and control subjects. This observation provides a
plausible explanation for incomplete penetrance in LHON and has
broad implications for therapy in LHON and other disorders.
336 | Brain 2014: 137; 335–353 C. Giordano et al.
Materials and methodsThe procedures for ex vivo collection and use of human tissues for
this study were approved by the Ethics Committee of the St. Orsola-
Malpighi Polyclinic (University of Bologna) and the Sao Paulo Hospital
(Federal University of Sao Paulo). The procedures for collection and
use of human post-mortem tissues were approved by the University of
Southern California Ethics Committee. All samples were obtained from
donors or their families having provided written informed consent ac-
cording to the Declaration of Helsinki.
Detailed experimental procedures are available in the Supplementary
material.
Leber’s hereditary optic neuropathypedigrees and case seriesWe first investigated three large LHON pedigrees harbouring the
m.11778G4A homoplasmic mutation on a haplogroup J background
(Table 1 and Supplementary Figs 1–3). Family 1 is a previously re-
ported large maternal lineage of Italian ancestry, now mostly living
in Brazil (SOA-BR family) (Sadun et al., 2003, 2004, 2006; Ventura
et al., 2005; Carelli et al., 2006; Shankar et al., 2008; Ramos Cdo
et al., 2009; La Morgia et al., 2010; Pan et al., 2012). We had avail-
able peripheral blood from 25 affected and 38 unaffected mutation
carriers from this pedigree. As controls (n = 54) we used the spouses
from the same family, which do not belong to the mutant maternal
lineage (off-pedigree). Family 2 is a previously reported (Carelli et al.,
2006) Italian family composed of 21 individuals (eight affected, eight
carriers and five off-pedigree). Family 3 is an Irish-American pedigree
composed of 17 individuals (two affected, 14 carriers and one off-
pedigree).
Subsequently, we studied all the available individuals from 39 unre-
lated Italian LHON pedigrees (64 affected and 68 carriers) harbouring
one of the three common LHON mutations: m.11778/G4A/MT-
ND4, m.3460G4A/MT-ND1 and m.14484T4C/MT-ND6 mutations
(Table 2). A further independently-collected cohort (100 affected
and 100 carriers harbouring the same common mutations) from
Northern Europe was used only for the association studies investigat-
ing candidate genetic variants in genes involved in mitochondrial
biogenesis.
For all cases, we assessed only unaffected carriers 535 years of age,
to minimize the possibility that these individuals could become affected
in the future.
Ophthalmological assessments incarriers from Family 1 (SOA-BR)The ophthalmological data used for correlative analysis with mitochon-
drial DNA content were previously reported assessments of ocular
fundus features (Sadun et al., 2004), contrast sensitivity functions
(Ventura et al., 2005), and optical coherence tomography measure-
ments of retinal nerve fibre layer (RNFL) thickness and optic disc size
(Ramos et al., 2009), carried out in carriers from Family 1. The ana-
tomical measures of optical coherence tomography analyses con-
sidered in this study are the RNFL thickness around the optic nerve
head in the temporal, superior, nasal and inferior quadrants
(QUADRANT T, S, N, I), as well as the optic disc area and the aver-
age, minimum, and six sectorial (TEMPSUP, SUP, NASSUP, NASINF,
INF and TEMPINF) RNFL thicknesses measured from the annulus
centred on the fovea.
Muscle biopsiesVastus lateralis or tibialis anterior muscle biopsies were performed by
open surgery, under local anaesthesia and after informed consent of
the patient. Muscle specimens were frozen in cooled isopentane and
stored in liquid nitrogen for histological and histoenzymatic analysis
including succinic dehydrogenase activity and adenosine triphospha-
tase (ATPase) staining according to standard protocols. Analysis of
the distribution of type I and II fibres was performed by counting
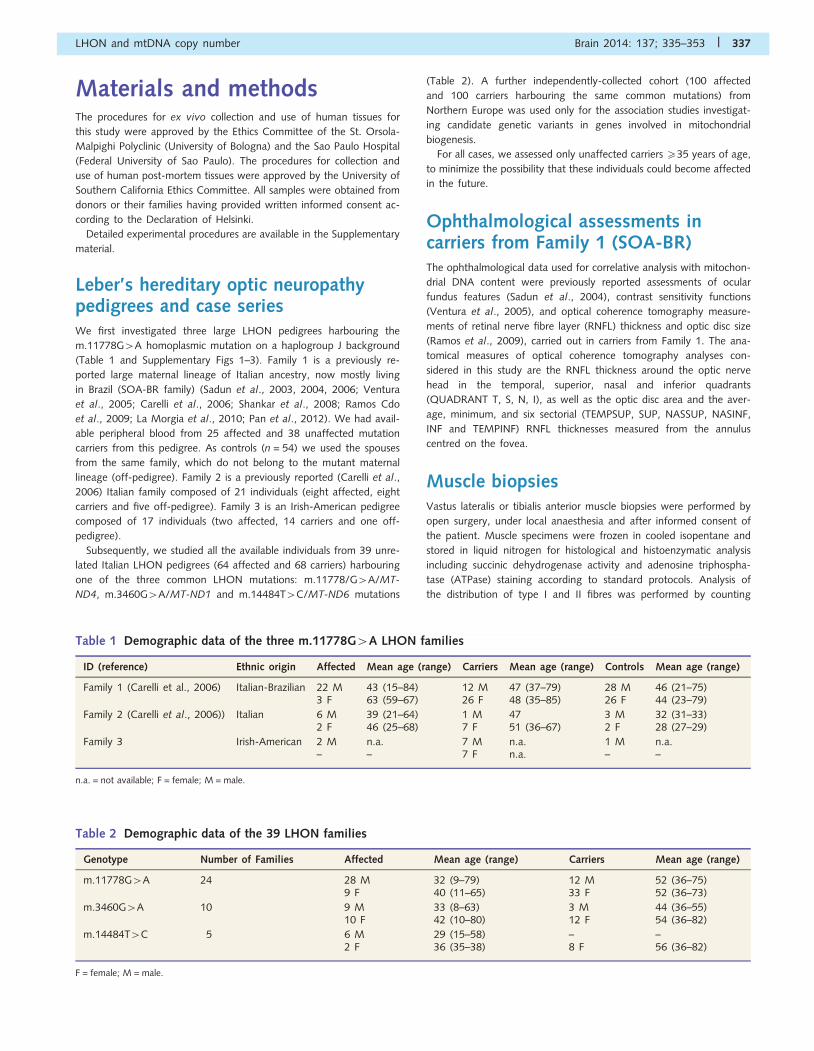
Table 1 Demographic data of the three m.11778G4A LHON families
ID (reference) Ethnic origin Affected Mean age (range) Carriers Mean age (range) Controls Mean age (range)
Family 1 (Carelli et al., 2006) Italian-Brazilian 22 M 43 (15–84) 12 M 47 (37–79) 28 M 46 (21–75)3 F 63 (59–67) 26 F 48 (35–85) 26 F 44 (23–79)
Family 2 (Carelli et al., 2006)) Italian 6 M 39 (21–64) 1 M 47 3 M 32 (31–33)2 F 46 (25–68) 7 F 51 (36–67) 2 F 28 (27–29)
Family 3 Irish-American 2 M n.a. 7 M n.a. 1 M n.a.– – 7 F n.a. – –
n.a. = not available; F = female; M = male.
Table 2 Demographic data of the 39 LHON families
Genotype Number of Families Affected Mean age (range) Carriers Mean age (range)
m.11778G4A 24 28 M 32 (9–79) 12 M 52 (36–75)9 F 40 (11–65) 33 F 52 (36–73)
m.3460G4A 10 9 M 33 (8–63) 3 M 44 (36–55)10 F 42 (10–80) 12 F 54 (36–82)
m.14484T4C 5 6 M 29 (15–58) – –2 F 36 (35–38) 8 F 56 (36–82)
F = female; M = male.
LHON and mtDNA copy number Brain 2014: 137; 335–353 | 337
them with light microscopy on sections from tibialis anterioris stained
with ATPase. At least 200 fibres (from 200 to 700) were counted for
each biopsy.
Optic nerve and retina studiesWe examined formalin-fixed, paraffin embedded ocular post-mortem
specimens as follows: sagittal histological serial sections of optic nerves
from four control male subjects (left and right eyes; age range 60–80;
mean 72); retrobulbar histological serial cross-sections of optic nerves
from six control subjects (left and right eyes; four males, age range
58–74, mean 66); two LHON-affected eyes (both sagittal and cross-
sections) from a 59-year-old male subject bearing the m.11778G4A
mutation; two LHON-unaffected carrier eyes (both sagittal and cross-
sections) from an 83-year-old female bearing the m.11778G4A mu-
tation. Control eyes were obtained from the Lions Eye Bank of Oregon
(Portland, OR). The eyes from affected and carrier individuals were
obtained at post-mortem examination. The interval between time of
death and time of formalin preservation ranged from 5 to12 h. Time in
formalin varied from 1 month to 2 years.
For histological analysis, sections were stained with Masson tri-
chrome stain. Immunohistochemistry with anti-neurofilament mono-
clonal antibodies (Dako, 1:1000) was also performed. For laser
capture microdissection (MMI NIKON UV-CUT System, Molecular
Machines and Industries) three serial 5-mm thick cut sections were
mounted on a polyethylene foil slide and stained with either haema-
toxylin and eosin or Luxol Fast Blue. Sections were observed under
light microscope with a �40 objective. Selected tissue areas were
microdissected by a UV laser and collected on an adhesive cap of
nanotubes as previously described (Giordano and d’Amati, 2011).
Samples were digested with proteinase K (20mg/100 ml). Absolute
quantification of mitochondrial DNA was performed by the standard
curve method using serial known dilutions of a vector in which the
mitochondrial DNA region used as template for the amplification (nu-
cleotides 4625–4714) was cloned, as previously detailed (Cossarizza
et al., 2003). Preliminary to these experiments, we amplified serial
dilutions of DNA obtained from a fixed tissue and we verified that
the PCR was quantitative. Nonetheless, as quantity and quality of
DNA recovery from formalin-fixed tissues is dramatically influenced
by fixation time and type (Gilbert et al., 2007), and as the small
amount of DNA obtained from microdissected tissues does not allow
one to run an appropriate standard curve within each experiment, to
reduce inter-samples variability we report, for each sample, the ratio
between the mitochondrial DNA content obtained in two different
microdissected areas.
Statistical analysisData were analysed by using SPSS Base 16 software, applying the
ANOVA test in conjunction with Tukey’s test. Statistical significance
was set at P5 0.05. Mitochondrial DNA per cell distribution analysis
was performed considering the number of individuals falling within
classes of 200 mitochondrial DNA copies per cell, graphically expressed
as dispersion. Numerical calculations for the normal mixture model,
logistic regression and multiple regression analysis were performed
with the software R and the package BMA (R: A Language and
Environment for Statistical Computing, R Development Core Team,
R Foundation for Statistical Computing, Vienna, Austria, 2012, ISBN
3-900051-07-0, http://www.R-project.org/).
Results
Analysis of three Leber’s hereditaryoptic neuropathy pedigrees revealsincreased mitochondrial DNA copynumber in white blood cells particularlyin unaffected mutation carriersWe first investigated mitochondrial DNA copy number in periph-
eral white blood cells from LHON affected individuals (affected)
and unaffected mutation carriers (carriers) from three large LHON
pedigrees, two of them previously reported (Carelli et al., 2006),
genetically homogeneous for harbouring the m.11778G4A muta-
tion on a haplogroup J background (demographic data of the
three families are reported in Table 1 and pedigrees are shown
in Supplementary Figs 1–3).
The cumulative results for all three families, comparing the mito-
chondrial DNA content per cell of the three groups (affected, car-
riers and controls) showed that subjects belonging to the mutant
maternal lineages (affected and carriers) presented a significantly
higher mitochondrial DNA content, as compared with controls
(481 � 18 versus 178 � 6; P50.0001). Subgrouping the individ-
uals carrying the m.11778G4A mutation into affected and
carriers, we found that the mitochondrial DNA content was sig-
nificantly higher in carriers (Fig. 1A).
By analysing cumulatively the three families, the frequency dis-
tribution of the mitochondrial DNA copy number per cell in con-
trols, affected and carriers showed that the peak of mitochondrial
DNA content shifts progressively towards higher values from con-
trols to affected to carriers, this last group having the widest vari-
ability and peaking at 4500 mitochondrial DNA copies (Fig. 1B).
This distribution pattern, as well as the statistical significances pre-
viously shown amongst groups, is consistent across each of the
individual pedigrees (P5 0.0001) (Supplementary Fig. 4A).
Analysis of a large Leber’s hereditaryoptic neuropathy Italian cohort with allthree primary mutations confirms thatcarriers present the highestmitochondrial DNA copy number inwhite blood cellsTo extend the previous findings, we investigated an independent
cohort of all available individuals belonging to 39 unrelated Italian
LHON pedigrees harbouring one of the three common primary
mutations (demographic data of the Italian cohort are reported
in Table 2). We assessed the mitochondrial DNA copy number
per cell in a total of 64 affected and 68 carriers, finding, as we
did in the three large pedigrees described above, a significantly
higher mitochondrial DNA content in peripheral white blood cells
from carriers compared with affected individuals (Fig. 1C). The
frequency distribution of the mitochondrial DNA content for
affected and carriers showed carriers peaking at 4600
338 | Brain 2014: 137; 335–353 C. Giordano et al.
mitochondrial DNA copies (Fig. 1D). Stratifying these data for mu-
tation type, the frequency distribution of the mitochondrial DNA
content was similar for the three mutations, with a slightly lower
mean for the m.14484T4C carriers (Supplementary Fig. 4B).
Mitochondrial DNA copies in bloodcells discriminate affected and carriersand correlate with subclinical signs ofdisease in carriersAfter combining all data from the two previous data sets we
applied a normal mixture model fitted to the mitochondrial DNA
content observations. The model identified three populations with
estimated means of 155 � 24, 301 � 63 and 612 � 141
mitochondrial DNA copies per cell (Fig. 2A). These populations
consistently fitted the frequency distribution of controls, affected
and carriers, with a putative threshold of �500 mitochondrial DNA
copies discriminating affected from carriers. Logistic regression
analysis applied on the same overall data set, stratified by
gender, identified a similar mitochondrial DNA copy number per
cell threshold. The probability to be a carrier is 100% at 4600
mitochondrial DNA copies, whereas 5300 the probability of being
a carrier is almost reduced to zero (Fig. 2B). Females presented a
shifted probability curve indicating that for a certain amount of
mitochondrial DNA content the probability to be a carrier is sig-
nificantly higher compared with males (P50.01), consistent with
the known lower risk to be affected in females (Fig. 2B).
It is noteworthy that five carriers from the previously reported
large Family 1 (SOA-BR) converted to be clinically affected in the
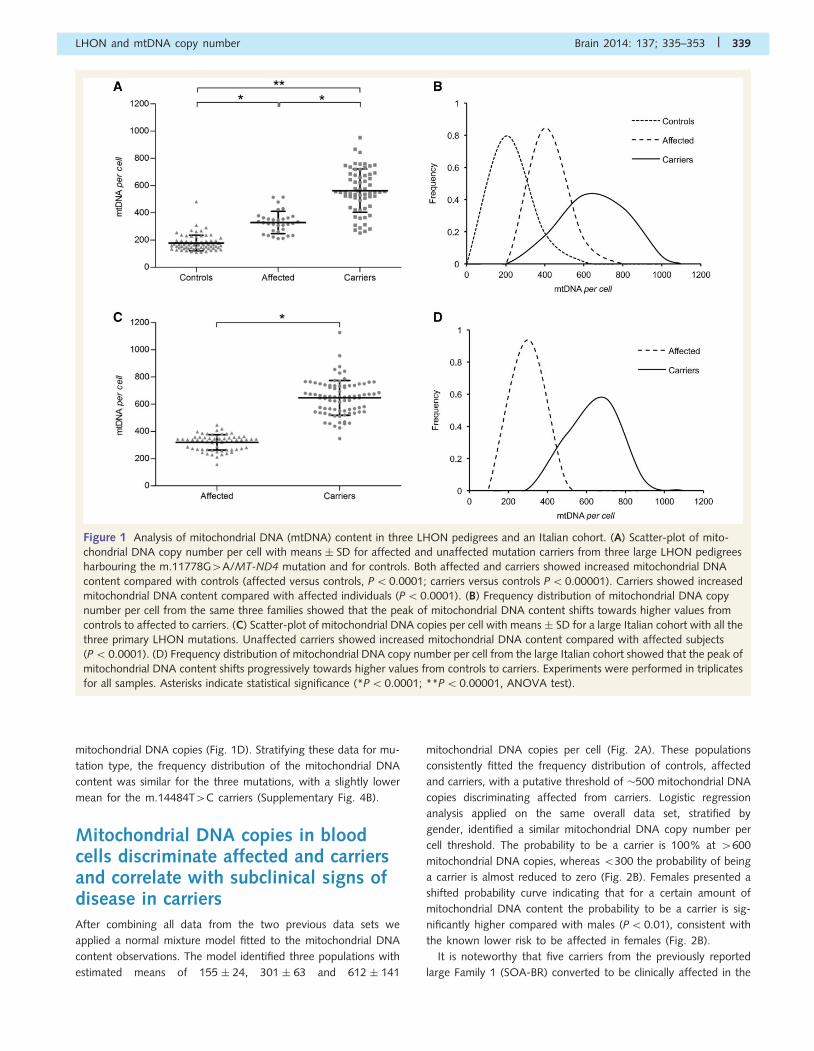
Figure 1 Analysis of mitochondrial DNA (mtDNA) content in three LHON pedigrees and an Italian cohort. (A) Scatter-plot of mito-
chondrial DNA copy number per cell with means � SD for affected and unaffected mutation carriers from three large LHON pedigrees
harbouring the m.11778G4A/MT-ND4 mutation and for controls. Both affected and carriers showed increased mitochondrial DNA
content compared with controls (affected versus controls, P50.0001; carriers versus controls P50.00001). Carriers showed increased
mitochondrial DNA content compared with affected individuals (P50.0001). (B) Frequency distribution of mitochondrial DNA copy
number per cell from the same three families showed that the peak of mitochondrial DNA content shifts towards higher values from
controls to affected to carriers. (C) Scatter-plot of mitochondrial DNA copies per cell with means � SD for a large Italian cohort with all the
three primary LHON mutations. Unaffected carriers showed increased mitochondrial DNA content compared with affected subjects
(P50.0001). (D) Frequency distribution of mitochondrial DNA copy number per cell from the large Italian cohort showed that the peak of
mitochondrial DNA content shifts progressively towards higher values from controls to carriers. Experiments were performed in triplicates
for all samples. Asterisks indicate statistical significance (*P50.0001; **P5 0.00001, ANOVA test).
LHON and mtDNA copy number Brain 2014: 137; 335–353 | 339
last 10 years, the time elapsing from the blood sampling used in
the current investigation (Sadun et al., 2003, 2006). Of these, the
four males had 5400 mitochondrial DNA copies (277, 289, 359
and 381, respectively), in accordance with the possible threshold
of �600 mitochondrial DNA copies, above which carriers are at
virtually no risk to become affected. The only female, who con-
verted at 46 years of age, had 621 copies of mitochondrial DNA.
The blood sample assessed was drawn �9 years before she under-
went menopause and shortly after she became affected.
For most of the carriers from the large Family 1, we had avail-
able a series of ophthalmological examinations, characterizing the
subclinical changes that frequently occur in carriers (Sadun et al.,
2004; Ventura et al., 2005). Using the fundus examination and
the contrast sensitivity evaluation classified as normal or abnormal,
we found that mitochondrial DNA copy number was significantly
higher in carriers lacking abnormalities in both parameters, as
compared with carriers having at least one abnormal evaluation
and carriers with both fundus and contrast sensitivity abnormal-
ities, who had the lowest mitochondrial DNA copy number
(Fig. 2C). We also assessed by optical coherence tomography
the RNFL thickness around the optic nerve head, as well as the
optic disc area and the macular RNFL thickness. These are ana-
tomical measures indicative of the number of retinal ganglion cells
and correlated axons, which form the RNFL and enter the optic
disc. Previous studies documented that a subset of carriers display
increased RNFL thickness, probably a result of pathological axonal
swelling, in the inferior-temporal quadrants of the optic disc,
which is currently considered a subclinical sign of disease (Savini
et al., 2005). This increase (pseudoedema) may lead to conversion
to visual loss and onset of acute LHON, at which point RNFL
thickness decreases as part of the process of optic atrophy
(Barboni et al., 2010). However, many carriers maintain lifelong
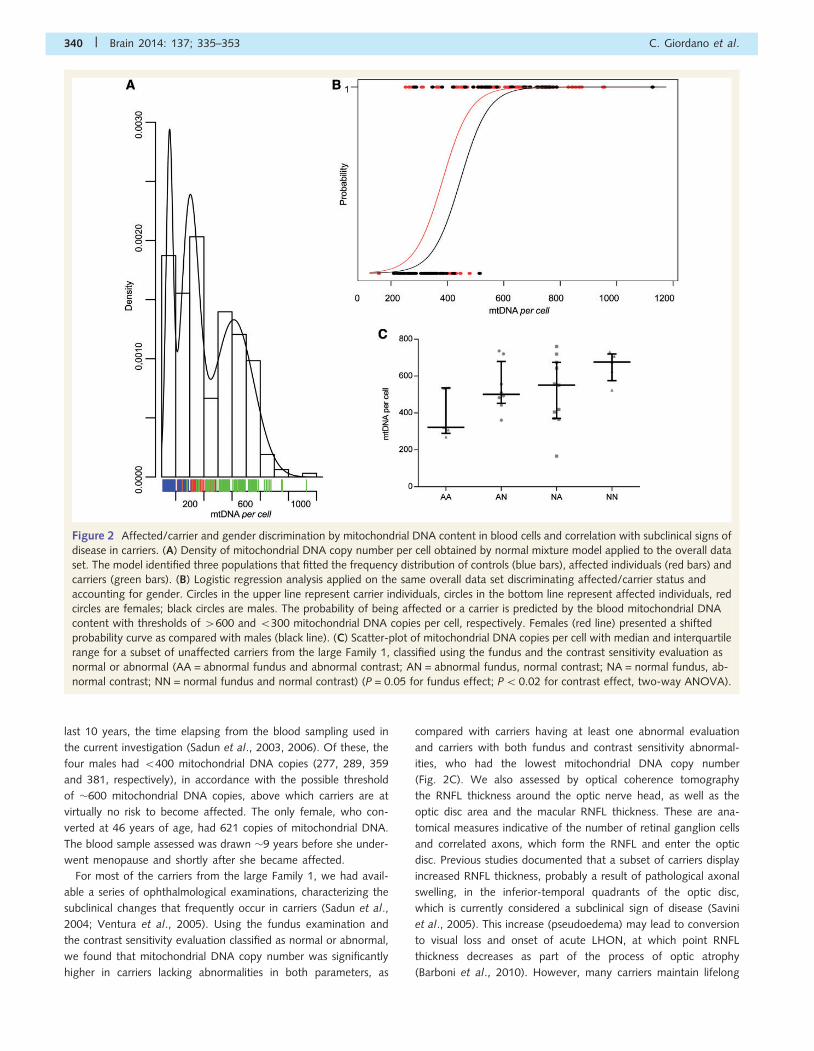
Figure 2 Affected/carrier and gender discrimination by mitochondrial DNA content in blood cells and correlation with subclinical signs of
disease in carriers. (A) Density of mitochondrial DNA copy number per cell obtained by normal mixture model applied to the overall data
set. The model identified three populations that fitted the frequency distribution of controls (blue bars), affected individuals (red bars) and
carriers (green bars). (B) Logistic regression analysis applied on the same overall data set discriminating affected/carrier status and
accounting for gender. Circles in the upper line represent carrier individuals, circles in the bottom line represent affected individuals, red
circles are females; black circles are males. The probability of being affected or a carrier is predicted by the blood mitochondrial DNA
content with thresholds of 4600 and 5300 mitochondrial DNA copies per cell, respectively. Females (red line) presented a shifted
probability curve as compared with males (black line). (C) Scatter-plot of mitochondrial DNA copies per cell with median and interquartile
range for a subset of unaffected carriers from the large Family 1, classified using the fundus and the contrast sensitivity evaluation as
normal or abnormal (AA = abnormal fundus and abnormal contrast; AN = abnormal fundus, normal contrast; NA = normal fundus, ab-
normal contrast; NN = normal fundus and normal contrast) (P = 0.05 for fundus effect; P50.02 for contrast effect, two-way ANOVA).
340 | Brain 2014: 137; 335–353 C. Giordano et al.
the subclinical increased RNFL thickness without converting. We
applied a multiple regression analysis, modelling the mitochondrial
DNA content of blood cells as a function of the optical coherence
tomography anatomical measures in the carriers from Family 1,
and included gender and age as covariates. The best fitting
model shows a negative correlation between mitochondrial DNA
blood content and the temporal RNFL thickness/nasal-inferior
macular thickness (P50.005, Supplementary Fig. 5). Thus, by
fixing the other variables, the decreasing mitochondrial DNA con-
tent of blood cells correlates with increasing subclinical RNFL
thickness of the papillomacular axons originating from the nasal-
inferior macula and constituting the temporal quadrant of the
optic disc (Supplementary Fig. 5). Another significant correlation
in this model positively linked the mitochondrial DNA content
with the optic disc area, which has already been shown to be a
protective factor for disease conversion and final visual outcome
(Ramos et al., 2009).
Mitochondrial DNA copy number isindicative of global mitochondrialbiogenesisTo confirm the activation of global mitochondrial biogenesis in
blood cells, we carried out a separate series of experiments from
a limited resampled subset of controls (n = 9), affected (n = 8) and
carriers (n = 9) belonging to the Italian cohort. For each blood
sample, we evaluated the content of mitochondrial DNA and of
messenger RNAs coding for key regulators of mitochondrial biogen-
esis and the amount of proteins belonging to different mitochondrial
compartments (matrix, inner and outer mitochondrial membrane).
The results are summarized in Fig. 3. The mitochondrial DNA copy
number per cell assessment reproduced the previous results, with
carriers having the highest mitochondrial DNA content (Fig. 3A).
The analysis of gene expression of transcription factors (NRF1 and
TFAM) and the PPRC1 co-activator showed a concordance between
mitochondrial DNA content and transcripts level displaying a scale
of increasing expression from controls to affected individuals to car-
riers (Fig. 3B). A significant difference was reached for PPRC1 and
TFAM, comparing carriers to controls. Western blots of a panel of
representative mitochondrial proteins showed a global increase of all
protein content in individuals carrying the LHON mutation com-
pared with controls and in carriers compared with affected individ-
uals (Fig. 3C). However, densitometric analysis failed to show any
statistical significance, possibly because of the small data set and the
intrinsic interindividual variability (Fig. 3C).
Overall, these results confirmed that blood cells from individuals
carrying the LHON mutation have a globally activated mitochondrial
biogenesis associated with increased mitochondrial DNA content.
Increased mitochondrial biogenesisalso characterizes the post-mitoticskeletal muscleWe evaluated the mitochondrial DNA content (expressed as mito-
chondrial DNA/nuclear DNA ratio) in skeletal muscle biopsies from
17 controls, 24 affected and six carrier individuals harbouring one
of the three common primary LHON mutations. In skeletal muscle,
as in blood cells, the mitochondrial DNA content was significantly
higher in LHON affected individuals and carriers compared with
controls, as well as in carriers compared with those affected
(Fig. 4A). The difference between affected individuals and carriers
was less pronounced compared with the results from blood sam-
ples. Interestingly, in considering the three pairs of discordant male
siblings available (affected versus carrier brothers), all three male
carriers showed a higher mitochondrial DNA content compared
with their affected brothers (Fig. 4B). A similar result was obtained
by measuring the level of TFAM messenger RNA in the same
muscle samples (Fig. 4C).
Histoenzymatic staining of the muscle biopsies showed a fre-
quent subsarcolemmal increase of succinic dehydrogenase stain
in affected and carriers, indicative of mitochondrial proliferation.
These features were more evident in carriers (Fig. 4D). To see if
mitochondrial proliferation was associated with a switch in fibre
type, we counted type I and II fibres on muscle biopsies from four
groups of discordant siblings and from controls (n = 6). Based on
ATPase staining the distribution of muscle fibres was substantially
similar in the three groups. Interestingly, two of four carriers
showed a higher percentage of type I fibres (82% and 96%,
respectively) as compared with affected (range 49–75%) and
control subjects (range 62–81%) (Fig. 4D and E).
Taken together, these data confirm that mitochondrial biogen-
esis also is activated in a post-mitotic tissue with high-energy
requirement, exemplified by skeletal muscle.
Carrier-derived fibroblasts successfullyactivate mitochondrial biogenesisunder forced oxidativephosphorylation conditionsThe results obtained on ex vivo tissues by comparing affected
and carrier individuals prompted us to investigate this issue further
in vitro, using skin-derived fibroblasts. Most cell studies in LHON
used the cybrid cell model (Vergani et al., 1995; Ghelli et al.,
2003; Baracca et al., 2005; Floreani et al., 2005; Giordano
et al., 2011), where only the mitochondrial DNA from the patient
was transferred to a cell line with a constant nuclear background,
thus eliminating the effects of the nuclear complement of genes.
Hence, we chose to investigate fibroblasts because the hypothet-
ical modifying genes in the nuclear genome might underlie differ-
ences in mitochondrial biogenesis measurable by comparing
affected and carrier individuals (Guan et al., 1996, 2001). To high-
light these differences, we studied fibroblasts grown in medium
containing either glucose or galactose as a carbon source. This
strategy was previously employed to enhance observable differ-
ences in oxidative phosphorylation efficiency, forcing cells in
galactose medium to rely on mitochondrial respiration for ATP
synthesis (Robinson et al., 1992).
Three control-derived fibroblast cell lines were compared with five
affected-derived and four carrier-derived cell lines. The growth rate
in galactose medium normalized on growth in glucose at the same
time points showed that fibroblasts from controls and carriers grew
at a similar rate, whereas a significantly slower rate characterized
LHON and mtDNA copy number Brain 2014: 137; 335–353 | 341

fibroblasts from affected individuals (Fig. 5A). Moreover, control cell
lines activated their ATP synthesis, increasing the ATP levels over
the time course in galactose (Fig. 5B). Carriers displayed a similar
behaviour, even if less efficiently than controls, whereas affected
clearly decreased their ATP content while incubated in galactose
(Fig. 5B). The cellular lactate production showed a sharp decrease
after switching to galactose medium in all groups, with a progres-
sive increase at the following time points (Fig. 5C). This increase
appeared earlier in affected (after 48 h), with a significant difference
compared with carriers and controls. Overall, these three experi-
ments underscored a clear difference in oxidative phosphorylation
efficiency between affected individuals and carriers. This difference
was mirrored by the change in mitochondrial DNA copy number per
cell over the time course in galactose medium (Fig. 5D). In fact, the
mitochondrial DNA content in fibroblasts from controls and affected
individuals had a similar behaviour, failing to show significant
Figure 3 Mitochondrial DNA copy number and global mitochondrial biogenesis in white blood cells. (A) Scatter-plot of mitochondrial DNA
copy number per cell with mean � SD. The increase of mitochondrial DNA content was confirmed in both affected individuals and carriers
compared with controls and in carriers compared with affected individuals (affected versus controls, P50.01; carriers versus controls,
P50.001; carriers versus affected, P = 0.05). (B) Messenger RNA relative expression (mean � SEM) of PPRC1, NRF1 and TFAM. Significant
increase of TFAM and PPRC1 gene expression was found in carriers compared with controls. (C and D) Mitochondrial proteins expression:
representative western blot and densitometry are shown (mean � SEM). The quantification showed a generalized increase of all proteins
content in individuals carrying the LHON mutation compared with controls, higher for carriers, although the statistical significance was not
reached. Core2 = Cytochrome b-c1 complex subunit 2; CS = citrate synthetase; MnSOD = manganese superoxide dismutase. Experiments
were performed in triplicates for all samples. Asterisks indicate statistical significance: *P50.05, **P50.01, ANOVA test.
342 | Brain 2014: 137; 335–353 C. Giordano et al.
changes of mitochondrial DNA copy number. In contrast, fibroblasts
from carriers increased their mitochondrial DNA content �1.5-fold
when incubated in galactose. These results were paralleled by the
results of western blot analysis of NRF1, TFAM and mitochondrial
single stranded DNA-binding protein (mtSSB), whose levels
increased during the time course in galactose medium only in car-
riers, compatibly with the activation of mitochondrial biogenesis
(Fig. 5E).
To further document the increase of mitochondrial biogenesis as
a general process not limited to mitochondrial DNA cellular con-
tent, we determined the citrate synthase protein level and activity.
Control subjects and carriers increased both citrate synthetase ac-
tivity and protein content in galactose, whereas affected individ-
uals did not show any difference (Fig. 6A and B). In fibroblasts
from control and affected subjects, the citrate synthetase activity
did not correlate with mitochondrial DNA content (Fig. 6C).
Conversely, the increase of citrate synthetase activity and mito-
chondrial DNA copy number per cell in galactose medium were
correlated in carrier-derived cells (Fig. 6C), suggesting a global
activation of mitochondrial biogenesis (Fig. 6C).
Fibroblasts from carriers are themost effective in repopulatingmitochondrial DNA after depletionby ethidium bromideRecent reports showed that mitochondrial DNA repopulation rate,
in cells previously depleted of mitochondrial DNA by ethidium
bromide exposure, may vary depending on the efficiency of mito-
chondrial DNA maintenance machinery (Stewart et al., 2011). We
adopted the same experimental strategy to further validate the ac-
tivation of mitochondrial DNA replication specifically in fibroblasts
from carriers. After ethidium bromide withdrawal and growth in
glucose medium, cells remained quiescent until Day 8 and then
started to increase their mitochondrial DNA content, demonstrating
a clear divergence at the 12th day with cells from carriers being the
most efficient, followed by those from affected and then control
subjects (Fig. 7A). Thus, the presence of the LHON mutation signals
a compensatory activation of mitochondrial DNA replication, which
is most efficient in carriers with the permissive glucose medium. The
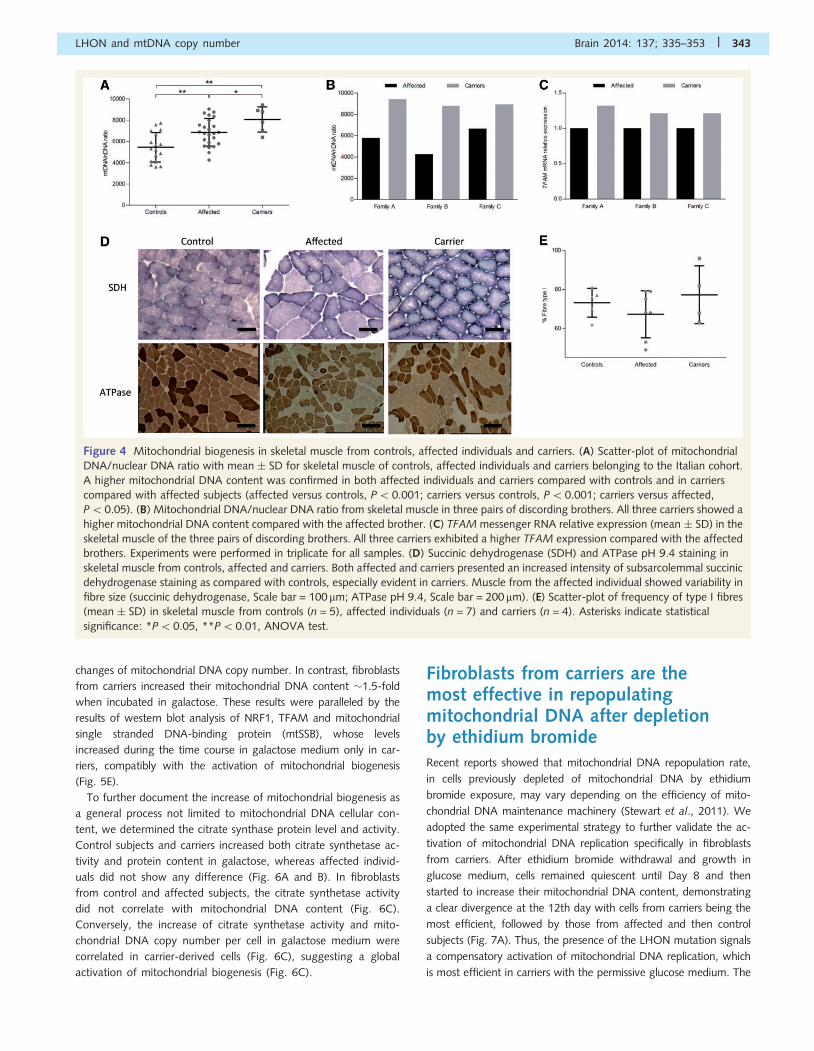
Figure 4 Mitochondrial biogenesis in skeletal muscle from controls, affected individuals and carriers. (A) Scatter-plot of mitochondrial
DNA/nuclear DNA ratio with mean � SD for skeletal muscle of controls, affected individuals and carriers belonging to the Italian cohort.
A higher mitochondrial DNA content was confirmed in both affected individuals and carriers compared with controls and in carriers
compared with affected subjects (affected versus controls, P5 0.001; carriers versus controls, P50.001; carriers versus affected,
P50.05). (B) Mitochondrial DNA/nuclear DNA ratio from skeletal muscle in three pairs of discording brothers. All three carriers showed a
higher mitochondrial DNA content compared with the affected brother. (C) TFAM messenger RNA relative expression (mean � SD) in the
skeletal muscle of the three pairs of discording brothers. All three carriers exhibited a higher TFAM expression compared with the affected
brothers. Experiments were performed in triplicate for all samples. (D) Succinic dehydrogenase (SDH) and ATPase pH 9.4 staining in
skeletal muscle from controls, affected and carriers. Both affected and carriers presented an increased intensity of subsarcolemmal succinic
dehydrogenase staining as compared with controls, especially evident in carriers. Muscle from the affected individual showed variability in
fibre size (succinic dehydrogenase, Scale bar = 100 mm; ATPase pH 9.4, Scale bar = 200mm). (E) Scatter-plot of frequency of type I fibres
(mean � SD) in skeletal muscle from controls (n = 5), affected individuals (n = 7) and carriers (n = 4). Asterisks indicate statistical
significance: *P50.05, **P50.01, ANOVA test.
LHON and mtDNA copy number Brain 2014: 137; 335–353 | 343
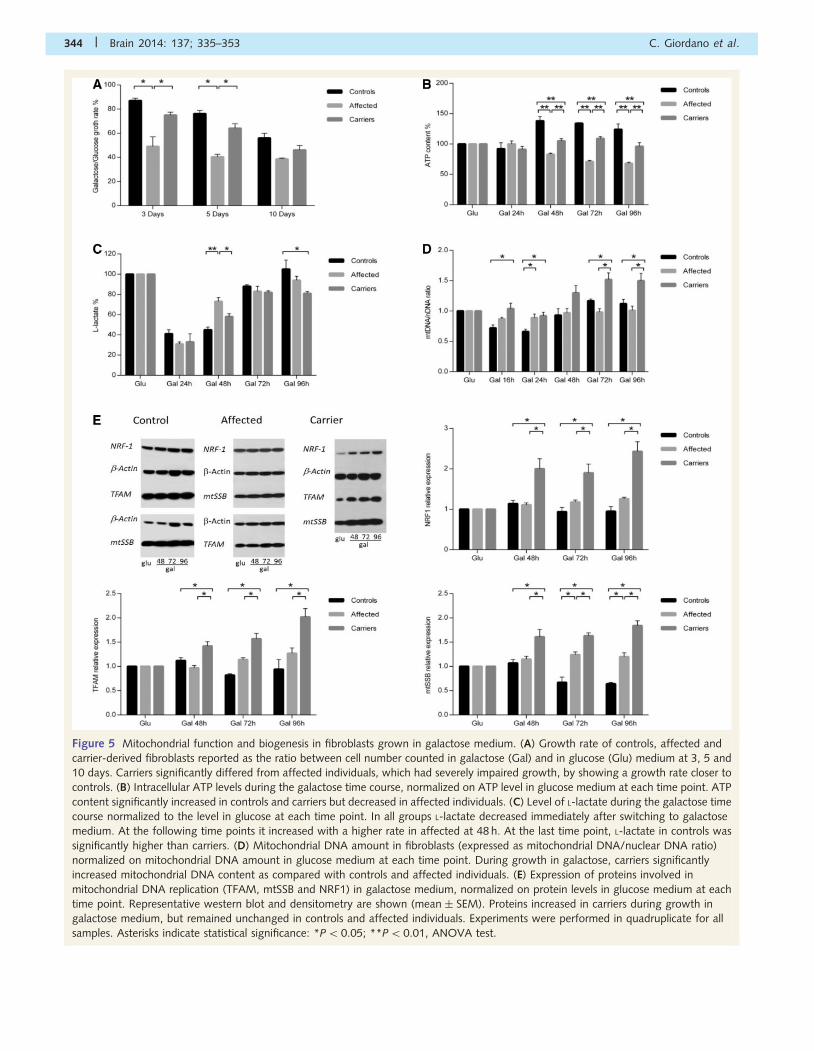
Figure 5 Mitochondrial function and biogenesis in fibroblasts grown in galactose medium. (A) Growth rate of controls, affected and
carrier-derived fibroblasts reported as the ratio between cell number counted in galactose (Gal) and in glucose (Glu) medium at 3, 5 and
10 days. Carriers significantly differed from affected individuals, which had severely impaired growth, by showing a growth rate closer to
controls. (B) Intracellular ATP levels during the galactose time course, normalized on ATP level in glucose medium at each time point. ATP
content significantly increased in controls and carriers but decreased in affected individuals. (C) Level of L-lactate during the galactose time
course normalized to the level in glucose at each time point. In all groups L-lactate decreased immediately after switching to galactose
medium. At the following time points it increased with a higher rate in affected at 48 h. At the last time point, L-lactate in controls was
significantly higher than carriers. (D) Mitochondrial DNA amount in fibroblasts (expressed as mitochondrial DNA/nuclear DNA ratio)
normalized on mitochondrial DNA amount in glucose medium at each time point. During growth in galactose, carriers significantly
increased mitochondrial DNA content as compared with controls and affected individuals. (E) Expression of proteins involved in
mitochondrial DNA replication (TFAM, mtSSB and NRF1) in galactose medium, normalized on protein levels in glucose medium at each
time point. Representative western blot and densitometry are shown (mean � SEM). Proteins increased in carriers during growth in
galactose medium, but remained unchanged in controls and affected individuals. Experiments were performed in quadruplicate for all
samples. Asterisks indicate statistical significance: *P5 0.05; **P50.01, ANOVA test.
344 | Brain 2014: 137; 335–353 C. Giordano et al.
faster repopulation in carriers over controls probably depends on the
activation of the compensatory response as a result of the LHON
mutation. Conversely, when cells were grown in galactose medium
after removal of ethidium bromide, control cells showed the most
efficient repopulation rate, followed by those from carriers (Fig. 7B).
Cells from affected individuals presented a slow repopulation rate
until Day 10, at which point three of four lines were lost as a result
of massive cell death. The only surviving line continued to show
mitochondrial DNA repopulation, albeit at a very slow rate. Thus, in
the restrictive galactose medium, mutant cells do perform worst
compared with controls.
These results consolidate the evidence for a clear difference
between unaffected mutation carriers and affected individuals in
activating mitochondrial DNA replication.
Analysis of human ocular tissuesshows that neurodegeneration inLeber’s hereditary optic neuropathyfollows the gradient of mitochondrialDNA content and compensatorychanges characterize a carrierTo verify our previous findings in the LHON target tissue, we
evaluated mitochondrial DNA amount in formalin-fixed retinal
and optic nerve post-mortem specimens from six control subjects,
one affected and one carrier individual from well-characterized
cases belonging to Family 1 (Sadun et al., 2003, 2004; Ventura
et al., 2005; Carelli et al., 2006; Sadun et al., 2006; Ramos et al.,
2009).
The retinal ganglion cells, selectively affected in LHON, have
large soma located in the inner retina, which give origin to unmye-
linated axons constituting the RNFL. Each axon then becomes
myelinated after turning posteriorly into the optic nerve head
and crossing the lamina cribrosa. These myelinated axons form
the optic nerve. We first studied, by laser capture, sagittal retinal
sections from two controls and the one available carrier, using
horizontal sections that went through the optic nerve head and
the macula. The retinal ganglion cells and RNFL complex, dis-
sected from the macular region and an equidistant area nasal
to the optic nerve head, were compared (Fig. 8A and B). The
macular/nasal ratio showed that the mitochondrial DNA content
(expressed as mitochondrial DNA copy per retinal ganglion
cell nucleus) from the macular region was higher than that
from the corresponding nasal region, both in controls and the
carrier individuals. The carrier showed the highest ratio (Fig. 8C).
These results suggest that the retinal ganglion cells of the mac-
ula, which give rise to the axons entering the temporal sector of
the optic nerve (i.e. papillomacular bundle), the first target of
neurodegeneration in LHON (Sadun et al., 2000), are the
most energy-dependent. In addition, the observation that the car-
rier displays the highest macular/nasal mitochondrial DNA ratio
may reflect a possible compensation in macular retinal
ganglion cells.
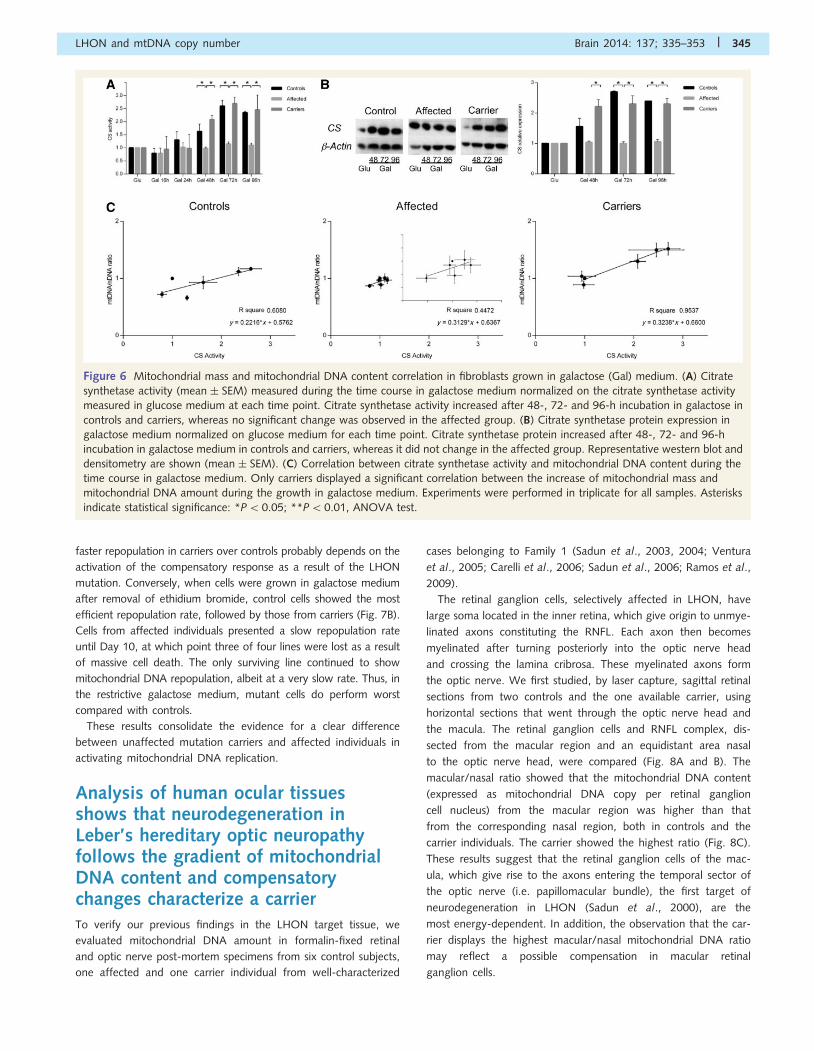
Figure 6 Mitochondrial mass and mitochondrial DNA content correlation in fibroblasts grown in galactose (Gal) medium. (A) Citrate
synthetase activity (mean � SEM) measured during the time course in galactose medium normalized on the citrate synthetase activity
measured in glucose medium at each time point. Citrate synthetase activity increased after 48-, 72- and 96-h incubation in galactose in
controls and carriers, whereas no significant change was observed in the affected group. (B) Citrate synthetase protein expression in
galactose medium normalized on glucose medium for each time point. Citrate synthetase protein increased after 48-, 72- and 96-h
incubation in galactose medium in controls and carriers, whereas it did not change in the affected group. Representative western blot and
densitometry are shown (mean � SEM). (C) Correlation between citrate synthetase activity and mitochondrial DNA content during the
time course in galactose medium. Only carriers displayed a significant correlation between the increase of mitochondrial mass and
mitochondrial DNA amount during the growth in galactose medium. Experiments were performed in triplicate for all samples. Asterisks
indicate statistical significance: *P50.05; **P50.01, ANOVA test.
LHON and mtDNA copy number Brain 2014: 137; 335–353 | 345
Myelination of retinal ganglion cell axons, as they exit the
lamina cribrosa, is associated with a marked reduction in the
number of mitochondria and activity of respiratory chain enzymes
(Andrews et al., 1999; Barron et al., 2004; Carelli et al., 2004; Pan
et al., 2012). Thus, we dissected portions of the optic nerve head
anterior to the lamina cribrosa and portions of post-laminar mye-
linated optic nerve using sagittal sections of optic nerves from four
controls and the carrier, at similar planes and showing similar fea-
tures. We did not evaluate the affected individual, because of
extensive gliosis (Fig. 9A and B). As expected, evaluation of mito-
chondrial DNA density (expressed as mitochondrial DNA molecule
per mm3) showed that, both in controls and the carrier, the pre-
laminar portion had more mitochondrial DNA copies than the
post-laminar region (up to 2.5-fold). Interestingly, the pre/post-
laminar ratio was lower in carrier. This might be because of an
increased mitochondrial DNA copy number in the carrier’s post-
laminar myelinated axons (Fig. 9C).
Finally, we microdissected portions from optic nerve cross-
sections in the post-laminar region. Control optic nerves displayed
a well-organized cross-sectional profile with axons grouped in
�1000 fascicles (Carelli et al., 2004). The carrier also showed an
essentially conserved number of fascicles and axons. In LHON the
neurodegenerative process starts from the temporal sector, which is
composed mostly of the small axons from the papillomacular bundle;
further degeneration extends into the central region, sparing some
of the far periphery of the superior, nasal and inferior quadrants, as
shown by the cross-sectional profile of the affected subject here
examined and in our previous studies (Fig. 9D) (Sadun et al.,
2000; Carelli et al., 2004; La Morgia et al., 2010; Pan et al.,
2012). Accordingly, we microdissected samples from the temporal
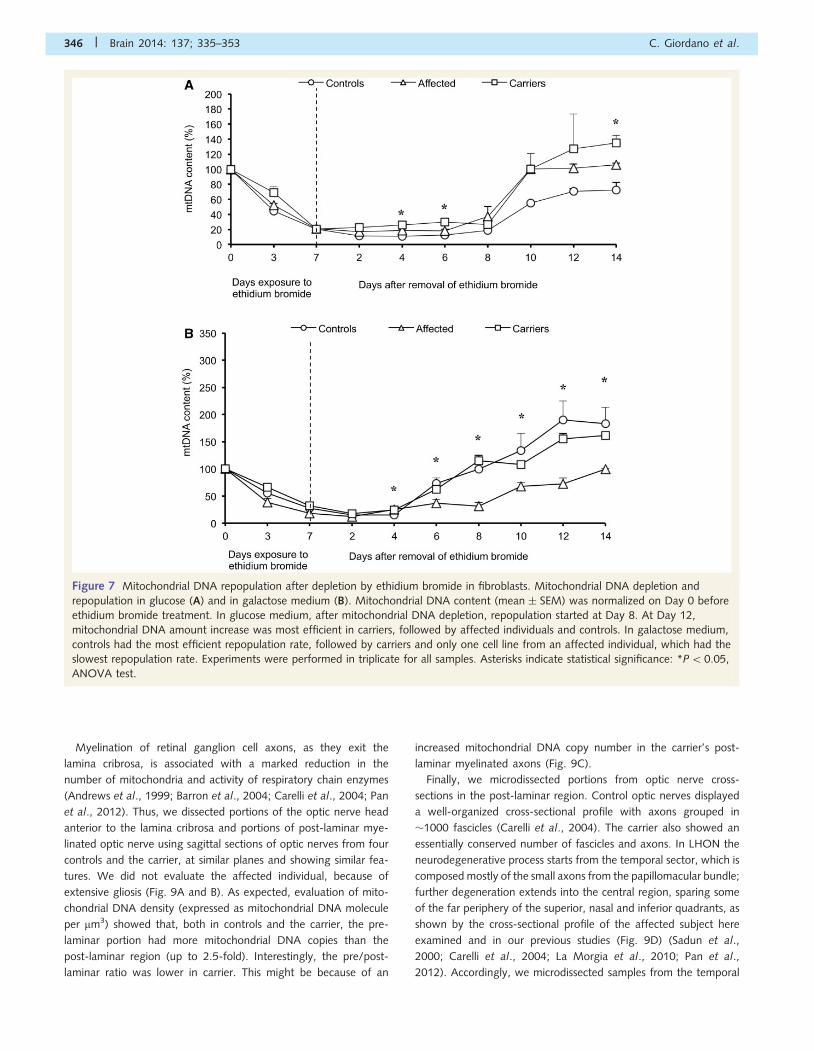
Figure 7 Mitochondrial DNA repopulation after depletion by ethidium bromide in fibroblasts. Mitochondrial DNA depletion and
repopulation in glucose (A) and in galactose medium (B). Mitochondrial DNA content (mean � SEM) was normalized on Day 0 before
ethidium bromide treatment. In glucose medium, after mitochondrial DNA depletion, repopulation started at Day 8. At Day 12,
mitochondrial DNA amount increase was most efficient in carriers, followed by affected individuals and controls. In galactose medium,
controls had the most efficient repopulation rate, followed by carriers and only one cell line from an affected individual, which had the
slowest repopulation rate. Experiments were performed in triplicate for all samples. Asterisks indicate statistical significance: *P50.05,
ANOVA test.
346 | Brain 2014: 137; 335–353 C. Giordano et al.
quadrant, as well as from the inferior, nasal and superior far periph-
ery of the optic nerve (Fig. 9E). The results from 12 control optic
nerves (six individuals) showed that temporal area had the lowest
mitochondrial DNA density (mitochondrial DNA molecules per mm3),
whereas the nasal and the inferior far periphery of the optic nerve
had the highest (Fig. 9F). This pattern is in agreement with our pre-
vious observation that the average axonal diameter progressively
increases from temporal to nasal regions of the optic nerve,
the same gradient followed by the neurodegenerative process
(Pan et al., 2012). With the same approach, we also evaluated the
carrier individual, who showed a slight decrease of the inferior/
temporal, superior/temporal and nasal/temporal ratios compared
with controls (Fig. 9F), indicating a compensatory increase of mito-
chondrial DNA density in the temporal sector (papillomacular
bundle), relative to the other sectors of the same nerve. Analysis
of the LHON-affected individual revealed the virtual absence of
mitochondrial DNA in the temporal sector where the axonal popu-
lation was ablated, and a decreased mitochondrial DNA level in the
nasal and inferior periphery, matching axonal depletion of these
areas (data not shown).
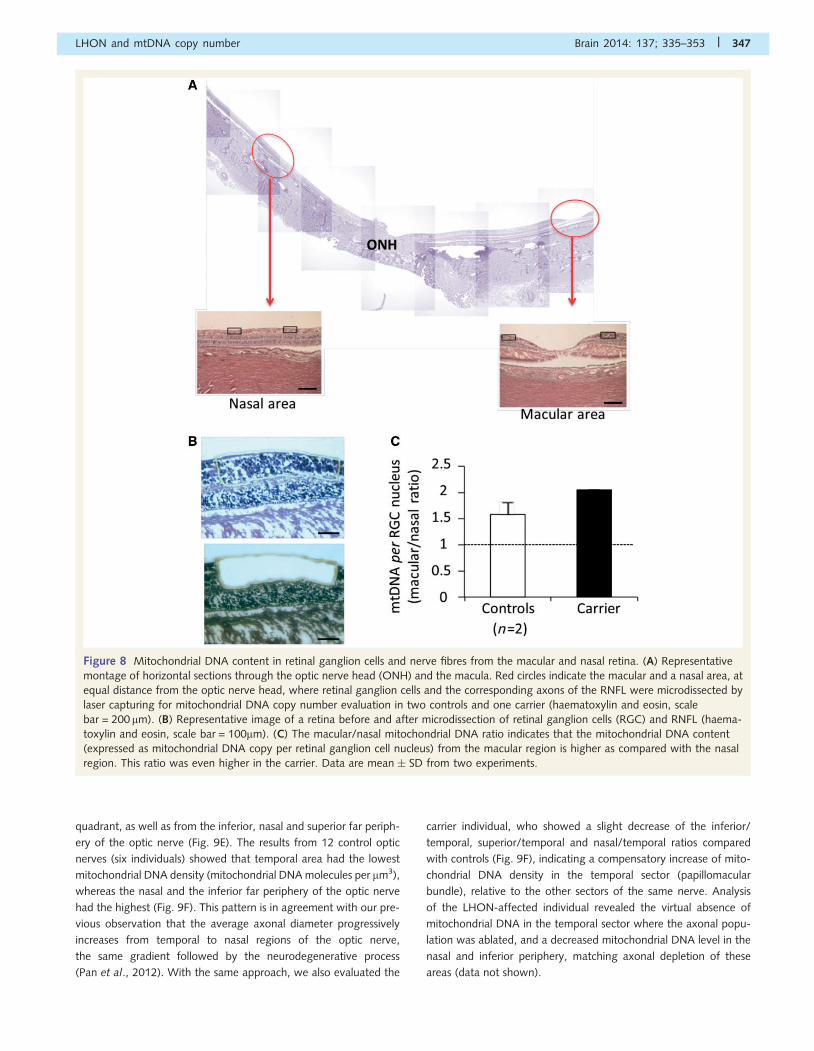
Figure 8 Mitochondrial DNA content in retinal ganglion cells and nerve fibres from the macular and nasal retina. (A) Representative
montage of horizontal sections through the optic nerve head (ONH) and the macula. Red circles indicate the macular and a nasal area, at
equal distance from the optic nerve head, where retinal ganglion cells and the corresponding axons of the RNFL were microdissected by
laser capturing for mitochondrial DNA copy number evaluation in two controls and one carrier (haematoxylin and eosin, scale
bar = 200 mm). (B) Representative image of a retina before and after microdissection of retinal ganglion cells (RGC) and RNFL (haema-
toxylin and eosin, scale bar = 100mm). (C) The macular/nasal mitochondrial DNA ratio indicates that the mitochondrial DNA content
(expressed as mitochondrial DNA copy per retinal ganglion cell nucleus) from the macular region is higher as compared with the nasal
region. This ratio was even higher in the carrier. Data are mean � SD from two experiments.
LHON and mtDNA copy number Brain 2014: 137; 335–353 | 347
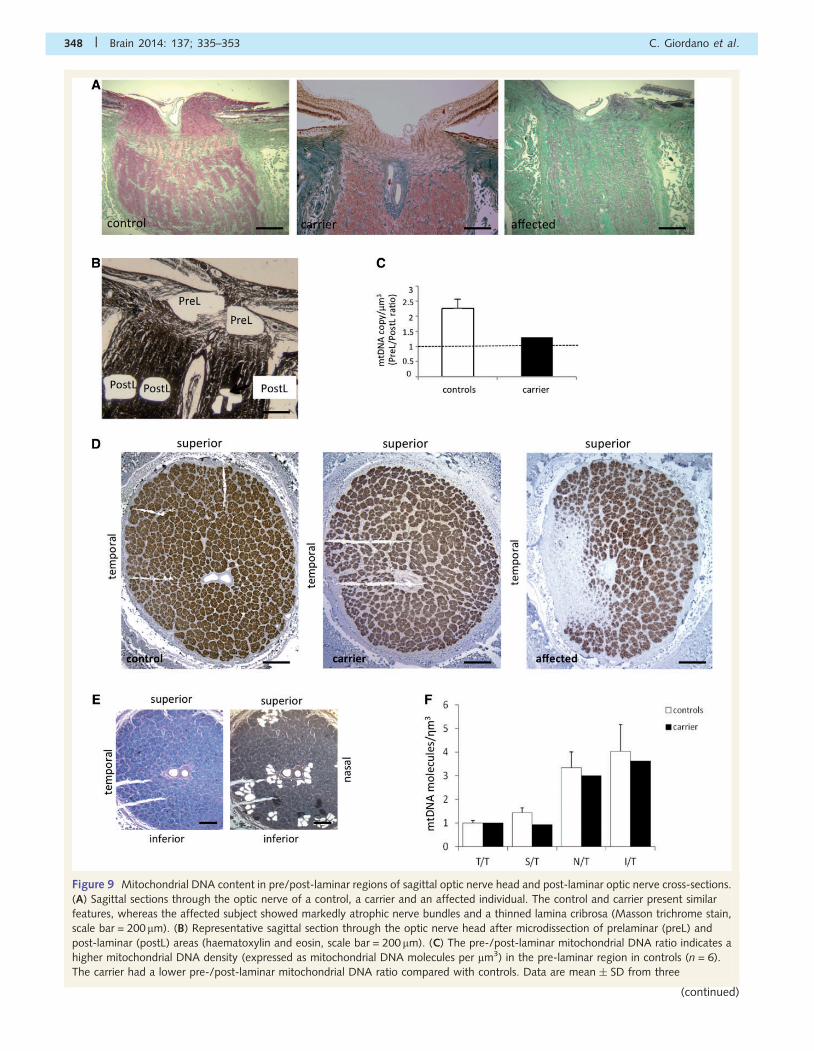
Figure 9 Mitochondrial DNA content in pre/post-laminar regions of sagittal optic nerve head and post-laminar optic nerve cross-sections.
(A) Sagittal sections through the optic nerve of a control, a carrier and an affected individual. The control and carrier present similar
features, whereas the affected subject showed markedly atrophic nerve bundles and a thinned lamina cribrosa (Masson trichrome stain,
scale bar = 200mm). (B) Representative sagittal section through the optic nerve head after microdissection of prelaminar (preL) and
post-laminar (postL) areas (haematoxylin and eosin, scale bar = 200 mm). (C) The pre-/post-laminar mitochondrial DNA ratio indicates a
higher mitochondrial DNA density (expressed as mitochondrial DNA molecules per mm3) in the pre-laminar region in controls (n = 6).
The carrier had a lower pre-/post-laminar mitochondrial DNA ratio compared with controls. Data are mean � SD from three
348 | Brain 2014: 137; 335–353 C. Giordano et al.
(continued)
Mitochondrial genetic variability is nota modifying factor of mitochondrialDNA copy numberMultiple reports indicate that specific mitochondrial DNA hap-
logroup-specific polymorphic changes might influence the abun-
dance of mitochondrial genomes in cells by modulating respiratory
chain coupling and reactive oxygen species production (Moreno-
Loshuertos et al., 2006; Curran et al., 2007; Suissa et al., 2009;
Liou et al., 2010; Gomez-Duran et al., 2012). In particular, hap-
logroup J and the m.16189T4C/MT-DLOOP variant that gener-
ates a heteroplasmic uninterrupted polycytosines (poly-C) tract of
variable length (Bendall and Sykes, 1995), have been proposed to
affect the mitochondrial DNA transcription and replication rates,
eventually reflecting on the mitochondrial DNA content (Suissa
et al., 2009; Liou et al., 2010).
Thus, we analysed the distribution of mitochondrial DNA
content of affected individuals and carriers from the Italian
cohort stratified by haplogroup affiliation and presence of the
m.16189T4C variant. We failed to observe any significant hap-
logroup-driven difference, or trend, in mitochondrial DNA copy
number (Supplementary Fig. 6). Moreover, none of the analysed
samples presented the m.16189T4C polymorphism, indicating
that the mitochondrial DNA content variability in our cohort was
not determined by this nucleotide change (data not shown).
Searching for nuclear modifiers:analysis of five candidate genesThese results strongly support a role for mitochondrial biogenesis
in modulating LHON penetrance. Thus, we sought to investigate
candidate modifiers in some of the genes regulating mitochondrial
DNA replication and biogenesis. We selected SNPs already
reported in the literature as associated with diseases or having a
functional activity. We screened nine SNPs in the coding region of
PPARGC1A (PGC-1�), PPARGC1B (PGC-1b), TP53 (p53), TFAM
and PARL (Supplementary Table 1). PGC-1� and PGC-1b are
transcriptional co-activators involved upstream of NRF1, and
TFAM, regarded as master regulators of mitochondrial biogenesis
(Scarpulla, 2008). p53 is a tumour suppressor protein mainly
involved in the DNA repair system, also implicated in the regula-
tion of mitochondrial DNA replication by interacting with POLG
(Achanta et al., 2005). TFAM, the main mitochondrial DNA
transcription factor, is the most abundant nucleoid protein and
regulates mitochondrial DNA replication (Campbell et al., 2012).
Finally, PARL is a mitochondrial protease, which cleaves, among
others, OPA1 and PINK1, genes responsible for dominant optic
atrophy and familial Parkinson’s disease (Martinelli and Rugarli,
2010). A recent report implicated a specific PARL SNP in regulat-
ing mitochondrial DNA copy number in a control population
(Curran et al., 2010), and linkage analysis in Asian LHON pedi-
grees found a significant association with other PARL SNPs
(Phasukkijwatana et al., 2010). Thus, we screened these genetic
variants in the large Family 1, in the cohort of 39 Italian families
and in a further, independently collected, LHON cohort from
Northern Europe. The affected and carrier individuals were com-
pared, considering genotypes (homo/heterozygous) and allelic fre-
quencies. We also searched for a correlation between genotypes
and mitochondrial DNA content and a multiple logistic regression
of all SNPs was performed.
None of the genotypes, or the allelic frequencies showed a stat-
istical difference between the two groups of affected and carriers
(Supplementary Table 1). Interestingly, we found a significant
correlation between two SNPs in the promoter of PARL gene
(rs3792588 and rs3792589) and the mitochondrial DNA cellular
content of affected individuals belonging to the large Family 1
(Supplementary Fig. 7), but not in the affected individuals of the
Italian cohort (data not shown).
DiscussionWe have demonstrated, using different approaches, that mito-
chondrial DNA content and mitochondrial biogenesis are asso-
ciated with incomplete penetrance in homoplasmic LHON
families. First, we showed that high mitochondrial DNA content
and increased mitochondrial biogenesis, both in high turnover
tissue such as peripheral white blood cells and in post-mitotic
tissue such as skeletal muscle, are significantly associated with
unaffected LHON mutation carriers. In blood cells, a threshold
of �500 mitochondrial DNA copies discriminates the probability
of an individual carrying the LHON mutation to remain unaffected
or undergo clinical conversion to optic atrophy. Furthermore, in
carriers the mitochondrial DNA blood content was inversely corre-
lated with the occurrence of subclinical pathological features such
as fundus abnormalities and contrast/sensitivity losses, and with
structural abnormalities as measurements by optical coherence
tomography. We further demonstrated that fibroblasts derived
from LHON carriers, grown under the metabolic pressure of
galactose medium or after ethidium bromide-driven
mitochondrial DNA depletion, activate mitochondrial biogenesis
Figure 9 Continuedexperiments.(D) Post-laminar optic nerve cross-sections of a control, a carrier and an affected individual. The control and carrier displayed
organized bundles of axons. The affected subject showed extensive gliosis of the temporal region and a relative sparing of axons in the
other quadrants (anti-neurofilament antibody, scale bar = 500 mm). (E) Representative post-laminar optic nerve-cross section before and
after microdissection of bundles of axons in the temporal (T, double nick) inferior (I), nasal (N) and superior (S, single nick) quadrants
(Luxol Fast Blue, scale bar = 500mm). (F) The superior/temporal, inferior/temporal and nasal/temporal mitochondrial DNA ratio indicate a
lower mitochondrial DNA density in the temporal area, both in controls (n = 6) and the carrier. In the carrier these ratios were slightly lower
compared with controls, suggesting a compensatory mitochondrial DNA increase in the temporal quadrant. Data are mean � SD from
three experiments.
LHON and mtDNA copy number Brain 2014: 137; 335–353 | 349
and mitochondrial DNA replication more efficiently compared with
those from affected individuals. Finally, our results on post-
mortem specimens indicate that the pattern of neurodegeneration
in the optic nerve is inversely related to the axonal mitochondrial
DNA density, which in turn matches the axonal diameter (Sadun
et al., 2000; Pan et al., 2012). Thus, the small fibres that consti-
tute the papillomacular bundle, the first target in LHON, by virtue
of their high surface/volume ratio are limited in their capacity for
compensation and this explains their high vulnerability (Sadun
et al., 2000; Pan et al., 2012). In addition, in a single carrier,
concordant results from the optic nerve and retinal sections sug-
gest the occurrence of a compensatory increase in mitochondrial
DNA amount in the most vulnerable macular retinal ganglion cells
and their axons that form the papillomacular bundle, which runs
into the temporal optic nerve head. These results lend support to
the hypothesis that carrier individuals are more likely to achieve,
by genetic variation, a highly efficient mitochondrial biogenesis.
This genetic modifying background may further interact with en-
vironmental (Sadun et al., 2003; Carelli et al., 2004) and hormo-
nal factors (Giordano et al., 2011), ultimately determining the
outcome of an LHON carrier in becoming affected. We tested
the possibility that genetic variants in mitochondrial DNA itself
or in the nuclear-encoded molecular machinery controlling mito-
chondrial DNA replication and mitochondrial biogenesis, may play
a modifying role leading to incomplete penetrance in LHON; we
evaluated mitochondrial DNA haplogroups and screened a few
candidate SNPs of interest in nuclear genes, without finding any
significant association in this pilot study. Overall, we have estab-
lished a solid correlation between incomplete penetrance in LHON
and the efficiency of mitochondrial biogenesis. This observation
may broadly apply to other mitochondrial DNA mutations with a
weak pathogenic potential.
LHON pathogenic mutations invariably affect complex I with
different biochemical phenotypic consequences (Carelli et al.,
2004; Newman, 2005). The m.3460G4A mutation consistently
decreases the complex I specific activity by affecting the
ND1 subunit and the quinone binding site, whereas the
m.11778G4A and m.14484T4C mutations, affecting the ND4
and ND6 subunits, respectively, do not decrease complex I activ-
ity, but most probably interfere with proton translocation and
complex I-dependent energy conservation (Carelli et al., 2004;
Gonzalez-Halphen et al., 2011). All three LHON primary muta-
tions ultimately decrease complex I-driven ATP synthesis rate, and
in addition, chronically increase reactive oxygen species production
and predispose cells to apoptosis (Vergani et al., 1995; Ghelli
et al., 2003; Baracca et al., 2005; Floreani et al., 2005).
Different views have emphasized the bioenergetic defect as most
important or, conversely, hypothesized that the critical problem
resided in increased reactive oxygen species production. Recent
data, obtained by studying the first faithful mouse model of
LHON, added weight to oxidative stress as the critical pathogenic
mechanism for retinal ganglion cells neurodegeneration (Lin et al.,
2012). However, increased reactive oxygen species production, in
addition to damaging cells, may also signal mitochondrial biogen-
esis and mitochondrial DNA content (Moreno-Loshuertos et al.,
2006). This signalling system, originating from dysfunctional mito-
chondria, may activate an orchestrated response with different
efficiencies based on genetic variation in the complex genetic ma-
chinery involved in mitochondrial biogenesis and mitochondrial
DNA replication (Liu and Butow, 2006). Thus, increased mitochon-
drial biogenesis may be a compensatory response that, if suffi-
ciently efficient, maintains unaffected the mutation carriers
(Korsten et al., 2010), even if we cannot completely exclude
other factors differentiating carriers and affected, such as mito-
phagy rate and mitochondrial turnover.
Given the overall weak pathogenic potential of LHON muta-
tions, we envisage a scenario where increased mitochondrial
mass supports the bypassing of complex I, through complex II
and downstream complexes III and IV, which are all unaffected
by the LHON mutations. This and the parallel increase of antioxi-
dant enzymes such as manganese superoxide dismutase and
glutathione peroxidase, as we also documented after oestrogen
exposure of LHON cybrids (Giordano et al., 2011), may coordi-
nately balance the complex I dysfunction and maintain unaffected
the carriers. If this compensatory mechanism fails, the increased
reactive oxygen species production may synergize with deficient
bioenergetics, ultimately leading to retinal ganglion cell loss, thus
converting mutation carriers to affected status.
Our current results closely resemble those recently reported for
an incompletely penetrant mitochondrial DNA mutation affecting
the transfer RNA isoleucine gene (Moreno-Loshuertos et al.,
2011). Furthermore, seminal cybrid studies by Bentlage and
Attardi (1996) highlighted the role played by mitochondrial DNA
content in modulating the pathogenic potential of the
m.3243A4G/MT-TL1 mutation associated with mitochondrial
encephalopathy, lactic acidosis, stroke-like syndrome (MELAS).
Similarly, most homoplasmic cybrids carrying the deafness-asso-
ciated mitochondrial DNA mutation at position m.7473insC/MT-
TS1 displayed only a mild respiratory defect, with the exception of
one clone with a reduced mitochondrial DNA content that
expressed severe growth impairment in galactose medium
(Toompuu et al., 1999).
Two further observations from our study deserve comment.
First, the m.14484C4T/MT-ND6 mutation had a lower average
peak of mitochondrial DNA content in blood cells for carriers. This
is compatible with the milder nature of this mutation, prone to low
penetrance in females and high rates of spontaneous recovery of
vision (Carelli et al., 2004; Newman, 2005). Second, the only
female who converted to become affected in Family 1 had a
supra-threshold mitochondrial DNA content (621 copies) in her
blood cells, but she became affected after her menopause, and
9 years after her blood was sampled. We postulate a post-meno-
pausal decrease in mitochondrial DNA content triggered her con-
version to affected, in accordance with the protective role of
oestrogens in LHON. In fact, we have recently shown in cybrid
cells that oestrogens activate mitochondrial biogenesis and mito-
chondrial DNA content (Giordano et al., 2011), a result both com-
patible with these present observations and the low penetrance of
LHON in females.
One important implication of these findings is that the assess-
ment of mitochondrial DNA cellular content may, once solidly
validated by quantitative studies in different tissues, become a
surrogate biomarker with predictive value on metabolic compen-
sation of unaffected mutation carriers; this would be in
350 | Brain 2014: 137; 335–353 C. Giordano et al.
conjunction with other clinical and metabolic markers. The com-
bination of predictive markers may lead to a scoring system useful
in the assessment of prognosis and therapeutic options. Validation
of the current results, by dissecting the molecular mechanism
underlying the retrograde signalling that regulates mitochondrial
biogenesis and the understanding of genetic determinants driving
the efficiency of mitochondrial biogenesis, will also be advanta-
geous to exploit this spontaneous compensatory strategy for
therapeutic interventions. In fact, several studies are testing the
feasibility of this approach, which in the case of LHON may allow
unaffected carriers to avoid conversion indefinitely.
Our targeted approach of screening selected variants in candi-
date genes did not lead to positive results. We failed to confirm
the association with the previously reported SNPs in the PARL
gene, which were attractive candidates considering the proposed
role played by this protease in controlling mitochondrial DNA copy
number (Curran et al., 2010). Similarly, we failed to observe any
stringent association with mitochondrial DNA haplogroups or spe-
cific variants (Moreno-Loshuertos et al., 2006; Curran et al., 2007;
Suissa et al., 2009; Liou et al., 2010; Gomez-Duran et al., 2012).
However, currently available high-throughput strategies of genetic
screening, as well as expression studies in relevant tissues, using
large cohorts of patients or informative pedigrees, increase the
probability of successfully identifying the genetic basis of incom-
plete penetrance in LHON. It must be considered that a complex
interaction of genetic variants with environmental factors, already
validated as triggers for LHON, may further complicate their
identification.
In conclusion, we provide multiple lines of evidence that cellular
mitochondrial DNA content can differentiate the LHON affected
individuals from the unaffected mutation carriers. This observation
supports a mechanism in which penetrance is modulated by the
ability to efficiently activate mitochondrial biogenesis. This is a
natural compensatory strategy that cells from carriers successfully
use. This mechanism has wide implications for the pathogenesis of
LHON, providing indications for hunting the nuclear genetic modi-
fiers and studying their possible interaction with environmental
triggers. Ultimately, this compensatory strategy may be exploited
for new therapies in LHON carriers to maintain their visual func-
tion indefinitely.
AcknowledgementsWe thank Mariangela Sebastiani for her excellent technical assist-
ance. We also thank the LHON-Brazil project team, who provided
over the years the logistics and all the hard work with the patients
from the SOA-BR family. We also thank all the patients with
LHON and their families who participated to this study.
FundingThis work was supported by Telethon Grants GGP06233 (to
G.d.A., P.M. and V.C.), GGP11182 (to V.C. and P.M.), and
GPP10005 (to M.Z. and V.C.), as well as by Associazione
Serena Talarico per i giovani nel mondo and Fondazione
Giuseppe Tomasello O.N.L.U.S. (to C.G.), Mitocon Onlus (grant
to C.G. and V.C.), Research to Prevent Blindness, the International
Foundation for Optic Nerve Diseases (IFOND), Struggling Within
Leber’s, The Poincenot Family, the Eierman Foundation, and a
National Eye Institute grant EY03040 (F. N. R.-C and A. A. S.).
Supplementary materialSupplementary material is available at Brain online.
ReferencesAchanta G, Sasaki R, Feng L, Carew JS, Lu W, Pelicano H, et al. Novel
role of p53 in maintaining mitochondrial genetic stability through
interaction with DNA Pol gamma. EMBO J 2005; 24: 3482–92.Andrews RM, Griffiths PG, Johnson MA, Turnbull DM. Histochemical
localisation of mitochondrial enzyme activity in human optic nerve
and retina. Br J Ophthalmol 1999; 83: 231–5.
Baracca A, Solaini G, Sgarbi G, Lenaz G, Baruzzi A, Schapira AH, et al.
Severe impairment of complex I-driven adenosine triphosphate synthe-
sis in leber hereditary optic neuropathy cybrids. Arch Neurol 2005; 62:
730–6.
Barboni P, Carbonelli M, Savini G, Ramos Cdo V, Carta A, Berezovsky A,
et al. Natural history of Leber’s hereditary optic neuropathy: longitu-
dinal analysis of the retinal nerve fiber layer by optical coherence
tomography. Ophthalmology 2010; 117: 623–7.
Barron MJ, Griffiths P, Turnbull DM, Bates D, Nichols P. The distributions
of mitochondria and sodium channels reflect the specific energy
requirements and conduction properties of the human optic nerve
head. Br J Ophthalmol 2004; 88: 286–90.Bendall KE, Sykes BC. Length heteroplasmy in the first hypervariable
segment of the human mtDNA control region. Am J Hum Genet
1995; 57: 248–56.
Bentlage HA, Attardi G. Relationship of genotype to phenotype in fibro-
blast-derived transmitochondrial cell lines carrying the 3243 mutation
associated with the MELAS encephalomyopathy: shift towards mutant
genotype and role of mtDNA copy number. Hum Mol Genet 1996; 5:
197–205.
Campbell CT, Kolesar JE, Kaufman BA. Mitochondrial transcription factor
A regulates mitochondrial transcription initiation, DNA packaging, and
genome copy number. Biochim Biophys Acta 2012; 1819: 921–9.Carelli V, Achilli A, Valentino ML, Rengo C, Semino O, Pala M, et al.
Haplogroup effects and recombination of mitochondrial DNA: novel
clues from the analysis of Leber hereditary optic neuropathy pedigrees.
Am J Hum Genet 2006; 78: 564–74.Carelli V, Giordano C, d’Amati G. Pathogenic expression of homoplasmic
mtDNA mutations needs a complex nuclear-mitochondrial interaction.
Trends Genet 2003; 19: 257–62.
Carelli V, Ross-Cisneros FN, Sadun AA. Mitochondrial dysfunction as a
cause of optic neuropathies. Prog Retin Eye Res 2004; 23: 53–89.Chinnery PF, Johnson MA, Wardell TM, Singh-Kler R, Hayes C,
Brown DT, et al. The epidemiology of pathogenic mitochondrial
DNA mutations. Ann Neurol 2000; 48: 188–93.
Cossarizza A, Riva A, Pinti M, Ammannato S, Fedeli P, Mussini C, et al.
Increased mitochondrial DNA content in peripheral blood lymphocytes
from HIV infected patients with lipodystrophy. Antivir Ther 2003; 8:
51–7.
Curran JE, Johnson MP, Dyer TD, Goring HH, Kent JW, Charlesworth JC,
et al. Genetic determinants of mitochondrial content. Hum Mol Genet
2007; 16: 1504–14.
Curran JE, Jowett JB, Abraham LJ, Diepeveen LA, Elliott KS, Dyer TD,
et al. Genetic variation in PARL influences mitochondrial content. Hum
Genet 2010; 127: 183–90.
LHON and mtDNA copy number Brain 2014: 137; 335–353 | 351
DiMauro S, Schon EA. Mitochondrial respiratory-chain diseases. N Engl J
Med 2003; 356: 809–19.
Floreani M, Napoli E, Martinuzzi A, Pantano G, De Riva V, Trevisan R,
et al. Antioxidant defences in cybrids harboring mtDNA mutations
associated with Leber’s hereditary optic neuropathy. FEBS J 2005;
272: 1124–35.
Ghelli A, Zanna C, Porcelli AM, Schapira AH, Martinuzzi A, Carelli V,
et al. Leber’s hereditary optic neuropathy (LHON) pathogenic muta-
tions induce mitochondrial-dependent apoptotic death in transmito-
chondrial cells incubated with galactose medium. J Biol Chem 2003;
278: 4145–50.Gilbert MT, Haselkorn T, Bunce M, Sanchez JJ, Lucas SB, Jewell LD, et al.
The isolation of nucleic acids from fixed, paraffin-embedded tissues—
which methods are useful when? PLoS One 2007; 2: e537.
Giordano C, d’Amati G. Evaluation of gastrointestinal mtDNA depletion
in mitochondrial neurogastrointestinal encephalomyopathy (MNGIE).
Methods Mol Biol 2011; 755: 223.
Giordano C, Montopoli M, Perli E, Orlandi M, Fantin M, Ross-
Cisneros FN, et al. Oestrogens ameliorate mitochondrial dysfunction
in Leber’s hereditary optic neuropathy. Brain 2011; 134: 220–34.
Gomez-Duran A, Pacheu-Grau D, Martınez-Romero I, Lopez-Gallardo E,
Lopez-Perez MJ, Montoya J, et al. Oxidative phosphorylation differ-
ences between mitochondrial DNA haplogroups modify the risk of
Leber’s hereditary optic neuropathy. Biochim Biophys Acta 2012;
1822: 1216–22.Gonzalez-Halphen D, Ghelli A, Iommarini L, Carelli V, Esposti MD.
Mitochondrial complex I and cell death: a semi-automatic shotgun
model. Cell Death Dis 2011; 2: e222.Guan MX, Fischel-Ghodsian N, Attardi G. Biochemical evidence for
nuclear gene involvement in phenotype of non-syndromic deafness
associated with mitochondrial 12S rRNA mutation. Hum Mol Genet
1996; 5: 963–71.
Guan MX, Fischel-Ghodsian N, Attardi G. Nuclear background deter-
mines biochemical phenotype in the deafness-associated mitochondrial
12S rRNA mutation. Hum Mol Genet 2001; 10: 573–580.
Howell N, Mackey DA. Low-penetrance branches in matrilinear pedi-
grees with Leber hereditary optic neuropathy. Am J Hum Genet
1998; 63: 1220–24.
Hudson G, Keers S, Yu Wai Man P, Griffiths P, Huoponen K,
Savontaus ML, et al. Identification of an X-chromosomal locus and
haplotype modulating the phenotype of a mitochondrial DNA disorder.
Am J Hum Genet 2005; 77: 1086–91.
Iommarini L, Maresca A, Caporali L, Valentino ML, Liguori R,
Giordano C, et al. Revisiting the issue of mitochondrial DNA content
in optic mitochondriopathies. Neurology 2012; 79: 1517–19.Ji Y, Jia X, Li S, Xiao X, Guo X, Zhang Q. Evaluation of the X-linked
modifier loci for Leber hereditary optic neuropathy with the G11778A
mutation in Chinese. Mol Vis 2010; 16: 416–24.Korsten A, de Coo IF, Spruijt L, de Wit LE, Smeets HJ, Sluiter W. Patients
with Leber hereditary optic neuropathy fail to compensate impaired
oxidative phosphorylation. Biochim Biophys Acta 2010; 1797:
197–203.
La Morgia C, Ross-Cisneros FN, Sadun AA, Hannibal J, Munarini A,
Mantovani V, et al. Melanopsin retinal ganglion cells are resistant to
neurodegeneration in mitochondrial optic neuropathies. Brain 2010;
133: 2426–38.
Larsson NG, Andersen O, Holme E, Oldfors A, Wahlstrom J. Leber’s
hereditary optic neuropathy and complex I deficiency in muscle. Ann
Neurol 1991; 30: 701–8.
Lin CS, Sharpley MS, Fan W, Waymire KG, Sadun AA, Carelli V, et al.
Mouse mtDNA mutant model of Leber hereditary optic neuropathy.
Proc Natl Acad Sci USA 2012; 109: 20065–70.
Liou CW, Lin TK, Chen JB, Tiao MM, Weng SW, Chen SD, et al.
Association between a common mitochondrial DNA D-loop polycyto-
sine variant and alteration of mitochondrial copy number in human
peripheral blood cells. J Med Genet 2010; 47: 723–8.
Liu Z, Butow RA. Mitochondrial retrograde signaling. Annu Rev Genet
2006; 40: 159–85.
Mackey DA, Fingert JH, Luzhansky JZ, McCluskey PJ, Howell N, Hall AJ,
et al. Leber’s hereditary optic neuropathy triggered by antiretroviral
therapy for human immunodeficiency virus. Eye 2003; 17: 312–17.
Martinelli P, Rugarli EI. Emerging roles of mitochondrial proteases in
neurodegeneration. Biochim Biophys Acta 2010; 1797: 1–10.
Moreno-Loshuertos R, Acın-Perez R, Fernandez-Silva P, Movilla N,
Perez-Martos A, Rodriguez de Cordoba S, et al. Differences in reactive
oxygen species production explain the phenotypes associated with
common mouse mitochondrial DNA variants. Nat Genet 2006; 38:
1261–8.
Moreno-Loshuertos R, Ferrın G, Acın-Perez R, Gallardo ME, Viscomi C,
Perez-Martos A, et al. Evolution meets disease: penetrance and func-
tional epistasis of mitochondrial tRNA mutations. PLoS Genet 2011; 7:
e1001379.Newman NJ. Hereditary optic neuropathies. In: Miller NR, Newman NJ,
Biousse V, Kerrison JB, editors. Walsh & Hoyt’s Clinical Neuro-
Ophthalmology. Philadelphia: Lippincott Williams & Williams; 2005.
p. 465–501.Nishioka T, Soemantri A, Ishida T. mtDNA/nDNA ratio in 14484 LHON
mitochondrial mutation carriers. J Hum Genet 2004; 49: 701–5.Pan BX, Ross-Cisneros FN, Carelli V, Rue KS, Salomao SR, Moraes-
Filho MN, et al. Mathematically modeling the involvement of axons
in Leber’s hereditary optic neuropathy. Invest Ophthalmol Vis Sci
2012; 53: 7608–17.
Phasukkijwatana N, Kunhapan B, Stankovich J, Chuenkongkaew WL,
Thomson R, Thornton T, et al. Genome-wide linkage scan and asso-
ciation study of PARL to the expression of LHON families in Thailand.
Hum Genet 2010; 128: 39–49.
Ramos Cdo V, Bellusci C, Savini G, Carbonelli M, Berezovsky A,
Tamaki C, et al. Association of optic disc size with development and
prognosis of Leber’s hereditary optic neuropathy. Invest Ophthalmol
Vis Sci 2009; 50: 1666–74.
Robinson BH, Petrova-Benedict R, Buncic JR, Wallace DC. Nonviability of
cells with oxidative defects in galactose medium: a screening test for
affected patient fibroblasts. Biochem Med Metab Biol 1992; 48:
122–6.
Sadun AA, Carelli V, Salomao SR, Berezovsky A, Quiros PA, Sadun F,
et al. Extensive investigation of a large Brazilian pedigree of 11778/
haplogroup J Leber hereditary optic neuropathy. Am J Ophthalmol
2003; 136: 231–8.Sadun AA, Salomao SR, Berezovsky A, Sadun F, De Negri AM,
Quiros PA, et al. Subclinical carriers and conversions in Leber heredi-
tary optic neuropathy: a prospective psychophysical study. Trans Am
Ophthalmol Soc 2006; 104: 51–61.
Sadun AA, Win PH, Ross-Cisneros FN, Walker SO, Carelli V. Leber’s
hereditary optic neuropathy differentially affects smaller axons in the
optic nerve. Trans Am Ophthalmol Soc 2000; 98: 223–32;discussion
232–5.
Sadun F, De Negri AM, Carelli V, Salomao SR, Berezovsky A, Andrade R,
et al. Ophthalmologic findings in a large pedigree of 11778/
Haplogroup J Leber hereditary optic neuropathy. Am J Ophthalmol
2004; 137: 271–7.
Savini G, Barboni P, Valentino ML, Montagna P, Cortelli P, De
Negri AM, et al. Retinal nerve fiber layer evaluation by optical coher-
ence tomography in unaffected carriers with Leber’s hereditary optic
neuropathy mutations. Ophthalmology 2005; 112: 127–31.Scarpulla RC. Transcriptional paradigms in mammalian mitochondrial bio-
genesis and function. Physiol Rev 2008; 88: 611–38.
Shankar SP, Fingert JH, Carelli V, Valentino ML, King TM, Daiger SP,
et al. Evidence for a novel x-linked modifier locus for leber hereditary
optic neuropathy. Ophthalmic Genet 2008; 29: 17–24.
Stewart JD, Schoeler S, Sitarz KS, Horvath R, Hallmann K, Pyle A, et al.
POLG mutations cause decreased mitochondrial DNA repopulation
rates following induced depletion in human fibroblasts. Biochim
Biophys Acta 2011; 1812: 321–5.Suissa S, Wang Z, Poole J, Wittkopp S, Feder J, Shutt TE, et al. Ancient
mtDNA genetic variants modulate mtDNA transcription and replica-
tion. PLoS Genet 2009; 5: e1000474.
352 | Brain 2014: 137; 335–353 C. Giordano et al.
Toompuu M, Tiranti V, Zeviani M, Jacobs HT. Molecular phenotype ofthe np 7472 deafness-associated mitochondrial mutation in osteosar-
coma cell cybrids. Hum Mol Genet 1999; 8: 2275–83.
Ventura DF, Quiros P, Carelli V, Salomao SR, Gualtieri M, Oliveira AG,
et al. Chromatic and luminance contrast sensitivities in asymptomaticcarriers from a large Brazilian pedigree of 11778 Leber hereditary optic
neuropathy. Invest Ophthalmol Vis Sci 2005; 46: 4809–14.
Vergani L, Martinuzzi A, Carelli V, Cortelli P, Montagna P, Schievano G,
et al. MtDNA mutations associated with Leber’s hereditary optic neur-opathy: studies on cytoplasmic hybrid (cybrid) cells. Biochem Biophys
Res Commun 1995; 210: 880–8.
Wong A, Cavelier L, Collins-Schramm HE, Seldin MF, McGrogan M,Savontaus ML, et al. Differentiation-specific effects of LHON mutations
introduced into neuronal NT2 cells. Hum Mol Genet 2002; 11: 431–8.
Wredenberg A, Wibom R, Wilhelmsson H, Graff C, Wiener HH,
Burden SJ, et al. Increased mitochondrial mass in mitochondrial myop-
athy mice. Proc Natl Acad Sci USA 2002; 99: 15066–71.
Yen MY, Chen CS, Wang AG, Wei YH. Increase of mitochondrial DNA in
blood cells of patients with Leber’s hereditary optic neuropathy with
11778 mutation. Br J Ophthalmol 2002; 86: 1027–30.
Yen MY, Lee HC, Liu JH, Wei YH. Compensatory elevation of complex II
activity in Leber’s hereditary optic neuropathy. Br J Ophthalmol 1996;
80: 78–81.
Zhang AM, Jia X, Zhang Q, Yao YG. No association between the SNPs
(rs3749446 and rs1402000) in the PARL gene and LHON in Chinese
patients with m.11778G4A. Hum Genet 2010; 128: 465–8.
LHON and mtDNA copy number Brain 2014: 137; 335–353 | 353