brands take a stand - edelman.com · 2 edelman earned brand 2015 innovation and the earned brand...
TRANSCRIPT

BRANDS TAKE A STAND
2018 Edelman Earned Brand
October 2018
#EarnedBrand

2
Edelman Earned Brand
Innovation and the Earned Brand2015
The Consumer-Brand Relationship2016
The Rise of the Belief-Driven Buyer2017
Brands Take a Stand2018

3
Margin of error
8-market average online survey data +/- 1.1% (N=8,000)Market-specific online survey data +/- 3.1% (N=1,000)
8-market average mobile survey data +/- 0.6% (N=32,000)Market-specific mobile survey data +/- 1.6% (N=4,000)
2018 Edelman Earned Brand
8 MarketsBrazil, China, France, Germany, India, Japan, the U.K. and the U.S.All data is nationally representative based on age, region and gender
A study of how brands can
earn, strengthen and protect consumer-brand
relationships
Online Survey• Belief-driven buying and general
attitudes toward brands• Relationships with 48 brands • Reactions to two communications
from each of 16 brands
Mobile Survey• Signal-contingent measurement of
reactions to specific brand communications
• Respondents were asked to describe their experience with the next brand communication they noticed naturally
8,000 respondents (1,000 per market)
Fieldwork: July 10 – July 20, 2018
32,000 respondents (4,000 per market)
Fieldwork: June 29 – July 24, 2018

Business%Trust 57 48 43 43 42 74 44 74cccccccc
4
Business Expect to Lead
Source: 2018 Edelman Trust Barometer. COM_MCL. When looking for general news and information, how much would you trust each type of source for general news and information? Please use a nine-point scale where one means that you “do not trust it at all” and nine means that you “trust it a great deal.” 9-point scale; top 4 box, trust, question asked of half of the sample. TRU_INS. Below is a list of institutions. For each one, please indicate how much you trust that institution to do what is right using a nine-point scale, where one means that you “do not trust them at all” and nine means that you “trust them a great deal.” 9-point scale; top 4 box, trust. CEO_AGR. Thinking about CEOs, how strongly do you agree or disagree with the following statements? 9-point scale; top 4 box, agree, question asked of half of the sample. General population, 8-market average.
2018 Trust Barometer
24 25 27 28 30
5262 63
U.K.
Fran
ce
Germ
any
Japa
n
U.S.
Braz
il
Chin
a
Indi
a
llllllll-2 -1 -4 +1 -11 -3 +4 -6
Information platforms not trusted
say that CEOs should take the lead on change rather than waiting for government to impose it
64%
Business more trusted than government
Business expected to take initiative on change
Percent trust in social media Gap in trust, business vs. governmentChange, 2017 to 2018 − +0
Government% Trust 18 33 33 36 37 70 43 84
Braz
il
U.S.
Fran
ce
U.K.
Japa
n
Indi
a
Germ
any
Chin
a
********
39
15 10 7 5 4 1
-10
Gap

Source: 2017 Edelman Earned Brand. Belief-driven buying segments. See Technical Appendix for a full explanation of how belief-driven buying was measured. Q17. Please indicate how much you agree or disagree with the following statements. 9-point scale; top 4 box, agree. 14-market average, among belief-driven buyers.
5
2017: The Rise of the Belief-Driven Buyer
They choose, switch, avoid or boycott a brand based on its stand on societal issues
people are
1 2 67inbelief-driven buyers
%because of its position on a controversial issue
bought a brand for the first time
Of belief-driven buyers,
65% a brand because it stayed silent on an issue it had an obligation to address
will not buy

Some Brands Go All In
Benetton and Act Up Paris,1993 Nike, 2018

7
take a stand?Should your brand

88
A World ofBelief-Driven Buying

64Source: 2018 Edelman Earned Brand. Belief-driven buying segments. 8-market average. See Technical Appendix for a full explanation of how belief-driven buying was measured.
9
Do you choose, switch, avoid or boycott a brand based on its stand on societal issues? (Percent in each segment)
Nearly 2 in 3 Now Belief-Driven Buyers
SPECTATORSRarely buy on belief or punish brands for taking a stand
LEADERSHave strongly held, passionate beliefs. The brands they buy are one important way they express those beliefs
JOINERSDepending on the issue and the brand, they will change their buying behavior based on the brand’s stand
26 30
2534
4936
2017 2018
13pts+%
BELIEF-DRIVEN BUYERS

Source: 2018 Edelman Earned Brand. Belief-driven buying segments. 8-market average. See Technical Appendix for a full explanation of how belief-driven buying was measured.
10
Percent who are belief-driven buyers, and year-to-year change
Belief-Driven Buying Now Mainstream Around the World
Double-digit growth in 6 of 8 markets
Y-to-Y Change− +0
2017 2018
Majority in Every Market
51
73
56
65
50
3947
37 37
64
78
69 68 6560 59 57 54
8-marketaverage
China Brazil India France Japan U.S. U.K. Germany
+13 +17+20+12+21+15+3+13+5

Source: 2018 Edelman Earned Brand. Belief-driven buying segments. 8-market average, by age. See Technical Appendix for a full explanation of how belief-driven buying was measured.
11
Percent who are belief-driven buyers, and year-to-year change
Belief-Driven MindsetNow Spans Generations
Y-to-Y Change− +0
2017 2018
6053
38
69 67
56
18-34 35-54 55+
+9 +14 +18
Majority at All Ages
More older consumersnow buying on belief

Source: 2018 Edelman Earned Brand. Belief-driven buying segments. 8-market average, by income. See Technical Appendix for a full explanation of how belief-driven buying was measured.
12
Percent who are belief-driven buyers, and year-to-year change
Belief-Driven MindsetNow Spans Income Levels
Y-to-Y Change− +0
2017 2018
More lower- and middle-income consumers now buying on belief
5146
5862 62
69
Low Middle High
+11 +16 +11
Majority at All Incomes
(Bottom 25%) (50%) (Top 25%)

I believe brands can be a powerful force for change.I expect them to represent me and solve societal problems. My wallet is my vote.
Brand DemocracyWelcome to the new

Source: 2018 Edelman Earned Brand. Q17. Please indicate how much you agree or disagree with the following statements. 9-point scale; top 4 box, agree. 8-market average.
14
Percent who agree
People Believe in Brandsas an Effective Force for Change
53Brands have better ideas for solving our country’s problems than government
46Brands can do more to solve social ills than government
% %

Source: 2018 Edelman Earned Brand. Q17. Please indicate how much you agree or disagree with the following statements. 9-point scale; top 4 box, agree. 8-market average.
15
Percent who agree
People Believe Brands Will Answer Their Call
It is easier for people to get brands to address social problems than to get government to take action
%54 73
62 60 5750 49
4337
India Brazil China U.S. U.K. France Germany Japan

1616
The Power ofa Brand’s Stand
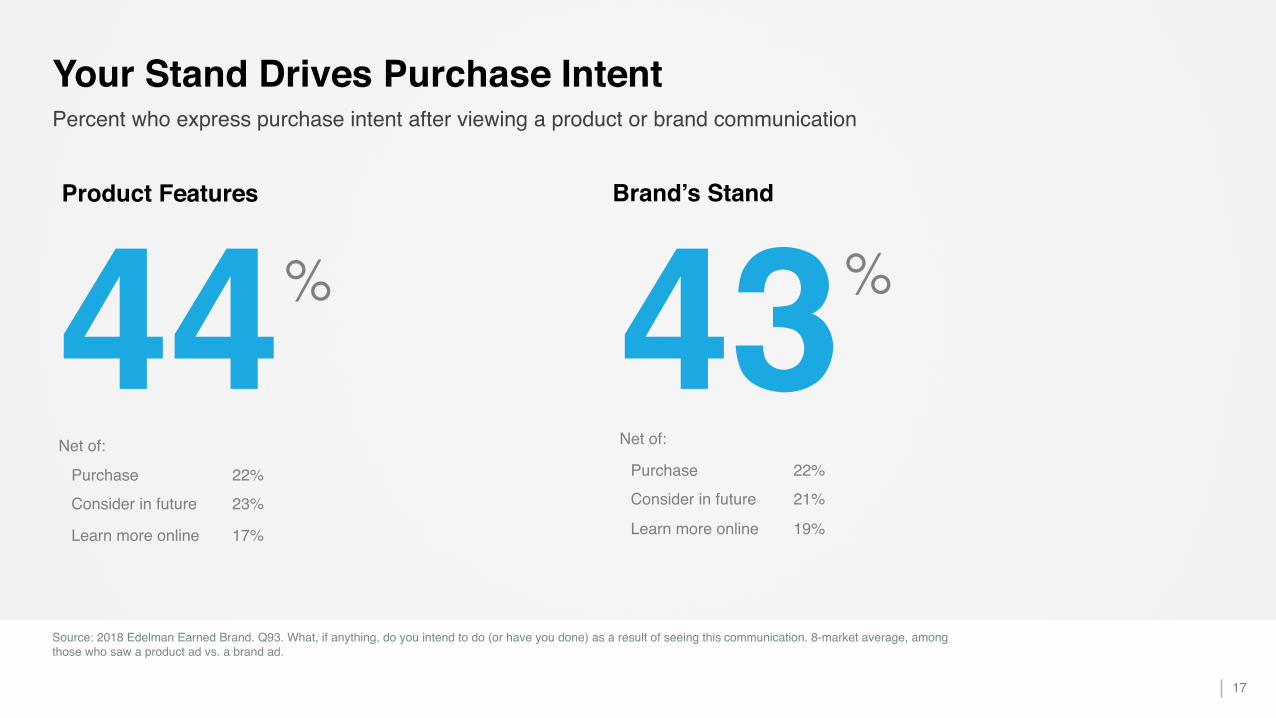
Source: 2018 Edelman Earned Brand. Q93. What, if anything, do you intend to do (or have you done) as a result of seeing this communication. 8-market average, among those who saw a product ad vs. a brand ad.
17
Percent who express purchase intent after viewing a product or brand communication
Your Stand Drives Purchase Intent
Product Features
44% 43%Brand’s Stand
Purchase 22%
Consider in future 23%
Learn more online 17%
Purchase 22%
Consider in future 21%
Learn more online 19%
Net of: Net of:

Source: 2018 Edelman Earned Brand. Q93. What, if anything, do you intend to do (or have you done) as a result of seeing this communication. 8-market average, among those who saw a product ad vs. a brand ad.
18
Percent who express intent to advocate for the brand after viewing a product or brand communication
Your Stand Gets People Talking
3226% %
Talk to friends or family 19%
Post online, like or reply to the brand
12%
Talk to friends or family 24%
Post online, like or reply to the brand
15%
Net of: Net of:
Product Features Brand’s Stand

Your Stand Matters to ThemEven at the Point of Sale
Source: 2018 Edelman Earned Brand. Q17. Please indicate how much you agree or disagree with the following statements. 9-point scale; top 4 box, agree. 8-market average.
19
Percent who agree
Brands should make it easier for me to see what their values and positions on important issues are when I am about to make a purchase
%60 79
69 68
56 56 55 5248
India Brazil China France U.K. U.S. Japan Germany

Source: 2018 Edelman Earned Brand. Q70. Please indicate how much you agree or disagree with the following statements. 9-point scale; top 4 box, agree. 8-market average.
20
You’re Not ReallyReaching ThemPercent who agree
%
Marketers spend too much time looking for ways to force me to pay attention to their messages and not enough time thinking of ways to make me want to pay attention
56 65 64 6358
53 52 5045
U.K. India U.S. France Brazil Germany China Japan

21
How to Take a Stand

22
The Brand Stand Spectrum
PURPOSE
Is your organization living its purpose–every day?
Clearly articulate why your brand exists and make a proactive effort to address that purpose
CULTUREAuthentically connect your stand to a relevant moment in culture
Are you connecting to culture–or just co-opting it?
ACTIVISMConfront a controversial issue that has a direct impact on your stakeholders and/or your brand
Will your stakeholders support your position–and act on it?
Watch-Out Watch-Out Watch-Out
Johnson & Johnson works to end Myopia in children Levi Strauss CEO supports gun control measuresNissan helps communities clean up their beaches

Source: 2018 Edelman Earned Brand: Mobile survey. Q3. When you first encountered the communication, how would you describe the way it got your attention? 8-market average, among the original invite sample. “Engaged Attention” is a net of “It attracted my attention. I noticed it and decided it was worth paying some attention to,” “Someone pointed it out to me. They suggested that I look at or pay attention to it.” and “It was a natural part of a conversation that I was having.”
23
Percent who describe their attention as having been interrupted or engaged by the brand communication they noticed
1. Tell a Compelling StoryInterruption Does Not Break Through
I could not easily ignore or avoid paying attention to it
Someone pointed it out to me, or it was a natural part of a conversation I was having
I noticed it and decided it was worth paying attention to
Interruptedtheir attention
Engagedtheir attention
Mobile Survey of 32,000 Brand Interactions
1 848%
36%
% %6 4

Source: 2018 Edelman Earned Brand: Mobile survey. Q1. What was the communication you just noticed? Q3. When you first encountered the communication, how would you describe the way it got your attention? 8-market average, among the original invite sample who describe their attention as engaged (Q3/1, Q3/3, or Q3/4).
24
Percent who noticed each of the following types of brand communications, among those who describe their attention as engaged
2. Content Matters More Engaged Attention Possible Across Channels
Owned25%
A direct communication from the brand like a tweet or email
An advertisement
Paid29%
A conversation A news story
Social27%
Peers and journalists account for 45% of brand touchpoints
Mobile Survey of 32,000 Brand Interactions
Mainstream Media18%

20
73
90
96
105
120
131
166
Actor
Model
Celebrity
CEO or other executive
Journalist
Company employee
Expert
Customer or regular person
Source: 2018 Edelman Earned Brand: Mobile survey. This data is based on a logistic regression using Q14: Did the communication feature any of the following [spokespeople] to predict brand advocacy behavior Q13: What, if anything, do you intend to do (or have you done) as a result of seeing this communication: Talk positively about the brand with my friends or family OR Post a positive response, like or reply to the communication. The indices represent the increase in likelihood of advocacy attributable to the spokesperson indicated versus not having a spokesperson divided by the average increase in advocacy across all of the spokespeople tested. 8-market average. 25
Relative increase in the likelihood that each type of spokesperson will drive advocacy (regression analysis); data shown as an index
3. Activate Your CommunityPeer, Expert and Employee Voices Earn Advocacy for Your Brand
Index
Mobile Survey of 32,000 Brand Interactions
Spokespeople in messages that were noticed anddrove brand advocacy

26
27
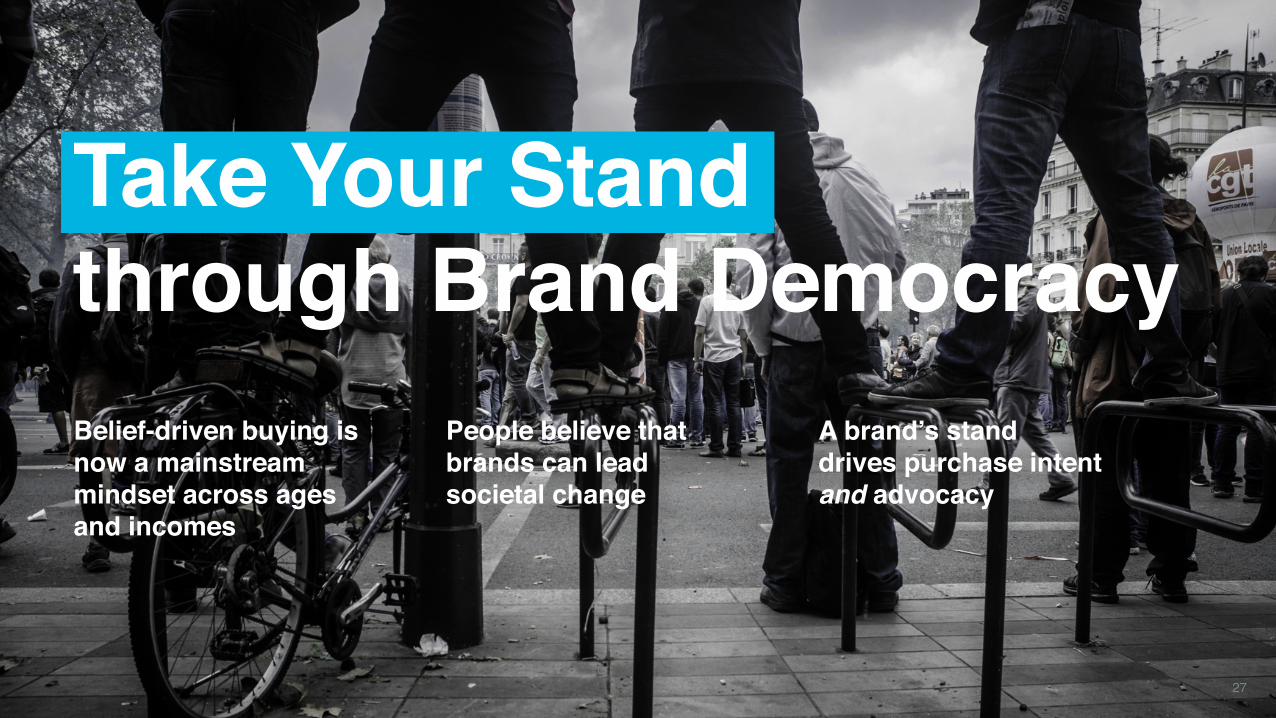
Take Your Stand through Brand DemocracyBelief-driven buying is now a mainstreammindset across ages and incomes
People believe that brands can lead societal change
A brand’s stand drives purchase intent and advocacy

28
TECHNICAL APPENDIX

29
2018 Edelman Earned Brand Sample
8-market average online survey data +/- 1.1% (N=8,000)Market-specific online survey data +/- 3.1% (N=1,000)
COUNTRY INTERNET PENETRATION SAMPLE SIZE LANGUAGES QUOTA PARAMETERS
BRAZIL 66% 1,000 Portuguese Gender, age & region
CHINA 52% 1,000 Simplified Chinese (Mandarin) Gender, age & region
FRANCE 86% 1,000 French Gender, age & region
GERMANY 88% 1,000 German Gender, age & region
INDIA 35% 1,000 English Gender, age & region
JAPAN 91% 1,000 Japanese Gender, age & region
U.K. 93% 1,000 English Gender, age & region & ethnicity
U.S. 88% 1,000 English Gender, age & region & ethnicity

30
How Were Belief-Driven Buyers Identified?
We developed a series of six nine-point questions to measure the extent to which beliefs affect people’s buying behaviors:
We then classified respondents into three segments based on their responses to the above items:
1Even if a company makes the product that I like most, I will not buy it if I disagree with the company’s stand on important social issues
I have bought a brand for the first time for the sole reason that I appreciated its position on a controversial societal or political issue
I have stopped buying one brand and started buying another because I liked the politics of one more than the other
I have strong opinions about many societal and political issues. The brands I choose to buy and not buy are one important way I express those opinionsIf a brand offers the best price on a product, I will buy it even if I disagree with the company’s stand on controversial social or political issues [reversed scored]I have stopped buying a brand solely because it remained silent on a controversial societal or political issue that I believed it had an obligation to publicly address
LEADERS JOINERS SPECTATORS
Have strongly-held, passionate beliefs. The brands they buy are one important way they express those beliefs.
Depending on the issue and the brand, they will change their buying behavior based on the brand’s stand.
Rarely buy on belief or punish brands that take a stand.
1
2
3
4
5
6

31
The Edelman Brand Relationship Index
A strong consumer-brand relationship is a form of brand equity that is of increasing importance in today’s unpredictable and exacting marketplace. It is directly tied to the reliable tendency of a brand’s customer base to be the first to buy its new product innovations, advocate for it among their peers, defend it against critics and remain loyal to it even when there are potentially good reasons to switch. These behaviors protect a brand from marketplace disruptions and give it permission to introduce new disruptions of its own.
The Edelman Brand Relationship Index is uniquely designed to quantify how interwoven a brand is into a person’s life. The more points of attachment there are between a brand and a customer, the more vital, resilient and valuable that relationship is for both parties.
The Seven Dimensions of the Consumer-Brand Relationship
The Brand Relationship Index is a composite measure of the depth and quality of the bond a consumer has with a brand across seven distinct dimensions that constitute the fundamental building blocks of consumer-brand relationships.
EMBODIES UNIQUE CHARACTER
MAKES ITS MARK
TELLS A MEMORABLE STORY
LISTENS OPENLY, RESPONDS SELECTIVELY
INSPIRES SHARING, INVITES PARTNERSHIP
BUILDS TRUST AT EVERY TOUCHPOINT
ACTS WITH PURPOSE
11
2
3
4
5
6
7
INDIFFERENT INTERESTED INVOLVED INVESTED COMMITTED
0-6 7-26 24-43 44-69 70-100
“I may buy and use your product or service, but I don’t really put much thought into it”
“I know a little about your product. I am making an educated choice”
“Given a choice, I would pick your brand; I appreciate what you stand for”
“We share common values and see the world in a similar way”
“We do things together and for each other; we share a past and a future”
The Edelman Brand Relationship Index measures the strength of the consumer-brand relationship along a continuum

2018 Edelman Earned Brand Team
Edelman Intellectual Property
Executive Director Tonia E. [email protected]
Executive Advisors Michelle HuttonAmanda GlasgowNick LucidoCarol PotterRichard Wergan
Executive Editor Joseph Tropiano
Sr. Project Manager Kisha R. Stokes
Project Manager Alina Krikunova
Edelman Intelligence
Head of Thought Leadership Research David M. Bersoff, [email protected]
Director of Operations Sarah Adkins
Research Manager Cody Armstrong
Research Coordinator Nick Maxwell
Assoc. Research Coordinators Giuseppe BovenziAbbey Fox
Assoc. Data Processor John Zamites
32