brasil telecom participações s.a. -...
TRANSCRIPT
January 23, 2009
Valuation Report
Brasil Telecom Participações S.A.
IMPORTANT DISCLAIMER: This document is a free translation only. Due to the complexities of language translation, translations are not always precise. The original document was prepared in Portuguese and in case of any divergence, discrepancy or difference between this version and the Portuguese version, the Portuguese version shall prevail. The Portuguese version is the only valid and complete version and shall prevail for any and all purposes. The Translation was made by persons whose native language is not English, therefore there is no warranty as to the accuracy, reliability or completeness of any information translated and no one should rely on the accuracy, reliability or completeness of such information. There is no assurance as to the accuracy, reliability or completeness of the translation. Any person reading this translation and relying on it should do so at his or her own risk.
1
Disclaimer
This valuation report is for informational purposes only and is not an offer to purchase or the solicitation of an offer to sell any shares of Brasil Telecom Participações S.A. (“BRP"). The tender offer for the outstanding common shares of BRP referred to in this valuation report has not commenced.
Any offer to purchase or solicitation of an offer to sell any common shares of BRP from any person resident in the United States will be made only pursuant to an offer to purchase and related materials that Telemar Norte Leste S.A. ("Telemar") intends to file with the U.S. Securities and Exchange Commission (the "Commission") upon commencement of the tender offer.
Holders of common shares of BRP should read carefully the offer to purchase and the other documents relating to the tender offer when they become available and prior to making any decisions with respect to the tender offer because these documents will contain important information about the tender offer, including the terms and conditions of the tender offer.
Following the filing with the Commission of the offer to purchase and the other documents relating to the tender offer, holders of common shares of BRP will be able to obtain the filed documents free of charge at the Commission's website at www.sec.gov or from Telemar.

\\C
SA
O11
P20
011A
\dep
to\I
NV
ES
T\_M
&A
\ID
EIA
S\B
rasi
l_Te
leco
m\C
ontin
ent\
Laud
os_M
aste
r\La
udo_
OP
A_O
brig
atór
ia\B
RP
\SE
C\3
a_po
s_co
mm
ents
\Lau
do_B
RP
_OP
A_O
brig
atór
ia_E
ng_v
05.p
pt
2
Summary
1. Executive summary 3
2. Information about the evaluator 8
3. Market and company description 15
4. Valuation of Brasil Telecom Participações 18
4.1. Financial and operational highlights 19
4.2. Economic value based on market multiples of comparable companies methodology 23
4.3. Book value of the shareholders’ equity 30
4.4. Weighted average price of the shares on the BOVESPA 32
Appendix A. Analysis of the historical spreads between ON and PN shares 36
Appendix B. Valuation criterion 39
Appendix C. Calculation of the NPV of holding expenses 41
Appendix D. Terms and definitions used in the valuation report 45
Appendix E. Additional information and disclaimers 47

3
1. Executive summary

4
Banco de Investimentos Credit Suisse (Brasil) S.A. (“Credit Suisse” or “CS”) has been retained by Telemar Norte Leste S.A. (“Telemar”) to prepare this valuation report (“Valuation Report”) for the purpose of the public mandatory tender offer (“Mandatory TO”) for the common shares of Brasil Telecom Participações S.A. (“Brasil Telecom Participações”, “BRP” or the “Company”), holding that controls Brasil Telecom S.A. (“Brasil Telecom” or “BRT”), as described in Article 2 (III) of CVM Instruction No. 361/02 and in Article 254-A of Law No. 6404/76.
Based on the economic value criterion and multiples of comparable companies methodology, the value range per common and preferred share issued by BRP is demonstrated below: (1)
Economic value - multiples of comparable companiesR$ mn, except when otherwise indicated
Credit Suisse applied the economic value criterion based on multiples of comparable companies to calculate the value of the shares issued by BRP, as this is one of the criteria allowed by CVM Instruction 361/02 to calculate economic value, and was considered the most appropriate given the information available to the appraiser (for additional information please see page 40)
BRP - Valuation summary
Source: Financial statements of BRP and Credit Suisse. Base date: September 30, 2008.(1) For further information on the justification of the value breakdown between different classes of shares of BRP, see pages 28 and 29 of this Report.(2) LTM = Last twelve months ended on September 30, 2008. EV/EBITDA multiple of the same period.(3) The value of BRP is calculated based on its ownership stake in BRT, a controlled company responsible for the operating activ ities.(4) Net present value of BRP holding operating expenses. For more information, see Appendix D of this report.(5) Source: BRP (BRP had 1,480,800 treasury common shares as of September 30, 2008).
BRT EBITDA LTM (2)(3) R$ 3,910.0x EV/EBITDA Multiple 3.97x= BRT enterprise value 15,537.8(-) BRT net debt (09/30/2008) 1,971.5= BRT total equity value 13,566.3
. PN shares (1) 4,010.9
. ON controlling shares (1) 9,485.4
. ON minority shares (1) 70.0
BRT shares owned by BRP % of share class
. PN shares ('000) 120.9 40.59%
. ON shares ('000) 247.3 99.09%
= BRP enterprise value 11,113.3
(-) NPV of BRP holding expenses (4) 236.3(+) BRP net cash (09/30/2008) 1,341.1= BRP total equity value 12,218.1. PN shares 5,130.4. ON shares 7,087.7
Number of PN shares (million) (5) 229.9
Number of ON shares (million) (5) 132.6
Total number of shares (million) (5) 362.5
PN (R$/share) (1) R$ 21.27 R$ 22.31 R$ 23.40
ON controlling (R$/share) (1) 56.40 59.15 62.04
ON minority (R$/share) (1) 45.12 47.32 49.63
+ 4,88%- 4,65%
(2)

5
BRP - Valuation summary (cont’d)
Based on the book value of the shareholders’ equity per share methodology, the value of common and preferred shares issued by BRP is R$15.92
Book value of the shareholders’ equity per share
Source: Financial statements of BRP. Base date: September 30, 2008.(1) Source: BRP (BRP had 1,480,800 treasury common shares as of September 30, 2008).
R$ mn, except when otherwise indicated
09/30/08
Total assets R$ 18,655(-) Total liabilities 10,857(-) Minority interests 2,029= Shareholders' equity 5,769
Total number of shares (million) (1) 362.5
R$/share ON and/or PN 15.92

6
Weighted average price of common and preferred shares listed on the BOVESPA
BRP - Valuation summary (cont’d)Based on the volume weighted average price of the shares issued by BRP listed on the BOVESPA, the price range of the shares issued by BRP is demonstrated below:
R$ mn, except when otherwise indicated
Source: Economática, as of January 23rd, 2009. (1) Material Fact dated April 25, 2008 regarding the acquisition of indirect control of Brasil Telecom and Brasil Telecom Participações.(2) Source: BRP (BRP had 1,480,800 treasury common shares as of September 30, 2008).
BRTP3 BRTP4
12-month period prior to the release of the Material Fact (1)
04/24/2007 - 04/24/2008 R$ 46.62 R$ 23.11
Number of shares (mn) (2) 132.6 229.9
Market capitalization (R$ mn) R$ 6,178.9 R$ 5,313.6
Value per share weighted by the number of shares of each class R$ 46.62 R$ 23.11
Period between the release of the Material Fact and the date of the Valuation Report
04/25/2008 - 01/23/2009 R$ 51.90 R$ 20.11
Number of shares (mn) (2) 132.6 229.9
Market capitalization (R$ mn) R$ 6,879.7 R$ 4,625.0
Value per share weighted by the number of shares of each class R$ 51.90 R$ 20.11
90-day period between 01/24/08 and 04/23/08
01/24/2008 - 04/23/2008 R$ 48.62 R$ 22.98
Number of shares (mn) (2) 132.6 229.9
Market capitalization (R$ mn) R$ 6,445.1 R$ 5,284.4
Value per share weighted by the number of shares of each class R$ 48.62 R$ 22.98

7
Comparative analysis of value rangesR$ per share
BRP - Valuation summary (cont’d)
According to Schedule III, IX, “e” of CVM Instruction No 361/02, CS presents a comparative chart with the amounts calculated for common and preferred shares issued by BRP
(1) For further information, see pages 32-35 of this Valuation Report.(2) For further information, see pages 23-29 of this Valuation Report.(3) For further information, see pages 30-31 of this Valuation Report.
BRTP4BRTP3
Weighted average price(1)
Economic value(2)
Book value of the shareholders’ equity per share(3)
Period from 04/24/2007 to 04/24/2008
Period from 04/27/2008 to 01/23/2009
Period from 01/24/2008 to 04/23/2008
ON controlling
ON minority R$ 45.12
R$ 56.40
R$ 15.92
R$ 62.04
R$ 49.63
R$ 46.62
R$ 51.90
R$ 48.62
R$ 21.27
R$ 15.92
R$ 23.40
R$ 23.11
R$ 20.11
R$ 22.98
8
2. Information about the evaluator

9
Qualifications of the evaluator
As established in CVM Instruction No. 361/02, CS presents its qualifications below.n CS has acted as an advisor in important mergers and acquisitions in the Brazilian market:
Advisory services in mergers and acquisitions
Companies that operate in the segment of BRP (Telecom)n Telemar (2008): Advisory services to Telemar Norte Leste in the acquisition of Tele Norte Celular / Amazônia Celularn Telecom Itália (2007): Advisory services to Telecom Itália in the sale of its stake in Solpart Participações to a group of investors n TIM (2006): Advisory services to TIM in the merger of shares of TIM Celular by TIM Participaçõesn Telesp Celular (2003): Advisory services to Telesp Celular in the acquisition of Tele Centro Oeste Celular
Other relevant credentials in mergers and acquisitionsPublic companiesn Aracruz (2008): Advisory services to Arapar in the sale of 28% of the voting capital of Aracruz to Votorantim Celulose e Papeln Bovespa (2008): Advisory services to Bovespa Holding in its merger with Bolsa de Mercadorias & Futuros - BM&Fn MMX (2008): Advisory services to MMX in the sale of MMX Minas-Rio and MMX Amapá to Anglo Americann Magnesita (2007): Advisory services in the sale of Magnesita to GP Investimentosn Eleva (2007): Advisory services to Perdigão in the acquisition of Elevan MMX (2007): Advisory services to MMX and Centennial Asset in the sale of 50% of the capital of MMX Minas-Rio to Anglo Americann Submarino (2006): Advisory services to Submarino in the merger between Submarino and Americanas.comn CVRD (2006): Advisory services to CVRD in its takeover bid for Incon International Paper (2006): Advisory services to IP in the sale of Inpacel to Stora Enson Dufry (2006): Advisory services in the acquisition of 80% of Brasif and Eurotraden ALL (2006): Advisory services to ALL in the acquisition of Brasil Ferrovias and Novoeste Brasil n Bunge Fertilizantes (2006): Advisory services to Bunge Fertilizantes in its sale to Fosfertiln Acesita (2005): Advisory services to Previ and Petros in the exercise of their put option against Arcelor do Brasil, whereby they sold 25% of
the voting capital of Acesitan Usiminas (2005): Advisory services in the exchange of its stake in Siderar and Sidor for a stake of 16% in the total capital of TerniumPrivate companiesn J. Mendes (2008): Advisory services to Mineração J. Mendes in its sale to Usiminasn Grupo Dedini Agro (2007): Advisory services in the sale of Dedini to Abengoa Bioenergy
Note: The term “advisory” includes the following services: structuring of the transaction, assistance on data gathering, financial and economic valuations and advisory on the negotiation between the parties.
10
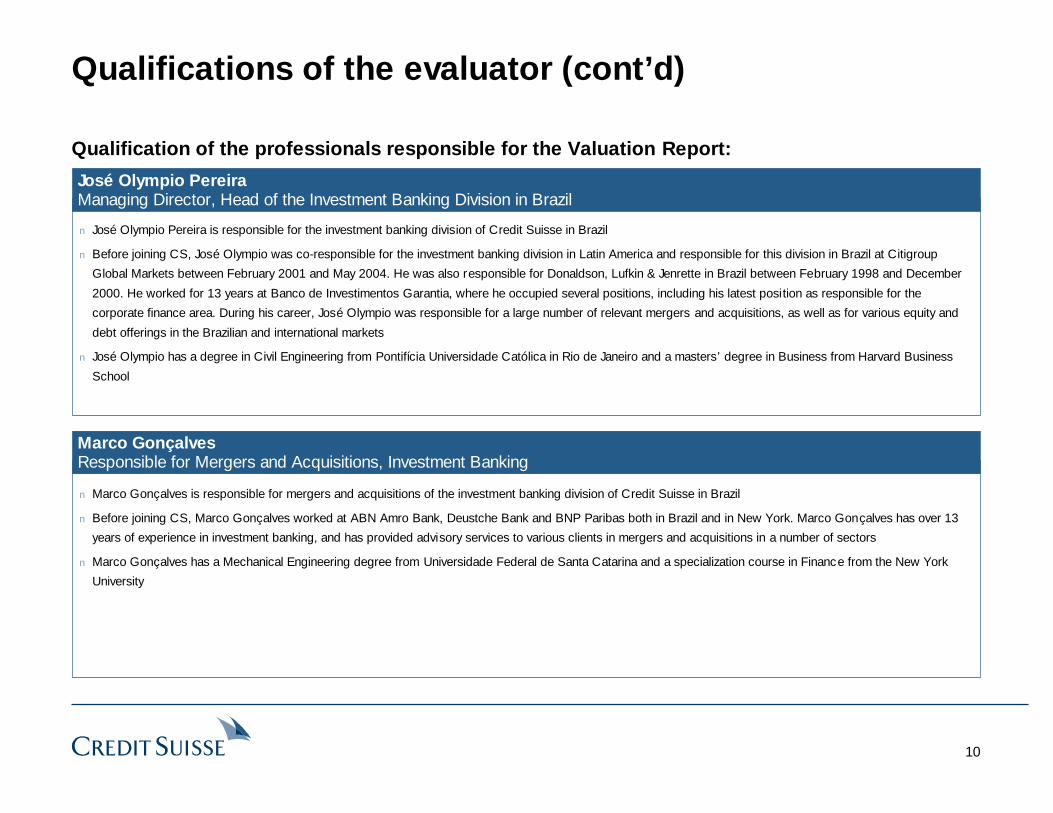
Qualifications of the evaluator (cont’d)
Qualification of the professionals responsible for the Valuation Report:
Marco GonçalvesResponsible for Mergers and Acquisitions, Investment Banking
José Olympio PereiraManaging Director, Head of the Investment Banking Division in Brazil
n José Olympio Pereira is responsible for the investment banking division of Credit Suisse in Brazil
n Before joining CS, José Olympio was co-responsible for the investment banking division in Latin America and responsible for this division in Brazil at Citigroup
Global Markets between February 2001 and May 2004. He was also responsible for Donaldson, Lufkin & Jenrette in Brazil between February 1998 and December
2000. He worked for 13 years at Banco de Investimentos Garantia, where he occupied several positions, including his latest position as responsible for the
corporate finance area. During his career, José Olympio was responsible for a large number of relevant mergers and acquisitions, as well as for various equity and
debt offerings in the Brazilian and international markets
n José Olympio has a degree in Civil Engineering from Pontifícia Universidade Católica in Rio de Janeiro and a masters’ degree in Business from Harvard Business
School
n Marco Gonçalves is responsible for mergers and acquisitions of the investment banking division of Credit Suisse in Brazil
n Before joining CS, Marco Gonçalves worked at ABN Amro Bank, Deustche Bank and BNP Paribas both in Brazil and in New York. Marco Gonçalves has over 13
years of experience in investment banking, and has provided advisory services to various clients in mergers and acquisitions in a number of sectors
n Marco Gonçalves has a Mechanical Engineering degree from Universidade Federal de Santa Catarina and a specialization course in Finance from the New York
University

11
Qualifications of the evaluator (cont’d)
Qualification of the professionals responsible for the Valuation Report:
Daniel AngerAnalyst, Investment Banking
Bruno AmaralVice President, Investment Banking
n Bruno Amaral is a vice president of the investment banking division of Credit Suisse in Brazil
n Bruno Amaral has been a part of the Credit Suisse team since February 2005. Before joining Credit Suisse, Bruno worked in the investment banking division of
Citigroup Global Markets (ex-Salomon Smith Barney) in São Paulo and New York, and in the mergers and acquisitions division of BNP Paribas in São Paulo and
Paris. He has over 9 years of experience in investment banks and has already worked on various mergers and acquisitions, as well as equity and debt offerings in
various sectors in Brazil, Latin America and Europe
n Bruno Amaral has a degree in Economics from Universidade de São Paulo
n Daniel Anger is part of the execution team of the investment banking division of Credit Suisse in Brazil
n Daniel Anger joined Credit Suisse in June 2007. Before joining Credit Suisse, Daniel worked as an analyst in the investment banking division of N.M. Rothschild in
Brazil, and at Bain & Company. He has over 4 years of experience in investment banks and has already worked on several operations in mergers and acquisitions
and capital markets in different sectors
n Daniel Anger has a degree in Industrial Engineering from Universidade de São Paulo
12
Evaluator’s representations
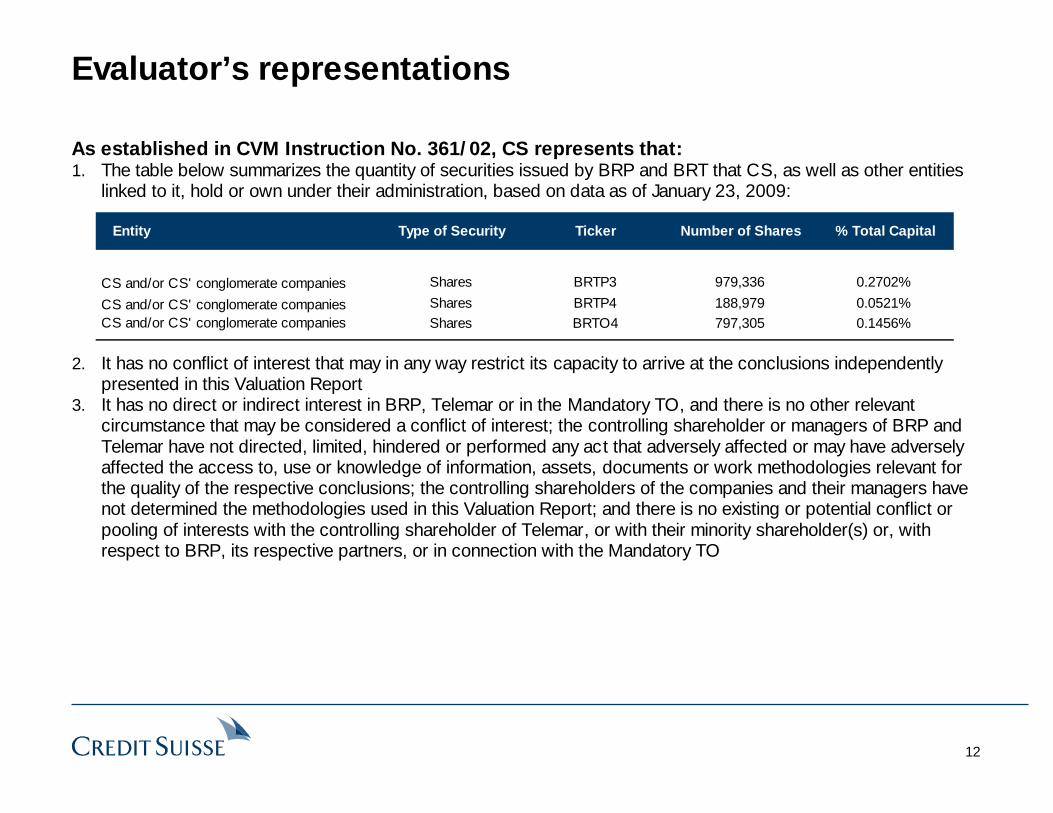
As established in CVM Instruction No. 361/02, CS represents that: 1. The table below summarizes the quantity of securities issued by BRP and BRT that CS, as well as other entities
linked to it, hold or own under their administration, based on data as of January 23, 2009:
2. It has no conflict of interest that may in any way restrict its capacity to arrive at the conclusions independently presented in this Valuation Report
3. It has no direct or indirect interest in BRP, Telemar or in the Mandatory TO, and there is no other relevant circumstance that may be considered a conflict of interest; the controlling shareholder or managers of BRP and Telemar have not directed, limited, hindered or performed any act that adversely affected or may have adversely affected the access to, use or knowledge of information, assets, documents or work methodologies relevant for the quality of the respective conclusions; the controlling shareholders of the companies and their managers have not determined the methodologies used in this Valuation Report; and there is no existing or potential conflict or pooling of interests with the controlling shareholder of Telemar, or with their minority shareholder(s) or, with respect to BRP, its respective partners, or in connection with the Mandatory TO
Entity Type of Security Ticker Number of Shares % Total Capital
CS and/or CS' conglomerate companies Shares BRTP3 979,336 0.2702%
CS and/or CS' conglomerate companies Shares BRTP4 188,979 0.0521%CS and/or CS' conglomerate companies Shares BRTO4 797,305 0.1456%

13
Evaluator’s representations (cont’d)
4. CS will receive the equivalent amount in Reais of R$8,000,000.00 as commission for structuring the public mandatory tender offers for the acquisition of shares of BRT and BRP (including the issuance of both Valuation Reports), to be paid by Telemar
5. On August 06, 2008 CS received R$2.136.596,47 as commission and remuneration with respect to the valuation reports of the voluntary public tender offers for preferred shares acquisition of BRT and BRP
6. On May 02, 2008 CS received R$5,341,491.18 as the engagement commission to act as the Agent (“Comissário”) with respect to the acquisition of the indirect control of Brasil Telecom S.A. and Brasil Telecom Participações S.A.
7. On May 15, 2008 it received R$1,244,428.57 as commission and remuneration with respect to the valuation reports of the voluntary public tender offers of Tele Norte Celular Participações S.A. and Amazônia Celular S.A.
8. On November 05, 2008 received R$793,686.83 as commission for structuring the public mandatory tender offers and public voluntary tender offers for the acquisition of shares of Amazônia Celular S.A. and Tele Norte CelularParticipações S.A.
9. It has been retained by Telemar to prepare a valuation report with respect to BRT in the context of the mandatory tender offer for acquisition of common shares of BRT, as explained previously in item 4 above
10. It received R$9,516,203.05 from Telemar, in the 12 months prior to the Mandatory TO registration request, as remuneration for any consultancy, valuation, auditing and related services provided, as previously explained in items 5, 6, 7 and 8 above
11. It has not received any amounts from BRP as remuneration for any consultancy, valuation, auditing and related services provided in the 12 months prior to the Mandatory TO registration request

14
Evaluator’s representations (cont’d)
12. This Valuation Report presents:I. Information about the shares issued by BRP, including the ownership structure;II. The valuation criterion based on economic value using the multiples of comparable companies
methodology;III. Description of the methodologies applied in the valuation of the shares issued by BRP using market
prices and book value of the shareholders’ equity criteria; andIV. Tables with data used in the calculation of values.
13. In addition to the information required in article 8, paragraph 3 of CVM Instruction No. 361/02, this Valuation Report provides additional information aimed at supplementing the analysis presented herein and supporting the conclusion on the calculated value of the shares of BRP
14. In compliance with article 8 (V) (b) of CVM Instruction No. 361/02, Credit Suisse represents that, among the valuation criteria presented in this document, it believes the methodology of economic value using multiples of comparable companies, as per item XII (c), 2, of schedule III of CVM Instruction No. 361/02, to be the most appropriate for determining the value range of the shares issued by BRP (for more information see page 40)
15. CS’s internal process for the approval of the Valuation Report involves the following stages: I. Discussion about the methodology and assumptions to be applied in the valuation with the team involved
in the operation; andII. After preparation and revision of the Valuation Report by the team involved, submission of the Valuation
Report for the analysis of an internal bank committee, composed of the bank’s CEO, the director of the investment banking division, legal counsel and other members of the committee, and others responsible for the departments involved in the transaction

15
3. Market and company description
16
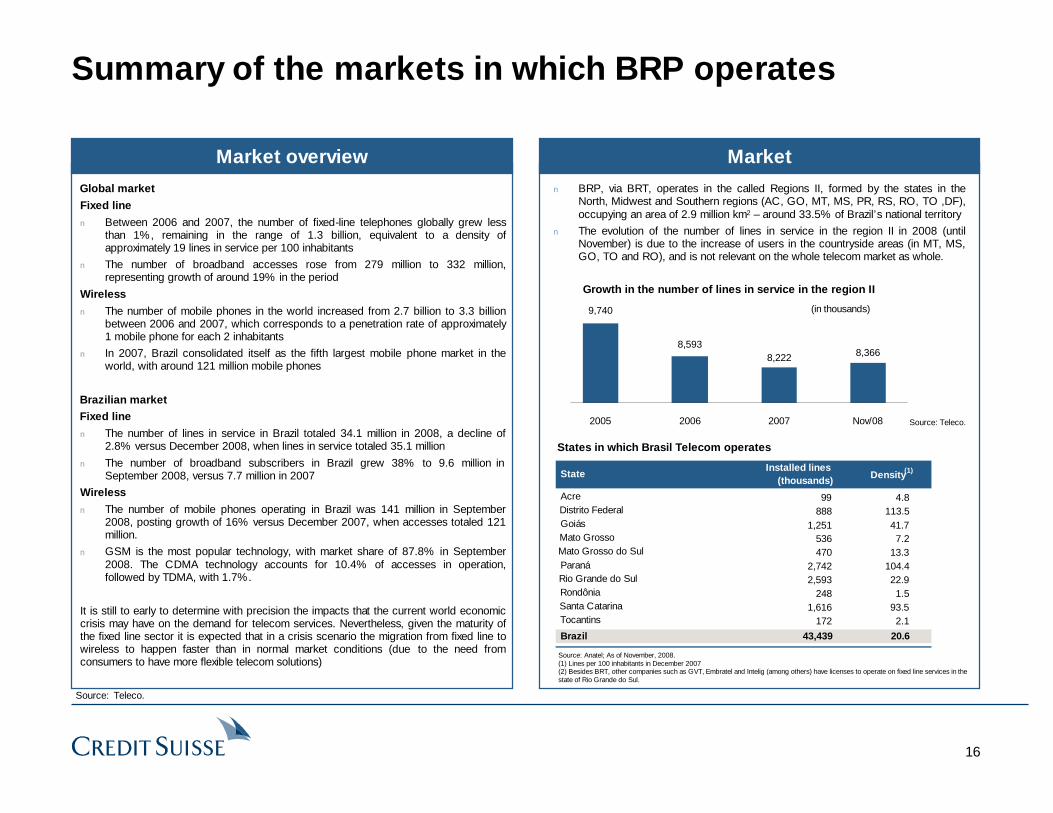
n BRP, via BRT, operates in the called Regions II, formed by the states in the North, Midwest and Southern regions (AC, GO, MT, MS, PR, RS, RO, TO ,DF), occupying an area of 2.9 million km2 – around 33.5% of Brazil’s national territory
n The evolution of the number of lines in service in the region II in 2008 (until November) is due to the increase of users in the countryside areas (in MT, MS, GO, TO and RO), and is not relevant on the whole telecom market as whole.
Summary of the markets in which BRP operates
MarketMarket overview
Global market
Fixed line
n Between 2006 and 2007, the number of fixed-line telephones globally grew less than 1%, remaining in the range of 1.3 billion, equivalent to a density of approximately 19 lines in service per 100 inhabitants
n The number of broadband accesses rose from 279 million to 332 million, representing growth of around 19% in the period
Wireless
n The number of mobile phones in the world increased from 2.7 billion to 3.3 billion between 2006 and 2007, which corresponds to a penetration rate of approximately 1 mobile phone for each 2 inhabitants
n In 2007, Brazil consolidated itself as the fifth largest mobile phone market in the world, with around 121 million mobile phones
Brazilian marketFixed line
n The number of lines in service in Brazil totaled 34.1 million in 2008, a decline of 2.8% versus December 2008, when lines in service totaled 35.1 million
n The number of broadband subscribers in Brazil grew 38% to 9.6 million in September 2008, versus 7.7 million in 2007
Wireless
n The number of mobile phones operating in Brazil was 141 million in September 2008, posting growth of 16% versus December 2007, when accesses totaled 121 million.
n GSM is the most popular technology, with market share of 87.8% in September 2008. The CDMA technology accounts for 10.4% of accesses in operation, followed by TDMA, with 1.7%.
It is still to early to determine with precision the impacts that the current world economic crisis may have on the demand for telecom services. Nevertheless, given the maturity of the fixed line sector it is expected that in a crisis scenario the migration from fixed line to wireless to happen faster than in normal market conditions (due to the need from consumers to have more flexible telecom solutions)
Source: Teleco.
Source: Teleco.
States in which Brasil Telecom operates
Source: Anatel; As of November, 2008.
StateInstalled lines
(thousands) Density(1)
Acre 99 4.8Distrito Federal 888 113.5Goiás 1,251 41.7Mato Grosso 536 7.2Mato Grosso do Sul 470 13.3Paraná 2,742 104.4Rio Grande do Sul 2,593 22.9Rondônia 248 1.5Santa Catarina 1,616 93.5Tocantins 172 2.1
Brazil 43,439 20.6
(1) Lines per 100 inhabitants in December 2007(2) Besides BRT, other companies such as GVT, Embratel and Intelig (among others) have licenses to operate on fixed line services in the state of Rio Grande do Sul.
9,740
8,5938,222 8,366
2005 2006 2007 Nov/08
Growth in the number of lines in service in the region II
(in thousands)

17
Description of BRP
Company descriptionn Brasil Telecom Participações S.A. is a holding company with
99.1% of the voting capital and 65.6% of the total capital of BrasilTelecom S.A.
n Created after the spin-off of Telebrás, on May 22, 1998, BrasilTelecom Participações S.A. – at that time called Tele Centro SulParticipações S.A. – was acquired in the privatization auction held on July 29, 1998.
n BRP, via Brasil Telecom S.A., provides services in the fixed line, wireless, data solutions, internet, video and data center segments in an area of around 2.9 million km2, equivalent to around 33.5% of Brazil’s national territory
Performance in Q3 2008n Brasil Telecom S.A. ended Q3 2008 with around 8.2 million fixed-
line telephones in service, more than 5.2 mobile phones in service, 278,000 public phones and 1.8 million ADSL (broadband) accesses
n The average market share of BRT in its operating region in Q3 2008 was 85.0% in the intra-regional segment, 89.8% in the intra-sector segment, 65.7% in the inter-regional segment and 42.2% in the international segment
n The ADSL ARPU was R$49.5 in 3Q08, showing a growth of 2.2%yoy from 3Q07 ARPU of R$48.4
n The total ARPU of mobile telecom was R$28.8 in 3Q08, 17.5% lower than 3Q07
Ownership structure
Source: BRP. (1) Direct and indirect stake.
Company overview
Market share
Source: Teleco; Market share as of Companies’ lines in service.Source: Teleco and BRP.
21.7% 20.4% 20.3% 20.1% 19.9%
37.1% 36.1% 35.6% 34.5% 33.8%
31.2% 30.4% 30.2% 29.5% 28.9%
10.1% 13.1% 13.8% 15.9% 17.4%
2006 2007 1Q08 2Q08 3Q08BrT Oi Telefonica Others
Brasil Telecom Participações S.A.
Total 56.66%ON 39.50%PN 66.67%
Telemar Norte Leste S.A.(1) Free Float
Total 43.34%ON 60.50%PN 33.33%

18
4. Valuation of Brasil Telecom Participações
19
4. Valuation of Brasil Telecom Participações4.1. Financial and operational highlights

20
Main financial highlights
Historical consolidated balance sheet of BRP
R$ mm
Source: Standardized financial statements, CVM.
2005 2006 2007 09/30/08 2005 2006 2007 09/30/08
Loans and financing 1,201.7 1,109.6 496.8 627.9Cash and financial investments 2,613.8 3,974.0 3,364.5 3,083.1 Suppliers 1,787.9 1,474.7 1,483.0 1,478.3Accounts receivable 2,152.8 2,127.7 2,189.7 2,271.7 Taxes payable 1,035.3 888.4 820.9 1,315.1Recoverable taxes 1,276.7 944.1 804.5 1,452.4 Dividends payable 499.8 614.4 1,016.5 347.3Inventory 83.0 64.2 32.7 46.0 Provisions 265.1 218.8 298.9 351.0Other current assets 187.6 388.2 1,044.5 844.9 Other obligations 522.7 546.5 611.3 1,151.8Current assets 6,314.0 7,498.1 7,436.0 7,698.2 Current liabilities 5,312.4 4,852.4 4,727.4 5,271.3
Loans and financing 3,367.4 4,265.6 3,886.6 3,637.7Provisions 1,115.9 1,163.2 1,286.5 1,287.5Taxes 342.1 113.8 171.1 296.0
Deferred income taxes 1,512.3 1,649.5 1,793.2 1,899.9 Authorization to Explore Telecom Serv. 252.3 219.5 174.6 189.6Judicial deposits 152.9 429.9 1,069.1 1,948.4 Others 143.6 90.6 110.8 174.8Other long-term assets 176.1 49.0 104.7 105.1 Long-term liabilities 5,221.3 5,852.7 5,629.7 5,585.6Long-term assets 1,841.4 2,128.4 2,967.1 3,953.4 Minorities' interest 1,801.2 1,811.1 1,825.8 2,029.1
Investments 423.4 330.1 201.5 107.9 Paid-in capital 2,596.3 2,596.3 2,596.3 2,596.3PP&E 7,587.6 6,535.3 5,664.2 5,460.9 Capital reserve 309.2 309.2 309.2 309.2Intangible 1,220.1 1,163.4 1,049.6 1,365.1 Profit reserves 282.7 306.3 266.0 266.0Deferred 194.4 138.5 111.0 70.0 Retained earnings 2,057.9 2,065.8 2,075.1 2,598.0Fixed assets 9,425.5 8,167.3 7,026.2 7,003.9 Shareholders' equity 5,246.0 5,277.6 5,246.5 5,769.4
Total assets 17,580.9 17,793.8 17,429.3 18,655.4 Total liabilities and shareholders’ equity 15,779.7 15,982.7 15,603.5 16,626.3
21
Main financial highlights (cont’d)
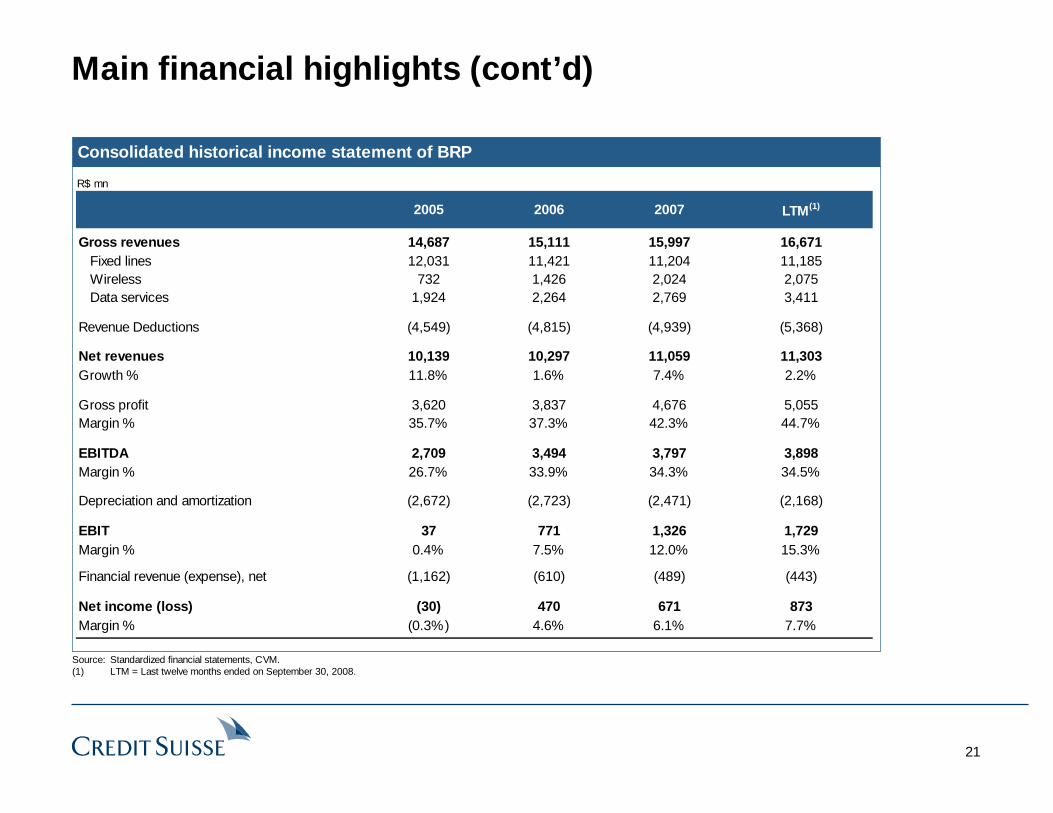
Consolidated historical income statement of BRP
R$ mn
Source: Standardized financial statements, CVM.(1) LTM = Last twelve months ended on September 30, 2008.
2005 2006 2007 LTM(1)
Gross revenues 14,687 15,111 15,997 16,671Fixed lines 12,031 11,421 11,204 11,185Wireless 732 1,426 2,024 2,075Data services 1,924 2,264 2,769 3,411
Revenue Deductions (4,549) (4,815) (4,939) (5,368)
Net revenues 10,139 10,297 11,059 11,303Growth % 11.8% 1.6% 7.4% 2.2%
Gross profit 3,620 3,837 4,676 5,055Margin % 35.7% 37.3% 42.3% 44.7%
EBITDA 2,709 3,494 3,797 3,898Margin % 26.7% 33.9% 34.3% 34.5%
Depreciation and amortization (2,672) (2,723) (2,471) (2,168)
EBIT 37 771 1,326 1,729Margin % 0.4% 7.5% 12.0% 15.3%
Financial revenue (expense), net (1,162) (610) (489) (443)
Net income (loss) (30) 470 671 873Margin % (0.3%) 4.6% 6.1% 7.7%

22
Main operational highlights
Operational indicators of BRP
Source: Standardized financial statements, CVM.
2005 2006 2007 1Q08
Lines in service 9,560 8,418 8,034 8,198Growth % 0.6% (11.9%) (4.6%) 1.7%
ADSL accesses 1,014 1,318 1,568 1,762Growth % 89.3% 30.0% 19.0% 15.7%
Number of wireless subscribers (thousand) 2,213 3,377 4,263 5,246Post-paid 1,520 2,383 3,407 4,351Pre-paid 693 994 856 895

23
4. Valuation of Brasil Telecom Participações4.2. Economic value based on market multiples of comparable companies methodology

24
Description of comparable companies
BRP’s valuation according to an analysis of multiples of comparable companies used as reference Brazilian and international comparable companies with greater similarities and outstanding position in the sector in which they operate
Brazilian comparable companies
n Telesp: Operates local fixed telephone line services in the State of São Paulo and provides Internet services
n GVT: Offers products and solutions for conventional fixed telephone lines, data transmission services to companies, Internet services (broadband and ISP), and VoIP services
n Vivo: Provides mobile phone services via the GSM, CDMA and TDMA systems
n TIM: Offers mobile phone services in the entire Brazilian territory via the GSM system
n Telemar: Provides fixed and mobile telephone services, data communication, Internet and paid-TV
Foreign comparable companies
n America Móvil: Provides mobile communication services in Latin America via the GSM system
n Telmex: Provides local and long-distance fixed line telephone services in Mexico, and Internet and data transmission services in Brazil, Argentina, Chile, Colombia and Peru. It also offers paid-TV services in Brazil and telecommunication services in Ecuador
Credit Suisse believes it is reasonable to take the group of companies above as a parameter for calculation of multiples, since (i) a significant part of their revenues comes from similar activities to those provided by BRP and/or BRT (ii) these companies operate in the telecom market in Brazil or Latin America

25
Summary table of 2007 financial information:
Description of comparable companies (cont’d)
Net Revenues
Wireless Wireline Other
(in R$ million)
Wireline
Telmex - 18,537 4,765 14,249 6,425 2,395
Telesp (1) - 16,949 4,235 6,401 2,363 1,993 GVT - 854 127 358 59 566
Wireless
América Móvil 47,699 - 8,103 23,335 10,493 6,160 Vivo Participações 11,089 - 1,403 3,013 (99) 1,919 TIM Participações 11,421 - 1,021 2,918 76 1,933
Integrated
Telemar (2) 4,436 20,717 3,523 6,442 2,358 2,328
Source: Companies.
(1) Gross revenues breakdown. Total net revenues of R$14,728 million.
(2) Gross revenues breakdown. Total net revenues of R$17,584 milion.
EBITDA Net Income CAPEX
Note: Both América Móvil and Telmex have operations in markets with less competition than in Brazil (e.g. Mexico). As a consequence, they have higher EBITDA and Net Income margins than the Brazilian Companies. Nevertheless, both Companies also (i) have operations in Brazil; (ii) attract, in general, the same type of institutional foreign investor than the Brazilian Companies; and (iii) are in general covered by the same Research Analysts than the Brazilian Companies. Considering the differences and similarities between those companies, and given the benefit of having a larger group of comparable companies, it is justifiable the use of such Companies in this analysis.
26
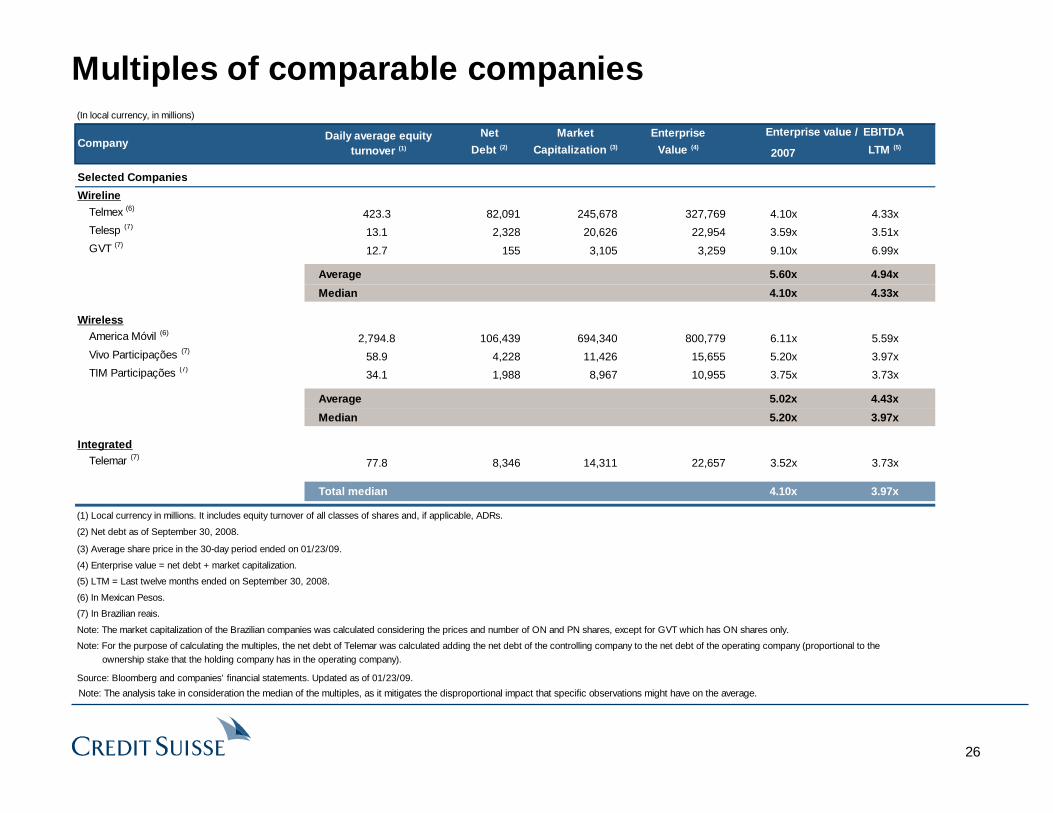
Multiples of comparable companies(In local currency, in millions)
Net Market Enterprise
Debt (2) Capitalization (3) Value (4)2007 LTM (5)
Selected Companies
WirelineTelmex (6)
423.3 82,091 245,678 327,769 4.10x 4.33xTelesp (7)
13.1 2,328 20,626 22,954 3.59x 3.51xGVT (7)
12.7 155 3,105 3,259 9.10x 6.99x
Average 5.60x 4.94x
Median 4.10x 4.33x
WirelessAmerica Móvil (6)
2,794.8 106,439 694,340 800,779 6.11x 5.59xVivo Participações (7)
58.9 4,228 11,426 15,655 5.20x 3.97xTIM Participações (7)
34.1 1,988 8,967 10,955 3.75x 3.73x
Average 5.02x 4.43x
Median 5.20x 3.97x
IntegratedTelemar (7)
77.8 8,346 14,311 22,657 3.52x 3.73x
Total median 4.10x 3.97x
(1) Local currency in millions. It includes equity turnover of all classes of shares and, if applicable, ADRs.
(2) Net debt as of September 30, 2008.
(3) Average share price in the 30-day period ended on 01/23/09.
(4) Enterprise value = net debt + market capitalization.
(5) LTM = Last twelve months ended on September 30, 2008.
(6) In Mexican Pesos.
(7) In Brazilian reais.
Note: The market capitalization of the Brazilian companies was calculated considering the prices and number of ON and PN shares, except for GVT which has ON shares only.
Note: For the purpose of calculating the multiples, the net debt of Telemar was calculated adding the net debt of the controlling company to the net debt of the operating company (proportional to theNote: ownership stake that the holding company has in the operating company).
Source: Bloomberg and companies' financial statements. Updated as of 01/23/09.
CompanyDaily average equity
turnover (1)
Enterprise value / EBITDA
Note: The analysis take in consideration the median of the multiples, as it mitigates the disproportional impact that specific observations might have on the average.
27
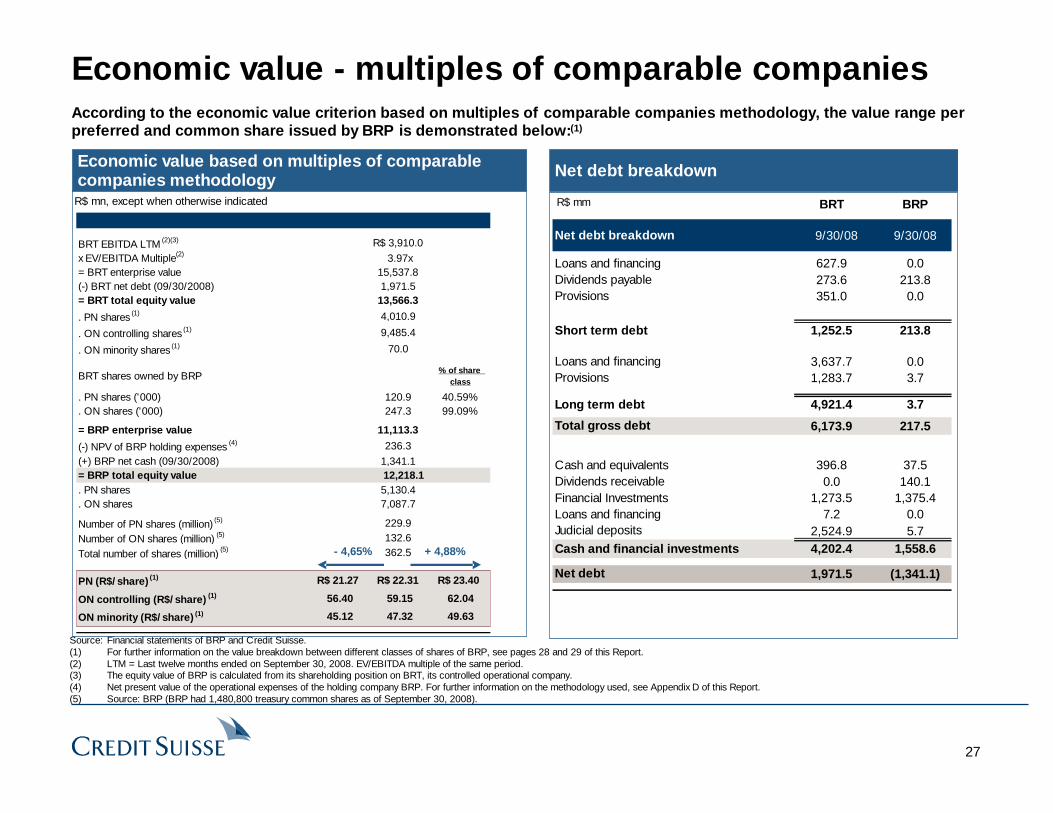
According to the economic value criterion based on multiples of comparable companies methodology, the value range per preferred and common share issued by BRP is demonstrated below:(1)
Economic value based on multiples of comparable companies methodology Net debt breakdown
R$ mmR$ mn, except when otherwise indicated
Source: Financial statements of BRP and Credit Suisse.(1) For further information on the value breakdown between different classes of shares of BRP, see pages 28 and 29 of this Report.(2) LTM = Last twelve months ended on September 30, 2008. EV/EBITDA multiple of the same period.(3) The equity value of BRP is calculated from its shareholding position on BRT, its controlled operational company.(4) Net present value of the operational expenses of the holding company BRP. For further information on the methodology used, see Appendix D of this Report.(5) Source: BRP (BRP had 1,480,800 treasury common shares as of September 30, 2008).
Economic value - multiples of comparable companies
BRT EBITDA LTM (2)(3) R$ 3,910.0x EV/EBITDA Multiple 3.97x= BRT enterprise value 15,537.8(-) BRT net debt (09/30/2008) 1,971.5= BRT total equity value 13,566.3
. PN shares (1) 4,010.9
. ON controlling shares (1) 9,485.4
. ON minority shares (1) 70.0
BRT shares owned by BRP% of share
class
. PN shares ('000) 120.9 40.59%
. ON shares ('000) 247.3 99.09%
= BRP enterprise value 11,113.3
(-) NPV of BRP holding expenses (4) 236.3(+) BRP net cash (09/30/2008) 1,341.1= BRP total equity value 12,218.1 . PN shares 5,130.4. ON shares 7,087.7
Number of PN shares (million) (5) 229.9Number of ON shares (million) (5) 132.6
Total number of shares (million) (5) 362.5
PN (R$/share) (1) R$ 21.27 R$ 22.31 R$ 23.40
ON controlling (R$/share) (1) 56.40 59.15 62.04
ON minority (R$/share) (1) 45.12 47.32 49.63
+ 4,88%- 4,65%
BRT BRP
Net debt breakdown 9/30/08 9/30/08
Loans and financing 627.9 0.0Dividends payable 273.6 213.8Provisions 351.0 0.0
Short term debt 1,252.5 213.8
Loans and financing 3,637.7 0.0Provisions 1,283.7 3.7
Long term debt 4,921.4 3.7
Total gross debt 6,173.9 217.5
Cash and equivalents 396.8 37.5Dividends receivable 0.0 140.1Financial Investments 1,273.5 1,375.4Loans and financing 7.2 0.0Judicial deposits 2,524.9 5.7Cash and financial investments 4,202.4 1,558.6
Net debt 1,971.5 (1,341.1)
(2)

28
BRT - Value breakdown among PN shares, ON minority and ON controlling shares
1. Total value of the shares reflects the average economic value of the shares of BRT
2. Value of the ON controlling shares reflects the control premium of 25.0% over minority common shares, consistent with the implicit premium defined by Brazilian Corporate Law(1)
3. The value of ON minority shares reflects a historic spread (90 days) of 128% on PN shares, as per appendix A
4. Value of the PN shares reflects the remaining value of the shares after distributions in “2” and “3”
The shares issued by BRT, as is the case for other companies traded on Bovespa, are negotiated in different price levels according to their specific class and type. This differentiation is due to specific rights and characteristics attributed to each share class and type. Therefore, it is justified to have specific valuations of each class and type of share according to an objectively verifiable criterion deemed to be adequate (as per interpretation of CVM “Parecerde Orientação” No 34 of 08/18/2006).
The distribution of the total equity value among ON controlling, ON minority and PN shares issued by BRT was done according to the following criteria:
R$ per share, except when otherwise indicated
(1) As stated on Article 254-A of Law 6.404 from 12/15/1976 (Brazilian Corporate Law), the sale of the control of a public company triggers an obligatory tag along offer to the voting minority shareholders on a price of at least 80% of the acquisition price per common share of the controlling block. Therefore, the implicit control premium is (1/ 80% - 1 = 25%).
1. Equity value 13,566.3
Total number of shares (millions) 547.5
Average price per share $24.78
2. Equity value of ON controlling shares 9,485.4
Number of ON controlling shares (millions) 247.3
Price per ON controlling share (economic value per controlling ON share) $38.35
3. Equity value of ON minority shares 70.0
Number of ON minority shares (millions) 2.3
$30.68
4. Equity value of PN shares 4,010.9
Number of PN shares (millions) 297.9
Price per PN share (economic value per PN share) $13.46
Price per ON minority share (control ON x 80%) (economic value per ON minority share)
29
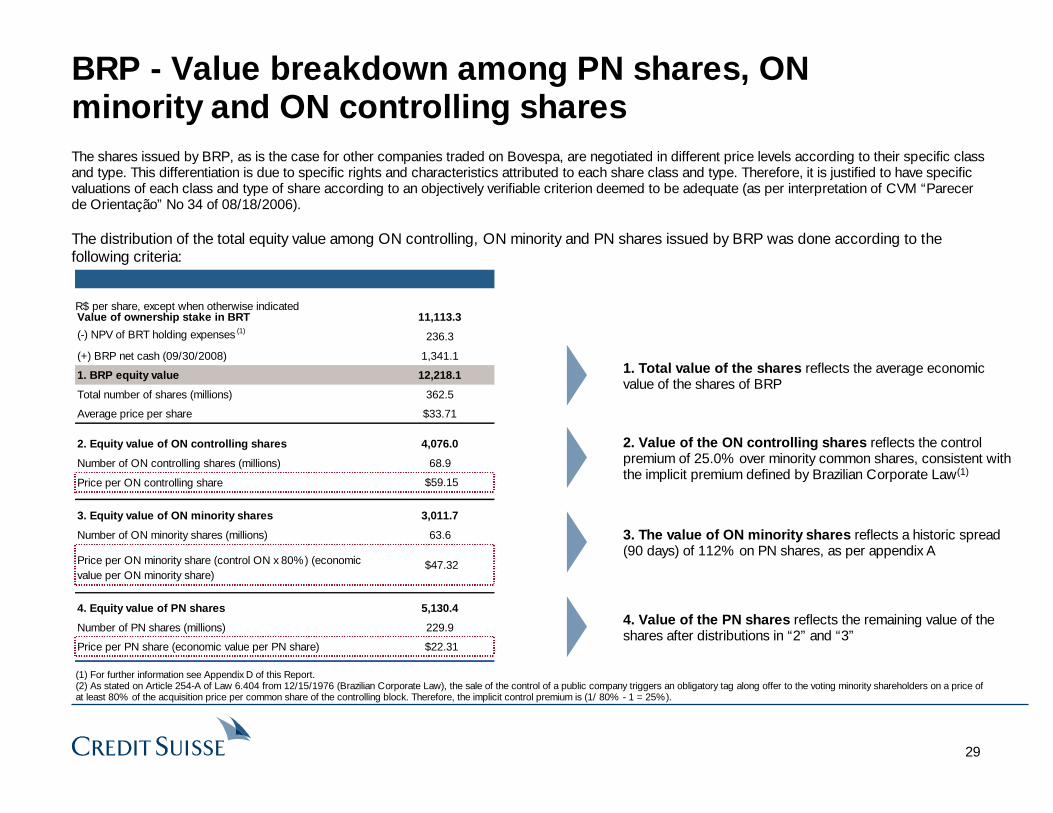
BRP - Value breakdown among PN shares, ON minority and ON controlling shares
1. Total value of the shares reflects the average economic value of the shares of BRP
2. Value of the ON controlling shares reflects the control premium of 25.0% over minority common shares, consistent with the implicit premium defined by Brazilian Corporate Law(1)
3. The value of ON minority shares reflects a historic spread (90 days) of 112% on PN shares, as per appendix A
4. Value of the PN shares reflects the remaining value of the shares after distributions in “2” and “3”
The shares issued by BRP, as is the case for other companies traded on Bovespa, are negotiated in different price levels according to their specific class and type. This differentiation is due to specific rights and characteristics attributed to each share class and type. Therefore, it is justified to have specific valuations of each class and type of share according to an objectively verifiable criterion deemed to be adequate (as per interpretation of CVM “Parecerde Orientação” No 34 of 08/18/2006).
The distribution of the total equity value among ON controlling, ON minority and PN shares issued by BRP was done according to the following criteria:
R$ per share, except when otherwise indicated
(1) For further information see Appendix D of this Report.(2) As stated on Article 254-A of Law 6.404 from 12/15/1976 (Brazilian Corporate Law), the sale of the control of a public company triggers an obligatory tag along offer to the voting minority shareholders on a price of at least 80% of the acquisition price per common share of the controlling block. Therefore, the implicit control premium is (1/ 80% - 1 = 25%).
Value of ownership stake in BRT 11,113.3
(-) NPV of BRT holding expenses (1)236.3
(+) BRP net cash (09/30/2008) 1,341.1
1. BRP equity value 12,218.1
Total number of shares (millions) 362.5
Average price per share $33.71
2. Equity value of ON controlling shares 4,076.0
Number of ON controlling shares (millions) 68.9
Price per ON controlling share $59.15
3. Equity value of ON minority shares 3,011.7
Number of ON minority shares (millions) 63.6
$47.32
4. Equity value of PN shares 5,130.4
Number of PN shares (millions) 229.9
Price per PN share (economic value per PN share) $22.31
Price per ON minority share (control ON x 80%) (economic value per ON minority share)

30
4. Valuation of Brasil Telecom Participações4.3. Book value of the shareholders’ equity

31
Book value of the shareholders’ equity per share
Source: Financial statements of BRP. Base date: September 30, 2008.(1) Source: BRP (BRP had 1,480,800 treasury common shares as of September 30, 2008).
Based on the book value of the shareholders’ equity per share methodology, the value of common and preferred shares issued by BRP is R$15.92
R$ mn, except when otherwise indicated
Book value of the shareholders’ equity
09/30/08
Total assets R$ 18,655(-) Total liabilities 10,857(-) Minority interests 2,029= Shareholders' equity 5,769
Total number of shares (million) (1) 362.5
R$/share ON and/or PN 15.92

32
4. Valuation of Brasil Telecom Participações4.4. Weighted average price of the shares on the BOVESPA

33
0
20,000,000
40,000,000
60,000,000
80,000,000
100,000,000
120,000,000
140,000,000
160,000,000
180,000,000
Jan-07 Feb-07 Apr-07 May-07 Jul-07 Sep-07 Oct-07 Dec-07 Jan-08 Mar-08 May-08 Jun-08 Aug-08 Sep-08 Nov-08 Jan-09
Eq
uity
Tur
nove
r (R
$)
-
10.00
20.00
30.00
40.00
50.00
60.00
70.00
Pri
ce (
R$
per
sha
re)
Volume Price
BRTP3Weighted average price of the shares on the BOVESPA
Price of common shares of Brasil Telecom Participações (BRTP3) on the BOVESPA
Source: Economática as of January 23, 2009.
Weighted average between 04/25/2008 and 01/23/2009: R$51.90
Weighted average between 04/24/2007 and 04/24/2008: R$46.62

34
BRTP4Weighted average price of the shares on the BOVESPA
Price of preferred shares of Brasil Telecom Participações (BRTP4) on the BOVESPA
Source: Economática as of January 23, 2009.
0
50,000,000
100,000,000
150,000,000
200,000,000
250,000,000
Jan-07 Feb-07 Apr-07 May-07 Jul-07 Sep-07 Oct-07 Dec-07 Jan-08 Mar-08 May-08 Jun-08 Aug-08 Sep-08 Nov-08 Jan-09
Eq
uity
Tur
nove
r (R
$)
-
5.00
10.00
15.00
20.00
25.00
30.00
Pri
ce (
R$
per
sha
re)
Volume Price
Weighted average between 04/24/2007 and 04/24/2008: R$23.11
Weighted average between 04/25/2008 and 01/23/2009: R$20.11

35
Market value of the shares
Based on the weighted average price of the common and preferred shares issued by BRP listed on the BOVESPA, the price range of the shares issued by BRP is demonstrated below:
Volume weighted average price of the common and preferred shares on the BOVESPA
Source: Economática as of January 23, 2009.(1) Material Fact dated April 25, 2008 regarding the acquisition of indirect control of Brasil Telecom and Brasil Telecom Participações.(2) Source: BRP (BRP had 1,480,800 treasury common shares as of September 30, 2008).
R$ per share, except when otherwise indicated
BRTP3 BRTP4
12-month period prior to the release of the Material Fact (1)
04/24/2007 - 04/24/2008 R$ 46.62 R$ 23.11
Number of shares (mn) (2) 132.6 229.9
Market capitalization (R$ mn) R$ 6,178.9 R$ 5,313.6
Value per share weighted by the number of shares of each class R$ 46.62 R$ 23.11
Period between the release of the Material Fact and the date of the Valuation Report
04/25/2008 - 01/23/2009 R$ 51.90 R$ 20.11
Number of shares (mn) (2) 132.6 229.9
Market capitalization (R$ mn) R$ 6,879.7 R$ 4,625.0
Value per share weighted by the number of shares of each class R$ 51.90 R$ 20.11
90-day period between 01/24/08 and 04/23/08
01/24/2008 - 04/23/2008 R$ 48.62 R$ 22.98
Number of shares (mn) (2) 132.6 229.9
Market capitalization (R$ mn) R$ 6,445.1 R$ 5,284.4
Value per share weighted by the number of shares of each class R$ 48.62 R$ 22.98
36
Appendix A. Analysis of the historical spreads between ON and PN shares

37
Analysis of historical spreads between BRT ON and PN sharesHistorical spreads between ON and PN shares of BRT
Source: Economática, as of January 23, 2009.
Days prior to the Material Fact fromApril 25, 2008
(Average prices of BRTO3 /Average prices of BRTO4) - 1
30 days 105.5%60 days 120.1%90 days 127.9%
180 days 114.7%1 year 119.7%

38
Analysis of historical spreads between BRP ON and PN sharesHistorical spreads between ON and PN shares of BRP
Source: Economática, as of January 23, 2009.
Days prior to the Material Fact fromApril 25, 2008
(Average prices of BRTP3 /Average prices of BRTP4) - 1
30 days 98.4%60 days 108.8%90 days 112.1%
180 days 105.6%1 year 102.6%

39
Appendix B. Valuation criterion

40
Valuation methodology
CS valued BRP using multiples of comparable listed companies with similar operational and financial characteristics
Calculation methodology
n Once the universe of comparable companies is chosen, the implicit enterprise value and the value of the shares of the company being valued is calculated by multiplying their operational variables (e.g., net profit, EBITDA) by the respective multiples of the universe of comparable companies
n The key element in the analysis of comparable companies is to identify the companies that are most comparable and relevant
• A good comparable company is one that has operational and financial characteristics similar to those of the company being valued
• Examples of operational characteristics: operating sector, products, distribution channels, markets, clients, seasonality and cyclicality
• Examples of financial characteristics: size, leverage, shareholders’ base, growth and margins
CS applied the economic value criterion using multiples of comparable companies for the following reasons:
i. It is one of the criteria allowed by the CVM Instruction 361/02 to calculate economic value, and was considered by the appraiser the most appropriate criterion given the availability of information on this specific case and given the representative number of telecommunications companies listed in Brazil and Latin America;
ii. The companies listed on pages 23 to 25 of this Valuation Report have similar operational and financial characteristics to those BRP and BRT and;
iii. The shares of those companies have adequate liquidity and are covered by several research departments of investment banks, and thus their prices appropriately reflect growth perspectives, profitability and risks inherent to companies in the same sector as BRP and BRT.

41
Appendix C. Calculation of the NPV of holding expenses

42
Calculation of the NPV of holding expenses
(1) Calculation using Gordon’s perpetuity growth model. Assumes a perpetuity growth rate of 2.5% in nominal terms, in U.S. dollars.(2) Source: Financial statements of BRP and Credit Suisse estimates.(3) Source: Brazilian Central Bank (2007 year average and in September 30, 2008), Brazilian Central Bank Focus Report (Jan. 23, 2009) and Credit Suisse estimates.
Assumptionsn Expenses projections in nominal Brazilian reaisn Expenses flows converted to US$ and then discountedn Base date of September 30, 2008: present value of cash flows as of September 30, 2008n Period of projections: from 2008 to 2018n WACC in nominal terms, in US$, of 10.0%(a)
n Perpetuity growth of 2.5% in nominal US$(b)
For the correct application of the market multiples of comparable companies methodology to BRP, it is necessary to subtract from the EBITDA of BRT, the operating company, all general and administrative holding expenses of BRP, as this company does not have any own cash flows other than the cash flows received from its controlling company in order to honor its expenses.
The net present value of BRP holding general and administrative expenses is demonstrated below:
(a) For additional information regarding the calculation of WACC, see pages 45 and 46 of this Report.(b) Equivalent to a growth rate in nominal R$ of app. 4.5%, based on the CAGR between 2008 e 2018.
BRP holding general and administrative expenses 2007 2008 2009 2010 2011 2012 2013 2014 2015 2016 2017 2018
General and administrative expenses (R$ million) (2) (18.41) (19.49) (20.40) (21.31) (22.27) (23.27) (24.32) (25.42) (26.56) (27.76) (29.00) (30.31)
R$/ US$ FX rate - year average (3) 1.95 1.84 2.29 2.23 2.25 2.28 2.40 2.42 2.47 2.52 2.57 2.62
General and administrative expenses (US$ million) (9.45) (10.61) (8.91) (9.56) (9.90) (10.21) (10.13) (10.49) (10.75) (11.02) (11.29) (11.58) 0.125 0.75 1.75 2.75 3.75 4.75 5.75 6.75 7.75 8.75 9.75
Multiplying factor 0% 25% 100% 100% 100% 100% 100% 100% 100% 100% 100% 100%
Discounted cash flows (US$ million) - (2.62) (8.29) (8.09) (7.62) (7.14) (6.44) (6.06) (5.65) (5.26) (4.91) (4.57)
WACC 10.00%
Perpetuity growth 2.50%
NPV on September 30, 2008 (US$) (123.4)
R$/US$ FX rate on September 30, 2008 (3)1.91
NPV on September 30, 2008 (R$) (236.3)

43
WACC
WACC has been calculated with the combination of the cost of equity (Ke) and cost of debt (Kd) estimated for BRP, considering a target capital structure
n Ke was estimated by the appraiser using the CAPM - Capital Asset Pricing Model, adjusting for country riskn Kd was estimated by the appraiser considering credit risk and current situation of the debt capital markets
WACC
Cost of Debt (Kd) Cost of Equity (Ke)
U.S. Risk-freerate (Rf)
Beta (B) Equity RiskPremium (Rm)
Country RiskPremium (CRP)
Kd = Kdb * (1- tax rate) Ke = Rf + (B * Rm) + CRP
WACC = D / (D + E) * Kd + E / (D + E) * Ke

44
WACC CalculationAssumptionsTax Rate - Brazil 34.00%Risk Free Rate (U.S.) (R f)
(1)2.62%
Equity Risk Premium (Rm) (2) 6.70%
Country Risk Premium (CRP) (3) 2.79%
Debt / Levering Unlevered
Comparable Companies Beta (B) (4) Equity (4) Factor (5) Beta (6)
Telesp 0.484 11.3% 1.07 0.45GVT 0.843 5.0% 1.03 0.82Vivo Participações 1.002 37.0% 1.24 0.81TIM Participações 0.915 22.2% 1.15 0.80Telemar 0.788 58.3% 1.38 0.57Telmex 1.032 33.4% 1.22 0.85America Móvil 1.237 15.3% 1.10 1.12
Average 0.90 26.1% 0.77Median 0.92 22.2% 0.81
Pre-tax Cost of Debt 7.0% 7.5% 8.0% 8.5% 9.0% 9.5%Post-tax Cost of Debt 4.6% 5.0% 5.3% 5.6% 5.9% 6.3%
Debt/ Debt/ Average Levering Levered Cost of Debt/
Equity T. Capital (7) U. Beta Factor Beta (8) Equity (9) Equity Weighted Average Cost of Capital
30.0% 42.9% 0.77 1.28 0.99 12.0% 30.0% 9.8% 9.9% 10.0% 10.1% 10.2% 10.3%35.0% 53.8% 0.77 1.36 1.05 12.4% 35.0% 9.7% 9.8% 9.9% 10.0% 10.2% 10.3%40.0% 66.7% 0.77 1.44 1.11 12.9% 40.0% 9.6% 9.7% 9.8% 10.0% 10.1% 10.2%45.0% 81.8% 0.77 1.54 1.19 13.4% 45.0% 9.4% 9.6% 9.7% 9.9% 10.0% 10.2%50.0% 100.0% 0.77 1.66 1.28 14.0% 50.0% 9.3% 9.5% 9.6% 9.8% 10.0% 10.1%55.0% 122.2% 0.77 1.81 1.40 14.8% 55.0% 9.2% 9.4% 9.5% 9.7% 9.9% 10.1%60.0% 150.0% 0.77 1.99 1.54 15.7% 60.0% 9.1% 9.3% 9.5% 9.6% 9.8% 10.0%
(1) Yield of 10-year U.S. gonverment Treasury Bonds, on January 23, 2009. Source: Bloomberg.(2) Long term Equity Risk Premium, calculated by Credit Suisse's Financial Strategies Group .
(3) Brazilian Country Risk Premium estimated by Credit Suisse's Economic Research department.
(4) Source: Bloomberg, on January 23, 2009.
(5) Levering Factor: 1+ (1-tax rate) x (Debt/Total Capital).
(6) Unlevered Beta: Beta / Levering Factor.
(7) Total Capital = Debt + Equity.
(8) Levered Beta: Beta x Levering Factor.
(9) Cost of Equity: R f + B x (Rm - R f).

45
Appendix D. Terms and definitions used in the valuation report

46
Terms and definitions used in the valuation report
n ARPU: average revenues per user
n B: beta
n CAGR: compound annual growth rate
n Capex: capital expenditures, or investments in capacity maintenance and/or expansion
n CAPM: capital asset pricing model
n CAPU: cost of acquisition per user
n CRP: country risk premium
n D: debt
n E: equity
n EBIT: earnings before interest and taxes
n EBITDA: earnings before interest, taxes, depreciation and amortization
n Kd: cost of debt, net of taxes
n Kdb: cost of debt, gross of taxes
n Ke: cost of equity
n NPV: net present value, calculated based on a projected cash flow and a certain discount rate
n Spread: difference between prices of two shares
n WACC: weighted average cost of capital
47
Appendix E. Additional information and disclaimers

48
Additional information and disclaimers
The following information is important and must be carefully and thoroughly read:
1. This Valuation Report has been prepared for exclusive use of the Board of Directors of Telemar, its shareholders and BRP’s shareholders for the purpose of their evaluation of the proposed Mandatory TO, and may not be used or relied upon for any other purpose. This Valuation Report must not be used by any third party and for any other purpose without the prior written consent of CS. This Valuation Report, including its analyses and conclusions, do not constitute a recommendation to any shareholder of Telemar or BRP or member of the Board of Directors of Telemar on how to vote or act in connection with any matter related to the Mandatory TO. CS will not be liable for any direct or indirect losses or loss of profits resulting from the use of this Valuation Report. The base date used in this Valuation Report is January 23, 2009. The base date of financial information used in this Valuation Report is September 30, 2008.
2. In order to arrive at the conclusions presented in this Valuation Report, we have performed the following, among other things: (i) analysis of the consolidated financial statements prepared in accordance with accounting practices adopted in Brazil of Brasil Telecom S.A , audited by DeloitteTouche Tohmatsu for the fiscal year ended on December 31, 2005, 2006, 2007 and September 30, 2008; (ii) discussions with members of Telemar’s management about the criteria / assumptions to be adopted in order to estimate the operational expenses of the holding company BRP; and (iii) analysis of other information, financial studies, analyses, research and financial, economic and market criteria we deemed relevant (jointly referred to as “Information”).
3. With respect to our work, we do not assume any responsibility for independently investigating any of the information referred to above and have assumed that such information was complete and accurate in all its relevant aspects. Additionally, we have not been requested to perform, and have not performed, an independent verification of such information, or any independent verification or assessment of any assets or liabilities (contingent or not) of BRP, and we have not received any such assessment and have not assessed the solvency or fair value of BRP under any laws governing bankruptcy, insolvency or similar matters.
4. We do not make, and will not make, either expressly or implicitly, any representation or warranty regarding any information (including financial forecasts of the operational expenses of the holding company BRP or assumptions and estimates on which such forecasts were based) used in the preparation of this Valuation Report. Additionally, we do not assume any obligation to make, and have not made, any physical inspection of the properties or facilities of BRP. We are not an accounting firm and do not provide accounting or auditing services related to this Valuation Report. We are not a law firm and do not provide legal, tax or fiscal services related to this Valuation Report.
5. The controlling shareholders of BRP and/or Telemar and their management did not (i) in any way interfere with, restrict or hinder our access and our capacity to obtain and use the information necessary to prepare this Valuation Report, (ii) determine the methodologies used in the preparation of the analyses, or (iii) in any way restrict our capacity to arrive at the conclusions independently presented in this Valuation Report.

49
Additional information and disclaimers (cont’d)
6. During the preparation of this Valuation Report, CS has not had access to any information or had any discussions with the controlling shareholders of BRP, its management and/or its auditors. In particular, CS has not received, reviewed or discussed any financial projections of BRP with its controlling shareholders and/or its management.
7. The preparation of a financial analysis is a complex process that involves various decisions on the most appropriate and relevant financial analysis methods, and the application of these methods. In order to arrive at the conclusions presented in this Valuation Report, we applied a qualitative approach to the analyses and factors considered by us. We arrived at a final conclusion based on the results of the analysis performed by us as a whole, and we did not reach individual conclusions based on or related to any of the factors or methods of our analysis. Therefore, we believe our analysis must be considered as a whole and that the examination of parts of our analysis and specific factors without considering the full context of our analysis and conclusions may lead to incomplete and incorrect interpretations of the processes used in our analyses and conclusions.
8. This Valuation Report provides an estimate with respect to the value of the shares issued by BRP and does not evaluate any other aspect or implication of the Mandatory TO or any contract, agreement or understanding signed in relation to the Mandatory TO. We do not express any opinion on the value for which the shares related to the Mandatory TO could be traded on any securities market at any time. The results presented in this Valuation Report refer exclusively to the Mandatory TO, and do not apply to any other matter or operation, present or future, relative to BRP or Telemar, or to the economic group of which these companies are part or to the sector in which they operate.
9. Our Valuation Report is necessarily based on information provided to us as of the date of this Valuation Report and takes into account economic and market conditions and other conditions as they are and as can be evaluated on this date. Although future events and other developments could affect the conclusions presented in this Valuation Report, we do not have any obligation to update, revise, rectify or revoke this Valuation Report, wholly or partly, as a result of any subsequent development or for any other reason.
10. Our analyses deal with BRP as an operation independent from Telemar (stand-alone operation) and, thus, do not include operating, tax or any other benefits or losses, including any premiums, synergies, incremental value and/or costs, if any, that Telemar or BRP may have as a result of the completion of the Mandatory TO, if consummated, or of any other transaction. The evaluation also disregards any operational and financial gains or losses that may result after the Mandatory TO due to a commercial change in the business currently existing between Telemar and BRP.
11. Telemar has agreed to reimburse us for our expenses and to indemnify us and certain persons related to us for certain liabilities and expenses that may arise as a result of our retained services.

50
Additional information and disclaimers (cont’d)
12. We have provided, from time to time, in the past, investment banking services and other financial services to Telemar, its controlling shareholders, subsidiaries and companies under common control (“Affiliates”) for which we were remunerated, as mentioned in “Evaluator Representations” of this Valuation Report (for the purposes of Schedule III, X, “d”, 5, of CVM Instruction No. 361/02) and may, in the future, provide these services to Telemar and BRP and/or their Affiliates, for which we expect to be remunerated. We are a financial institution that provides a variety of financial services and other services related to securities, brokerage and investment banking. In the normal course of our activities, we may acquire, hold or sell, on our behalf or on the behalf of our clients, shares, debt instruments and other securities and financial instruments (including bank loans and other obligations) of Telemar and BRP and of any other companies involved in the Mandatory TO, as well as provide investment banking services and other financial services to these companies and their Affiliates. Also, the professionals of our research departments and of other divisions may base their analyses and publications on different operational and market assumptions and on different analysis methodologies compared with those used in the preparation of this Valuation Report, with the result that the research reports and other publications prepared by them may contain different results and conclusions when compared with those herein presented. We also adopted policies and procedures to preserve the independence of our research analysts, who may have different views from those of our investment banking department. We also adopted policies and procedures for preserving the independence between investment banking and other areas and departments of CS, including but not limited to asset management and the proprietary desk for trading shares, debt instruments, securities and other financial instruments.
This Valuation Report is the intellectual property of CS.
The financial calculations contained in this Valuation Report may not result in exact sums due to rounding.
Banco de Investimentos Credit Suisse (Brasil) S.A.
José Olympio Pereira Bruno Amaral Daniel AngerMarco Gonçalves
[by: /s/ Daniel Anger][by: /s/ Bruno Amaral][by: /s/ Marco Gonçalves][by: /s/ José Olympio Pereira]

51
BANCO DE INVESTIMENTOS CREDIT SUISSE (BRASIL) S.A.Avenida Brigadeiro Faria Lima, 3064 – 13th floor01451-000 São Paulo, SP+55 11 3841 6000www.credit-suisse.com