brazilian interest rate futures: evolution and forecast ... · brazilian interest rate futures:...
TRANSCRIPT

Brazilian Interest Rate Futures: Evolution and Forecast Performance
Emilio Carlos Dantas Costa*
Matthew Nespoli** Patrice Robitaille**
October 2007
Abstract The market for Brazilian interest futures, DI futures, has grown considerably over the past decade and has seen rising investor participation from abroad. In this paper, we investigate how well DI futures forecast the Brazilian central bank’s policy rate over the last couple of years of the fixed exchange rate regime (1996-98) and since the adoption of inflation targeting in 1999. In the full sample, the average error from DI futures-based forecasts is large, although imprecisely estimated, and increases in the forecast horizon. Forecast errors are especially large in 1997 and 1998. Under inflation targeting, futures-based forecasts systematically over-predicted future policy rates. Systematic forecast errors reflected term premiums, investors’ learning about central bank behavior, and unusual events. Within-sample, futures-based and survey-based forecasts beat random walk forecasts over the post-2002 period.
* Central Bank of Brazil ** Board of Governors of the Federal Reserve System
The authors would like to thank John Ammer, Sally Davies, Fang Cai, and Mark Carey, Cícero Augusto Vieira Neto of the BM&F, Fábio Coelho dos Santos of the Brazilian central bank, and Joao Batista da Silveira , Rodrigo Fiaes, and Lucas Ralston Bielawski, of Gavea Investimentos for helpful discussions. We also thank Ericsom Semerene Costa of the Brazilian Central Bank for help with the swaps data. Justin Vitanza provided superb research assistance. All errors are our own. The views expressed in this paper are solely the responsibility of the authors and should not be interpreted as reflecting views of the Board of Governors of the Federal Reserve System or of any other person associated with the Federal Reserve System, nor of the Central Bank of Brazil. Corresponding author: [email protected].

I. Introduction
The market for Brazilian interest futures, DI futures, is one of the largest
derivatives markets in emerging market economies, has grown considerably over the past
decade, and has seen rising investor participation from abroad.1 The DI futures market
far exceeds in size the secondary market for fixed-rate Brazilian government bonds and
interest rate swaps.2 The relative size and liquidity of the market and the availability of
timely market information have made DI futures the most popular market-based forecasts
for the Brazilian central bank’s policy rate, the Selic rate.
In this paper, we overview the development of the DI futures market and
investigate well DI futures forecast the target Selic rate. We also compare futures-based
forecasts with survey-based forecasts that became available in early 2002 and with a
naïve random walk forecast. We restrict our attention to the performance of forecasts of
up to three months ahead.
The period covered by our empirical investigation, May 1996 to August 2007,
witnessed a dramatic change in monetary regime, as Brazil’s fixed exchange rate regime
was abandoned in January 1999 and an inflation targeting regime was adopted the
following July. Because we are interested, in part, in comparing forecast performance
between the two monetary regimes, we omit from consideration the several months in
1999 that marked the transition period between the two monetary regimes. That said, the
international experience indicates that it takes time to build up policy credibility under an
1 IMF (2002, 2006). 2 Over the first half of 2006, average daily transactions volume in the DI futures market was six times that of the secondary market for fixed-rate government bonds (data from Central bank and Treasury monthly press release). In mid-2006, open interest on interest rate swaps was an estimated R$5 billion on a major part of this market (swaps that are registered with the BM&F), adopting the convention of assuming that the average notional value of contracts is R$50 thousand. (Data are available by number of contracts only.) We thank Ericsom Semerene Costa of the Brazilian Central Bank for help with the swaps data.

2
inflation targeting regime is adopted (e.g., see Bernanke et al 1999). We take that fact
into account in our interpretation of forecast performance of DI futures. Another
rationale for dropping the transition period that separates the two monetary regimes is
that this period was quite special, but, since Brazil has experienced other periods of
financial turmoil, taking that argument far enough would call for removing so much of
the sample that there would be no empirical paper to write. In our analysis of the post-
1999 period, we aim for an intermediate position by considering to what extent our
results may reflect special events that are unlikely to reoccur.
We find that over the full sample and subsamples, the average error from DI
futures-based forecasts is large, although imprecisely estimated, and increases in the
forecast horizon. Forecast errors are particularly large over the last two years of the
dollar peg. Under the inflation targeting regime, futures-based forecasts systematically
over-predict future policy rates. Systematic forecast errors are often seen as evidence of
a term premium in futures-based forecasts and we find evidence consistent with the view
that term premia vary over time. We do not rule out that systematic forecast errors
reflected investors’ learning about central bank behavior under the new regime or
reflected unusual events, such as the turmoil of 2002, that are not likely to reoccur.
Futures-based forecast errors have declined in recent years. One interpretation of that
decline is that the growing presence of foreign investors in DI futures has driven down
the term premium. In sub-samples that cover the more recent past, evidence of
systematic forecast errors is weaker. Futures-based forecasts in recent years also
outperformed survey-based and naïve random walk forecasts in terms of having a lower
root mean squared error.
3
Our results add to a large body of work on the forecast proprieties interest rate
futures and forwards. Most of this work has focused on the experiences of the
industrialized countries. Krueger and Kuttner (1996) and Robertson and Thorton (1997)
study the forecast properties of fed fund futures. Chernenko, Schwarz, and Wright (CSW
2004) survey the forecast properties of a broad array of asset prices, including futures and
forwards on U.S. and other industrial country interest rates. The results in this paper are
consistent with those of CSW and a large number of related studies, who emphasis that
great caution should be taken in reading futures and forwards as market expectations, as
they often incorporate a term premium that is often time-varying. But, other factors
likely also shaped the forecast process, the sample is small, and arguably, the post-1999
period witnessed some extraordinary events.
II. The DI-Futures Market
DI futures were created in 1991 and are traded on Sao Paulo’s Mercantile and
Futures Exchange (Bolsa de Mercadorias e Futuros), the BM&F. Currently, each
contract has a notional value of R$100 thousand (equivalent to US$45 thousand). The
contract is cash settled, and is marked to market every business day. Final settlement is
on the first business day of the contract month and the last trading day is the preceding
business day. The final settlement price is the geometric average of the DI rates over the
business days between the day of the trade and the last trading day, inclusive, where the
DI rate is an overnight interbank borrowing rate.3 DI futures contracts currently trade for
3 The DI rate is the average interest rate on overnight on repurchase agreements that are collateralized by private securities and is compiled by CETIP, a private clearing house. The Selic Rate is the average interest rate on overnight repurchase agreements that are collateralized by government debt instruments. The Selic rate is compiled by the central bank.

4
settlement not only for the next few months ahead, but also for settlement in January,
April, July, and October over several years into the future.
The DI futures market has seen considerable growth in recent years. As can seen
in Figure 1, the notional amount of outstanding contracts, or open interest, has more than
tripled since the end of 2003, and exceeded R$600 billion in December 2006.
Transactions volume has also grown considerably as well.
Figures 2a through 2d display average monthly transactions volume and open
interest by contract horizon between May 1996 and March 2007. Only those months that
had a contract settling in January, April, July, and October are plotted because market
activity is relatively light for contracts that settle in other months. The dashed lines plot
values in constant reais of December 2005. Market activity has grown considerably in
recent years, but falls off considerably beyond contract horizons of five months.4 Crisis
periods in the late 1990s and in 2002 depressed activity in DI futures, particularly at
investment horizons of beyond two months. The considerable fall in market activity over
these periods is the reason for our focus on the performance of near-term forecasts.
Growth in the DI futures market has been driven in by the sizeable expansion in
real-denominated fixed-rate government debt in recent years, as the greater amount of
fixed rate debt has increased the demand for market-based hedges against interest rate
risk. As of 2003, much of the Brazilian government’s marketable debt was linked to the
Selic rate. (The rest was either denominated in a foreign currency or had some other
form of indexation.) By 2006, fixed-rate government debt accounted for about
30 percent of the outstanding domestically-issued government debt. The maturity profile
4 The market’s growth in recent years is more striking when considering that the headline CPI registered a cumulative increase of 50 percent between end-1998 and end-2003, while it rose only 17 percent between end-2003 and end-2006.

5
of the fixed-rate government debt has lengthened as well, although as of mid-2007, over
70 percent of the debt sold domestically had a maturity of up to two years.5
Figure 3 displays the market shares of major groups of investors in DI futures as
they were classified by the BM&F through early 2007: banks (both domestic and
Brazilian subsidiaries of foreign banks), domestic institutional investors, and other
foreign investors.6 Market share is equal to the notional value of all outstanding
contracts. Other foreign investors, which are called “foreign institutional investors” in
the BM&F data, are types of investors that have been allowed to enter Brazilian capital
markets since January 2000 without using a bank in Brazil as an intermediary. Because
they enter under the legal vehicle called Resolution 2689, they are also known as Res
2689 investors. Res 2698 investors includes foreign banks that do not have a Brazilian
subsidiary, foreign institutional investors, hedge funds, non-financial firms, and
individual investors. Since 2003, the market share of banks has declined and the market
shares of other domestic and Res 2698 investors have risen.
Because data on banks’ proprietary and own positions were not available, it is
impossible to know to what extent the growing market share of the Res 2698 investors
reflects a rise in foreign investor participation as opposed to a shift in the composition of
capital inflows from abroad from Brazilian bank-intermediated to non-Brazilian bank-
intermediated means. Figure 4 sheds a little more light into this question by displaying
the evolution of gross positions of the three broad investor classes between
January 1, 2002, when the data became available, and March 29, 2007. A salient
5 Brazilian Central Bank, Monthly Press Release, Federal Government Securities Debt and Open Market (Portuguese version), August 2007. 6 Domestic institutional investors comprise a wide range of investors: mutual funds, pension funds, and insurance companies, non-financial companies, and even wealthy individuals.

6
development is the rising net long position of the Res 2689 investors beginning in mid-
2004. At the end of March 2007, this investor group held about a third of the long
positions in the market and the notional value of its net long position was about
R$160 billion.
The rising gross and net long position of Res 2689 investors is consistent with the
evidence that investors from abroad have preferred to take long positions on Brazilian
interest rates, which have been relatively high, via derivatives rather than through the
fixed rate government bond market.7 For both domestic and foreign investors, interest
rate derivatives are more attractive than government bonds for tax reasons and because of
other impediments to the development of the government bond market.8
The rise in the gross and net short positions of domestic institutional investors is
consistent with the considerable commentary that one hears about hedging activities by
the Brazilian mutual funds. Mutual funds are very popular investment vehicles in Brazil,
more popular than savings accounts and CDs. Government bonds have accounted for the
lion’s share of the portfolios of domestic mutual funds and other institutional investors.
Owing to the country’s long history of high and variable inflation, Brazilian mutual funds
benchmarked their returns to the DI rate and held Brazilian government floating rate debt
to supply investor demand for protection against interest rate risk. After 2003, the
Brazilian government debt management pursued more aggressively its goal to reduce its
7 For example, in August 2006, the Munich-based senior portfolio manager for Pimco, a large investor in emerging market bonds, stated that the company “has been investing in Brazil's local debt market through derivatives, mainly interest rate futures and interest rate swaps.” “Pimco ups exposure to Brazil's local debt market,” Reuters, August 28, 2006, downloaded from Factiva on September 25, 2006. 8 See Chapter III in the IMF’s Global Financial Stability Report, April 2006. Until February 2006, foreign holdings of government debt that were sold locally were subject to income and capital gains taxes while DI futures were not subject to these taxes. Foreign investor holdings of government debt have risen since February 2006, but their holdings of fixed rate government debt have remained small. Amante, Arujo, and Jeanneau (2007) highlight a number of impediments to the development of the secondary market for Brazilian government bonds.

7
reliance on floating rate and increase its reliance on fixed-rate debt as a source of funding
(e.g., Brazilian Ministry of Finance, 2005). Conversations with market participants and
other observers indicate that mutual funds in part responded to the change in funding
policy in part by increasing hedging activities in the futures market. The asset pricing
implications of these developments are discussed below.
III. Broad Brush Overview of Monetary Policy
Figure 5 displays the target Selic rate, Selic rate, and twelve-month headline
inflation between January 1996 and August 2007. After a fixed exchange rate regime
was introduced in July 1994, inflation fell from very high levels (not shown) to single
digit levels by the mid-1990s. In late 1997 and again in late 1998, the overnight rate was
roughly doubled, surpassing 45 percent at their peaks, when authorities attempted to
support the currency. The fixed exchange rate policy was abandoned in January 1999.
On March 4, 1999, a new central bank governing board took office, began to
announce the target for the Selic rate, and raised the target to 45 percent. The Selic rate
was subsequently reduced and stood at 21 percent by the following July, when an
inflation targeting regime was formally launched.
There have been three tightening phases under the inflation targeting regime.
Between March 21, 2001 and July 17, 2001, the Selic rate target was raised from 15.25 to
19 percent in several steps to counter an inflationary threat that stemmed in part from an
adverse supply-side shock (a domestic energy crisis). The policy rate was subsequently
reduced to 18 percent by July 2002.
An October 14, 2002 inter-meeting move that raised the Selic rate target 300 basis
points to 21 percent amid considerable financial turmoil marked the beginning of a

8
second tightening phase. This period was characterized in part by a sharp depreciation of
the currency and a sizeable increase in the sovereign credit risk spread (not shown). Most
observers agree that investor concerns that the incoming Lula government would relax
macro policies contributed to the financial turbulence. After the Lula government took
office in January 2003, the Selic rate was raised in several more steps, peaking at
26.5 percent in February. Subsequent monetary easing brought the overnight rate down
to 16 percent in April 2004.
The third tightening phase began on September 15, 2004 and the policy rate was
raised in several steps from 16 percent to 19.75 percent by May 2005. An easing phase
began in September 2005 that has continued, bringing the target Selic rate to
11.25 percent in September 2007. Twelve-month inflation declined from double-digit
levels in early 2003 to 3.1 percent in March 2007, the lowest level since the late 1990s,
but has since then crept up and stood at 4.3 percent in August 2007.
Between 1999 and 2005, meetings of the central bank’s governing board were
held on a monthly basis. Since 2006, meetings have been held eight times a year. Since
1999, there have been three inter-meeting moves, the October 14, 2002 decision and two
moves that reduced the target by 50 basis points (March, 3 2000 and July 7, 2000).
IV. Forecast properties of DI Futures
We focus on the forecast properties of the DI futures for the target Selic rate.
Prior to March 5, 1999, we use the actual Selic rate. Because the forecast properties of
the target Selic rate, Selic rate, and DI futures were qualitatively similar, the terms Selic
rate and target Selic rate are used interchangeably unless otherwise noted.

9
We obtain monthly observations for the fifteenth of every month by linearly
interpolating the prices between the front month and major contract months, using the
price on last trade of the day. For months where the fifteenth falls on a weekend or
holiday, we use the following business day. From the interpolated prices, we compute
the implied one-month forward yields one, two, and three months ahead, keeping track of
business days. We employ these forward yields as the market’s forecast of the geometric
average of the Selic rate one, two, and three months ahead. These forecasts are compared
with the realized target for the Selic rate (geometric average).
Henceforth, day t refers to business day t.9 Let nkktf ++ , be the day t forward rate
that is implied by futures market quotes for the period t+k to t+k+n. Let nktktr +++ ,~ be the
realized net Selic target rate between t+k and t+k+n, where
100*)1)100/1((~, −+=
+
=++++ C
nk
kjjtnktkt rr .
The forecast error is defined as
nkktnktkt fr +++++ − ,,~
The top panels in Figures 6a-c display the Selic rate and the one- to three-month
ahead forecasts and the bottom panels display the forecast errors. The plots are truncated
over the early part of the sample so that forecast errors over the latter part of the sample
are at least somewhat visible. (There are gaps in the graphs because of missing data.)
Forecast errors in 1998 and 1997 were very large. Investors did not seem to have
anticipated the doubling of the Selic rate in late 1997 and 1998 to very high levels, as the
realized ex post Selic rate was well above the futures-based forecast. Between July 1999
9 Our notation follows that of Gurkaynak, Sack, and Swanson (2005).

10
and early 2003, forecast errors were often negative, that is, futures-based forecasts were
often above the ex post realized Selic rate. Since then, for the two and three-month ahead
forecasts, there have been both positive and negative misses. At all three forecast
horizons, forecast errors have fallen noticeably since mid-2004.
Our formal empirical analysis covers the period May 1996 to August 2007, but
several months were excluded from the full sample. We dropped an observation if at
least one of the futures-based forecasts was unavailable. As a result, June 1997 and
March, April, September, and December 1998 were removed from the sample. We also
omitted observations that corresponded to the transition period in 1999. Because the first
three-month ahead forecast after the launching of inflation targeting in July 1999 was for
the following October, our inflation targeting sample starts in October. Our full sample
contains 102 observations, 26 of which correspond to the fixed exchange rate period and
95 of which correspond to the inflation targeting period.
The columns in Table 1 display the mean ex post forecast errors for the full
sample and two sub-samples, in percentage points. Standard errors are shown under the
forecasts. Forecasts in bold are those for which the hypothesis that mean prediction error
is zero is rejected at the 10 percent significance level. Forecast errors are increasing in
the forecast horizon. In the full sample, average forecast errors are large and negative,
i.e., futures forecasts exceeded ex post realized rates. Over the fixed exchange rate
period, on average, ex post realized rates were well above futures-based forecasts,
corresponding to (as is also seen in Figure 6). However, the average forecast errors are
imprecisely measured and are not statistically different from zero.10 Over the inflation
10 Standard errors are Newey-West autocorrelation and heteroschedasticity-robust with the lag truncation parameter set equal to the number of overlapping observations.

11
targeting period, average forecast errors are large and negative, i.e., on average, futures-
based forecasts exceeded ex post Selic rates, and the null that the average forecast error is
zero is rejected.
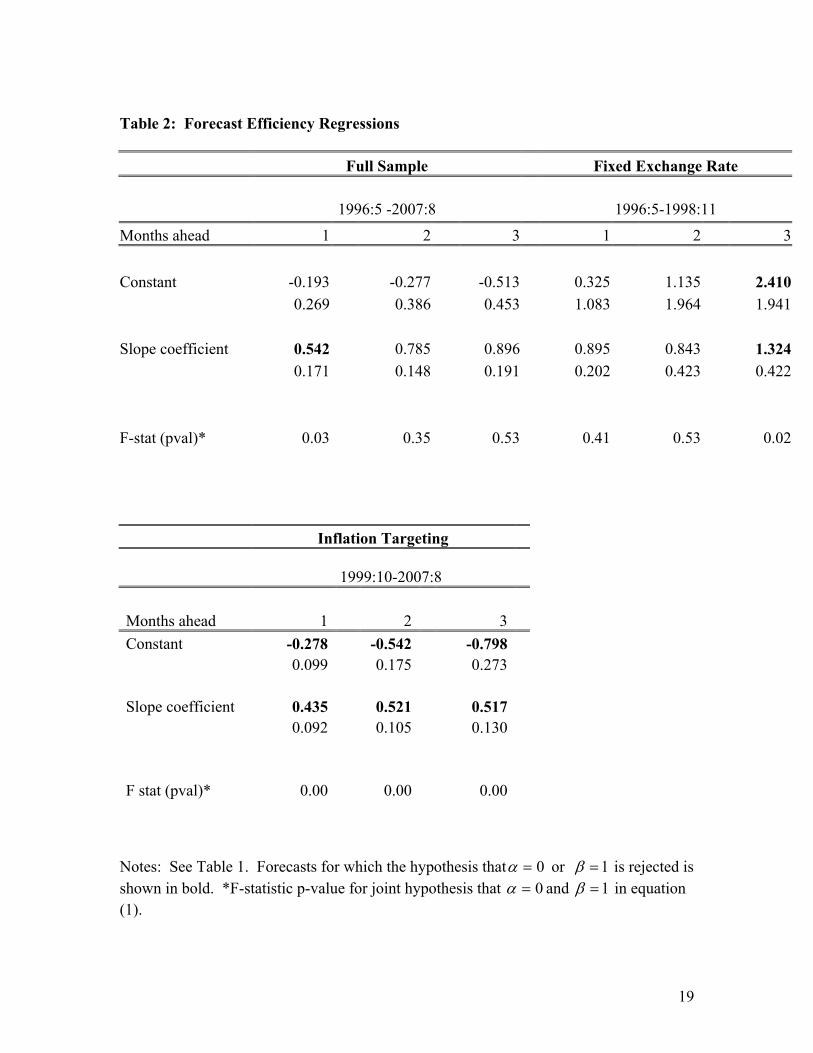
One interpretation of the systematic forecast errors over the inflation targeting
period is that futures-based forecasts incorporated a term premium. To investigate
further, we estimate the regression
ttnktkttnktkt rfrr εβα +−+=− ++++++ )(~,, . (1)
and test the hypothesis that 1=β and the joint hypothesis that 0=α and .1=β ( tr is the
spot rate.) In Table 2, over the inflation targeting period, β is significantly different
from one and the joint hypothesis is also rejected at all three forecast horizons.
We offer several interpretations of the finding that, over the post-1999 period,
there were systematic and positive forecast errors that were time varying:
Time-varying term premiums. Rejection of forecast rationality is a rejection of
the expectations theory of the term structure. Time-varying term premiums are the most
frequently-offered explanation.
Rational learning. Agents were engaged in a rational learning process following
the 1999 shift in the monetary regime.
Since inflation targeting was new, agents could have been learning about the
inflation-output tradeoff of the central bank. Brazil’s inflation targeting regime has a
very wide tolerance interval so that monetary policy could accommodate shocks. But the
wide confidence interval also made it difficult to assess authorities’ true output-inflation
trade-off, particularly since the central bank is not legally independent. In this scenario,

12
investors expected inflation to be higher and expected nominal (but not real) interest rates
would be higher. Investors updated their expectations over time.
Or, investors expected higher inflation and hence policy rates because they had a
different view of the underlying macro economy than did the central bank. Informal and
informal indexation of wages and prices has been common. Investors could have
believed that there was more momentum (inertia) in the inflation process than did the
central bank. Since Brazil has been experiencing a disinflation process, investors had
higher inflation expectations and expected future policy rates to be higher.
Brazil’s early experience with inflation targeting was clearly characterized by a
learning process. In Figures 6a-c, the first three shaded regions denote three “inflation
scare” episodes that were identified by Werlang (2002), a member of the central bank’s
monetary policy board (the Copom) between 1999 and mid-2000. These episodes were
characterized by adverse supply-side shocks that resulted in a sizeable increase in
inflation expectations twelve-months ahead, according to the central bank’s survey.11 In
both instances, the central bank regarded the price increases as reflecting temporary
shocks and did not alter policy. The view that the inflationary effects of the shocks were
temporary was communicated in the minutes of the central bank board meetings, which
were released two weeks after the meeting in 1999 (one week later beginning in 2000).
According to Werlang, as inflation continued to fall, the public learned from these
experiences and did not over-react to a supply-side shock in mid-2000.
11 The July 1999 shock was a sizeable upward adjustments in government-administered prices. Many government-administered prices are contractually linked to the real-dollar exchange rate, and experienced large upward adjustments because of the sizeable depreciation of the currency earlier that year. The supply-side shock the following October and November reflected jumps in food prices. Administered and food prices have high weights in the headline CPI (currently about 30 and 20 percent) and so changes in these prices have a major effect on headline inflation.

13
In Figures 6a-c, futures-based forecasts were more elevated relative to the ex post
policy rate during these two episodes in 1999 than they were in 2000. So, it is possible
that financial market participants initially believed that the central bank would be very
aggressive in countering adverse supply-side shocks, only to later update their beliefs.
The third and forth shaded areas of the figures pertain to unusual circumstances that are
covered below.
Special shocks. Persistent forecast errors over the post-1999 period could have
been the result of special shocks that are not likely to reoccur. The third shaded area
covers March to August 2001, which was characterized by a number of shocks, a major
one of which was domestic electrical energy crisis that led to widespread rationing and
price spikes in some energy markets. (Rationing actually stretched from roughly May of
that year to early 2002.) Minella, Springer, Goldfajn, and Kfoury (2002) note that that
after February 2001, “twelve-month inflation expectations were unusually sensitive to
actual inflation.” The central bank did raised its policy rate 300 basis points in 2001, but
futures-based forecasts were well above the ex post policy rate. In the 2002 episode, as
the financial crisis unfolded, investors may have foreseen that the central bank would
raise its policy rate.
Hedging demand/Institutional Developments. As discussed above, an increase in
fixed rate government since 2004 has increased domestic hedging activity in the futures
market. All else equal, a rise in hedging demand increases the term premium. But the
entry from abroad of investors that are net supplies of the interest rate hedge puts
downward pressure on the term premium component, all else equal.

14
The view that the entry of new types of investors from abroad that are net
suppliers of a hedge against interest rate risk has helped drive down yields is mentioned
frequently in the Brazilian financial press. If the rise in the supply of the hedge was big
enough, it could have driven down a term premium and help account for the fall in the
futures-based forecast error since 2004.12
In sum, because of rational learning, special shocks, and institutional
developments, forecast performance over the first few years of the inflation targeting
regime may not be a good guide to future performance. 13
V. Futures-based forecasts vs Survey-Based and Random Walk Forecasts
Survey-based forecasts of the future policy rate that have been only available
since November 2001, and so with caution, we compare the survey-based forecasts to
futures-based forecasts. Survey-based forecasts, although not as timely, should not
include a term premium, and so they might have performed better than the futures-based
forecasts. The first three-month-ahead forecast is available for March 2002. Monthly
survey-based forecasts were constructed so that they were comparable to the futures-
based forecasts, i.e., each survey-based forecast is a forecast of the monthly (geometric)
average of future Selic rates, one- to three-months ahead. In the central bank survey,
12 For example, Valor Economico, reported that the “persistence of interest from external investors for local assets—which ends up influencing the local agents—also helped in the decline in the DI future [yields]....” See “Markets: DIs fall in the BM&F: January 2008 projects 12.50 percent,” January 14, 2006 (in Portuguese).
13 There is the possibility that there may have been a rise in counterparty credit risk that had a noticeable effect on pricing of DI futures at times. In 1999, however, the Brazilian central bank was quick to provide the financial assistance needed prevent the collapse of two small banks (which had bet many times their equity capital on the wrong side on dollar futures contracts) from depleting the BM&F’s equity capital. Risk management practices at the BM&F were reformed. See “BM&F reestrutura-se para retomar espaço perdido,” Gazeta Mercantil, December 27, 1999. But Brazilian government bonds account for most of the collateral posted in satisfaction of margin requirements and government credit risk spreads were very high in 1999 and 2002.

15
initially, participants were asked for their forecasts for the Selic rate as of the end of each
month, up to about one year ahead. Beginning in March 2004, participants were asked
for their forecasts of the policy rate decision at the scheduled meetings. We assume that
investors did not forecast inter-meeting moves. There has been only one inter-meeting
move since 2002, which occurred on October 14 of that year. We use the average of the
survey responses.14
As can be seen in Figures 7a-7c, the one- to three-month ahead survey-based
forecast errors were one-sided for several months over much of the sample period.
Forecast errors swing from being positive in 2002 (the realized Selic rate was above the
predicted rate) to being negative by late 2003, and then move back to positive territory in
2004.
Average futures-based and survey-based forecast errors over this latter period are
displayed in Table 3. Quantifying the trend pictured earlier, although futures-based
forecast errors were still negative on average, i.e., ex post realized rates were below
forecasts, they were much lower than they were on average over the full sample period.
The one-month ahead forecast error is small and there is no evidence of systematic errors.
The two- and three-month ahead forecast errors were less than half their average levels
over the post-1999 sample, but we reject the null of a zero mean. In contrast, survey-
based forecast errors are large, but are larger but are not statistically significant from
zero.
The last two columns of Table 3 display average forecast errors over a sample that
includes only the last four years. With the exception of the near-term futures-based
14 Data are available on a daily basis and represent survey responses that have been received up to that day.

16
forecast error, futures and survey-based forecast errors decline and are not statistically
different from zero.
Table 4 provides one further look at forecast performance by displaying the ratio
of the root mean squared forecast error of futures-based and survey-based forecasts to
that of a random walk. Over the whole sample period and over the fixed exchange rate
regime, the future-based forecast beats a random walk.15 The random walk beats the
futures-based forecast over the post-1999 period, but not since at least 2002. Also,
futures-based forecast is at least as good as the survey-based forecasts for forecasts
further out than one month.
V. Conclusion
Central bankers around the world are often interested in understanding what
information can be gleaned from financial markets (see Bernanke 2004, Brazilian Central
Bank 2005). Although reports in the Brazilian financial press often imply that the DI
futures are good forecasts for the central bank’s policy rate, overall, our results support
the view that one should view financial market-based forecasts as market expectations
with great caution. Over the past few years, however, DI futures seem to have performed
fairly well as predictors of future short-term interest rates at a short forecast horizon.
15 The root mean squared errors (in levels, not shown) were much larger over the fixed exchange rate regime than under inflation targeting. Batini, Kuttner, Laxton (2005) find that for emerging market economies, the volatility of interest rates and other macro variables has been lower under inflation targeting regimes than under other monetary regimes.

17
References
Amante, A., Araujo, M., and Jeanneau, S., 2007. “The Search for Liquidity in the Brazilian Domestic Bond Market.” BIS Quarterly Review, June.
Batini, N. Kuttner, K., and Laxton, D., 2005. “Does Inflation Targeting Work in Emerging Markets? IMF, World Economic Outlook, September, pp. 161-186.
Bernanke, B., Laubach, T., Mishkin, F., and Posen, A., 1999. Inflation Targeting: Lessons from the International Experience. Princeton: Princeton University Press.
Bernanke, B, 2004. “What Policymakers Can Learn from Asset Prices.” Speech before the Investment Analysts Society of Chicago, Chicago, Illinois, April 15, 2004
Central Bank of Brazil, 2005, “Interest Rates, Term Structure, and Cost of Credit,” Inflation Report, March 2005, pp. 105-108.
Chernanko, S., Schwarz, C., and Wright, J. 2004. The Information Content of
Forward and Futures Prices: Market Expectations and the Price of Risk, International Finance Discussion Paper No. 808.
Gurkaynak, Sack, and Swanson. 2005. Do Actions Speak Louder Than Words?
The Response of Asset Prices to Monetary Policy Actions and Statements, The International Journal of Central Banking, May.
International Monetary Fund, 2002. “The Role of Financial Derivatives in
Emerging Markets,” Global Financial Stability Report, December (Chapter IV). _____, 2006. “Structural Changes in Emerging Sovereign Debt and Implications
for Financial Stability,” Global Financial Stability Report, April (Chapter III). Krueger, J. and Kuttner, K. 1996. The Fed Funds Futures Rate as a Predictor of
Federal Reserve Policy. The Journal of Futures Markets, Vol 16, No. 8, pp. 865-879. Minella, A., Springer, P., Goldfajn, I., and Kfoury, M., 2002. Inflation Targeting
in Brazil: Lessons and Challenges, Central Bank Working Paper No. 53, November. Ministry of Finance, Brazil, 2006, Public Debt Annual Report 2005. Robertson, J.C. and Thorton, D., 1997. Using Federal Funds Futures Rates to
Predict Federal Reserve Actions. Federal Reserve Bank of St. Louis Review Nov/Dec. Werlang, S., 2002, “Three Years of Inflation Targeting: Leading with Adverse
Expectations.” (In Portuguese), Powerpoint presentation at annual conference on inflation targeting, Central Bank of Brazil, May.

18
Table 1: Mean Ex Post Forecast Error (actual minus predicted)
Full Sample Fixed
Exchange Rate Inflation Targeting
1996:5 -2007:8 1996:5-1998:11 1999:10-2007:8 Months ahead
1 -0.178 0.797 -0.455 0.295 1.160 0.165
2 -0.332 1.461 -0.841 0.413 1.600 0.235
3 -0.563 1.854 -1.250 0.503 1.848 0.349 No. obs 122 27 95
Notes: Full sample period is May 1996 to August 2007, excluding the transition period between the fixed exchange rate and inflation targeting regimes (January-July 1999) and some months during the fixed exchange rate regime period (see text for details). Fixed exchange rate regime: May 1996 to November 1998. June 1997 and March, April, September, and December 1998 were dropped from the sample because some data for those months were missing. Inflation targeting: October 1999 to August 2007. In all tables, Newey-West autocorrelation heteroschedasticity-robust standard errors are shown below estimates. In Table 1, forecasts in bold are those for which the hypothesis that 0=α is rejected is rejected at the 10 percent significance level.
19
Table 2: Forecast Efficiency Regressions
Full Sample Fixed Exchange Rate 1996:5 -2007:8 1996:5-1998:11
Months ahead 1 2 3 1 2 3 Constant -0.193 -0.277 -0.513 0.325 1.135 2.410 0.269 0.386 0.453 1.083 1.964 1.941 Slope coefficient 0.542 0.785 0.896 0.895 0.843 1.324 0.171 0.148 0.191 0.202 0.423 0.422 F-stat (pval)* 0.03 0.35 0.53 0.41 0.53 0.02
Inflation Targeting
1999:10-2007:8 Months ahead 1 2 3 Constant -0.278 -0.542 -0.798 0.099 0.175 0.273 Slope coefficient 0.435 0.521 0.517 0.092 0.105 0.130 F stat (pval)* 0.00 0.00 0.00
Notes: See Table 1. Forecasts for which the hypothesis that 0=α or 1=β is rejected is shown in bold. *F-statistic p-value for joint hypothesis that 0=α and 1=β in equation (1).

20
Table 3: Futures-based versus Survey-based Forecasts
Mean Ex Post Forecast Error (actual minus predicted)
March 2002-August 2007 Last four years futures survey futures survey Months ahead
1 -0.031 0.217 0.177 0.022 0.122 0.138 0.047 0.064
2 -0.292 0.380 -0.029 0.021 0.168 0.264 0.108 0.142
3 -0.508 0.542 -0.180 0.008 0.221 0.408 0.195 0.246
Notes: See Table 1. Forecasts in bold are those for which the hypothesis that 0=α is rejected is rejected at the 10 percent significance level.
Table 4: Root Mean Squared Forecast Errors Relative to Random Walk Forecast
months ahead Full sample Fixed
Inflation targeting
March 2002:3 on last 4yrs
1 0.97 0.89 1.22 0.70 0.372 0.88 0.85 1.07 0.57 0.323 0.84 0.79 1.12 0.56 0.39
1 0.68 0.372 0.74 0.403 0.77 0.43

Figure 1
0
100
200
300
400
500
600
700
0
10
20
30
40
50
60
70
1996 1997 1998 1999 2000 2001 2002 2003 2004 2005 2006
Average monthly transaction volume
DI Futures, Notional Value of Outstanding Contracts $R billions $R billions

Figure 2a: Brazilian DI Futures*
0
3
6
9
12
15
18
1996 1997 1998 1999 2000 2001 2002 2003 2004 2005 2006 2007
Transactions Volume Front Month**
$R billion
0
3
6
9
12
15
18
1996 1997 1998 1999 2000 2001 2002 2003 2004 2005 2006 2007*Monthly averages of transactions volume and open interest for major contract months (January, April, July, and October).
One Month Ahead$R billion
0
20
40
60
80
100
120
140
160
1996 1997 1998 1999 2000 2001 2002 2003 2004 2005 2006 2007
Open Interest Front Month**
$R billion
0
20
40
60
80
100
120
140
160
1996 1997 1998 1999 2000 2001 2002 2003 2004 2005 2006 2007
One Month Ahead$R billion

Figure 2b: Brazilian DI Futures*
0
3
6
9
12
15
18
21
1996 1997 1998 1999 2000 2001 2002 2003 2004 2005 2006 2007
Transactions Volume Two Months Ahead
$R billion
0
3
6
9
12
15
18
21
1996 1997 1998 1999 2000 2001 2002 2003 2004 2005 2006 2007*Monthly averages of transactions volume and open interest for major contract months (January, April, July, and October).
Three Months Ahead**$R billion
0
20
40
60
80
100
120
140
1996 1997 1998 1999 2000 2001 2002 2003 2004 2005 2006 2007
Open Interest Two Months Ahead
$R billion
0
20
40
60
80
100
120
140
1996 1997 1998 1999 2000 2001 2002 2003 2004 2005 2006 2007
Three Months Ahead**$R billion
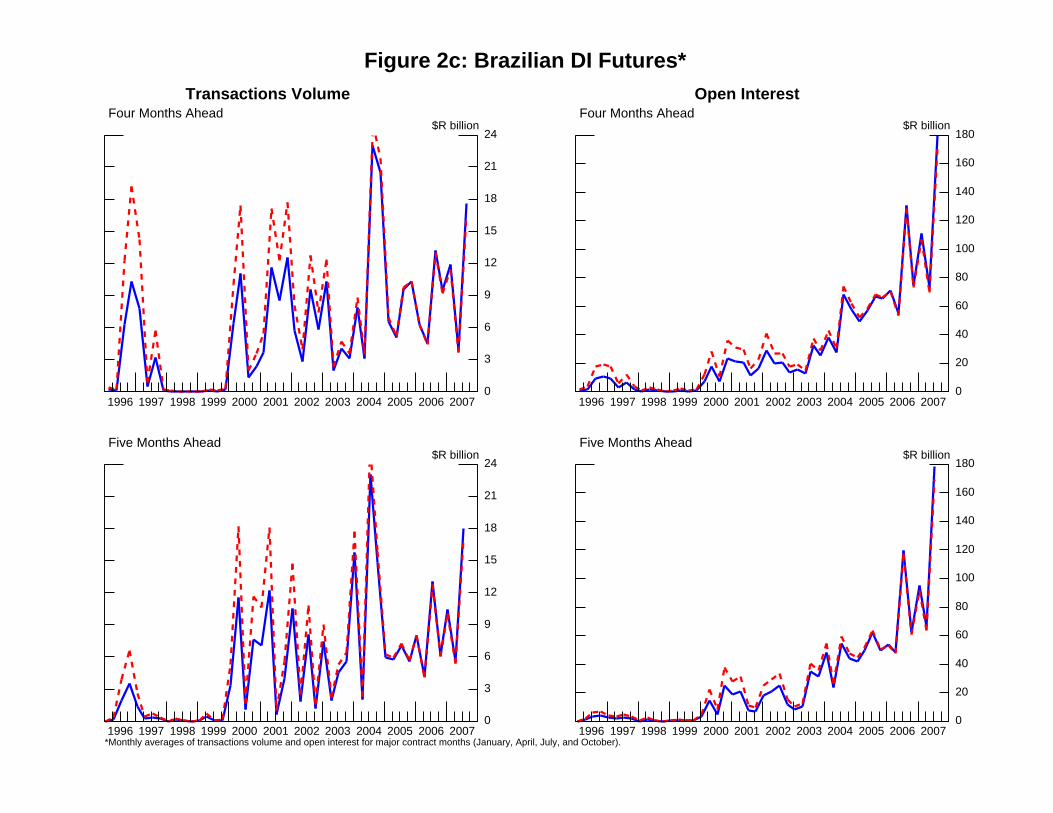
Figure 2c: Brazilian DI Futures*
0
3
6
9
12
15
18
21
24
1996 1997 1998 1999 2000 2001 2002 2003 2004 2005 2006 2007
Transactions Volume Four Months Ahead
$R billion
0
3
6
9
12
15
18
21
24
1996 1997 1998 1999 2000 2001 2002 2003 2004 2005 2006 2007*Monthly averages of transactions volume and open interest for major contract months (January, April, July, and October).
Five Months Ahead$R billion
0
20
40
60
80
100
120
140
160
180
1996 1997 1998 1999 2000 2001 2002 2003 2004 2005 2006 2007
Open Interest Four Months Ahead
$R billion
0
20
40
60
80
100
120
140
160
180
1996 1997 1998 1999 2000 2001 2002 2003 2004 2005 2006 2007
Five Months Ahead$R billion

Figure 2d: Brazilian DI Futures*
0
3
6
9
12
15
18
21
24
1996 1997 1998 1999 2000 2001 2002 2003 2004 2005 2006 2007
Transactions Volume Six Months Ahead**
$R billion
0
3
6
9
12
15
18
21
24
1996 1997 1998 1999 2000 2001 2002 2003 2004 2005 2006 2007*Monthly averages of transactions volume and open interest for major contract months (January, April, July, and October).
Twelve Months Ahead**$R billion
0
20
40
60
80
100
120
140
160
180
1996 1997 1998 1999 2000 2001 2002 2003 2004 2005 2006 2007
Open Interest Six Months Ahead**
$R billion
0
20
40
60
80
100
120
140
160
180
1996 1997 1998 1999 2000 2001 2002 2003 2004 2005 2006 2007
Twelve Months Ahead**$R billion

Notes to Figures 2a-2d The left hand side plots transactions volume and the right hand side plots open interest on the front month contract, on the one month- to six month-ahead contracts, and on the one year-ahead contract. Values in both current reais (solid line) and December 2005 reais (dashed line) are shown. Observations are shown only for months there where is activity on one of the four major month contracts (January, April, July, and October). The sample covers the period May 1996 through mid-September 2007. Data for September therefore are the average for the first half of the month. We list the last observation by contract: front-month: September 2007; one-month-ahead, August 2007; two-months-ahead, July 2007; three-months-ahead, first half of September 2007; four-months-ahead, August 2007; five-months-ahead, July 2007; six-months-ahead September 2007; one-year-ahead, September 2007.

Figure 3 Market Shares (based on notional amounts of outstanding short and long contracts)
0
10
20
30
40
50
60
70
& Includes domestic hedge funds; && other foreign investors = Resolution 2689 investors (see text)*other = domestic financial and non-financial institutions and individuals
Perc
ent
1/2/2002
7/6/2006
banks
Domestic Institutional investors&
Other Foreign Investors&&
Other*
Figure 4 Notional Value of DI Futures by Investor Class, 1/2/02-3/29/07
Banks
-
50
100
150
200
250
300
350
400
1/2/2002
3/2/2002
5/2/2002
7/2/2002
9/2/2002
11/2/2002
1/2/2003
3/2/2003
5/2/2003
7/2/2003
9/2/2003
11/2/2003
1/2/2004
3/2/2004
5/2/2004
7/2/2004
9/2/2004
11/2/2004
1/2/2005
3/2/2005
5/2/2005
7/2/2005
9/2/2005
11/2/2005
1/2/2006
3/2/2006
5/2/2006
7/2/2006
9/2/2006
11/2/2006
1/2/2007
3/2/2007$R
bill
ions
long short

Figure 4 (cont.)
Non-bank domestic investors
-
50
100
150
200
250
300
350
400
1/2/2002
3/2/2002
5/2/2002
7/2/2002
9/2/2002
11/2/2002
1/2/2003
3/2/2003
5/2/2003
7/2/2003
9/2/2003
11/2/2003
1/2/2004
3/2/2004
5/2/2004
7/2/2004
9/2/2004
11/2/2004
1/2/2005
3/2/2005
5/2/2005
7/2/2005
9/2/2005
11/2/2005
1/2/2006
3/2/2006
5/2/2006
7/2/2006
9/2/2006
11/2/2006
1/2/2007
3/2/2007
$R b
illio
ns
long short
Other Foreign Investors
-
50
100
150
200
250
300
350
4001/2/2002
4/2/2002
7/2/2002
10/2/2002
1/2/2003
4/2/2003
7/2/2003
10/2/2003
1/2/2004
4/2/2004
7/2/2004
10/2/2004
1/2/2005
4/2/2005
7/2/2005
10/2/2005
1/2/2006
4/2/2006
7/2/2006
10/2/2006
1/2/2007$R
bill
ions long short
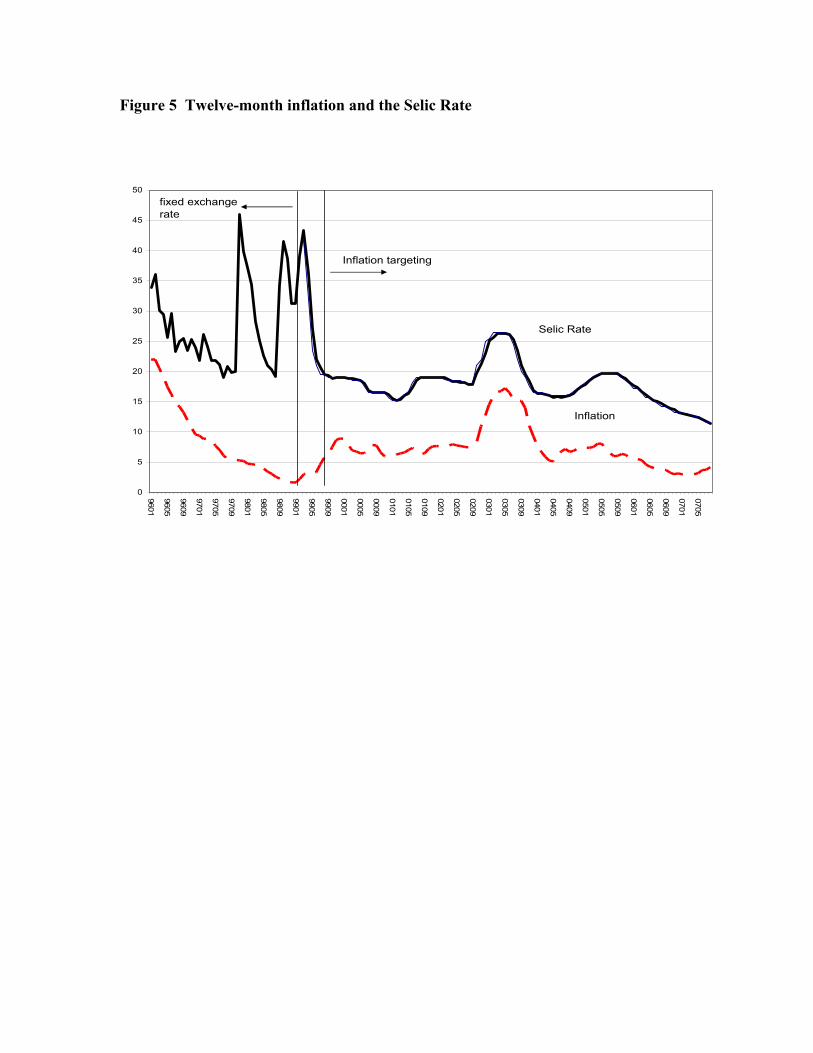
Figure 5 Twelve-month inflation and the Selic Rate
0
5
10
15
20
25
30
35
40
45
50
9601
9605
9609
9701
9705
9709
9801
9805
9809
9901
9905
9909
0001
0005
0009
0101
0105
0109
0201
0205
0209
0301
0305
0309
0401
0405
0409
0501
0505
0509
0601
0605
0609
0701
0705
fixed exchange rate
Inflation targeting
Selic Rate
Inflation

Figure 6a: Futures-Based Forecasts and Target for Selic Rate
11
14
17
20
23
26
29
32
35
38
41
44
47
1996 1997 1998 1999 2000 2001 2002 2003 2004 2005 2006 2007
Inflation Targeting
Fixed Exchange
Rate Regime
One Month Ahead
Target
Percent
-9
-6
-3
0
3
6
9
12
15
1996 1997 1998 1999 2000 2001 2002 2003 2004 2005 2006 2007
Inflation TargetingFixed ExchangeRate Regime
Forecast errorPercent

Figure 6b: Futures-Based Forecasts and Target for Selic Rate
11
14
17
20
23
26
29
32
35
38
41
44
47
1996 1997 1998 1999 2000 2001 2002 2003 2004 2005 2006 2007
Inflation Targeting
Fixed Exchange
Rate Regime
Two Months Ahead
Target
Percent
-9
-6
-3
0
3
6
9
12
15
1996 1997 1998 1999 2000 2001 2002 2003 2004 2005 2006 2007
Inflation TargetingFixed ExchangeRate Regime
Forecast errorPercent

Figure 6c: Futures-Based Forecasts and Target for Selic Rate
11
14
17
20
23
26
29
32
35
38
41
44
47
1996 1997 1998 1999 2000 2001 2002 2003 2004 2005 2006 2007
Inflation Targeting
Fixed Exchange
Rate Regime
Three Months Ahead
Target
Percent
-12
-9
-6
-3
0
3
6
9
12
1996 1997 1998 1999 2000 2001 2002 2003 2004 2005 2006 2007
Inflation TargetingFixed ExchangeRate Regime
Forecast errorPercent
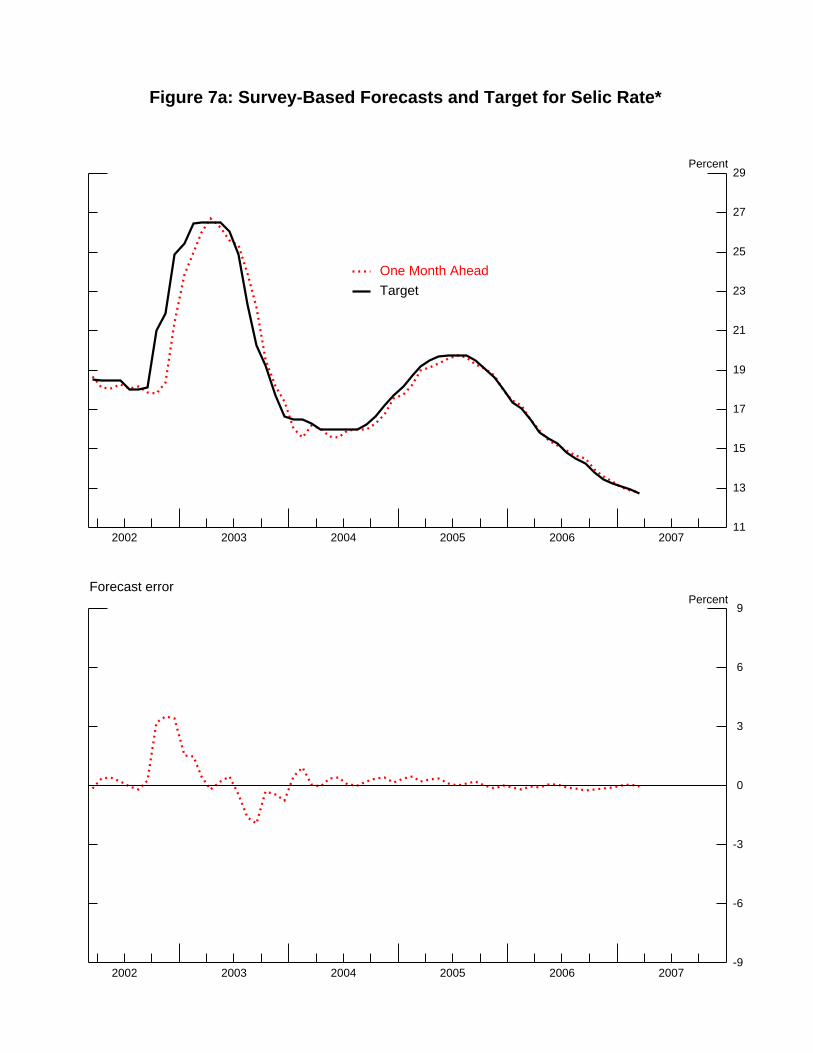
Figure 7a: Survey-Based Forecasts and Target for Selic Rate*
11
13
15
17
19
21
23
25
27
29
2002 2003 2004 2005 2006 2007
One Month Ahead
Target
Percent
-9
-6
-3
0
3
6
9
2002 2003 2004 2005 2006 2007
Forecast errorPercent

Figure 7b: Survey-Based Forecasts and Target for Selic Rate*
11
13
15
17
19
21
23
25
27
29
2002 2003 2004 2005 2006 2007
Two Months Ahead
Target
Percent
-9
-6
-3
0
3
6
9
2002 2003 2004 2005 2006 2007
Forecast errorPercent

Figure 7c: Survey-Based Forecasts and Target for Selic Rate*
11
13
15
17
19
21
23
25
27
29
2002 2003 2004 2005 2006 2007
Three Months Ahead
Target
Percent
-9
-6
-3
0
3
6
9
2002 2003 2004 2005 2006 2007
Forecast errorPercent