brazilian sugarcane sector’s approach to the agro ... · the brazilian sugarcane sector big...
TRANSCRIPT
Brazilian Sugarcane Sector’s approach to the Agro-environmental Protocol
March 2013
1. About Raízen2. Sugarcane sector in Brazil
� Brazilian Energy Matrix� Sector’s Key Figures
3. Agro-environmental Protocol� Definition� Objectives and Directives
4. Mechanization Impacts5. Environmental Impacts6. Social Aspects7. Q&A
Agenda

Lubricants
E&P
Downstream
� Fuels
� Bases
� Service stations
� Airports
Upstream
� Ethanol
� Sugar
� Bioenergy
About Raízen

To be globally recognized for
excellence in the development,
production and commercialization of
sustainable energy
Vision
To promote sustainable solutions in
energy through technology, talent and
swift actions, maximizing and creating
value for our clients and shareholders
and contributing to society
Mission

Dimension
R$ 50 bi worth of revenues
R$ 20 biestimated market value
Over 40,000employees
General numbersWorld’s largest sugarcane ethanol producer and Brazil’s largest sugar producer
860,000 ha of cultivated area
86%mechanized harvesting
2 bi litersof ethanol
930 MWof installed capacity
4 m tonsof sugar
Fuels CommercializationA highly efficient and trustworthy network
4,700service stations
700convenience stores
64distribution bases
54airports
22billion liters/year

Ethanol, Sugar and BioenergySugar-energy production clusters
24 Mills
São Francisco, Rafard, Bom Retiro, Santa Helena, Costa Pinto
Barra, Dois Córregos, Diamante
Bonfim, Tamoio, Serra, Zanin
Paralcool, Tarumã, Maracaí, Ipaussu
Gasa, Univalem, Destivale, Mundial, Benálcool, Junqueira
Jataí
Caarapó
1
2
3
4
5
6
7
Votuporanga
Itapeva
Registro
Sorocaba
Gal. Salgado
Orlândia
Franca
S. J. daBoa Vista
MogiMirim
Campinas BragançaPaulista
São Paulo
Mogidas Cruzes
Pindamonhangaba
Guaratinguetá
Ilha de São Sebastião(Ilha Bela)
Fernandópolis
Santos
Jales
Dracena
Pres.Venceslau
Pres. Prudente
Tupã
Marília
Baurú
Avaré
Botucatu
S. J. do Rio Preto
Ribeirão Preto
Barretos
Andradina
Araçatuba
Catanduva
Jaboticabal
Lins
Itapetininga
Assis
Ourinhos
Piracicaba
Limeira
Araraquara
Jaú
Junq
CA
JAT
Gasa
Mund
Univ
DestBen
Ipau
Tar
Mar
Par
49 Km
Diam DC
Barra
Bonf
SerraZanin
Tam
23
Km
UBR
Raf
IASF
USH
CoPi
10,8 Mtc
9,4 Mtc
11,6 Mtc
10,7 Mtc
Greenfield in
MS
2,3 Mtc
11,0 Mtc
2,8 Mtc
Greenfield in
GO
4,0 Mtc
Santos Port

Içara
Campo GrandeS.J. Rio Preto
Guarapuava
Passo Fundo
Uberlândia
Pres. Prudente
Maringá
Londrina
Goiânia
Uberaba
Ribeirão Preto
Santarém
Itaituba
Porto Velho
Cuiabá
Palmas
Marabá
Açailândia
Teresina
Montes Claros
Alto Taquari
Rio Grande
Belém
Manaus
São Luis
Fortaleza
Cabedelo
Suape
Maceió
Madre de DeusJequié
ItabunaBrasília
Betim
Vitória
Duque de Caxias
Barueri
Cubatão
Guarulhos
São José dos Campos
São Paulo
Itajaí
Florianópolis
Esteio São Caetano
Cubatão
Barueri
Guarulhos
Guamaré
Governador
Valadares
Araçatuba
Irani
Araucária
Campos dos Goytacazes
Juazeiro
Bauru
Ourinhos
Jaraguá do Sul
Paulínia
Logistics, Distribution and TradingStructure set up to distribute 40 billion liters of fuel
58% Own base
25% Raízen Pool
10% 3rd party Pool
7% 3rd party cession
Primary Terminal
Secondary Terminal
Refineries
Railway
Ducts
Cabotage
Hydroway
Type of operation
Own base
3rd party cession
3rd party pool
Raízen Pool
DISTRIBUTION VOL

� Brazilian Energy Matrix
� Sector’s Key Figures
Sugarcane Sector in Brazil

Brazilian energy matrix input
# 1 Source of Renewable
Energy in BR- 2010 But decreasing
Sugarcane 15,7%
Petroleum and
derivatives
38,6%
Hydro
14,7%
Wood
and other
biomass
9,7%
Natural Gas
10.1%
Coal and
derivatives
5,6%
Other Renewables 4,1%
Uranium
1,5 %
2009 2010 2011
52,7%
47,3%
54,5%
45,5%
55,9%
44,1%
Non-renewable
Renewable
World (2008) OCDE (2009) Brazil (2011)
87.1
12,9
92,4
7,6
55,9
44,1
World (%)

Prepared by: UNICA. Note: 2010¹ - position on 8/30/2010; ² 2008 data from Rais (Annual Report
on Social Information issued by the Ministry of Labor and Employment); ³ Neves, Marcos Fava et.
al, (2009) – Mapping of the sugar-eneregy chain
The Brazilian sugarcane sectorBig figures
Production structure: Plants (2010) 432
Cane suppliers 70.000
Registered jobs 1,28 million
GDP for sugar-energy chain US$ 28 billion
Foreign currency (2010) US$ 13,8 billion
Direct investment More than US$ 20 billion (2006-2009)
% of national power matrix 18% (> hydroelectricity)
Reduction in CO2 emissions > 600 million tons since 1975
Sugar Production37,9 million TonsDomestic consumption: 10,4 mil tons - Exports: 27.5 mil tons
Ethanol production
27,4 Billion LittersDomestic consumption: 25,5 mil tons L - Exports: 1,9 billion L
Production of anhydrous ethanol: 8,3 billion L
Production of hydrous ethanol: 19,1 billion L
Production mix 46,2% sugar - 53,8% Ethanol
Annual Revenue of the sector More than US $50 Billion
0
5
10
15
20
25
30
2003
2004
2005
2006
2007
2008
2009
2010
2011
2012
2013
2014
2015
2016
2017
2018
2019
2020
Gasoline Flex fuel
0
10
20
30
40
50
60
2003
2004
2005
2006
2007
2008
2009
2010
2011
2012
2013
2014
2015
2016
2017
2018
2019
2020
Ethanol (only) Gasoline Flex fuel2
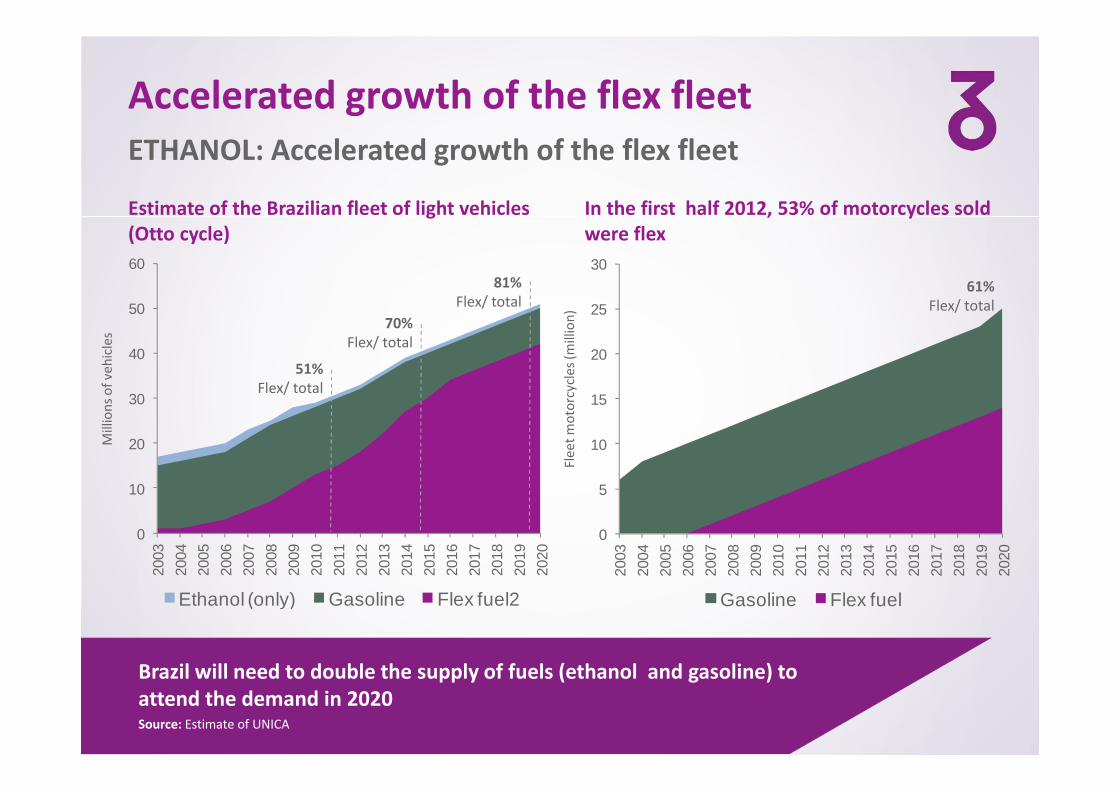
Accelerated growth of the flex fleet
ETHANOL: Accelerated growth of the flex fleet
Estimate of the Brazilian fleet of light vehicles
(Otto cycle)
In the first half 2012, 53% of motorcycles sold
were flex
Mill
ion
s o
f ve
hic
les
Fle
et
mo
torc
ycle
s (m
illio
n)
Brazil will need to double the supply of fuels (ethanol and gasoline) to
attend the demand in 2020
51%
Flex/ total
70%
Flex/ total
81%
Flex/ total61%
Flex/ total
Source: Estimate of UNICA

0
200
400
600
800
1000
1200
1400
2011/12 2015/16 2020/21
Sugar Anhydrous Ethanol Hydrous Ethanol
Sugarcane demand scenarioTo supply 50% of the country’s automotive fleet with ethanol (anhydrous +
hydrous) and maintain Brazil’s current share in world sugar market (~50%):
Source: UNICA. Note: the hydrous ethanol is pure sold at the pumps and used without modification by the flex- fuel
vehicles, then it competes directly with gasoline by the preference of consumers (this product is 4.9% water), the
anhydrous ethanol is blended with gasoline in proportions ranging from 18% 10 25% (the anhydrous ethanol has a
lower water content – 0.4%)
36 mn t
8.5 bn l
14 bn I
45 mn t
18 bn I
27 bn I
51 mn t
28 bn l
42 bn I
~120 new mills
555Million tons
886Million tons
1.2billion tons
~9% per year
~US$65 million of
new investment

Sugarcane production in Brazil:an overview of the last decade
� World financial crisis: acquisitions involving affected companies
� Weather problems in three consecutive harvests
� Loss of domestic competitiveness for ethanol compared to gasoline
00/01 01/02 02/03 03/04 04/05 05/06 06/07 07/08 08/09 09/10 10/11 11/12 12/13*
Stagnation
Sources: UNICA and MAPA Note * - forecast

9
19
2530
21
9
3 2
2005/06 2006/07 2007/ 08 2008/ 09 2009/ 10 2010/ 2011 2011/12 2012/13*
Evolution of the number of new production
facilities in center-south Brazil
In recent years, 65 distilleries also installed sugar factories
Source: Estimate of UNICA
High investment
level to expand
production
2007/08 2012/13
Mix units 249 290
Ethanol only 161 94
Sugar only 16 10
Units registered with MAPA

Land UsageSignificant potential for sustainable growth
Total Area Protected / Native Area Land Other
Millions of hectares 851.48 554 329.94 25.92
100% 58% 39% 3%
Usable
111.3433%
Pasture
158.7548%
Agriculture
51.716%
Sugar Cane
8.142.4%

� Definition
� Benefits
Agro-environmental Protocol

The green protocol of São Paulo state� Voluntary agreement reached between São Paulo State Government, the
sugarcane industry (UNICA) and the cane suppliers (ORPLANA )
� It anticipates the deadline for ending sugarcane burning: from 2021 to 2014
in areas that can be mechanized and from 2031 to 2017 in other areas
� It also includes other conservation measures, such as the protection of river
side woods, the recovering of those near water springs and the reduction
of water use
� 173 mills and 29 association of sugarcane suppliers joined
the initiative, representing 90% of the state
production and 50% of Brazilian production

Objectives and Directives
� Reduction to the legal deadline for ending sugarcane
straw burning (State Law No. 11.241/02) to 2014,
instead of 2021, in areas where machinery can be
used, and to 2017, instead of 2031, in other areas
� Not to use sugarcane burning for harvesting in
plantation expansion areas
� To avoid burning of sugarcane bagasse, or any other
sub-product of sugarcane, in the open air
� To protect riverside woodlands in the sugarcane
plantation areas, because of their importance in
preserving the environment and protecting biodiversity
� To protect water springs in the rural areas of the
sugarcane plantations, and recover the vegetation
surrounding them
� To propose and implement a technical soil
conservation plan
� To propose and implement a technical plan for
conserving water resources and minimizing water
usage;
� A plan for handling waste generated in the agro-
industrial process
� A plan for minimizing generation of atmospheric
pollutants
� Main commitments established: Deadline for eliminating cane straw burning
in São Paulo State
Areas where machinery can be used
Note: The points shown on the lines of the graph indicate specific
years cited in the Law or the Protocol.
Prepared by Unica.
Other areas
Pe
rce
nta
ge
of
can
e h
arv
est
ed
wit
ho
ut
bu
rnin
g

Mechanization

The green protocol of São Paulo state
65,8%53,4% 50,9%
44,5% 44,4%34,8%
34,2%46,6% 49,1%
55,5% 55,6%65,2%
2006/ 2007 2007/ 2008 2008/ 2009 2009/ 2010 2010/ 2011 2011/ 2012
Manual Harvesting - with use of fire Raw Cane - harvested mechanically
Source: INPE, UNICA and the São Paulo State Secretariat for the Environment.
Note: Values of mechanized harvest correspond to the entire São Paulo State
sugarcane area and not just the area of Protocol signatories
Mechanization in the State exceeded 65% of all
cane fields in 2011/2012

Harvest 2006/2007
Raw cane
Burned cane
S. J. do Rio Preto
P.Prudente
Marília
Franca
SorocabaCampinas
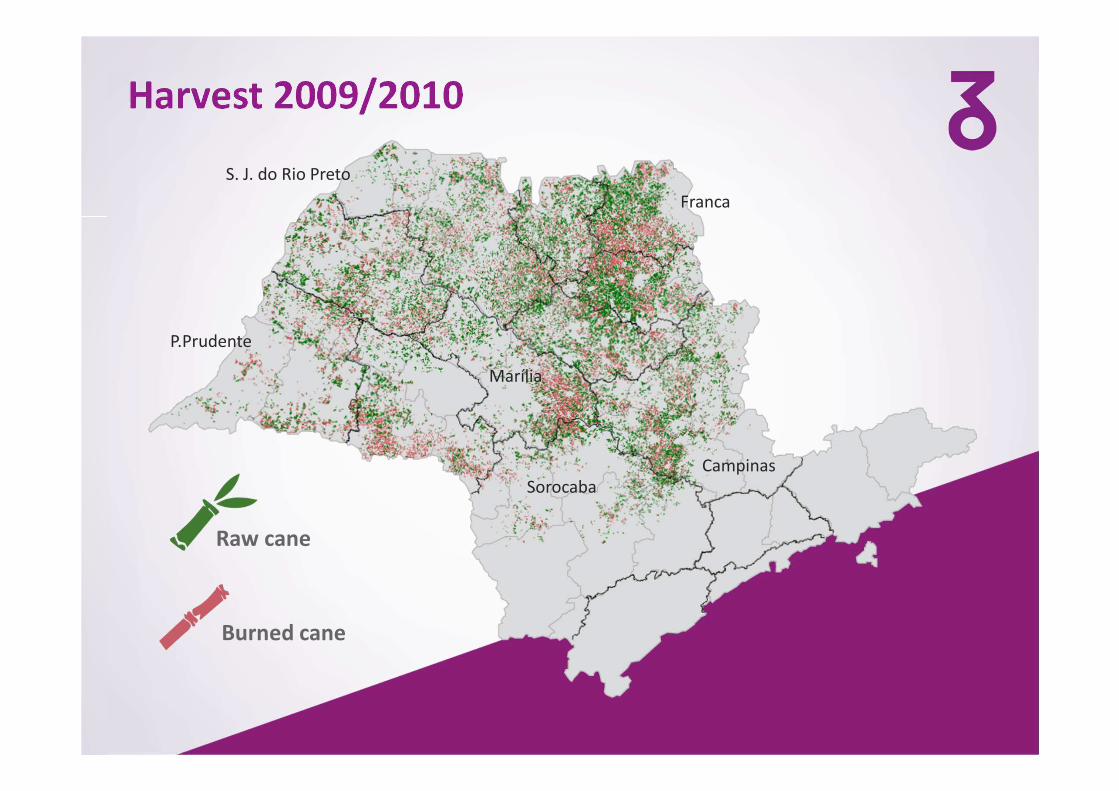
Harvest 2009/2010
S. J. do Rio Preto
P.Prudente
Marília
Franca
SorocabaCampinas
Raw cane
Burned cane

Environmental Impacts

Environmental Impacts
3,34 3,24
1,11
2,13
3,96 3,79
1,772,02
4,433,92
1,92 1,99
4,91
4,34
2,421,91
4,984,72
2,62
2,10
5,40
4,79
3,12
1,67
Planted cane area Harvested cane area Raw Cane Burnt Cane
Harvest 06/07 Harvest 07/08 Harvest 08/09 Harvest 09/10 Harvest 10/11 Harvest 11/12
Comparative harvest
2,06 M ha
+ 61% 1,55 M ha
+ 48%
2 M ha
+ 181%- 0,46 M ha
- 22%
Area 3 times the size
of São Paulo city
34,2%
65,2%
65,8%
34,8%
He
cta
res
(mill
ion
s)

Harvest 2006/2007 Harvest 2007/2008 Harvest 2008/2009 Harvest 2009/2010 Harvest 2010/2011 Harvest 2011/2012 TotalArea that could have been burnt according to Law 11.241 (ha) Area actually burnt (ha) Reduction in area burnt
Environmental Gains in SP State
* Total area where burning has ceased since start of Protocol in 2007
** Carbon Monoxide, Hydrocarbons and Particulate Material
Equivalent to run 47
thousand buses for 1 year
Reduction of 2.7 million tons
of CO2 emitted and
Reduction of 16.7 million tons
of pollutants emitted **
2,3 m
(ha) 2,13 m
(ha)
0,14 m
(ha)
2,4 m
(ha)
1,67
m (ha)
0,7 m
(ha)
4,5 m
(ha)*
Are
a (
he
cta
res)

Water Consumption in the Agro-industry
Consumption levels at signatory
Plants (m3/ton of cane)%
0,7 - 1,0 41
1,0 - 2,0 40
More than 2 19
M3
/to
n o
f ca
ne
pro
cess
ed

1 ton of leaves = 500 KWh
Biomass
19.5 million tons of leaves
available for cogeneration
Leaves/straw cover on soil
1.124 MW
for
Cogeneration
~ 29 % of residential consumption
in SP State ( ~ 3.906 MW)
~ 25 % of potential generation at Belo
Monte hydroelectric plant (~ 4.571 MW)
39 million tons of straw on
3.1 million hectares (12.6 ton/ha)
� Protection of soil from wind and rain
� Can be transported to the plant for
power generation
� Can be used to produce the 2nd
Generation Ethanol
50%
( )

Production
social aspects
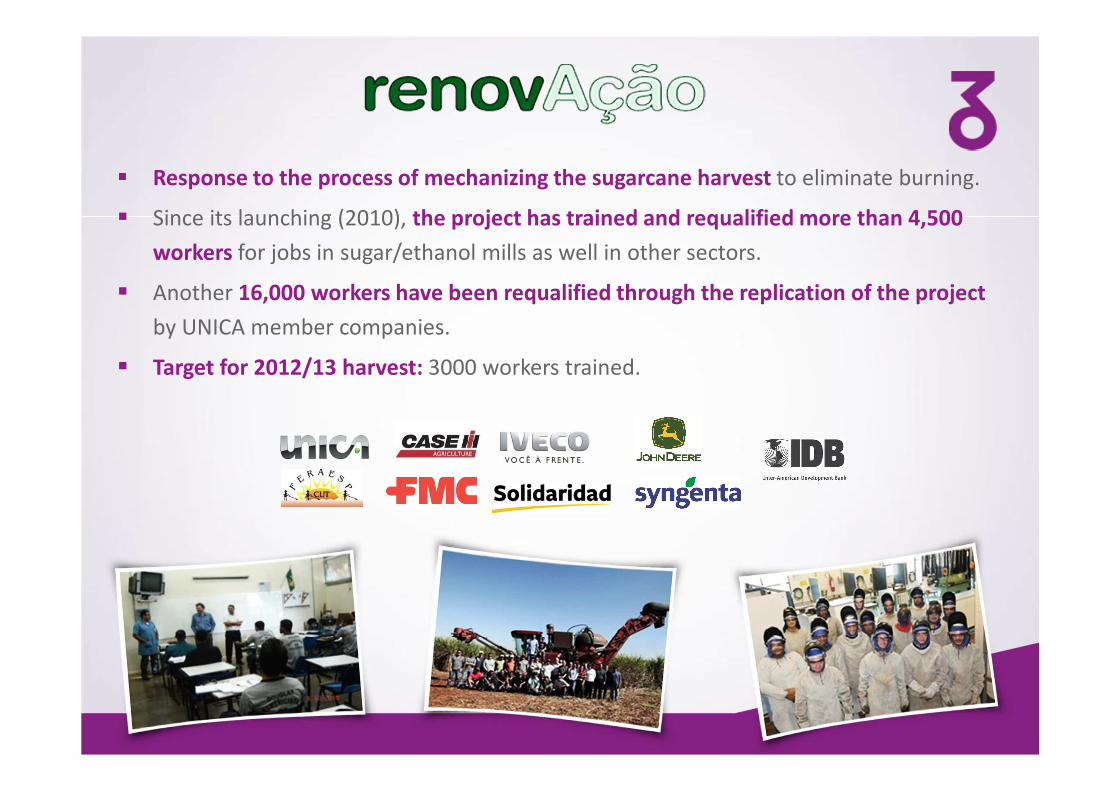
� Response to the process of mechanizing the sugarcane harvest to eliminate burning.
� Since its launching (2010), the project has trained and requalified more than 4,500
workers for jobs in sugar/ethanol mills as well in other sectors.
� Another 16,000 workers have been requalified through the replication of the project
by UNICA member companies.
� Target for 2012/13 harvest: 3000 workers trained.

Project
Re-qualified worker per year
� 30 courses offered in 6 regions in São Paulo State
2010/2011 harvest: 2.751 (formed)
2011/2012 harvest: 1.479 (formed)
TOTAL4.550

I) Activities within the sugarcane sector
(examples)
II) Local communities – jobs in other sectors of
the economy (examples)
� Harvester operator
� Mechanic (harvesters, tractor
� Truck driver
� Electrician (harvesters, tractors,
trucks)
� Welder
� Horticulture
� Garment making
� Plumber
� Baker
� Manicure
The Project was designed in two
training modules:
Two additional components:
� Pre-RenovAção: for the least educated, alphabetization courses were
also ministered before the actual training
� Women’s module: aiming at gender inclusion, some classes were
dedicated to women only

Module I (courses for the sugar-energy sector)
Module II (courses for the other sector)
Graduates per module
Tractor
driver 6%
Truck
driver 8%
Welder
8%
Eletrician (harvester,
tractor, truck)
28%
Mechanic
(harvester, tractor,
truck 20%
Harvester
operator
14%
Literacy +
re-qualification
course 10%
Urban services
(e.g.: baker) 38%
Rural services
(e.g.: horticulture)
21%
Industrial services
(e.g.: welder)
31%
Agricultural services
(e.g.: tractor driver)
10%

mResults
� International recognition by FAO as an “example” of social inclusion initiative
� 78% of the attendants in module 1 were immediately placed in the
labor market (UNICA monitoring).
� At least 50% of the community’s workers in module 2 have established
their own business and/or have gathered in a system of cooperative.
Another 20% were absorbed by the labour market (FERAESP monitoring)
� Average salaries of the re-qualifed proffessionals raised by 61%
� The number of women retrained has increased from 2% in the first
classes to 12% in the second year.
� The program encouraged similar actions multiplying the number of trained
workers: more than 16,000 professionals were independently re-qualified
by the mills in line the RenovAção courses


Automotive fuel in short supply in Brazil
6,0
16,5
25,5
29,5
20,0
25,5
48
75
Gasoline production and VNG
consumption: stable
Otto Cycle consumption
Productive capacity of gasoline and VNG consumption
Ethanol supply
Fuel
Fuel deficit
Need to expand production
of ethanol and/or gasoline
2012 2021
Ethanol productive capacity
(>30 billion liters)
In billion liters of gasoline equivalent – Source: UNICA February 2012

Protocol Definition
� The Agro-environmental Protocol arose from the need to organize agricultural and
industrial activities in such a way as to promote environmental improvements and,
consequently, to reduce the impact on the environment and on society.
� This is particularly important in a sector that has grown significantly and represents an
increasingly large portion of the economy of the State.
� It is intended to recognize good environmental practices in the sugar-energy sector, and
to reward them with a certificate of compliance, renewed annually.
� Through the publicity given to the certificate awarded to agro-industrial units and cane
growers associations, the Protocol affects the image of the plants and the associations in
the domestic and the foreign markets, providing a positive standard for environmental
plans and improvement goals to be followed.
� Now in its third year of operation in São Paulo State
� Bringing forward deadlines for eliminating cane straw burning
� Protecting forest remnants, springs and riverside woodland
� Erosion control and good soil usage practices
� Management of pesticide containers, and reduction of water usage in the
industrial phase.
Aspects: