brazil's constitutional financing funds: how to …ibi/minerva/spring2015/carlos_rosa.pdf ·...
TRANSCRIPT
1
SCHOOL OF BUSINESS
THE INSTITUTE OF BRAZILIAN ISSUES
THE MINERVA PROGRAM
Spring/2014
BRAZIL'S CONSTITUTIONAL FINANCING
FUNDS: HOW TO BUILD A METHODOLOGY
TO EVALUATE THE ECONOMIC AND
SOCIAL IMPACTS
CARLOS HENRIQUE ROSA Advisor: Prof. Reid Click
Washington, D.C. April, 2014
2
CONTENTS
1 – INTRODUCTION ................................................................................................................... 5
2 – BRAZIL'S CONSTITUTIONAL FINANCING FUNDS ....................................................... 6
2.1 – ASPECTS OF INCOME CONCENTRATION IN BRAZIL IN THE 1980’S ................ 6
2.1 – REGIONAL INEQUALITIES IN THE TEXT OF THE 1988 FEDERAL CONSTITUTION ..................................................................................................................... 8
2.3 – THE CREATION OF THE BRAZIL'S CONSTITUTIONAL FINANCING FUNDS ... 9
2.3.1 – OBJECTIVES ........................................................................................................... 9
2.3.2 – ORIGIN OF RESOURCES ..................................................................................... 10
2.3.3 – ADMINISTRATION OF RESOURCES ................................................................ 11
2.3.4 – TYPE OF COMPANIES AND SECTORS SUPPORTED ..................................... 12
2.3.5 – THE FUNDING OVER THE YEARS ................................................................... 13
2.4 – NEW DIRECTIONS: THE NEED TO EVALUATE AND POINT TO NEW ALTERNATIVES ................................................................................................................... 23
3 – WHY EVALUATE? ............................................................................................................. 26
4 – REVIEW OF LITERATURE: SOME METHODOLOGIES OF EVALUATION ALREADY USED ...................................................................................................................... 27
5 – PROPOSAL OF A MODEL FOR SYSTEMATIC EVALUATION FOR BRAZIL'S CONSTITUTIONAL FINANCING FUNDS ............................................................................. 33
5.1 – CONSIDERATIONS ON MONITORING AND EVALUATION OF PUBLIC POLICIES ............................................................................................................................... 33
5.2 – THE PROPOSAL OF EVALUATION .......................................................................... 36
6 – CONCLUSION ..................................................................................................................... 41
7 – REFERENCES ...................................................................................................................... 44
APPENDIX I - TASKS OF THE MINISTRY OF NATIONAL INTEGRATION .................... 49
APPENDIX II - NATIONAL POLICY FOR REGIONAL DEVELOPMENT ......................... 53
APPENDIX III - THE NUMBERS, IN DETAIL, BRAZIL'S CONSTITUTIONAL FINANCING FUNDS ................................................................................................................. 56
3
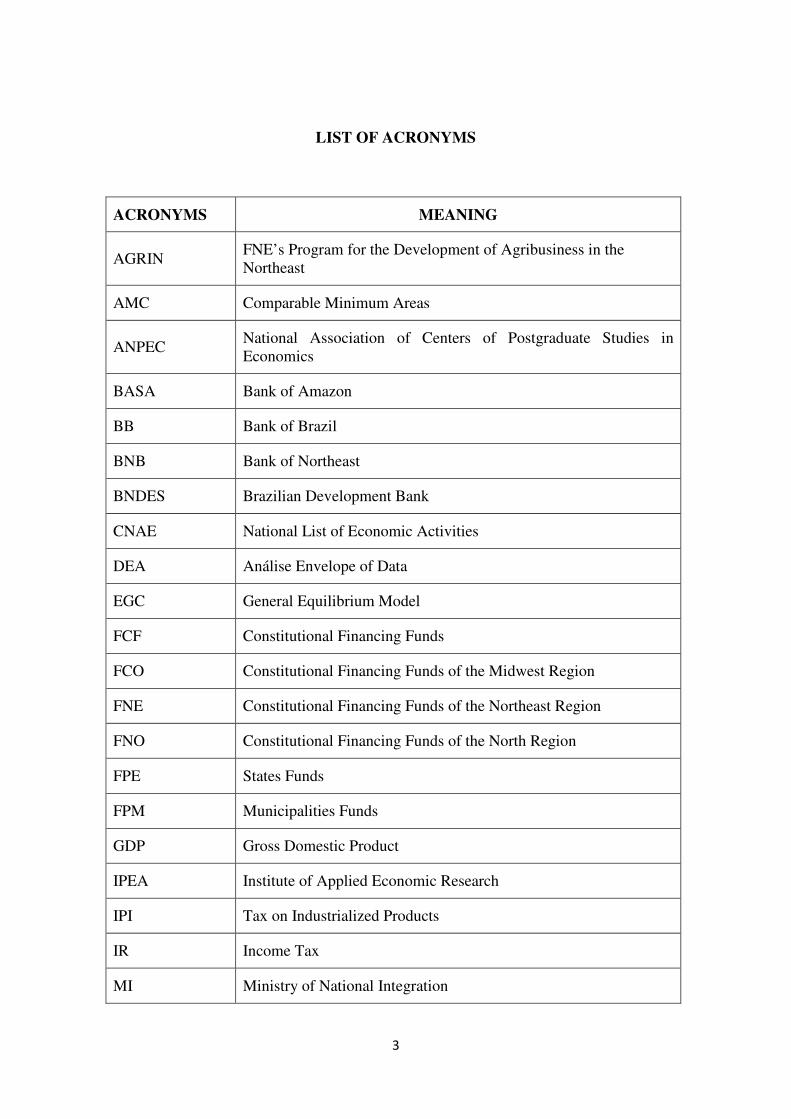
LIST OF ACRONYMS
ACRONYMS MEANING
AGRIN FNE’s Program for the Development of Agribusiness in the Northeast
AMC Comparable Minimum Areas
ANPEC National Association of Centers of Postgraduate Studies in Economics
BASA Bank of Amazon
BB Bank of Brazil
BNB Bank of Northeast
BNDES Brazilian Development Bank
CNAE National List of Economic Activities
DEA Análise Envelope of Data
EGC General Equilibrium Model
FCF Constitutional Financing Funds
FCO Constitutional Financing Funds of the Midwest Region
FNE Constitutional Financing Funds of the Northeast Region
FNO Constitutional Financing Funds of the North Region
FPE States Funds
FPM Municipalities Funds
GDP Gross Domestic Product
IPEA Institute of Applied Economic Research
IPI Tax on Industrialized Products
IR Income Tax
MI Ministry of National Integration
4
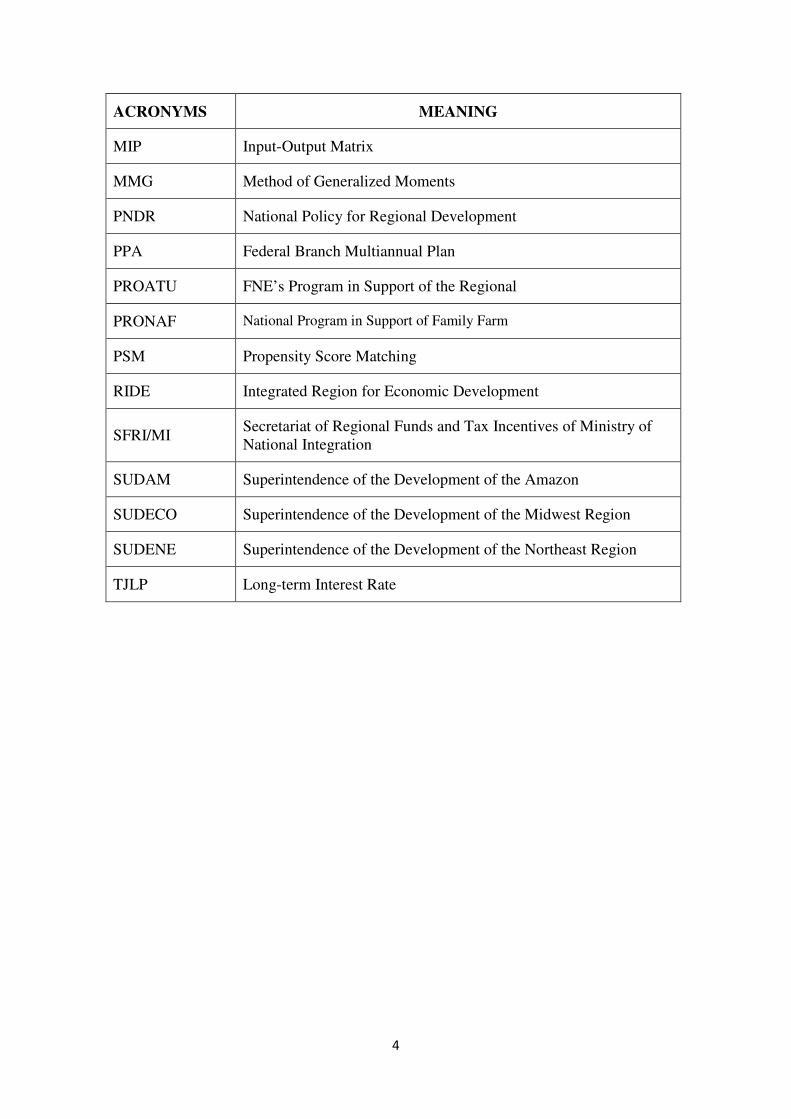
ACRONYMS MEANING
MIP Input-Output Matrix
MMG Method of Generalized Moments
PNDR National Policy for Regional Development
PPA Federal Branch Multiannual Plan
PROATU FNE’s Program in Support of the Regional
PRONAF National Program in Support of Family Farm
PSM Propensity Score Matching
RIDE Integrated Region for Economic Development
SFRI/MI Secretariat of Regional Funds and Tax Incentives of Ministry of National Integration
SUDAM Superintendence of the Development of the Amazon
SUDECO Superintendence of the Development of the Midwest Region
SUDENE Superintendence of the Development of the Northeast Region
TJLP Long-term Interest Rate
5
1 – INTRODUCTION
Brazil, since the second half of the 20th century, has had one of the major
economies of the world capitalist system. Due to its large territory and population, the
complexity of its society, its historical conditions, and the peculiar development of its
capitalist system, Brazil has also developed one of the greatest inequalities in income
over the last few decades, at least in spatial terms. For example, in 2009, the Gross
Domestic Product (GDP) from the Southeast Region was 55.3% of the national GDP -
four times higher than the GDP of the Northeast Region and almost 11 times higher
than the GDP of the North Region. In this context, the creation of Constitutional
Financing Funds (FCF) had the main objective of contributing to the economic and
social development of the North, Northeast and Midwest Regions. Through support
differentiated productive activity in these regions, FCF would thus facilitate the
reduction of distortions between the Brazilian regions.
Since the policy’s creation, these FCF loans have been fundamental in the
economy’s development, improving the economic and social conditions of the regions.
These loans contribute to the generation of employment and income, and support the
potential of development in these regions, in accordance with the guidelines of the
National Policy for Regional Development (PNDR), the Ministry of National
Integration (MI), and the Deliberative Councils of their Funds.
The strong ability of these loans to contribute to the growth and regional
development of the regions is very important. Diagnostics to measure the generated
impacts should be developed to build propositions for improvements in order to make
the loans even more effective in the process of regional development.
So, it is essential to evaluate the economic and social impacts arising from the
FCF investments in order to: (1) verify that the results obtained are in agreement with
6
the objectives defined for the application of resources; (2) identify possible legal and
operational bottlenecks that entail limitations to objectives recommended; (3) optimize
the economic and social impacts, with the generation of employment, income, and
increase in tax collection; (4) verify the possibility to optimize the reduction of regional
inequalities, with the objective of subsidizing its improvement, by adjusting the PNDR
so to better direct the investment of the resources towards institutional effort, combat
regional inequalities, and eliminate extreme poverty.
Thus, in order to contribute to the fulfilment of the mission of the Ministry of
National Integration, it aims to build a methodology to be applied for monitoring and
evaluating the Constitutional Financing Funds, involving social and economic aspects
arising from its loans.
2 – BRAZIL'S CONSTITUTIONAL FINANCING FUNDS
2.1 – ASPECTS OF INCOME CONCENTRATION IN BRAZIL IN THE 1980’S
After World War II up to the end of the 1970s, The Brazilian economy presented
an impressive performance in which the GDP grew at a rate of approximately 7% per
year.
While Brazil was creating a diversified industry and the leves of urbanization
was rising, income and regional inequalities was increasing. These arose from a model
of unequal development.
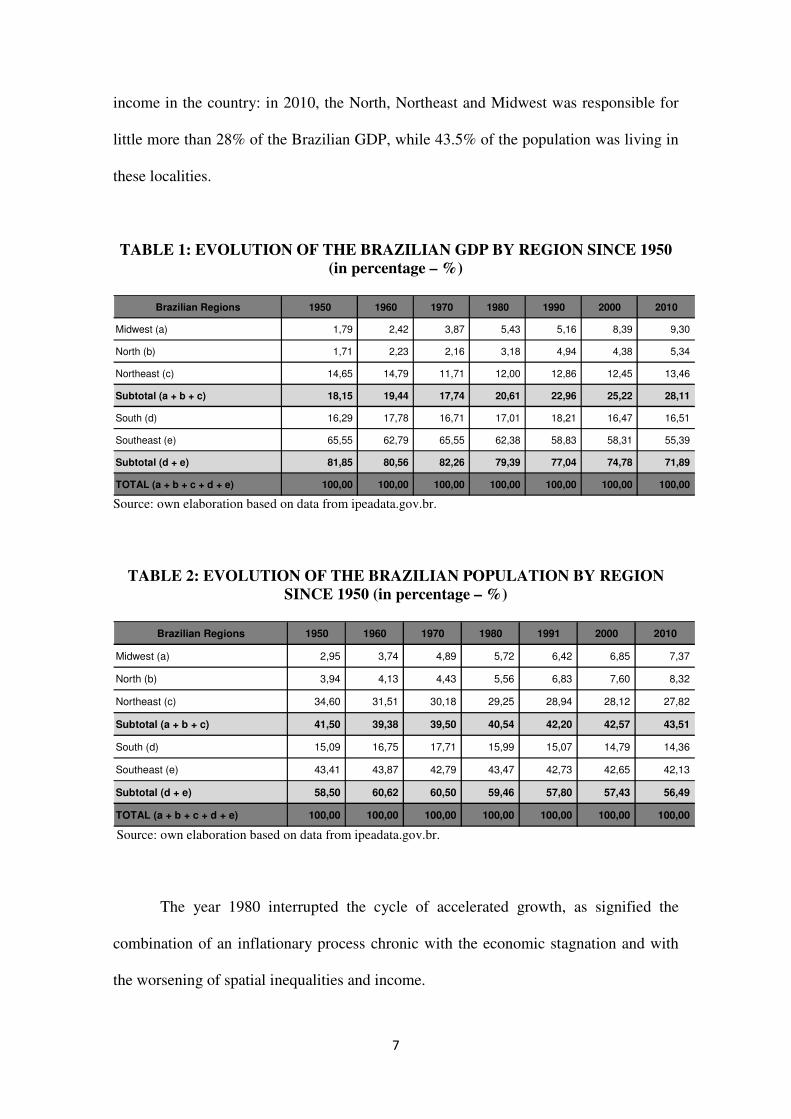
As shown in the two tables below, the participation of the North, Northeast and
Midwest regions in the GDP of Brazil in 1970 corresponded to approximately 17.7%.
These three regions inhabited 39.5% of the population of the country.
This scenario of inequality, as shown by the tables below, persisted until the
current year, even though a significant reduction was observed in the concentration of
7
income in the country: in 2010, the North, Northeast and Midwest was responsible for
little more than 28% of the Brazilian GDP, while 43.5% of the population was living in
these localities.
TABLE 1: EVOLUTION OF THE BRAZILIAN GDP BY REGION SINCE 1950
(in percentage – %)
Brazilian Regions 1950 1960 1970 1980 1990 2000 2010
Midwest (a) 1,79 2,42 3,87 5,43 5,16 8,39 9,30
North (b) 1,71 2,23 2,16 3,18 4,94 4,38 5,34
Northeast (c) 14,65 14,79 11,71 12,00 12,86 12,45 13,46
Subtotal (a + b + c) 18,15 19,44 17,74 20,61 22,96 25,22 28,11
South (d) 16,29 17,78 16,71 17,01 18,21 16,47 16,51
Southeast (e) 65,55 62,79 65,55 62,38 58,83 58,31 55,39
Subtotal (d + e) 81,85 80,56 82,26 79,39 77,04 74,78 71,89
TOTAL (a + b + c + d + e) 100,00 100,00 100,00 100,00 100,00 100,00 100,00
Source: own elaboration based on data from ipeadata.gov.br.
TABLE 2: EVOLUTION OF THE BRAZILIAN POPULATION BY REGION
SINCE 1950 (in percentage – %)
Brazilian Regions 1950 1960 1970 1980 1991 2000 2010
Midwest (a) 2,95 3,74 4,89 5,72 6,42 6,85 7,37
North (b) 3,94 4,13 4,43 5,56 6,83 7,60 8,32
Northeast (c) 34,60 31,51 30,18 29,25 28,94 28,12 27,82
Subtotal (a + b + c) 41,50 39,38 39,50 40,54 42,20 42,57 43,51
South (d) 15,09 16,75 17,71 15,99 15,07 14,79 14,36
Southeast (e) 43,41 43,87 42,79 43,47 42,73 42,65 42,13
Subtotal (d + e) 58,50 60,62 60,50 59,46 57,80 57,43 56,49
TOTAL (a + b + c + d + e) 100,00 100,00 100,00 100,00 100,00 100,00 100,00
Source: own elaboration based on data from ipeadata.gov.br.
The year 1980 interrupted the cycle of accelerated growth, as signified the
combination of an inflationary process chronic with the economic stagnation and with
the worsening of spatial inequalities and income.
8
This period was also characterized by a series of successive plans to stabilize the
economy. Although these plans alternated orthodox and heterodox characteristics, they
did not succeed in combating inflationary process.
Despite these changes in the economic scenario, regional development policy
was not abandoned after the 1980s. There were constitutional provisions that elected
regional development as one of the fundamental objectives of the Republic and one of
the principles of economic order. There were also laws that aimed at achieving these
constitutional principles, allocating resources for regional development programs. For
example, 1989 Law nº 7827, regulated the article 159, I, "c", of the Federal
Constitution, creating the Constitutional Financing Funds of the North, Northeast and
Midwest regions.
2.1 – REGIONAL INEQUALITIES IN THE TEXT OF THE 1988 FEDERAL
CONSTITUTION
The historical persistence of regional imbalances in Brazil was the background
to the establishment of regional policies supported by public funds, with the objective of
promoting the development and diversification of productive of the poorest regions in
the country. This perception was also present in the latest national constituent assembly
when regional and federalism issues were objects of debates that culminated in article
159 of the 1988 Federal Constitution.
This article had a decisive role in federalism and regional issues in the country.
First, the Federal Constitution determined that 21.5% and 22.5% of the inflow of the
Income Tax (IR) and Imposto sobre Produtos Industrializados, translated as the Tax on
Industrialized Goods (IPI) were applied, respectively, in the States Funds (FPE) and in
the Municipalities Funds (FPM). This created objective conditions for the process of
9
fiscal decentralisation in the country, which increased the capacity of subnational
entities for the provision of services and public policies.
Second, it also reserved 3.0% of that same inflow (IR + IPI) for application in
financing programs for the private sector whose investments were found in the North,
Northeast and Midwest regions. Through the Federal Government regional financial
institutions, in accordance with the regional plans of development, half of the resources
intended for their region were reserved to the semi-arid of the Northeast region of
Brazil.
The obligation of the formulation, financing, and implementation of
development regional policies were recovered with the creation of Constitutional
Financing Funds of the North, Northeast and Midwest. These policies abandoned in the
context of the crisis of the 1980s shook the fundamentals of the Brazil’s economy.
2.3 – THE CREATION OF THE BRAZIL'S CONSTITUTIONAL FINANCING
FUNDS
2.3.1 – OBJECTIVES
In Article 159 of the 1988 Federal Constitution, section I, paragraph "c", defined
that 3% of the inflow of income taxes (IR) and tax on industrialized goods (IPI) is for
financing the private sectors of the North, Northeast and Midwest1 regions of Brazil.
Subsequently, the 1989 Law nº 7827, which regulated the article 159, section I,
paragraph "c" of the 1988 Federal Constitution, created the Constitutional Financing
1 It’s important to define which States compose which recipient regions:
a) North: States of Acre, Amazonas, Amapa, Para, Roraima, Rondonia, and Tocantins;
b) Northeast: States of Maranhao, Piaui, Ceara, Rio Grande do Norte, Paraiba, Pernambuco, Alagoas, Sergipe, Bahia, in addition to the north parts of the States of Minas Gerais and Espirito Santo;
c) Midwest: States of Mato Grosso, Mato Grosso do Sul, Goias and Distrito Federal.
10
Funds of the North (FNO), the Northeast (FNE) and the Midwest (FCO). This had the
objective of promoting the economic and social development of those regions through
loans to private sectors.
The FCF loans must look for greater effectiveness, in order to increase the
productivity of the companies, create new jobs, raise the tax collection and improve the
distribution of income.
2.3.2 – ORIGIN OF RESOURCES
Article 6 of 1989 Law nº 7827 defines the constitution of the sources of
resources that make up the budget for these Funds. The main sources are:
a) 3% of the Income Tax (IR) and Tax on Industrialized Products (IPI). Of this
total, the FNE has a share of 1.8% and the other two funds (FCO and FNO) have
a share of 0.6 %; and
b) returns, and results of their applications.
It is important to note that the Federal Government can not impound the
resources of these Funds. The resources of the budget in a given year that perhaps is not
fully implemented, the availability will provide resources to make new loans in the next
financial year. The decision to invest is, therefore, a discretionary act of the
administrators of these resources, combined with the demand for credit of these regions.
The Funds will also have tax exemption. The financing operations are free of
any tax or contribution, including the tax on credit operations or any kind of social
contributions.
11
2.3.3 – ADMINISTRATION OF RESOURCES
The Constitutional Financing Funds of the North Region (FNO) are
administered by the Ministry of National Integration (MI) and by the Deliberative
Council of the Superintendence of the Development of the Amazon (SUDAM) and
Bank of Amazon (BASA).
The FNE are also administered by the Ministry of National Integration and by
the Deliberative Council of the Superintendence of the Development of the Northeast
Region (SUDENE) and the Bank of Northeast (BNB).
The MI also manages the FCO together with the Deliberative Council of the
Superintendence of the Development of the Midwest (SUDECO) and Bank of Brazil.
The MI is responsable for laying down guidelines for the loans, establish
standards for operationalization of funding programs, supervise, monitor and control the
application of resources and evaluate the performance of these funds.
The Deliberative Council of the SUDECO, SUDENE and SUDAM are
responsible for providing, annually, the priorities for the implementation of resources,
approving the funding programs, assessing the results obtained with the application of
resources, determining measures of adjustments necessary to comply with the
established policies and the adequacy of financing activities to regional priorities, and
are responsible for routing the funding programs and the results obtained with the
application of the resources to the Congress.
The financial agents of FCO (Bank of Brazil), of the FNE (Bank of Northeast)
and the FNO (Bank of Amazon) are responsible for applying the resources, defining
standards, procedures and operational conditions of banking activity, in addition to
analyzing the financing proposals in its multiple aspects, including the relation to
economic and financial viability and granting loans.
12
2.3.4 – TYPE OF COMPANIES AND SECTORS SUPPORTED
The Constitutional Funds finance (grant loans to) farmers and firms that wish to
start, expand, diversify or modernize their businesses and to develop productive
activities in the following sectors: agriculture, livestock, industry, agribusiness, tourism,
infrastructure, trade and services. By Law, the public sector (government and state-
owned company) are not allowed to receive any kind of loans.
Family farmers framed in PRONAF2, mini and small farmers and micro and
small companies receive preferential treatment. Also, the activities that use intensively
local raw materials and labor; the production of basic food for the population; projects
that preserve the environment and/or adopt good environmental practices and projects
that promote science, technology and innovation.
The special treatment reserved for entrepreneurs, sectors and projects mentioned
above is given offering loans with extended deadlines, extended funding limits, interest
rates and other charges differentiated or favored. The interest rates can also vary
according social, economic and spatial aspects.
At this point, it is important to clarify which administrator of these Funds will
assume the risk of the loans; in other words, who should pay for the losses if the credit
become default. The risks inherent in loans contracted with Constitutional Funds are
supported in three different ways:
a) “full risk” (100%) for the Government: in cases of losses, Government will
cover the loans that became default;
2 NATIONAL PROGRAM IN SUPPORT OF FAMILY FARM (PRONAF) is intended for financial support of agricultural and non- agricultural activities exploited by direct employment of the workforce of the farmer and his family. It is understood by non agricultural activities services related to agriculture tourism, handicraft production, family agribusiness and other services in agriculture areas, which are compatible with the nature of the farm and with the best use of family labor.
13
b) “shared risk” (50%) between Government and Banks: in cases that loans became
default, Banks and Government will equally share the losses;
c) “full risk” (100%) for the Banks: in cases of losses, Banks will cover the loans
that became default.
Currently, the risks in the event of loss (default) are fully borne by the Federal
Government only for the small family farmer’s loans. Only the Bank of Brazil has taken
a “full risk” of loans granted with FCO’s resources. Most of all the loans are contracted
under “shared risk”.
2.3.5 – THE FUNDING OVER THE YEARS
Analyzing the historical series from 1989, there is a very positive balance
regarding the contribution of Constitutional Financing Funds (FCO, FNE and FNO) for
the reduction of regional inequalities and the expansion of opportunities for the
development of the North, Northeast and Midwest.
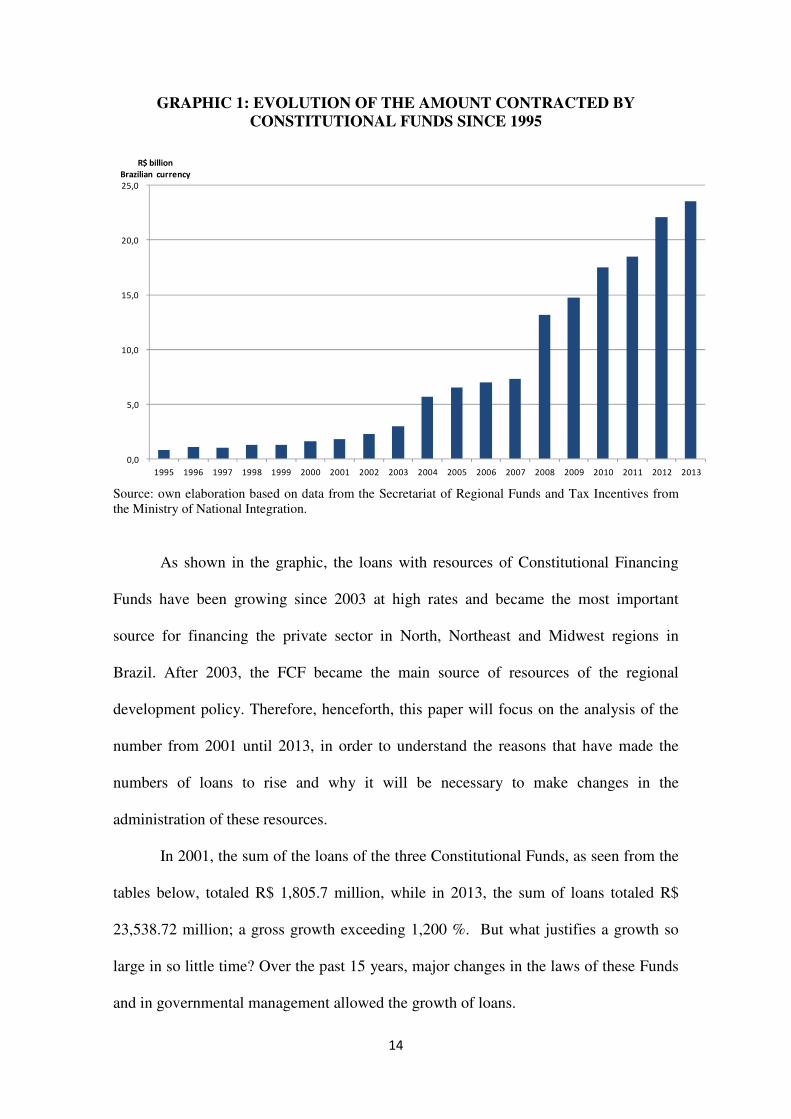
According to the Ministry of National Integration, in twenty-five years of
existence, the joint investment of FCO, FNE and FNO was higher than the R$ 166
billion, allowing for 6.5 million loans. The following chart details the evolution of
credit with this FCF’s resources from 1995 (due to the adoption of the Real Plan and the
currency stabilization in Brazil) until the year 2013 (latest information available).
14
GRAPHIC 1: EVOLUTION OF THE AMOUNT CONTRACTED BY
CONSTITUTIONAL FUNDS SINCE 1995
0,0
5,0
10,0
15,0
20,0
25,0
1995 1996 1997 1998 1999 2000 2001 2002 2003 2004 2005 2006 2007 2008 2009 2010 2011 2012 2013
R$ billion
Brazilian currency
Source: own elaboration based on data from the Secretariat of Regional Funds and Tax Incentives from the Ministry of National Integration.
As shown in the graphic, the loans with resources of Constitutional Financing
Funds have been growing since 2003 at high rates and became the most important
source for financing the private sector in North, Northeast and Midwest regions in
Brazil. After 2003, the FCF became the main source of resources of the regional
development policy. Therefore, henceforth, this paper will focus on the analysis of the
number from 2001 until 2013, in order to understand the reasons that have made the
numbers of loans to rise and why it will be necessary to make changes in the
administration of these resources.
In 2001, the sum of the loans of the three Constitutional Funds, as seen from the
tables below, totaled R$ 1,805.7 million, while in 2013, the sum of loans totaled R$
23,538.72 million; a gross growth exceeding 1,200 %. But what justifies a growth so
large in so little time? Over the past 15 years, major changes in the laws of these Funds
and in governmental management allowed the growth of loans.
15
The first amendments of greater relevance occured in January 2001, with the
enactment of Law nº 10177. From 2001, most part of the loans granted with resources
of Constitutional Funds are “share risk” between the government and the bank. In other
words, in case of default, banks and government split the losses. For some loans
contracted with small family farmers, the risk of the operation are exclusively of the
government, i.e., in the event of a default the government pays for the losses. The
measure forced the banks to be more responsible at the time of the granting credit, by
selecting the best projects according technical issues (and not political issues) and
allowing the return of the loans for future budgets.
This measure has also allowed the government to afford half of an eventual
default loss and encourage the banks to grant credit to those farmers and firms which
the risk of the loan is extremely high because of their historical banking or by the
economic activity that they play. The measure, although controversial, because FCF is a
public policy, has made possible the access to credit for thousands of small farmers and
companies who, until then, were not included in the financial market. By inserting these
entrepreneurs in the credit market, there is no doubt that the measure was quite
successful. Now, it is necessary to respond if this increase in loans allowed the desired
economy growth in the undeveloped regions in Brazil.
Secondly, another important measure adopted from 2001 relates to interest rate.
From this year, the interest rates have to be pre-set, i.e., at the moment to sign a loan
contract, the farmers and firms knew with certainty the interest rate that would apply
throughout the contract. Until then, the interest rates varied according to the TJLP3 and
3 TJLP: The Long-term Interest Rate was introduced by 1994 Provisional Measure nº 684. The TJLP has duration of three months and is calculated from the following parameters: I - inflation target calculated pro rata for the twelve months following the first month of validity of rate, including, based on annual targets laid down by the National Monetary Council; II – “premium risk”. The TJLP is fixed by the National Monetary Council and disclosed until the last working day of the quarter immediately prior to its expiry. Currently, in January 31, 2015, the TJLP is fixed at 5.5% a.a.
16
indexes that measured inflation in the period. This arrangement brought insecurity for
entrepreneurs, because they did not know, for sure, which would be the rates that would
apply in the course of financing, preventing an adequate planning of its activities. The
law also created a reward repayment, a kind of discount for those entrepreneurs who
regulary pay their loan installments.
Despite these changes in the form of interest rates, it was determined that by an
act of Executive Branch interest rates could be reviewed annually. Thus, the interest
rates can be changed, ranging to more or to less, adapting better to the reality of the
market. It should be pointed out that the new interest rates can only be extended to old
contracts if it is to benefit the borrowers, i.e. , if the new interest rates are lower than the
rates originally contracted.
Another important change in the FCF’s interest rates occurred in 2001. They
have to be differentiated by size of farmers and companies and sector of the economy
since then. A little later (in 2012), the law authorized the Executive Branch to set
interest rates in accordance with the purpose of financing and by location of the firms
and farmers (localities more developed x localities less developed). This change has
made possible for the Ministry of National Integration to intensify its policy of
differentiation, seeking to achieve in an appropriate intensity the population focus of
regional policy.
Up to 2001, FCF granted loans only to the rural and industrial sectors. Important
sectors for the Brazilian economy were not possible to finance: trade activities, services
and infrastructure. Therefore, it could not finance schools, hospitals, supermarkets,
shopping malls, construction of a hydroelectric power plant, a port, among other
relevant activities. It is recorded that in the great part of the main cities in the interior of
Brazil, mainly those municipalities in the North and Northeast regions of the country,
17
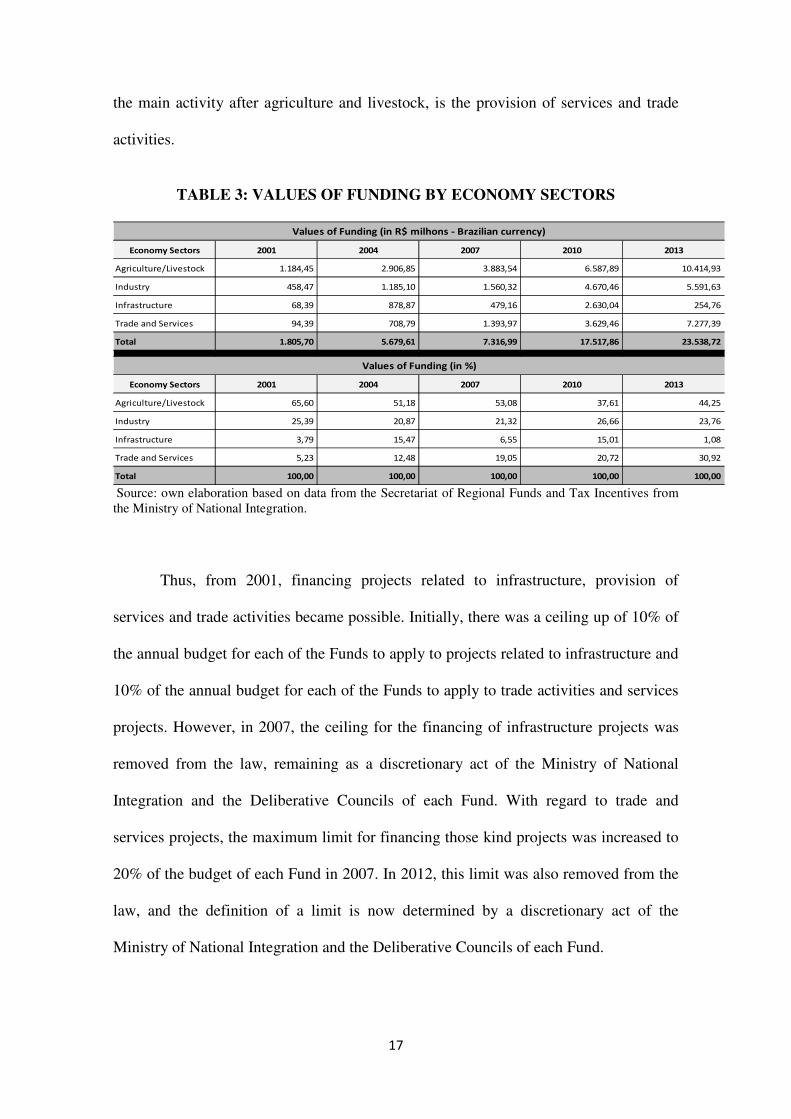
the main activity after agriculture and livestock, is the provision of services and trade
activities.
TABLE 3: VALUES OF FUNDING BY ECONOMY SECTORS
Economy Sectors 2001 2004 2007 2010 2013
Agriculture/Livestock 1.184,45 2.906,85 3.883,54 6.587,89 10.414,93
Industry 458,47 1.185,10 1.560,32 4.670,46 5.591,63
Infrastructure 68,39 878,87 479,16 2.630,04 254,76
Trade and Services 94,39 708,79 1.393,97 3.629,46 7.277,39
Total 1.805,70 5.679,61 7.316,99 17.517,86 23.538,72
Economy Sectors 2001 2004 2007 2010 2013
Agriculture/Livestock 65,60 51,18 53,08 37,61 44,25
Industry 25,39 20,87 21,32 26,66 23,76
Infrastructure 3,79 15,47 6,55 15,01 1,08
Trade and Services 5,23 12,48 19,05 20,72 30,92
Total 100,00 100,00 100,00 100,00 100,00
Values of Funding (in R$ milhons - Brazilian currency)
Values of Funding (in %)
Source: own elaboration based on data from the Secretariat of Regional Funds and Tax Incentives from the Ministry of National Integration.
Thus, from 2001, financing projects related to infrastructure, provision of
services and trade activities became possible. Initially, there was a ceiling up of 10% of
the annual budget for each of the Funds to apply to projects related to infrastructure and
10% of the annual budget for each of the Funds to apply to trade activities and services
projects. However, in 2007, the ceiling for the financing of infrastructure projects was
removed from the law, remaining as a discretionary act of the Ministry of National
Integration and the Deliberative Councils of each Fund. With regard to trade and
services projects, the maximum limit for financing those kind projects was increased to
20% of the budget of each Fund in 2007. In 2012, this limit was also removed from the
law, and the definition of a limit is now determined by a discretionary act of the
Ministry of National Integration and the Deliberative Councils of each Fund.
18
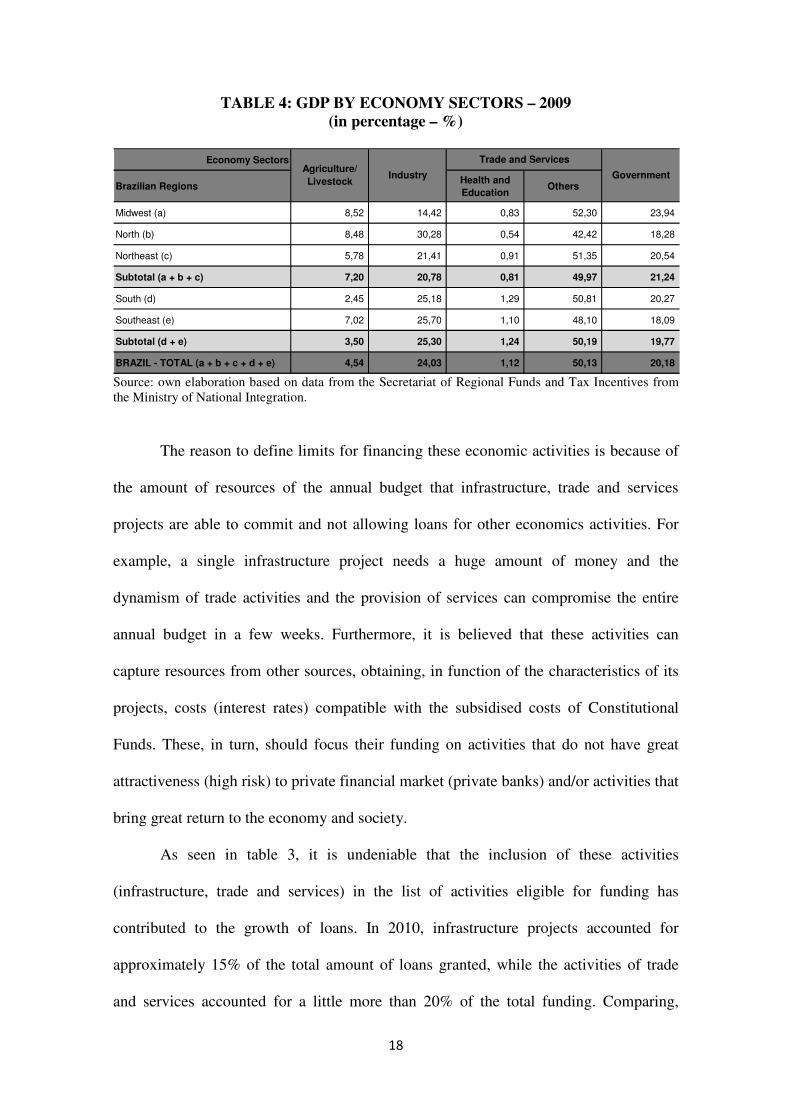
TABLE 4: GDP BY ECONOMY SECTORS – 2009
(in percentage – %)
Economy Sectors
Brazilian RegionsHealth and
EducationOthers
Midwest (a) 8,52 14,42 0,83 52,30 23,94
North (b) 8,48 30,28 0,54 42,42 18,28
Northeast (c) 5,78 21,41 0,91 51,35 20,54
Subtotal (a + b + c) 7,20 20,78 0,81 49,97 21,24
South (d) 2,45 25,18 1,29 50,81 20,27
Southeast (e) 7,02 25,70 1,10 48,10 18,09
Subtotal (d + e) 3,50 25,30 1,24 50,19 19,77
BRAZIL - TOTAL (a + b + c + d + e) 4,54 24,03 1,12 50,13 20,18
Agriculture/
LivestockIndustry
Trade and Services
Government
Source: own elaboration based on data from the Secretariat of Regional Funds and Tax Incentives from the Ministry of National Integration.
The reason to define limits for financing these economic activities is because of
the amount of resources of the annual budget that infrastructure, trade and services
projects are able to commit and not allowing loans for other economics activities. For
example, a single infrastructure project needs a huge amount of money and the
dynamism of trade activities and the provision of services can compromise the entire
annual budget in a few weeks. Furthermore, it is believed that these activities can
capture resources from other sources, obtaining, in function of the characteristics of its
projects, costs (interest rates) compatible with the subsidised costs of Constitutional
Funds. These, in turn, should focus their funding on activities that do not have great
attractiveness (high risk) to private financial market (private banks) and/or activities that
bring great return to the economy and society.
As seen in table 3, it is undeniable that the inclusion of these activities
(infrastructure, trade and services) in the list of activities eligible for funding has
contributed to the growth of loans. In 2010, infrastructure projects accounted for
approximately 15% of the total amount of loans granted, while the activities of trade
and services accounted for a little more than 20% of the total funding. Comparing,
19
infrastructure and trade and services activities accounted for 3.79% and 5.23% of the
total amount loans granted in 2001.
In this period, according to the MI, major projects of energy sector were funded,
between them, the two hydroelectric power stations on the Madeira River in the State of
Rondonia (Santo Antonio and Jirau), the hydroelectric power station in the Xingu River,
in the State of Para (Belo Monte), transmission lines, wind power plants in the
Northeast Region. In this same period, the main cities of the Northern Region, including
state capitals, had financed their first major shopping malls and large retail chains of
supermarkets.
However, the Ministry of National Integration returned to regulate the financing
of infrastructure projects. It sealed the granting of credit with resources of
Constitutional Funds in 2012 for the implementation of projects of generation,
transmission and distribution of energy, except in the cases of generation of electricity
for their own consumption of the venture.
It is important to record that the funding for the small family farmers, framed in
PRONAF (operations that the Government fully accept the risk of the operation), had
great importance for the growth of the total values financed. According to information
available by the Ministry of National Integration, approximately 10% of the total
amount of loans granted in 2013 were for financing these small family farmers.
As shown in the table 3, the loans to the industrial sector always represented a
little more than 20% of total amount, year upwards, year down, but without ever losing
large representativity. On the other hand, loans for rural producers have fallen of 65.6%
in 2001 to 44.2% in 2013. In 2010, the financing granted to the rural sector accounted
for 37.6% of the total borrowing in the year.
20
A second way to examine the loans of Constitutional Funds is to look at the
applications according to the size of the company. As defined in Law nº 7827,
preferential treatment of productive activities of mini and small agricultures, their
associations and cooperatives, and micro and small enterprises is provided. Therefore,
the banks must observe the priority to finance the activities of small businesses.
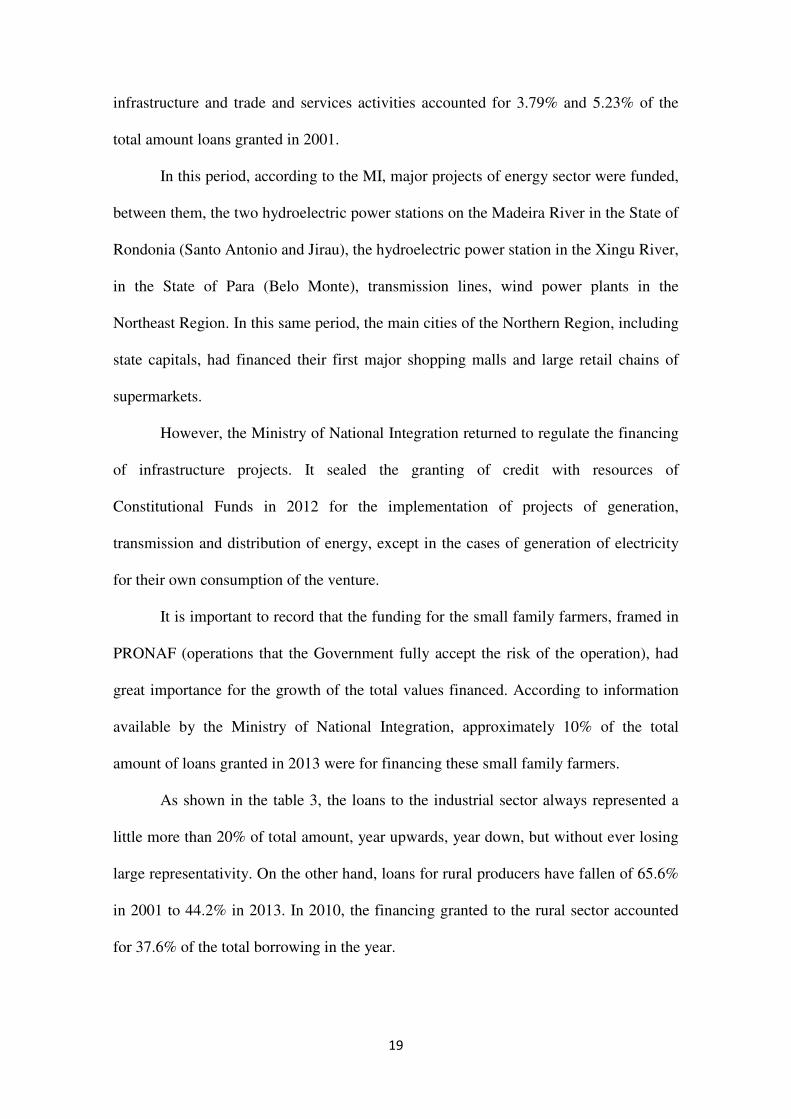
It is important to note that the size of the company is defined by its annual gross
revenues: increased annual revenue, increased the size of the company, as shown in the
Figure 1 below:
FIGURE 1: COMPANY SIZE
Micro Until R$ 360,000
Small R$ 360,000 to R$ 3.6 million
Small-Medium R$ 3.6 millon to R$ 16 million
Medium R$ 16 million to R$ 90 million
Large Above R$ 90 million
Company Size by Annual Gross Revenue (Brazilian currency)
Source: own elaboration based on data from the Secretariat of Regional Funds and Tax Incentives from the Ministry of National Integration.
In 2011, the definition of size between companies and rural producers became
the same. This amendment had the objective of reducing any distortions that could
adversely affect rural producers and enterprises whose levels of billing result in separate
framework, because of the different criteria used by other federal financial institutions.
In that year, the MI also set an important guideline. It established that 51% of the
resources of the three FCF must be intended for smaller entrepreneurs (micro, small and
small-medium businesses). The objective of this measure was to force the banks of
Constitutional Funds to make more efforts to grant loans preferably to this priority
21
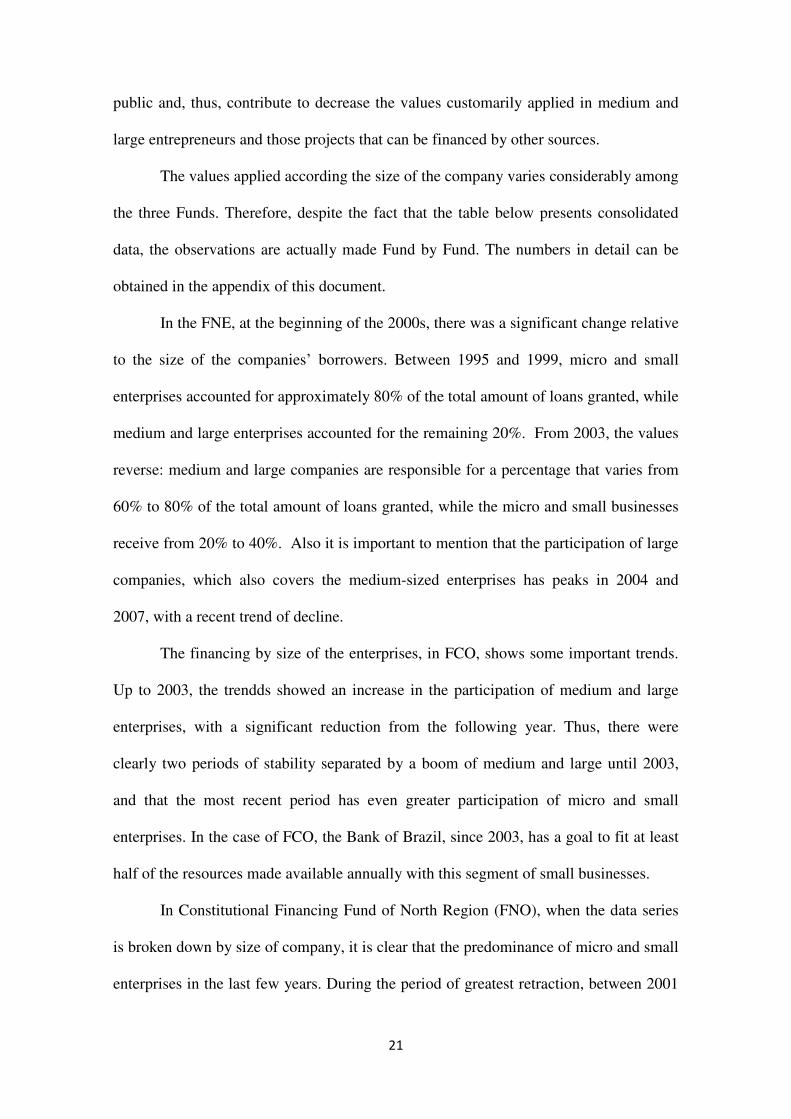
public and, thus, contribute to decrease the values customarily applied in medium and
large entrepreneurs and those projects that can be financed by other sources.
The values applied according the size of the company varies considerably among
the three Funds. Therefore, despite the fact that the table below presents consolidated
data, the observations are actually made Fund by Fund. The numbers in detail can be
obtained in the appendix of this document.
In the FNE, at the beginning of the 2000s, there was a significant change relative
to the size of the companies’ borrowers. Between 1995 and 1999, micro and small
enterprises accounted for approximately 80% of the total amount of loans granted, while
medium and large enterprises accounted for the remaining 20%. From 2003, the values
reverse: medium and large companies are responsible for a percentage that varies from
60% to 80% of the total amount of loans granted, while the micro and small businesses
receive from 20% to 40%. Also it is important to mention that the participation of large
companies, which also covers the medium-sized enterprises has peaks in 2004 and
2007, with a recent trend of decline.
The financing by size of the enterprises, in FCO, shows some important trends.
Up to 2003, the trendds showed an increase in the participation of medium and large
enterprises, with a significant reduction from the following year. Thus, there were
clearly two periods of stability separated by a boom of medium and large until 2003,
and that the most recent period has even greater participation of micro and small
enterprises. In the case of FCO, the Bank of Brazil, since 2003, has a goal to fit at least
half of the resources made available annually with this segment of small businesses.
In Constitutional Financing Fund of North Region (FNO), when the data series
is broken down by size of company, it is clear that the predominance of micro and small
enterprises in the last few years. During the period of greatest retraction, between 2001
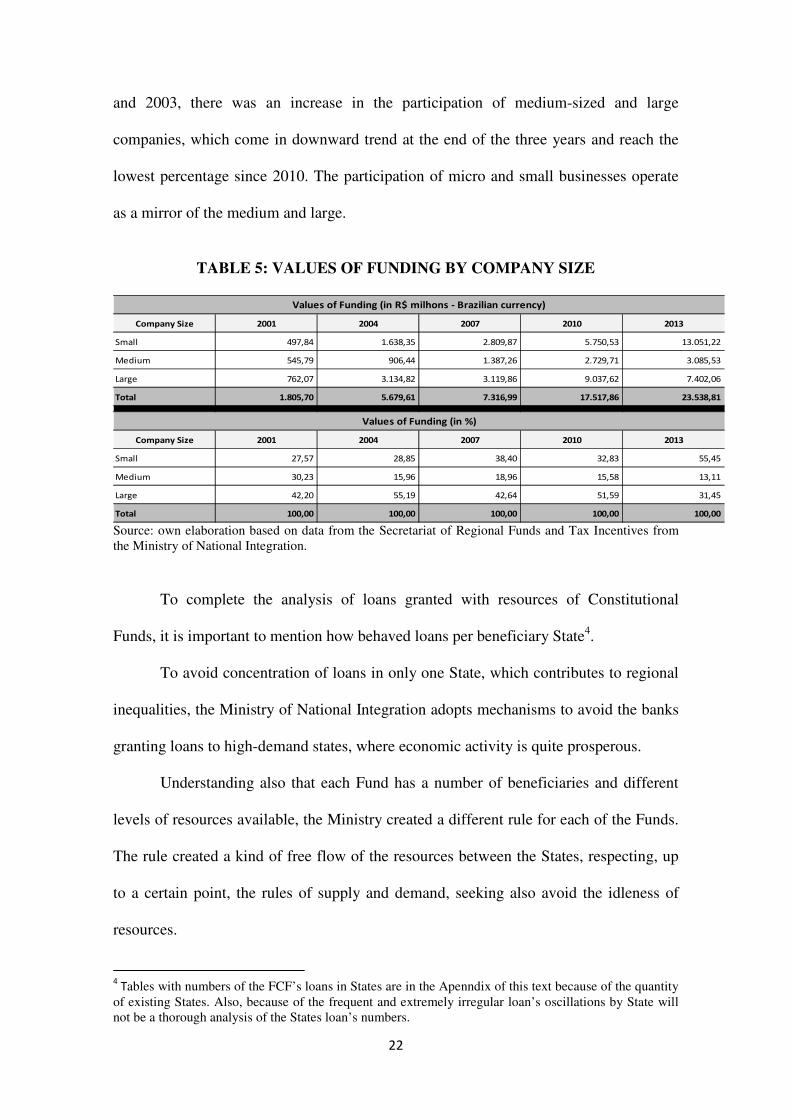
22
and 2003, there was an increase in the participation of medium-sized and large
companies, which come in downward trend at the end of the three years and reach the
lowest percentage since 2010. The participation of micro and small businesses operate
as a mirror of the medium and large.
TABLE 5: VALUES OF FUNDING BY COMPANY SIZE
Company Size 2001 2004 2007 2010 2013
Small 497,84 1.638,35 2.809,87 5.750,53 13.051,22
Medium 545,79 906,44 1.387,26 2.729,71 3.085,53
Large 762,07 3.134,82 3.119,86 9.037,62 7.402,06
Total 1.805,70 5.679,61 7.316,99 17.517,86 23.538,81
Company Size 2001 2004 2007 2010 2013
Small 27,57 28,85 38,40 32,83 55,45
Medium 30,23 15,96 18,96 15,58 13,11
Large 42,20 55,19 42,64 51,59 31,45
Total 100,00 100,00 100,00 100,00 100,00
Values of Funding (in R$ milhons - Brazilian currency)
Values of Funding (in %)
Source: own elaboration based on data from the Secretariat of Regional Funds and Tax Incentives from the Ministry of National Integration.
To complete the analysis of loans granted with resources of Constitutional
Funds, it is important to mention how behaved loans per beneficiary State4.
To avoid concentration of loans in only one State, which contributes to regional
inequalities, the Ministry of National Integration adopts mechanisms to avoid the banks
granting loans to high-demand states, where economic activity is quite prosperous.
Understanding also that each Fund has a number of beneficiaries and different
levels of resources available, the Ministry created a different rule for each of the Funds.
The rule created a kind of free flow of the resources between the States, respecting, up
to a certain point, the rules of supply and demand, seeking also avoid the idleness of
resources.
4 Tables with numbers of the FCF’s loans in States are in the Apenndix of this text because of the quantity
of existing States. Also, because of the frequent and extremely irregular loan’s oscillations by State will not be a thorough analysis of the States loan’s numbers.
23
Thus, since 2010 the banks must finance in each of the localities a minimum
percentage, limited to a maximum percentage. For example, in the Northeastern Region,
the minimum of the available resources of the FNE on year to each of the States is
4.5%, and the maximum is 30% of annual resources. Since the existence of the rule, it
was not possible to reach the minimum percentage of application only in the Distrito
Federal (DF), federal unit in the Midwest Region.
2.4 – NEW DIRECTIONS: THE NEED TO EVALUATE AND POINT TO NEW
ALTERNATIVES
Since 2010, the resources of Constitutional Financing Funds, according to
Ministry of National Integration, prove insufficient to attend the demand for credit of
the firms and farmers located in the beneficiary regions and, even more important,
unable to accelerate the reduction of regional inequalities that still exist at high levels.
In recent years, the economic growth of Brazil, combined with the various social
programs of the Federal Government, the agribusiness, the high demand for investments
and the drop in interest rates for the long-term financing, worned all availabilities
remnants of years of low application of Constitutional Funds. Also contributed to this
scenario of scarcity of these resources the insertion of economic activities without the
slightest concern about the ability of such activity contribute to the fulfilment of the
objective of the Fund.
Alternatives in the short term were adopted to minimize the lack of funding at a
cheap cost for the entrepreneurs of the beneficiary regions. The Ministry of Finance
proposal conformed to equalize the interest rates of funding from other sources, but
alternatives such as this, in a scenario of national fiscal adjustment, will be in the
coming years not wel welcome.
24
There is a need to develop a long-term sustainable solution. An alternative is
better allocate resources of Constitutional Funds with the resources of The Brazilian
Development Bank (BNDES).
BNDES is the main financing agent for development in Brazil. Since its
foundation, in 1952, the BNDES has played a fundamental role in stimulating the
expansion of industry and infrastructure in the country. Over the course of the Bank’s
history, its operations have evolved in accordance with the Brazilian socio-economic
challenges, and now they include support for exports, technological innovation,
sustainable socio-environmental development and the modernization of public
administration.
The Bank offers several financial support mechanisms to Brazilian companies of
all sizes as well as public administration entities, enabling investments in all economic
sectors. In any supported undertaking, from the analysis phase up to the monitoring, the
BNDES emphasizes three factors it considers strategic: innovation, local development
and socio-environmental development.
The BNDES also finances the expansion of national companies far beyond the
borders of the country and seeks to diversify the sources of its resources on the
international market. In addition, the BNDES has strengthened its efforts that are
already traditionally conducted, such as financing exports of Brazilian goods and
services in projects carried out overseas and institutional fundraising through
multilateral organizations, sharing experiences and promotion opportunities.
The table below shows the values applied by the BNDES since 2001. As the
applications of Constitutional Funds, applications by the Bank accelerate from 2003,
reaching almost R$ 200 billion at the end of the analyzed period. It is to be noted that
the participation of the applications of the BNDES in the regions (North, Northeast and
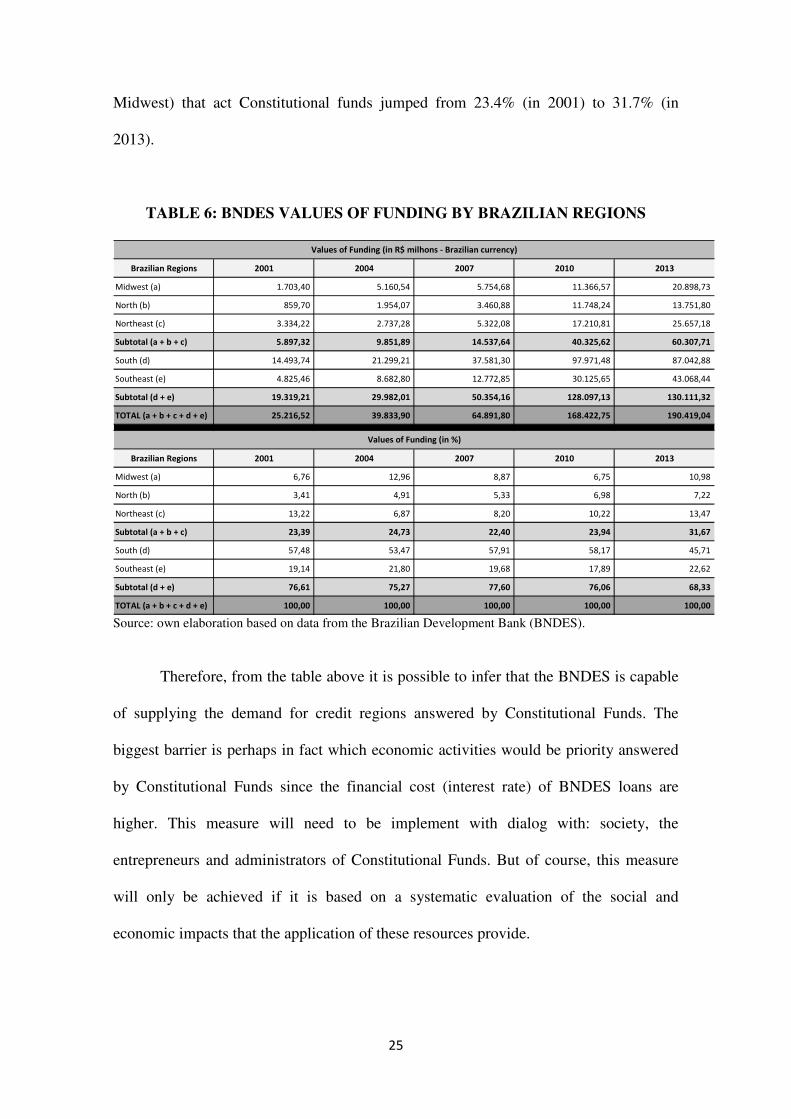
25
Midwest) that act Constitutional funds jumped from 23.4% (in 2001) to 31.7% (in
2013).
TABLE 6: BNDES VALUES OF FUNDING BY BRAZILIAN REGIONS
Brazilian Regions 2001 2004 2007 2010 2013
Midwest (a) 1.703,40 5.160,54 5.754,68 11.366,57 20.898,73
North (b) 859,70 1.954,07 3.460,88 11.748,24 13.751,80
Northeast (c) 3.334,22 2.737,28 5.322,08 17.210,81 25.657,18
Subtotal (a + b + c) 5.897,32 9.851,89 14.537,64 40.325,62 60.307,71
South (d) 14.493,74 21.299,21 37.581,30 97.971,48 87.042,88
Southeast (e) 4.825,46 8.682,80 12.772,85 30.125,65 43.068,44
Subtotal (d + e) 19.319,21 29.982,01 50.354,16 128.097,13 130.111,32
TOTAL (a + b + c + d + e) 25.216,52 39.833,90 64.891,80 168.422,75 190.419,04
Brazilian Regions 2001 2004 2007 2010 2013
Midwest (a) 6,76 12,96 8,87 6,75 10,98
North (b) 3,41 4,91 5,33 6,98 7,22
Northeast (c) 13,22 6,87 8,20 10,22 13,47
Subtotal (a + b + c) 23,39 24,73 22,40 23,94 31,67
South (d) 57,48 53,47 57,91 58,17 45,71
Southeast (e) 19,14 21,80 19,68 17,89 22,62
Subtotal (d + e) 76,61 75,27 77,60 76,06 68,33
TOTAL (a + b + c + d + e) 100,00 100,00 100,00 100,00 100,00
Values of Funding (in R$ milhons - Brazilian currency)
Values of Funding (in %)
Source: own elaboration based on data from the Brazilian Development Bank (BNDES).
Therefore, from the table above it is possible to infer that the BNDES is capable
of supplying the demand for credit regions answered by Constitutional Funds. The
biggest barrier is perhaps in fact which economic activities would be priority answered
by Constitutional Funds since the financial cost (interest rate) of BNDES loans are
higher. This measure will need to be implement with dialog with: society, the
entrepreneurs and administrators of Constitutional Funds. But of course, this measure
will only be achieved if it is based on a systematic evaluation of the social and
economic impacts that the application of these resources provide.
26
3 – WHY EVALUATE?
One of the first questions evaluators should ask is: why is it necessary to
evaluate? Making clear the reasons for evaluation is one of the first steps to making
well-informed decisions when the evaluation process is confronted with the limitations
of everyday life. To say that is to recognize that it is impossible to evaluate everything
in every manner, and that we have to deal with the constraints of resources – in terms of
budget, personnel and expertise.
Discussing motivations for evaluation we should recognize that this process
usually involves interests of a wide range of groups. In a governmental program,
citizens and elected officials may be interested in the outcomes of a program that
receives a significant amount of public resources. Program staff are interested in
improving program performance through evaluation. Finally, managers and leaders
have to make decisions based on some evidence about the results of the program.
Recognizing that, we see that a useful evaluation that is worth the cost and the work
involved should not only answer accountability questions, but also be used to improve
program performance.
The development of a systematic monitoring and evaluation of the
Constitutional Financing Funds is vital, not only to the actions of the Secretariat of
Regional Funds and Tax Incentives (SFRI), but also to the activity of the Ministry of
National Integration (MI) as a whole, with a view, that the results of these processes
will contribute to continuous improvement of public policies of this Ministry and its
remit - in this case, the management of Regional Funds and Tax Incentives, in addition
to pursuing the completion of the institutional mission of this Ministry: to promote
national integration, sustainable development and overcoming regional inequalities in
the country, ensuring social inclusion and improving the quality of life.
27
The implementation of a systematic monitoring and evaluation of the FCF will
also improve the management tools of Superintendence of Regional Development
(SUDAM, SUDECO and SUDENE) and the financial institutions (Bank of the Amazon,
Bank of Brazil and the Bank of Northeast).
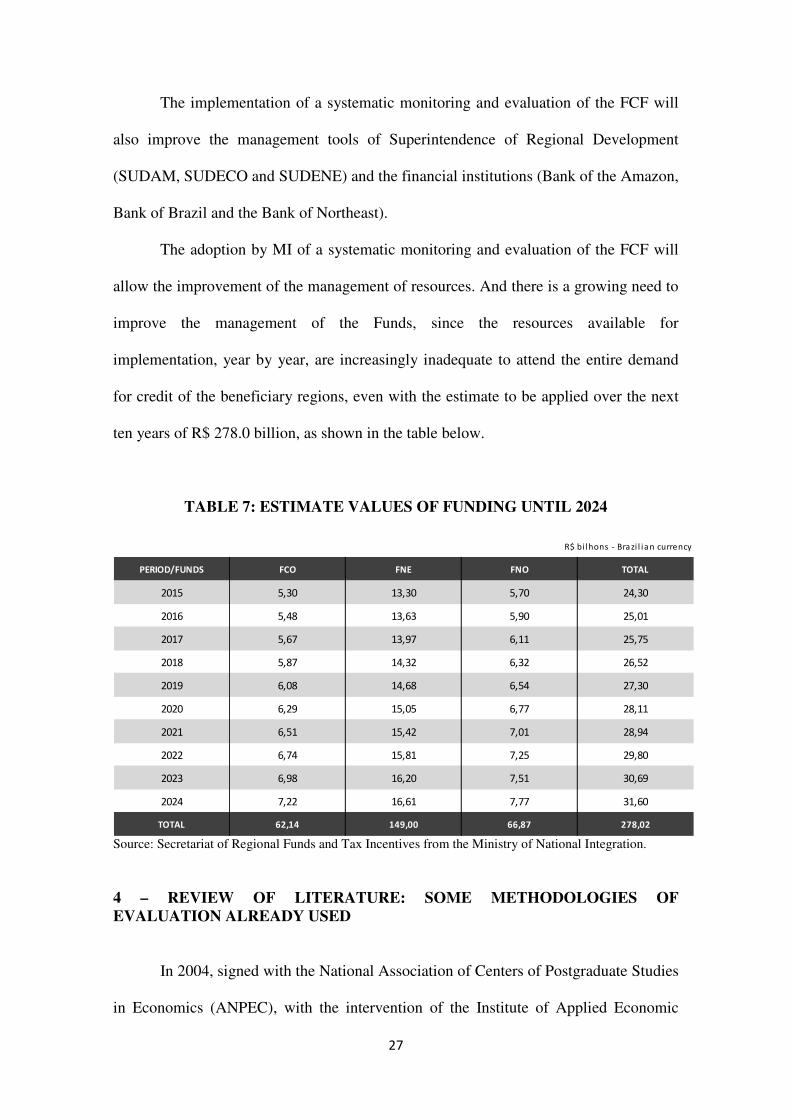
The adoption by MI of a systematic monitoring and evaluation of the FCF will
allow the improvement of the management of resources. And there is a growing need to
improve the management of the Funds, since the resources available for
implementation, year by year, are increasingly inadequate to attend the entire demand
for credit of the beneficiary regions, even with the estimate to be applied over the next
ten years of R$ 278.0 billion, as shown in the table below.
TABLE 7: ESTIMATE VALUES OF FUNDING UNTIL 2024
R$ bi lhons - Brazi l ian currency
PERIOD/FUNDS FCO FNE FNO TOTAL
2015 5,30 13,30 5,70 24,30
2016 5,48 13,63 5,90 25,01
2017 5,67 13,97 6,11 25,75
2018 5,87 14,32 6,32 26,52
2019 6,08 14,68 6,54 27,30
2020 6,29 15,05 6,77 28,11
2021 6,51 15,42 7,01 28,94
2022 6,74 15,81 7,25 29,80
2023 6,98 16,20 7,51 30,69
2024 7,22 16,61 7,77 31,60
TOTAL 62,14 149,00 66,87 278,02
Source: Secretariat of Regional Funds and Tax Incentives from the Ministry of National Integration. 4 – REVIEW OF LITERATURE: SOME METHODOLOGIES OF
EVALUATION ALREADY USED
In 2004, signed with the National Association of Centers of Postgraduate Studies
in Economics (ANPEC), with the intervention of the Institute of Applied Economic
28
Research (IPEA), agreement with the objective of developing and disseminating
methodology for measurement of impacts arising from the investment of the resources
of these Funds.
Since then, the Ministry has been promoting meetings with the participation of
representatives of banks of Constitutional Financing Funds (Bank of Amazon: FNO;
Bank of Brazil: FCO and Bank of Northeast: FNE), the Superintendence of the
Development of the Midwest (SUDECO), of the Amazon (SUDAM) and of the
Northeast (SUDENE), aiming to draw up guidelines for the improvement of the
assessment of FCO, the FNO and the FNE.
As a result of measures taken, the information requested for this Ministry assess
the economic impacts and social arising from loans with resources of Constitutional
financing funds comes presenting sensitive developments, mainly in the case of the
FNO and the FNE, which are presented on reports on activities and results of these
Funds.
The contribution to the analysis of the financial instruments of regional
development is offered by the Bank of Northeast (BNB) from the formulation, which
began in 2005, an array of logical structure that tariff all assessment instruments and
describes - in absolute values and in frequency, activity, product, and location - various
data on the implementation, effectiveness and the results of their applications. The
reports BNB (2009a), BNB (2009b) and BNB (2009g) compare with data from the
periods 2000 to 2004, 2000 to 2005 and 2000 to 2006, respectively, the relative
variation and accumulated in the level of employment, be based on mobile or stationary,
the companies that received those that do not receive funding from the FNE. To
describe the evolution each year from stock of employment; the number of persons
employed by region and second 12 sectors of activity; labor income by income range
29
and gender; and admissions, by range of salary, age and gender. These studies conclude
that the growth in the number of jobs in all companies financed is superior to those who
form the group of not financed, contributing to a rise in employment in the Northeast,
and that the resources of the FNE influenced, as a matter of priority and in degree of
importance, the generation of jobs in sectors of farming, industry and agriculture.
In BNB (2009c) the database identifies the subsectors of economic activity
intensive labor-intensive, and that provide the highest labor income in the Northeast
region from 2000 to 2005 and concluded that 55% of the resources of the FNE were
applied in these sectors, which were: livestock, agriculture, retail trade, industry, food
products and wholesale trade.
In four following papers the BNB used field research reconciled to analyzes of
the array of logical structure. The report BNB (2009d), built from questionnaires in 140
industries by all states in the Northeast, it was concluded that the Program for the
Development of Agribusiness in the Northeast (AGRIN) contributed to the generation
of employment and income, for the increase of the value added of agricultural
production and for the technological modernization of agro-industrial ventures between
the years of 1998 to 2006, even though in a somewhat significant due to the small
volume of loans.
The BNB (2009e) points: an increase of resources contracted from 2003, in the
period from 1989 to 2007; the implementation of legal obligation to apply half of the
resources in semi-arid regions; a focus on micro and small enterprises; and a positive
impact on socioeconomic variables in periods of greater disbursement, even without
isolating the effects of the FNE.
The BNB (2010a) concludes, on the basis of a socioeconomic diagnosis from
questionnaires applied to 180 beneficiaries, (109 men and 46 women in rural areas and
30
18 men and seven women in seats of municipalities) and compared to the performance
variables; whereas the impacts of PRONAF, type B, are still incipient on various
socioeconomic indicators, given its low amount of resources in comparison to the FNE-
Total, for the period 2000 to 2008.
The BNB (2010c) describes the evaluation of the Program in Support of the
Regional Tourism (PROATUR) from questionnaires in 90 companies and the analysis
of data for the period 2000 to 2008 by Input-Output Matrix (MIP) to evaluate the impact
of this program on production, income, employment, wages and taxation.
The findings indicate that there was no impact on the generation of jobs,
revenue, and in the flow of income, particularly in the states of Bahia, Ceara, Alagoas
and Rio Grande do Norte, concentrated, mainly in the activity of housing. Subsequently,
the bank uses the same methodology for analysis of MIP for the years 2009, 2010 and
2011, published in the reports BNB (2010d), (2011), (2012), to check the impact of the
resources of the FNE on seven key sectors of the Northeast region. These reports
indicate that the rural sector is the one that has the largest multiplier effects on
employment, taxes and income; followed by Trade and Services sectors, Industry,
Tourism and Infrastructure.
The Bank of Amazon has published several studies with outbreaks in impacts of
Constitutional Financing Funds and the PNDR on the Northern region from 2013. From
estimates of data models in painel, Bank of Amazon (2013a) shows that the GDP is
positively correlated with the physical capital, calculated by quantitative index
synthetic, human capital (years of study), the capital (number of new cooperatives), the
natural capital (the rate of deforestation) and the FNO, for the period 1995 to 2009. As
the natural capital is abundant in the region and the companies cannot incorporate in
their spreadsheets to cost the damage caused by the use of natural resources, the returns
31
generated by physical capital, influenced by activities of exploration and mineral
transformation, become preponderant.
The Bank of Amazon (2013b) used a methodology of factorial analysis to find
that there was a reduction in the ratio between capital and labor, a reduction in the
intensity of land use in the period of 1985 and 2006, mainly from 1995 to 2006, which
was interpreted as a low effectiveness of the credit, but that there was a breakthrough in
the access to services of technical assistance and management practices and soil
conservation. The study also concludes that there has not been a modernisation of the
agricultural activities in the Northern Region between 1974 and 2010.
The following report published in 2013, Bank of Amazon (2013c), the bank
assessed whether there was convergence in productivity of land and labor between the
municipalities of the north region, organized in Comparable Minimum Areas (AMC),
by estimates clubs of convergence based on calculations of density distribution, arrays
of transition of Markov, core stochastic and threshold; for the periods 1975 to 1985 and
from 1996 to 2006, two periods before and two after the FNO. The report revealed a
process of divergence characterized by a convergence in two blocks, in which the
greater part of AMC’s converged to the block of low productivity of land and labor and
that this process was not statistically related to credit offered by FNO.
However, from simulations of a General Equilibrium Model (EGC), which
absorb the substitutions between the consumer goods resulting from changes in relative
prices, on the basis of an array of MIP with data for 1999, Bank of Amazon (2013d)
showed that there are positive knock-on effects of the credit on the product, the income
and the salary of all the Northern states, but that the fact that the supply of credit is
concentrated in the states of Tocantins and Para, which are precisely the states with
32
economies more expressive and with activities more concentrated in a few sectors,
makes that the credit is not able to reduce regional imbalances.
In the following report, Bank of Amazon (2013g), organised interviews
collected in 234 enterprises of all states of the North region between 2006 and 2011 and
confirmed from the responses of the majority of the interviewees that the credit policy
has been conducted with efficiency and contributed to the local economy; and
multivariate regression by the Method of Generalized Moments (MMG) concluded that
the FNO has helped to raise the gross revenues, the occupation of labor, labor
productivity, the profit margin and the insertion of products on the markets. Another
interesting point raised by the report refers to the conclusion that the impacts of the
FNO indicators on economic, social, technological and environmental levels strongly
asymmetric between the enterprises, which strengthens the strategy of unbalanced
growth and divergent between sectors of the economy and the states in the Northern
Region.
The Bank of Brazil, in spite of the recommendations of the Ministry of National
Integration, never presented a paper of evaluation of the FCO. The directors of the Bank
believes that the responsability to evaluate is of the other administrador of the Fund and
the Bank needs only to provide the necessary information.
It is possible to find others academic papers regarding the applications of
Constitutional Funds and ways of how to evaluate these resources. It is striking that
these papers have great quality and offer important contributions to the development of
a methodology for the evaluation. However, these studies were also inspiration for the
papers prepared by the Bank of the Amazon and the Bank of the Northeast, exhaustively
described in this section. Therefore, a large part of the authors who offer their
33
contribution to this discussion is mentioned in the bibliography of this work and will not
trace the outline of your paper.
Although there are several different impact assessments for the three funds
(FNO, FCO and FNE), the diversity of methodologies and review periods in these jobs
demand careful comparisons between their results in the search for contradictory results,
which deserve further assessments and new analyzes based on methodology and lapse
in time in common to the three Constitutional Funds, in order to expand the knowledge
about the current credit policy developed under the PNDR and make it simpler to
compare the effects of existing instruments. The creation of this methodology should
consider future periodic assessments that facilitate decision-making on the future
directions of financing instruments of the PNDR.
5 – PROPOSAL OF A MODEL FOR SYSTEMATIC EVALUATION FOR
BRAZIL'S CONSTITUTIONAL FINANCING FUNDS
5.1 – CONSIDERATIONS ON MONITORING AND EVALUATION OF PUBLIC
POLICIES
According to Rossi and Freeman (1985), the assessment is defined as a
systematic implementation of procedures for social research with the aim of achieving
the concept, the implementation and the usefulness of a program of social intervention.
Specifically, according to the authors, the evaluation research involves the use of
methodologies of social research in order to analyze and promote improvements in
planning, monitoring effectiveness and efficiency of social policies.
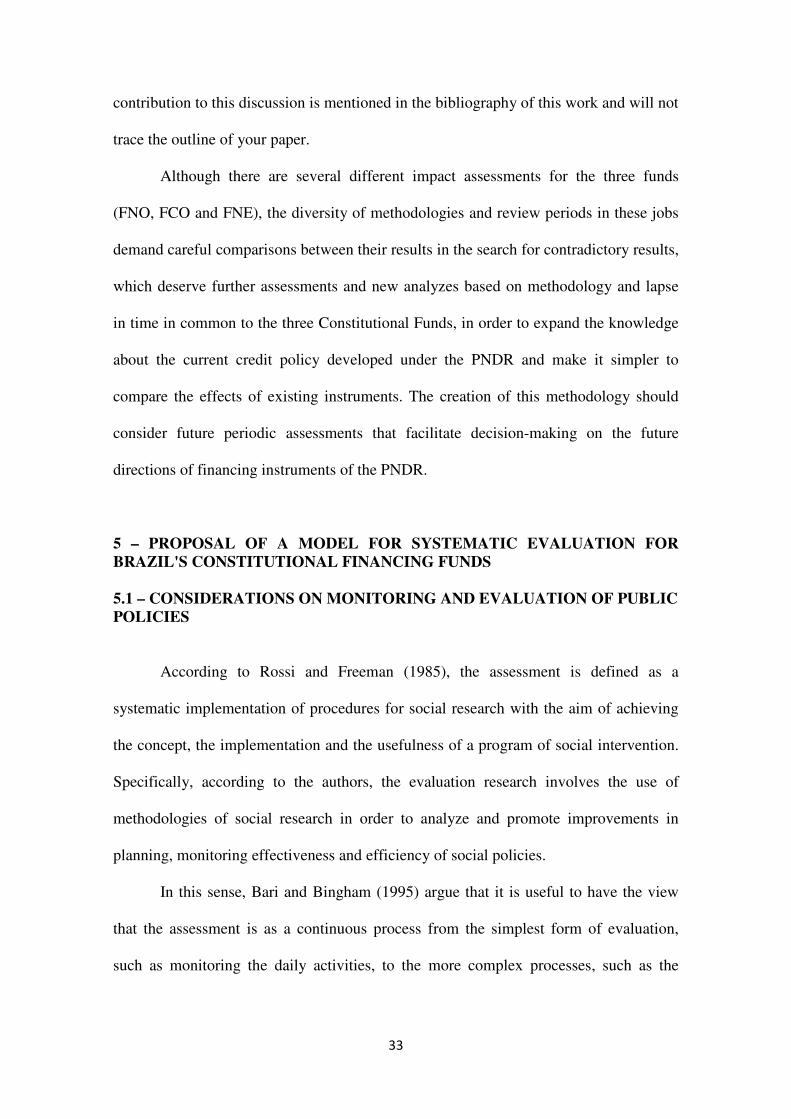
In this sense, Bari and Bingham (1995) argue that it is useful to have the view
that the assessment is as a continuous process from the simplest form of evaluation,
such as monitoring the daily activities, to the more complex processes, such as the
34
evaluation of the impact on the problem. This continuous process is illustrated in Figure
2 below.
FIGURE 2
Monitoring of
daily activities
Evaluation of the
activities of the
program
Enumeration of
results
Analysis of
effectiveness
Cost-benefit
analysis of
Analysis of the
impact on the
problem
PROCESS RESULT
The six levels of evaluation illustrated in Figure 2 are developed approximately
in the same sequence that the implementation of the program. First, the tasks are
monitored, the activities are evaluated, the results are listed, the effectiveness of the
programs are measured and, finally, a judgment is made to determine whether the
problem has been reduced (Trisco and League, 1978).
The characteristics and the main questions that are answered by each level of
evaluation, in accordance with Bartik and Bingham (1995), are:
a) Monitoring of Daily Activities
This level of assessment simply examines the domestic work of a program,
evaluating issues such as: The contractual obligations are being followed? The daily
activities are being met? The workers are adequately prepared to carry out their tasks?
In other words, the monitoring of activities is an assessment that deals with the
problems of management.
35
b) Evaluation of the Activities of the Program
At this point the characteristics of the activities of the program are identified and
seeks to answer the following questions: What activities are occurring? Who is the
target of the activity (companies, cities, etc), and that the problems or needs? As the
program is being implemented? Could be done more efficiently?
c) Listing of Results
From this level, the levels of evaluation are considered evaluations of results.
The enumeration of results makes it possible to evaluate whether the immediate
objectives of the program are achieved. The typical questions that this level should
answer are: What is the result of each activity described in the evaluation process? What
happened with the target audience? How much they have changed? There were
unexpected results? The objective of the program was achieved?
d) Analysis of Effectiveness
Bari and Bingham (1995) emphasize that only enumerate the results is not
sufficient to assign as impacts of the program changes that have occurred in the period
of existence of this. In this sense, the analysis of effectiveness becomes useful for
verifying that the goals of the program were checked. This analysis attempts to answer
questions such as: what would happen if the program was not implemented? The
program works? Which of the factors that may have contributed to the changes in the
public program? The answers to these questions should be answered by the analysis of
effectiveness through cause and effect relationships established between the program
and the results.
36
e) Analysis of Cost-Benefit
The cost-benefit analysis allows you to determine whether the benefits of the
program outweigh its costs. This review, simply respond to the question of whether the
benefits outweigh the costs of the program, otherwise the program should not be
implemented.
f) Analysis of the Impact on the Problem
This analysis is aimed to answer the following questions: What changes are
evident in the problem? Is that the problem has been reduced, as a result of the
program? The new knowledge has been generated for the society on the problem or the
ways to solve this? In accordance with Bartik and Bingham (1995), it is difficult to
answer these questions, which depart for a further analysis of policy results of program
evaluated.
5.2 – THE PROPOSAL OF EVALUATION
The FCF apply billions every year trying to reach their objectives. The need for
evaluation of these funds is clear. However, because of the many types of loans, the
many types of methodologies for evaluation and the maturation time to observe the
effects of each loan that was granted, it is necessary to build and make continuous and
systematic evaluations.
Therefore, a proposal for continued assessment of policy instruments is detail.
That have the ambition to bring past experiences occasional and not coordinated in a
cycle of systematic evaluation, in which you can compare the results of the evaluations
37
with frequency pre-defined, in order to better inform the decisions of the managers of
regional policy Brazilian.
The methodology of continuous evaluation is a systematic application of
methods of evaluation, in order to verify the economic and social impacts, monitor the
implementation and assess the usefulness of each FCF. Specifically, the methodology of
continuous evaluation involves the use of multiple methods of evaluation for the same
period of time, in order to analyze and improve: planning, monitoring, the effectiveness
and the efficiency of the FCF loans.
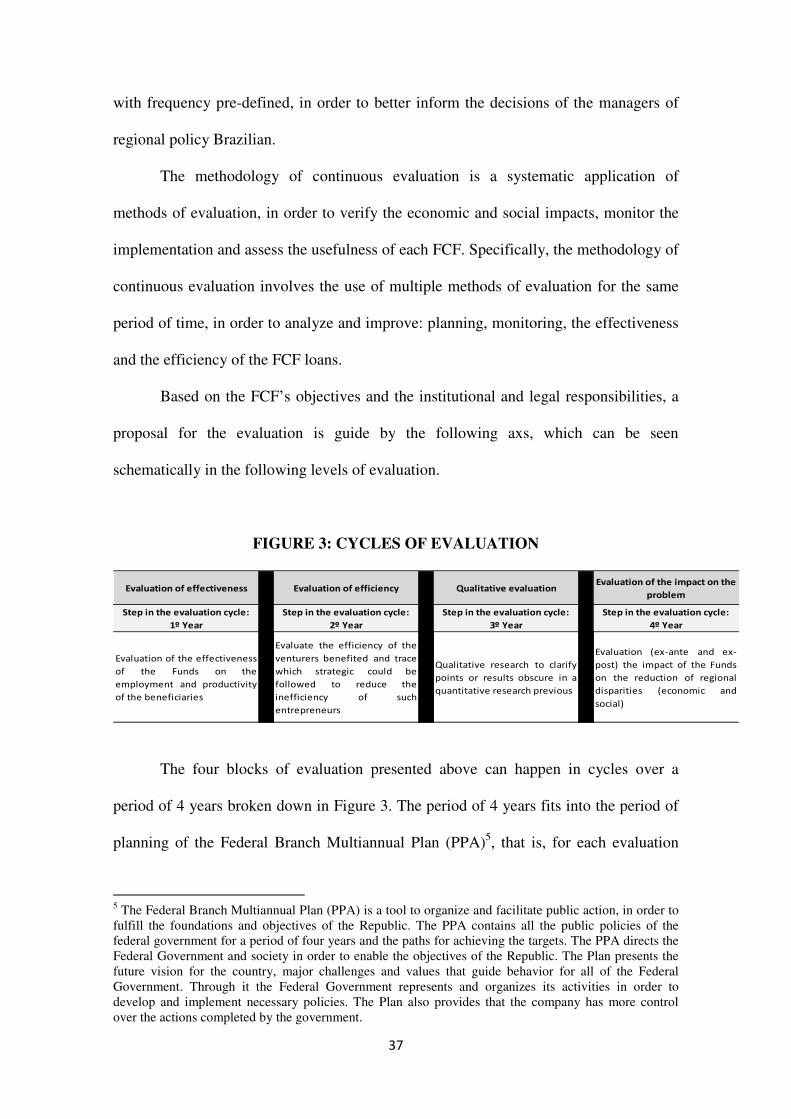
Based on the FCF’s objectives and the institutional and legal responsibilities, a
proposal for the evaluation is guide by the following axs, which can be seen
schematically in the following levels of evaluation.
FIGURE 3: CYCLES OF EVALUATION
Evaluation of effectiveness Evaluation of efficiency Qualitative evaluationEvaluation of the impact on the
problem
Step in the evaluation cycle:
1º Year
Step in the evaluation cycle:
2º Year
Step in the evaluation cycle:
3º Year
Step in the evaluation cycle:
4º Year
Evaluation of the effectiveness
of the Funds on the
employment and productivity
of the beneficiaries
Evaluate the efficiency of the
venturers benefited and trace
which strategic could be
followed to reduce the
inefficiency of such
entrepreneurs
Qualitative research to clarify
points or results obscure in a
quantitative research previous
Evaluation (ex-ante and ex-
post) the impact of the Funds
on the reduction of regional
disparities (economic and
social)
The four blocks of evaluation presented above can happen in cycles over a
period of 4 years broken down in Figure 3. The period of 4 years fits into the period of
planning of the Federal Branch Multiannual Plan (PPA)5, that is, for each evaluation
5 The Federal Branch Multiannual Plan (PPA) is a tool to organize and facilitate public action, in order to fulfill the foundations and objectives of the Republic. The PPA contains all the public policies of the federal government for a period of four years and the paths for achieving the targets. The PPA directs the Federal Government and society in order to enable the objectives of the Republic. The Plan presents the future vision for the country, major challenges and values that guide behavior for all of the Federal Government. Through it the Federal Government represents and organizes its activities in order to develop and implement necessary policies. The Plan also provides that the company has more control over the actions completed by the government.
38
cycle is possible better inform the PPA following. It is worth noting that there is data
available, all instruments can use and follow the same structure of assessment every
year. If for a given instrument the PNDR data does not exist in the format necessary to
carry out the assessments proposed below, will be made a descriptive analysis and
exploratory data available to look for evaluating your performance. In addition, the
proposition of this methodology of continuous evaluation does not prevent other studies
on the PNDR are developed in a complementary manner over the years.
The evaluation process begins in the first year with assessments of effectiveness
by method of "Propensity Score Matching” (PSM). The analysis of effectiveness it is
useful to check if the program goals were achieved at the level of beneficiary
enterprises. This analysis attempts to answer questions such as: what would happen if
the program was not implemented? The program works? The answers to these questions
should be answered by the analysis of effectiveness through cause and effect
relationships established between the program and the results.
In the second year, undertakes an analysis of efficiency through the method
"Data envelopment analysis (DEA). The contribution of this evaluation would define
sectors more strategic - and efficient - regarding the receiving of credit, in addition to
investigating the reasons of higher and lower efficiency of certain enterprises, in order
to correct the inefficiencies.
The following year, a qualitative assessment of the FCF will be carried out by
means of the method of focal group. The qualitative research fits into the context of that
evaluate the policy - and its instruments - only by measuring the volume of resources
used is not clear properly - or even indicates - institutional issues fundamental to the
39
existence of a system for evaluating funds and tax incentives broad and systematic
temporally speaking.
In the fourth year of the cycle, impact assessment is carried out of the
instruments the PNDR on the evolution of regional inequalities by ex ante methods
(interregional models general equilibrium computável) and ex post methods
(econometric regressions with panel data). The order to investigate the impact of the
instruments of the PNDR on the evolution of regional disparities, bearing in mind that
the main objectives of this policy are defined in a macro level - for example, reducing
regional inequalities.
This timeline of implementation is justified for three reasons: (i) the four-year
cycle adheres to the period of the PPA and will give subsidies to the formulators of the
policy both at the end of each year of evaluation as well as at the end of each cycle; (ii)
assessments are complex and require a time for their analyzes are carried out and, for
this reason, it was decided to carry out an assessment in each year; (iii) the order of the
evaluations was defined by the availability of data and the objective to get to the end of
the four-year cycle assessments to understand the same period of time.
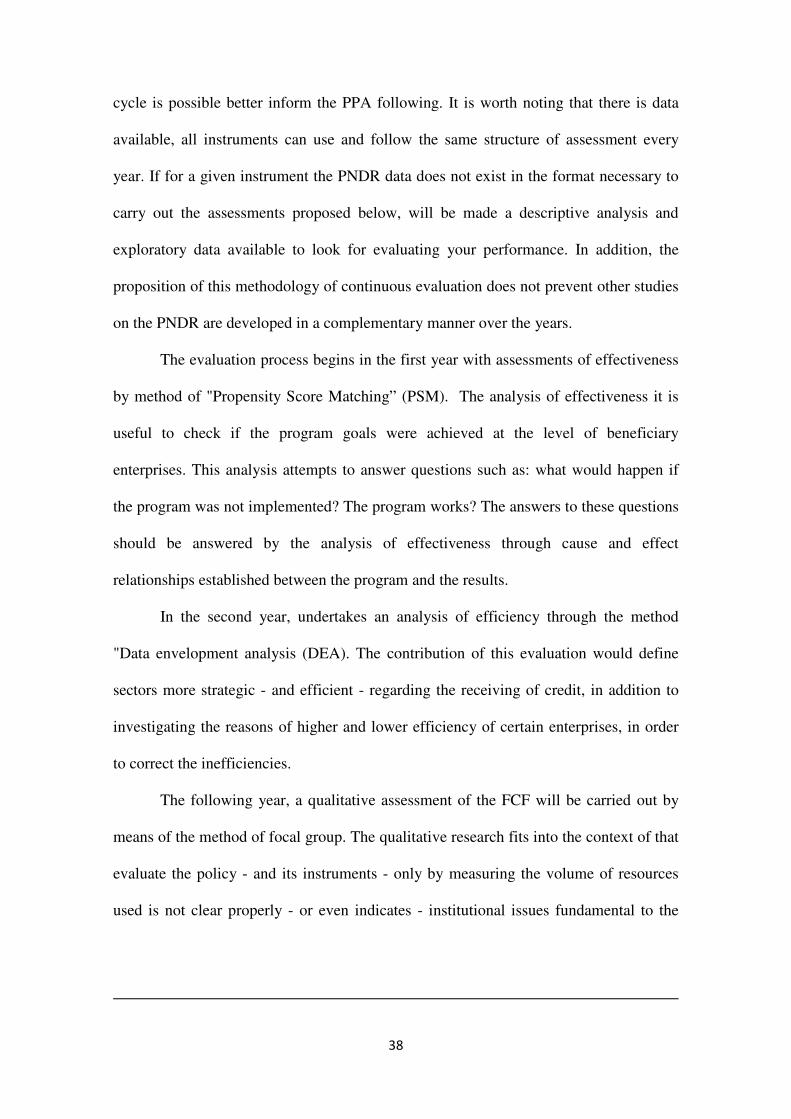
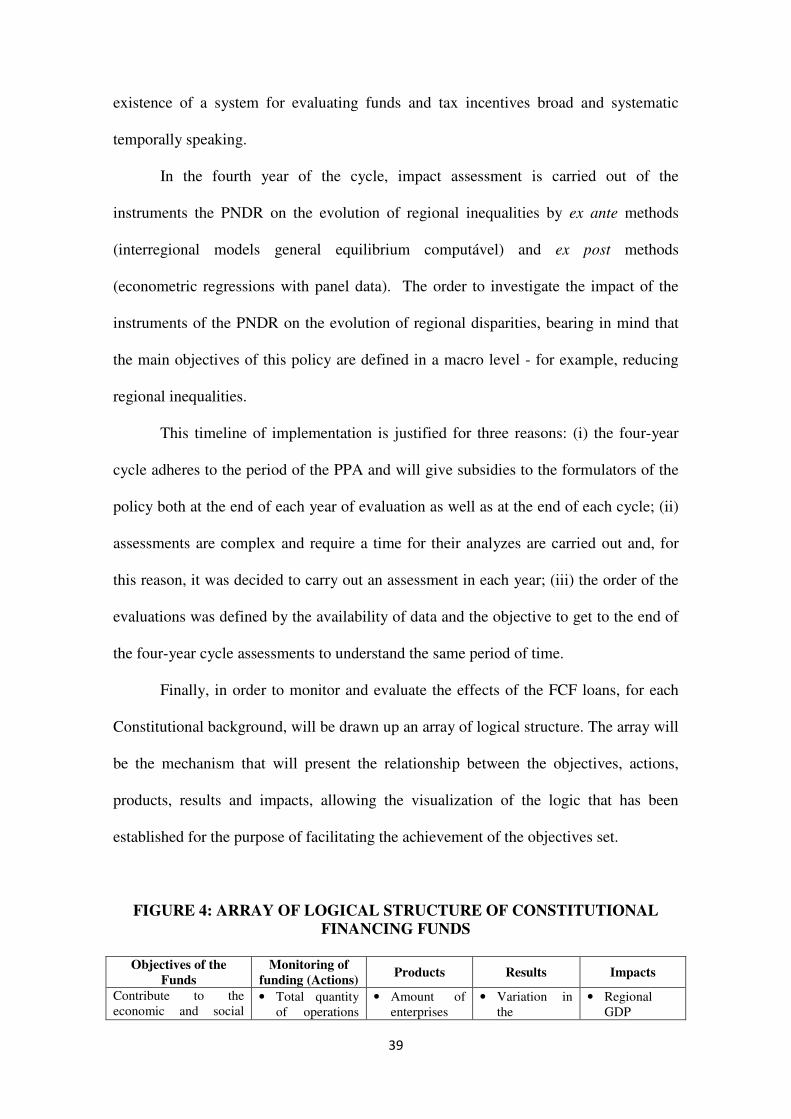
Finally, in order to monitor and evaluate the effects of the FCF loans, for each
Constitutional background, will be drawn up an array of logical structure. The array will
be the mechanism that will present the relationship between the objectives, actions,
products, results and impacts, allowing the visualization of the logic that has been
established for the purpose of facilitating the achievement of the objectives set.
FIGURE 4: ARRAY OF LOGICAL STRUCTURE OF CONSTITUTIONAL
FINANCING FUNDS
Objectives of the
Funds
Monitoring of
funding (Actions) Products Results Impacts
Contribute to the economic and social
• Total quantity of operations
• Amount of enterprises
• Variation in the
• Regional GDP
40
Objectives of the
Funds
Monitoring of
funding (Actions) Products Results Impacts
development of the North, Northeast and Midwest, through the federal financial institutions of regional character, through the implementation of programs of financing productive sectors, in line with the respective regional plans of development.
contracted and values of funding by: UF, sector, program, porte, typology PNDR, priority localities (RIDE, Semi-arid, Border, mesoregions), purpose;
• total quantity of operations contracted and values of funding aimed at diversifying productive;
• total quantity of operations contracted and values of financing for the establishment, expansion, relocation and modernization.
deployed; • Quantity of
enterprises expanded;
• Quantity of ventures modernised;
• the Amount of projects financed kept;
• Quantity of enterprises expanded;
• Increased production activities (CNAE) that are not directly connected with the production of commodities.
production of the enterprises financed;
• Variation in the number of jobs generated in the enterprises financed;
• Variation in billing for projects financed;
• production Variation in activities that are not directly connected with the production of commodities;
• Variation of formal employment not directly related to production of commodities.
variation; • Variation in
production of sectors financed;
• Variation of the offer of employment;
• Variation in the rates of regional inequalities;
• Variation in labor Productivity: VA/SAP.
It is important to record that the matrix presented in this proposal is only an
illustration, are not the final results of the matrix of indicators related to Constitutional
Funds.
To assess the actions, products, the results and the related impacts on the array
of logical structure of Constitutional Funds shall be established a set of indicators that
should characterize simple information that should be communicated and easily
understood; they are realistically measurable; the units of measure are achievable and
are sensitive to changes during the life cycle of the project and able to be assigned to the
project; reflect information that is important for the management of the project and
41
analyzes relating to the project; and your progress should be monitored to a desired
frequency for a period of time.
6 – CONCLUSION
Constitutional Financing Funds of the North, Northeast and Midwest Regions
has been expanding its loans and financing a huge numbers of private firms and farmers
since its creation on 1988 Federal Constitution. In 1995, the total amount of loans
granted by FCF was R$ 2.5 billion. The total amount of loans granted by FCF reached
R$ 23.5 billion in 2013.
They also gained impressive regional economies performance. In each of the
three regions, the total amount of loans accounted for less than 0.6% of the regional
GDP in 1995 (in the North, 0.2% of GDP; in the Northeast, 0.6 %; and in the Midwest,
0.2 %). In 2013 this level has changed and has reached 1.0% of GDP in the North
Region, 2.3% in the Northeast Region and 1.6% in the Midwest Region.
Designed and structured as mechanisms for strengthening regional economies,
the FCF, with 25 years of operation, show characteristics of applications of resources
commensurate - although likely to recast - with the assumptions of reduction of
territorial inequalities. It was found that the distribution per state, as well as the cut-off
capital/pool in each state of the three regions, and it was found that there was low
concentration of resources in its spatial aspect.
Rarely, a single unit of the federation has captured more than 30% of all the
resources of their region in the whole of the period considered (1995-2012). This
situation was found only in Para, with 37.7% of regional resources of FNO, and in
Goias, with 45.6% of the resources of the fund.
42
It seems, therefore, that the concerns related to the application of the resources
of these public sources of financing of economic activity - are closer to sectorial uses of
resources rather than the territorial distribution.
In fact, the data show strong allocation of resources for primary activities
(agriculture and livestock) in three major regions. In the Northeast Region, these
activities captured 44.9% of the total; in the North Region, the fraction used for such
activities was much larger: 82.5%, during this period; and in the Midwest Region, the
participation of these activities in the total use of resources was also high (75.2%).
It is true that there is a trend toward reduction in the concentration of sectoral
applications, at least in the period after 2010. In the Northeast, there is a reduction to
36.6% of the total; in the North, for 75.7%; and in the Midwest, to 55.2%.
However, it is worth asking what the strategic direction of high level of
application of resources in productive sectors of low added value. What are the reasons
for the industrial sector has not received application higher level than this, it is known
that it is in industrial branches that the added value tends to be higher and to expand
more strongly?
The set of resources that the regional policy mobilizes in the country already has
enviable volume, and its trajectory shows no signs of reduction over the coming
decades. The set of Constitutional Funds have R$ 24.3 billion in 2015, and forecast to
reach R$ 31.6 billion, in 2024. During this period that extends from 2015 to 2024, the
cumulative amount will come to R$ 278.02 billion, which represents figure relevant to
be well used by PNDR.
On the basis of this observation, it is equally important that the functions of
planning, implementation, monitoring and evaluation of policies and instruments for
regional policies are prepared to account for the use of this large volume of resources. It

43
is known that there are many problems arising from the application of resources, as well
as their limitations - whether the sector profile, whether the spatial profile of
applications - and that, necessarily, require monitoring and evaluation more qualified
and permanent than the existing one.
44
7 – REFERENCES
ALMEIDA JUNIOR M., RESENDE G. M., SILVA A. M. (2006) Uma análise dos fundos constitucionais de financiamento do Nordeste, Norte e Centro-Oeste. Texto para discussão do IPEA n° 1206, Instituto de Pesquisa Econômica Aplicada - IPEA. ______. (2007) Distribuição espacial dos fundos constitucionais de financiamento do Nordeste, Norte e Centro-Oeste. Revista de economia, Editora UFPR, 33 (2): 115-137. ANGRIST J., PISCHKE J. (2009) Mostly harmless econometrics: an empiricist's
companion. Princeton University Press, London, UK. BACELAR. Por uma política nacional de desenvolvimento regional. Revista econômica do nordeste, v. 30, n. 2, p. 144–161, 1999. BANCO DA AMAZÔNIA – BANK OF AMAZON (2013a). O fundo Constitucional de Financiamento do Norte (FNO) e a dinâmica do Desenvolvimento Regional. In: Série de Estudos e Impactos do FNO 1. Banco da Amazônia S.A., Belém, p. 1-123. ______. (2013b) Indicadores de modernização e impactos dos financiamentos no setor agropecuário na região norte do Brasil. In: Série de Estudos e Impactos do FNO 2. Banco da Amazônia S.A., Belém, p. 1-131. ______. (2013c) Convergência da produtividade da terra e do trabalho no setor agropecuário da Região Norte do Brasil. In: Série de Estudos e Impactos do FNO 3. Banco da Amazônia S.A., Belém, p. 1-83. ______. (2013d) O Fundo Constitucional de Financiamento do Norte (FNO) e a estrutura da economia regional: uma análise de equilíbrio geral. In: Série de Estudos e Impactos do FNO 4. Banco da Amazônia S.A., Belém, p. 1-141. ______. (2013e) Avaliação do FNO sobre empregos e salários 2000-2010. In: Série de Estudos e Impactos do FNO 5. Banco da Amazônia S.A., Belém, p. 1-99. ______. (2013f) Sistema de indicadores de monitoramento e avaliação do Fundo Constitucional de Financiamento do Norte (FNO). In: Série de Estudos e Impactos do FNO 6. Banco da Amazônia S.A., Belém, p. 1-74. ______. (2013g) Efeitos do FNO no desenvolvimento socioeconômico da região norte: Uma analise de eficácia. In: Série de Estudos e Impactos do FNO 7. Banco da Amazônia S.A., Belém, p. 1-228. BANCO DO NORDESTE DO BRASIL – BNB (2009a) Avaliação de Impactos do Fundo Constitucional de Financiamento do Nordeste (FNE): Geração de Empregos: Período 2000-2004. In: Série Avaliação de Políticas e Programas do BNB n. 1. Banco do Nordeste do Brasil, Fortaleza, p. 1-78.
45
______. (2009b) Avaliação de Impactos do Fundo Constitucional de Financiamento do Nordeste (FNE): Geração de Empregos: Período 2000-2005. In: Série Avaliação de Políticas e Programas do BNB n. 2. Banco do Nordeste do Brasil, Fortaleza, p. 1-88. ______. (2009c) Avaliação de Impactos do Fundo Constitucional de Financiamento do Nordeste (FNE): Atividades intensivas em mão-de-obra e rendimentos do trabalho período: 2000-2005. In: Série Avaliação de Políticas e Programas do BNB n. 3. . Banco do Nordeste do Brasil, Fortaleza, p. 1-50. ______. (2009d) Avaliação do Programa de Apoio ao Desenvolvimento da Agroindústria do Nordeste (AGRIN). In: Série Avaliação de Políticas e Programas do BNB n. 4. Banco do Nordeste do Brasil, Fortaleza, p. 1-116. ______. (2009e) Avaliação de Execução do FNE e de Resultados e Impactos do FNE Industrial e do FNE Comércio e Serviços. In: Série Avaliação de Políticas e Programas do BNB n. 5. Banco do Nordeste do Brasil, Fortaleza, p. 1-214. ______. (2009f) Avaliação de Impactos do Fundo Constitucional de Financiamento do Nordeste (FNE): Emprego, Massa Salarial e Salário Médio. In: Série Avaliação de Políticas e Programas do BNB n. 6. Banco do Nordeste do Brasil, Fortaleza, p. 1-132. ______. (2009g) Avaliação de Impactos do Fundo Constitucional de Financiamento do Nordeste (FNE): Geração de Empregos: Período 2000-2006. In: Série Avaliação de Políticas e Programas do BNB n. 7. Banco do Nordeste do Brasil, Fortaleza, p. 1-108. ______. (2010a) Avaliação do Pronaf B no Banco do Nordeste do Brasil S.A.. In: Série Avaliação de Políticas e Programas do BNB n. 8. Banco do Nordeste do Brasil, Fortaleza, p. 1-98. ______. (2010b) Metodologia para avaliação do Fundo Constitucional de Financiamento do Nordeste (FNE) In: Série Avaliação de Políticas e Programas do BNB n. 9. Banco do Nordeste do Brasil, Fortaleza, p. 1-100. (2010c) Avaliação da execução, resultados e impactos do FNE PROATUR. In: Série Avaliação de Políticas e Programas do BNB n. 10. Banco do Nordeste do Brasil, Fortaleza, p. 1-140. ______. (2010d) Fundo Constitucional de Financiamento do Nordeste (FNE): relatório de resultados e impactos 2009. Banco do Nordeste do Brasil, Fortaleza, p. 1-250. ______. (2011) Fundo Constitucional de Financiamento do Nordeste (FNE): relatório de resultados e impactos 2010. Banco do Nordeste do Brasil, Fortaleza, p. 1-239. ______. (2012) Fundo Constitucional de Financiamento do Nordeste (FNE): relatório de resultados e impactos 2011. Banco do Nordeste do Brasil, Fortaleza, p. 1-223. ______. (2013) Fundo Constitucional de Financiamento do Nordeste – FNE 2013 – Programação Regional. Banco do Nordeste, Fortaleza, p. 1-119.
46
______. (2014) Avaliação de impacto e eficiência das empresas beneficiadas pelo FNE: Geração de emprego, massa salarial e salario médio 2000-2008. In: Série Avaliação de Políticas e Programas do BNB n. 13. Banco do Nordeste do Brasil, Fortaleza, p. 1-105. BARTIK, T., BINGHAM, R. (1995) Can economic development programs be
evaluated? Staff Working Papers 95-29, W.E. Upjohn Institute for Employment Research. BEHRENS, K., THISSE, J. F. (2007) Regional economics: A new economic geography perspective. Regional Science and Urban Economics, 37: 457–465. BORGES, A.H; PINHO, J; AZEVEDO, J.P; NEWMAN, J; WENCESLAU, J; JOPPERT, M; CARVALHO, S (2011). A Rede Brasileira de Monitoramento e Avaliação: um relato do processo de sua criação e desenvolvimento. Revista Brasileira
de Monitoramento e Avaliação 1, Janeiro-Junho de 2011. CANº Desconcentração produtiva regional do Brasil: 1970-2005. 1a. ed ed. São Paulo: Editora UNESP, 2008. DECRETO nº 6047 (2007) Política Nacional de Desenvolvimento Regional – PNDR
(disponível em: http:// www.planalto.gov.br/ccivil_03/Ato2007-2010/2007/Decreto/ D6047.htm). FOCHEZATTO, A. Modelos de Equilíbrio Geral Aplicados na Análise de Políticas Ficais: Uma revisão da Literatura. Análise, Porto Alegre, v. 16, 2005. FURTADO. Essencial Celso Furtado. 1o. ed. São Paulo: Penguin Classics Companhia das Letras, 2013. GALEANO, E. A. V. ; FEIJÓ, C (2012) Crédito e Crescimento Econômico: Evidências a partir de um painel de dados regionais para a economia brasileira. Revista Econômica
do Nordeste, 43: 201-219. GERTLER, P; MARTINEZ, S; PREMAND, P; RAWLINGS, L; VERMEERSCH, C (2011). Impact Evaluation in Practice, World Bank. IBGE (2012) Sistema de contas regionais referência 2010 – Produto interno bruto dos
municípios 1999-2010 (available at: http://www.sidra.ibge.gov.br/bda/ pesquisas/PIBMun/default.asp). IPEADATA. Dados macroeconômicos e regionais (available at: http://www. ipeadata.gov.br). KHANDKER, S. R.; KOOLWAL, G. B.; SAMAD, H. A. (2010) Handbook on Impact
Evaluation: Quantitative Methods and Practices. The World Bank: Washington DC. LEI Nº 7827 (1989) (disponível em: http://www.planalto.gov.br/ccivil_03/Leis/L7827. htm).
47
LESAGE, J.P.; PACE, R.K. Introduction to spatial econometrics. Boca Raton, US: CRC Press Taylor & Francis Group, 2009. MACEDO, C. M.; MATTOS, E. N. O papel dos fundos constitucionais de financiamento nodesenvolvimento regional brasileiro. Ensaios FEE, v. 29, n. 2, p. 355-384, 2008. MENON, C. (2012) The bright side of MAUP: Defining new measures of industrial agglomeration. Papers in Regional Science, 91(1): 3-28. MINISTÉRIO DA INTEGRAÇÃO NACIONAL – MI (2010) Relatório de Gestão 2010: FDA e FDNE. (Disponível em: http://www.integracao.gov.br/c/document_library) ______. (2013a). FNO: Relatório anual - Exercicio 2012. (Disponível em: http://www.integracao.gov.br/c/document_library) ______. (2013b) FNE: Relatório anual - Exercicio 2012. (Disponível em: http://www.integracao.gov.br/c/document_library) ______. (2013c) FINAM e FINOR: Relatório anual - Exercicio 2012. (Disponível em: http://www.integracao.gov.br/c/document_library) MONTEIRO NETO. Desenvolvimento regional em crise: políticas econômicas liberais e restrições à intervenção estatal no Brasil dos anos 90. [s.l.] Universidade Estadual de Campinas, 2005. OLIVEIRA, H. C.; DOMINGUES, E. P. (2005) Considerações sobre o impacto dos Fundos Constitucionais de Financiamento do Norte e do Centro-Oeste na redução da desigualdade regional no Brasil. In: ENCONTRO NACIONAL DE ECONOMIA, 33, 2005, Natal, Rio Grande do Norte. Anais eletrônicos... Natal, ANPEC. RESENDE, G. M. (2014a) Avaliação dos impactos econômicos do Fundo Constitucional de Financiamento do Nordeste entre 2004 e 2010. Texto para discussão do IPEA n° 1918, Instituto de Pesquisa Econômica Aplicada - IPEA. RESENDE, G. M. (2014b) Avaliação dos impactos regionais do Fundo Constitucional de Financiamento do Norte entre 2004 e 2010. Texto para discussão do IPEA n° 1973, Instituto de Pesquisa Econômica Aplicada - IPEA. RESENDE, G. M., CRAVO, T.A., PIRES, M.J.S. (2014) Avaliação dos impactos econômicos do Fundo Constitucional de Financiamento do Centro-Oeste Norte entre 2004 e 2010. Texto para discussão do IPEA n° 1969, Instituto de Pesquisa Econômica Aplicada - IPEA. ROSENBAUM, P.; RUBIN, D. The central role of the propensity score in observa- tional studies for causal effects. Biometrika, v. 70, p. 41-55, 1983.

48
SILVA A. M.; RESENDE G. M.; SILVEIRA NETO R. (2006) Avaliação Econômica dos fundos constitucionais de financiamento do Nordeste e Norte. Texto para discussão do IPEA n° 1207, Instituto de Pesquisa Econômica Aplicada - IPEA. ______. (2007a) Eficácia do gasto público: Uma avaliação do FNE, FNO e FCO. Texto para discussão do IPEA n° 1259, Instituto de Pesquisa Econômica Aplicada - IPEA. ______. (2007b) Uma Avaliação da Eficácia do FNE, no período 1995-2000. Análise Econômica (UFRGS), 25: 233-261. ______. (2009) Eficácia do gasto público: uma avaliação do FNE, FNO e FCO. Estudos econômicos, 39 (1): 89-125.
49
APPENDIX I - TASKS OF THE MINISTRY OF NATIONAL INTEGRATION
The Ministry of National Integration (MI), according to Law nº 10,683, of May 28,
2003, has its current structure procedure approved by Decree nº. 8,161 of December 18,
2013, which established the following competencies for the institution:
a) formulate and conduct the National Policy for Regional Development - PNDR;
b) formulate regional development plans and programs;
c) establishment of strategies for the integration of regional economies;
d) establishment of guidelines and priorities in the application of the resources of
Constitutional Financing Funds;
e) establishment of guidelines and priorities in the application of the resources of
the Fund for the Development of the Amazon Region and the Fund for
Development of the Northeast;
f) establishment of standards for compliance with the funding programs of
Constitutional Funds and budgetary schedules of regional investment funds;
g) monitoring and evaluation of integrated programs of national development;
h) civil defense;
i) works against droughts and water infrastructure;
j) formulate and conduct of national policy of irrigation;
k) territorial organization; and
l) public works in bands of borders.
To exercise the responsibilities listed above, the MI, in addition to the Executive
Secretariat, responsible for administrative actions of component, has five other
secretariats. The functions of the secretariat are described below:
50
1) National Secretariat of Protection and Civil Defense (SEDEC)
Protection and Civil Defense in Brazil is organised in the form of system, called
National System of Protection and Civil Defense (SINPDEC), composed of several
components.
The Secretariat is the central organ of this System, which is responsible for
coordinating the actions of protection and civil defense throughout the national territory.
The actions of protection and civil defense has the objective to reduce the risk of
disaster and includes actions of prevention, mitigation, preparedness, response and
recovery, and is multisectoral and at all three levels of government federal, state and
municipal - with broad participation of the community.
2) Secretariat of Regional Development (SDR)
Promote development of the border region, support for the structuring of local
productive arrangements in the less developed regions, prepare regional plans of
development, organization of the National Regional Development Award, the
construction of the center for regional development and the preparation of events such
as the National Conference on Regional Development.
In the context of the Plan Brazil Without Misery, the Department of Regional
Development coordinates the program Water for All, effectively contributing to the
eradication of extreme poverty and the reduction of regional inequalities in Brazil.
51
3) Secretariat of Water Infrastructure (SIH)
The Secretariat, in line with the objectives of the PNDR, works for the construction
of water supply - dams, pipelines and channels - and works of drainage, which serve for
the conduct of water abstracted in the streets, gutters and galleries. The objective of
these actions is to ensure better health and comfort for the population, encouraging the
creation of jobs, increase the income of the population and contribute to the reduction of
regional inequalities.
4) National Secretariat of Irrigation (SENIR)
SENIR has as main goal set up a management system for irrigated agriculture,
articulating the various components that interact in the sector, particularly by supporting
the private initiative and optimizing the public areas as instruments of development of
less favored regions. In addition, promote the irrigation as a means of efficiency in
agricultural production and eradicate poverty with the generation of employment and
income.
5) Secretariat of Regional Funds and Tax Incentives (SFRI)
Was created in 2011 with the restructuring of the Ministry of National Integration. It
arose from the need to standardize procedures, criteria and priorities in the application
of the resources of the Regional Funds and Tax Incentives, update the existing financing
instruments, exploring for new sources of resources and opportunities for reducing
52
regional inequalities. Still, has as mission making new tools to support the productive
sectors and the promotion of projects of interest to the regional development, in line
with the strategic objectives of the Ministry.
Currently, the SFRI is responsible for administering, together with other institutions,
the resources of Constitutional Financing Funds the North Region (FNO) from the
Northeast Region (FNE) and Midwest Region (FCO), the Funds for Development of the
Amazon (FDA), the Northeast Region (FNE) and Midwest Region (FDCO), of Tax
Incentives and Investment Funds of the Amazon (FINAM) and North Region (FINOR).
53
APPENDIX II - NATIONAL POLICY FOR REGIONAL DEVELOPMENT
The National Policy for Regional Development (PNDR) is an expression of the
effective priority of the theme and is being implemented in order to achieve effective
results in regional issue. The PNDR has the dual purpose of reducing regional
inequalities and to enable the development potential of the Brazilian regions, exploring
the vast and fantastic diversity observed in this country of continental dimensions. The
focus of concern focuses, therefore, on the dynamization of the regions and the better
distribution of productive activities in the territory.
In this direction, the PNDR offers to Brazilian society a way to facilitate their active
engagement in the development and conduct of regional projects of development,
involving the federated entities, the socially relevant forces and the productive sectors.
The PNDR organizes a look over the whole of the territory of the Country, allowing the
actions and the programs implemented are regulated from a referential common
national, capable of producing the desired effect in reducing regional inequalities.
Created in 2007, the PNDR comprises of development strategies in scales 1995-
2005 (priority to the North, Northeast and Midwest) and sub-regional (in addition to
spaces traditionally priority, such as the semi-arid and the border strip, includes a
mapping of the whole national territory, depending on the degree of their development
and dynamism).
This mapping was prepared from the crossing of two variables: household income
and average growth of per capita GDP, generating the typology of the PNDR, with
microregions classified as:
a) High Income: high household income per capita, regardless of dynamism
observed;

54
b) Dynamic: middle and lower income, but with economic dynamics significant;
c) Stagnant: income average household, but with low economic growth;
d) Low Income: low household income and low dynamism.
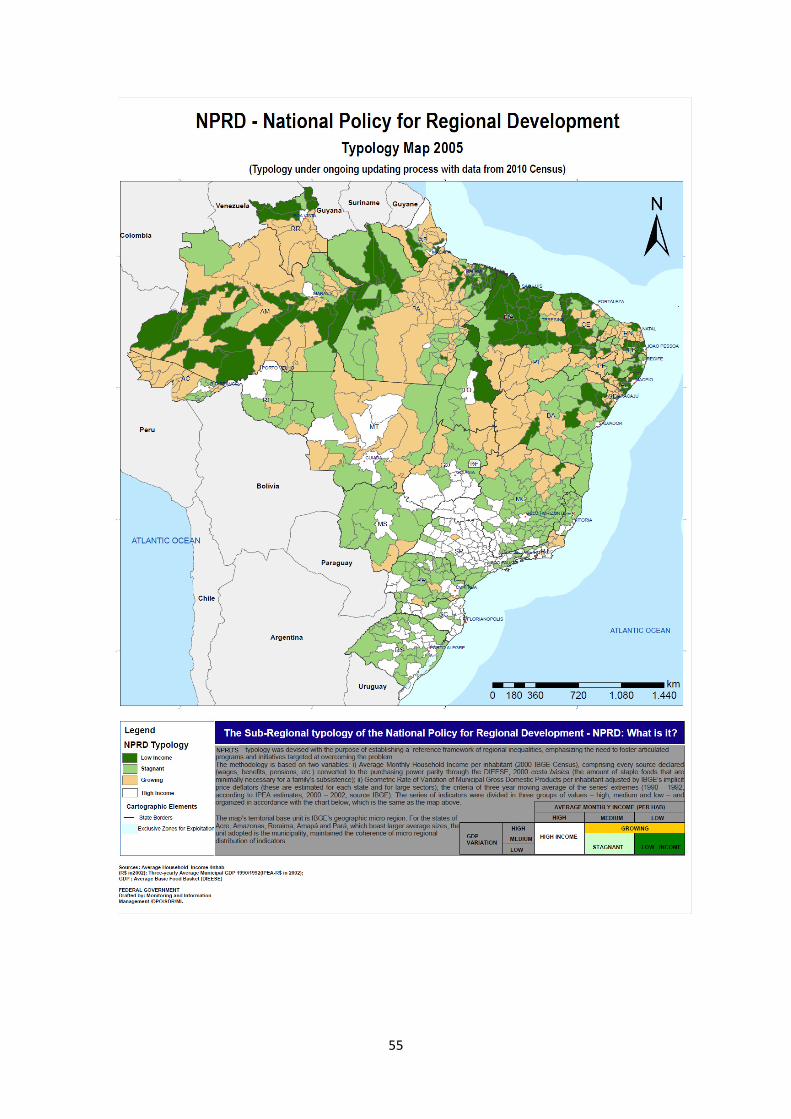
55
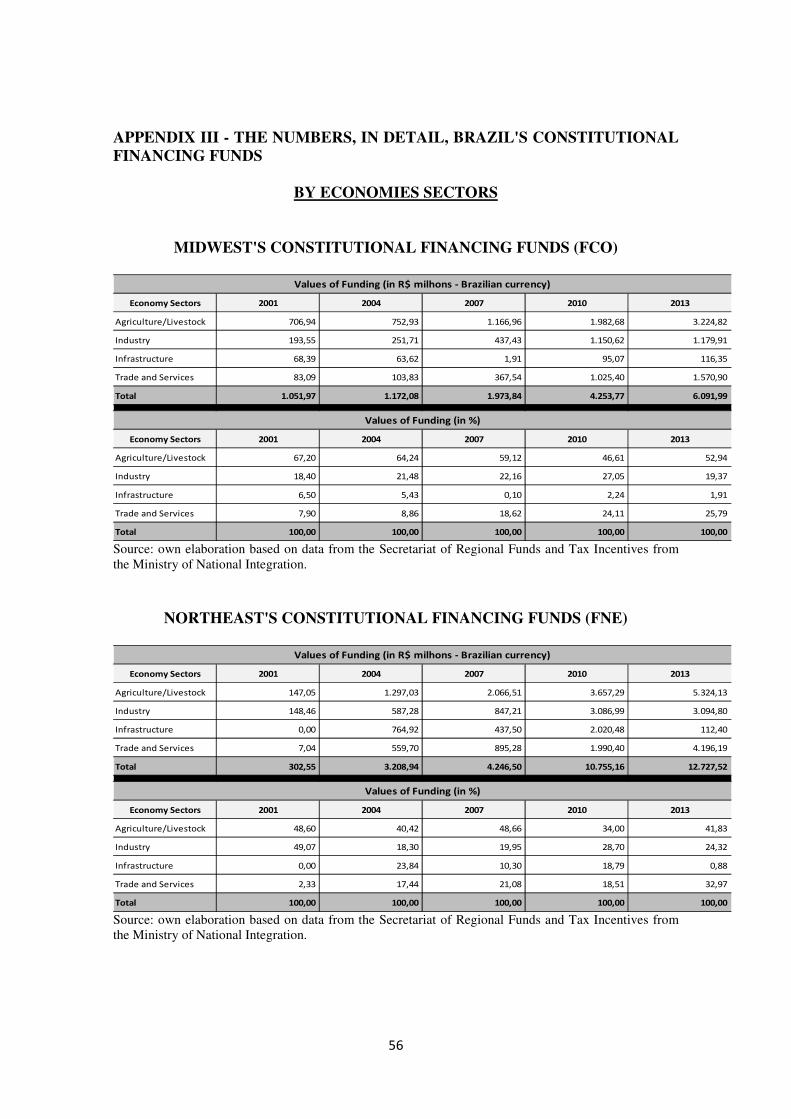
56
APPENDIX III - THE NUMBERS, IN DETAIL, BRAZIL'S CONSTITUTIONAL
FINANCING FUNDS
BY ECONOMIES SECTORS
MIDWEST'S CONSTITUTIONAL FINANCING FUNDS (FCO)
Economy Sectors 2001 2004 2007 2010 2013
Agriculture/Livestock 706,94 752,93 1.166,96 1.982,68 3.224,82
Industry 193,55 251,71 437,43 1.150,62 1.179,91
Infrastructure 68,39 63,62 1,91 95,07 116,35
Trade and Services 83,09 103,83 367,54 1.025,40 1.570,90
Total 1.051,97 1.172,08 1.973,84 4.253,77 6.091,99
Economy Sectors 2001 2004 2007 2010 2013
Agriculture/Livestock 67,20 64,24 59,12 46,61 52,94
Industry 18,40 21,48 22,16 27,05 19,37
Infrastructure 6,50 5,43 0,10 2,24 1,91
Trade and Services 7,90 8,86 18,62 24,11 25,79
Total 100,00 100,00 100,00 100,00 100,00
Values of Funding (in R$ milhons - Brazilian currency)
Values of Funding (in %)
Source: own elaboration based on data from the Secretariat of Regional Funds and Tax Incentives from the Ministry of National Integration.
NORTHEAST'S CONSTITUTIONAL FINANCING FUNDS (FNE)
Economy Sectors 2001 2004 2007 2010 2013
Agriculture/Livestock 147,05 1.297,03 2.066,51 3.657,29 5.324,13
Industry 148,46 587,28 847,21 3.086,99 3.094,80
Infrastructure 0,00 764,92 437,50 2.020,48 112,40
Trade and Services 7,04 559,70 895,28 1.990,40 4.196,19
Total 302,55 3.208,94 4.246,50 10.755,16 12.727,52
Economy Sectors 2001 2004 2007 2010 2013
Agriculture/Livestock 48,60 40,42 48,66 34,00 41,83
Industry 49,07 18,30 19,95 28,70 24,32
Infrastructure 0,00 23,84 10,30 18,79 0,88
Trade and Services 2,33 17,44 21,08 18,51 32,97
Total 100,00 100,00 100,00 100,00 100,00
Values of Funding (in %)
Values of Funding (in R$ milhons - Brazilian currency)
Source: own elaboration based on data from the Secretariat of Regional Funds and Tax Incentives from the Ministry of National Integration.
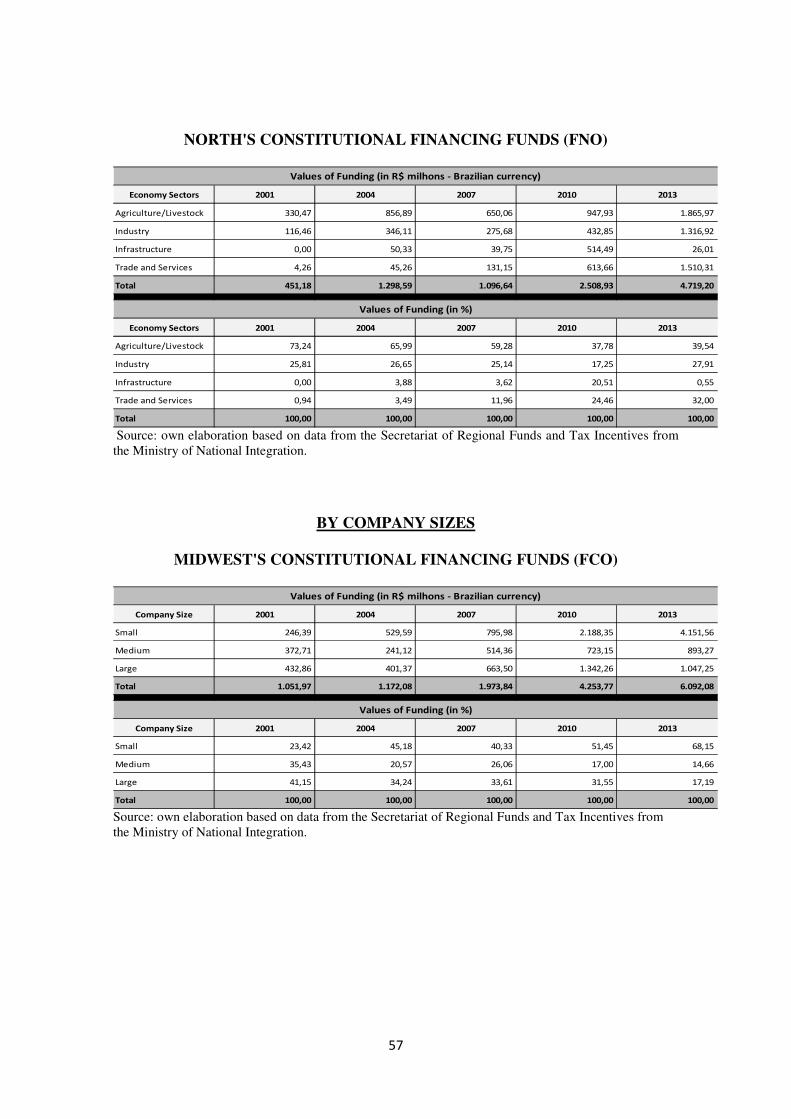
57
NORTH'S CONSTITUTIONAL FINANCING FUNDS (FNO)
Economy Sectors 2001 2004 2007 2010 2013
Agriculture/Livestock 330,47 856,89 650,06 947,93 1.865,97
Industry 116,46 346,11 275,68 432,85 1.316,92
Infrastructure 0,00 50,33 39,75 514,49 26,01
Trade and Services 4,26 45,26 131,15 613,66 1.510,31
Total 451,18 1.298,59 1.096,64 2.508,93 4.719,20
Economy Sectors 2001 2004 2007 2010 2013
Agriculture/Livestock 73,24 65,99 59,28 37,78 39,54
Industry 25,81 26,65 25,14 17,25 27,91
Infrastructure 0,00 3,88 3,62 20,51 0,55
Trade and Services 0,94 3,49 11,96 24,46 32,00
Total 100,00 100,00 100,00 100,00 100,00
Values of Funding (in R$ milhons - Brazilian currency)
Values of Funding (in %)
Source: own elaboration based on data from the Secretariat of Regional Funds and Tax Incentives from the Ministry of National Integration.
BY COMPANY SIZES
MIDWEST'S CONSTITUTIONAL FINANCING FUNDS (FCO)
Company Size 2001 2004 2007 2010 2013
Small 246,39 529,59 795,98 2.188,35 4.151,56
Medium 372,71 241,12 514,36 723,15 893,27
Large 432,86 401,37 663,50 1.342,26 1.047,25
Total 1.051,97 1.172,08 1.973,84 4.253,77 6.092,08
Company Size 2001 2004 2007 2010 2013
Small 23,42 45,18 40,33 51,45 68,15
Medium 35,43 20,57 26,06 17,00 14,66
Large 41,15 34,24 33,61 31,55 17,19
Total 100,00 100,00 100,00 100,00 100,00
Values of Funding (in %)
Values of Funding (in R$ milhons - Brazilian currency)
Source: own elaboration based on data from the Secretariat of Regional Funds and Tax Incentives from the Ministry of National Integration.
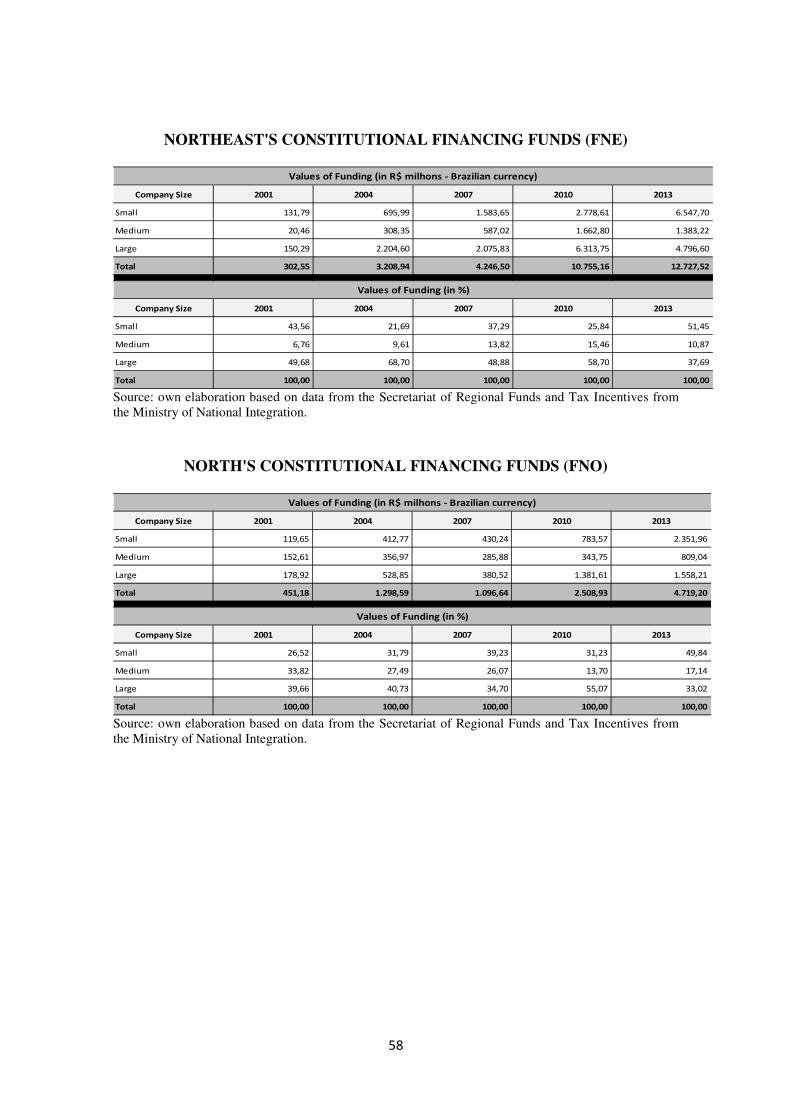
58
NORTHEAST'S CONSTITUTIONAL FINANCING FUNDS (FNE)
Company Size 2001 2004 2007 2010 2013
Small 131,79 695,99 1.583,65 2.778,61 6.547,70
Medium 20,46 308,35 587,02 1.662,80 1.383,22
Large 150,29 2.204,60 2.075,83 6.313,75 4.796,60
Total 302,55 3.208,94 4.246,50 10.755,16 12.727,52
Company Size 2001 2004 2007 2010 2013
Small 43,56 21,69 37,29 25,84 51,45
Medium 6,76 9,61 13,82 15,46 10,87
Large 49,68 68,70 48,88 58,70 37,69
Total 100,00 100,00 100,00 100,00 100,00
Values of Funding (in R$ milhons - Brazilian currency)
Values of Funding (in %)
Source: own elaboration based on data from the Secretariat of Regional Funds and Tax Incentives from the Ministry of National Integration.
NORTH'S CONSTITUTIONAL FINANCING FUNDS (FNO)
Company Size 2001 2004 2007 2010 2013
Small 119,65 412,77 430,24 783,57 2.351,96
Medium 152,61 356,97 285,88 343,75 809,04
Large 178,92 528,85 380,52 1.381,61 1.558,21
Total 451,18 1.298,59 1.096,64 2.508,93 4.719,20
Company Size 2001 2004 2007 2010 2013
Small 26,52 31,79 39,23 31,23 49,84
Medium 33,82 27,49 26,07 13,70 17,14
Large 39,66 40,73 34,70 55,07 33,02
Total 100,00 100,00 100,00 100,00 100,00
Values of Funding (in %)
Values of Funding (in R$ milhons - Brazilian currency)
Source: own elaboration based on data from the Secretariat of Regional Funds and Tax Incentives from the Ministry of National Integration.
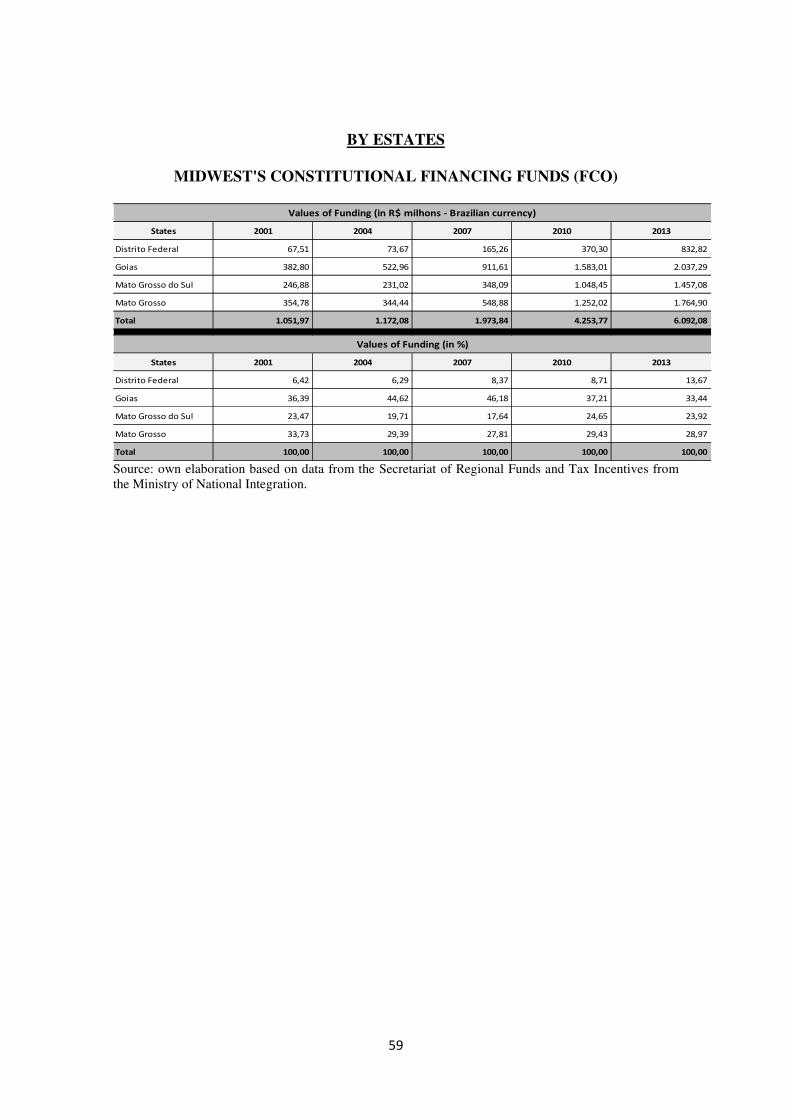
59
BY ESTATES
MIDWEST'S CONSTITUTIONAL FINANCING FUNDS (FCO)
States 2001 2004 2007 2010 2013
Distrito Federal 67,51 73,67 165,26 370,30 832,82
Goias 382,80 522,96 911,61 1.583,01 2.037,29
Mato Grosso do Sul 246,88 231,02 348,09 1.048,45 1.457,08
Mato Grosso 354,78 344,44 548,88 1.252,02 1.764,90
Total 1.051,97 1.172,08 1.973,84 4.253,77 6.092,08
States 2001 2004 2007 2010 2013
Distrito Federal 6,42 6,29 8,37 8,71 13,67
Goias 36,39 44,62 46,18 37,21 33,44
Mato Grosso do Sul 23,47 19,71 17,64 24,65 23,92
Mato Grosso 33,73 29,39 27,81 29,43 28,97
Total 100,00 100,00 100,00 100,00 100,00
Values of Funding (in R$ milhons - Brazilian currency)
Values of Funding (in %)
Source: own elaboration based on data from the Secretariat of Regional Funds and Tax Incentives from the Ministry of National Integration.
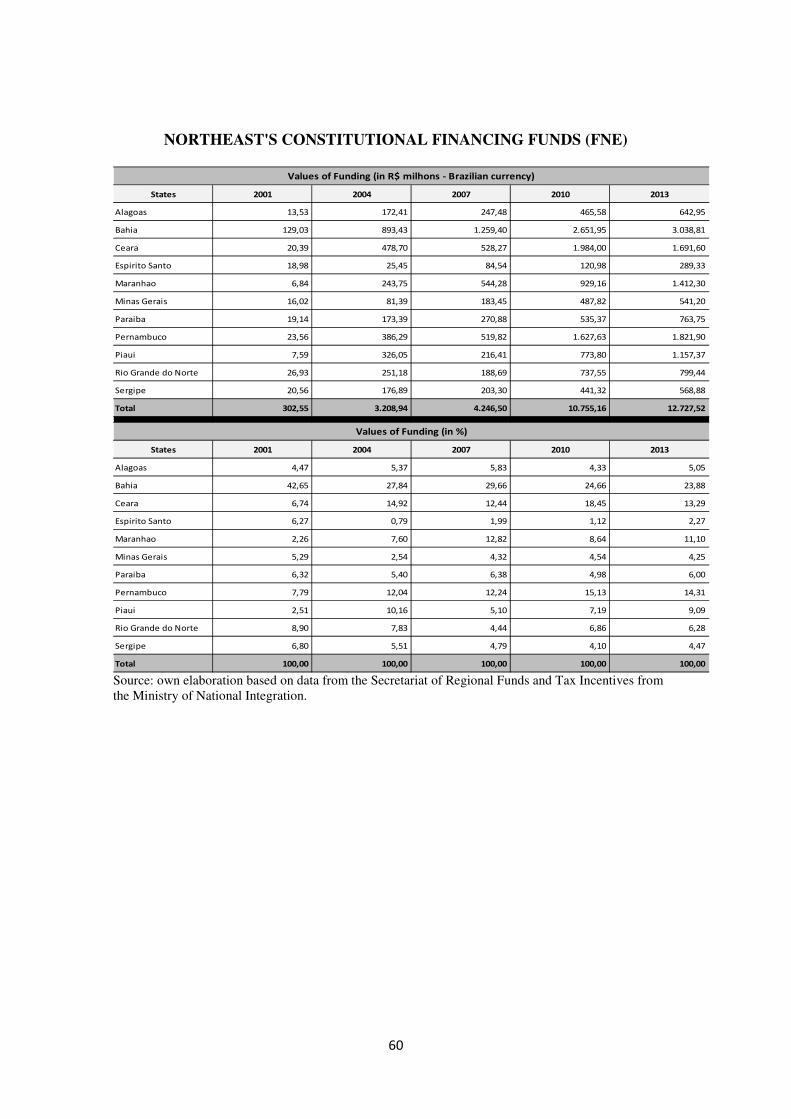
60
NORTHEAST'S CONSTITUTIONAL FINANCING FUNDS (FNE)
States 2001 2004 2007 2010 2013
Alagoas 13,53 172,41 247,48 465,58 642,95
Bahia 129,03 893,43 1.259,40 2.651,95 3.038,81
Ceara 20,39 478,70 528,27 1.984,00 1.691,60
Espirito Santo 18,98 25,45 84,54 120,98 289,33
Maranhao 6,84 243,75 544,28 929,16 1.412,30
Minas Gerais 16,02 81,39 183,45 487,82 541,20
Paraiba 19,14 173,39 270,88 535,37 763,75
Pernambuco 23,56 386,29 519,82 1.627,63 1.821,90
Piaui 7,59 326,05 216,41 773,80 1.157,37
Rio Grande do Norte 26,93 251,18 188,69 737,55 799,44
Sergipe 20,56 176,89 203,30 441,32 568,88
Total 302,55 3.208,94 4.246,50 10.755,16 12.727,52
States 2001 2004 2007 2010 2013
Alagoas 4,47 5,37 5,83 4,33 5,05
Bahia 42,65 27,84 29,66 24,66 23,88
Ceara 6,74 14,92 12,44 18,45 13,29
Espirito Santo 6,27 0,79 1,99 1,12 2,27
Maranhao 2,26 7,60 12,82 8,64 11,10
Minas Gerais 5,29 2,54 4,32 4,54 4,25
Paraiba 6,32 5,40 6,38 4,98 6,00
Pernambuco 7,79 12,04 12,24 15,13 14,31
Piaui 2,51 10,16 5,10 7,19 9,09
Rio Grande do Norte 8,90 7,83 4,44 6,86 6,28
Sergipe 6,80 5,51 4,79 4,10 4,47
Total 100,00 100,00 100,00 100,00 100,00
Values of Funding (in R$ milhons - Brazilian currency)
Values of Funding (in %)
Source: own elaboration based on data from the Secretariat of Regional Funds and Tax Incentives from the Ministry of National Integration.
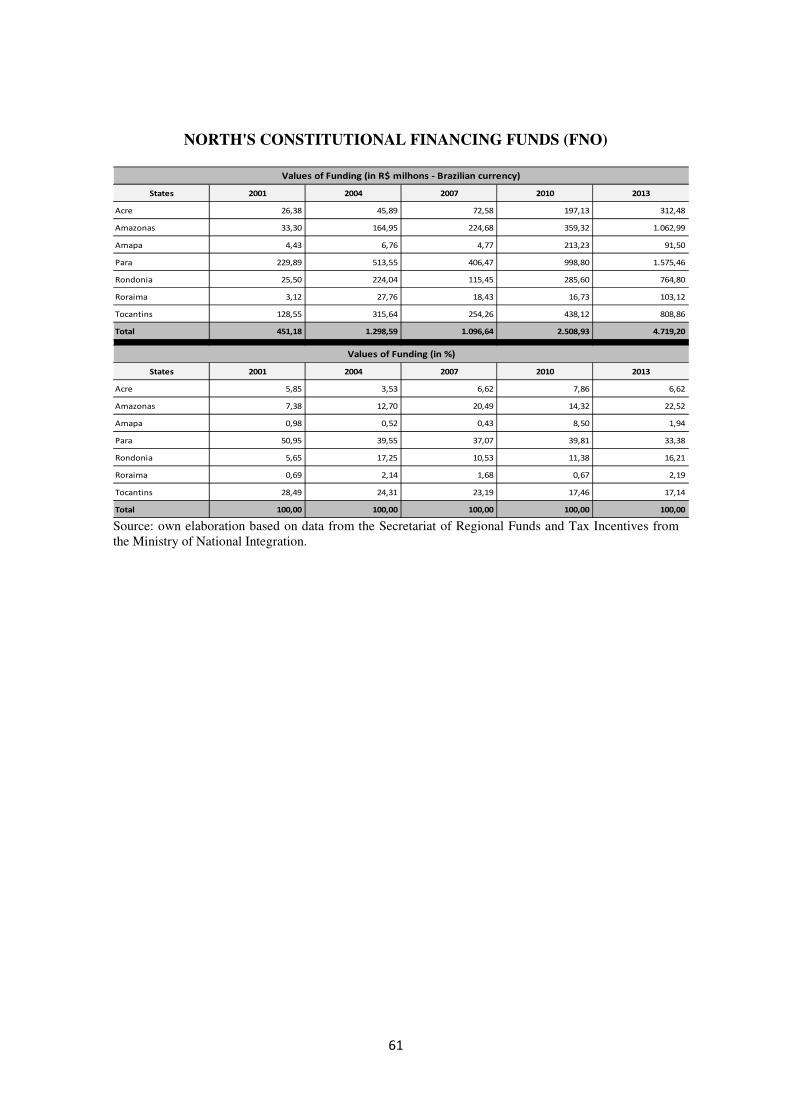
61
NORTH'S CONSTITUTIONAL FINANCING FUNDS (FNO)
States 2001 2004 2007 2010 2013
Acre 26,38 45,89 72,58 197,13 312,48
Amazonas 33,30 164,95 224,68 359,32 1.062,99
Amapa 4,43 6,76 4,77 213,23 91,50
Para 229,89 513,55 406,47 998,80 1.575,46
Rondonia 25,50 224,04 115,45 285,60 764,80
Roraima 3,12 27,76 18,43 16,73 103,12
Tocantins 128,55 315,64 254,26 438,12 808,86
Total 451,18 1.298,59 1.096,64 2.508,93 4.719,20
States 2001 2004 2007 2010 2013
Acre 5,85 3,53 6,62 7,86 6,62
Amazonas 7,38 12,70 20,49 14,32 22,52
Amapa 0,98 0,52 0,43 8,50 1,94
Para 50,95 39,55 37,07 39,81 33,38
Rondonia 5,65 17,25 10,53 11,38 16,21
Roraima 0,69 2,14 1,68 0,67 2,19
Tocantins 28,49 24,31 23,19 17,46 17,14
Total 100,00 100,00 100,00 100,00 100,00
Values of Funding (in R$ milhons - Brazilian currency)
Values of Funding (in %)
Source: own elaboration based on data from the Secretariat of Regional Funds and Tax Incentives from the Ministry of National Integration.