brca1 185delag mutant protein, brat, amplifies caspase
TRANSCRIPT
University of South FloridaScholar Commons
Graduate Theses and Dissertations Graduate School
2008
BRCA1 185delAG mutant protein, BRAt, amplifiescaspase-mediated apoptosis and maspin expressionin ovarian cellsJoshua D. O'DonnellUniversity of South Florida
Follow this and additional works at: http://scholarcommons.usf.edu/etd
Part of the American Studies Commons
This Dissertation is brought to you for free and open access by the Graduate School at Scholar Commons. It has been accepted for inclusion inGraduate Theses and Dissertations by an authorized administrator of Scholar Commons. For more information, please [email protected].
Scholar Commons CitationO'Donnell, Joshua D., "BRCA1 185delAG mutant protein, BRAt, amplifies caspase-mediated apoptosis and maspin expression inovarian cells" (2008). Graduate Theses and Dissertations.http://scholarcommons.usf.edu/etd/433
BRCA1 185delAG Mutant Protein, BRAt, Amplifies Caspase-Mediated Apoptosis and
Maspin Expression in Ovarian Cells
by
Joshua D. O’Donnell
A dissertation submitted in partial fulfillment of the requirements for the degree of
Doctor of Philosophy Department of Pathology and Cell Biology
College of Medicine University of South Florida
Major Professor: Patricia A. Kruk, Ph.D. Jin Q. Cheng, M.D., Ph.D.
Santo V. Nicosia, M.D. Alvaro Monteiro, Ph.D. Rebecca Sutphen, M.D.
Date of Approval: April 4, 2008
Keywords: ovarian cancer, chemotherapy, programmed cell death, Akt, caspase 3
© Copyright 2008, Joshua D. O’Donnell

I would like to dedicate this dissertation to my parents, David and Joanne
O’Donnell of Maryville, Missouri. Without their loving support and encouragement I
would not be where I am today and for that I am grateful. Additionally, I would like to
dedicate this dissertation to my friend and former coworker/office mate Dr. Stephen
Tebes. Dr. Tebes was the most inspirational human being I have ever had the pleasure to
know. He was an incredibly compassionate, dedicated, and talented gynecologic
oncologist who used his personal experiences as a cancer patient to give his own patients
unique and insightful advice and care that only another cancer patient could give. Steve’s
attitude and demeanor, even in his darkest hour, were incredible as he stood tall with a
smile on his face; even though he knew the end was near. Dr. Tebes lost his battle with
rhabdomyosarcoma in December of 2006 and will forever be missed.

ACKNOWLEDGMENTS
I would like to thank my mentor Dr. Patricia Kruk for her continued support,
guidance, and patience as I completed my dissertation research and prepared this
manuscript. Additionally, I would like to thank Dr. Nicole Johnson for laying the
foundation for this research project. I would also like to thank my other coworkers, Dr.
Yira Bermudez, Nancy Lowell, Rebecca Linger, Christina Drenberg, and Nicole
Anderson for their support and encouragement. I am also grateful for the excellent
advice and direction provided by my dissertation committee consisting of Dr. Santo
Nicosia, Dr. Jin Cheng, Dr. Alvaro Monteiro, and Dr. Rebecca Sutphen. I appreciate the
time they’ve given to attend committee meetings and am thankful for the great
suggestions they’ve provided. Finally, I would like to thank my family and friends for
encouraging me over the last five years. It has been a long road that I would not have
been able to travel on my own.
i
TABLE OF CONTENTS
LIST OF TABLES...……………………………………………………………………...iii LIST OF FIGURES……………………………………………………………………….iv LIST OF ABBREVIATIONS ..………………...………………………………………....vi ABSTRACT …….…………………………………………………...…………………….x CHAPTER I: INTRODUCTION……………………………………………… ...……….1
Ovarian Cancer………………………………………… ……………………..…..1 BRCA1……………………………………………………….……….……..…….8 Apoptosis….………..………………………… ……………………………..…..12 Maspin………………… …………………………………………………..…….16
CENTRAL HYPOTHESIS …………………………………………………………….20
SPECIFIC AIMS ..……………………………………………………………………….20
CHAPTER II: BRCA1 185delAG TRUNCATION PROTEIN, BRAT, AMPLIFIES CASPASE-MEDIATED APOPTOSIS IN OVARIAN CELLS ………21
Abstract .……………………………...………………………………………….21 Introduction ..……………………………………………………………………..23 Materials and Methods …..……………………………………………………….26
Cell Culture, Plasmid Construction, and Transfection …………..………26 Luciferase Assay ….……………………………………………………...28 BRAt Morphology and Cell Growth ..………………………………..…..29 Tumorigenesis and Telomerase Assays .……………………………..….29 BRAt Localization .…………………………………………………..…..29 BRAt RT-PCR ………………………………………….…………….….30 XIAP, cIAP1, and Bax RT-PCR ………………………………………...31 Apoptosis Induction and Quantification …………………………………32 Statistical Analysis …………………………………………………..…..34
Results ………………………………………….…………………………..……35 Detection of BRAt mRNA and nuclear localization of BRAt protein …..35 BRAt does not alter IOSE morphology or induce tumorigenesis …….….44 BRAt increases caspase-3 mediated apoptosis following STS Treatment ............................................................………………………. 46
ii
BRAt cells express lower levels of XIAP, cIAP1, and p-Akt and increased levels of Bax ………………………………..…………….51 hTERT-BRAt can selectively increase apoptosis in cancer cell.…….…..56 BRAt increases cytotoxicity in platinum-resistant ovarian cancer cells …………………………………………………………………..…57
Discussion ……………………………………………………..…………………60 Acknowledgements ………..……………………………………………………..63
CHAPTER III: BRCA1 185delAG TRUNCATION PROTEIN, BRAT, AMPLFIES
MASPIN EXPRESSION IN OVARIAN SURFACE EPITHELIAL CELLS …...…64 Abstract ………………………………………………………………..…………64 Introduction …………………………………..…………………………………..66 Materials and Methods ..……………………………………………………….....68
Cell Culture and Transfection ……………………………………………68 Cell Viability Assay ……………………………………………………...68 Western Blot and RT-PCR …………………………………………….69 Luciferase Assay ………………………………………………………....70 Statistical Analysis ……………………………………………………….71
Results ………..…………………………………………………………………..72 BRAt and maspin have similar effects on ovarian cell proliferation following treatment …………………………………...………………72 IOSE cells carrying the BRCA1 185delAG mutation have increased maspin protein levels …………………..……………………..72 BRAt transfection increases maspin message and nuclear maspin protein…………………………………………………………… 74 IOSE cells carrying the BRCA1 185delAG mutation and stable BRAt cells display increased activation of the maspin promoter ……….77 BRAt-enhanced maspin promoter activation is partially mediated by the transcription factor AP1 …………….…………………………….79
Discussion …….………………………………………………………………....84 Acknowledgements …..…………………………………………………………..87
CHAPTER IV: CONCLUSIONS .………….……...…………………………………...88 REFERENCES …………………………………………………………………………..93 ABOUT THE AUTHOR………………………………………………………….End Page

iii
LIST OF TABLES
Table 1: Densitometric analysis of selected members of the caspase pathway in
BRAt cells ..…………………………………………………………………..49
iv
LIST OF FIGURES
Figure 1: BRAt Nucleotide and Protein Sequence….…………………….………..35
Figure 2: BRAt Expression Plasmids.………………………………………...…....36
Figure 3: Initial Application of the BRAt RT-PCR Protocol…………………..…..38
Figure 4: BRAt PCR Optimization with DMSO and Glycerol …….……………...39
Figure 5: BRAt RT-PCR detects BRAt mRNA in Stable and Transiently Transfected Cells ……………………………………………40
Figure 6: Optimization of β-actin Primer Addition for use as an Internal Control ..........................................................................................42
Figure 7: Localization of BRAt Protein………………………………………...….43
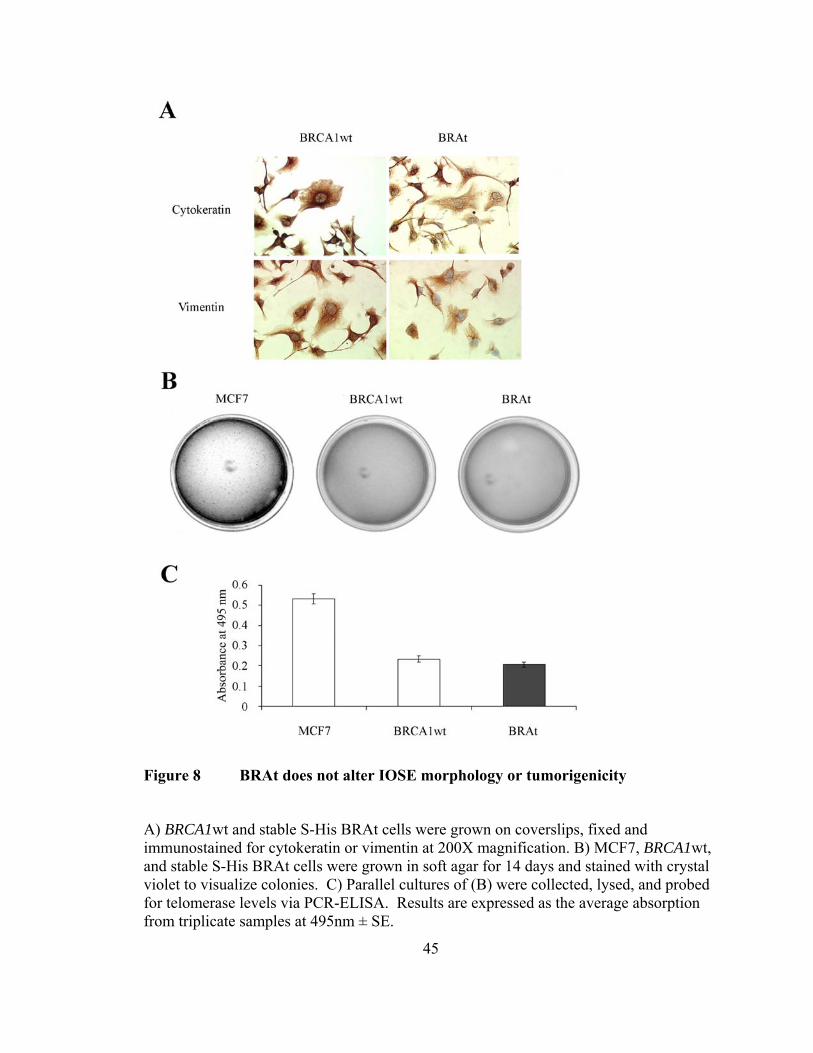
Figure 8: BRAt does not alter IOSE morphology or tumorigenicity…...………….45
Figure 9: BRAt confers increased STS-mediated cell death via caspase-3 cleavage …………………………………………………...…..48
Figure 10: BRAt confers increased STS-mediated cell death…………………...…..50
Figure 11: BRAt cells have decreased cIAP1 and XIAP and increased Bax protein levels ……………………………………………………………..53
Figure 12: BRAt cells have decreased XIAP and increased Bax message levels …...54
Figure 13: BRAt cells have decreased levels of phosphorylated AKT ……………...55
Figure 14: BRAt increases STS-induced death in ovarian cancer cells ……………..57
Figure 15: BRAt increases cytotoxicity in platinum-resistant ovarian cancer cells ……………………………………………………………….59 Figure 16: BRAt and maspin protein have similar effects on ovarian cell proliferation …………………….…………………………...……….73
v
Figure 17: The BRCA1 185delAG mutation correlates with increased maspin expression ………………………………………………………..74
Figure 18: BRAt transfection increases maspin message and protein levels………..76
Figure 19: IOSE cells carrying the BRCA1 185delAG mutation and stable BRAt cells display increased activation of the maspin promoter ………..78
Figure 20: Truncated maspin promoter results in decreased activation of
luciferase reporter ......................................................................................80
Figure 21: AP1 knockdown results in decreased activation of the full length maspin promoter …………………………………………………………81
Figure 22: AP1 knockdown decreases maspin protein levels in BRAt cells and attenuates the apoptotic response following STS treatment …….…..83
Figure 23: Proposed mechanism for BRAt-induced maspin expression and caspase-3 cleavage in ovarian cells ……………………………..…...92
vi
LIST OF ABBREVIATIONS
AA Constitutively active Akt
AP1 Activator protein 1
Apaf-1 Apoptotic protease activating factor 1
b.p. Base pair
BAP1 BRCA1 associate protein-1
BARD1 BRCA1-associated RING domain protein
Bax BCL-2 -associated X protein
Bcl-2 B-cell CLL/lymphoma 2
BH Bcl-2 homology domain
BIR Baculovirus IAP repeat
BRAt BRCA1 185delAG amino terminal truncation protein
BRCA1 Breast and ovarian cancer susceptibility gene 1
BRCA2 Breast and ovarian cancer susceptibility gene 2
BRCT BRCA1 c-terminal domain
BRIT BRAt control plasmid containing a scramble sequence at the C-terminus
BSA Bovine serum albumin
CA-125 Cancer antigen 125
CARD Caspase recruitment domains
CB Carboplatinum
vii
cDNA complementary DNA
CP Cisplatinum
Cyt Cytoplasmic fraction
dATP Deoxyadenosine triphosphate
DED Death effector domains
DFF45 DNA fragmentation factor 45
DISC Death-inducing signaling complex
DMSO Dimethyl sulfoxide
DNA Deoxyribonucleic acid
dns Data not shown
ECL Enhanced chemiluminescence
EGF Epidermal growth factor
EGFR Epidermal growth factor receptor
ELISA Enzyme linked immunosorbent assay
ERCC1 Excision repair cross-complementing rodent repair deficiency, group 1
FADD Fas-associated protein with death domain
GFP Green flourescent protein
h Hour
HDF Human dermal fibroblasts
HER2/neu Human epidermal growth factor receptor 2
His Histidine tag
hMLH1 Human MutL homolog 1
viii
hMSH2 Human MutS homolog 2
HNPCC Hereditary nonpolyposis colorectal carcinoma
hTERT Human telomerase reverse transcriptase
IAP Inhibitor of apoptosis protein
IBM IAP-binding motif
IC50 Median inhibition concentration
IOSE Immortilized ovarian surface epithelium
IP Immunoprecipitation
Luc Luciferase
M Minute
MPTP Mitochondrial permeability transition pore
mRNA Messenger ribonucleic acid
ND Not detectable
NER Nucleotide excision repair
NMD Nonsense-mediated decay
Nuc Nuclear fraction
OVAD Ovarian adenoma
PARP Poly (ADP-ribose) polymerase
PBS Phosphate buffered saline
PCR Polymerase chain reaction
PI Propidium iodide
PVDF Polyvinylidene fluoride
ix
RING Really interesting new gene
RT-PCR Reverse transcriptase polymerase chain reaction
s Second
SDS-PAGE Sodium dodecyl sulfate polyacrylamide gel electrophoresis
SE Standard error
siRNA Small interfering RNA
STS Staurosporine
SV-40 Simian virus 40
TBS Tris-buffered saline
TM Trans-membrane
VEGF Vascular endothelial growth factor
WT Wild-type
XIAP X-linked inhibitor of apoptosis protein
x
BRCA1 185delAG Mutant Protein, BRAt, Amplifies Caspase-Mediated Apoptosis
and Maspin Expression in Ovarian Cells
Joshua D. O’Donnell
ABSTRACT
Ovarian cancer is a deadly disease that kills an estimated 15,000 women annually
in the United States. It is estimated that approximately 10% of ovarian cancers are due to
familial inheritance. The most commonly mutated genes in familial ovarian cancer are
BRCA1 and BRCA2. It has been reported that cells carrying the BRCA1 185delAG
mutation undergo an enhanced caspase-3 mediated apoptotic response. Here, we report
on the transfection of cDNA coding for the putative truncated protein product of the
BRCA1 185delAG mutant gene into BRCA1 wild-type human immortalized ovarian
surface epithelial (IOSE) cells and ovarian cancer cells. Cells transfected with the
BRCA1 185delAG truncation protein (BRAt) showed increased levels of active caspase
3, increased cleavage of caspase 3 substrates, PARP and DFF45, and decreased XIAP
and cIAP1 following staurosporine (STS) treatment. BRAt also reduced Akt
phosphorylation and over expression of activated Akt in BRAt cells restored caspase-3
activity to that seen in wild type cells. Further, BRAt expression increased
xi
chemosensitivity in platinum resistant ovarian cancer cells. Similarly, maspin protein
has been shown to sensitize breast carcinoma cells to STS-induced apoptosis. We
provide the first evidence that BRAt is sufficient to induce maspin protein in IOSE cells.
IOSE cell lines carrying the BRCA1 185delAG mutation showed higher maspin levels
than wild-type BRCA1 IOSE cell lines. BRCA1 wild-type IOSE cells were transfected
with BRAt protein and showed increased maspin mRNA levels and increased nuclear
maspin protein levels as compared to control cells. Additionally, both heterozygous
carriers of the BRCA1 185delAG mutation and cells transfected with BRAt protein show
an increased ability to activate the maspin promoter as compared to control cells. The
transcription factor AP1 is at least partially required for full activation of the maspin
promoter in BRAt cells, as siRNA directed towards c-jun decreased activation of the full-
length maspin promoter. Taken together, our data demonstrate that truncated proteins
arising from BRCA1 185delAG mutation increase Akt-mediated apoptosis by increasing
nuclear maspin expression, suggesting a possible mechanism by which ovarian cancer
patients with germline BRCA1 mutations may respond better to chemotherapy.

1
CHAPTER I
INTRODUCTION
Ovarian Cancer
It is estimated that over 15,000 women die annually of ovarian cancer in the
United States [1, 2]. Only three other cancers, breast, lung, and colon, are estimated to
kill more women annually [2]. Five-year survival rates for ovarian cancer vary based on
stage and grade of the tumor. In the United States, the overall survival rate for stage I is
93%, stage II is 70%, stage III is 37%, and stage IV is 25%. However, only about 20% of
patients are diagnosed at stage I, whereas approximately two-thirds of patients are
diagnosed at stage III or IV [1]. Between 1995 and 2000, 68% of ovarian cancer patients
were diagnosed with late stage disease, with only 29% of these late stage patients
surviving five years [3].
Ovarian cancer is the deadliest of the gynecologic cancers due to the lack of
symptoms resulting in difficult early detection. When symptoms present they are
commonly mistaken as gastrointestinal problems or menopausal symptoms. Thus, many
cases are misdiagnosed and these misdiagnoses are a primary cause for the high
incidence of late stage diagnosis.
The CA-125 blood test is the most specific screening tool available for ovarian
cancer detection. CA-125 is an epithelial antigen protein expressed on the coelomic

2
epithelium, which includes the ovarian surface. Over 90% of patients with advanced
ovarian tumors will have elevated plasma CA-125 levels, whereas 50% of stage 1
patients will show normal levels of CA-125 [4]. Thus, the CA-125 blood test is not an
effective screen for early stage ovarian tumors due to the high percent of false negatives.
False positive results are also common and are caused by a wide range of conditions,
including endometriosis, fibroids, hemorrhagic ovarian cysts, menstruation, pregnancy,
acute pelvic inflammatory disease, renal disease, and cancers of the endometrium,
pancreas, bladder, breast, liver, or lung [5].
Transvaginal ultrasound is also used to detect ovarian cancer. This tool is most
useful for postmenopausal women. The ovaries of premenopausal women are active and
may harbor large functional cysts which could lead to false positives. Multiple cyst
formation, bilaterality, papillary projections, and ascites fluid are conditions characteristic
of ovarian cancer that are detectable by ultrasound [5].
A third, less effective tool is the manual pelvic exam. The physician will feel for
the size, shape, and position of the uterus and ovaries. Only large palpable tumors will be
detected by this method [6].
The origin of ovarian cancer has been debated, [7, 8] however, the traditional
theory suggests that most ovarian cancers arise from the simple epithelial lining of the
ovary or cortical inclusion cysts [7]. Several studies have used mouse models to
introduce specific genetic lesions into ovarian surface epithelium, resulting in ovarian
cancer and supporting the traditional theory [9-11]. Other theories suggest that ovarian
cancer arises from the ‘secondary Müllerian system’ [8]. This includes structures that
exist in the ovarian hilum and in paratubal and paraovarian areas that are thought to be
3
remnants of the Müllerian ducts [7]. Additionally, a small proportion of ovarian tumors
are believed to have granulosa or germ cell origins [12].
Tumors of the ovarian surface epithelium are classified into five types: serous,
endometrioid, mucinous, clear-cell, and transitional-cell [13]. The most common form of
ovarian cancer is serous carcinoma, accounting for about 53% of cases [14].
Morphologic and genetic data suggest that this form arises directly from ovarian surface
epithelium or inclusion cysts [15]. Serous tumors range from cystic, papillary tumors to
solid masses often with papillary surfaces, and histologically are very similar to cancers
of the fallopian tube. Endometrioid cancers account for 15-20% of ovarian cancers and
are characterized by their endometrial-like glandular structures. Mucinous tumors
account for 10% of ovarian cancers and are typically composed of glands and cysts lined
by cells with mucin-rich cytoplasm that resemble epithelial cells of the endocervix or of
the intestine. Generally, the prognosis for women with serous carcinomas is poorer than
those with endometrioid or mucinous carcinomas. Clear-cell and transitional-cell types
are less common [14, 16, 17].
The first step in the management of patients with epithelial ovarian cancer is an
accurate diagnosis and thorough staging, with optimal surgical cytoreduction of disease.
In early stage disease radical surgery will cure most women, although a minority of
women would benefit from adjuvant chemotherapy [18, 19]. In advanced disease, where
all macroscopic disease cannot be excised, the current practice is to debulk the tumor,
aiming to remove as much macroscopic disease as possible. Optimal debulking surgery
can improve patients’ responses to chemotherapy and relieve their symptoms.
4
Postoperative taxane– and platinum–based chemotherapy is then administered to
patients with a significant risk of recurrence [20, 21]. In the 1990s, the combination of
paclitaxel and cisplatinum was found to have an improved response rate and an increase
in progression-free and overall survival as compared to either drug administered
individually. Recently, carboplatinum was introduced as a replacement for CP because
of its ease of outpatient administration and better side effect profile. Carboplatinum and
paclitaxel, when directly compared to CP and paclitaxel, showed no difference in
progression-free or overall survival and was less toxic [22]. Almost 80% of patients with
advanced disease experience an initial favorable clinical response with platinum and
taxane chemotherapy, however, most ultimately relapse and only 25% of patients are
cured [23]. Patients who develop recurrent disease at intervals of greater than 6 months
following primary treatment, defined as “platinum-sensitive”, have a high probability of
responding again to platinum-based therapy. Patients who experience disease
progression during treatment, who have stable disease in response to primary platinum-
based therapy, or who relapse within 6 months are considered to have “platinum-
refractory” disease [24, 25]. Drugs with demonstrated activity as secondary treatments
for platinum-refractory disease include topotecan, docetaxel, oral etoposide, liposome
encapsulated doxorubicin, gemcitabine, ifosfamide and hexamethylmelamine. These
secondary treatments rarely result in a cure and are generally considered as palliative
[26].
There is a pressing need to identify the mechanisms underlying drug resistance to
allow the development of novel drugs that can be used to re-sensitize tumor cells. There
are many genes and pathways that have been implicated in drug resistance. The primary
5
mechanism of platinum toxicity is thought to be through DNA damage by the formation
of DNA adducts. Genes involved in DNA damage repair are often up regulated in drug
resistant tumors. For instance, the ERCC1 gene product is considered a rate-limiting
component of the nucleotide-excision repair system (NER). NER is a primary
mechanism by which cells repair platinum-induced DNA damage. Down regulation of
ERCC1 leads to a sensitization of cells to platinum both in vitro and in xenograft tumor
models [27].
Genes involved in regulating apoptosis are also involved in drug resistance. One
such molecule that has been implicated in drug resistance is the caspase inhibitor XIAP.
In cells that are sensitive to drug, CP treatment down regulates XIAP, leading to a
corresponding activation of caspase 3 and subsequent apoptosis. In contrast, drug-
resistant cells have shown no decrease in XIAP after exposure to CP [28, 29].
Recently there has been an increased emphasis placed on the development of
novel agents targeting biological mechanisms necessary for ovarian tumor growth and
progression. Inhibitors of the EGF and HER2/neu receptors in epithelial ovarian cancer
patients have received much attention. Preclinical evidence suggests that the EGFR and
HER2 pathways govern critical cellular processes in ovarian cancer, including cell
proliferation and survival [30]. Drugs that target these pathways include Iressa® (Astra
Zeneca) and Tarceva® (Roche), which are tyrosine kinase inhibitors specific for EGFR.
Monoclonal antibody treatments have also been developed. Erbitux® (ImClone Inc.)
targets the extracellular domain of the EGFR. Omintarg™ (Genentech) disrupts the
interaction between HER2/Neu and its partners HER1 and HER3, blocking intracellular
signaling downstream of HER2/Neu. Herceptin® is directed against the extracellular
6
domain of HER2/neu. Unfortunately, Phase II clinical trials with many of these drugs
have been disappointing. Patients with platinum-resistant ovarian cancer were treated
with Iressa® or Tarceva® and less than 6% of the tumors responded to the treatment [31,
32]. Similarly, only 7.3% of patients with HER2 positive ovarian cancer responded to
Herceptin® [33].
Another biological mechanism that is currently being targeted is angiogenesis.
Angiogenesis, the growth of new blood vessels from pre-existing vessels, is a normal
process that is important for embryological development and wound healing [34]. It is
also an essential mechanism that allows cancer cells to nest, expand, and invade distant
tissues, making angiogenesis an attractive target for therapeutic intervention.
Angiogenesis is regulated by numerous pro- and anti-angiogenic molecules. Vascular
endothelial growth factor (VEGF) is the most potent pro-angiogenic molecule known
[35]. Expression of VEGF and of its receptors correlates with an invasive phenotype and
worse clinical outcome in epithelial ovarian cancer [36]. VEGF also regulates the
formation of ascites in ovarian cancer [37]. Avastin® (Genentech) is an antibody against
VEGF that has been shown to inhibit the growth of human tumors in mice [38]. Clinical
studies have shown that Avastin® increases the efficacy of chemotherapy in breast,
colorectal, and lung cancers [39-41]. In a Phase II clinical trial of patients with recurrent
platinum-resistant ovarian cancer, the response rate to single agent Avastin® was 17%
and 39% of patients had no further disease progression after six months [42]. Another
study coupled Avastin® with metronomic cyclophosphamide to treat platinum-resistant
ovarian cancer. In this study 28% of patients responded and 59% had no further disease
7
progression after six months [43]. More trials are needed to advance the use of Avastin®
as an adjuvant treatment.
It is estimated that approximately 90% of ovarian cancers are spontaneous and the
remaining 10% are due to familial inheritance [44]. Women in hereditary nonpolyposis
colorectal carcinoma (HNPCC) families or those carrying mutations in either the hMSH2
or hMLH1 genes have a tenfold increase in the risk for developing ovarian cancer [45,
46], however, these mutations make up a small percentage of familial ovarian cancer
cases. Other genes commonly mutated in various cancers, including PTEN and TP53,
have also been associated with ovarian cancer [47, 48]. The most commonly mutated
genes in familial ovarian cancer are the breast and ovarian cancer susceptibility genes,
BRCA1 and BRCA2 [49, 50].
8
BRCA1
The breast and ovarian cancer susceptibility gene, BRCA1, is located at
chromosome 17q21, contains twenty-two coding exons, and encodes a 1863 amino acid
protein [50, 51]. The BRCA1 locus was identified via linkage analysis in 1990 [52] and
the gene was first cloned in 1994 [50].
BRCA1 is located primarily in the nucleus, however, its expression and
distribution within the cytoplasm and nucleus varies with the cell cycle. BRCA1 is
expressed during the mid G1 phase of the cell cycle and elevates to its maximum level
during S phase [53, 54]. During S phase, BRCA1 localizes to subnuclear foci in response
to DNA damage [55]. BRCA1 levels remain high during M phase where it can be found
associated with the centrosomes [56].
BRCA1 protein has two highly conserved domains located at either end of the
protein. The first 109 amino acids at the N-terminus form a RING finger domain. This
region contains a core of approximately fifty amino acids with a conserved pattern of
seven cysteine and one histidine residue arranged to form a structure responsible for
coordinating the binding of two Zn2+ ions [57]. The C-terminus contains two BRCT
(BRCA1 c-terminal) domains. The BRCT domain is approximately one hundred amino
acids that is present in a number of DNA-repair and DNA-damage-response proteins
[58].
9
BRCA1 has been found to interact with many different proteins. The N-terminal
RING finger domain interacts with BARD1 (BRCA1-associated ring domain protein 1)
and BAP1 (ubiquitin hydrolase BRCA1-associated protein 1). The interaction of BARD1
with BRCA1 is required to stabilize the BRCA1 RING finger domain for E3 ubiquitin
ligase activity [59]. Other proteins bind to the central portion of BRCA1, including c-
Myc, p53, pRB, RAD50, and RAD51. The C-terminal BRCT domains bind many
proteins, including p53, pRB, p300/CBP, MSH2, BRCA2, CtIP, RNA Pol II, and RNA
helicase A [60-65].
The exact biological function of BRCA1 has not been defined; however, multiple
roles have been suggested. BRCA1 has been implicated in transcriptional regulation, cell
cycle checkpoint control, chromosome segregation, and DNA damage repair [66]. Many
of the therapeutic agents used in cancer treatment cause DNA damage through various
mechanisms. BRCA1 has been reported to be involved DNA repair and is implicated in
both homologous recombination and non-homologous end joining of double-stranded
DNA breaks and in nucleotide excision repair of DNA adducts [62]. As a result, BRCA1
has been classified as a tumor suppressor based on its involvement in DNA integrity
maintenance. Thus, a better understanding of the role BRCA1 plays in the response to
DNA damage caused by chemotherapeutic drugs may lead to more effective treatments.
Specifically, BRCA1 status may have the potential be used as an indicator of the efficacy
of specific drugs.
There have been numerous different mutations reported throughout the entire span
of the BRCA1 gene. The Breast Cancer Information Core lists over 1000 different
BRCA1 alleles in its database. These include nonsense, missense, and frameshift
10
mutations as well as large and small deletions. Women who carry BRCA1 mutations are
predisposed to the development of breast and/or ovarian cancer [67]. By age 70, BRCA1
mutation carriers have a breast cancer risk of 71% and an ovarian cancer risk of 47-63%
[68].
The most common BRCA1 mutations are the germline founder mutations [69-71].
‘Founders’ are small groups of people who have remained isolated from other
populations, resulting in interbreeding among the group. This interbreeding causes
otherwise rare mutations to become more common within the particular group. The best-
known example of a founder effect is that seen in the Ashkenazi Jewish population. This
group has ancestors from Eastern and Central Europe and 1% of this population are
carriers of the most common founder mutation, the BRCA1 185delAG truncation [72].
This is a frameshift mutation that results in a premature stop signal at codon 39 in the
BRCA1 protein. This mutation is also carried by significant numbers of non-Jewish
Spanish, Spanish Gypsy, and women of mid-eastern decent [72-75]. The second most
common founder mutation in BRCA1, the BRCA1 5382insC mutation, is found in 0.13%
of Ashkenazi Jews [76]. Women carrying these mutations have an approximate 65%
lifetime risk for developing breast cancer [77] and 15%-54% lifetime risk for developing
ovarian cancer [78, 79].
Most clinical reports comparing the survival of ovarian cancer patients carrying
BRCA1 mutations to those ovarian cancer patients with wild-type BRCA1 fail to
differentiate the effects of the specific mutations present. Therefore, the data are
inconsistent with some reports suggesting that BRCA1 mutation carriers have a prolonged
survival compared to BRCA1 wild-type disease, whereas in other reports there is no
11
survival difference between the two cohorts [80-83]. The few reports that do identify the
effects of specific mutations suggest that ovarian cancer patients carrying the two most
common BRCA1 founder mutations (185delAG and 5382insC) have a better initial
response to treatment and longer median survival than ovarian cancer patients with wild-
type BRCA1 [80, 84, 85] Ben David et al. (2002) compared 152 ovarian cancer patients
carrying the BRCA1 185delAG mutation to 549 BRCA1 wild-type ovarian cancer patients
and reported a median survival of 51.84 months for 185delAG carriers compared to 37.84
months for BRCA1 wild-type patients [86] . Additionally, in vitro data show that
BRCA1-defective cells are sensitive to half the dose of CP (IC50: 30-40 µM) compared to
BRCA1 wild type cells (IC50: 90-100 µM) [87] and that mutations within the amino-
terminus of BRCA1 are associated with increased apoptosis [88-90] and, therefore, may
be responsible for the enhanced chemotherapeutic response and survival associated with
some BRCA1 founder mutation carriers.

12
Apoptosis
Apoptosis is a form of cell death in which a programmed sequence of events leads
to the elimination of cells without releasing harmful substances into the surrounding
tissue. Apoptosis plays a crucial role in developing and maintaining health by eliminating
old cells, unnecessary cells, and unhealthy cells.
Apoptotic cells can be recognized by gross morphological changes: the cell
shrinks, shows deformation and loses contact to its neighboring cells. Its chromatin
condenses and marginates at the nuclear membrane, the plasma membrane blebs or buds,
and finally the cell is fragmented into compact membrane-enclosed structures, called
'apoptotic bodies' which contain cytosol, the condensed chromatin, and organelles. The
apoptotic bodies are engulfed by macrophages and thus are removed from the tissue
without causing an inflammatory response [91].
Apoptosis is in contrast to the necrotic mode of cell-death in which case the cells
suffer a major insult, resulting in a loss of membrane integrity, swelling and disrupture of
the cells. During necrosis, the cellular contents are released uncontrolled into the cell's
environment which results in damage of surrounding cells and a strong inflammatory
response in the corresponding tissue [92].
Apoptosis is initiated by sequential activation of members of the human caspase
(cysteine-aspartyl specific protease) family. The caspase family consists of twelve
13
members that are all known to exclusively cleave their substrates immediately
downstream of aspartic acid residues [93]. All members of the caspase family share a
conserved active site and their precursors are all zymogens known as procaspases. The
amino-terminal domain of procaspases contains a diverse structure required for caspase
activation. All procaspases are capable of autoactivating as well as activating other
caspases. Activation results in a heterodimer and two heterodimers join together to form
an enzymatic active tetramer [94].
The caspase family is further divided into three subfamilies. The apoptosis
activator family consists of caspases-2, -8, -9, and -10. The apoptosis executioner family
consists of caspases-3, -6, and -7. The inflammatory mediator family consists of
caspases-1, -4, -5, -12, and -14 [95]. The activator caspases differ from the executioner
caspases in that they have long N-terminal domains that allow them to associate with
death effector domains (DED) or caspase recruitment domains (CARD) present in
adaptor proteins.
Caspase-mediated apoptosis can occur by two distinct, but converging pathways
[96, 97]. The extrinsic pathway is triggered by the binding of “external” ligands to death
receptors, one example being Fas binding to the Fas receptor. Upon Fas binding to its
receptor, oligomerization results and formation of the death-inducing signaling complex
(DISC) occurs. DISC is comprised of Fas, the adaptor protein Fas-associated protein
with death domain (FADD), and procaspase-8. The aggregation of pro-caspase-8 in
DISC leads to its auto-activation to active caspase-8. This activation leads to the
subsequent activation of downstream effector caspases [98].
14
The intrinsic pathway occurs in response to cellular stress and genotoxic damages
caused by chemotherapeutic agents. The initial stress signal results in the release of
cytochrome c from the inner-mitochondrial membrane space into the cytosol. The
cytosolic cytochrome c then binds to dATP and causes the apoptotic protease-activating
factor-1 (Apaf-1) to oligomerize and form a large complex called the apoptosome. The
apoptosome recruits and interacts with the CARD domain of pro-caspase-9 which leads
to its auto-activation. Active caspase-9 then recruits and activates pro-caspase-3 and-7.
The activation of caspase-3 and -7 leads the cleavage of critical cellular substrates
including poly-(ADP) ribose polymerase (PARP), in what is known as the execution
phase of apoptosis [99-101].
The intrinsic pathway is partially controlled by the Bcl-2 protein family [102].
The members of the Bcl-2 family are categorized into three groups based on their
structure and function. The first group are anti-apoptotic proteins and include A1/Bfl1,
Bcl-2, Bcl-w, Bcl-xL, Boo/Diva, Mcl-1, NR-13, and Nrf3 . All members of this group
have four short Bcl-2 homology (BH) domains; BH1, BH2, BH3, and BH4. They also
contain a carboxy-terminal transmembrane domain (TM) that targets them to the outer
mitochondrial membrane, endoplasmic reticulum, and nuclear envelope [103]. These
proteins potently inhibit apoptosis and their mechanism appears to be related to their
ability to prevent proper assembly of the apoptosome complex [104].
The two other groups of Bcl-2 family protein are pro-apoptotic. The first includes
Bax, Bak, and Bok which contain three BH domains (BH1, BH2, and BH3) and a TM
domain [105] . These proteins are initially found in the cytoplasm and undergo a
conformational change to integrate into the outer mitochondrial membrane. They then
15
oligomerize and this is thought to increase the permeability of mitochondrial
permeability transition pores (MPTPs), permitting the release of cytochrome c into the
cytosol [106]. The anti-apoptotic Bcl-2 proteins are thought to selectively bind to active
Bax, thus preventing its insertion into the outer mitochondrial membrane [107].
The second group of pro-apoptotic Bcl-2 family proteins is classified as ‘BH3-
only’. These include Bim, Bad, Bid, Bik, Bmf, Puma, Noxa, and Hrk [105]. The BH3-
only proteins are inactive in healthy cells. When a cell death signal is detected, these
proteins are activated and translocate to intracellular membranes to inhibit the anti-
apoptotic Bcl-2 proteins [108, 109].
Another group of proteins that regulate the apoptotic cascade are the inhibitor of
apoptosis (IAP) proteins. In humans the IAP family includes cIAP1, cIAP2, XIAP,
NAIP, survivin, and livin [110-115]. All members of the IAP family contain at least one
N-terminal baculovirus IAP repeat (BIR) domain and one conserved C-terminal RING
domain. The IAP BIR domains can bind to caspases, thus protecting the cells from
apoptosis by inhibiting the activity of the bound caspases [116]. IAP activity is opposed
by Smac/Diablo or Omi/HtrA2m, proteins released from the mitochondria along with
cytochrome c [117]. These IAP inhibitors contain IAP-binding motifs (IBM) that bind
and sequester IAPs [118].

16
Maspin
Maspin, the mammary serine protease inhibitor, has been shown to sensitize
breast carcinoma cells to induced apoptosis [119, 120]. Maspin was identified based on
its expression in normal, but not in tumor-derived human mammary epithelial cells [121].
Maspin is a Class II tumor suppressor due to its ability to inhibit cellular
invasion/motility and because it is not mutated or deleted, but rather transcriptionally
downregulated or silenced by epigenetic changes in breast cancer [122-124].
The exact function of maspin is still unclear, however, studies on maspin have
demonstrated its ability to inhibit cancer cell motility, invasion, metastasis, angiogenesis,
and to induce apoptosis in cancer cells [119, 121, 122, 125, 126]. One of the earliest
studies on maspin function showed that maspin regulates cell invasion by altering the
integrin profile of the cell. Breast cancer cells treated with recombinant maspin had
increased levels of α3- and α5- containing integrins. The addition of an α5β1-blocking
antibody diminished the anti-invasive properties induced by recombinant maspin [127].
Recombinant maspin also decreased Rac1 activity in MDA-MB-231 breast cancer cells,
resulting in decreased cell motility and increased cell adhesion. The highly aggressive
phenotype of these breast cancer cells was reverted to a more epithelial-like phenotype in
the presence of maspin [128].

17
Angiogenesis describes the formation of new blood vessels, which is necessary
for rapidly proliferating tumors which require an increased blood supply to maintain their
growth. In general, tumors that secrete high levels of angiogenic factors, such as VEGF,
tend to be associated with an increased invasive and metastatic phenotype. Maspin has
been shown to interfere with the migration of cultured endothelial cells toward VEGF
[129], which is an important chemoattractant for angiogenesis. Maspin has also been
shown to obstruct neovascularization and decrease the density of tumor-associated
microvessels in vivo [125].
Maspin has also been implicated in the control of apoptosis. Initial observations
were that maspin inhibits SV-40 large-T-antigen-induced breast carcinogenesis by
increasing apoptosis [130]. Subsequently, maspin has been shown to sensitize breast
cancer cells to STS-induced apoptosis.
It is increasingly apparent that the subcellular localization of maspin is tissue-
dependent and that it is important for its function and usefulness as a potential prognostic
marker. In addition to breast, maspin was initially identified in prostate, thymus, testis,
intestine, and lung tissues [131]. It has since been identified in many other tissues,
including ovary, stomach, colon, bladder, pancreas, cornea, gall bladder, and thyroid
[132-140].
Reports describing the expression of maspin in normal ovarian surface epithelial
cells and epithelial ovarian cancer have been inconclusive. Initially, Sood et al. (2002)
reported that maspin was minimally expressed in normal ovarian epithelium. It was also
reported that maspin was expressed in a substantial portion of ovarian cancers and that
nuclear localization of maspin was associated with increased patient survival, whereas no
18
expression or cytoplasmic localization of maspin was associated with poor outcome in
ovarian cancer [141]. El-Wahed et al. (2005) suggested that maspin was not detectable in
normal ovarian epithelium, whereas 63% of ovarian cancers expressed maspin, however,
no survival difference was observed between patients with and without maspin
expression [142]. Similarly, Secord et al. (2006) reported that maspin was detected in
72% of advanced epithelial ovarian cancer cases and that non-detectable maspin appears
to be an independent predictor of increased risk of disease progression and death [143].
Most recently Solomon et al. (2006) reported that high maspin expression in the nucleus
of ovarian carcinoma cells is associated with lower tumor angiogenesis and improved
patient survival [144].
The initial cloning of the maspin promoter led to the identification of numerous
transcription-factor binding sites within the one kilobase maspin promoter region,
including sites for Ets, AP1, hormone-response element, HIF, and p53 [145]. p53 was
one the first factors to be investigated and was found to induce maspin expression in
breast and prostate cancer cells by binding to a putative site near the transcription start
site [146]. TAp63γ can substitute for p53 in inducing maspin expression in
hepatocellular carcinomas carrying only inactive forms of p53 [147].
The breast cancer drug Tamoxifen has also recently been described as a regulator
of maspin expression in breast cancer cells. Tamoxifen induced maspin expression in
vitro and in vivo primarily through the hormone-response element within the maspin
promoter. This was the first evidence that maspin expression in breast tissue may be
hormone-regulated. This was supported by the observation that 17β-estradiol reduced
maspin expression in normal mammary epithelial cells [148] and that Tamoxifen induced

19
maspin expression via estrogen receptor-α in normal and malignant breast cells [149].
Similar work in prostate shows that maspin expression is regulated by the hormone-
response element site recognized by androgen receptor in prostate cells [145].
Maspin expression is also known to be epigenetically regulated [150]. Epigenetic
changes that regulate maspin expression involve cytosine methylation, histone
deacetylation, and chromatin accessibility. Promoter methylation of the maspin gene
leads to silenced maspin in breast, thyroid, skin, and colon cancers [135, 140, 151],
whereas promoter demethylation leads the paradoxical overexpression of maspin in
ovarian, pancreatic, and gastric cancers [133, 152, 153].
20
CENTRAL HYPOTHESIS
I hypothesize that transfection of the BRCA1 185delAG truncation protein, BRAt, into
human ovarian surface epithelial cells results in detectable protein that is sufficient to
increase the apoptotic response following STS treatment. I also hypothesize that this
increased apoptotic response is due, in part, to BRAt induced maspin expression and that
BRAt protein can be used to selectively transfect ovarian cancer cells and is sufficient to
increase/restore sensitivity in chemo-resistant cells.
SPECIFIC AIMS
1. Develop BRAt expression vectors suitable for detecting BRAt protein in vitro and optimize detection protocols.
2. Identify and confirm molecular signaling pathways involved in BRAt mediated
apoptosis. 3. Identify potential BRAt target(s) and demonstrate potential clinical relevance for
BRAt mediated apoptosis.
21
CHAPTER II
BRCA1 185delAG TRUNCATION PROTEIN, BRAT, AMPLIFIES CASPASE-
MEDIATED APOPTOSIS IN OVARIAN CELLS
Abstract
Ovarian cancer patients with germline mutations in BRCA1 have been reported to
respond more favorably to initial chemotherapy. We previously reported that cells from
women carrying the BRCA1 185delAG founder mutation undergo an enhanced caspase-3
mediated apoptotic response. Here, we report on the transient and stable transfection of
cDNA coding for the putative truncated protein product of the BRCA1 185delAG mutant
gene into BRCA1 wild type human ovarian surface epithelial cells and ovarian cancer
cells. The BRCA1 185delAG truncation (BRAt) protein did not alter epithelial cell
morphology or induce tumorigenesis. However, upon treatment with STS, BRAt cells
showed increased levels of active caspase 3, increased cleavage of caspase 3 substrates,
PARP and DFF45, and decreased XIAP and cIAP-1. BRAt also reduced levels of
phosphorylated Akt and over expression of activated Akt in BRAt cells restored caspase
3 activity to that seen in wild type cells. Further, BRAt expression increased
chemosensitivity in platinum resistant ovarian cancer cells. Taken together, our data
demonstrate that truncated proteins arising from BRCA1 185delAG mutation increase

22
STS- or platinum-induced apoptosis, suggesting a possible mechanism by which women
with germline BRCA1 mutations may respond better to initial chemotherapy.
23
Introduction
Ovarian cancer, the deadliest of the gynecologic cancers, kills an estimated
15,000 women annually [2]. The asymptomatic nature of early ovarian cancer leads to
predominately late stage diagnoses, which results in a five-year survival rate of less than
30% [1, 3]. Primary treatment of epithelial ovarian cancer involves cytoreductive surgery
and platinum-based chemotherapy, to which more than 80% of patients show an initial
chemotherapeutic response. However, most women with advanced-stage disease at
initial diagnosis will develop recurrent tumors that are resistant to traditional platinum-
based therapy [154]. Thus, new protocols are needed to effectively treat chemo-resistant
ovarian cancer.
More than 10% of women with ovarian cancer show a positive familial history
[155]. Mutations in the breast and ovarian susceptibility gene (BRCA1) account for 60%
of these familial ovarian cancers [51]. BRCA1 has been linked to numerous pathways
within the cell with its best known function being tumor suppression [50]. Women with a
mutation in BRCA1 have an 87% and a 44% increased chance of developing breast or
ovarian cancer, respectively, and 80% of all hereditary cases of ovarian cancer are linked
to mutations in BRCA1 [51, 156]. While the large size of BRCA1 (1863 amino acids in
22 exons) predisposes the protein to numerous spontaneous mutations, the most common
are germline founder mutations found primarily in the highly conserved terminal regions
24
[69, 71, 157]. One such founder mutation is the BRCA1 185delAG, a frameshift in exon
2, carried by 1% of the Ashkenazi Jewish population, as well as significant numbers of
non-Jewish Spanish, Spanish Gypsy, and women of mid-eastern decent [72-75].
Clinical studies have shown that women with breast and ovarian cancer who carry
founder mutations have a better initial response to chemotherapeutic treatment than
women with wild-type BRCA1 (91.43 months versus 40.92 months survival) [81, 158,
159]. BRCA1-defective cells are sensitive to half the dose of CP (IC50: 30-40 µM)
compared to BRCA1 wild type cells (IC50: 90-100 µM) [87]. Loss of one or both BRCA1
carboxy terminal (BRCT) domains results in decreased apoptosis due primarily to the
loss of FasL activation of caspase 8 [160]. In contrast, mutations within the amino-
terminus of BRCA1 are associated with increased apoptosis [88] and, therefore, may be
responsible for the enhanced chemotherapeutic response associated with certain BRCA1
germline mutations.
In addition to inherited germline BRCA1 mutations, BRCA1 normally produces
various truncated proteins due to alternate splicing patterns resulting in shorter proteins
with distinct functions [161]. BRCA1 deletions in exons 2, 3, 9, 10, 11, 14, 15, 16, 17,
and 18 also produce truncation proteins within the same open reading frame as the wild
type BRCA1 transcript, yet they posses unique properties. For example, splice variants
produced from the BRCA1 1b exon appear only in placental tissue, and splice variants
lacking exon 7 are found predominantly in lymphocytes [162, 163]. Transcripts lacking
exon 11 lose the ability to translocate to the nucleus, and have been shown to cause
increased radiation-induced apoptosis in both human fibroblasts and breast cancer
carcinoma cell lines [164, 165].
25
Recently, we have shown that immortalized ovarian surface epithelial (IOSE)
cells cultured from women carrying the BRCA1 185delAG founder mutation express an
elevated caspase 3-mediated apoptotic response [89, 90] associated with reduced p-Akt-
mediated XIAP stabilization and subsequent loss of XIAP-mediated ubiquitination of
caspase 3 [89, 166]. Here, using transiently and stably transfected cell lines, we report
that the specific protein product of the BRCA1 185delAG mutation has direct effects on
caspase-mediated apoptosis in ovarian cells. We also demonstrate the chemosensitizing
effects of this mutant protein in chemoresistant ovarian cancer cells. These data not only
provide a potential molecular mechanism for the initial chemotherapeutic advantage seen
clinically in women with certain BRCA1 founder mutations, but also suggest new
therapeutic possibilities for the treatment of ovarian cancer.
26
Materials and Methods
Cell Culture, Plasmid Construction, and Transfection
The SV 40-Large T-Ag transfected human IOSE cell line IOSE-118 (BRCA1wt)
[89, 167] was cultured in Medium 199/ MCDB 105 (Sigma, St. Louis, MO) with 5% fetal
bovine serum and gentamicin. Wild type BRCA1 status was confirmed via single site
BRACAnalysis DNA sequencing at Myriad Biotechnologies (Salt Lake City, UT).
OV2008 and C13 ovarian cancer cells, and MCF7 breast cancer cells were also cultured
in Medium 199/ MCDB 105 media with 5% fetal bovine serum and gentamicin. Primary
cultures of human dermal fibroblasts (HDF) and ovarian adenoma (OVAD) cells were
cultured in Medium 199/MCDB 105 media (Sigma, St. Louis, MO) with 10% fetal
bovine serum and gentamicin. All cells were incubated at 37ºC with 5% CO2.
cDNA encoding for BRCA1 185delAG with an N-terminal His-tag and C-
terminal S-protein motif was generated by Midland Certified Reagent Company
(Midland, TX) using the published genbank BRCA1 sequence U14680. The truncated
BRCA1 185delAG protein is referred to as BRAt (BRCA1 amino-terminus truncation)
herein. S-His-BRAt cDNA was then ligated using T4 DNA ligase (New England
Biolabs) in 1X T4 ligase buffer (50mM Tris-Hcl (pH 7.5), 10 MgCl2, 10mM
dithiothreitol, 2mM ATP, 25µg/mL BSA) into the pTriEx-4 plasmid (Novagen),
transformed into DH5α competent cells and isolated under standard conditions
27
(Invitrogen). The S-His-BRAt plasmid sequence was confirmed. cDNA encoding for
BRAt with an N-terminal Flag-tag was generated by Integrate DNA Technologies
(Coralville, IA) using the published genbank BRCA1 sequence U14680. Flag-BRAt
cDNA was then ligated using T4 DNA ligase (New England Biolabs) in 1X T4 ligase
buffer into the pcDNA3.1(+) expression vector (Clontech, Palo Alto, CA), transformed
into DH5α competent cells and isolated under standard conditions (Invitrogen). The
Flag-BRAt plasmid sequence was confirmed.
A control plasmid, named BRIT, was generated by inserting an in-frame missense
mutation to abrogate the BRAt sequence from amino acids 22 through 33 in the S-His-
BRAt plasmid. This plasmid was used as a negative control to demonstrate BRAt
specificity.
The human telomerase reverse transcriptase (hTERT) promoter-luciferase
construct, pGL3–1375 [168], was used to develop a BRAt expression plasmid under the
control of the hTERT promoter. Flag-tagged cDNA for the BRAt protein was inserted in
sense orientation at the HindIII and NcoI sites. The resulting plasmid was sequenced to
confirm the correct orientation and sequence of the insert. This plasmid was named
hTERT-BRAt-luc and was also used to create a second plasmid lacking the luciferase
reporter. Briefly, the luciferase reporter cDNA was removed from the hTERT-BRAt-luc
plasmid by NcoI and BamHI digestion and the resulting sticky ends were blunted by use
of the Klenow fragment. Blunt-end ligation was performed to close the plasmid,
resulting in an hTERT-BRAt plasmid lacking the luciferase reporter gene.
IOSE-118, OV2008, and C13 cells were transfected using the Nucleofector device
(Amaxa, Gaithersburg, MD) with 2 μg of plasmid (GFP, S-His-BRAt, Flag-BRAt,
28
hTERT-BRAt, hTERT-BRAt-luc, BRIT, Activated Akt, or pcDNA3.1(+)). Briefly,
1x10⁶ cells were mixed with 2 μg of the appropriate plasmid in 100 µl of Nucleofector
solution (kit #VPD-1005). The cell suspensions were then transferred to electroporation
cuvettes and transfected using program X-005 on the Nucleofector device. To estimate
overall transfection efficiency, GFP-transfected cells were visualized and photographed
24 hours post-transfection using a digital camera-equipped fluorescence microscope.
Stable BRAt cells were generated using the S-His BRAt and Flag-BRAt plasmids.
Two million IOSE-118 cells were transfected with 2 µg of plasmid (S-His-BRAt, Flag-
BRAt, or pcDNA3.1(+)). After 24 hours, S-His-BRAt cells were grown with 1%
hygromycin B selection media and Flag-BRAt and pcDNA3.1(+) cells were grown with
1 mg/ml G418 selection media. Multiple stable clones of each cell line were established
and characterized for this study.
Luciferase Assay
Luciferase expression (to indicate BRAt expression) was confirmed in hTERT-
BRAt-luc-transfected cells using the luciferase assay. To confirm the cancer-specific
expression of our hTERT-BRAt-luc plasmid, 1x10⁶ primary HDF cells or primary OVAD
cells were transfected with 2 μg of GFP or 2 μg of hTERT-BRAt-luc using Nucleofector
kit #VCA-1003 and program X-005. Luciferase activity was measured 48 h after
transfection using the Luciferase Assay System (Promega, Madison, WI) according to the
manufacturers' instructions. β-galactosidase was measured 48 h after transfection using
the Luminescent β-galactosidase Detection Kit II (Clontech, Mountain View, CA)
29
according to the manufacturers' instructions. Transcriptional activity was expressed as
relative luciferase activity ±SE, after normalization with β-galactosidase activity.
BRAt Morphology and Cell Growth
To assess potential BRAt-dependent morphological changes, BRCA1wt and stable
S-His-BRAt cells were grown on coverslips and visualized via light microscopy. Cells
were also fixed in 4% paraformaldehyde and immunostained with cytokeratin and
vimentin [167, 169].
Tumorigenesis and Telomerase Assays
Fifty thousand BRCA1wt, stable S-His-BRAt, or the telomerase-positive,
tumorigenic breast cancer carcinoma MCF7 cells [170] were subjected to growth in
0.35% soft agar for 14 days. Agar cultures were lysed, stained with 0.005% Crystal
Violet and photographed. Telomerase activity of each cell line was measured using the
telomerase polymerase chain reaction-enzyme-linked immunosorbent assay (PCR-
ELISA) (Roche Molecular Biochemicals, Indianapolis, IN) as described previously and
according to manufacturer’s instructions [171].
BRAt Localization
BRCA1wt and transient S-His-BRAt cells were lysed in chilled IGEPAL lysis
buffer (50mM Tris-HCl (pH 8.0), 100mM NaCl, 5mM MgCl2, 0.5% (v/v) IGEPAL).
Lysed cells were centrifuged at 15,000 x g and supernatant (containing cytoplasm/plasma
membrane proteins) was removed for analysis. The pellet (containing nuclear proteins)
30
was washed twice and resuspended in lysis buffer. Fractionation samples were incubated
overnight with anti-His-tag antibody. Immunocomplexes were then precipitated using
Protein A agarose (Invitrogen), washed, resuspended with loading buffer and
electrophoresed via 7% SDS-PAGE. Samples were transferred to PVDF membrane and
probed against biotinylated S-Protein (Novagen). Immunoprecipitate supernatant
samples were electrophoresed via 7% SDS-PAGE, transferred to PVDF membrane, and
probed for NFĸB p65 and Histone H2A (Cell Signalling Technologies) to confirm
fractionation purity.
BRAt RT-PCR
To determine if BRAt mRNA was subject to nonsense-mediated mRNA decay,
we performed RT-PCR to detect BRAt mRNA levels in stable Flag-BRAt cells. Total
RNA was collected using TRizol reagent (GIBCO BRL). One microgram total mRNA,
oligo(dT), and reverse transcriptase were used to generate single-strand cDNA as
previously described [172]. The cDNA samples were amplified using the Perkin-Elmer
(Palo Alto, CA) GeneAmp kit. To prevent wild-type BRCA1 amplification, the sense
primer encompassed a portion of the Flag sequence. The BRAt primers used were BRAt-
S (CGATGACAAAATGGATTTATCTGC) and BRAt-AS
(GAGACAGGTTCCTTCATCAACTCC) with β-actin primers actin-S
(CCGTACCACTGGCATCGTGATGGA) and actin-AS
(CCAGGGCAGTGATCTCCTTCTGCA) for an internal control. PCR was performed
for 32 cycles of 94ºC for 30 s, 60ºC for 30 s, and 72ºC for 20 s. Ten percent DMSO and
31
10% glycerol were added to the PCR reaction to further prevent any wild-type BRCA1
amplification. Actin primers were added at cycle 14. The amplified products were then
separated by electrophoresis on a 10% polyacrylamide gel, stained with 1x SYBR Green
(Lonza, Rockland, ME), and photographed with the Kodak EDAS 120 Digital Analysis
System.
XIAP, cIAP1, and Bax RT-PCR
To determine if STS treatment affected mRNA levels of XIAP, cIAP1, and Bax,
we used RT-PCR to measure their mRNA levels following STS treatment. Total RNA
was collected using TRizol reagent (GIBCO BRL) at 0, 2, 4, and 6 hours following STS
treatment. One microgram total mRNA, oligo(dT), and reverse transcriptase were used
to generate single-strand cDNA as previously described [172]. The cDNA samples were
amplified using the Perkin-Elmer (Palo Alto, CA) GeneAmp kit. The XIAP primers
used were XIAP-S (CGCGAGCGGGGTTTCTCTACAC) and XIAP-AS
(ACCAGGCACGGTCACAGGGTTC). The cIAP1 primers used were cIAP1-S
(CCAGCCTGCCCTCAAACCCTCT) and cIAP1-AS
(GGGTCATCTCCGGGTTCCCAAC). The Bax primers used were Bax-S
(AGGGTTTCATCCAGGATCGAGCAG) and Bax-AS
(ATCTTCTTCCAGATGGTGAGCGAG). β-actin primers actin-S
(GGGAATTCAAAACTGGAACGGTGAAGG) and actin-AS
(GGAAGCTTATCAAAGTCCTCGGCCACA) were used as an internal control. PCR
was performed for 35 cycles of 94ºC for 1 m, 65ºC for 1m, and 72ºC for 2 m. Actin
primers were added after cycle 19. The amplified products were then separated by
32
electrophoresis on a 10% polyacrylamide gel, stained with 1x SYBR Green (Lonza,
Rockland, ME), and photographed with the Kodak EDAS 120 Digital Analysis System.
Apoptosis Induction and Quantification
Cells were treated with 1µM STS (Alexis Biochemicals, San Diego, CA), 25 µM
CP (CP)(Sigma), or 25 µM carboplatinum (CB)(Sigma) and incubated as indicated in the
results. Cellular death was determined via trypan blue exclusion assay as previously
described [160]. To ensure that any detached cells were included in the assay all
conditioned media, PBS-wash samples, and trypsinized cell samples were pooled prior to
centrifugation. Cells were pelleted by centrifuging at 1000 x g for 5 minutes and pellets
were washed with PBS. Cells were then centrifuged again for 5 minutes and the cell
pellets were resuspended in 1 ml of PBS. Aliquots of 100 μl were transferred to 1.5 ml
tubes and mixed with 100 μl of 0.4% Trypan blue stain (Gibco BRL). Samples of the
Trypan blue stained cells were counted in quadruplet using a hemocytometer and
classified as dead (blue/black in appearance) or alive (clear/refractile in appearance).
The cell suspensions were also subjected to western blot analysis. Protein
samples were lysed in CHAPS buffer and 15 μg of protein was separated via 10% SDS-
PAGE. Proteins were transferred to PVDF membranes and blocked in 5% milk in Tween
20-TBS. Blots were incubated in their respective antibodies overnight and developed via
enhanced chemiluminescence (ECL) (Amersham). Cleaved-caspase 3, caspase 3, DFF45,
XIAP, cIAP1, cIAP2, survivin, Bax, Akt, and phospho-Akt antibodies were purchased
from Cell Signaling Technology (Beverly, MA). FLAG and β-actin antibodies were
purchased from Sigma (St. Louis, MO).
33
Cell viability was also measured by the CellTiter 96® AQueous One Solution Cell
Proliferation MTS (Promega, Madison, WI) colorimetric assay. The assay was performed
in 96 well microtiter plates according to manufacturer's instructions and is based on
soluble formazan production by dehydrogenase enzymes. Absorbance was determined at
490 nm using an ELx800 microplate reader (Bio-Tek Instruments, Winooski, VT) and the
results expressed as the mean absorbance ± SE.
Caspase 3 activation was confirmed and quantified via the Quantikine Active
Caspase 3 ELISA Kit performed as previously described [89] and according to
manufacturer’s instructions (R&D Systems, Minneapolis, MN). The results are
expressed as the mean absorbance ± SE.
Cell death was also measured via flow cytometry. Cells were treated with 1 µM
STS and incubated as indicated in the results. To ensure that any detached cells were
included in the assay all conditioned media, PBS-wash samples, and trypsinized cell
samples were pooled prior to centrifugation. Cells were pelleted by centrifuging at 1000
x g for 5 minutes and pellets were washed with PBS. Cells were then centrifuged again
for 5 minutes and the cell pellets were resuspended in 250 µl of PBS. Ten microliters of
propidium iodide (PI) were added to each sample and the samples were analyzed on a
FACS Canto II Flow Cytometry System. Cells staining positive for PI are considered
dead and negative staining cells are considered alive.

34
Statistical Analysis
Where applicable, the data were subjected to paired Student's t test analysis to
determine statistical differences between control and treated samples. The results are
reported as a P value within the respective figures.
35
Results
Detection of BRAt mRNA and nuclear localization of BRAt protein
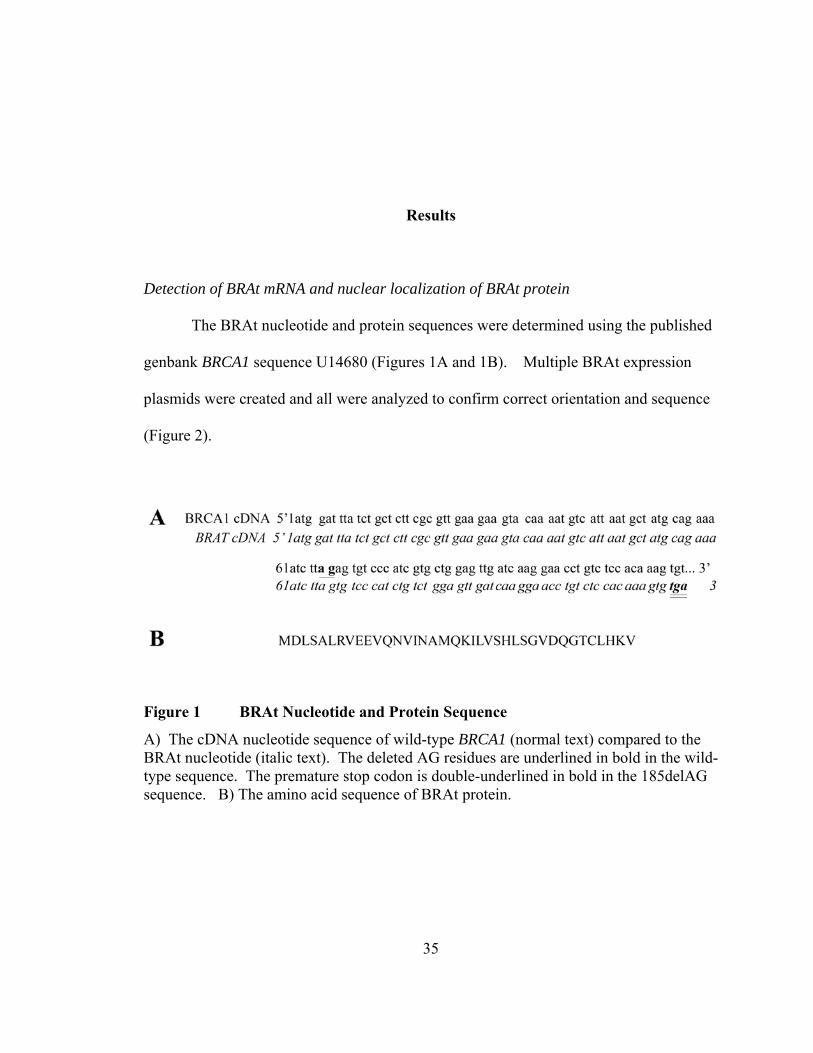
The BRAt nucleotide and protein sequences were determined using the published
genbank BRCA1 sequence U14680 (Figures 1A and 1B). Multiple BRAt expression
plasmids were created and all were analyzed to confirm correct orientation and sequence
(Figure 2).
Figure 1 BRAt Nucleotide and Protein Sequence
A) The cDNA nucleotide sequence of wild-type BRCA1 (normal text) compared to the BRAt nucleotide (italic text). The deleted AG residues are underlined in bold in the wild-type sequence. The premature stop codon is double-underlined in bold in the 185delAG sequence. B) The amino acid sequence of BRAt protein.
36
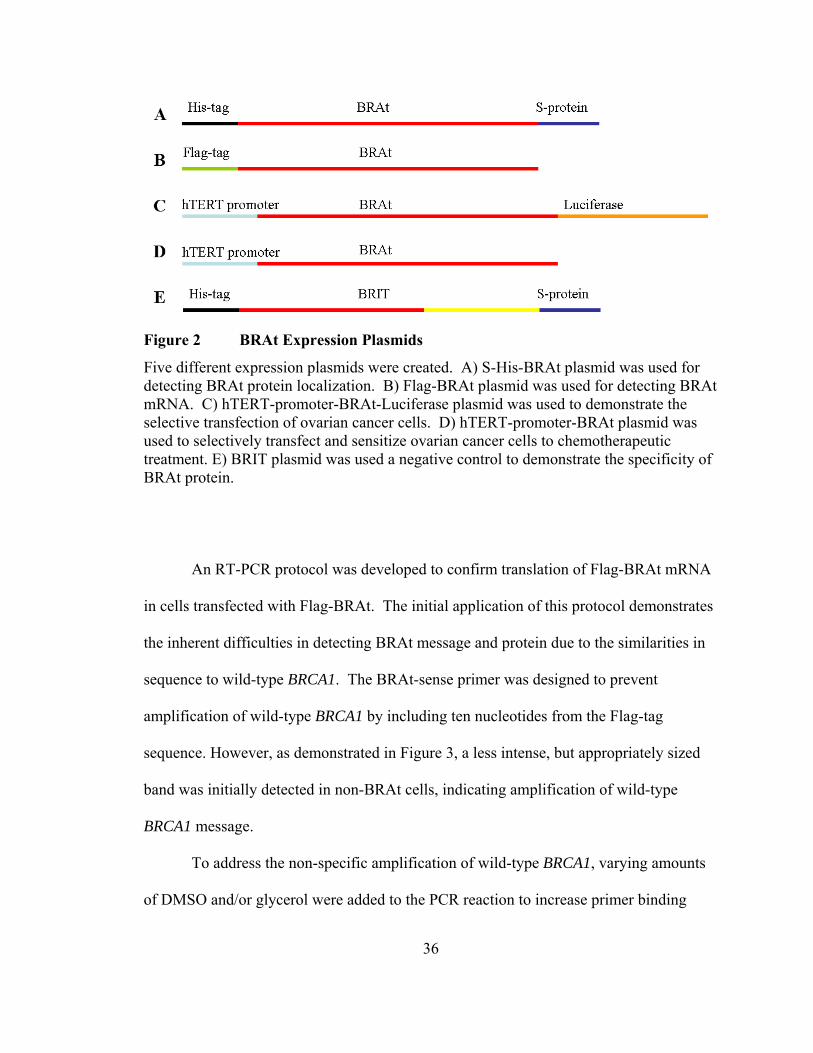
Figure 2 BRAt Expression Plasmids
Five different expression plasmids were created. A) S-His-BRAt plasmid was used for detecting BRAt protein localization. B) Flag-BRAt plasmid was used for detecting BRAt mRNA. C) hTERT-promoter-BRAt-Luciferase plasmid was used to demonstrate the selective transfection of ovarian cancer cells. D) hTERT-promoter-BRAt plasmid was used to selectively transfect and sensitize ovarian cancer cells to chemotherapeutic treatment. E) BRIT plasmid was used a negative control to demonstrate the specificity of BRAt protein.
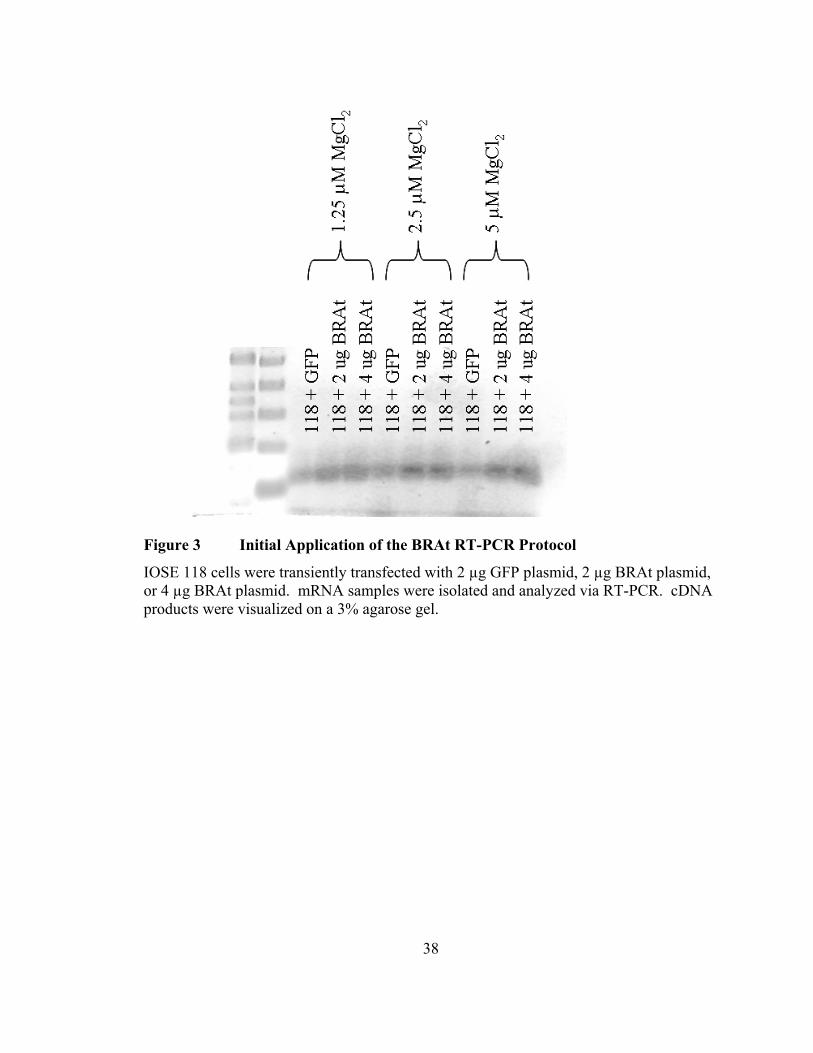
An RT-PCR protocol was developed to confirm translation of Flag-BRAt mRNA
in cells transfected with Flag-BRAt. The initial application of this protocol demonstrates
the inherent difficulties in detecting BRAt message and protein due to the similarities in
sequence to wild-type BRCA1. The BRAt-sense primer was designed to prevent
amplification of wild-type BRCA1 by including ten nucleotides from the Flag-tag
sequence. However, as demonstrated in Figure 3, a less intense, but appropriately sized
band was initially detected in non-BRAt cells, indicating amplification of wild-type
BRCA1 message.
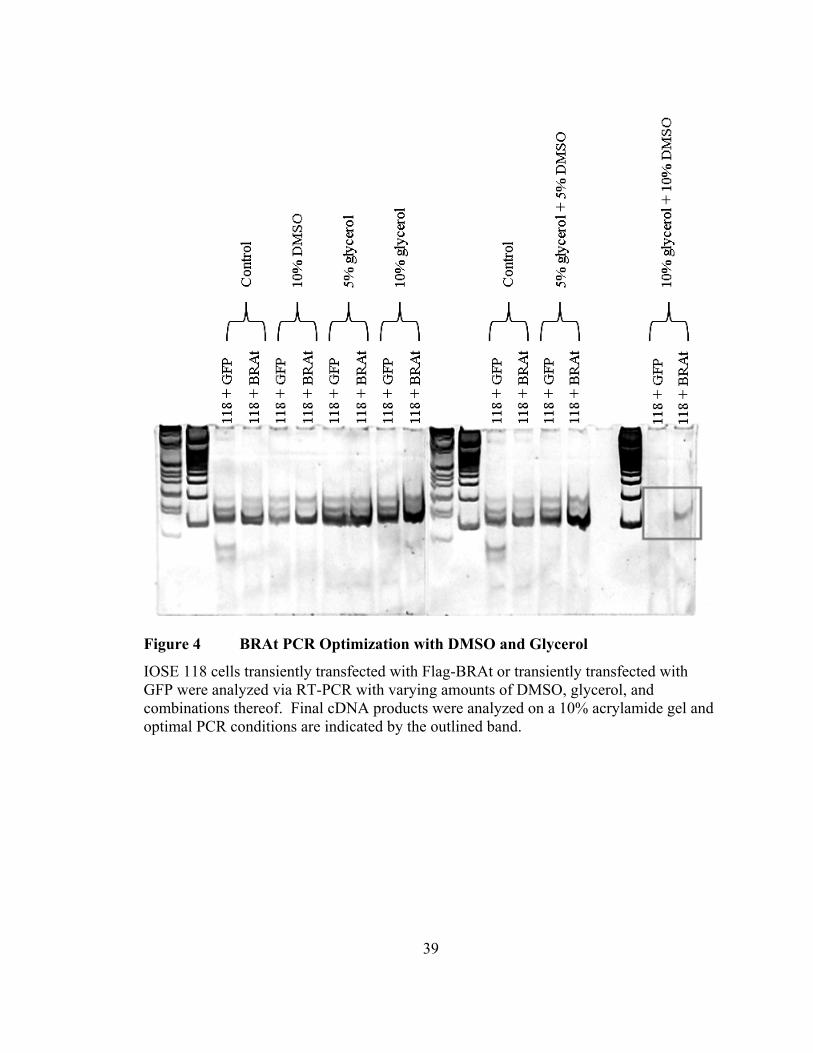
To address the non-specific amplification of wild-type BRCA1, varying amounts
of DMSO and/or glycerol were added to the PCR reaction to increase primer binding
37
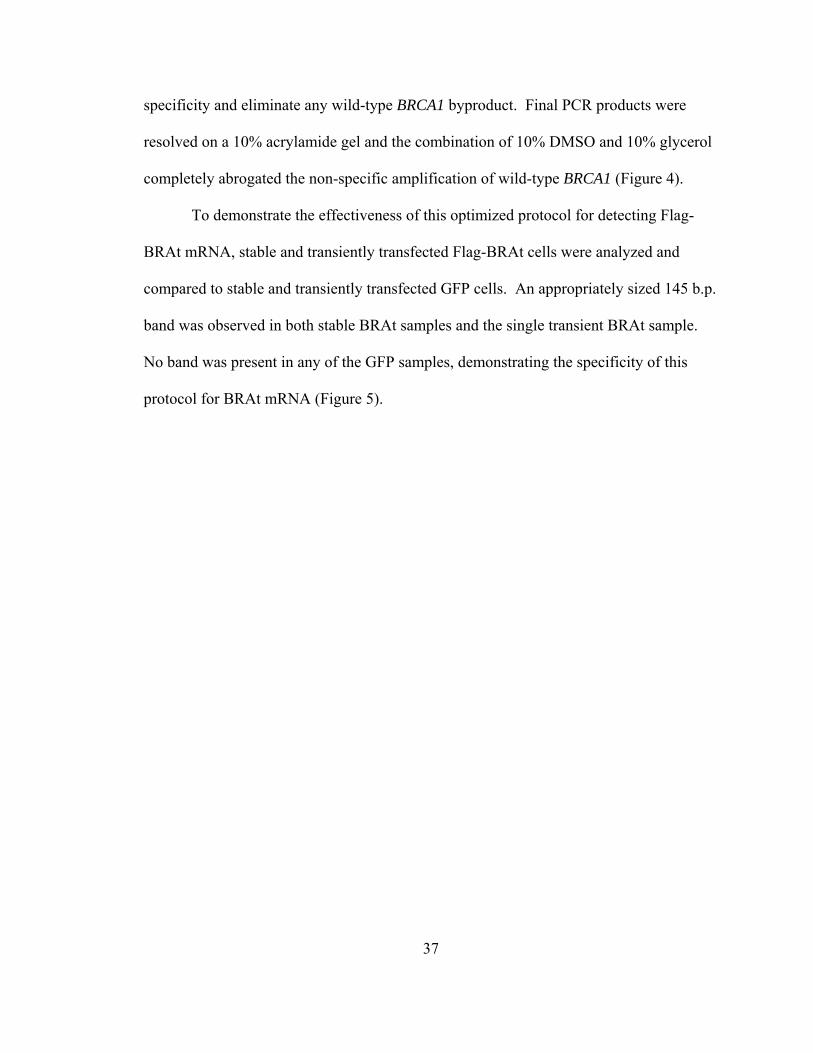
specificity and eliminate any wild-type BRCA1 byproduct. Final PCR products were
resolved on a 10% acrylamide gel and the combination of 10% DMSO and 10% glycerol
completely abrogated the non-specific amplification of wild-type BRCA1 (Figure 4).
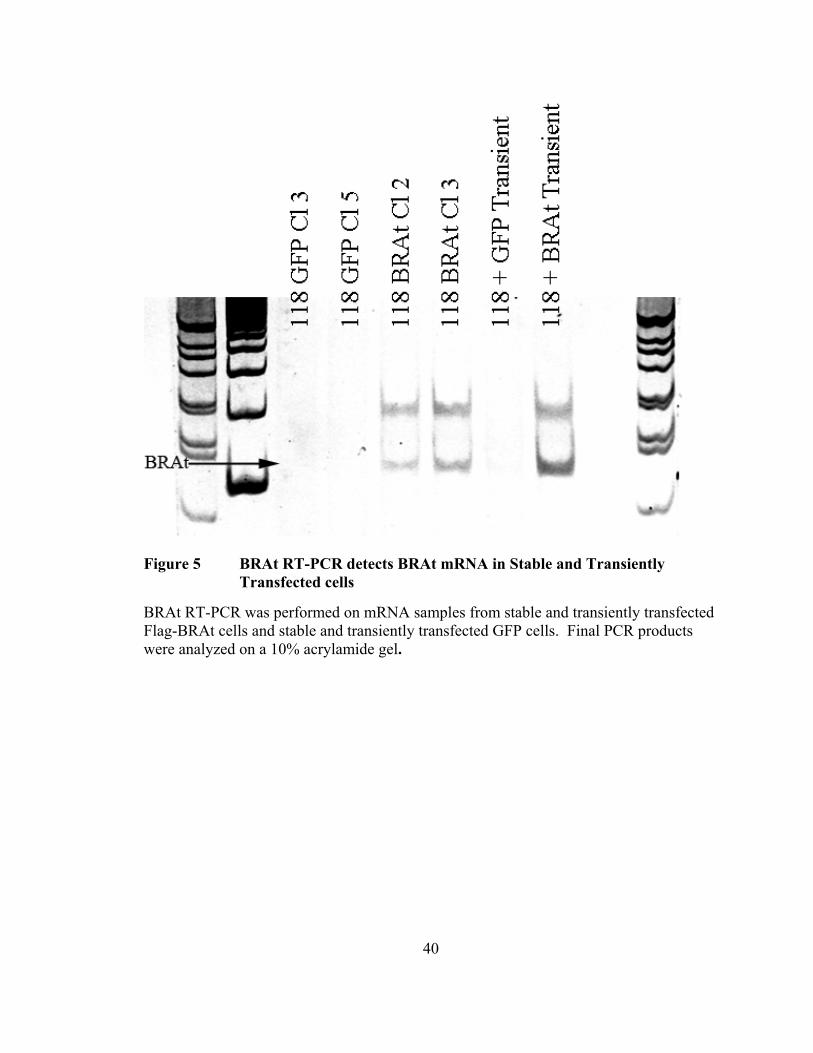
To demonstrate the effectiveness of this optimized protocol for detecting Flag-
BRAt mRNA, stable and transiently transfected Flag-BRAt cells were analyzed and
compared to stable and transiently transfected GFP cells. An appropriately sized 145 b.p.
band was observed in both stable BRAt samples and the single transient BRAt sample.
No band was present in any of the GFP samples, demonstrating the specificity of this
protocol for BRAt mRNA (Figure 5).
38
Figure 3 Initial Application of the BRAt RT-PCR Protocol
IOSE 118 cells were transiently transfected with 2 µg GFP plasmid, 2 µg BRAt plasmid, or 4 µg BRAt plasmid. mRNA samples were isolated and analyzed via RT-PCR. cDNA products were visualized on a 3% agarose gel.
39
Figure 4 BRAt PCR Optimization with DMSO and Glycerol
IOSE 118 cells transiently transfected with Flag-BRAt or transiently transfected with GFP were analyzed via RT-PCR with varying amounts of DMSO, glycerol, and combinations thereof. Final cDNA products were analyzed on a 10% acrylamide gel and optimal PCR conditions are indicated by the outlined band.
40
Figure 5 BRAt RT-PCR detects BRAt mRNA in Stable and Transiently Transfected cells
BRAt RT-PCR was performed on mRNA samples from stable and transiently transfected Flag-BRAt cells and stable and transiently transfected GFP cells. Final PCR products were analyzed on a 10% acrylamide gel.
41
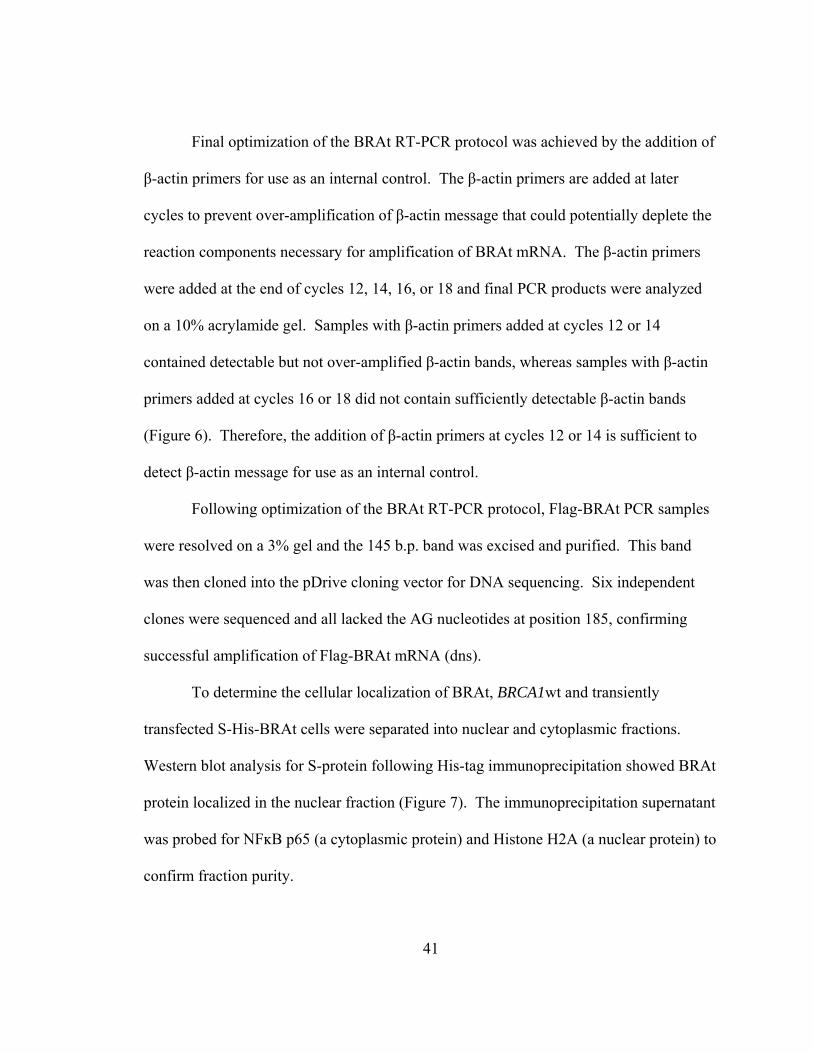
Final optimization of the BRAt RT-PCR protocol was achieved by the addition of
β-actin primers for use as an internal control. The β-actin primers are added at later
cycles to prevent over-amplification of β-actin message that could potentially deplete the
reaction components necessary for amplification of BRAt mRNA. The β-actin primers
were added at the end of cycles 12, 14, 16, or 18 and final PCR products were analyzed
on a 10% acrylamide gel. Samples with β-actin primers added at cycles 12 or 14
contained detectable but not over-amplified β-actin bands, whereas samples with β-actin
primers added at cycles 16 or 18 did not contain sufficiently detectable β-actin bands
(Figure 6). Therefore, the addition of β-actin primers at cycles 12 or 14 is sufficient to
detect β-actin message for use as an internal control.
Following optimization of the BRAt RT-PCR protocol, Flag-BRAt PCR samples
were resolved on a 3% gel and the 145 b.p. band was excised and purified. This band
was then cloned into the pDrive cloning vector for DNA sequencing. Six independent
clones were sequenced and all lacked the AG nucleotides at position 185, confirming
successful amplification of Flag-BRAt mRNA (dns).
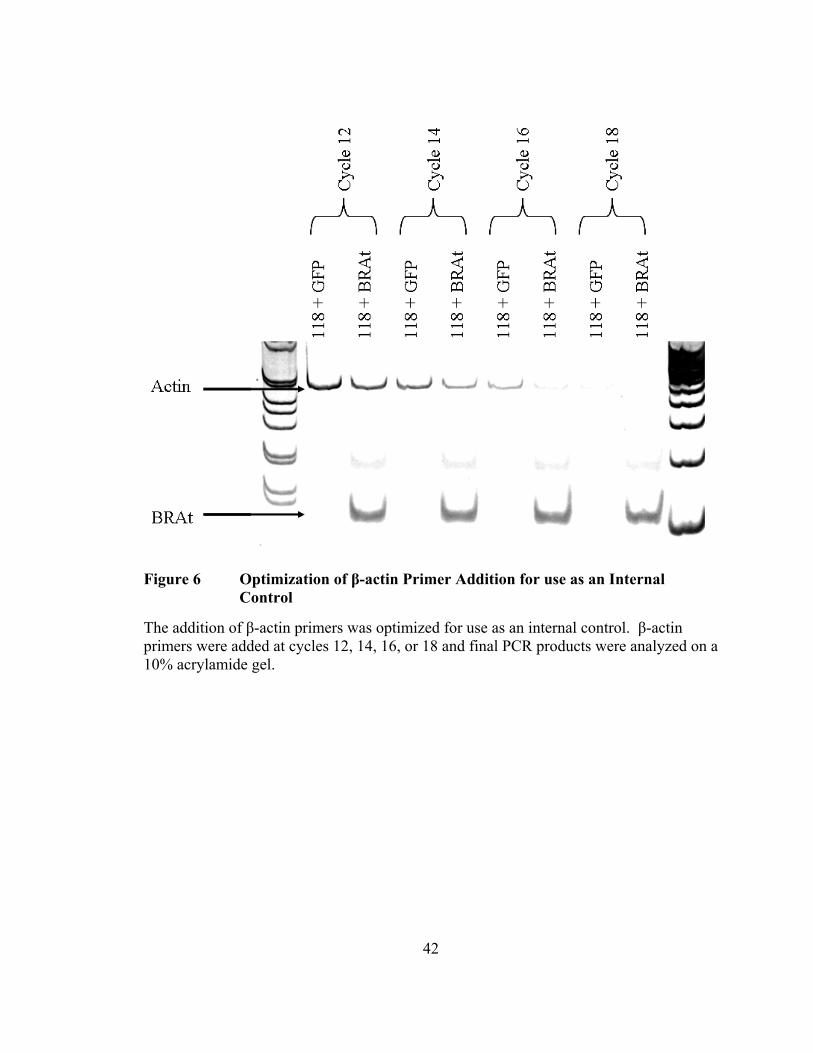
To determine the cellular localization of BRAt, BRCA1wt and transiently
transfected S-His-BRAt cells were separated into nuclear and cytoplasmic fractions.
Western blot analysis for S-protein following His-tag immunoprecipitation showed BRAt
protein localized in the nuclear fraction (Figure 7). The immunoprecipitation supernatant
was probed for NFĸB p65 (a cytoplasmic protein) and Histone H2A (a nuclear protein) to
confirm fraction purity.
42
Figure 6 Optimization of β-actin Primer Addition for use as an Internal Control
The addition of β-actin primers was optimized for use as an internal control. β-actin primers were added at cycles 12, 14, 16, or 18 and final PCR products were analyzed on a 10% acrylamide gel.
43
Figure 7 Localization of BRAt Protein
BRCA1wt and transiently transfected S-His BRAt cells were lysed and separated into nuclear (nuc) and cytoplasmic (cyt) fractions. The BRAt 6X-His tag was immunoprecipitated from the fractionated samples. IP reaction and supernatant were analyzed via SDS-PAGE. IP reaction was probed for biotinylated S-protein and supernatant was probed for NFĸB p65 and Histone H2A to ensure fraction purity.
44
BRAt does not alter IOSE morphology or induce tumorigenesis
We next sought to determine whether BRAt altered the growth, morphology,
and/or tumorigenesis of human IOSE cells. BRAt cells maintained equal expression of
cytokeratin and vimentin (Figure 8A), two intermediate filaments characteristic of
ovarian surface epithelial cells [169, 173]. Further, BRAt cells retained the approximate
size and morphology of the BRCA1wt cells (Figure 8A). In addition, BRAt cells showed
the same growth pattern as BRCA1wt in the initial passages after transfection and BRAt
expression did not alter endogenous levels of full length BRCA1 (dns).
Transfection with BRAt did not cause tumorigenesis in BRCA1wt cells (Figure
8B). Soft agar cultures stained with crystal violet showed colonies only in dishes seeded
with MCF7 cells, a breast cancer carcinoma cell line known to be tumorigenic [170]. No
colonies formed in BRCA1wt or BRAt dishes. To confirm that BRAt transfection did not
cause BRCA1wt cells to become tumorigenic, we assayed all three cell lines for
telomerase, an enzyme not found in normal adult tissue, but active in almost 90% of all
tumors [174]. BRCA1wt and BRAt cells did not express telomerase levels above assay
background levels, whereas MCF7 levels were 2-fold higher (Figure 8C). Taken
together, these results suggest BRAt expression does not alter ovarian surface epithelial
morphology, growth, or tumorigenic capability.
45
Figure 8 BRAt does not alter IOSE morphology or tumorigenicity
A) BRCA1wt and stable S-His BRAt cells were grown on coverslips, fixed and immunostained for cytokeratin or vimentin at 200X magnification. B) MCF7, BRCA1wt, and stable S-His BRAt cells were grown in soft agar for 14 days and stained with crystal violet to visualize colonies. C) Parallel cultures of (B) were collected, lysed, and probed for telomerase levels via PCR-ELISA. Results are expressed as the average absorption from triplicate samples at 495nm ± SE.
46
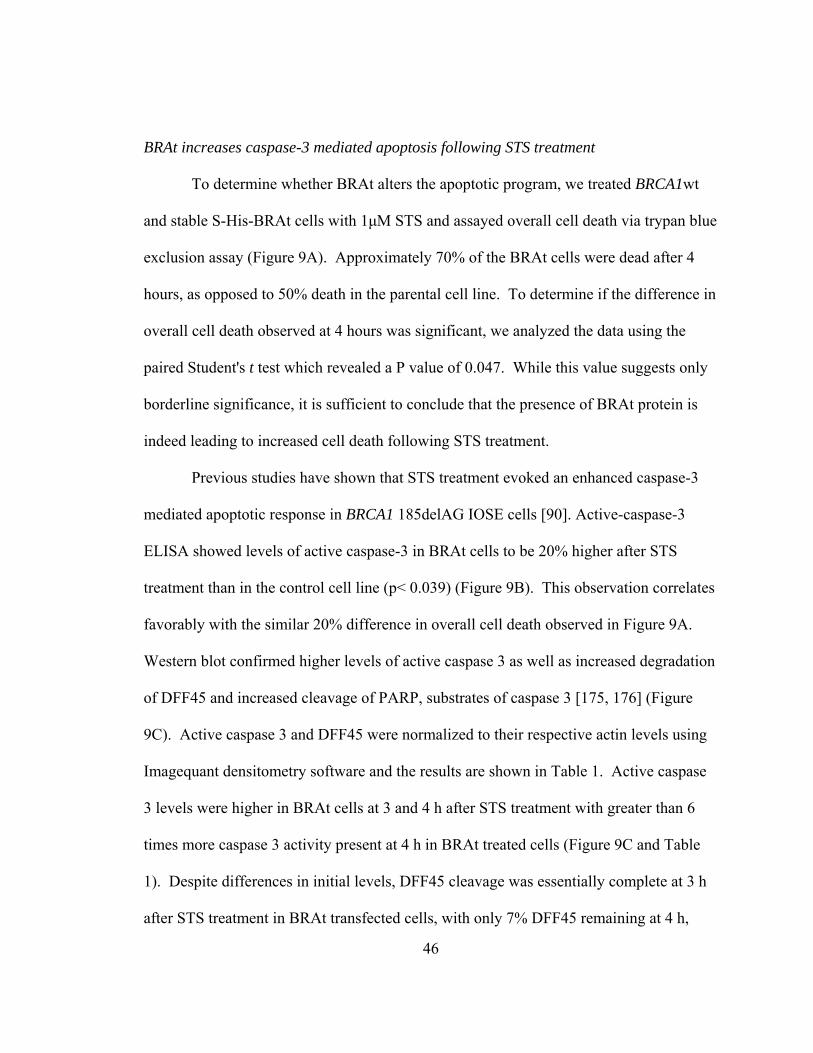
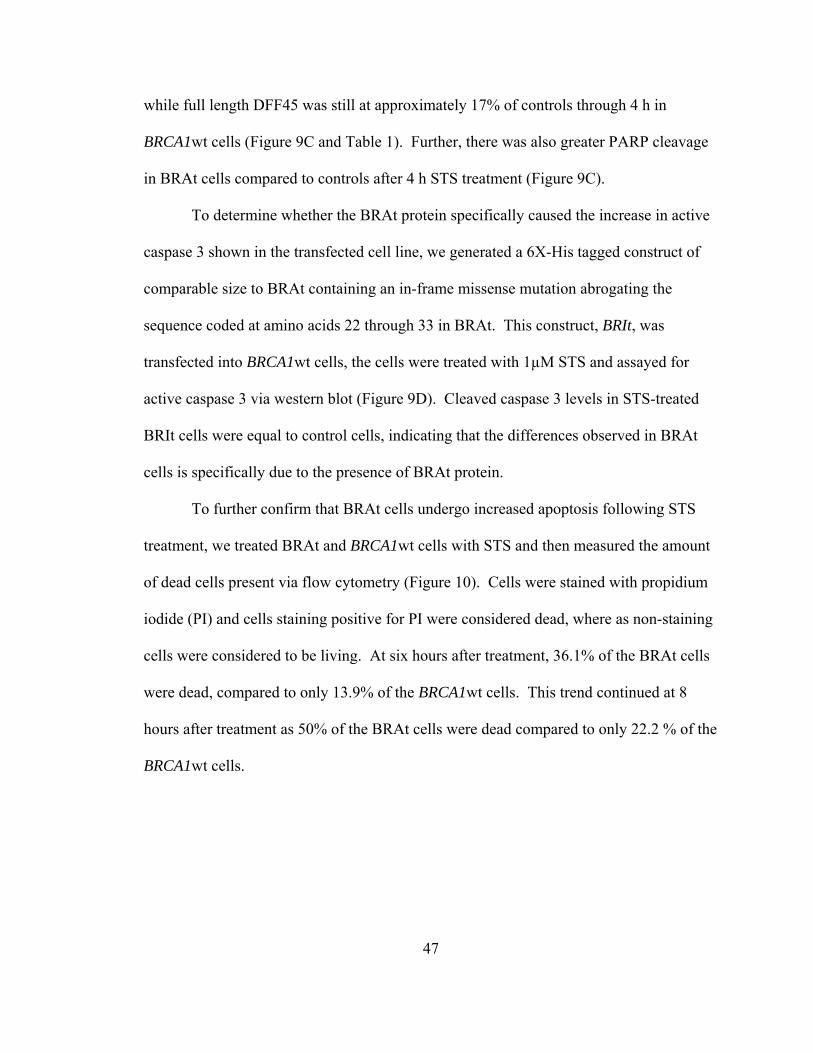
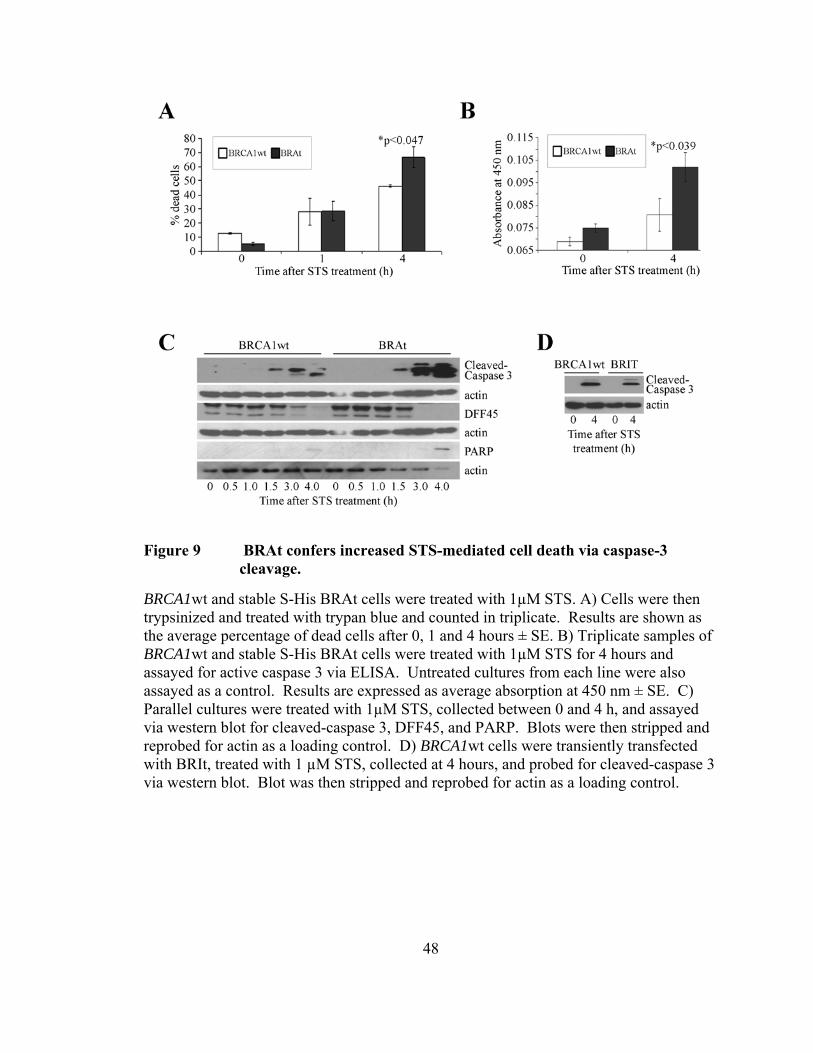
BRAt increases caspase-3 mediated apoptosis following STS treatment
To determine whether BRAt alters the apoptotic program, we treated BRCA1wt
and stable S-His-BRAt cells with 1μM STS and assayed overall cell death via trypan blue
exclusion assay (Figure 9A). Approximately 70% of the BRAt cells were dead after 4
hours, as opposed to 50% death in the parental cell line. To determine if the difference in
overall cell death observed at 4 hours was significant, we analyzed the data using the
paired Student's t test which revealed a P value of 0.047. While this value suggests only
borderline significance, it is sufficient to conclude that the presence of BRAt protein is
indeed leading to increased cell death following STS treatment.
Previous studies have shown that STS treatment evoked an enhanced caspase-3
mediated apoptotic response in BRCA1 185delAG IOSE cells [90]. Active-caspase-3
ELISA showed levels of active caspase-3 in BRAt cells to be 20% higher after STS
treatment than in the control cell line (p< 0.039) (Figure 9B). This observation correlates
favorably with the similar 20% difference in overall cell death observed in Figure 9A.
Western blot confirmed higher levels of active caspase 3 as well as increased degradation
of DFF45 and increased cleavage of PARP, substrates of caspase 3 [175, 176] (Figure
9C). Active caspase 3 and DFF45 were normalized to their respective actin levels using
Imagequant densitometry software and the results are shown in Table 1. Active caspase
3 levels were higher in BRAt cells at 3 and 4 h after STS treatment with greater than 6
times more caspase 3 activity present at 4 h in BRAt treated cells (Figure 9C and Table
1). Despite differences in initial levels, DFF45 cleavage was essentially complete at 3 h
after STS treatment in BRAt transfected cells, with only 7% DFF45 remaining at 4 h,
47
while full length DFF45 was still at approximately 17% of controls through 4 h in
BRCA1wt cells (Figure 9C and Table 1). Further, there was also greater PARP cleavage
in BRAt cells compared to controls after 4 h STS treatment (Figure 9C).
To determine whether the BRAt protein specifically caused the increase in active
caspase 3 shown in the transfected cell line, we generated a 6X-His tagged construct of
comparable size to BRAt containing an in-frame missense mutation abrogating the
sequence coded at amino acids 22 through 33 in BRAt. This construct, BRIt, was
transfected into BRCA1wt cells, the cells were treated with 1µM STS and assayed for
active caspase 3 via western blot (Figure 9D). Cleaved caspase 3 levels in STS-treated
BRIt cells were equal to control cells, indicating that the differences observed in BRAt
cells is specifically due to the presence of BRAt protein.
To further confirm that BRAt cells undergo increased apoptosis following STS
treatment, we treated BRAt and BRCA1wt cells with STS and then measured the amount
of dead cells present via flow cytometry (Figure 10). Cells were stained with propidium
iodide (PI) and cells staining positive for PI were considered dead, where as non-staining
cells were considered to be living. At six hours after treatment, 36.1% of the BRAt cells
were dead, compared to only 13.9% of the BRCA1wt cells. This trend continued at 8
hours after treatment as 50% of the BRAt cells were dead compared to only 22.2 % of the
BRCA1wt cells.
48
Figure 9 BRAt confers increased STS-mediated cell death via caspase-3 cleavage.
BRCA1wt and stable S-His BRAt cells were treated with 1µM STS. A) Cells were then trypsinized and treated with trypan blue and counted in triplicate. Results are shown as the average percentage of dead cells after 0, 1 and 4 hours ± SE. B) Triplicate samples of BRCA1wt and stable S-His BRAt cells were treated with 1µM STS for 4 hours and assayed for active caspase 3 via ELISA. Untreated cultures from each line were also assayed as a control. Results are expressed as average absorption at 450 nm ± SE. C) Parallel cultures were treated with 1µM STS, collected between 0 and 4 h, and assayed via western blot for cleaved-caspase 3, DFF45, and PARP. Blots were then stripped and reprobed for actin as a loading control. D) BRCA1wt cells were transiently transfected with BRIt, treated with 1 µM STS, collected at 4 hours, and probed for cleaved-caspase 3 via western blot. Blot was then stripped and reprobed for actin as a loading control.
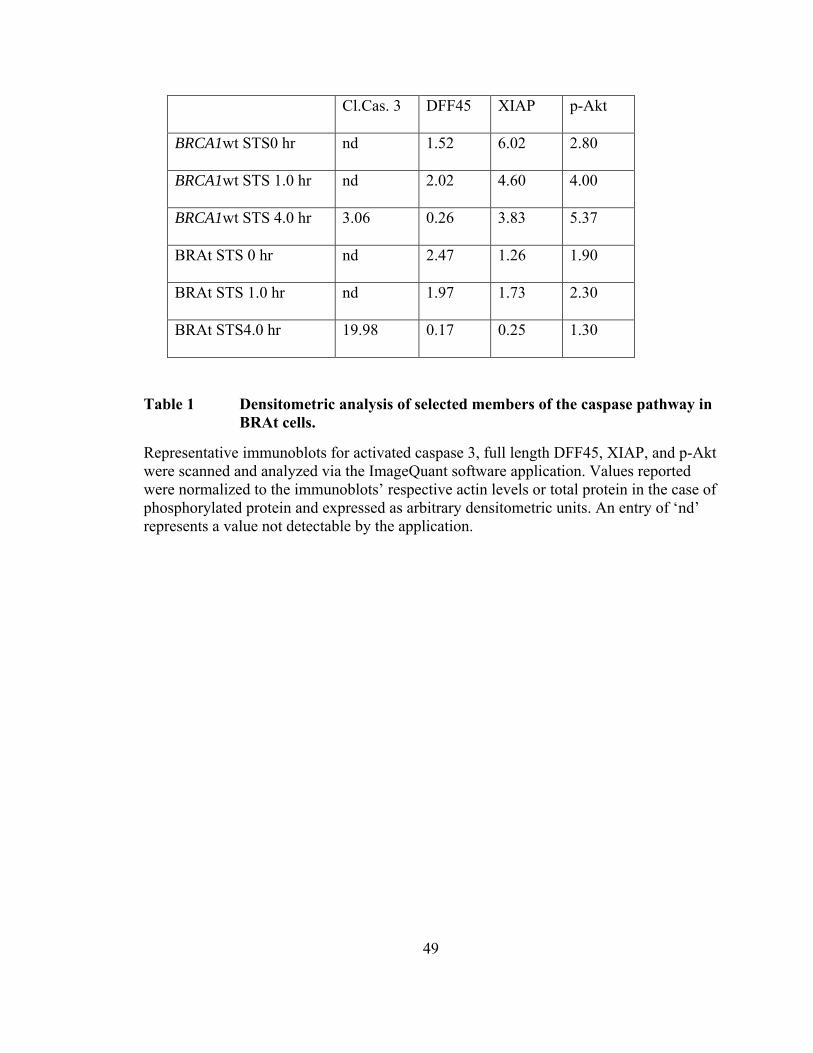
49
Cl.Cas. 3 DFF45 XIAP p-Akt
BRCA1wt STS0 hr nd 1.52 6.02 2.80
BRCA1wt STS 1.0 hr nd 2.02 4.60 4.00
BRCA1wt STS 4.0 hr 3.06 0.26 3.83 5.37
BRAt STS 0 hr nd 2.47 1.26 1.90
BRAt STS 1.0 hr nd 1.97 1.73 2.30
BRAt STS4.0 hr 19.98 0.17 0.25 1.30
Table 1 Densitometric analysis of selected members of the caspase pathway in BRAt cells.
Representative immunoblots for activated caspase 3, full length DFF45, XIAP, and p-Akt were scanned and analyzed via the ImageQuant software application. Values reported were normalized to the immunoblots’ respective actin levels or total protein in the case of phosphorylated protein and expressed as arbitrary densitometric units. An entry of ‘nd’ represents a value not detectable by the application.
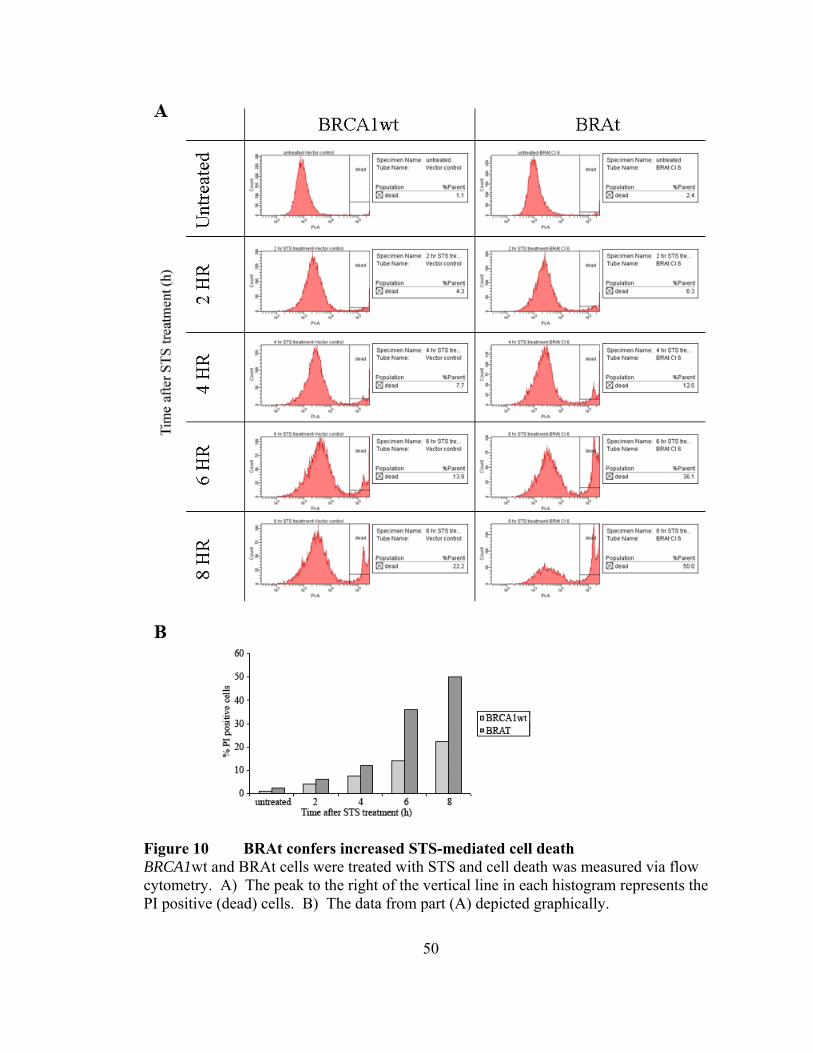
50
Figure 10 BRAt confers increased STS-mediated cell death BRCA1wt and BRAt cells were treated with STS and cell death was measured via flow cytometry. A) The peak to the right of the vertical line in each histogram represents the PI positive (dead) cells. B) The data from part (A) depicted graphically.
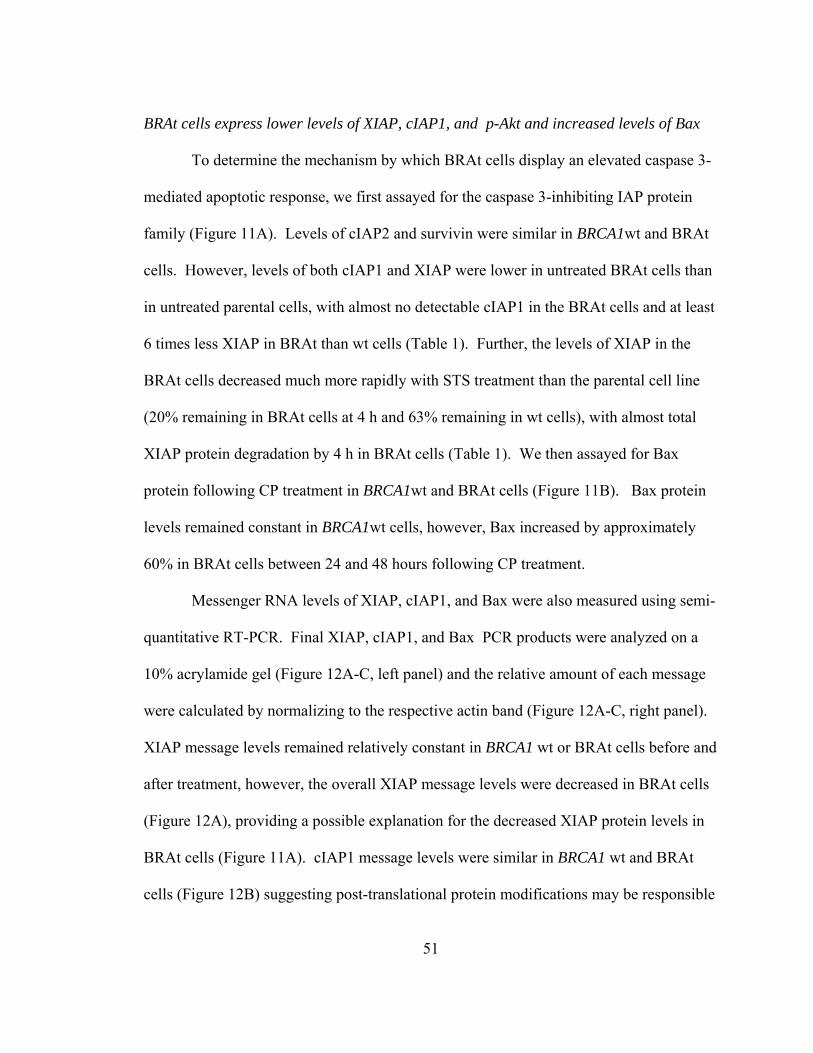
51
BRAt cells express lower levels of XIAP, cIAP1, and p-Akt and increased levels of Bax
To determine the mechanism by which BRAt cells display an elevated caspase 3-
mediated apoptotic response, we first assayed for the caspase 3-inhibiting IAP protein
family (Figure 11A). Levels of cIAP2 and survivin were similar in BRCA1wt and BRAt
cells. However, levels of both cIAP1 and XIAP were lower in untreated BRAt cells than
in untreated parental cells, with almost no detectable cIAP1 in the BRAt cells and at least
6 times less XIAP in BRAt than wt cells (Table 1). Further, the levels of XIAP in the
BRAt cells decreased much more rapidly with STS treatment than the parental cell line
(20% remaining in BRAt cells at 4 h and 63% remaining in wt cells), with almost total
XIAP protein degradation by 4 h in BRAt cells (Table 1). We then assayed for Bax
protein following CP treatment in BRCA1wt and BRAt cells (Figure 11B). Bax protein
levels remained constant in BRCA1wt cells, however, Bax increased by approximately
60% in BRAt cells between 24 and 48 hours following CP treatment.
Messenger RNA levels of XIAP, cIAP1, and Bax were also measured using semi-
quantitative RT-PCR. Final XIAP, cIAP1, and Bax PCR products were analyzed on a
10% acrylamide gel (Figure 12A-C, left panel) and the relative amount of each message
were calculated by normalizing to the respective actin band (Figure 12A-C, right panel).
XIAP message levels remained relatively constant in BRCA1 wt or BRAt cells before and
after treatment, however, the overall XIAP message levels were decreased in BRAt cells
(Figure 12A), providing a possible explanation for the decreased XIAP protein levels in
BRAt cells (Figure 11A). cIAP1 message levels were similar in BRCA1 wt and BRAt
cells (Figure 12B) suggesting post-translational protein modifications may be responsible

52
for the decreased cIAP1 protein levels (Figure 11A). Bax mRNA levels increased in both
BRCA1wt and BRAt cells following STS treatment, however, the increase in BRAt cells
was much more dramatic (Figure 12C).
Since XIAP stability is due, in large part, to its phosphorylation by Akt, we
examined Akt activation in BRCA1 wt vs. BRAt cells (Figure 13A). There was
approximately 30% less p-Akt in resting BRAt cells (Table 1) with no appreciable
change in total Akt protein. While STS treatment doubled p-Akt levels in wt cells, it did
not significantly affect p-Akt levels in BRAt cells (Figure 13B and Table 1).
To determine the extent to which the Akt pathway was responsible for BRAt-
mediated caspase 3 elevation, constitutively active Akt (AA) was transfected into BRAt
cells which were then treated with STS and caspase 3 activation was measured via
western blot (Figure 13B). AA-transfected BRAt cells showed a dramatic decrease in
caspase 3 activation following STS treatment, suggesting that Akt plays a pivotal role in
BRAt-mediated caspase-3 activation.
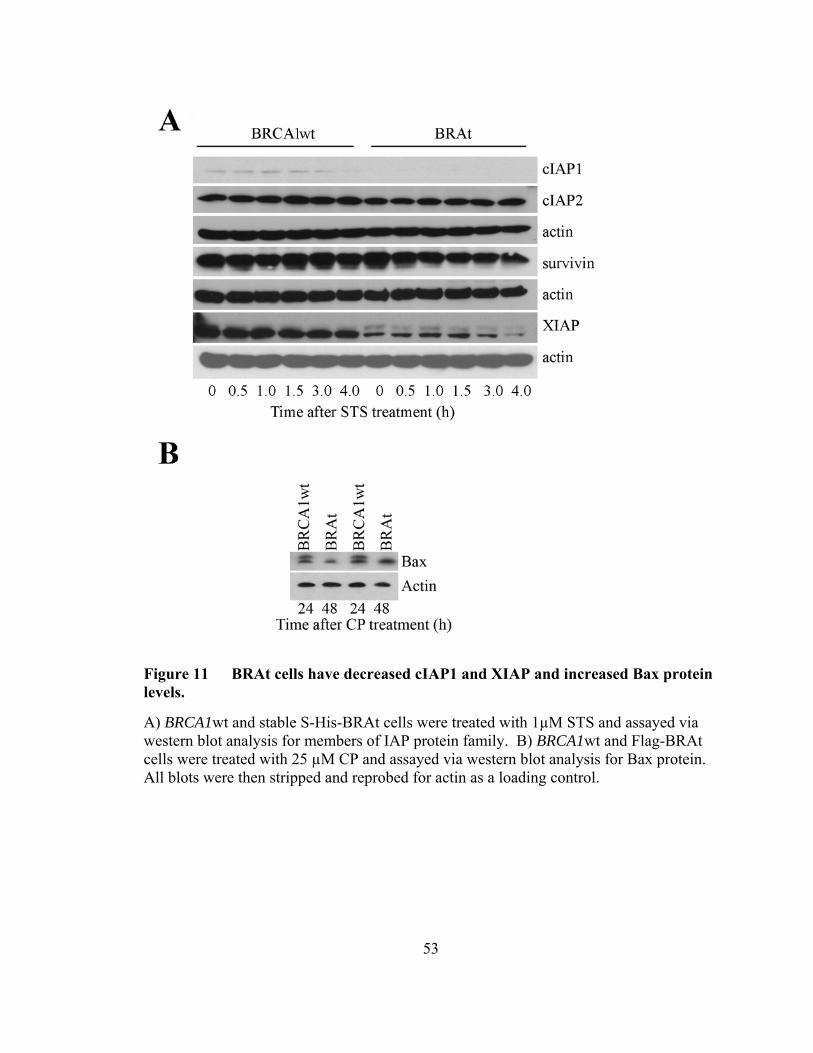
53
Figure 11 BRAt cells have decreased cIAP1 and XIAP and increased Bax protein levels.
A) BRCA1wt and stable S-His-BRAt cells were treated with 1µM STS and assayed via western blot analysis for members of IAP protein family. B) BRCA1wt and Flag-BRAt cells were treated with 25 µM CP and assayed via western blot analysis for Bax protein. All blots were then stripped and reprobed for actin as a loading control.
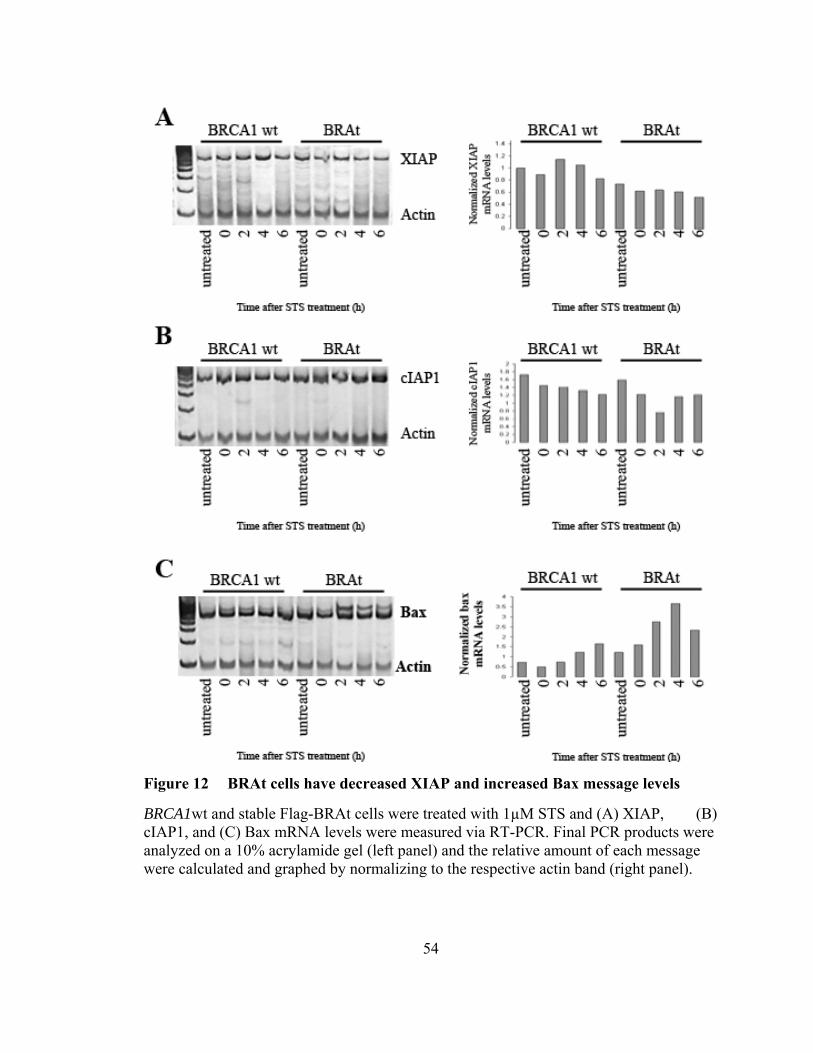
54
Figure 12 BRAt cells have decreased XIAP and increased Bax message levels
BRCA1wt and stable Flag-BRAt cells were treated with 1µM STS and (A) XIAP, (B) cIAP1, and (C) Bax mRNA levels were measured via RT-PCR. Final PCR products were analyzed on a 10% acrylamide gel (left panel) and the relative amount of each message were calculated and graphed by normalizing to the respective actin band (right panel).
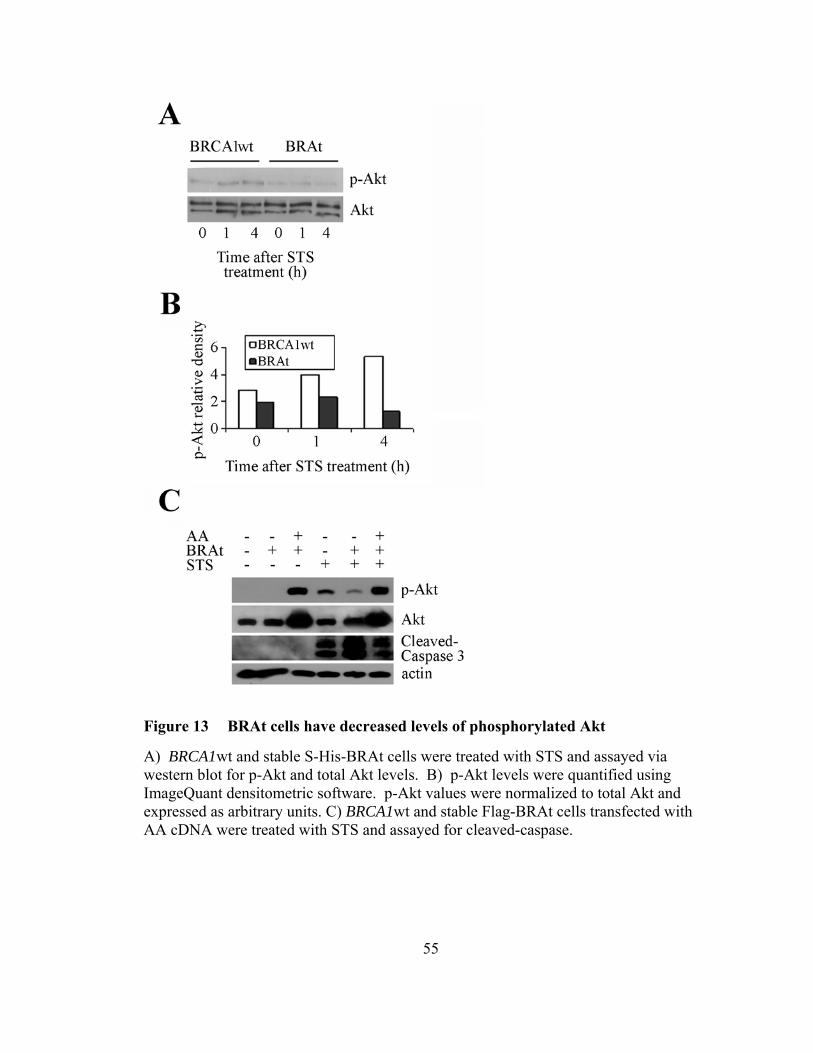
55
Figure 13 BRAt cells have decreased levels of phosphorylated Akt
A) BRCA1wt and stable S-His-BRAt cells were treated with STS and assayed via western blot for p-Akt and total Akt levels. B) p-Akt levels were quantified using ImageQuant densitometric software. p-Akt values were normalized to total Akt and expressed as arbitrary units. C) BRCA1wt and stable Flag-BRAt cells transfected with AA cDNA were treated with STS and assayed for cleaved-caspase.
56
hTERT-BRAt can selectively increase apoptosis in cancer cells
To determine if BRAt protein was sufficient to increase the apoptotic response in
drug-resistant ovarian cancer cells, we stably transfected S-His-BRAt into CP-resistant
C13 ovarian cancer cells and treated with 1 µM STS. In agreement with previous data
(Figures 9 and 10) C13-BRAt cells showed a 30% increase in cell death 24 hours after
treatment (Figure 14A).
To further explore BRAt’s ability to increase apoptosis in cancer cells, we
developed two BRAt expression plasmids operated by the hTERT gene promoter. The
cancer cell specific expression of telomerase makes the hTERT gene promoter an
attractive target for therapeutic intervention. Using this approach, it has been
demonstrated previously that telomerase-negative cells transfected with plasmids
encoding genes that are operated by the hTERT promoter do not recognize this promoter
and, therefore, do not produce the target protein [168]. In contrast, telomerase-positive
cancer cells drive hTERT promoter constructs and the encoded protein is produced as a
result. To determine if hTERT-BRAt constructs were sufficient to selectively transfect
cancer cells, we transfected the hTERT-BRAt-luc plasmid into primary cultures of
ovarian surface epithelial cells derived from adenomas and human dermal fibroblasts as
well as C13 ovarian cancer cells and measured their luciferase activity. The primary
adenoma and human dermal fibroblasts did not display any luciferase activity, whereas
the C13 ovarian cancer cells displayed high levels of luciferase activity following
hTERT-BRAt-luc transfection (Figure 14B). This indicated that hTERT-driven plasmids
were sufficient to selectively express BRAt protein in cancer cells.
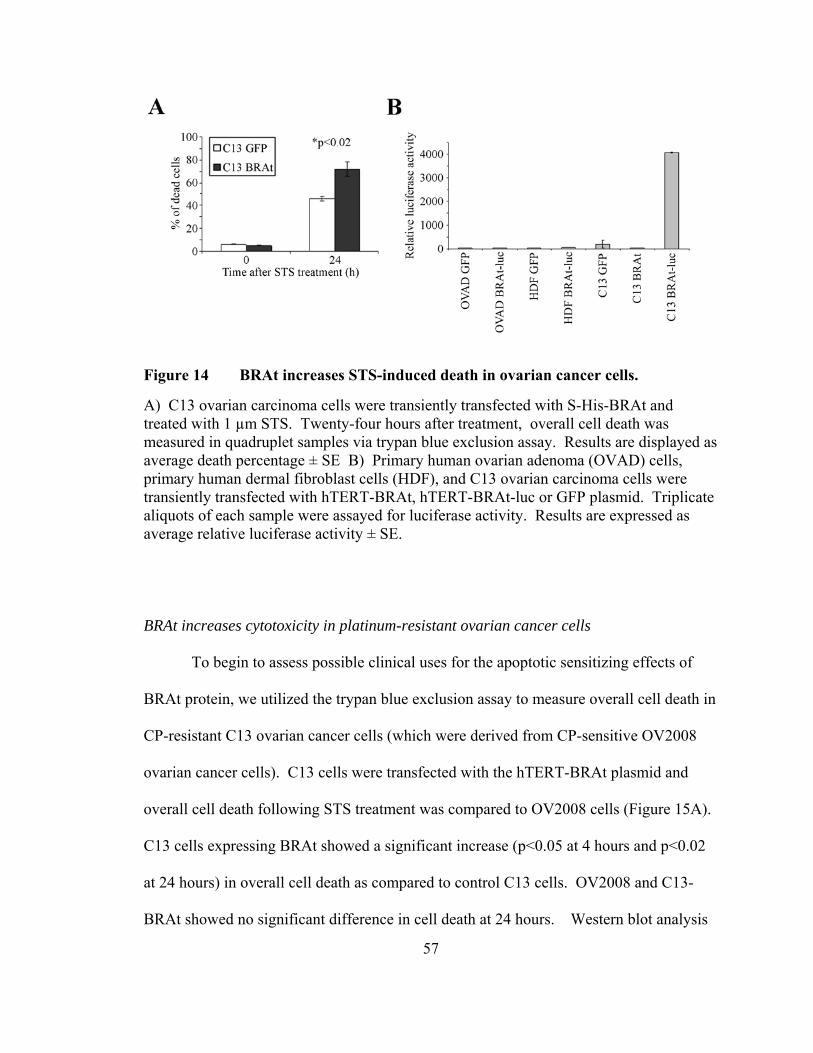
57
Figure 14 BRAt increases STS-induced death in ovarian cancer cells.
A) C13 ovarian carcinoma cells were transiently transfected with S-His-BRAt and treated with 1 µm STS. Twenty-four hours after treatment, overall cell death was measured in quadruplet samples via trypan blue exclusion assay. Results are displayed as average death percentage ± SE B) Primary human ovarian adenoma (OVAD) cells, primary human dermal fibroblast cells (HDF), and C13 ovarian carcinoma cells were transiently transfected with hTERT-BRAt, hTERT-BRAt-luc or GFP plasmid. Triplicate aliquots of each sample were assayed for luciferase activity. Results are expressed as average relative luciferase activity ± SE.
BRAt increases cytotoxicity in platinum-resistant ovarian cancer cells
To begin to assess possible clinical uses for the apoptotic sensitizing effects of
BRAt protein, we utilized the trypan blue exclusion assay to measure overall cell death in
CP-resistant C13 ovarian cancer cells (which were derived from CP-sensitive OV2008
ovarian cancer cells). C13 cells were transfected with the hTERT-BRAt plasmid and
overall cell death following STS treatment was compared to OV2008 cells (Figure 15A).
C13 cells expressing BRAt showed a significant increase (p<0.05 at 4 hours and p<0.02
at 24 hours) in overall cell death as compared to control C13 cells. OV2008 and C13-
BRAt showed no significant difference in cell death at 24 hours. Western blot analysis
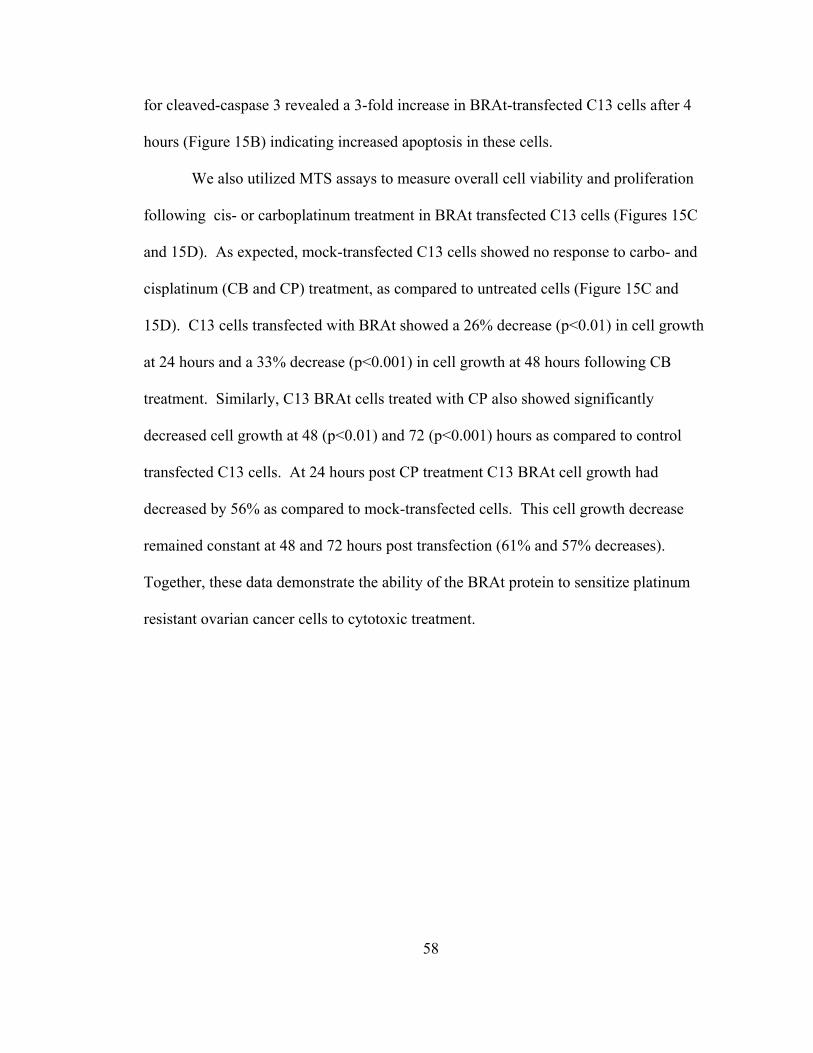
58
for cleaved-caspase 3 revealed a 3-fold increase in BRAt-transfected C13 cells after 4
hours (Figure 15B) indicating increased apoptosis in these cells.
We also utilized MTS assays to measure overall cell viability and proliferation
following cis- or carboplatinum treatment in BRAt transfected C13 cells (Figures 15C
and 15D). As expected, mock-transfected C13 cells showed no response to carbo- and
cisplatinum (CB and CP) treatment, as compared to untreated cells (Figure 15C and
15D). C13 cells transfected with BRAt showed a 26% decrease (p<0.01) in cell growth
at 24 hours and a 33% decrease (p<0.001) in cell growth at 48 hours following CB
treatment. Similarly, C13 BRAt cells treated with CP also showed significantly
decreased cell growth at 48 (p<0.01) and 72 (p<0.001) hours as compared to control
transfected C13 cells. At 24 hours post CP treatment C13 BRAt cell growth had
decreased by 56% as compared to mock-transfected cells. This cell growth decrease
remained constant at 48 and 72 hours post transfection (61% and 57% decreases).
Together, these data demonstrate the ability of the BRAt protein to sensitize platinum
resistant ovarian cancer cells to cytotoxic treatment.
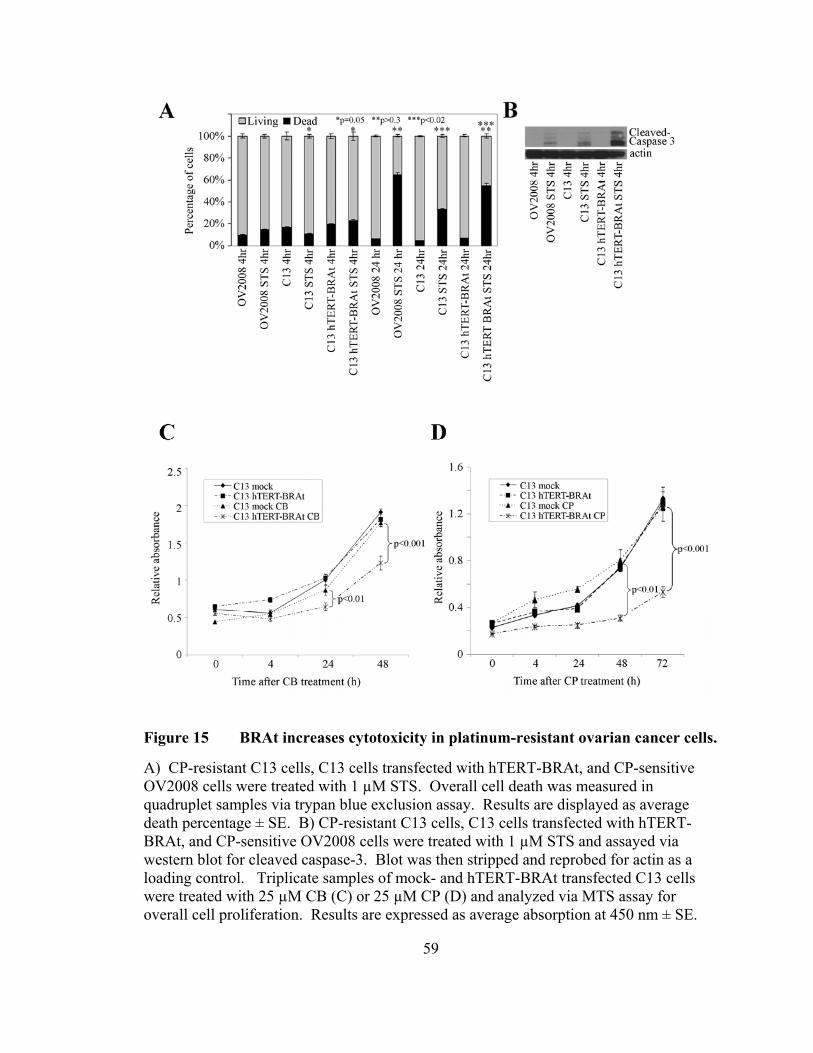
59
Figure 15 BRAt increases cytotoxicity in platinum-resistant ovarian cancer cells.
A) CP-resistant C13 cells, C13 cells transfected with hTERT-BRAt, and CP-sensitive OV2008 cells were treated with 1 µM STS. Overall cell death was measured in quadruplet samples via trypan blue exclusion assay. Results are displayed as average death percentage ± SE. B) CP-resistant C13 cells, C13 cells transfected with hTERT-BRAt, and CP-sensitive OV2008 cells were treated with 1 µM STS and assayed via western blot for cleaved caspase-3. Blot was then stripped and reprobed for actin as a loading control. Triplicate samples of mock- and hTERT-BRAt transfected C13 cells were treated with 25 µM CB (C) or 25 µM CP (D) and analyzed via MTS assay for overall cell proliferation. Results are expressed as average absorption at 450 nm ± SE.
60
Discussion
Previously, it has been shown that IOSE cells carrying the BRCA1 185delAG
mutation have an increased sensitivity to caspase-mediated apoptosis [90]. This increase
results from decreased XIAP-mediated ubiquitination and is associated with loss of Akt
activation [89]. Here, we provide direct evidence of the 185delAG truncation, BRAt,
protein’s involvement in caspase-mediated apoptosis of human IOSE. Transfection of
BRAt protein into BRCA1wt IOSE cells did not alter cell growth, morphology,
intermediate filament profile, or nuclear localization of full length BRCA1. Yet, STS
treatment induced a significantly stronger caspase 3-mediated apoptotic response in these
cells. Further, western blot analysis revealed BRAt increased caspase-3 activation by
decreasing Akt phosphorylation and that BRAt protein sensitized platinum resistant
ovarian cancer cells to cis- and carboplatinum treatment.
It is increasingly apparent that a paradox exists between the tumor-suppressive
function and therapeutic-sensitivity of wild-type BRCA1 cell lines and those expressing
BRCA1 mutants. Our study is the first to directly link the BRCA1 185delAG mutation to
increased apoptosis, and our findings are similar to those of others. For example, a
BRCA1 mutant expressing the first 299 amino acids of the protein increased
radiosensitivity in mammary epithelial cells [177], and a truncated BRCA1 mutant
61
expressing the first 602 amino acids of the protein increased chemosensitivity in ID-8
mouse ovarian cancer cells [88].
The propensity for the nonsense-mediated decay (NMD) of mRNAs containing
premature stop codons suggests that the mRNAs for the BRCA1 185delAG mutation and
other BRCA1 truncation mutants would not be translated in cell lines carrying these
mutants. It has been suggested that mRNA encoding the 185delAG has a very short half-
life and that the expression of the 185delAG mutant in transient transfection assays is
undetectable [178]. Others have reported that only twenty-four of thirty BRCA1
truncating mutants are subject to NMD. Interestingly, the 185delAG mutant is among the
six mutations found to have no significant decrease in steady-state transcript levels,
suggesting that this mutant is not subject to NMD [179]. Our results support the latter, as
we demonstrated the expression of stable and transiently-transfected BRAt in ovarian
surface epithelial cells via RT-PCR and western blot.
These data also correlate favorably with clinical reports noting reduced
chemotherapeutic response in breast and ovarian cancer patients with sporadic disease
when compared to patients carrying BRCA1 founder mutations [81, 158, 159]. Though
this protein has yet to be shown to exist clinically, these data suggest that the BRCA1
185delAG protein is functional and plays a crucial clinical role in ovarian cancer patients
carrying this mutation. While the exact function and molecular mechanisms of the
BRCA1 185delAG protein are not known, this data suggests that BRAt may disrupt Akt
activation in vitro. Akt is often overexpressed or constitutively activated in ovarian
cancers, thus it represents a valid therapeutic target [180, 181]. Accordingly, the
development of molecules that target Akt is an active area of biomedical research [182,

62
183]. Therefore, a better understanding of the signaling pathways responsible for the
favorable clinical response of ovarian cancer patients carrying the BRCA1 185delAG
mutation, especially those pertaining to the ability of BRAt to abrogate Akt activation, is
critical.
Taken together, these findings indicate that the truncated protein derived from the
BRCA1 185delAG mutation is sufficient to increase cytotoxicity in ovarian cells
following chemotherapeutic treatment. BRAt-enhanced caspase 3 activity, then, may
represent a new approach to overcome reduced apoptotic response commonly seen in
chemoresistant tumors.
63
Acknowledgements
The cDNA for activated-Akt protein was a generous gift from Dr. Jin Cheng’s
laboratory, H. Lee Moffitt Cancer Center, Tampa, FL. DNA sequencing was performed
by the H. Lee Moffitt Cancer Center Molecular Biology Core facility. Flow cytometry
was performed under the direction of Dr. Charlie Szekeres in the USF Health Flow
Cytometry Core Facility.
64
CHAPTER III
BRCA1 185delAG TRUNCATION PROTEIN, BRAT, AMPLIFIES MASPIN
EXPRESSION IN HUMAN OVARIAN SURFACE EPITHELIAL CELLS
Abstract
Maspin protein has been shown to sensitize breast carcinoma cells to STS-induced
apoptosis by a seemingly similar mechanism to what we see in BRAt induced apoptosis
in our ovarian models. In ovarian cancer the relationship between maspin expression
and patient prognosis appears to be dependent on the subcellular localization of maspin.
Nuclear maspin has been associated with reduced markers of angiogenesis and prolonged
survival. Additionally, ovarian cancer patients with complete response to CP treatment
have been reported to have significantly higher levels nuclear maspin than non-
responsive patients. Based on these initial observations, we hypothesized that BRAt
protein induces maspin protein expression in ovarian surface epithelial (IOSE) cells.
Herein, we provide the first evidence that the BRCA1 185delAG mutant protein, BRAt,
is sufficient to induce maspin protein in IOSE cells. Maspin protein levels in normal
IOSE cells that are heterozygous carriers of the BRCA1 185delAG mutation were
compared to other normal IOSE cells with homozygous wild-type BRCA1. All four
BRCA1 185delAG mutation carriers tested showed higher maspin levels than six of seven
65
BRCA1 wild-type/BRCA1 status unknown cell lines. Normal IOSE BRCA1 wild-type
cells were transfected with BRAt protein and showed increased maspin mRNA levels and
increased nuclear maspin protein levels as compared to mock-transfected cells.
Additionally, both heterozygous carriers of the BRCA1 185delAG mutation and cells
transfected with BRAt protein show an increased ability to activate the maspin promoter
as compared to control cells. The transcription factor AP1 is at least partially required for
full activation of the maspin promoter in BRAt cells, as siRNA directed towards c-jun
decreased activation of the full-length maspin promoter. In conclusion, the data herein
demonstrates that BRAt protein is sufficient to increase maspin expression in IOSE cells,
providing a possible explanation for the increased CP response observed in some ovarian
cancer patients.
66
Introduction
Maspin (mammary serine protease inhibitor) was originally identified in normal
mammary epithelium by subtractive hybridization on the basis of its expression in normal
mammary epithelial cells [121]. Maspin protein has been shown to sensitize breast
carcinoma cells to STS-induced apoptosis [119] and also plays a role in inhibition of
growth, invasion, and metastatic potential of neoplastic cells [184]. In prostate cancer
cell lines, maspin overexpression led to decreased tumorigenesis and reduced metastatic
potential [185]. In contrast, maspin was found to be over-expressed in the progression of
pre-invasive lesions to malignant tumors in pancreatic cancer specimens [186].
It is increasingly apparent that a paradox exists between maspin expression and
malignant progression in some cancers. In ovarian cancer the relationship between
maspin expression and patient prognosis appears to be dependent on the subcellular
localization of maspin. Maspin can inhibit ovarian cancer invasion in vitro, and nuclear
maspin is associated with increased survival, whereas cytoplasmic localization is
associate with poor outcome [141]. Similarly, nuclear maspin was associated with
reduced markers of angiogenesis and prolonged survival in a retroactive study of 118
ovarian cancer patients [144] and non-detectable maspin appears to confer an increased
risk of progression and death in advanced stage epithelial ovarian cancer [143]. A recent
report by Surowiak et al. presents conflicting data, suggesting that cytoplasmic maspin
67
correlates inversely with relapse of neoplastic disease. Interestingly, they also report that
patients with complete response to CP treatment showed significantly higher levels of
nuclear maspin than non-responsive patients, suggesting that nuclear maspin expression
may be characterstic of CP-sensitive ovarian cancers [136].
Studies aimed at increasing CP sensitivity are not unique, and we have recently
reported that the BRCA1 185delAG mutant protein, BRAt, can increase sensitivity in
platinum-resistant ovarian cancer cells [187]. Recently, the expression of maspin in
ovarian cancer cells has been reported to be epigenetically regulated [123] through
demethylation of the maspin promoter [133]. Herein, we provide the first evidence that
BRAt protein induces maspin expression in ovarian cells, thereby providing a possible
mechanism by which the BRCA1 185delAG mutation confers therapeutic sensitivity.
68
Materials and Methods
Cell Culture and Transfection
The SV 40-Large T-Ag transfected human ovarian surface epithelial cell lines
3261-77a, 3261-77b, 1816-686a, 1816-686b, 1816-680a, 1816-680b, 1816-575, IOSE-
118, IOSE-135, IOSE-120, IOSE-29, IOSE-144, and IMCC3 were cultured in Medium
199/ MCDB 105 (Sigma, St. Louis, MO) with 5% or 10% fetal bovine serum and
gentamicin. Wild type BRCA1 status was confirmed via single site BRACAnalysis DNA
sequencing at Myriad Biotechnologies (Salt Lake City, UT). Stable BRAt cells were
generated as previously described [187] and grown in 1 mg/ml G418 selection media.
All cells were incubated at 37ºC with 5% CO2.
IOSE-118 cells were transiently transfected as previously described [187] using
the Nucleofector device (Amaxa, Gaithersburg, MD) with 2 μg of plasmid (GFP, Flag-
BRAt, BRIT, Maspin, MasPro-FL, MasPro-759, MasPro-297, or MasPro-116).
Cell Viability Assay
Cell viability was measured by the CellTiter 96® AQueous One Solution Cell
Proliferation MTS (Promega, Madison, WI) colorimetric assay. The assay was performed
in 96 well microtiter plates according to manufacturer's instructions and is based on
soluble formazan production by dehydrogenase enzymes. Two thousand IOSE-118 cells
69
transiently transfected with Flag-BRAt, BRIT, or Maspin cDNA were plated on 96 well
microtiter plates and incubated for 24 hours. The cells were then treated with 1µM STS
or 25µM CP. Absorbance at 490 nm was measured at 0, 4, 24, 48, and 72 hours
following treatment using an ELx800 microplate reader (Bio-Tek Instruments, Winooski,
VT) and the results expressed as the mean absorbance ± SE.
Western Blot and RT-PCR
Protein samples were lysed in CHAPS buffer and 15 μg of protein was separated
via 10% SDS-PAGE. Proteins were transferred to PVDF membranes and blocked in 5%
milk in Tween 20-TBS. Blots were incubated in their respective antibodies overnight and
developed via ECL (Amersham). Maspin antibody was purchased from BD Biosciences
(San Jose, CA). Cleaved caspase-3, pro-caspase-3, and c-Jun antibodies were purchased
from Cell Signalling Technology (Beverly, MA). β-actin antibodies were purchased
from Sigma (St. Louis, MO).
Stable Flag-BRAt cells were separated into nuclear and cytoplasmic fractions by
lysing in a chilled IGEPAL lysis buffer (50mM Tris-HCl (pH 8.0), 100mM NaCl, 5mM
MgCl2, 0.5% (v/v) IGEPAL). Lysed cells were centrifuged at 15,000 x g and supernatant
(containing cytoplasm/plasma membrane proteins) was removed for analysis. The pellet
(containing nuclear proteins) was washed twice and resuspended in lysis buffer.
Fractionation samples were separated via 7% SDS-PAGE. Samples were transferred to
PVDF membrane and probed for maspin protein via western blot.
mRNA samples were isolated using TRIzol reagent from Invitrogen per
manufacturer’s protocol. One microgram total mRNA, oligo(dT), and reverse
70
transcriptase were used to generate single-strand cDNA as previously described. The
cDNA samples were amplified using the Perkin-Elmer (Palo Alto, CA) GeneAmp kit.
The maspin primers used were Maspin-S (GGAGGCCACGTTCTGTAT) and Maspin-
AS (CCTGGCACCTCTATGGA) with β-actin primers actin-S
(GGGAATTCAAAACTGGAACGGTGAAGG) and actin-AS
(GGAAGCTTATCAAAGTCCTCGGCCACA) for an internal control. PCR was
performed for 35 cycles of 94ºC for 90 s, 55ºC for 90 s, and 72ºC for 90 s. Actin primers
were added at cycle 19. The amplified products were then separated by electrophoresis
on a 10% polyacrylamide gel, stained with 1x SYBR Green (Lonza, Rockland, ME), and
photographed with the Kodak EDAS 120 Digital Analysis System.
Luciferase Assay
To measure maspin promoter activity, the full-length (MasPro-FL) and truncated
maspin promoter luciferase constructs (MasPro-759, MasPro-297, or MasPro-116) were
used. IOSE-118 cells were transiently co-transfected with 2 μg of DNA and 1 μg of β-
galactosidase cDNA using program X-005 on the Nucleofector device. To determine
whether the transcription factor, AP1, was involved in BRAt induced maspin expression,
cells were transiently transfected with full-length or truncated maspin promoter luciferase
constructs and either 1 μM AP1 siRNA or 1 μM control (scrambled) siRNA (Dharmacon,
Chicago, IL). Luciferase activity was measured 48 h after transfection using the
Luciferase Assay System (Promega, Madison, WI) according to the manufacturers'
instructions. β-galactosidase was measured 48 h after transfection using the Luminescent
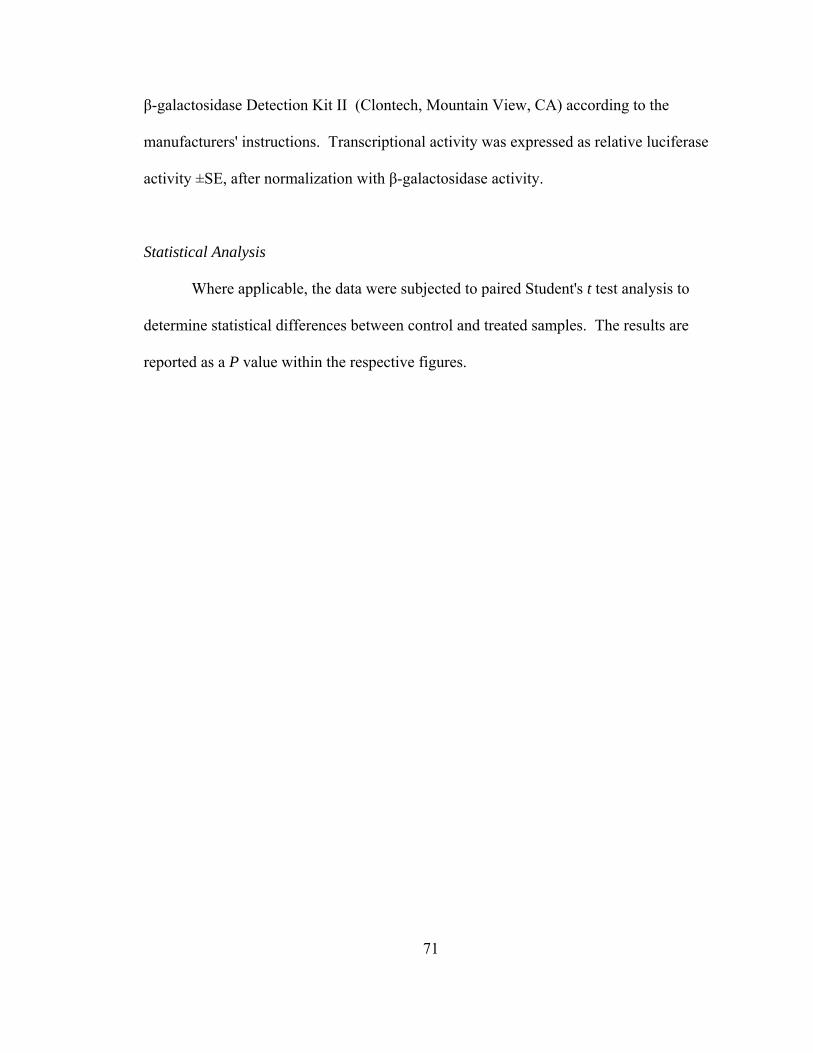
71
β-galactosidase Detection Kit II (Clontech, Mountain View, CA) according to the
manufacturers' instructions. Transcriptional activity was expressed as relative luciferase
activity ±SE, after normalization with β-galactosidase activity.
Statistical Analysis
Where applicable, the data were subjected to paired Student's t test analysis to
determine statistical differences between control and treated samples. The results are
reported as a P value within the respective figures.

72
Results
BRAt and maspin have similar effects on ovarian cell proliferation following treatment
To begin to evaluate if a relationship exists between BRAt protein and maspin
protein expression, we first performed independent transfections of BRAt, maspin, and
BRIT, and compared their proliferation as measured by MTS assay following STS or CP
treatment (Figure 16). Untreated BRAt, maspin, and BRIT transfected cells did not
display any significant differences in proliferation (Figure 16A). Interestingly, when
treated with STS (Figure 16B) or CP (Figure 16C), BRAt and maspin cell proliferation
were similarly inhibited, whereas BRIT cells displayed an initial increase in cell
proliferation before succumbing to the toxicity of the treatments at 48 hours. This data
suggests that BRAt and maspin protein have similar effects on ovarian cell proliferation
following chemotherapeutic treatment.
IOSE cells carrying the BRCA1 185delAG mutation have increased maspin protein levels
To determine if the BRCA1 185delAG mutation leads to higher levels of maspin
protein, we compared maspin protein levels in cell lines that endogenously carry this
mutation to those that are BRCA1wt or BRCA1 status unknown (Figure 17). All four cell
lines carrying the mutation (3261-77a, 3261-77b, 1816-686a, and 1816-686b) had higher
levels of maspin protein as measured by western blot than eight of the nine
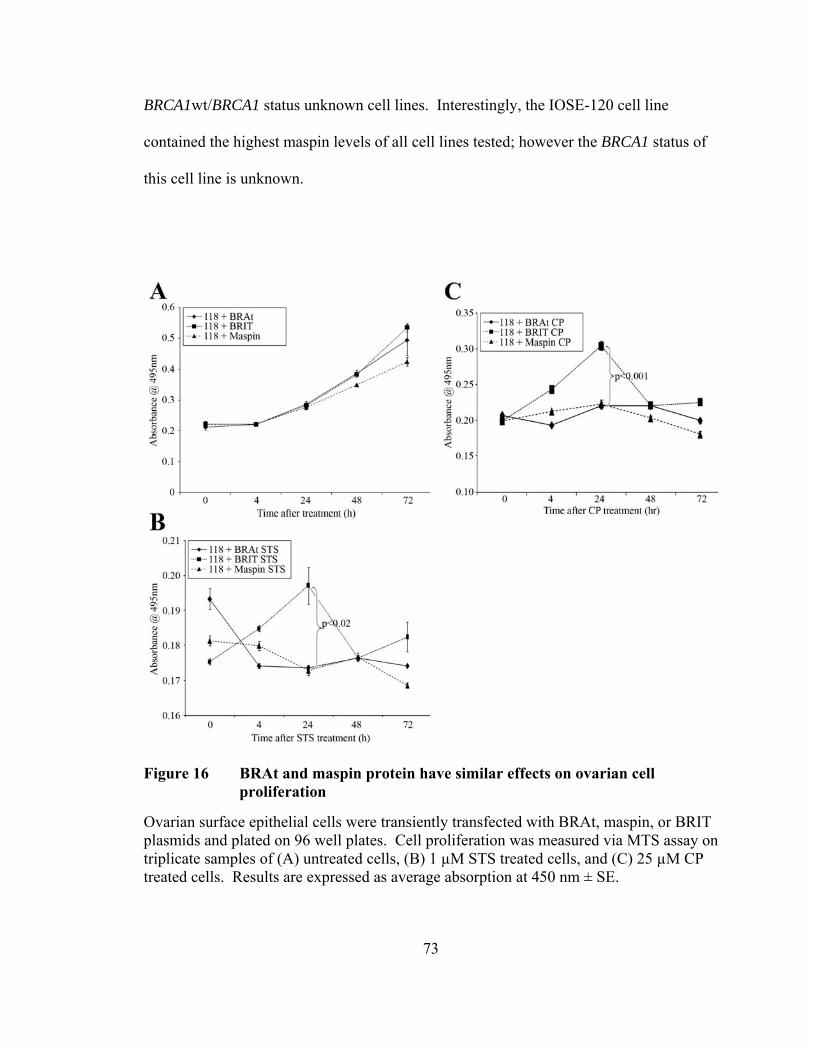
73
BRCA1wt/BRCA1 status unknown cell lines. Interestingly, the IOSE-120 cell line
contained the highest maspin levels of all cell lines tested; however the BRCA1 status of
this cell line is unknown.
Figure 16 BRAt and maspin protein have similar effects on ovarian cell proliferation
Ovarian surface epithelial cells were transiently transfected with BRAt, maspin, or BRIT plasmids and plated on 96 well plates. Cell proliferation was measured via MTS assay on triplicate samples of (A) untreated cells, (B) 1 µM STS treated cells, and (C) 25 µM CP treated cells. Results are expressed as average absorption at 450 nm ± SE.
74
Figure 17 The BRCA1 185delAG mutation correlates with increased maspin
expression
Normal IOSE cells carrying the BRCA1 185delAG mutation (3261-77a, 3261-77b, 1816-686a, and 1816-686b) were analyzed for maspin protein levels via western blot and compared to BRCA1wt/ BRCA1 status unknown cell lines. Blots were then stripped and probed for β-actin as a loading control. Upper panel shows a shorter exposure for maspin protein, lower panel shows a longer exposure for maspin protein.
BRAt transfection increases maspin message and nuclear maspin protein
To further confirm that the increased maspin levels observed in Figure 17 are
indeed related to the presence of the BRCA1 185delAG protein product, BRAt, we
analyzed cells transfected with BRAt for maspin message and protein levels (Figure 18).
75
Normal IOSE-118 cells transiently transfected with BRAt showed an increase in maspin
message levels as measured by semi-quantitative RT-PCR (Figure 18A). The intensity of
the maspin band was normalized to the respective actin band and this indicated an 87%
increase in maspin message in the BRAt transfected cells.
Next, we measured the total levels of maspin protein in stable BRAt cell lines as
compared to BRCA1wt cells. Both stable BRAt cell lines tested contained more than
double the amount of maspin protein as compared to the BRCA1wt control cells (Figure
18B). We then separated the stable BRAt and control BRCA1wt cells into nuclear and
cytosolic fractions to determine if the increased maspin in BRAt cells was localizing to
the cytoplasm or nucleus. Densitometric analysis of the western blot results show that
overall maspin levels were consistent with those seen in Figure 18B. Interestingly, over
71% of the maspin in BRAt cells is localized to the nucleus, whereas less than 30% of
maspin in the BRCA1wt is localized to the nucleus (Figure 18C). This data is consistent
with clinical reports suggesting that ovarian tumors with increased nuclear maspin are
associated with a favorable prognosis.
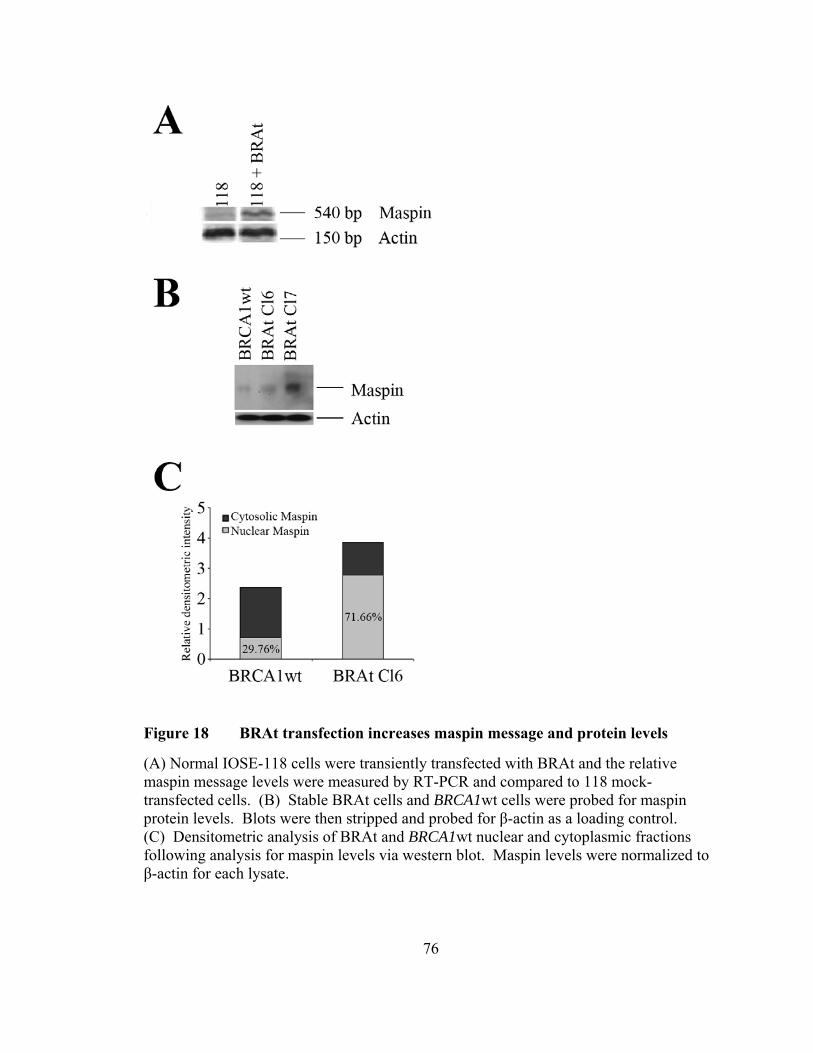
76
Figure 18 BRAt transfection increases maspin message and protein levels
(A) Normal IOSE-118 cells were transiently transfected with BRAt and the relative maspin message levels were measured by RT-PCR and compared to 118 mock-transfected cells. (B) Stable BRAt cells and BRCA1wt cells were probed for maspin protein levels. Blots were then stripped and probed for β-actin as a loading control. (C) Densitometric analysis of BRAt and BRCA1wt nuclear and cytoplasmic fractions following analysis for maspin levels via western blot. Maspin levels were normalized to β-actin for each lysate.
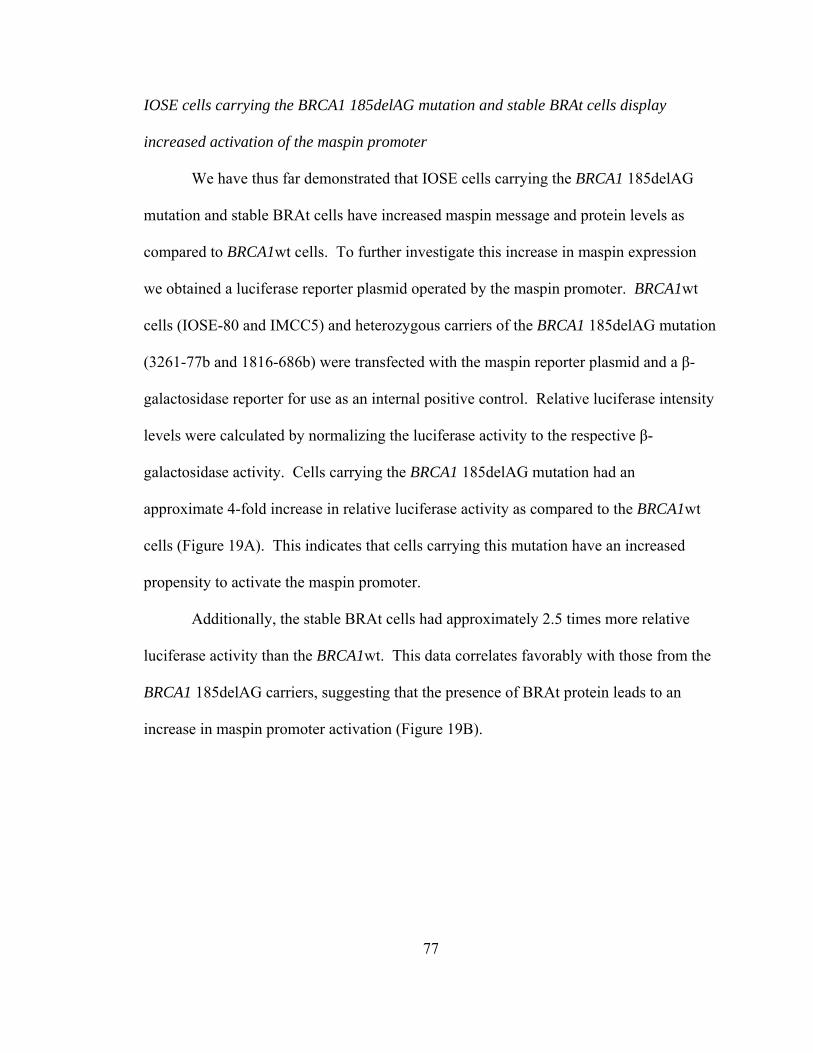
77
IOSE cells carrying the BRCA1 185delAG mutation and stable BRAt cells display
increased activation of the maspin promoter
We have thus far demonstrated that IOSE cells carrying the BRCA1 185delAG
mutation and stable BRAt cells have increased maspin message and protein levels as
compared to BRCA1wt cells. To further investigate this increase in maspin expression
we obtained a luciferase reporter plasmid operated by the maspin promoter. BRCA1wt
cells (IOSE-80 and IMCC5) and heterozygous carriers of the BRCA1 185delAG mutation
(3261-77b and 1816-686b) were transfected with the maspin reporter plasmid and a β-
galactosidase reporter for use as an internal positive control. Relative luciferase intensity
levels were calculated by normalizing the luciferase activity to the respective β-
galactosidase activity. Cells carrying the BRCA1 185delAG mutation had an
approximate 4-fold increase in relative luciferase activity as compared to the BRCA1wt
cells (Figure 19A). This indicates that cells carrying this mutation have an increased
propensity to activate the maspin promoter.
Additionally, the stable BRAt cells had approximately 2.5 times more relative
luciferase activity than the BRCA1wt. This data correlates favorably with those from the
BRCA1 185delAG carriers, suggesting that the presence of BRAt protein leads to an
increase in maspin promoter activation (Figure 19B).
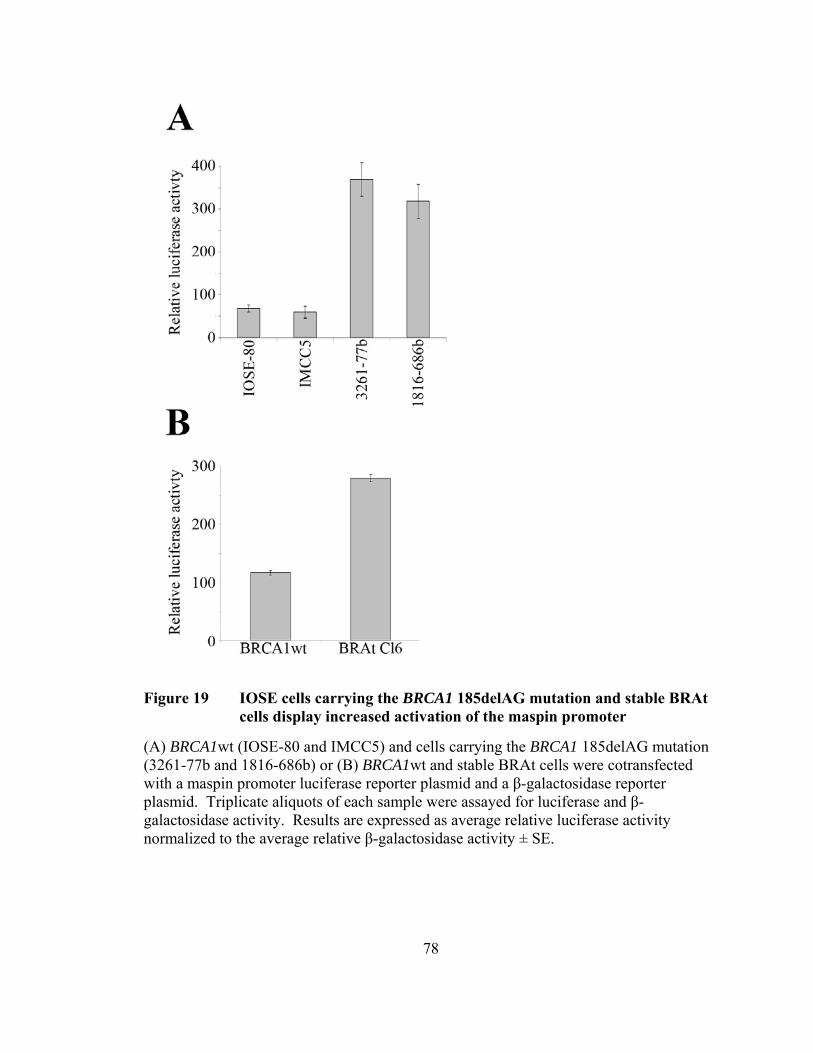
78
Figure 19 IOSE cells carrying the BRCA1 185delAG mutation and stable BRAt cells display increased activation of the maspin promoter
(A) BRCA1wt (IOSE-80 and IMCC5) and cells carrying the BRCA1 185delAG mutation (3261-77b and 1816-686b) or (B) BRCA1wt and stable BRAt cells were cotransfected with a maspin promoter luciferase reporter plasmid and a β-galactosidase reporter plasmid. Triplicate aliquots of each sample were assayed for luciferase and β-galactosidase activity. Results are expressed as average relative luciferase activity normalized to the average relative β-galactosidase activity ± SE.

79
BRAt-enhanced maspin promoter activation is partially mediated by the transcription
factor AP1
To determine if a specific region of the maspin promoter was required for the
BRAt-enhanced maspin promoter activation, we obtained three truncated maspin
promoter luciferase reporter plasmids and compared their relative luciferase activity in
stable BRAt cells to that of the full length maspin promoter. The full length maspin
promoter consists of the 957 base pairs directly upstream of the first exon in the maspin
gene. The truncated plasmids represent the regions from -759 to -1, -297 to -1, and -116
to -1 in the maspin promoter and are named accordingly (-759, -297, and -116).
The longest of the truncated promoters, plasmid -759, produced only approximately 20%
less luciferase activity than the full-length promoter, suggesting that the most distal
region of the maspin promoter is only partially required for maspin expression (Figure
20). The shorter promoter truncations, -297 and -116, produced 50% less luciferase
activity than the full length promoter, suggesting that the region of the maspin promoter
between residues -759 and -297 is required for full activation of the maspin promoter.
To further analyze the maspin promoter, we performed an online analysis for
potential transcription factor binding sites in the maspin promoter. Our analysis revealed
several potential AP1 binding sites between residues -759 and -297. Based on this
observation, we used siRNA to knockdown c-Jun, a component of the AP1 complex that
is required for AP1’s ability to promote transcription. Surprisingly, API knockdown had
no effect on luciferase activity from any of the truncated maspin promoter reporter
plasmids (Figure 21). All three truncated maspin reporter plasmids produced statistically
similar levels of luciferase activity when AP1 was silenced, as compared to mock
80
transfected control cells. Interestingly, AP1 knockdown resulted in a decrease in full-
length promoter luciferase activity to levels statistically similar to cells transfected with
the -759 truncated maspin promoter luciferase plasmid, suggesting that loss of an AP1
site or sites is responsible for the loss in luciferase activity observed with the -759
truncated maspin promoter luciferase plasmid. Additionally, this data suggests that AP1
is at least partially required for full activation of the maspin promoter in BRAt cells.
Figure 20 Truncated maspin promoter results in decreased activation of luciferase reporter
BRAt cells were cotransfected with β-galactosidase and full length maspin promoter luciferase reporter or truncated maspin promoter luciferase reporter. Triplicate aliquots of each sample were assayed for luciferase and β-galactosidase activity. Results are expressed as average relative luciferase activity normalized to the average β-galactosidase activity ± SE.
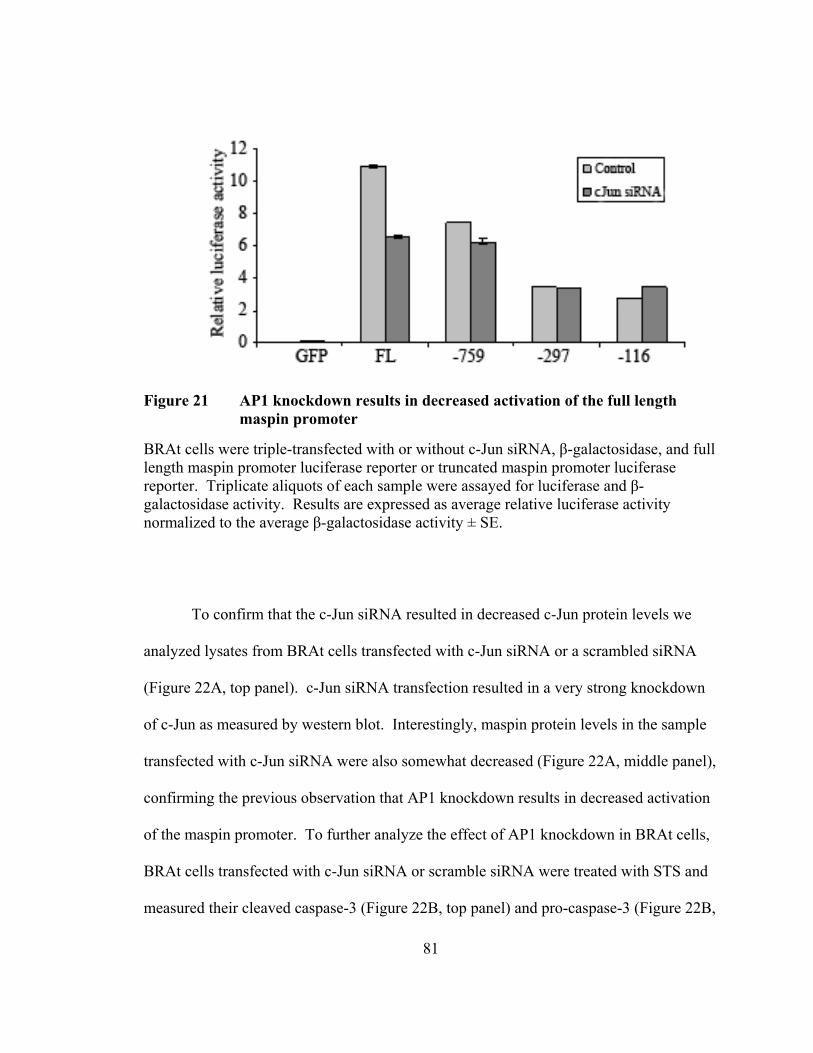
81
Figure 21 AP1 knockdown results in decreased activation of the full length maspin promoter
BRAt cells were triple-transfected with or without c-Jun siRNA, β-galactosidase, and full length maspin promoter luciferase reporter or truncated maspin promoter luciferase reporter. Triplicate aliquots of each sample were assayed for luciferase and β-galactosidase activity. Results are expressed as average relative luciferase activity normalized to the average β-galactosidase activity ± SE.
To confirm that the c-Jun siRNA resulted in decreased c-Jun protein levels we
analyzed lysates from BRAt cells transfected with c-Jun siRNA or a scrambled siRNA
(Figure 22A, top panel). c-Jun siRNA transfection resulted in a very strong knockdown
of c-Jun as measured by western blot. Interestingly, maspin protein levels in the sample
transfected with c-Jun siRNA were also somewhat decreased (Figure 22A, middle panel),
confirming the previous observation that AP1 knockdown results in decreased activation
of the maspin promoter. To further analyze the effect of AP1 knockdown in BRAt cells,
BRAt cells transfected with c-Jun siRNA or scramble siRNA were treated with STS and
measured their cleaved caspase-3 (Figure 22B, top panel) and pro-caspase-3 (Figure 22B,

82
lower panel) levels measured via western blot. AP1 knockdown resulted in a decrease in
cleaved-caspase-3. Additionally, the available pool of pro-caspase-3 was greater in cells
transfected with c-Jun siRNA. Taken together, these results demonstrate that AP1
knockdown is sufficient to decrease maspin levels in BRAt cells and this decrease in
maspin results in a decrease in cleaved-caspase-3 following STS treatment, indicating a
decrease in overall apoptosis.
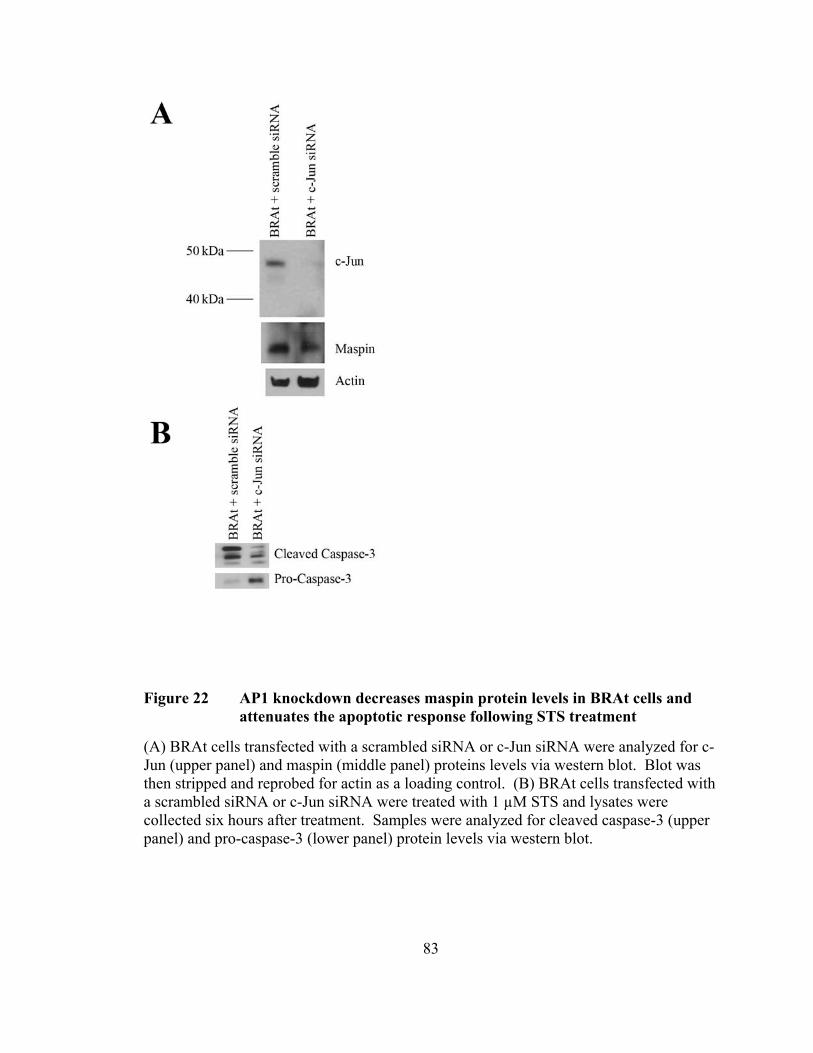
83
Figure 22 AP1 knockdown decreases maspin protein levels in BRAt cells and attenuates the apoptotic response following STS treatment
(A) BRAt cells transfected with a scrambled siRNA or c-Jun siRNA were analyzed for c-Jun (upper panel) and maspin (middle panel) proteins levels via western blot. Blot was then stripped and reprobed for actin as a loading control. (B) BRAt cells transfected with a scrambled siRNA or c-Jun siRNA were treated with 1 µM STS and lysates were collected six hours after treatment. Samples were analyzed for cleaved caspase-3 (upper panel) and pro-caspase-3 (lower panel) protein levels via western blot.

84
Discussion
Herein, we have demonstrated that the BRCA1 185delAG mutant protein, BRAt,
is sufficient to increase maspin protein levels in immortalized human ovarian surface
epithelial cell lines. We have demonstrated that this increase in maspin protein is due, in
part, to increased activation of the maspin promoter and that the transcription factor AP1
partially mediates this promoter activation. Additionally, we demonstrate that AP1
knockdown in BRAt cells results in partially decreased maspin protein levels, and this
corresponds with decreased caspase-3 cleavage following STS treatment.
The tumor suppressor p53 has been described as a direct stimulator of the maspin
promoter [146]. P53 protein has also been shown to bind to and be inactivated by the
SV-40 Large T antigen [188]. The BRCA1wt/ BRCA1 status unknown cell lines used in
this study are all SV-40 Large T antigen immortalized, therefore it is plausible that the
low levels of maspin protein expressed in these cells is at least partially attributed to their
decreased levels of functional p53 protein. Additionally, the cell lines that are
heterozygous BRCA1 185delAG mutation carriers used in this study are also SV-40
Large T antigen immortalized, however, the maspin levels in these cells are increased, in
addition to their increased ability to induce activation of the maspin promoter. This
85
suggests that the BRCA1 185delAG mutation product, BRAt, may be acting as a
transcription factor or interacting with other transcription factors to induce maspin
expression.
The induction of maspin protein expression by the overexpression of other
proteins has been previously established. Most recently, Yamaguchi et al. (2008)
describe induced maspin expression in a breast carcinoma cell line stably expressing the
interferon-inducible protein IFIXα. The function of the induced maspin in their system is
different than what we report here, as they observe decreased invasion in cells expressing
induced maspin [189]. However, their data support the general classification of maspin
as a tumor suppressor.
We were the first to propose that the BRCA1 185delAG mutation protein product,
BRAt, possesses a unique and novel function unrelated to that of full-length BRCA1
[187]. Herein, we provide the first evidence that the novel function of BRAt may be
related to its ability to induce maspin expression in ovarian cells. While the exact
mechanism by which BRAt protein induces maspin expression is not known, we
hypothesize that BRAt protein may interact, either directly or indirectly, with the maspin
promoter, possibly at an AP1 site at the distal region of the maspin promoter.
The function of maspin in the nucleus is still unknown. In the absence of a
nuclear localization signal, maspin must either be chaperoned to the nucleus or cross the
nuclear membrane by passive diffusion [190]. BRAt protein localizes to the nucleus
[187], therefore it is possible that BRAt protein may act as a scaffolding protein to shuttle
maspin to the nucleus. Further experimentation is needed to determine if BRAt and
maspin proteins physically interact.

86
Our in vitro observation that BRAt protein increases nuclear levels of maspin
protein in ovarian cells supports the observation that women with ovarian tumors with
nuclear maspin expression have prolonged survival as compared to those with
cytoplasmic or no maspin expression [144]. Surowiak et al. (2006) report that that
elevated nuclear maspin is typical for ovarian cancer cases with complete response to CP
treatment. Unfortunately, the BRCA1 status of the cell lines and patients in their study is
unknown, therefore we can not explore any potential correlations between specific
BRCA1 mutations and maspin expression/subcellular localization and the relationship to
chemosensitivity and prognosis
In summary, this study shows that IOSE cells carrying or stably transfected with
the BRCA1 185delAG mutation have increased maspin levels. This increase in maspin
was most notable in the nucleus and the increased maspin corresponds with increased
caspase-3 cleavage following STS treatment. The transcription factor AP1 partially
mediates maspin promoter activity in BRAt cells and AP1 knockdown decreases maspin
protein levels in BRAt cells.

87
Acknowledgements
Maspin expression plasmid was a generous gift from Dr. Shijie Sheng (Wayne
State University). Full-length maspin-promoter-luciferase-reporter plasmid was a
generous gift from Dr. Bernard Futscher (Arizona Cancer Center). The truncated
maspin-promoter-luciferase-reporter constructs were generous gifts from Dr. Shiv
Srivastava (Uniformed Services University of the Health Sciences).
88
CHAPTER IV
CONCLUSIONS
Ovarian cancer is a deadly disease that kills an estimated 15,000 women annually
in the United States [2]. Many of these deaths are attributed to tumors that are
unresponsive to chemotherapeutic treatment due to the development of multi-drug
resistance. The data presented herein suggests a novel explanation for the observation
that a subset of ovarian cancer patients, those carrying the BRCA1 185delAG mutation,
experience a better clinical response than those carrying other BRCA1 mutations or those
with sporadic disease.
We are the first to demonstrate that the protein product of the BRCA1 185delAG
mutation, BRAt, is sufficient to increase the chemotherapeutic response of ovarian cells
in vitro. Additionally, it is important to note that the increased apoptotic response
observed in our cell culture model occurs in the presence of wild-type BRCA1. Wild-
type BRCA1 is involved in the maintenance of genomic stability and DNA repair, thus it
has been suggested that loss of wild-type BRCA1, either via mutation or epigenetic
silencing, is responsible for the increased chemotherapeutic response observed in some
patients. While the loss of wild-type BRCA1 may and likely partially contributes to the
increased chemotherapeutic response observed in ovarian cancer patients carrying the
BRCA1 185delAG mutation, we provide evidence that shows that the protein product of
89
this mutation also contributes and itself is sufficient to increase the therapeutic response
in drug-resistant ovarian cancer cells.
We have demonstrated that the mRNA coding for BRAt is detectable in ovarian
cells transfected with cDNA coding for BRAt. We have also demonstrated that BRAt
protein is detectable in these cells, which in itself is a significant contribution based on
the general assumption that truncated mRNA transcripts are degraded via the non-sense
mediated mRNA decay pathway and, thus are unable to transcribe a functional truncated
protein.
Additionally, we have provided insight into the mechanism by which BRAt
protein increases drug-induced apoptosis in ovarian cells. Most notably, BRAt cells have
decreased phospho-Akt and XIAP protein levels following STS treatment, suggesting
that BRAt protein inhibits or decreases the phosphorylation of Akt and this decrease in
phospho-Akt may be responsible for the decrease in XIAP protein levels.
Overexpression of constitutively-activated Akt decreased the STS-induced apoptotic
response in our model system, indicating that Akt is indeed a mediator of BRAt induced
apoptosis.
Finally, we have provided the first evidence that ovarian cells carrying or
transfected with the BRCA1 185delAG mutation have increased levels of maspin protein.
Specifically, we show that in ovarian cells transfected with BRAt we see an increase in
maspin levels in the nucleus which correlates favorably with current literature describing
the effect of maspin protein expression in ovarian cancer patients [144]. We have
90
demonstrated that BRAt cells have an increased ability to activate the maspin promoter
and that this activation is at least partially dependent on an AP1 transcription factor
binding site located at the distal end of the maspin promoter.
Our data suggests that the signaling pathway(s) associated with BRAt-induced
maspin expression and drug-induced caspase-3 cleavage may be an attractive target for
future adjuvant therapies to enhance the treatment of ovarian cancer patients. It appears
that the unique sixteen amino acids at the C-terminus of BRAt protein are required for
BRAt’s activity, as the similarly sized BRIT control protein (with a scrambled sequence
at the C-terminus) did not elicit any changes in caspase-3 cleavage following STS
treatment. Thus, further analysis of these unique sixteen amino-acids should lead to a
better understanding of the mechanism by which BRAt protein leads to an increase in
induced apoptosis.
From our data it is apparent that caution should be used when interpreting the
results of clinical reports that group all BRCA1 mutation carriers into a single cohort.
When known, carriers of BRCA1 germline founder mutations, specifically those carrying
the 185delAG mutation, should be subcategorized into a separate group for more accurate
analysis. Unfortunately, it is unlikely that our findings will alter current protocols for
reporting BRCA1 mutation status, thus future reports will likely continue to fail to
provide crucial details that could better the understanding of this specific mutation.
Additionally, our data lead us to speculate that other BRCA1 mutations could
possibly lead to the production of stable truncated proteins with unique and novel
functions. Specifically, the steady-state levels of mRNA from the second most common
91
BRCA1 founder mutation, the 5382insC mutation, are reported to be stable, similar to
those seen with the 185delAG mutation [179].
In conclusion, based on our data we propose the following mechanism by which
BRAt induced maspin expression and subsequent drug-induced apoptosis occurs (Figure
23). BRAt protein, when expressed in ovarian cells induces maspin protein expression.
This increased expression of maspin protein is partially dependent on an AP1
transcription factor binding site in the maspin promoter. Upon treatment with STS or CP,
BRAt and/or maspin cause a reduction in IAP proteins, specifically XIAP and cIAP-1,
and an increase in proapoptotic proteins, specifically bax. Together, this leads to an
increase in caspase-3 cleavage and subsequently an increase in apoptosis. This apoptotic
increase can be attenuated by the overexpression of constitutively activated Akt, resulting
in decreased caspase-3 cleavage and decreased apoptosis following STS treatment.
Further experimentation is needed to determine exactly how the overexpression of
activated Akt is attenuating caspase-3 cleavage in our model system.
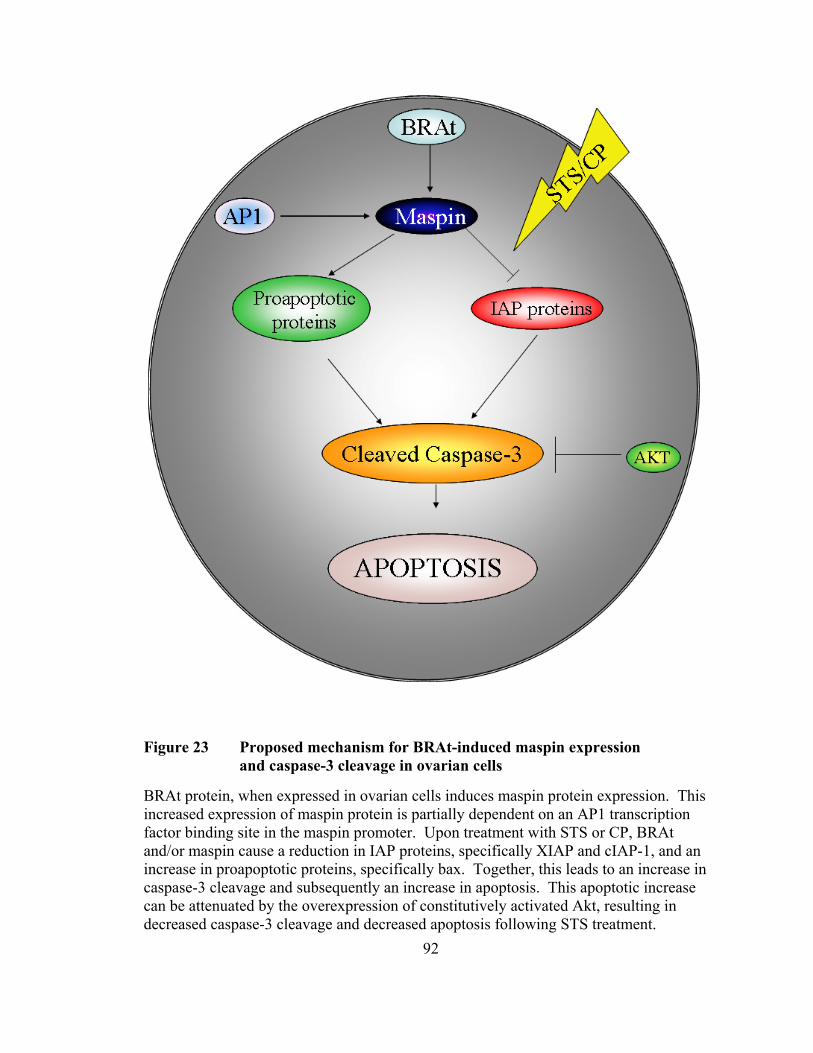
92
Figure 23 Proposed mechanism for BRAt-induced maspin expression and caspase-3 cleavage in ovarian cells
BRAt protein, when expressed in ovarian cells induces maspin protein expression. This increased expression of maspin protein is partially dependent on an AP1 transcription factor binding site in the maspin promoter. Upon treatment with STS or CP, BRAt and/or maspin cause a reduction in IAP proteins, specifically XIAP and cIAP-1, and an increase in proapoptotic proteins, specifically bax. Together, this leads to an increase in caspase-3 cleavage and subsequently an increase in apoptosis. This apoptotic increase can be attenuated by the overexpression of constitutively activated Akt, resulting in decreased caspase-3 cleavage and decreased apoptosis following STS treatment.
93
REFERENCES
[1] A Jemaldci, R Siegel, E Ward, T Murray, J Xu, C Smigal and MJ Thun. Cancer statistics, 2006. CA Cancer J Clin 2006, 56(2): 106-130.
[2] A Jemal, R Siegel, E Ward, T Murray, J Xu and MJ Thun. Cancer statistics, 2007.
CA Cancer J Clin 2007, 57(1): 43-66. [3] A Jemal, T Murray, E Ward, A Samuels, RC Tiwari, A Ghafoor, EJ Feuer and MJ
Thun. Cancer statistics, 2005. CA Cancer J Clin 2005, 55(1): 10-30. [4] VR Zurawski, Jr., H Orjaseter, A Andersen and E Jellum. Elevated serum CA 125
levels prior to diagnosis of ovarian neoplasia: relevance for early detection of ovarian cancer. Int J Cancer 1988, 42(5): 677-680.
[5] D Neesham. Ovarian cancer screening. Aust Fam Physician 2007, 36(3): 126-128. [6] Ovarian Cancer Screening. NC Institute.
http://www.cancer.gov/cancertopics/pdq/screening/ovarian/Patient/page3#Keypoint8.
[7] KM Feeley and M Wells. Precursor lesions of ovarian epithelial malignancy.
Histopathology 2001, 38(2): 87-95. [8] L Dubeau. The cell of origin of ovarian epithelial tumors and the ovarian surface
epithelium dogma: does the emperor have no clothes? Gynecol Oncol 1999, 72(3): 437-442.
[9] S Orsulic, Y Li, RA Soslow, LA Vitale-Cross, JS Gutkind and HE Varmus.
Induction of ovarian cancer by defined multiple genetic changes in a mouse model system. Cancer Cell 2002, 1(1): 53-62.
[10] DC Connolly, R Bao, AY Nikitin, KC Stephens, TW Poole, X Hua, SS Harris,
BC Vanderhyden and TC Hamilton. Female mice chimeric for expression of the simian virus 40 TAg under control of the MISIIR promoter develop epithelial ovarian cancer. Cancer Res 2003, 63(6): 1389-1397.
94
[11] A Flesken-Nikitin, KC Choi, JP Eng, EN Shmidt and AY Nikitin. Induction of carcinogenesis by concurrent inactivation of p53 and Rb1 in the mouse ovarian surface epithelium. Cancer Res 2003, 63(13): 3459-3463.
[12] LM Roth. Recent advances in the pathology and classification of ovarian sex
cord-stromal tumors. Int J Gynecol Pathol 2006, 25(3): 199-215. [13] F Tavassoli and P Devilee eds. WHO Classification of Tumours. Pathology and
Genetics of Tumours of the Breast and Female Genital Organs. Lyon: IARC Press, 2003.
[14] JD Seidman, I Horkayne-Szakaly, M Haiba, CR Boice, RJ Kurman and BM
Ronnett. The histologic type and stage distribution of ovarian carcinomas of surface epithelial origin. Int J Gynecol Pathol 2004, 23(1): 41-44.
[15] M Shih Ie and RJ Kurman. Ovarian tumorigenesis: a proposed model based on
morphological and molecular genetic analysis. Am J Pathol 2004, 164(5): 1511-1518.
[16] RH Young and RE Scully. Differential diagnosis of ovarian tumors based
primarily on their patterns and cell types. Semin Diagn Pathol 2001, 18(3): 161-235.
[17] T Kaku, S Ogawa, Y Kawano, Y Ohishi, H Kobayashi, T Hirakawa and H
Nakano. Histological classification of ovarian cancer. Med Electron Microsc 2003, 36(1): 9-17.
[18] JH Shepherd. Revised FIGO staging for gynaecological cancer. Br J Obstet
Gynaecol 1989, 96(8): 889-892. [19] JB Trimbos, M Parmar, I Vergote, D Guthrie, G Bolis, N Colombo, JB
Vermorken, V Torri, C Mangioni, S Pecorelli, A Lissoni and AM Swart. International Collaborative Ovarian Neoplasm trial 1 and Adjuvant ChemoTherapy In Ovarian Neoplasm trial: two parallel randomized phase III trials of adjuvant chemotherapy in patients with early-stage ovarian carcinoma. J Natl Cancer Inst 2003, 95(2): 105-112.
[20] A du Bois, HJ Luck, W Meier, HP Adams, V Mobus, S Costa, T Bauknecht, B
Richter, M Warm, W Schroder, S Olbricht, U Nitz, C Jackisch, G Emons, U Wagner, W Kuhn and J Pfisterer. A randomized clinical trial of cisplatin/paclitaxel versus carboplatin/paclitaxel as first-line treatment of ovarian cancer. J Natl Cancer Inst 2003, 95(17): 1320-1329.
[21] SA Cannistra. Cancer of the ovary. N Engl J Med 1993, 329(21): 1550-1559.
95
[22] RF Ozols, BN Bundy, BE Greer, JM Fowler, D Clarke-Pearson, RA Burger, RS Mannel, K DeGeest, EM Hartenbach and R Baergen. Phase III trial of carboplatin and paclitaxel compared with cisplatin and paclitaxel in patients with optimally resected stage III ovarian cancer: a Gynecologic Oncology Group study. J Clin Oncol 2003, 21(17): 3194-3200.
[23] VT De-Vita Jr, S Hellman and S Rosenberg eds. Cancer: Principles and practice
of oncology. Philadelphia: Lippincott Williams and Wilkins, 2005. [24] M Markman, R Rothman, T Hakes, B Reichman, W Hoskins, S Rubin, W Jones,
L Almadrones and JL Lewis, Jr. Second-line platinum therapy in patients with ovarian cancer previously treated with cisplatin. J Clin Oncol 1991, 9(3): 389-393.
[25] MG Cantu, A Buda, G Parma, R Rossi, I Floriani, C Bonazzi, T Dell'Anna, V
Torri and N Colombo. Randomized controlled trial of single-agent paclitaxel versus cyclophosphamide, doxorubicin, and cisplatin in patients with recurrent ovarian cancer who responded to first-line platinum-based regimens. J Clin Oncol 2002, 20(5): 1232-1237.
[26] M Gore ed. Treatment of relapsed epithelial ovarian cancer. Alexandria:
American Society of Clinical Oncology, 2001. [27] M Selvakumaran, DA Pisarcik, R Bao, AT Yeung and TC Hamilton. Enhanced
cisplatin cytotoxicity by disturbing the nucleotide excision repair pathway in ovarian cancer cell lines. Cancer Res 2003, 63(6): 1311-1316.
[28] E Asselin, GB Mills and BK Tsang. XIAP regulates Akt activity and caspase-3-
dependent cleavage during cisplatin-induced apoptosis in human ovarian epithelial cancer cells. Cancer Res 2001, 61(5): 1862-1868.
[29] J Li, Q Feng, JM Kim, D Schneiderman, P Liston, M Li, B Vanderhyden, W
Faught, MF Fung, M Senterman, RG Korneluk and BK Tsang. Human ovarian cancer and cisplatin resistance: possible role of inhibitor of apoptosis proteins. Endocrinology 2001, 142(1): 370-380.
[30] M Campiglio, S Ali, PG Knyazev and A Ullrich. Characteristics of EGFR family-
mediated HRG signals in human ovarian cancer. J Cell Biochem 1999, 73(4): 522-532.
[31] AN Gordon, N Finkler, RP Edwards, AA Garcia, M Crozier, DH Irwin and E
Barrett. Efficacy and safety of erlotinib HCl, an epidermal growth factor receptor (HER1/EGFR) tyrosine kinase inhibitor, in patients with advanced ovarian carcinoma: results from a phase II multicenter study. Int J Gynecol Cancer 2005, 15(5): 785-792.
96
[32] RJ Schilder, MW Sill, X Chen, KM Darcy, SL Decesare, G Lewandowski, RB
Lee, CA Arciero, H Wu and AK Godwin. Phase II study of gefitinib in patients with relapsed or persistent ovarian or primary peritoneal carcinoma and evaluation of epidermal growth factor receptor mutations and immunohistochemical expression: a Gynecologic Oncology Group Study. Clin Cancer Res 2005, 11(15): 5539-5548.
[33] MA Bookman, KM Darcy, D Clarke-Pearson, RA Boothby and IR Horowitz.
Evaluation of monoclonal humanized anti-HER2 antibody, trastuzumab, in patients with recurrent or refractory ovarian or primary peritoneal carcinoma with overexpression of HER2: a phase II trial of the Gynecologic Oncology Group. J Clin Oncol 2003, 21(2): 283-290.
[34] N Ferrara, K Carver-Moore, H Chen, M Dowd, L Lu, KS O'Shea, L Powell-
Braxton, KJ Hillan and MW Moore. Heterozygous embryonic lethality induced by targeted inactivation of the VEGF gene. Nature 1996, 380(6573): 439-442.
[35] J Folkman. Role of angiogenesis in tumor growth and metastasis. Semin Oncol
2002, 29(6 Suppl 16): 15-18. [36] L Li, L Wang, W Zhang, B Tang, J Zhang, H Song, D Yao, Y Tang, X Chen, Z
Yang, G Wang, X Li, J Zhao, H Ding, E Reed and QQ Li. Correlation of serum VEGF levels with clinical stage, therapy efficacy, tumor metastasis and patient survival in ovarian cancer. Anticancer Res 2004, 24(3b): 1973-1979.
[37] S Yamamoto, I Konishi, M Mandai, H Kuroda, T Komatsu, K Nanbu, H Sakahara
and T Mori. Expression of vascular endothelial growth factor (VEGF) in epithelial ovarian neoplasms: correlation with clinicopathology and patient survival, and analysis of serum VEGF levels. Br J Cancer 1997, 76(9): 1221-1227.
[38] KJ Kim, B Li, J Winer, M Armanini, N Gillett, HS Phillips and N Ferrara.
Inhibition of vascular endothelial growth factor-induced angiogenesis suppresses tumour growth in vivo. Nature 1993, 362(6423): 841-844.
[39] KD Miller, LI Chap, FA Holmes, MA Cobleigh, PK Marcom, L Fehrenbacher, M
Dickler, BA Overmoyer, JD Reimann, AP Sing, V Langmuir and HS Rugo. Randomized phase III trial of capecitabine compared with bevacizumab plus capecitabine in patients with previously treated metastatic breast cancer. J Clin Oncol 2005, 23(4): 792-799.
[40] F Kabbinavar, HI Hurwitz, L Fehrenbacher, NJ Meropol, WF Novotny, G
Lieberman, S Griffing and E Bergsland. Phase II, randomized trial comparing
97
bevacizumab plus fluorouracil (FU)/leucovorin (LV) with FU/LV alone in patients with metastatic colorectal cancer. J Clin Oncol 2003, 21(1): 60-65.
[41] DH Johnson, L Fehrenbacher, WF Novotny, RS Herbst, JJ Nemunaitis, DM
Jablons, CJ Langer, RF DeVore, 3rd, J Gaudreault, LA Damico, E Holmgren and F Kabbinavar. Randomized phase II trial comparing bevacizumab plus carboplatin and paclitaxel with carboplatin and paclitaxel alone in previously untreated locally advanced or metastatic non-small-cell lung cancer. J Clin Oncol 2004, 22(11): 2184-2191.
[42] RA Burger, M Sill, BJ Monk, B Greer and JI Sorosky. Phase II trial of
bevacizumab in persistent or recurrent epithelial ovarian cancer (EOC) or primary peritoneal cancer (PPC): a Gynecologic Oncology Group (GOG) study. Proc. Am. Soc. Clin. Oncol 2005, 23: 4575. Abstract 5009.
[43] AA Garcia, AM Oza, H Hirte, G Fleming, D Tsao-Wei, L Roman, S Swenson, D
Gandara, S Scudder and R Morgan. Interim report of a phase II clinical trial of bevacizumab (Bev) and low dose metronomic oral cyclophosphamide (mCTX) in recurrent ovarian (OC) and primary peritoneal carcinoma: A California Cancer Consortium Trial. Proc. Am. Soc. Clin. Oncol. 2005, 23: 4555. Abstract 5000.
[44] PA Futreal, Q Liu, D Shattuck-Eidens, C Cochran, K Harshman, S Tavtigian, LM
Bennett, A Haugen-Strano, J Swensen, Y Miki, K Eddington, M McClure, C Frye, J Weaver-Feldhaus, W Ding, Z Gholami, P Soederkvist, L Terry, S Jhanwar, A Berchuck, JD Iglehart, J Marks, DG Ballinger, JC Barrett, MH Skolnick, A Kamb and R Wiseman. BRCA1 mutations in primary breast and ovarian carcinomas. Science 1994, 266(5182): 120-122.
[45] M Aarnio, JP Mecklin, LA Aaltonen, M Nystrom-Lahti and HJ Jarvinen. Life-
time risk of different cancers in hereditary non-polyposis colorectal cancer (HNPCC) syndrome. Int J Cancer 1995, 64(6): 430-433.
[46] C Bewtra, P Watson, T Conway, C Read-Hippee and HT Lynch. Hereditary
ovarian cancer: a clinicopathological study. Int J Gynecol Pathol 1992, 11(3): 180-187.
[47] Y Saga, H Mizukami, Y Takei, K Ozawa and M Suzuki. Suppression of cell
migration in ovarian cancer cells mediated by PTEN overexpression. Int J Oncol 2003, 23(4): 1109-1113.
[48] Y Wang, A Helland, R Holm, H Skomedal, VM Abeler, HE Danielsen, CG
Trope, AL Borresen-Dale and GB Kristensen. TP53 mutations in early-stage ovarian carcinoma, relation to long-term survival. Br J Cancer 2004, 90(3): 678-685.
98
[49] R Wooster, SL Neuhausen, J Mangion, Y Quirk, D Ford, N Collins, K Nguyen, S Seal, T Tran, D Averill and et al. Localization of a breast cancer susceptibility gene, BRCA2, to chromosome 13q12-13. Science 1994, 265(5181): 2088-2090.
[50] Y Miki, J Swensen, D Shattuck-Eidens, PA Futreal, K Harshman, S Tavtigian, Q
Liu, C Cochran, LM Bennett, W Ding, R Bell, J Rosenthal, C Hussey, T Tran, M McClure, C Frye, T Hattier, R Phelps, A Haugen-Strano, H Katcher, K Yakumo, Z Gholami, D Shaffer, S Stone, S Bayer, C Wray, R Bogden, P Dayananth, J Ward, P Tonin, S Narod, PK Bristow, FH Norris, L Helvering, P Morrison, P Rosteck, M Lai, JC Barrett, C Lewis, S Neuhausen, L Cannon-Albright, D Goldgar, R Wiseman, A Kamb and MH Skolnick. A strong candidate for the breast and ovarian cancer susceptibility gene BRCA1. Science 1994, 266(5182): 66-71.
[51] D Ford, DF Easton, DT Bishop, SA Narod and DE Goldgar. Risks of cancer in
BRCA1-mutation carriers. Breast Cancer Linkage Consortium. Lancet 1994, 343(8899): 692-695.
[52] JM Hall, MK Lee, B Newman, JE Morrow, LA Anderson, B Huey and MC King.
Linkage of early-onset familial breast cancer to chromosome 17q21. Science 1990, 250(4988): 1684-1689.
[53] H Ruffner and IM Verma. BRCA1 is a cell cycle-regulated nuclear
phosphoprotein. Proc Natl Acad Sci U S A 1997, 94(14): 7138-7143. [54] JM Gudas, T Li, H Nguyen, D Jensen, FJ Rauscher, 3rd and KH Cowan. Cell
cycle regulation of BRCA1 messenger RNA in human breast epithelial cells. Cell Growth Differ 1996, 7(6): 717-723.
[55] R Scully, J Chen, RL Ochs, K Keegan, M Hoekstra, J Feunteun and DM
Livingston. Dynamic changes of BRCA1 subnuclear location and phosphorylation state are initiated by DNA damage. Cell 1997, 90(3): 425-435.
[56] LV Lotti, L Ottini, C D'Amico, R Gradini, A Cama, F Belleudi, L Frati, MR
Torrisi and R Mariani-Costantini. Subcellular localization of the BRCA1 gene product in mitotic cells. Genes Chromosomes Cancer 2002, 35(3): 193-203.
[57] PS Brzovic, P Rajagopal, DW Hoyt, MC King and RE Klevit. Structure of a
BRCA1-BARD1 heterodimeric RING-RING complex. Nat Struct Biol 2001, 8(10): 833-837.
[58] RS Williams, R Green and JN Glover. Crystal structure of the BRCT repeat
region from the breast cancer-associated protein BRCA1. Nat Struct Biol 2001, 8(10): 838-842.
99
[59] PS Brzovic, JR Keeffe, H Nishikawa, K Miyamoto, D Fox, 3rd, M Fukuda, T Ohta and R Klevit. Binding and recognition in the assembly of an active BRCA1/BARD1 ubiquitin-ligase complex. Proc Natl Acad Sci U S A 2003, 100(10): 5646-5651.
[60] CX Deng and SG Brodie. Roles of BRCA1 and its interacting proteins. Bioessays
2000, 22(8): 728-737. [61] Y Wang, D Cortez, P Yazdi, N Neff, SJ Elledge and J Qin. BASC, a super
complex of BRCA1-associated proteins involved in the recognition and repair of aberrant DNA structures. Genes Dev 2000, 14(8): 927-939.
[62] Q Zhong, CF Chen, S Li, Y Chen, CC Wang, J Xiao, PL Chen, ZD Sharp and
WH Lee. Association of BRCA1 with the hRad50-hMre11-p95 complex and the DNA damage response. Science 1999, 285(5428): 747-750.
[63] ON Aprelikova, BS Fang, EG Meissner, S Cotter, M Campbell, A Kuthiala, M
Bessho, RA Jensen and ET Liu. BRCA1-associated growth arrest is RB-dependent. Proc Natl Acad Sci U S A 1999, 96(21): 11866-11871.
[64] J Chen, DP Silver, D Walpita, SB Cantor, AF Gazdar, G Tomlinson, FJ Couch,
BL Weber, T Ashley, DM Livingston and R Scully. Stable interaction between the products of the BRCA1 and BRCA2 tumor suppressor genes in mitotic and meiotic cells. Mol Cell 1998, 2(3): 317-328.
[65] R Scully, SF Anderson, DM Chao, W Wei, L Ye, RA Young, DM Livingston and
JD Parvin. BRCA1 is a component of the RNA polymerase II holoenzyme. Proc Natl Acad Sci U S A 1997, 94(11): 5605-5610.
[66] AR Venkitaraman. Cancer susceptibility and the functions of BRCA1 and
BRCA2. Cell 2002, 108(2): 171-182. [67] MS Brose, TR Rebbeck, KA Calzone, JE Stopfer, KL Nathanson and BL Weber.
Cancer risk estimates for BRCA1 mutation carriers identified in a risk evaluation program. J Natl Cancer Inst 2002, 94(18): 1365-1372.
[68] DF Easton, D Ford and DT Bishop. Breast and ovarian cancer incidence in
BRCA1-mutation carriers. Breast Cancer Linkage Consortium. Am J Hum Genet 1995, 56(1): 265-271.
[69] LS Friedman, EA Ostermeyer, CI Szabo, P Dowd, ED Lynch, SE Rowell and MC
King. Confirmation of BRCA1 by analysis of germline mutations linked to breast and ovarian cancer in ten families. Nat Genet 1994, 8(4): 399-404.
100
[70] LS Friedman, CI Szabo, EA Ostermeyer, P Dowd, L Butler, T Park, MK Lee, EL Goode, SE Rowell and MC King. Novel inherited mutations and variable expressivity of BRCA1 alleles, including the founder mutation 185delAG in Ashkenazi Jewish families. Am J Hum Genet 1995, 57(6): 1284-1297.
[71] SM Ginolhac, S Gad, M Corbex, B Bressac-De-Paillerets, A Chompret, YJ
Bignon, JP Peyrat, J Fournier, C Lasset, S Giraud, D Muller, JP Fricker, A Hardouin, P Berthet, C Maugard, C Nogues, R Lidereau, M Longy, S Olschwang, C Toulas, R Guimbaud, D Yannoukakos, C Szabo, F Durocher, AM Moisan, J Simard, S Mazoyer, HT Lynch, D Goldgar, D Stoppa-Lyonnet, GM Lenoir and OM Sinilnikova. BRCA1 wild-type allele modifies risk of ovarian cancer in carriers of BRCA1 germ-line mutations. Cancer Epidemiol Biomarkers Prev 2003, 12(2): 90-95.
[72] JP Struewing, D Abeliovich, T Peretz, N Avishai, MM Kaback, FS Collins and
LC Brody. The carrier frequency of the BRCA1 185delAG mutation is approximately 1 percent in Ashkenazi Jewish individuals. Nat Genet 1995, 11(2): 198-200.
[73] J Simard, P Tonin, F Durocher, K Morgan, J Rommens, S Gingras, C Samson, JF
Leblanc, C Belanger, F Dion, Q Liu, M Skolnick, D Goldgar, D Shattuck-Eidens, F Labrie and SA Narod. Common origins of BRCA1 mutations in Canadian breast and ovarian cancer families. Nat Genet 1994, 8(4): 392-398.
[74] LG Mullineaux, TM Castellano, J Shaw, L Axell, ME Wood, S Diab, C Klein, M
Sitarik, AM Deffenbaugh and SL Graw. Identification of germline 185delAG BRCA1 mutations in non-Jewish Americans of Spanish ancestry from the San Luis Valley, Colorado. Cancer 2003, 98(3): 597-602.
[75] O Diez, M Domenech, MC Alonso, J Brunet, J Sanz, J Cortes, E del Rio and M
Baiget. Identification of the 185delAG BRCA1 mutation in a Spanish Gypsy population. Hum Genet 1998, 103(6): 707-708.
[76] BB Roa, AA Boyd, K Volcik and CS Richards. Ashkenazi Jewish population
frequencies for common mutations in BRCA1 and BRCA2. Nat Genet 1996, 14(2): 185-187.
[77] AC Antoniou, PD Pharoah, S Narod, HA Risch, JE Eyfjord, JL Hopper, H
Olsson, O Johannsson, A Borg, B Pasini, P Radice, S Manoukian, DM Eccles, N Tang, E Olah, H Anton-Culver, E Warner, J Lubinski, J Gronwald, B Gorski, H Tulinius, S Thorlacius, H Eerola, H Nevanlinna, K Syrjakoski, OP Kallioniemi, D Thompson, C Evans, J Peto, F Lalloo, DG Evans and DF Easton. Breast and ovarian cancer risks to carriers of the BRCA1 5382insC and 185delAG and BRCA2 6174delT mutations: a combined analysis of 22 population based studies. J Med Genet 2005, 42(7): 602-603.
101
[78] JP Struewing, P Hartge, S Wacholder, SM Baker, M Berlin, M McAdams, MM
Timmerman, LC Brody and MA Tucker. The risk of cancer associated with specific mutations of BRCA1 and BRCA2 among Ashkenazi Jews. N Engl J Med 1997, 336(20): 1401-1408.
[79] MC King, JH Marks and JB Mandell. Breast and ovarian cancer risks due to
inherited mutations in BRCA1 and BRCA2. Science 2003, 302(5645): 643-646. [80] J Boyd, Y Sonoda, MG Federici, F Bogomolniy, E Rhei, DL Maresco, PE Saigo,
LA Almadrones, RR Barakat, CL Brown, DS Chi, JP Curtin, EA Poynor and WJ Hoskins. Clinicopathologic features of BRCA-linked and sporadic ovarian cancer. Jama 2000, 283(17): 2260-2265.
[81] H Aida, K Takakuwa, H Nagata, I Tsuneki, M Takano, S Tsuji, T Takahashi, T
Sonoda, M Hatae, K Takahashi, K Hasegawa, H Mizunuma, N Toyoda, H Kamata, Y Torii, N Saito, K Tanaka, M Yakushiji, T Araki and K Tanaka. Clinical features of ovarian cancer in Japanese women with germ-line mutations of BRCA1. Clin Cancer Res 1998, 4(1): 235-240.
[82] OT Johannsson, J Ranstam, A Borg and H Olsson. Survival of BRCA1 breast and
ovarian cancer patients: a population-based study from southern Sweden. J Clin Oncol 1998, 16(2): 397-404.
[83] PD Pharoah, DF Easton, DL Stockton, S Gayther and BA Ponder. Survival in
familial, BRCA1-associated, and BRCA2-associated epithelial ovarian cancer. United Kingdom Coordinating Committee for Cancer Research (UKCCCR) Familial Ovarian Cancer Study Group. Cancer Res 1999, 59(4): 868-871.
[84] SJ Ramus, A Fishman, PD Pharoah, S Yarkoni, M Altaras and BA Ponder.
Ovarian cancer survival in Ashkenazi Jewish patients with BRCA1 and BRCA2 mutations. Eur J Surg Oncol 2001, 27(3): 278-281.
[85] I Cass, RL Baldwin, T Varkey, R Moslehi, SA Narod and BY Karlan. Improved
survival in women with BRCA-associated ovarian carcinoma. Cancer 2003, 97(9): 2187-2195.
[86] Y Ben David, A Chetrit, G Hirsh-Yechezkel, E Friedman, BD Beck, U Beller, G
Ben-Baruch, A Fishman, H Levavi, F Lubin, J Menczer, B Piura, JP Struewing and B Modan. Effect of BRCA mutations on the length of survival in epithelial ovarian tumors. J Clin Oncol 2002, 20(2): 463-466.
[87] P Tassone, P Tagliaferri, A Perricelli, S Blotta, B Quaresima, ML Martelli, A
Goel, V Barbieri, F Costanzo, CR Boland and S Venuta. BRCA1 expression
102
modulates chemosensitivity of BRCA1-defective HCC1937 human breast cancer cells. Br J Cancer 2003, 88(8): 1285-1291.
[88] V Sylvain, S Lafarge and YJ Bignon. Dominant-negative activity of a Brca1
truncation mutant: effects on proliferation, tumorigenicity in vivo, and chemosensitivity in a mouse ovarian cancer cell line. Int J Oncol 2002, 20(4): 845-853.
[89] NC Johnson, HC Dan, JQ Cheng and PA Kruk. BRCA1 185delAG mutation
inhibits Akt-dependent, IAP-mediated caspase 3 inactivation in human ovarian surface epithelial cells. Exp Cell Res 2004, 298(1): 9-16.
[90] NC Johnson and PA Kruk. BRCA1 Zinc RING Finger Domain Disruption Alters
Caspase Response in Ovarian Surface Epithelial Cells. Cancer Cell Int 2002, 2(1): 7.
[91] A Saraste and K Pulkki. Morphologic and biochemical hallmarks of apoptosis.
Cardiovasc Res 2000, 45(3): 528-537. [92] M Leist and M Jaattela. Four deaths and a funeral: from caspases to alternative
mechanisms. Nat Rev Mol Cell Biol 2001, 2(8): 589-598. [93] P Fuentes-Prior and GS Salvesen. The protein structures that shape caspase
activity, specificity, activation and inhibition. Biochem J 2004, 384(Pt 2): 201-232.
[94] S Launay, O Hermine, M Fontenay, G Kroemer, E Solary and C Garrido. Vital
functions for lethal caspases. Oncogene 2005, 24(33): 5137-5148. [95] JC Timmer and GS Salvesen. Caspase substrates. Cell Death Differ 2007, 14(1):
66-72. [96] JM Adams. Ways of dying: multiple pathways to apoptosis. Genes Dev 2003,
17(20): 2481-2495. [97] Y Shi. Mechanical aspects of apoptosome assembly. Curr Opin Cell Biol 2006,
18(6): 677-684. [98] DW Nicholson. Apoptosis. Baiting death inhibitors. Nature 2001, 410(6824): 33-
34. [99] IN Lavrik, A Golks and PH Krammer. Caspases: pharmacological manipulation
of cell death. J Clin Invest 2005, 115(10): 2665-2672.

103
[100] SB Bratton, G Walker, SM Srinivasula, XM Sun, M Butterworth, ES Alnemri and GM Cohen. Recruitment, activation and retention of caspases-9 and -3 by Apaf-1 apoptosome and associated XIAP complexes. Embo J 2001, 20(5): 998-1009.
[101] A Saleh, SM Srinivasula, S Acharya, R Fishel and ES Alnemri. Cytochrome c and
dATP-mediated oligomerization of Apaf-1 is a prerequisite for procaspase-9 activation. J Biol Chem 1999, 274(25): 17941-17945.
[102] JM Adams and S Cory. The Bcl-2 apoptotic switch in cancer development and
therapy. Oncogene 2007, 26(9): 1324-1337. [103] YF Fu and TJ Fan. Bcl-2 family proteins and apoptosis. Sheng Wu Hua Xue Yu
Sheng Wu Wu Li Xue Bao (Shanghai) 2002, 34(4): 389-394. [104] JM Adams and S Cory. Apoptosomes: engines for caspase activation. Curr Opin
Cell Biol 2002, 14(6): 715-720. [105] MG Hinds and CL Day. Regulation of apoptosis: uncovering the binding
determinants. Curr Opin Struct Biol 2005, 15(6): 690-699. [106] S Cory, DC Huang and JM Adams. The Bcl-2 family: roles in cell survival and
oncogenesis. Oncogene 2003, 22(53): 8590-8607. [107] CX Lu, TJ Fan, GB Hu and RS Cong. Apoptosis-inducing factor and apoptosis.
Sheng Wu Hua Xue Yu Sheng Wu Wu Li Xue Bao (Shanghai) 2003, 35(10): 881-885.
[108] EH Cheng, MC Wei, S Weiler, RA Flavell, TW Mak, T Lindsten and SJ
Korsmeyer. BCL-2, BCL-X(L) sequester BH3 domain-only molecules preventing BAX- and BAK-mediated mitochondrial apoptosis. Mol Cell 2001, 8(3): 705-711.
[109] WX Zong, T Lindsten, AJ Ross, GR MacGregor and CB Thompson. BH3-only
proteins that bind pro-survival Bcl-2 family members fail to induce apoptosis in the absence of Bax and Bak. Genes Dev 2001, 15(12): 1481-1486.
[110] CS Duckett, VE Nava, RW Gedrich, RJ Clem, JL Van Dongen, MC Gilfillan, H
Shiels, JM Hardwick and CB Thompson. A conserved family of cellular genes related to the baculovirus iap gene and encoding apoptosis inhibitors. Embo J 1996, 15(11): 2685-2694.
[111] P Liston, N Roy, K Tamai, C Lefebvre, S Baird, G Cherton-Horvat, R Farahani,
M McLean, JE Ikeda, A MacKenzie and RG Korneluk. Suppression of apoptosis in mammalian cells by NAIP and a related family of IAP genes. Nature 1996, 379(6563): 349-353.
104
[112] E Rajcan-Separovic, P Liston, C Lefebvre and RG Korneluk. Assignment of human inhibitor of apoptosis protein (IAP) genes xiap, hiap-1, and hiap-2 to chromosomes Xq25 and 11q22-q23 by fluorescence in situ hybridization. Genomics 1996, 37(3): 404-406.
[113] M Lagace, JY Xuan, SS Young, C McRoberts, J Maier, E Rajcan-Separovic and
RG Korneluk. Genomic organization of the X-linked inhibitor of apoptosis and identification of a novel testis-specific transcript. Genomics 2001, 77(3): 181-188.
[114] G Ambrosini, C Adida and DC Altieri. A novel anti-apoptosis gene, survivin,
expressed in cancer and lymphoma. Nat Med 1997, 3(8): 917-921. [115] GM Kasof and BC Gomes. Livin, a novel inhibitor of apoptosis protein family
member. J Biol Chem 2001, 276(5): 3238-3246. [116] Y Yang, S Fang, JP Jensen, AM Weissman and JD Ashwell. Ubiquitin protein
ligase activity of IAPs and their degradation in proteasomes in response to apoptotic stimuli. Science 2000, 288(5467): 874-877.
[117] G Kroemer, L Galluzzi and C Brenner. Mitochondrial membrane
permeabilization in cell death. Physiol Rev 2007, 87(1): 99-163. [118] BP Eckelman, GS Salvesen and FL Scott. Human inhibitor of apoptosis proteins:
why XIAP is the black sheep of the family. EMBO Rep 2006, 7(10): 988-994. [119] N Jiang, Y Meng, S Zhang, E Mensah-Osman and S Sheng. Maspin sensitizes
breast carcinoma cells to induced apoptosis. Oncogene 2002, 21(26): 4089-4098. [120] K Latha, W Zhang, N Cella, HY Shi and M Zhang. Maspin mediates increased
tumor cell apoptosis upon induction of the mitochondrial permeability transition. Mol Cell Biol 2005, 25(5): 1737-1748.
[121] Z Zou, A Anisowicz, MJ Hendrix, A Thor, M Neveu, S Sheng, K Rafidi, E Seftor
and R Sager. Maspin, a serpin with tumor-suppressing activity in human mammary epithelial cells. Science 1994, 263(5146): 526-529.
[122] S Sheng, J Carey, EA Seftor, L Dias, MJ Hendrix and R Sager. Maspin acts at the
cell membrane to inhibit invasion and motility of mammary and prostatic cancer cells. Proc Natl Acad Sci U S A 1996, 93(21): 11669-11674.
[123] BW Futscher, MM Oshiro, RJ Wozniak, N Holtan, CL Hanigan, H Duan and FE
Domann. Role for DNA methylation in the control of cell type specific maspin expression. Nat Genet 2002, 31(2): 175-179.
105
[124] M Zhang, N Maass, D Magit and R Sager. Transactivation through Ets and Ap1 transcription sites determines the expression of the tumor-suppressing gene maspin. Cell Growth Differ 1997, 8(2): 179-186.
[125] M Zhang, O Volpert, YH Shi and N Bouck. Maspin is an angiogenesis inhibitor.
Nat Med 2000, 6(2): 196-199. [126] ML Cher, HR Biliran, Jr., S Bhagat, Y Meng, M Che, J Lockett, J Abrams, R
Fridman, M Zachareas and S Sheng. Maspin expression inhibits osteolysis, tumor growth, and angiogenesis in a model of prostate cancer bone metastasis. Proc Natl Acad Sci U S A 2003, 100(13): 7847-7852.
[127] RE Seftor, EA Seftor, S Sheng, PA Pemberton, R Sager and MJ Hendrix. maspin
suppresses the invasive phenotype of human breast carcinoma. Cancer Res 1998, 58(24): 5681-5685.
[128] VA Odero-Marah, Z Khalkhali-Ellis, J Chunthapong, S Amir, RE Seftor, EA
Seftor and MJ Hendrix. Maspin regulates different signaling pathways for motility and adhesion in aggressive breast cancer cells. Cancer Biol Ther 2003, 2(4): 398-403.
[129] BJ Nickoloff, MW Lingen, BD Chang, M Shen, M Swift, J Curry, P Bacon, B
Bodner and IB Roninson. Tumor suppressor maspin is up-regulated during keratinocyte senescence, exerting a paracrine antiangiogenic activity. Cancer Res 2004, 64(9): 2956-2961.
[130] M Zhang, Y Shi, D Magit, PA Furth and R Sager. Reduced mammary tumor
progression in WAP-TAg/WAP-maspin bitransgenic mice. Oncogene 2000, 19(52): 6053-6058.
[131] M Zhang, S Sheng, N Maass and R Sager. mMaspin: the mouse homolog of a
human tumor suppressor gene inhibits mammary tumor invasion and motility. Mol Med 1997, 3(1): 49-59.
[132] S Sugimoto, N Maass, Y Takimoto, K Sato, S Minei, M Zhang, Y Hoshikawa, KP
Junemann, W Jonat and K Nagasaki. Expression and regulation of tumor suppressor gene maspin in human bladder cancer. Cancer Lett 2004, 203(2): 209-215.
[133] SL Rose, MP Fitzgerald, NO White, MJ Hitchler, BW Futscher, K De Geest and
FE Domann. Epigenetic regulation of maspin expression in human ovarian carcinoma cells. Gynecol Oncol 2006, 102(2): 319-324.
106
[134] C Ngamkitidechakul, JM Burke, WJ O'Brien and SS Twining. Maspin: synthesis by human cornea and regulation of in vitro stromal cell adhesion to extracellular matrix. Invest Ophthalmol Vis Sci 2001, 42(13): 3135-3141.
[135] M Bettstetter, M Woenckhaus, PJ Wild, P Rummele, H Blaszyk, A Hartmann, F
Hofstadter and W Dietmaier. Elevated nuclear maspin expression is associated with microsatellite instability and high tumour grade in colorectal cancer. J Pathol 2005, 205(5): 606-614.
[136] P Surowiak, V Materna, M Drag-Zalesinska, A Wojnar, I Kaplenko, M
Spaczynski, M Dietel, M Zabel and H Lage. Maspin expression is characteristic for cisplatin-sensitive ovarian cancer cells and for ovarian cancer cases of longer survival rates. Int J Gynecol Pathol 2006, 25(2): 131-139.
[137] N Sato, N Fukushima, H Matsubayashi and M Goggins. Identification of maspin
and S100P as novel hypomethylation targets in pancreatic cancer using global gene expression profiling. Oncogene 2004, 23(8): 1531-1538.
[138] S Ogasawara, C Maesawa, M Yamamoto, Y Akiyama, K Wada, K Fujisawa, T
Higuchi, Y Tomisawa, N Sato, S Endo, K Saito and T Masuda. Disruption of cell-type-specific methylation at the Maspin gene promoter is frequently involved in undifferentiated thyroid cancers. Oncogene 2004, 23(5): 1117-1124.
[139] C Maesawa, S Ogasawara, A Yashima-Abo, T Kimura, K Kotani, S Masuda, Y
Nagata, T Iwaya, K Suzuki, T Oyake, Y Akiyama, H Kawamura and T Masuda. Aberrant maspin expression in gallbladder epithelium is associated with intestinal metaplasia in patients with cholelithiasis. J Clin Pathol 2006, 59(3): 328-330.
[140] C Boltze, R Schneider-Stock, C Quednow, R Hinze, C Mawrin, A Hribaschek, A
Roessner and C Hoang-Vu. Silencing of the maspin gene by promoter hypermethylation in thyroid cancer. Int J Mol Med 2003, 12(4): 479-484.
[141] AK Sood, MS Fletcher, LM Gruman, JE Coffin, S Jabbari, Z Khalkhali-Ellis, N
Arbour, EA Seftor and MJ Hendrix. The paradoxical expression of maspin in ovarian carcinoma. Clin Cancer Res 2002, 8(9): 2924-2932.
[142] MM Abd El-Wahed. Expression and subcellular localization of maspin in human
ovarian epithelial neoplasms: correlation with clinicopathologic features. J Egypt Natl Canc Inst 2005, 17(3): 173-183.
[143] AA Secord, PS Lee, KM Darcy, LJ Havrilesky, LA Grace, JR Marks and A
Berchuck. Maspin expression in epithelial ovarian cancer and associations with poor prognosis: a Gynecologic Oncology Group study. Gynecol Oncol 2006, 101(3): 390-397.
107
[144] LA Solomon, AR Munkarah, VL Schimp, MH Arabi, RT Morris, H Nassar and R Ali-Fehmi. Maspin expression and localization impact on angiogenesis and prognosis in ovarian cancer. Gynecol Oncol 2006, 101(3): 385-389.
[145] M Zhang, D Magit and R Sager. Expression of maspin in prostate cells is
regulated by a positive ets element and a negative hormonal responsive element site recognized by androgen receptor. Proc Natl Acad Sci U S A 1997, 94(11): 5673-5678.
[146] Z Zou, C Gao, AK Nagaich, T Connell, S Saito, JW Moul, P Seth, E Appella and
S Srivastava. p53 regulates the expression of the tumor suppressor gene maspin. J Biol Chem 2000, 275(9): 6051-6054.
[147] K Spiesbach, A Tannapfel, J Mossner and K Engeland. TAp63gamma can
substitute for p53 in inducing expression of the maspin tumor suppressor. Int J Cancer 2005, 114(4): 555-562.
[148] Z Khalkhali-Ellis, AL Christian, DA Kirschmann, EM Edwards, M Rezaie-
Thompson, MA Vasef, LM Gruman, RE Seftor, LE Norwood and MJ Hendrix. Regulating the tumor suppressor gene maspin in breast cancer cells: a potential mechanism for the anticancer properties of tamoxifen. Clin Cancer Res 2004, 10(2): 449-454.
[149] Z Liu, HY Shi, Z Nawaz and M Zhang. Tamoxifen induces the expression of
maspin through estrogen receptor-alpha. Cancer Lett 2004, 209(1): 55-65. [150] FE Domann, JC Rice, MJ Hendrix and BW Futscher. Epigenetic silencing of
maspin gene expression in human breast cancers. Int J Cancer 2000, 85(6): 805-810.
[151] JS Reis-Filho, B Torio, A Albergaria and FC Schmitt. Maspin expression in
normal skin and usual cutaneous carcinomas. Virchows Arch 2002, 441(6): 551-558.
[152] Y Akiyama, C Maesawa, S Ogasawara, M Terashima and T Masuda. Cell-type-
specific repression of the maspin gene is disrupted frequently by demethylation at the promoter region in gastric intestinal metaplasia and cancer cells. Am J Pathol 2003, 163(5): 1911-1919.
[153] N Sato, A Maitra, N Fukushima, NT van Heek, H Matsubayashi, CA Iacobuzio-
Donahue, C Rosty and M Goggins. Frequent hypomethylation of multiple genes overexpressed in pancreatic ductal adenocarcinoma. Cancer Res 2003, 63(14): 4158-4166.
108
[154] MA Bookman. Standard treatment in advanced ovarian cancer in 2005: the state of the art. Int J Gynecol Cancer 2005, 15 Suppl 3(212-220.
[155] P Speiser. [Familial ovarian carcinoma]. Wien Med Wochenschr 1996, 146(1-2):
10-13. [156] R Angioli, R Estape, M Mason and M Penalver. Hereditary and sporadic ovarian
cancer: genetic testing and clinical implications (review). Int J Oncol 1998, 12(5): 1029-1034.
[157] CI Szabo, LA Wagner, LV Francisco, JC Roach, R Argonza, MC King and EA
Ostrander. Human, canine and murine BRCA1 genes: sequence comparison among species. Hum Mol Genet 1996, 5(9): 1289-1298.
[158] JE Quinn, RD Kennedy, PB Mullan, PM Gilmore, M Carty, PG Johnston and DP
Harkin. BRCA1 functions as a differential modulator of chemotherapy-induced apoptosis. Cancer Res 2003, 63(19): 6221-6228.
[159] DA Levine, MG Federici, VE Reuter and J Boyd. Cell proliferation and apoptosis
in BRCA-associated hereditary ovarian cancer. Gynecol Oncol 2002, 85(3): 431-434.
[160] M Thangaraju, SH Kaufmann and FJ Couch. BRCA1 facilitates stress-induced
apoptosis in breast and ovarian cancer cell lines. J Biol Chem 2000, 275(43): 33487-33496.
[161] KA McEachern, WB Archey, K Douville and BA Arrick. BRCA1 splice variants
exhibit overlapping and distinct transcriptional transactivation activities. J Cell Biochem 2003, 89(1): 120-132.
[162] CF Xu, MA Brown, JA Chambers, B Griffiths, H Nicolai and E Solomon.
Distinct transcription start sites generate two forms of BRCA1 mRNA. Hum Mol Genet 1995, 4(12): 2259-2264.
[163] M Munnes, S Fanaei, B Schmitz, I Muiznieks, AM Holschneider and W Doerfler.
Familial form of hirschsprung disease: nucleotide sequence studies reveal point mutations in the RET proto-oncogene in two of six families but not in other candidate genes. Am J Med Genet 2000, 94(1): 19-27.
[164] N Shao, YL Chai, E Shyam, P Reddy and VN Rao. Induction of apoptosis by the
tumor suppressor protein BRCA1. Oncogene 1996, 13(1): 1-7. [165] TI Orban and E Olah. Emerging roles of BRCA1 alternative splicing. Mol Pathol
2003, 56(4): 191-197.
109
[166] YL Yang and XM Li. The IAP family: endogenous caspase inhibitors with multiple biological activities. Cell Res 2000, 10(3): 169-177.
[167] PA Kruk, AK Godwin, TC Hamilton and N Auersperg. Telomeric instability and
reduced proliferative potential in ovarian surface epithelial cells from women with a family history of ovarian cancer. Gynecol Oncol 1999, 73(2): 229-236.
[168] M Takakura, S Kyo, T Kanaya, H Hirano, J Takeda, M Yutsudo and M Inoue.
Cloning of human telomerase catalytic subunit (hTERT) gene promoter and identification of proximal core promoter sequences essential for transcriptional activation in immortalized and cancer cells. Cancer Res 1999, 59(3): 551-557.
[169] SV Nicosia, GD Wilbanks, B Saunders, J Mayer, RJ Cardosi, PA Kruk, J Cheng,
W Bai, D Coppola and J Fiorica. Cytology of human ovarian surface epithelial brushings. Cancer 2004, 102(1): 1-10.
[170] P Correc, MC Fondaneche, M Bracke and P Burtin. The presence of plasmin
receptors on three mammary carcinoma MCF-7 sublines. Int J Cancer 1990, 46(4): 745-750.
[171] MY Alfonso-De Matte, JQ Cheng and PA Kruk. Ultraviolet irradiation- and
dimethyl sulfoxide-induced telomerase activity in ovarian epithelial cell lines. Exp Cell Res 2001, 267(1): 13-27.
[172] GA Ulaner, JF Hu, TH Vu, LC Giudice and AR Hoffman. Telomerase activity in
human development is regulated by human telomerase reverse transcriptase (hTERT) transcription and by alternate splicing of hTERT transcripts. Cancer Res 1998, 58(18): 4168-4172.
[173] N Auersperg, SL Maines-Bandiera, HG Dyck and PA Kruk. Characterization of
cultured human ovarian surface epithelial cells: phenotypic plasticity and premalignant changes. Lab Invest 1994, 71(4): 510-518.
[174] JW Shay and S Bacchetti. A survey of telomerase activity in human cancer. Eur J
Cancer 1997, 33(5): 787-791. [175] BB Wolf, M Schuler, F Echeverri and DR Green. Caspase-3 is the primary
activator of apoptotic DNA fragmentation via DNA fragmentation factor-45/inhibitor of caspase-activated DNase inactivation. J Biol Chem 1999, 274(43): 30651-30656.
[176] FJ Oliver, G de la Rubia, V Rolli, MC Ruiz-Ruiz, G de Murcia and JM Murcia.
Importance of poly(ADP-ribose) polymerase and its cleavage in apoptosis. Lesson from an uncleavable mutant. J Biol Chem 1998, 273(50): 33533-33539.
110
[177] MA Brown, H Nicolai, K Howe, T Katagiri, N Lalani el, KJ Simpson, NW Manning, A Deans, P Chen, KK Khanna, MR Wati, BL Griffiths, CF Xu, GW Stamp and E Solomon. Expression of a truncated Brca1 protein delays lactational mammary development in transgenic mice. Transgenic Res 2002, 11(5): 467-478.
[178] S Fan, R Yuan, YX Ma, Q Meng, ID Goldberg and EM Rosen. Mutant BRCA1
genes antagonize phenotype of wild-type BRCA1. Oncogene 2001, 20(57): 8215-8235.
[179] L Perrin-Vidoz, OM Sinilnikova, D Stoppa-Lyonnet, GM Lenoir and S Mazoyer.
The nonsense-mediated mRNA decay pathway triggers degradation of most BRCA1 mRNAs bearing premature termination codons. Hum Mol Genet 2002, 11(23): 2805-2814.
[180] M Sun, G Wang, JE Paciga, RI Feldman, ZQ Yuan, XL Ma, SA Shelley, R Jove,
PN Tsichlis, SV Nicosia and JQ Cheng. AKT1/PKBalpha kinase is frequently elevated in human cancers and its constitutive activation is required for oncogenic transformation in NIH3T3 cells. Am J Pathol 2001, 159(2): 431-437.
[181] ZQ Yuan, M Sun, RI Feldman, G Wang, X Ma, C Jiang, D Coppola, SV Nicosia
and JQ Cheng. Frequent activation of AKT2 and induction of apoptosis by inhibition of phosphoinositide-3-OH kinase/Akt pathway in human ovarian cancer. Oncogene 2000, 19(19): 2324-2330.
[182] JA Crowell, VE Steele and JR Fay. Targeting the AKT protein kinase for cancer
chemoprevention. Mol Cancer Ther 2007, 6(8): 2139-2148. [183] J LoPiccolo, CA Granville, JJ Gills and PA Dennis. Targeting Akt in cancer
therapy. Anticancer Drugs 2007, 18(8): 861-874. [184] CH Streuli. Maspin is a tumour suppressor that inhibits breast cancer tumour
metastasis in vivo. Breast Cancer Res 2002, 4(4): 137-140. [185] S Abraham, W Zhang, N Greenberg and M Zhang. Maspin functions as tumor
suppressor by increasing cell adhesion to extracellular matrix in prostate tumor cells. J Urol 2003, 169(3): 1157-1161.
[186] N Maass, T Hojo, M Ueding, J Luttges, G Kloppel, W Jonat and K Nagasaki.
Expression of the tumor suppressor gene Maspin in human pancreatic cancers. Clin Cancer Res 2001, 7(4): 812-817.
[187] JD O'Donnell, NC Johnson, TD Turbeville, MY Alfonso and PA Kruk. BRCA1
185delAG Truncation Protein, BRAt, Amplifies Caspase-Mediated Apoptosis in Ovarian Cells. In Vitro Cell Dev Biol Anim Submitted for review, January 2008,

111
[188] M Dobbelstein and J Roth. The large T antigen of simian virus 40 binds and inactivates p53 but not p73. J Gen Virol 1998, 79 (3079-3083.
[189] H Yamaguchi, Y Ding, JF Lee, M Zhang, A Pal, W Bornmann, DH Yan and MC
Hung. Interferon-inducible protein IFIXalpha inhibits cell invasion by upregulating the metastasis suppressor maspin. Mol Carcinog 2008, E-pub ahead of print.
[190] Z Khalkhali-Ellis. Maspin: the new frontier. Clin Cancer Res 2006, 12(24): 7279-
7283.

ABOUT THE AUTHOR
Joshua O’Donnell completed his undergraduate studies at Southwest Missouri
State University where he graduated with a B.S. degree in Cell and Molecular Biology
and a minor in Chemistry. Joshua completed a predoctoral fellowship in the Pediatric
Oncology Education program at St. Jude Children’s Research Hospital before entering
the Medical Science Ph.D program in the USF College of Medicine in 2003. He was
awarded with the Superior Presentation Award at the USF Health Research Day in 2005.
He presented his research at the American Association for Cancer Research annual
meeting in 2004, 2006, and 2007 and was one of two students from USF to be invited to
the 2007 National Graduate Student Research Festival at the National Institutes of Health
in Bethesda, MD. Joshua was also very active with the Association of Medical Science
Graduate Students, serving one year as secretary and another year as president.