break-even analysis. digital safari institute greenbizz project key questions how many items should...
TRANSCRIPT

Break-even AnalysisBreak-even Analysis
Digital Safari InstituteGreenBizz Project
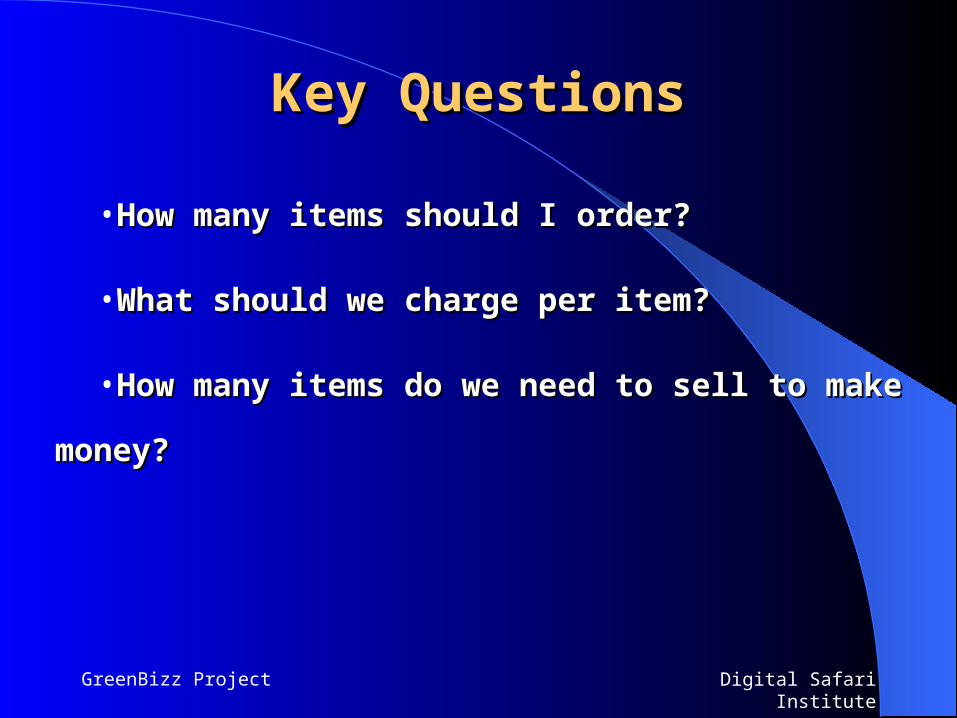
Key QuestionsKey Questions
•How many items should I order?How many items should I order?
•What should we charge per item?What should we charge per item?
•How many items do we need to sell to make money?How many items do we need to sell to make money?

Digital Safari InstituteGreenBizz Project
When will Your When will Your Business Make Money?Business Make Money?
Break-even pointBreak-even point: no loss, no gain: no loss, no gain
You need to know: You need to know:
How many units/hours do you need to How many units/hours do you need to sell in order to cover your costs?sell in order to cover your costs?
How much revenue do you need to How much revenue do you need to bring in to cover your costs?bring in to cover your costs?

Digital Safari InstituteGreenBizz Project
Break-even: Two PerspectivesBreak-even: Two Perspectives
Break-even Volume = Break-even Volume = Number of Units (or Hours)Number of Units (or Hours) to Achieve No Profit, No Loss to Achieve No Profit, No Loss
Break-even Sales = Break-even Sales = Level of Revenue NeededLevel of Revenue Needed to Achieve No Profit, No Loss to Achieve No Profit, No Loss
Digital Safari InstituteGreenBizz Project
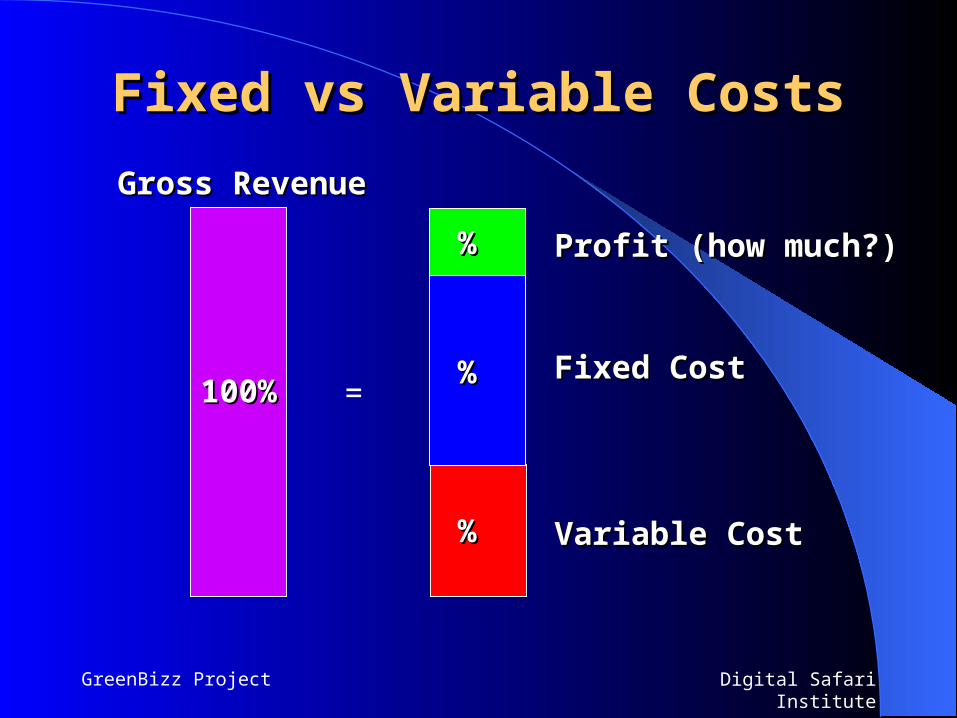
Fixed vs Variable CostsFixed vs Variable Costs
=
Profit (how much?)Profit (how much?)
Variable CostVariable Cost
Fixed Cost Fixed Cost
Gross RevenueGross Revenue
%%
%%
%%
100%100%

Digital Safari InstituteGreenBizz Project
Wholesale vs Retail PriceWholesale vs Retail Price
==
Wholesale PriceWholesale Price
Retail MarkupRetail Markup
Retail PriceRetail Price
40%40%
60%60%
100%100%

Break-even VolumeBreak-even Volume

Digital Safari InstituteGreenBizz Project
Data NeededData Needed
Total Fixed CostsTotal Fixed Costs
Price per UnitPrice per Unit
Variable Cost per UnitVariable Cost per Unit
Projected Unit SalesProjected Unit Sales
Projected Sales RevenueProjected Sales Revenue

Digital Safari InstituteGreenBizz Project
Calculating Break-even VolumeCalculating Break-even Volume
Break-even Volume = Break-even Volume =
Total Fixed CostsTotal Fixed Costs
Sales Price per Unit – Variable Cost per UnitSales Price per Unit – Variable Cost per Unit

Digital Safari InstituteGreenBizz Project
Data NeededData Needed
Total Fixed Costs = $175,000Total Fixed Costs = $175,000
Sales Price per Unit = $10Sales Price per Unit = $10
Variable Cost per Unit = $4Variable Cost per Unit = $4
Projected Unit Sales = 50,000Projected Unit Sales = 50,000
Projected Sales Revenue = $500,000Projected Sales Revenue = $500,000

Digital Safari InstituteGreenBizz Project
Step #1 Step #1 –– Revenue Line Revenue LineTotal Revenue
Revenue Line
45 degree angle

Digital Safari InstituteGreenBizz Project
Step #1 Step #1 –– Revenue Line Revenue Line$1,000K
$900K
$800K
$700K
$600K
$500K
$400K
$300K
$200K
$100K
00 10K 20K 30K 40K 50,000 60K 70K 80K 90K 100,000
Unit Sales Volume
Total Revenue
Revenue Line

Digital Safari InstituteGreenBizz Project
Step #2 Step #2 –– Fixed Costs Fixed Costs$1,000K
$900K
$800K
$700K
$600K
$500K
$400K
$300K
$200K
$100K
00 10K 20K 30K 40K 50,000 60K 70K 80K 90K 100,000
Unit Sales Volume
Total Revenue
Fixed Costs = $175,000
Revenue Line

Digital Safari InstituteGreenBizz Project
Step #3 Step #3 –– Variable Costs Variable Costs$1,000K
$900K
$800K
$700K
$600K
$500K
$400K
$300K
$200K
$100K
00 10K 20K 30K 40K 50,000 60K 70K 80K 90K 100,000
Unit Sales Volume
Total Revenue
Fixed Costs = $175,000
Variable Costs = $200,000
Total Costs = $375,000
Revenue Line

Digital Safari InstituteGreenBizz Project
Step #3 Step #3 –– Variable Cost Line Variable Cost Line$1,000K
$900K
$800K
$700K
$600K
$500K
$400K
$300K
$200K
$100K
00 10K 20K 30K 40K 50,000 60K 70K 80K 90K 100,000
Unit Sales Volume
Total Revenue
Fixed Costs = $175,000
Variable Costs = $200,000
Total Costs = $375,000
Revenue Line
Total Expense Line

Digital Safari InstituteGreenBizz Project
Step #4 Step #4 –– Break-even Point Break-even Point$1,000K
$900K
$800K
$700K
$600K
$500K
$400K
$300K
$200K
$100K
00 10K 20K 30K 40K 50,000 60K 70K 80K 90K 100,000
Unit Sales Volume
Total Revenue
Fixed Costs = $175,000
Variable Costs = $200,000
Total Costs = $375,000
B.E. = 29,167 units
Revenue Line
Total Expense Line
Digital Safari InstituteGreenBizz Project
Step #4 Step #4 –– Break-even Point Break-even Point$1,000K
$900K
$800K
$700K
$600K
$500K
$400K
$300K
$200K
$100K
00 10K 20K 30K 40K 50,000 60K 70K 80K 90K 100,000
Unit Sales Volume
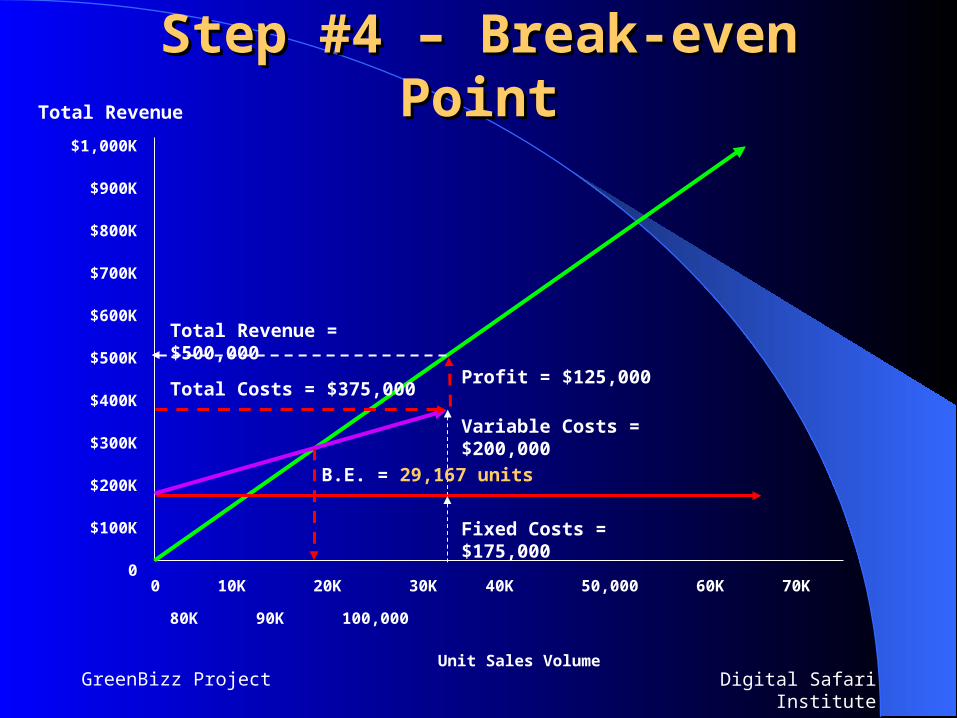
Total Revenue
Fixed Costs = $175,000
Variable Costs = $200,000
Total Costs = $375,000
B.E. = 29,167 units
Profit = $125,000
Total Revenue = $500,000

Digital Safari InstituteGreenBizz Project
Your Break-even EstimateYour Break-even EstimateEach Executive: $8,000/monthEach Tech/Sales: $7,000/monthEach Admin: $5,000/month
Headquarters: $1.50/sq. ft.
Utilities/Operations: $1,000/month
Your Product: $???/unitParts/Materials: $???Labor: $20/hr US or $0.50/hr ChinaShipping: $0.10/pound FOB China

Go For It!Go For It!

Digital Safari InstituteGreenBizz Project
Scenario #1 Scenario #1 –– Lower Fixed Costs Lower Fixed Costs
$1,000K
$900K
$800K
$700K
$600K
$500K
$400K
$300K
$200K
$100K
00 10K 20K 30K 40K 50,000 60K 70K 80K 90K 100,000
Unit Sales Volume
Total Revenue
Fixed Costs = $157,500
Variable Costs = $200,000
Total Costs = $357,500
B.E. = 26,250 units
Profit = $142,500
Total Revenue = $500,000
Lower Fixed Costs by 10%

Digital Safari InstituteGreenBizz Project
Scenario #2 Scenario #2 –– Raise Unit Price Raise Unit Price$1,000K
$900K
$800K
$700K
$600K
$500K
$400K
$300K
$200K
$100K
00 10K 20K 30K 40K 50,000 60K 70K 80K 90K 100,000
Unit Sales Volume
Total Revenue
Fixed Costs = $175,000
Variable Costs = $200,000
Total Costs = $375,000
B.E. = 25,000 units
Profit = $175,000
Total Revenue = $550,000
Raise Price by 10%

Digital Safari InstituteGreenBizz Project
Scenario #3 Scenario #3 –– Lower Variable Costs Lower Variable Costs
$1,000K
$900K
$800K
$700K
$600K
$500K
$400K
$300K
$200K
$100K
00 10K 20K 30K 40K 50,000 60K 70K 80K 90K 100,000
Unit Sales Volume
Total Revenue
Fixed Costs = $175,000
Variable Costs = $180,000
Total Costs = $355,000
B.E. = 27,344 units
Profit = $145,000
Total Revenue = $500,000
Lower Variable Costs by 10%

Digital Safari InstituteGreenBizz Project
Scenario ComparisonScenario Comparison
Original Costs & Pricing … BE = 29,167Profit: $125,000
Lower Fixed Costs by 10% … BE = 26,250Profit: $142,500
Raise Unit Price by 10% … BE = 25,000Profit: $175,000
Lower Variable Unit Cost by 10% … BE = 27,344Profit: $145,000