breaking down barriers to energy efficiency and renewable energy deployment … · ·...
TRANSCRIPT

Breaking Down Barriers to Energy Efficiency and Renewable Energy Deployment in Water and Waste
Title Style
May 27, 2015
Better Plants Challenge
U.S. Department of Energy May 2015
Martin L. Adams, P.E. Senior Assistant General Manager – Water System
Los Angeles Department of Water and Power
Barriers and Solutions to Energy Efficiency and Renewable Energy in the Water Facilities
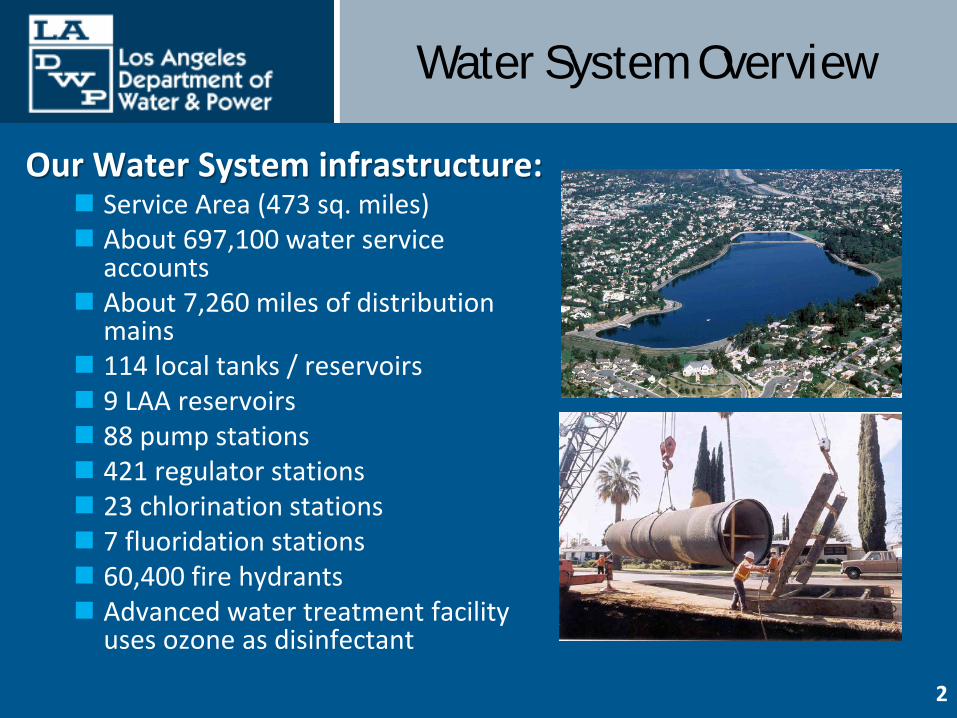
Our Water System infrastructure: Service Area (473 sq. miles) About 697,100 water service
accounts About 7,260 miles of distribution
mains 114 local tanks / reservoirs 9 LAA reservoirs 88 pump stations 421 regulator stations 23 chlorination stations 7 fluoridation stations 60,400 fire hydrants Advanced water treatment facility
uses ozone as disinfectant
Water System Overview
2

Distribution
3
Much of the hydraulic head required for water distribution is provided by gravity
The average energy
intensity for LADWP water distribution is approximately 196 kWh/AF
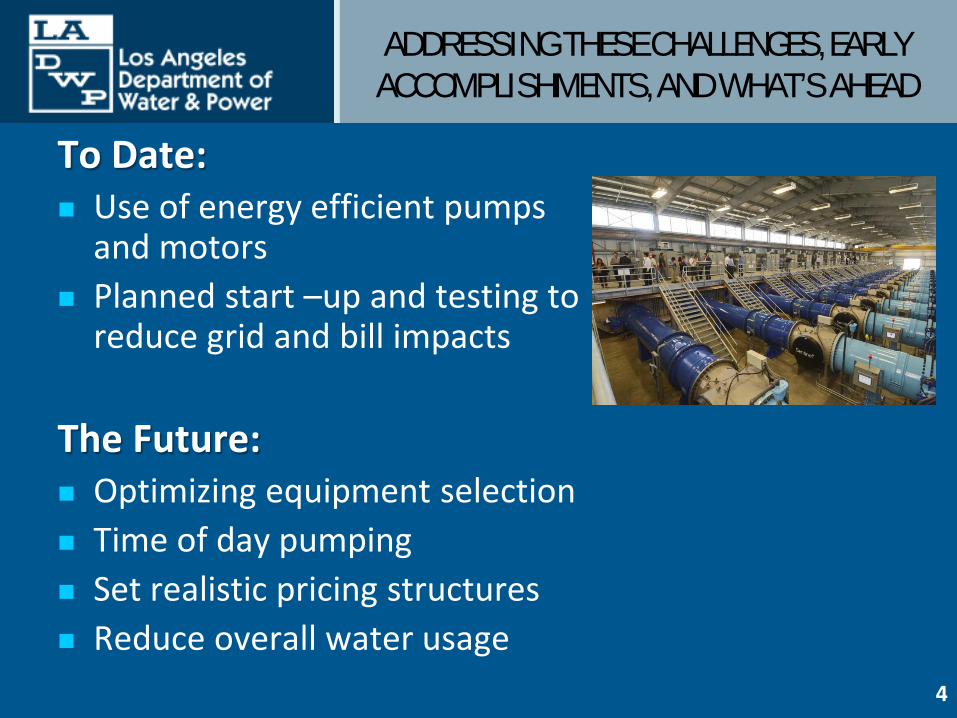
ADDRESSING THESE CHALLENGES, EARLY ACCOMPLISHMENTS, AND WHAT’S AHEAD
To Date: Use of energy efficient pumps
and motors Planned start –up and testing to
reduce grid and bill impacts
The Future: Optimizing equipment selection Time of day pumping Set realistic pricing structures Reduce overall water usage
4

Sources of Water for Los Angeles
Bay Delta LA
Aqueduct
Colorado River Aqueduct
State Water Project
Sierra Mountains
Local Groundwater, Stormwater, Conservation & Recycling
5

Los Angeles Aqueduct (LAA) System
6
The 233-mile long LAA provides water from the Eastern Sierra watershed and is entirely gravity fed.
14 Hydro-generation plants along the
aqueduct system. On average, the LAA system generates approximately 2,456 kWh/AF
Lee Vining Intake: 7,100 ft. elev
Los Angeles Reservoir: 1,134 ft. elev

State Water Project (SWP)
7
Water supplies are conveyed along the 444-mile California Aqueduct
Energy intensity of the West Branch is 2,614 kWh/AF
Energy intensity of the East Branch is 3,263 KWh/AF
Highest Single Pump Lift: 1,926 ft.
1,500 ft. elev.

Colorado River Aqueduct (CRA)
8
Water supplies are conveyed along the 242-mile CRA Aqueduct
CRA Energy Intensity is 2,027 kWh/AF
Net Pump Lift: 1,617 ft; Highest Single Lift 441 ft. at Hinds PP.
Colorado River, 450 ft. elev. Lake Matthews, 1,390 ft. elev.
0
200,000
400,000
600,000
800,000
1,000,000
1,200,000
2003 2004 2005 2006 2007 2008 2009 2010 2011 2012 2013
Tota
l Ene
rgy
(MW
h)
Calendar Year
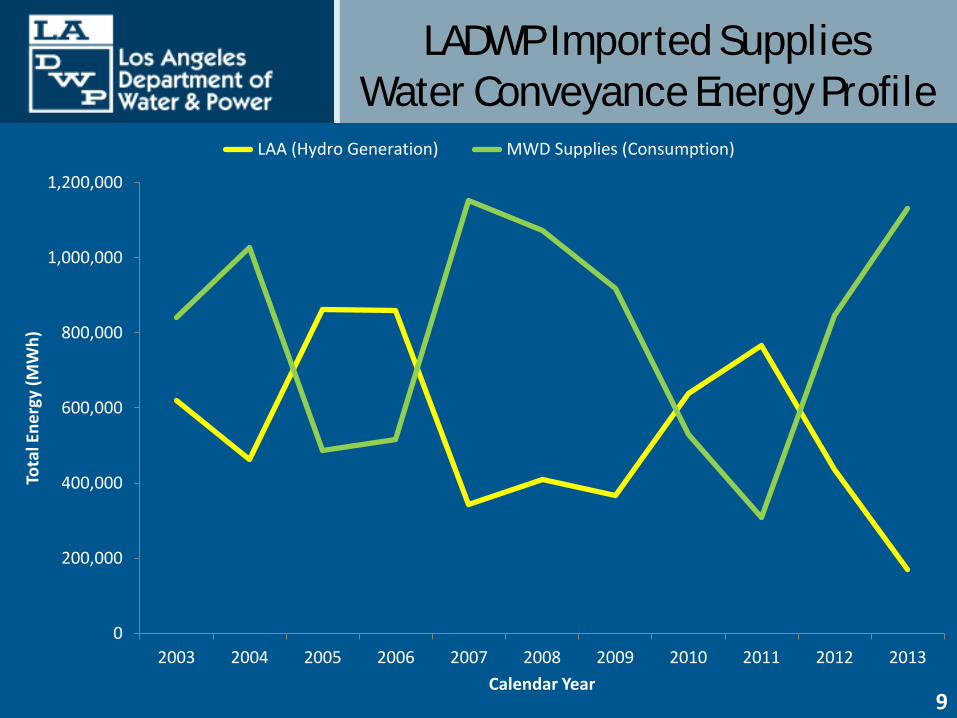
LAA (Hydro Generation) MWD Supplies (Consumption)
LADWP Imported Supplies Water Conveyance Energy Profile
9

Local Groundwater
10
City has 115 groundwater production wells
More than 50% of the
wells are inactive due to GW contamination
The average energy intensity is approx. 580 kWh/AF
Why Energy Efficiency and Renewable Energy Warrants Attention in Water and
Wastewater Systems
Power costs can be a key component of water costs, depending on source
Most local and sustainable sources
come with energy costs
Sustainability in Water and Power resources can oppose each other when it comes to energy usage
11
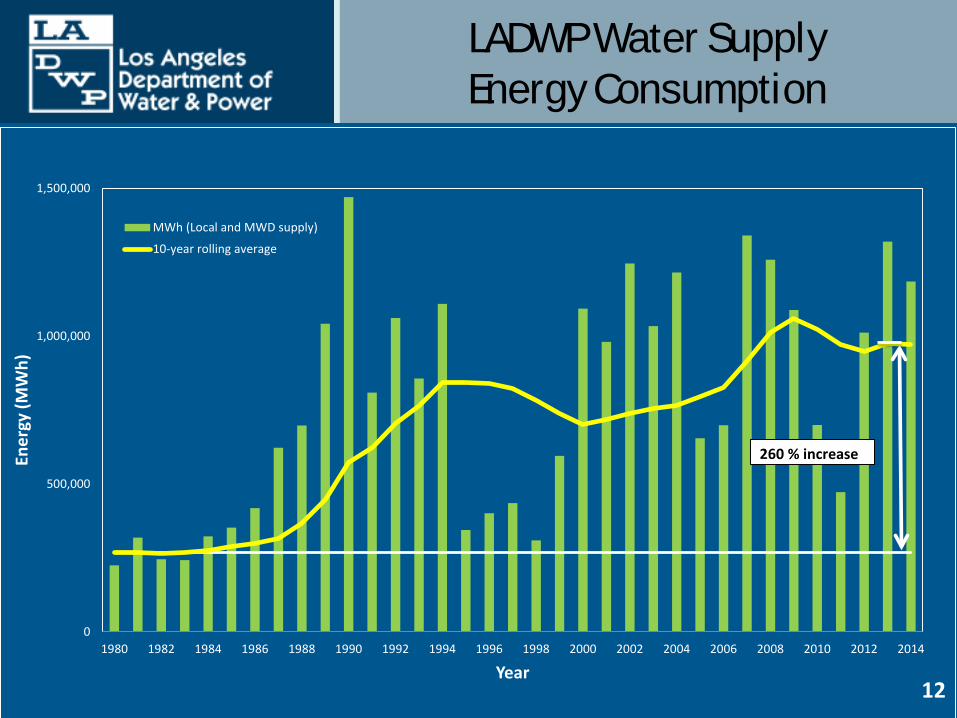
LADWP Water Supply Energy Consumption
12
0
500,000
1,000,000
1,500,000
1980 1982 1984 1986 1988 1990 1992 1994 1996 1998 2000 2002 2004 2006 2008 2010 2012 2014
Ener
gy (M
Wh)
Year
MWh (Local and MWD supply)
10-year rolling average
260 % increase
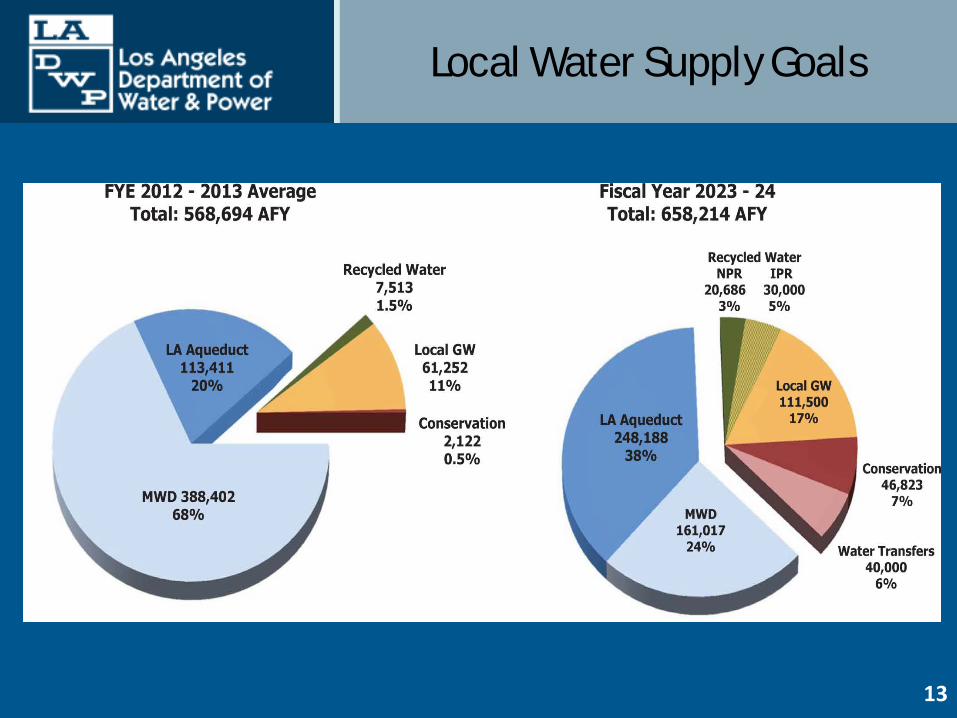
Local Water Supply Goals
13

Benefits of Water Conservation
Cumulative water conserved from FY 2007/08 to FY 2013/14 by LADWP customers is 578,141 acre-feet.
Equivalent to: Powering over 308,000 homes in
L.A. for 1 year Eliminating 1.48 billion pounds of
CO2 emissions Eliminating 134,772 passenger
vehicle emissions for 1 year Avoiding GHG emissions by recycling
over 244,000 tons of waste instead of sending it to the landfill
14

Summary Comparison of Energy Intensity
15

The Challenges Faced
In contrast to other forms of energy efficiency typically addressed by local or state governments, meaningful savings in the water sector brings into question:
Large scale energy efficiency Reliability of energy supply Substantial cost impacts to an historically cheap commodity Absorbing energy needs of new water sources
16
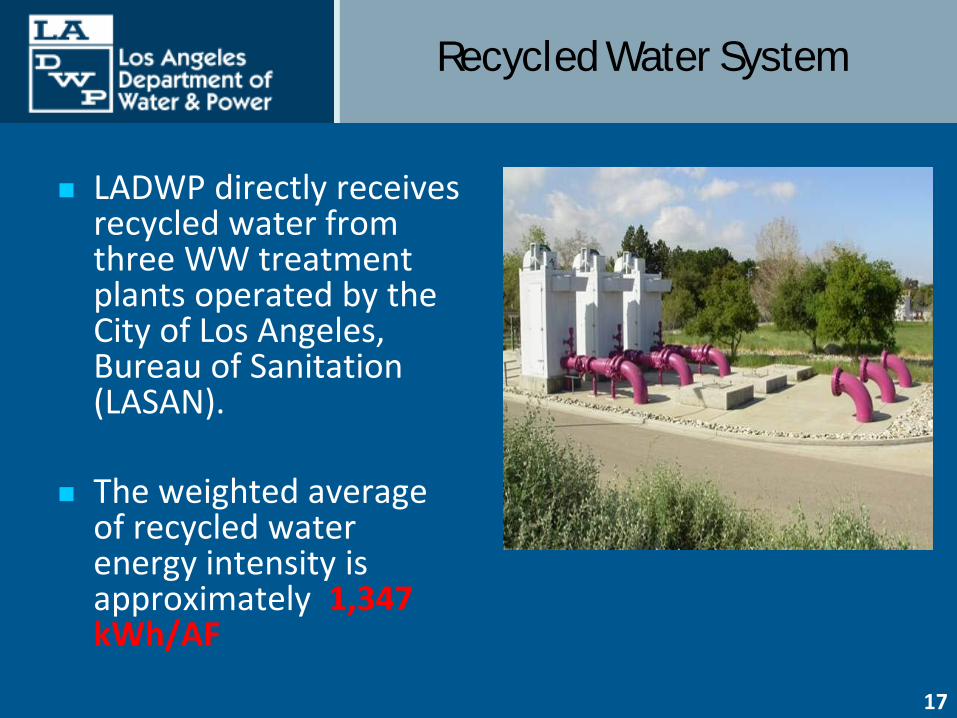
Recycled Water System
17
LADWP directly receives recycled water from three WW treatment plants operated by the City of Los Angeles, Bureau of Sanitation (LASAN).
The weighted average
of recycled water energy intensity is approximately 1,347 kWh/AF
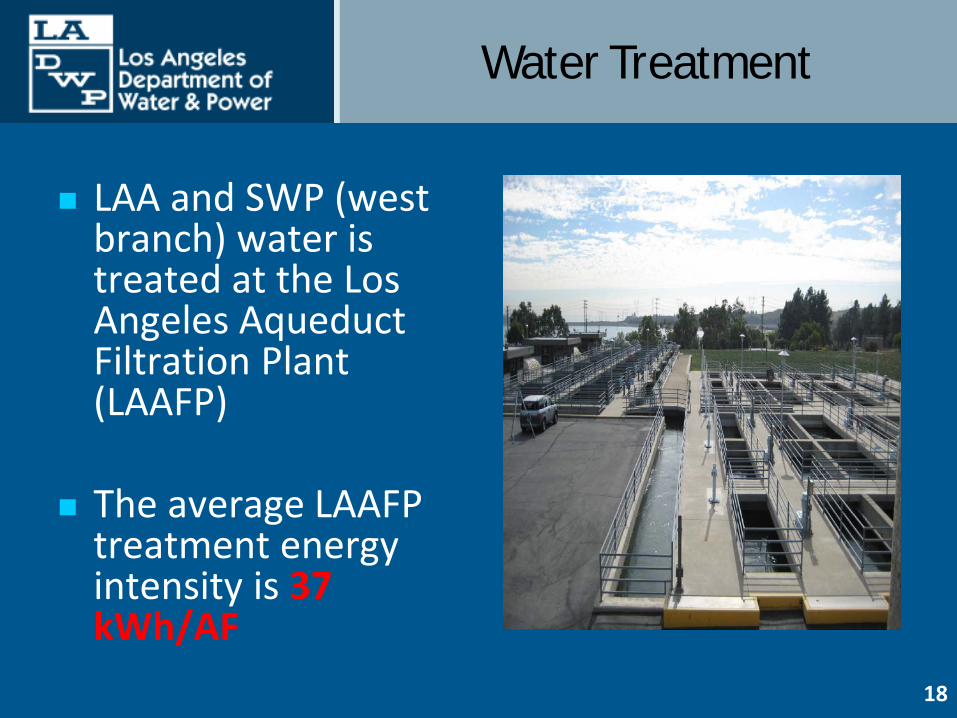
Water Treatment
18
LAA and SWP (west branch) water is treated at the Los Angeles Aqueduct Filtration Plant (LAAFP)
The average LAAFP
treatment energy intensity is 37 kWh/AF

Projected Water Supply Energy Demands
19
0
200,000
400,000
600,000
800,000
1,000,000
1,200,000
2015 2020 2025 2030 2035
Ener
gy (
MW
h)
Year
Projected MWh
Projected No MWD offset
Series2
* including MWD estimates
Status Quo
Based on 2010 UWMP Projections (average hydrologic conditions)
Based on ED5 goals (average hydrologic conditions)
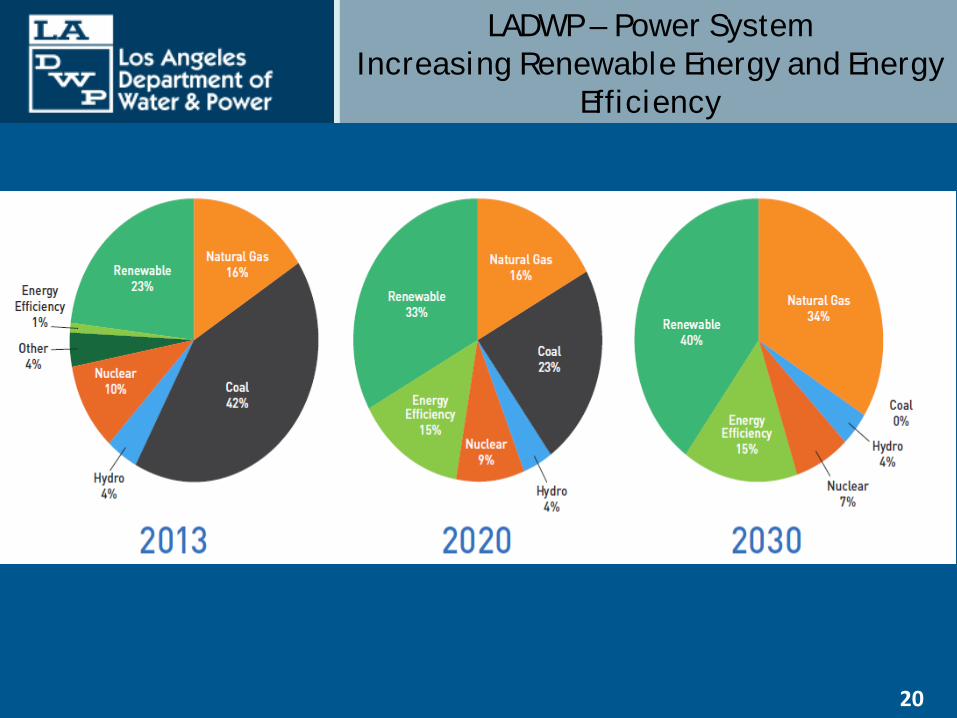
LADWP – Power System Increasing Renewable Energy and Energy
Efficiency
20
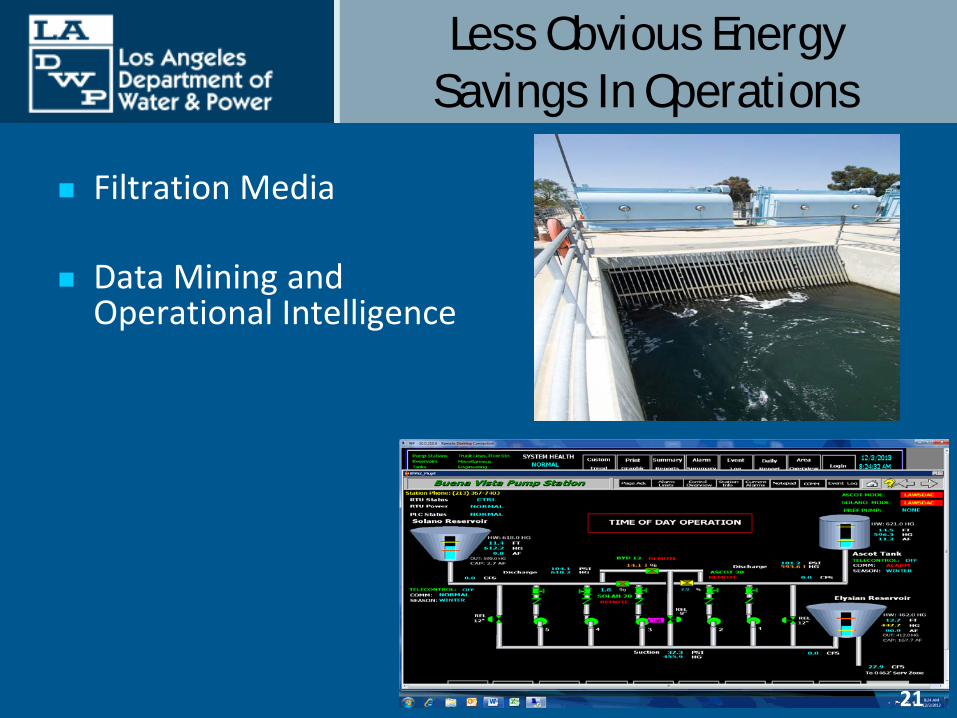
Less Obvious Energy Savings In Operations
Filtration Media Data Mining and
Operational Intelligence
21

Water Loss Control
22
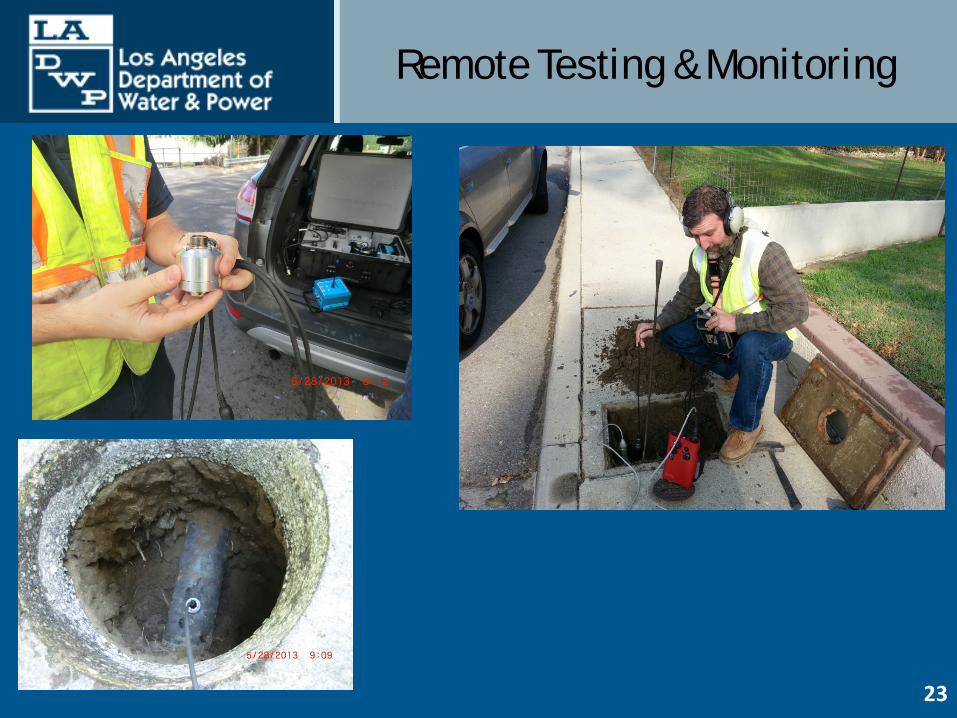
Remote Testing & Monitoring
23

Shade Balls
24
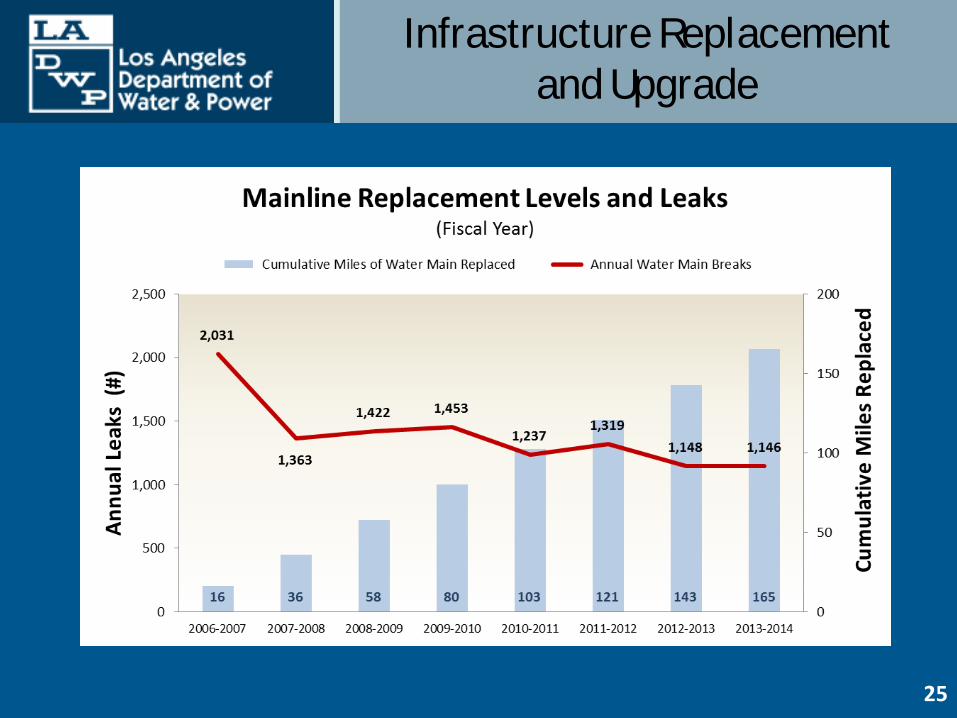
Infrastructure Replacement and Upgrade
25
Conclusions
26

6/8/2015 27
Energy Efficiency and Renewable Energy in the Wastewater Treatment Sector Better Buildings Summit
May 27, 2015

Agenda
• Project Description • Why this project • How could it work
• Partnerships • Introductions • Organizational strengths to
leveraged • Timeline/Milestones
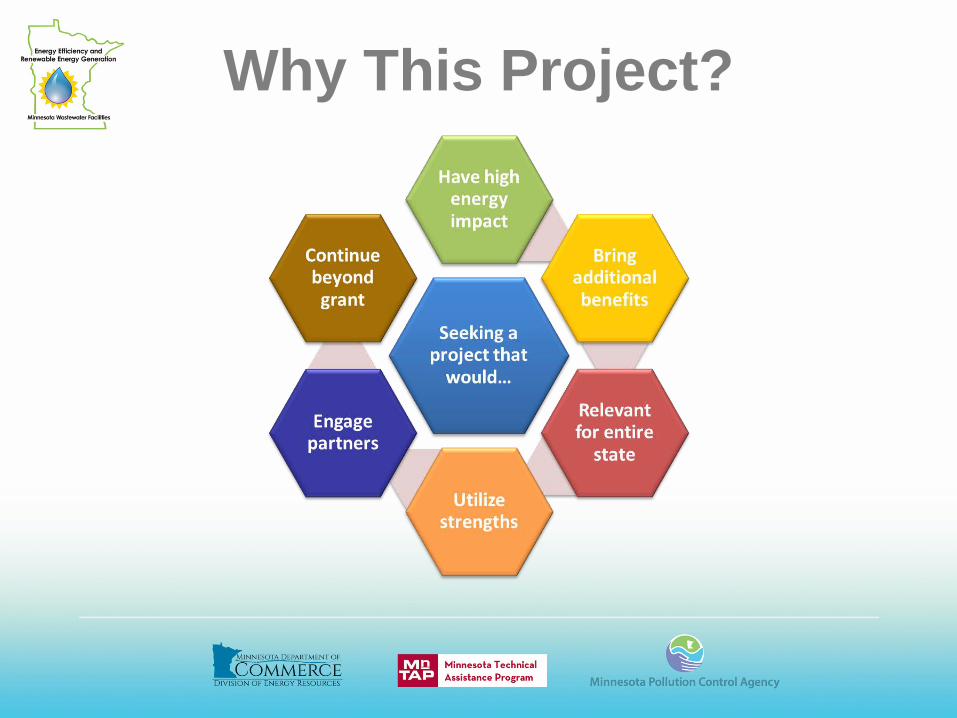
Why This Project?
Project Goal
Decrease energy use in Minnesota municipal wastewater facilities and scope opportunities
for energy generation
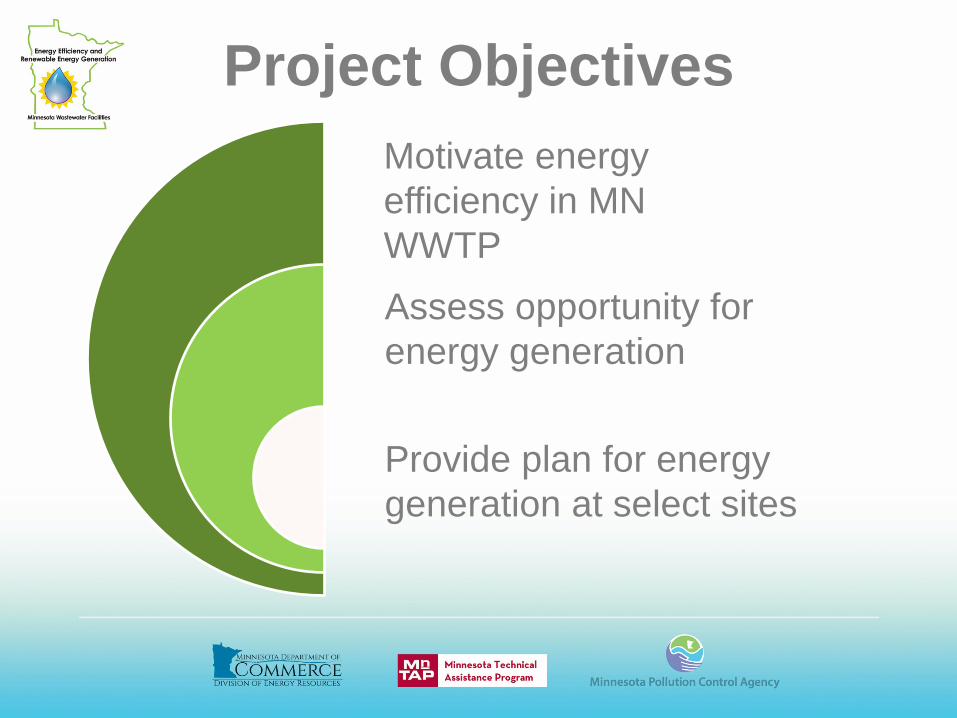
Project Objectives
Provide plan for energy generation at select sites
Assess opportunity for energy generation
Motivate energy efficiency in MN WWTP

Approach
• Commerce DER • PCA Water • DEED • GESP • Loan Programs • Grant Programs • Energy Resources
Center
• Vendors • Utilities • Regional Partnerships • Technical Assistance • University Engagement • Rural Water Association • Municipalities
Capitalize on the strengths of state and local resources
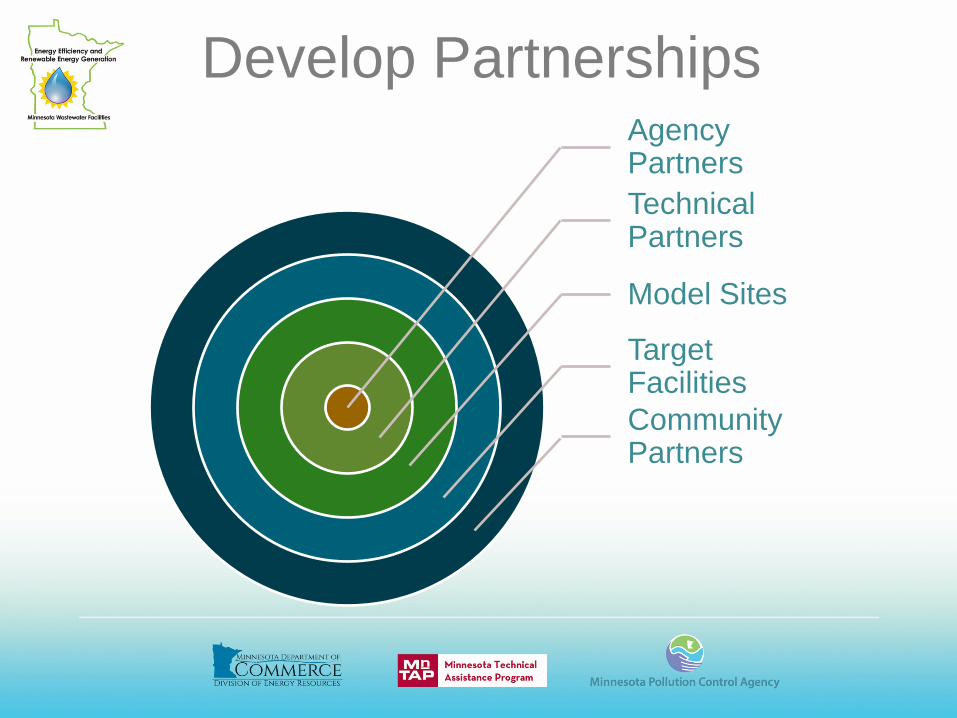
Agency Partners Technical Partners
Model Sites
Target Facilities Community Partners
Develop Partnerships
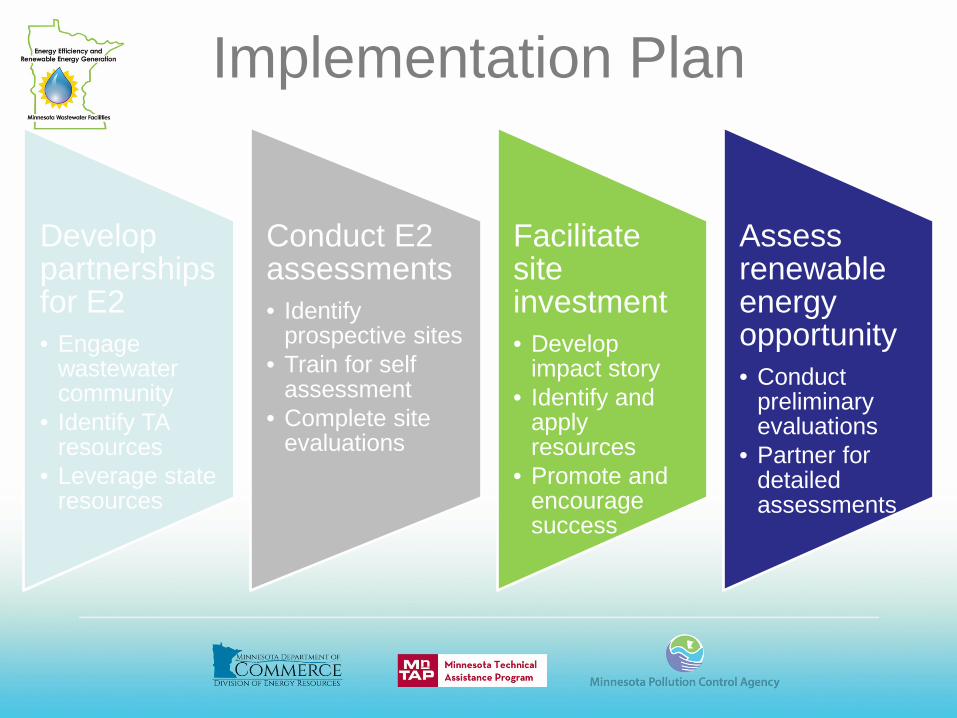
Implementation Plan
Develop partnerships for E2 • Engage
wastewater community
• Identify TA resources
• Leverage state resources
Conduct E2 assessments • Identify
prospective sites • Train for self
assessment • Complete site
evaluations
Facilitate site investment • Develop
impact story • Identify and
apply resources
• Promote and encourage success
Assess renewable energy opportunity • Conduct
preliminary evaluations
• Partner for detailed assessments

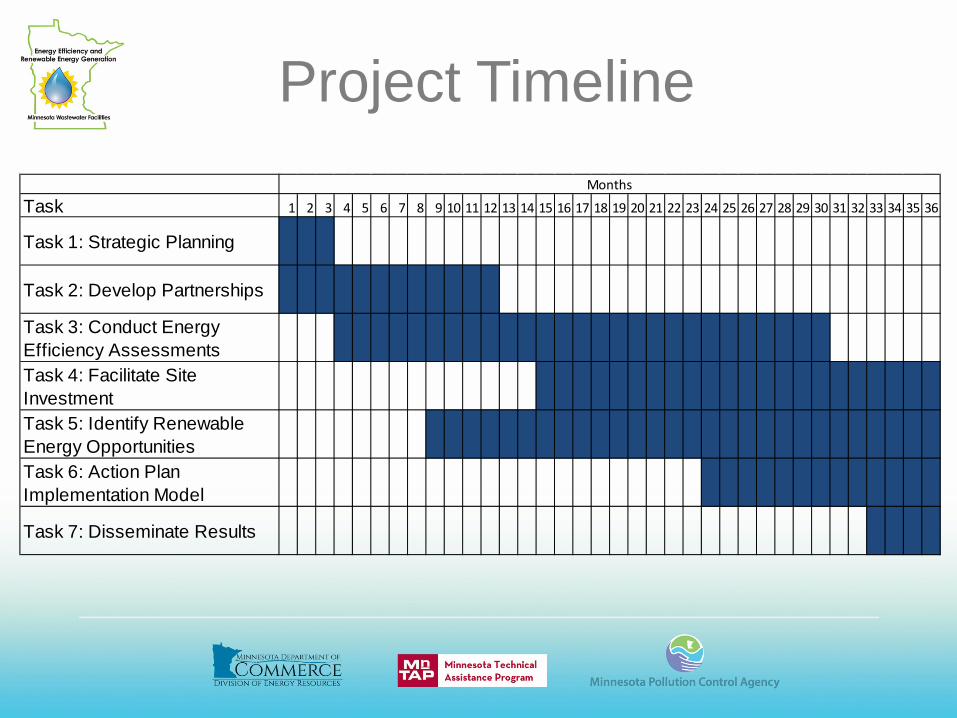
Task 1 2 3 4 5 6 7 8 9 10 11 12 13 14 15 16 17 18 19 20 21 22 23 24 25 26 27 28 29 30 31 32 33 34 35 36
Task 1: Strategic Planning
Task 2: Develop Partnerships
Task 3: Conduct Energy Efficiency AssessmentsTask 4: Facilitate Site InvestmentTask 5: Identify Renewable Energy OpportunitiesTask 6: Action Plan Implementation Model
Task 7: Disseminate Results
Months
Project Timeline
Next Steps • Continue developing partnerships • Engage model sites for informational interviews • Promote project opportunities • Identify/engage candidate assessment sites • Compile publicly available site data • Develop WWTP benchmarking capabilities • Establish training opportunity and curriculum

Jessica Burdette Minnesota Department of Commerce [email protected] 612-839-6659 Adam Zoet Minnesota Department of Commerce [email protected] 612-539-1798 Laura Babcock University of Minnesota – MNTAP [email protected] 612-624-4678 AJ Van den Berghe University of Minnesota – MNTAP [email protected] 612-624-4653

• 6th Largest State • 15 Counties • 30 State Parks • 22 National Parks • 22 Native
American Indian Tribes
• Lack Hwy Infrastructure
• 4 IECC Climate Zones
Arizona Facts

Community Energy Program Top 5 Problems for the Next 50 Years
1. Energy 2. Water 3. Food 4. Environment 5. Poverty

42
What’s the Energy Cost in Water EPA estimates 3-4 percent of national electricity consumption. Water and wastewater utilities are typically the largest consumers of energy, accounting for 30-40 percent of total energy consumed.
Energy costs make up the majority of an annual operating budget within a community, typically second only to labor costs.
Energy costs have a direct impact on an area’s economic health through inefficient energy use and high utility rates.
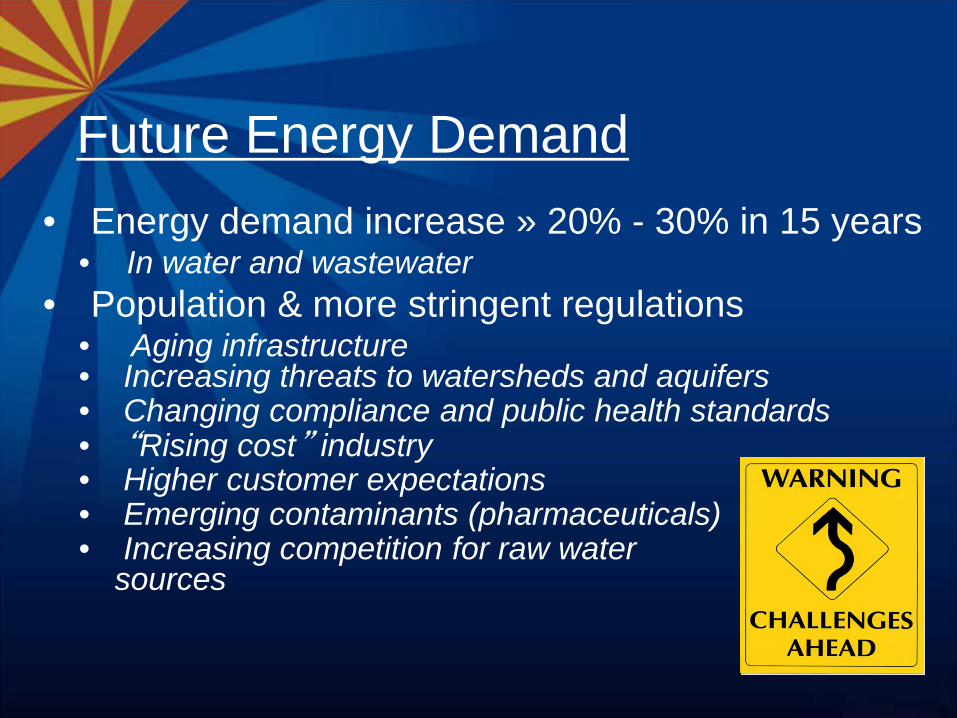
Future Energy Demand • Energy demand increase » 20% - 30% in 15 years
• In water and wastewater • Population & more stringent regulations
• Aging infrastructure • Increasing threats to watersheds and aquifers • Changing compliance and public health standards • “Rising cost” industry • Higher customer expectations • Emerging contaminants (pharmaceuticals) • Increasing competition for raw water
sources

GOEP Action
In February 2012 the U.S. Department of Energy (DOE) issued a funding opportunity announcement (FOA) to state energy offices. GOEP received 3 years of funding to: • Benchmark wastewater facilities into EPA Portfolio Manager • Identify Energy Efficiency Opportunities and match facilities with funding • Conduct Energy Efficiency Training

Water Energy Partnership in Arizona
INVESTIGATION - Facility Identification
-Benchmarking - Education/Training
TECHNICAL ASSISTANCE
- Needs Assessment - Funding Options
-Education/Training
IMPLEMENTATION - Project Upgrades
- Education/Training
Coordination/Collaboration
46
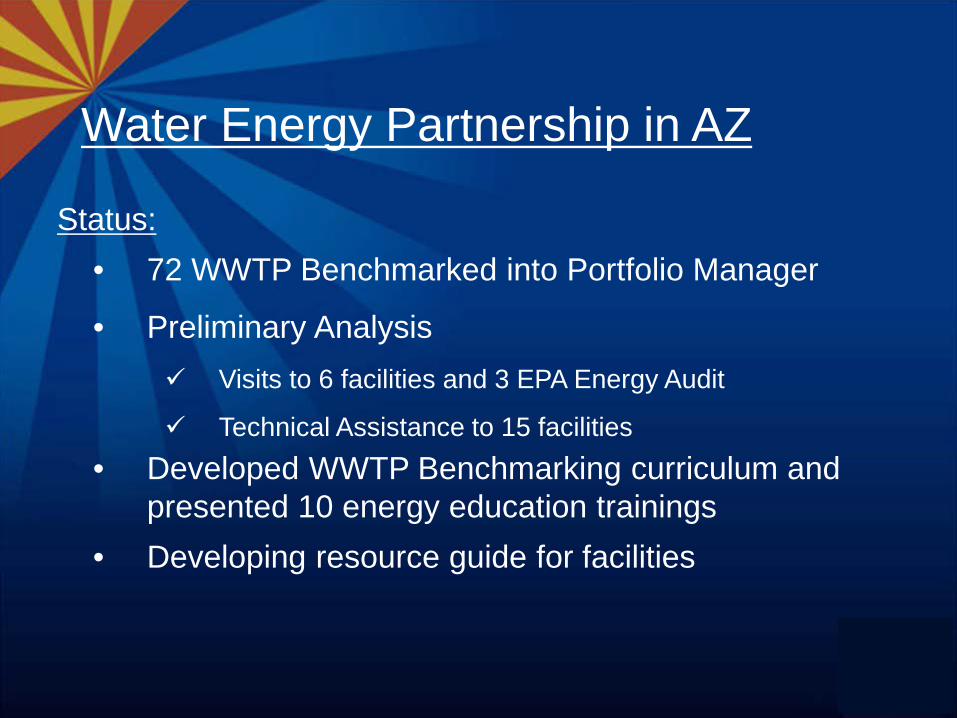
Status:
• 72 WWTP Benchmarked into Portfolio Manager
• Preliminary Analysis Visits to 6 facilities and 3 EPA Energy Audit
Technical Assistance to 15 facilities • Developed WWTP Benchmarking curriculum and
presented 10 energy education trainings • Developing resource guide for facilities
Water Energy Partnership in AZ

Portfolio Manager WRRF Factors
• Average Influent Flow (MGD) • Average Influent BOD (mg/l) • Average Effluent BOD (mg/l) • Plant Design Flow Rate (MGD) • Fixed Film Trickle Filtration Process • Nutrient Removal • Heating Degree Days • Cooling Degree Days

Portfolio Manager Scores SCORE Ratio Act./Pred.
1 2.05
10 1.44
20 1.22
30 1.08
40 0.97
50 0.88
60 0.78
70 0.69
80 0.60
90 0.48
99 0.27
0
0.5
1
1.5
2
2.5
0 20 40 60 80 100
Ratio
: Act
ual/P
redi
cted
Portfolio Manager Score
SCORE vs. Ratio
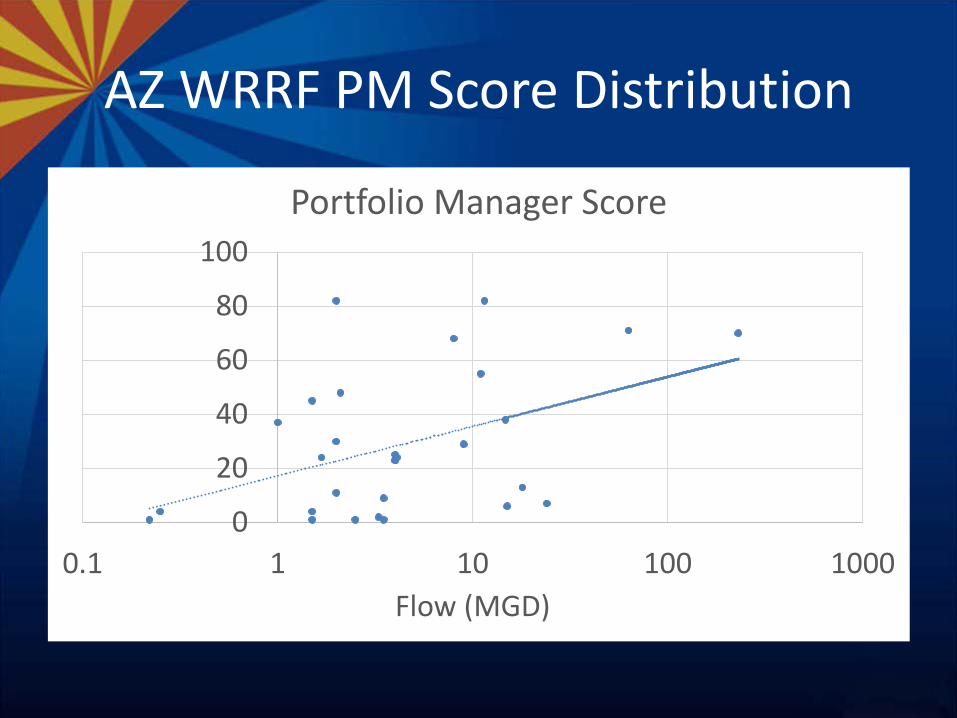
AZ WRRF PM Score Distribution
0
20
40
60
80
100
0.1 1 10 100 1000Flow (MGD)
Portfolio Manager Score

Grant Application Partners
State: Arizona Department of Environmental Quality Water Infrastructure Finance Authority Federal: U.S. Department of Agriculture Rural Development Private: Arizona Public Service Honeywell Lincus Energy Rural Community Assistance Corporation
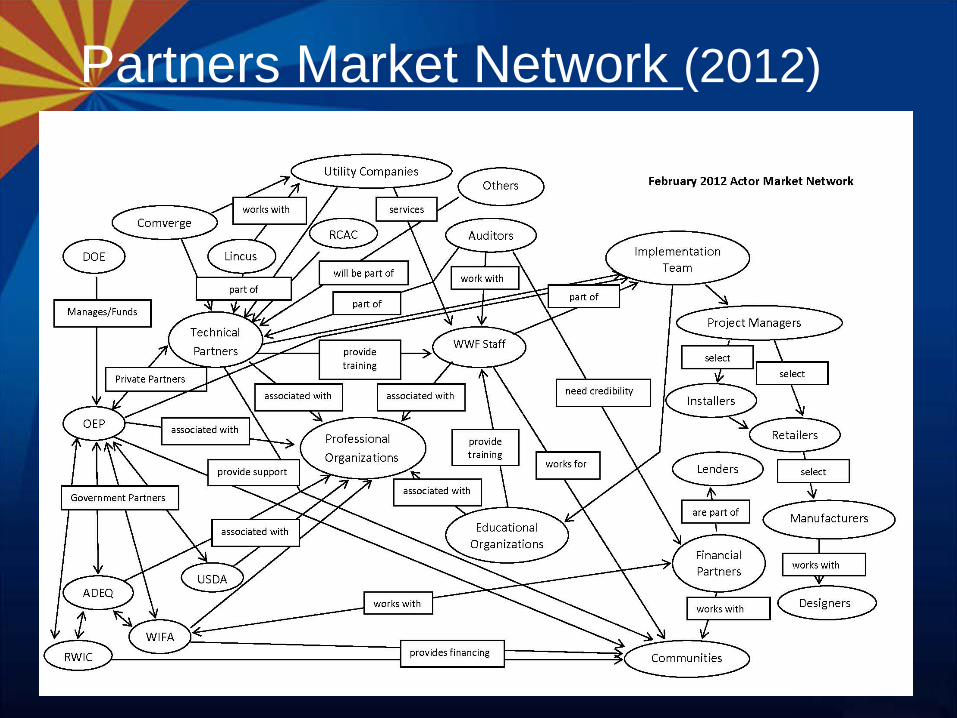
Partners Market Network (2012)

Current Partners (2015) State: AZ Department of Environmental Quality, Water Infrastructure Finance Authority, AZ Department of Water Resources, AZ State Parks, AZ Department of Transportation, Arizona Corporation Commission Federal: USDA Rural Development, EPA, U.S. Bureau of Reclamation Utility: Arizona Public Service, Unisource, Salt River Project, Sulphur Springs, AZ Electric Power Cooperative, Mohave Electric Co-op Private: Honeywell, Lincus Energy, AMERSCO, TRANE, Chelsea Group, Border Environment Cooperation Commission (BECC) Professional Organizations: AZ Water Association, Rural Water Association, AZ Electric Co-op Association

Partners Market Network (2014)

Challenge
Thank You Lisa Henderson Community Energy Program Manager State of Arizona|Office of Grants and Federal Resources 100 N. 15 Ave, Suite 202, Phoenix, AZ 85007 P: 602.771.1134 | M: 602.903.8211 [email protected]
Barry Liner, Ph.D., P.E. Director, Water Science & Engineering Center Water Environment Federation [email protected]