breaking through the bureaucracyfdra.org/wp-content/uploads/2014/07/india-breaking...adidas, metro...
TRANSCRIPT

July 2014
Breaking Through the Bureaucracy

Contents i. Overview of Indian Economy
ii. Summary – Economic & Future Outlook
iii. Forex forecasts
iv. GDP Global data
v. Status of Indian Footwear & Leather Industry
vi. Leather hubs
vii. Indian Footwear
viii. Beyond Business & Business Excellence
Indian Economy Overview

Economic Overview (i/ii)
• India's new government has the strongest mandate in 30 years to transform the
economic and political landscape and make the country more prosperous and business-
friendly.
• The main challenge facing India's business environment are its institutional weaknesses,
tackling obstructionism from regional governments and traditional interest groups, and
ensuring that future economic growth consolidates a politically moderate middle class.
• In line with expectations, India's union budget for FY 2014/15 (April-March) had a
greater focus on boosting economic growth. There are downside risks to the fiscal
deficit from the revenue and expenditure lines, and as such, the central government is
projected to marginally miss its deficit target of 4.1% of GDP.
Source: Business Monitor International 4

Economic Overview (ii/ii) Ease of Doing Business Index Ranking - India (DB) World Ranking
179 182
111
92
28 34
158
132
186
121
177 183
110
91
24 32
159
129
186
119
0
20
40
60
80
100
120
140
160
180
200 DB 2014 Rank DB 2013 Rank
5 Source: Doing Business Index; World Bank Index
China (CNY/US$)
India (INR/US$)
Japan (JPY/US$)
Russia (RUB/US$)
.0
10.0
20.0
30.0
40.0
50.0
60.0
70.0
80.0
90.0
100.0
110.0
2013 2014 f
2015 f
2016 f
2017 f
2018 f
2019 f
2020 f
2021 f
2022 f
2023 f
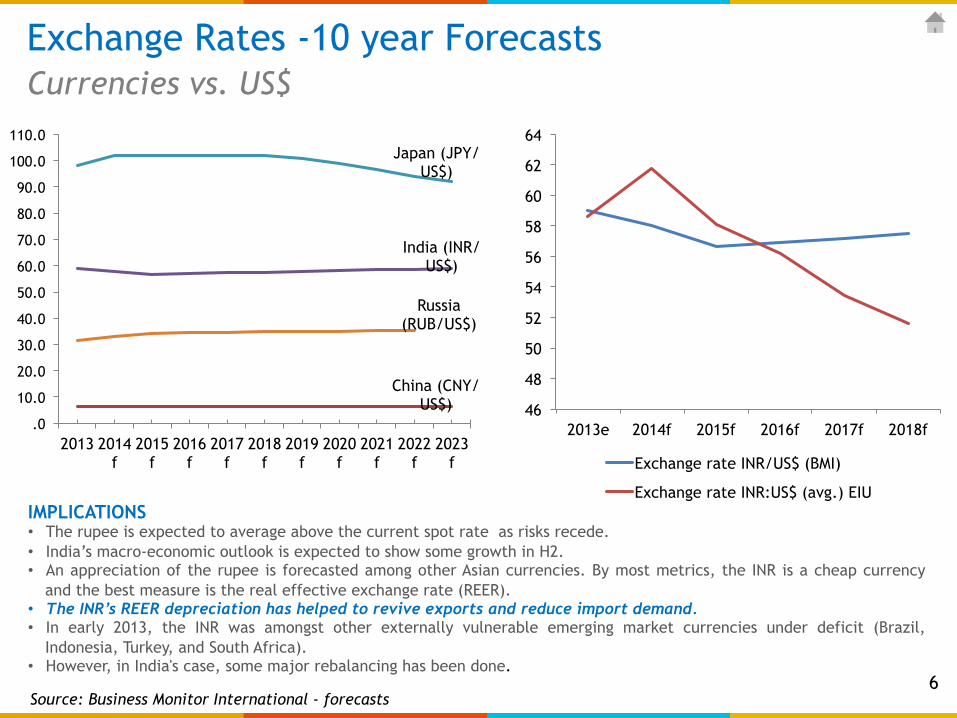
Exchange Rates -10 year Forecasts Currencies vs. US$
Source: Business Monitor International - forecasts
IMPLICATIONS • The rupee is expected to average above the current spot rate as risks recede. • India’s macro-economic outlook is expected to show some growth in H2. • An appreciation of the rupee is forecasted among other Asian currencies. By most metrics, the INR is a cheap currency
and the best measure is the real effective exchange rate (REER). • The INR’s REER depreciation has helped to revive exports and reduce import demand. • In early 2013, the INR was amongst other externally vulnerable emerging market currencies under deficit (Brazil,
Indonesia, Turkey, and South Africa). • However, in India's case, some major rebalancing has been done.
46
48
50
52
54
56
58
60
62
64
2013e 2014f 2015f 2016f 2017f 2018f
Exchange rate INR/US$ (BMI)
Exchange rate INR:US$ (avg.) EIU
6

USA
China
India
UK
South Korea
Japan
Mexico
Brazil
Germany
Indonesia
France
Turkey
Canada
Russia Australia/NZ
Taiwan
Spain
Nigeria
Poland
Argentina
Saudi Arabia
Iran
Vietnam
Italy
Colombia
Sweden
Thailand
South Africa
Hong Kong
Philippines
Netherlands
Malaysia
UAE
Chile
Norway
Peru Egypt
Austria
Israel
Bangladesh
Qatar
Singapore
-1.0%
1.0%
3.0%
5.0%
7.0%
9.0%
-20 -10 0 10 20 30 40 50 60 70 80 90 100 110 120 130 140 150 160 170 180 190
CAG
R (2
013
-202
3)
EASE OF DOING BUSINESS INDEX RANKINGS 2013
‘Size of Bubble’ Represents Real GDP (2013-23) US$ Bn
GDP Market size in 10 years Global Presence in Key Markets
TIL Global Presence Potential Markets
Absolute value growth in GDP (2013-2023) = 19.30 US$ Trillion; below plotted countries make up 90% i.e. 17.38 US$ Trillion
USA CHINA INDIA
7 Source: Business Monitor International

Status Update: Indian Leather & Footwear Industry

CHENNAI RANIPET AMBUR
JALANDHAR KARNAL
LUDHIANA FARIDABAD SONEPAT
AGRA DELHI
KANPUR
MUMBAI PUNE
KOLKATA
CALICUT ERNAKULAM
Source: Council for Leather Exports; Government of India
India Leather Hubs
DEWAS
9
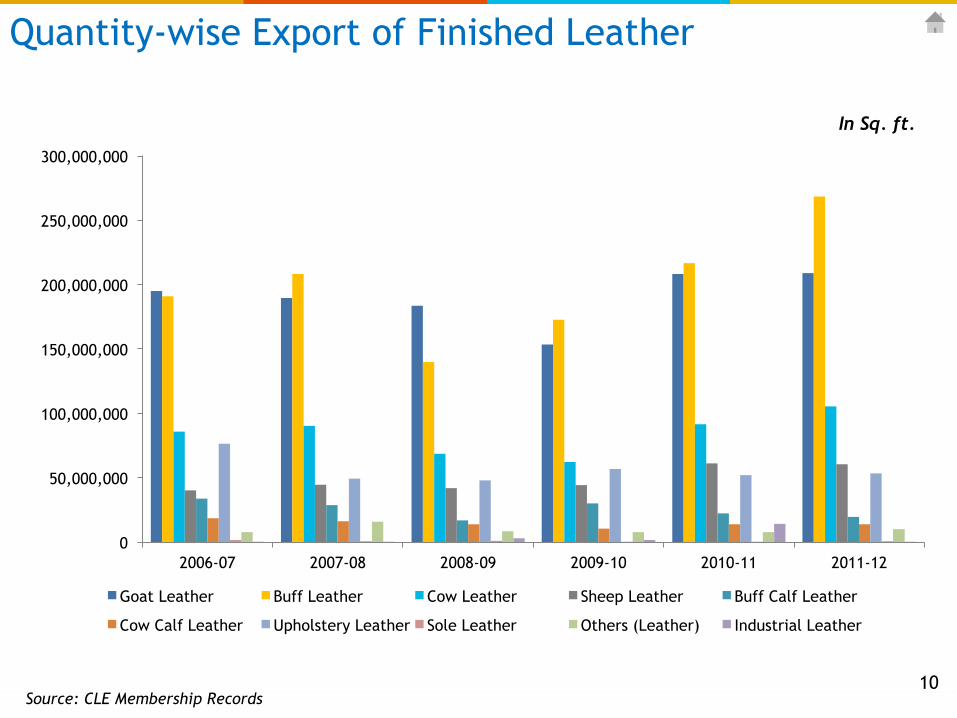
Quantity-wise Export of Finished Leather
Source: CLE Membership Records
In Sq. ft.
10
0
50,000,000
100,000,000
150,000,000
200,000,000
250,000,000
300,000,000
2006-07 2007-08 2008-09 2009-10 2010-11 2011-12
Goat Leather Buff Leather Cow Leather Sheep Leather Buff Calf Leather
Cow Calf Leather Upholstery Leather Sole Leather Others (Leather) Industrial Leather
1093.7
1284.6
1693.9
2011.4
245.9 316.2
563.5 596.2
1180.8
1351.5
110.4 145.5 127.2 203.5
0.0
500.0
1000.0
1500.0
2000.0
2500.0
2012-13 2013-14
FINISHED LEATHER LEATHER FOOTWEAR FOOTWEAR COMPONENTS LEATHER GARMENTS
LEATHER GOODS SADDLERY AND HARNESS NON-LEATHER FOOTWEAR
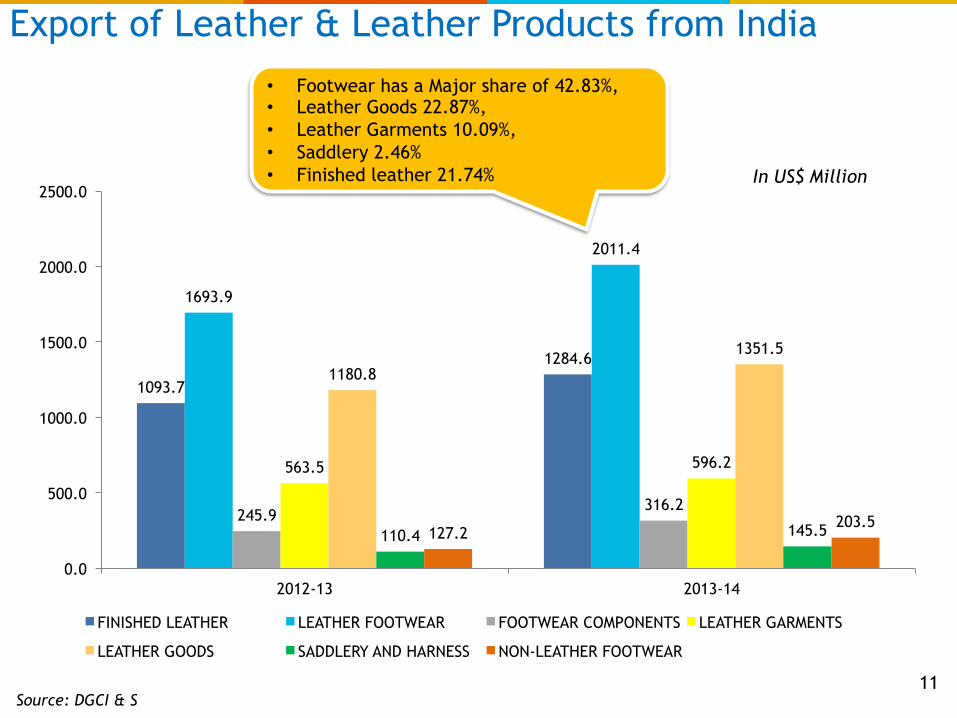
Export of Leather & Leather Products from India
Source: DGCI & S
In US$ Million
• Footwear has a Major share of 42.83%, • Leather Goods 22.87%, • Leather Garments 10.09%, • Saddlery 2.46% • Finished leather 21.74%
11
Market Outlook India- Manufacturing
• The new govt is going to crackdown on illegal cow/buff slaughter in India in next 1 year therefore pollution related closure of tanneries in India will reach alarming level in next few years. Most Raw to Wet Blue tanneries will be shut, if they do not meet the new environmental norms.
• The inevitable strengthening of rupee will make Raw Material imports cheaper and leather trading has huge opportunities to fill the future Raw Material supply vacuum in India.
• According to the national Productivity Centre (NPC) Global trends on export share indicate that in Asia, China had over 30%, India 11%, Indonesia, 0.41% and Taiwan at 0.32%.
• The growth of the leather processing sector through increased exports and per capita consumption resulted to an increase in its shoe per capita, which went from 0.12 (1990-91) to 1.6 (2001-02) attaining a target of 1.7 to slightly below 2.0 in 2011 mark. India is the 3rd highest producer, estimated to process about 2 billion Sq.ft annually.
• It is with this background that Tata International (Leather division) saw an opportunity to embark on intensive domestic marketing which proved a great success.
• CLE (2010) infers that India is currently the 10th largest exporter of leather and leather products to the world with an export value of US$ 3.75 billion. (Update)
• India produces • 909 million pairs of leather shoes • 100 million shoe uppers • 1056 million pairs of synthetic material based footwear
12 Source: CLE, Emerging World Leather Trends and Continental Shifts on Leather and Leather goods Production.

Indian Footwear Market Overview""
• 2nd largest global producer of footwear after China
• 3rd largest market, worth US$ 3.94 billion
• 13% of global footwear production of 16 billion pairs
• India produces 2065 million pairs of different categories
• Leather footwear - 909 million pairs
• Non-leather footwear - 1056 million pairs
• Leather shoe uppers - 100 million pairs
• India exports about 115 million pairs
• 95% of production goes to meet India’s domestic demand
• 110 million are engaged in the footwear manufacturing industry
Source: Business Monitor International – forecasts 13
14
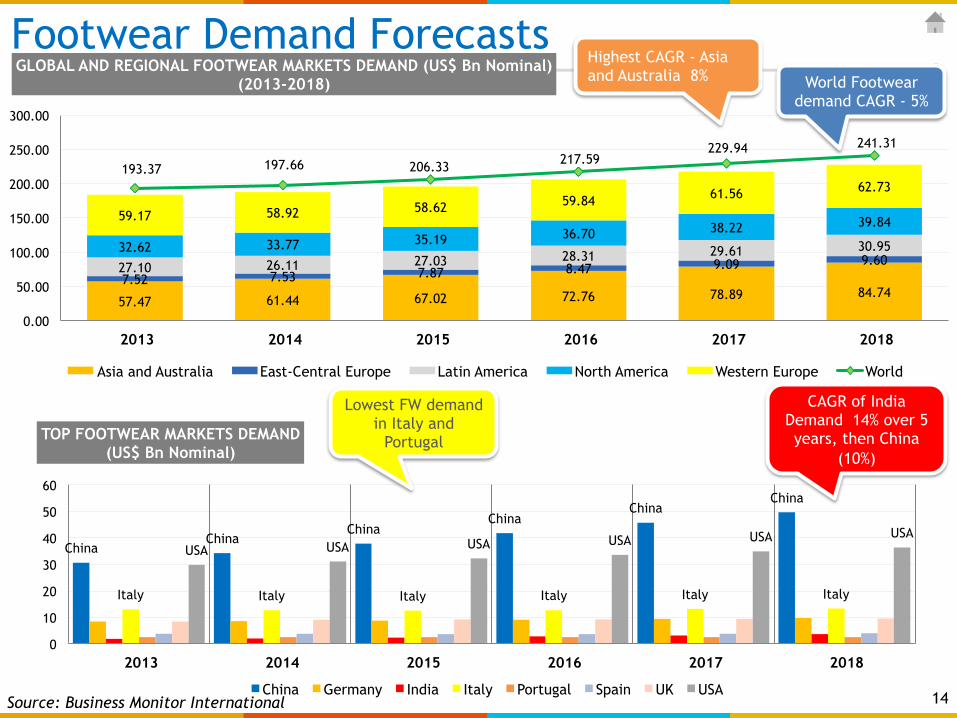
57.47 61.44 67.02 72.76 78.89 84.74 7.52 7.53 7.87 8.47 9.09 9.60 27.10 26.11 27.03 28.31 29.61 30.95 32.62 33.77 35.19 36.70 38.22 39.84 59.17 58.92 58.62 59.84 61.56 62.73 193.37 197.66 206.33 217.59
229.94 241.31
0.00
50.00
100.00
150.00
200.00
250.00
300.00
2013 2014 2015 2016 2017 2018
GLOBAL AND REGIONAL FOOTWEAR MARKETS DEMAND (US$ Bn Nominal) (2013-2018)
Asia and Australia East-Central Europe Latin America North America Western Europe World
China China
China China
China China
Italy Italy Italy Italy Italy Italy
USA USA USA USA USA USA
0
10
20
30
40
50
60
2013 2014 2015 2016 2017 2018
TOP FOOTWEAR MARKETS DEMAND (US$ Bn Nominal)
China Germany India Italy Portugal Spain UK USA
Footwear Demand Forecasts World Footwear
demand CAGR - 5%
Highest CAGR - Asia and Australia 8%
CAGR of India Demand 14% over 5 years, then China
(10%)
Lowest FW demand in Italy and
Portugal
Source: Business Monitor International

Indian Footwear Market will be worth US$ 6.89 billion by 2015
Organized 80%
Organized 5%
Unorganized 20%
Unorganized 95%
Globally India
Global Footwear
Indian Footwear
Market size US$ 181.9 b US$ 3.94 b
CAGR 5% 15%
Mens 58% Ladies
13%
Children 29%
Volume share in footwear
Casuals 61%
Mass 22%
Premium Leather
7%
Premium Non-
Leather 3%
Sports 7%
Segments in Footwear 15 Source: Retail info

Outside Food 5%
Leisure, 1.20%
Entertainment 3.40%
Clothing & Fashion
Accessories 9.90%
Jewellery 5.20% Watches, 0.30%
Footwear, 1.20%
Health & Beauty, 0.30%
Pharma 3.70%
Consumer Durables 4.30%
Mobiles 2%
Furnishings 3.40%
Food & Grocery, 59.90%
Indian Retail Sector"Market size INR 13.3 Trillion
16 Source: Retail info

Out-of-Home Food, 7.3%
Leisure, 2.8%
Entertainment 3.1%
Clothing & Fashion
Accessories, 38.1%
Jewellery 2.9%
Watches 2.7%
Footwear 9.9% Health &
Beauty 0.8%
Pharma 2.0%
Consumer Durables, 9.1%
Mobiles 3.4%
Furnishings 6.4%
Food & Grocery,
11.5%
Organized Retail Sector"Market size INR 0.78 Trillion
Bata, Liberty, Adidas, Metro
Increase in consumer spending,
modern lifestyle
Small cottage industry based manufacturers
Consumer behaviour
shifting
Organized Sector
Unorganized Sector
CONSUMER BEHAVIOUR
17 Source: Retail info
Indian Shoe Retail Sector – Current scenario"• The size of the Indian footwear market is approx. US$ 4.14 Bn growing at 15% a year. India’s footwear
industry is the world’s 2nd largest producer after China
• About 85% of the Indian footwear market is dominated by the unorganized sector but customers are more brand conscious hence the growth of the organized sector is likely to be 27% a year.
• Organized retail only reaches 5000 postal codes, e-commerce companies reach 25,000.
JOHN LOBB [premium] • John Lobb’s ‘By Request’ will sell shoes in India at approx. US$ 1,166 - US$ 9,995 (in line with its global
prices) through its partnership with Mumbai based retail company – Regalia Luxury Retail.
CROCS • To reach out to smaller cities, Crocs is launching a virtual store in association with Jabong.com and
building a retail distribution partnership with Amazon.com • Crocs grew 200% in the Indian market in the last 2 years – what did not work was their India line of shoes
because Indians wanted the global style. These shoes are priced between US$ 23-US$ 117 • Crocs India turnover crossed approx. US$ 17 Million in the last year
CLARKS • British shoe maker Clarks launched its global line in India and sold 400,000 pairs in 2.5 years of operation
in India and women customers account for 2/3rds of the shoes it sells • Clarks has a city wise strategy – E.g.: In Mumbai, Delhi and Bangalore, its women shoes sell the most and
its best sellers are multi-coloured sandals. • Almost 40% of Clarks men’s formal shoes are made in India for export
BATA • Bata’s turnover has doubled from approx. US$ 230 Mn in 2008 to US$ 333 Mn in 2014. It is growing at a
CAGR of approx. 15%. 18 Source: Retail Shoes – Press – All Pumped Up – by Arunima Mishra
Where Does Tata International (TIL) Stand Today? • TIL’s leather products contribute about 10% to the company’s revenue and the turnover for the
footwear business is about 680 Cr, which is approx. 113 US$ Million this year.
• Over the next 3 years, the company aims for approx. US$ 250 Million over the current business model, the majority of which is the made to order business
• TIL currently produces 5.5 Mn pairs a year and wants to increase that to 10 Mn pairs in 3 years
• It is venturing into a branding and distribution model for footwear
Ecommerce & The Domestic Market • Ecommerce companies such as Myntra and Yepme are pushing sales of private labels.
• Like their global counterparts in India’s US$ 4.14 Bn footwear business, home grown players are aggressively expanding to increase the share in the organized market from just 15% at present
• Almost 60% of Liberty Shoes' revenue (US$ 83 Mn in 2013-14) come from the domestic market. It has a share of 25-30% in the Indian footwear market. It sells 500,000 pairs daily and adds 50 stores each year
• It has introduced features such as Nature’s spell to make its stores more appealing to customers, which counters the smell of leather products that typically pervade the store
19 Source: Retail Shoes – Press – All Pumped Up – by Arunima Mishra
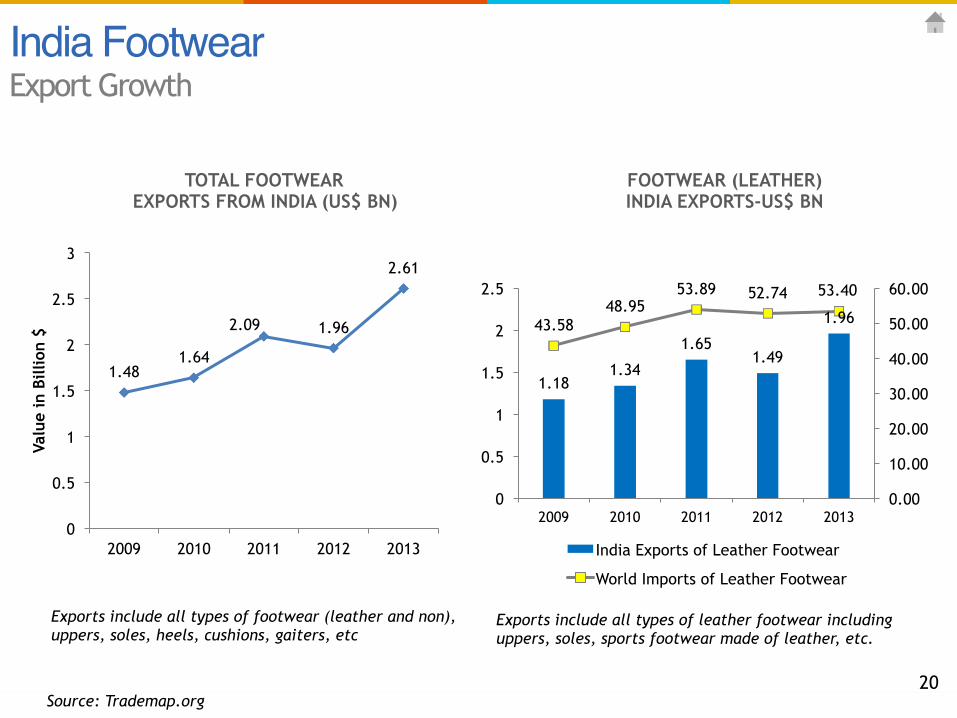
India Footwear"Export Growth
1.48 1.64
2.09 1.96
2.61
0
0.5
1
1.5
2
2.5
3
2009 2010 2011 2012 2013
Valu
e in
Bill
ion
$
1.18 1.34
1.65 1.49
1.96 43.58 48.95
53.89 52.74 53.40
0.00
10.00
20.00
30.00
40.00
50.00
60.00
0
0.5
1
1.5
2
2.5
2009 2010 2011 2012 2013
India Exports of Leather Footwear
World Imports of Leather Footwear
FOOTWEAR (LEATHER) INDIA EXPORTS-US$ BN
TOTAL FOOTWEAR EXPORTS FROM INDIA (US$ BN)
Source: Trademap.org 20
Exports include all types of footwear (leather and non), uppers, soles, heels, cushions, gaiters, etc
Exports include all types of leather footwear including uppers, soles, sports footwear made of leather, etc.

Consumption Production Sourcing • Increasing disposable income
and number of middleclass households
• Growing fashion consciousness
• Increasing number of working women
• Increasing penetra8on in Tier II and Tier III ci8es
• Online availability
• Low-‐cost produc8on
• Abundance of raw material
• Skilled manpower
• Government ini8a8ves boos8ng the industry
• High export poten8al
• Major supplier of medium and low priced footwear.
• Several footwear majors source parts of their produc8on and purchase from India.
• Global brands such as Florsheim, Bush, Gabor, Clarks, Reebok, Deichmann, Elefanten, Salamander, etc.. are manufactured under license in India.
India Footwear "Growth Drivers
21
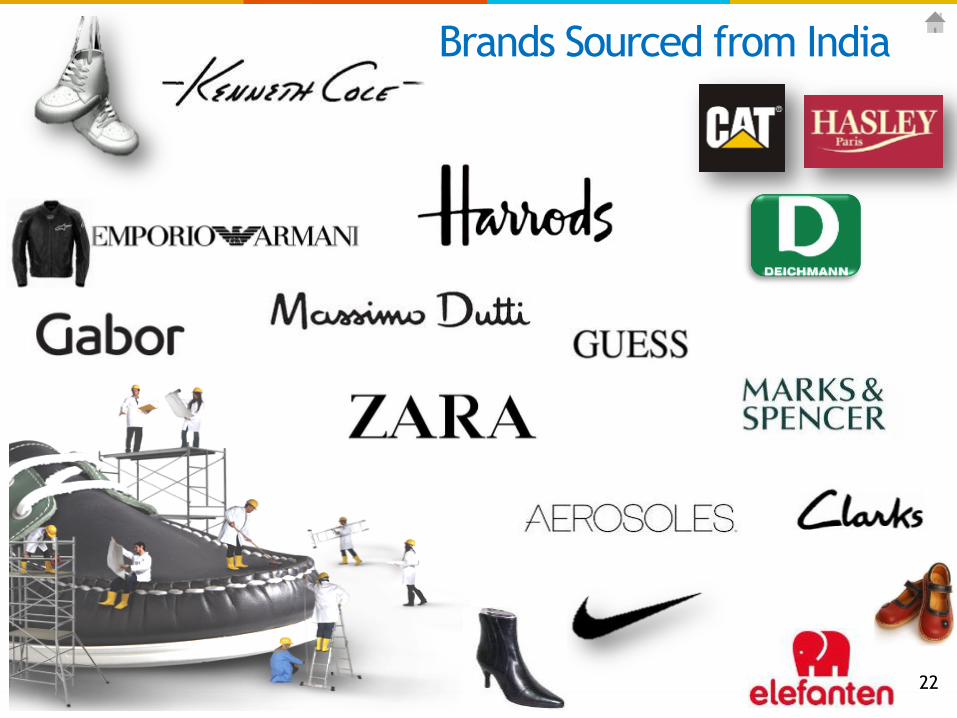
Brands Sourced from India
22

TATA International - Presence on a Global Scale
INDIA ITALY UK CHINA PORTUGAL
MANUFACTURING ü ü
DESIGN INPUTS ü ü ü ü ü
SUPPLY CHAIN OPERATIONS ü ü
MARKETING BASE ü ü ü
Profile Key Competencies
• Footwear Operations spread over China, India, Italy and Portugal
• Working with Top Global Brands and Retailers
• Design Studio in Italy and Portugal
• Footwear Design & Development Centre in China
• Supplier to Global Brands & Retailers
• Support in Product Development
• Setting global quality standards
• Value proposition for sustainable customer relationship
• Control, Monitoring, Operations Management in Major Production Hubs
• One Stop Shop Model for Retailers
• Experience in servicing the Major Customer Base in Europe
• Leverage ‘Global Presence’ for becoming footwear Supply Chain Integrator
23
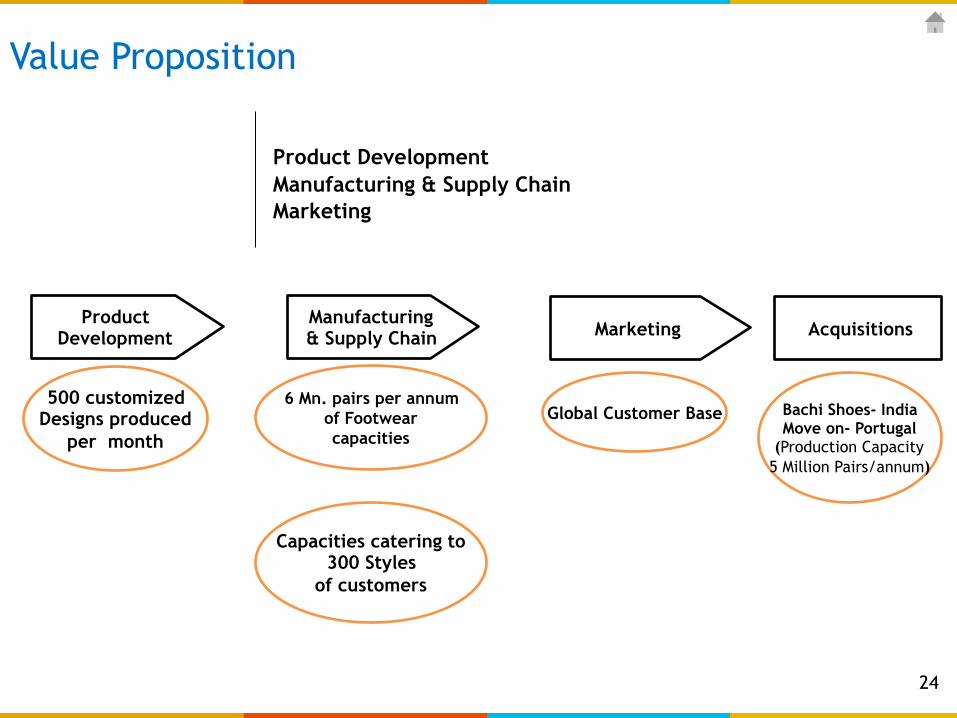
Product Development Manufacturing & Supply Chain Marketing
6 Mn. pairs per annum of Footwear capacities
Capacities catering to 300 Styles
of customers
Global Customer Base
Product Development
Manufacturing & Supply Chain Marketing Acquisitions
Bachi Shoes- India Move on- Portugal
(Production Capacity 5 Million Pairs/annum)
500 customized Designs produced
per month
Value Proposition
24
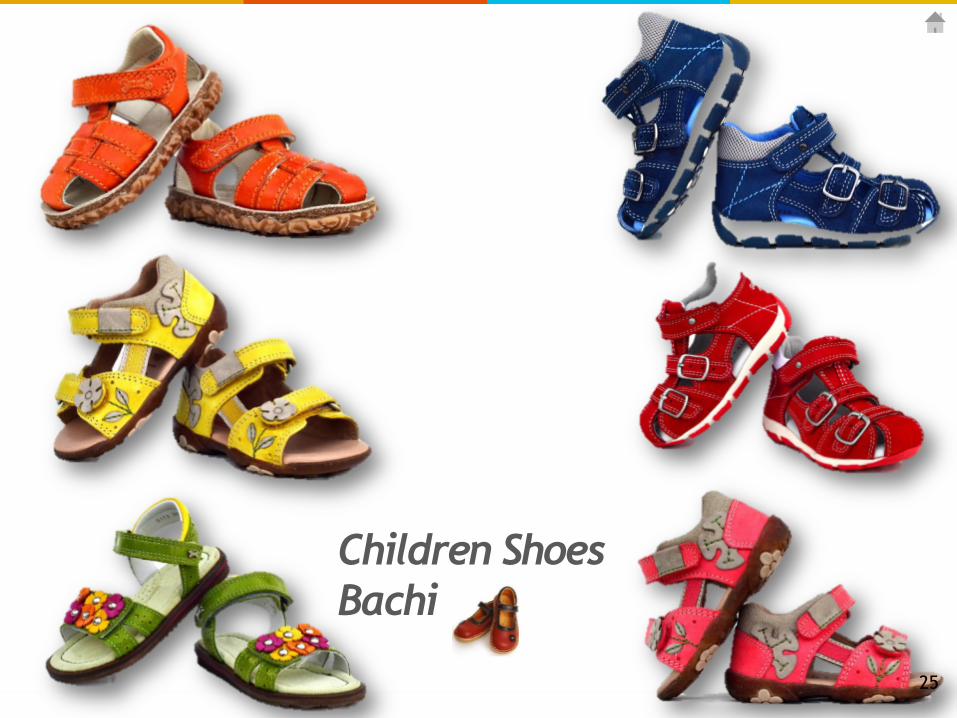
Children Shoes Bachi
25

Ladies Shoes Dewas
26
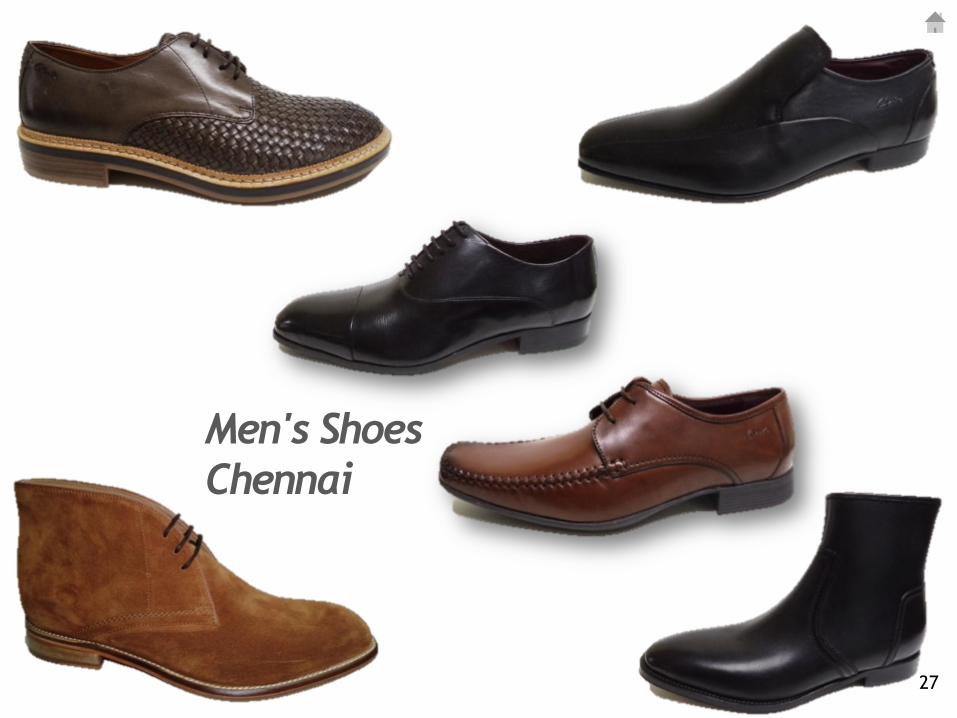
Men's Shoes Chennai
27

TATA International Finished Leather Spread Global Customer Base
Our product basket Our global customer base
Market spread – Germany, Italy, France, Spain, Portugal
Market spread – China, Taiwan, Vietnam, Korea, Australia, India
Market spread – US
USA Far East Europe
CUSTOMER BASE
28

Committed global corporate citizen
Beyond Business"
Community • Scholarships • Maintenance of public
parks, libraries • Adoption of school
buildings • Primary healthcare
support • Societal impact through
Affirmative Action
Environment • Eco friendly leather
Facilities • Sophisticated effluent
treatment plant • One of India’s largest
Solar thermal water heating systems
• Promoting Bio diversity
Skills Training • Industry
internships • Technical Training
Empowerment • Computer based
functional literacy for women
• Training in shoemaking to underprivileged young women
• Self-help groups (SHG’s) for Women
29
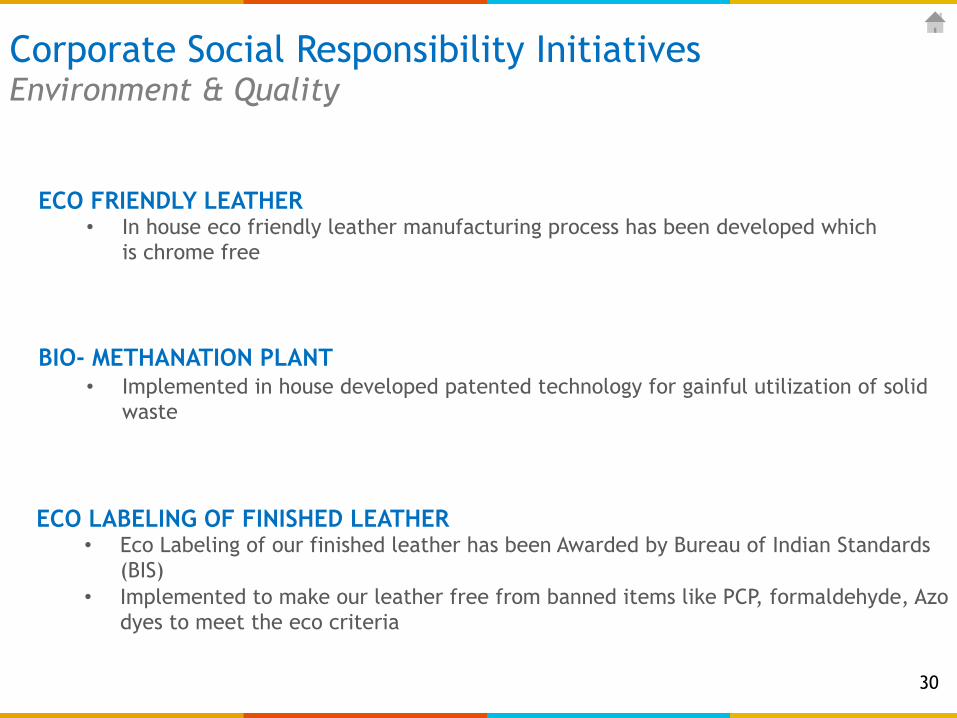
Corporate Social Responsibility Initiatives Environment & Quality
ECO FRIENDLY LEATHER • In house eco friendly leather manufacturing process has been developed which
is chrome free
BIO- METHANATION PLANT • Implemented in house developed patented technology for gainful utilization of solid
waste
ECO LABELING OF FINISHED LEATHER • Eco Labeling of our finished leather has been Awarded by Bureau of Indian Standards
(BIS) • Implemented to make our leather free from banned items like PCP, formaldehyde, Azo
dyes to meet the eco criteria
30

Corporate Social Responsibility Initiatives Environment & Quality
ETP TREATMENT BY NEW PROCESS • Process has been developed at pilot level for reducing chemical, manpower &
energy cost as well as sludge reduction.
SUBSTITUTION BY CHEAPER CHEMICALS • Expensive & hazardous chemicals have been replaced with cheaper & environment
friendly chemicals. • Chemicals from Waste Recycling
UP-GRADATION OF TECHNOLOGY • Adopted Reverse Osmosis technology for further improving the effluent treated water. • Daily 200 M3 water as good as drinking water is supplied to boiler house.
31
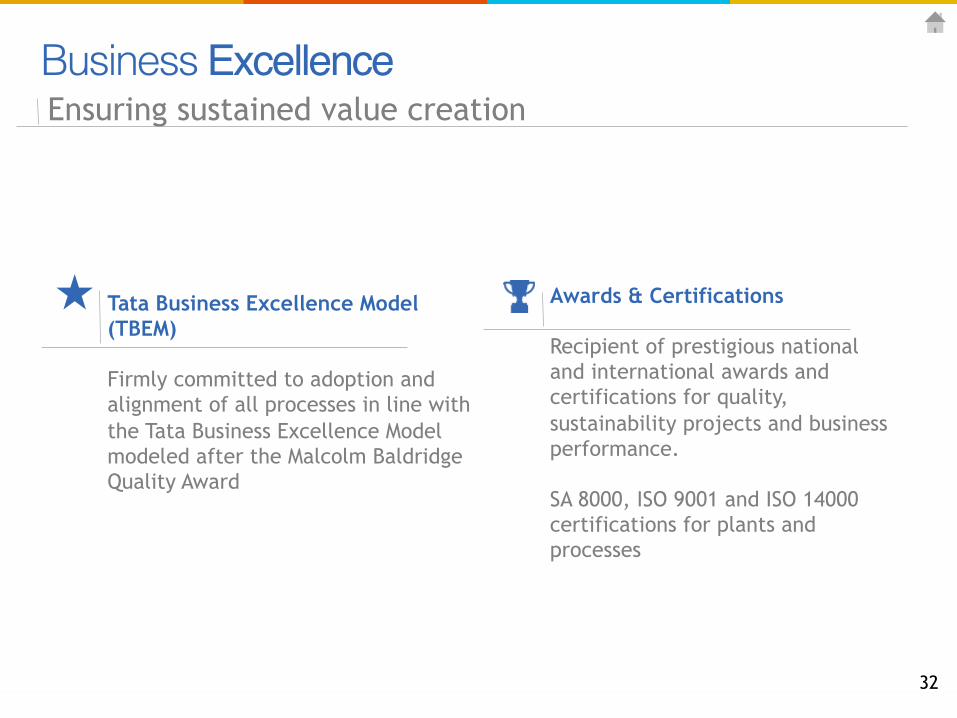
Tata Business Excellence Model (TBEM) Firmly committed to adoption and alignment of all processes in line with the Tata Business Excellence Model modeled after the Malcolm Baldridge Quality Award
Ensuring sustained value creation
Awards & Certifications Recipient of prestigious national and international awards and certifications for quality, sustainability projects and business performance. SA 8000, ISO 9001 and ISO 14000 certifications for plants and processes
Business Excellence"
32

Thank you!!

Appendix!!
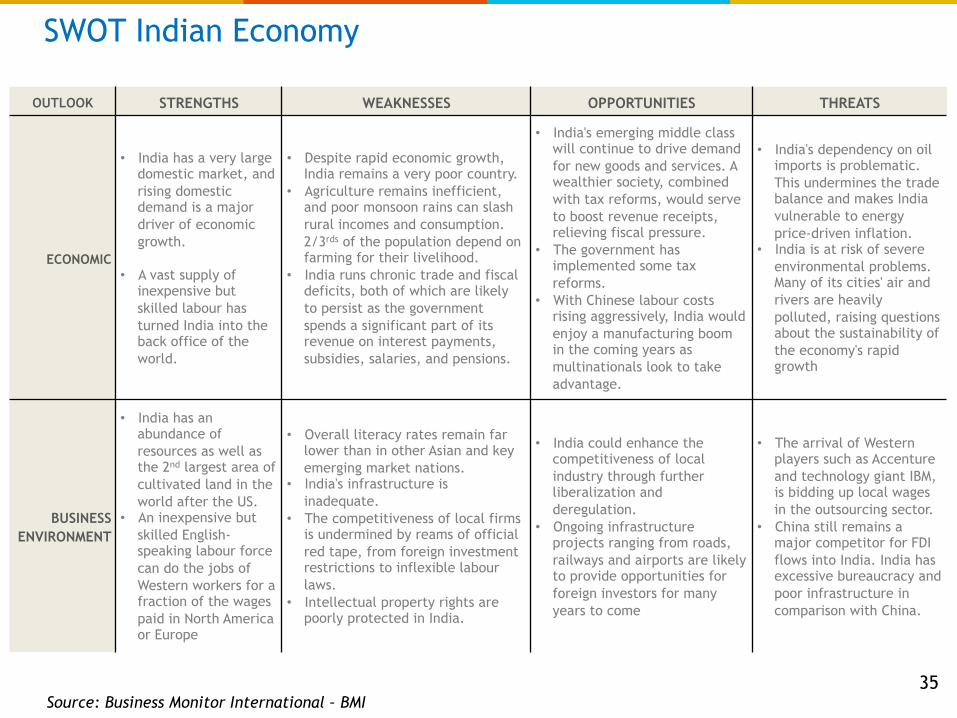
OUTLOOK STRENGTHS WEAKNESSES OPPORTUNITIES THREATS
ECONOMIC
• India has a very large domestic market, and rising domestic demand is a major driver of economic growth.
• A vast supply of inexpensive but skilled labour has turned India into the back office of the world.
• Despite rapid economic growth, India remains a very poor country.
• Agriculture remains inefficient, and poor monsoon rains can slash rural incomes and consumption. 2/3rds of the population depend on farming for their livelihood.
• India runs chronic trade and fiscal deficits, both of which are likely to persist as the government spends a significant part of its revenue on interest payments, subsidies, salaries, and pensions.
• India's emerging middle class will continue to drive demand for new goods and services. A wealthier society, combined with tax reforms, would serve to boost revenue receipts, relieving fiscal pressure.
• The government has implemented some tax reforms.
• With Chinese labour costs rising aggressively, India would enjoy a manufacturing boom in the coming years as multinationals look to take advantage.
• India's dependency on oil imports is problematic. This undermines the trade balance and makes India vulnerable to energy price-driven inflation.
• India is at risk of severe environmental problems. Many of its cities' air and rivers are heavily polluted, raising questions about the sustainability of the economy's rapid growth
BUSINESS ENVIRONMENT
• India has an abundance of resources as well as the 2nd largest area of cultivated land in the world after the US.
• An inexpensive but skilled English-speaking labour force can do the jobs of Western workers for a fraction of the wages paid in North America or Europe
• Overall literacy rates remain far lower than in other Asian and key emerging market nations.
• India's infrastructure is inadequate.
• The competitiveness of local firms is undermined by reams of official red tape, from foreign investment restrictions to inflexible labour laws.
• Intellectual property rights are poorly protected in India.
• India could enhance the competitiveness of local industry through further liberalization and deregulation.
• Ongoing infrastructure projects ranging from roads, railways and airports are likely to provide opportunities for foreign investors for many years to come
• The arrival of Western players such as Accenture and technology giant IBM, is bidding up local wages in the outsourcing sector.
• China still remains a major competitor for FDI flows into India. India has excessive bureaucracy and poor infrastructure in comparison with China.
SWOT Indian Economy
Source: Business Monitor International – BMI 35
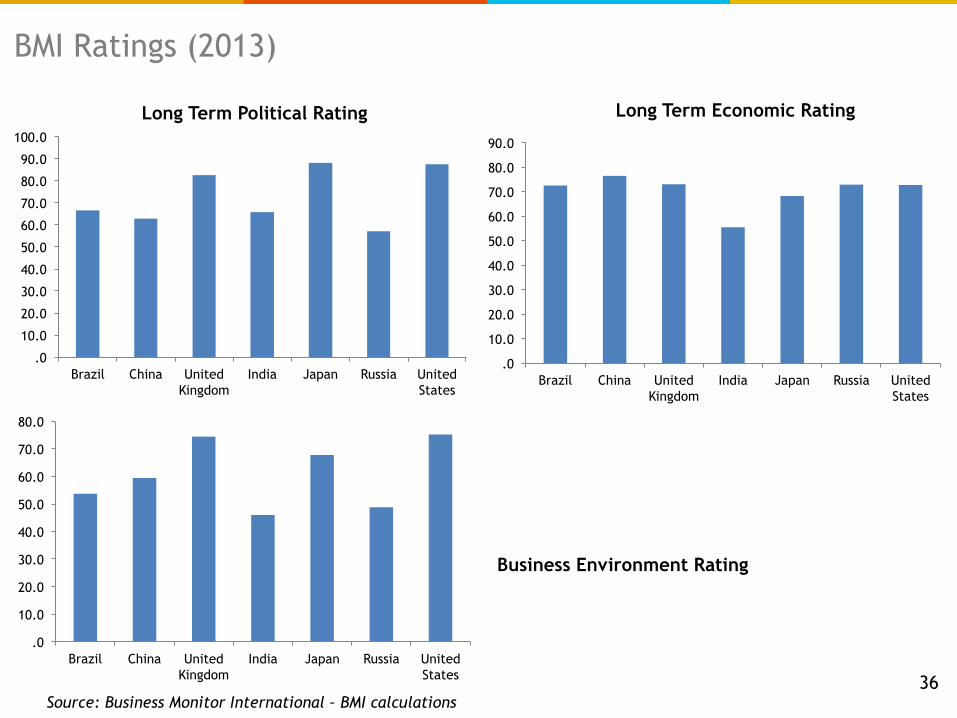
Long Term Political Rating
.0
10.0
20.0
30.0
40.0
50.0
60.0
70.0
80.0
90.0
100.0
Brazil China United Kingdom
India Japan Russia United States
.0
10.0
20.0
30.0
40.0
50.0
60.0
70.0
80.0
90.0
Brazil China United Kingdom
India Japan Russia United States
Long Term Economic Rating
.0
10.0
20.0
30.0
40.0
50.0
60.0
70.0
80.0
Brazil China United Kingdom
India Japan Russia United States
Business Environment Rating
BMI Ratings (2013)
Source: Business Monitor International – BMI calculations 36

-15.0
-10.0
-5.0
.0
5.0
10.0
2013 2014 2015 2016 2017 2018 2019 2020 2021 2022
Brazil China UK Japan Russia US
LABOUR FORCE: Total Unemployment, % change y-o-y (10 year forecasts)
Source: Business Monitor International – forecasts 37

10
20
30
40
50
60
70
80
90
Brazil China United Kingdom
India Japan Russia United States
Retail Business-Economic Rating (2013)
10
20
30
40
50
60
70
80
90
100
Brazil China United Kingdom
India Japan Russia United States
Retail Business-Economic Industry Risks (2013)
Retail Sector
Source: Business Monitor International – BMI calculations 38

TATA International Footwear Business India
STYLES LADIES FOOTWEAR MEN’S FOOTWEAR
DEWAS FOOTWEAR PLANT 1.2 million pairs per annum
• LADIES BOOTS • BALLERINA AND • MEN’S DRESS/CITY
SHOES
• BATA EUROPE • NEXT UK • ALDO CANADA
THROUGH FENILI • RSH AUSTRALIA
• GEBRA-ALDI STORES • BUGGATI
CHENNAI FOOTWEAR UNITS 1.3 million pairs per annum
• HIGH END MEN’S ELEGANT SHOES
• MEN’S DRESS & MEN’S SMART CASUALS
• MARKS & SPENCER • ZARA • MASSIMO DUTTI • CLARKS • WOLVERINE • FLORSHEIM • LLOYD • SALAMANDER
CALSEA RANIPET 1 million pairs per annum
• LADIES COMFORT SHOES • SANDALS ON STITCH &
TURN CONSTRUCTION
• MARKS & SPENCER • MOVE-ON • AEROSOLES
BACHI SHOES 2.4 million pairs per annum
• CHILDREN SHOES • STARTRITE • STONES & BONES • DEICHMANN • LEGERO
39