breakout close above 30024 essential - stockmechanics.com 270320… · investors can take the route...
TRANSCRIPT
(For Private Circulation- Subscriber only)
pg. 1
STOCK MECHANICS
WEEKLY 27 MARCH 2017
Trading on Technicals
Breakout close above 30024 essential By Hitendra Vasudeo
Last week, the Sensex opened at 29653.53, attained a high at 29699.48 and fell to a low of 29137.48 before it closed the week at 29421.40 and thereby showed a net fall of 227 points on a week-to-week basis.
Daily
The daily chart gap of 29356 to 29076 was tested partially. The low registered last week was 29137 and the close was higher at 29421. The gap is partially filled. The body gap gets closed at 28946.
The daily chart supply zone is at 29601-29824. A further breakout and close above 29824 and above 30024 is essential to extend the rise.
Profit-booking pressure at the supply zone of 29601-29824 may be witnessed unless a decisive breakout with a bullish candle on the daily and weekly charts is witnessed at the end of the week.
Weekly
The weekly chart supply zone still remains in spite of the volatility. The weekly chart gap is at 29356-29098 and the body gap gets covered at 28946. The weekly gap was covered partially and closed higher at 29431.
Resistance remains at the higher range of 29648-29824.
The current movement is already in the long-term supply zone of 29162 to 30024 thereby attracting resistance and profit-booking pressure in the higher range.
Monthly
Monthly closing will be seen at the end of this week. The highest monthly closing till now is 29361. Currently, the Sensex is above 29361 and the candle is bullish. A further breakout and close above 30024 as at March end can bring about strong momentum for the next couple of months with volatility.
In the event of a breakout and close above 30024, the Sensex will generate potential to move towards 34600.
The intermediate resistance could be at 31129 before it crosses for a ‘higher high and higher low’. March is the third
month of ‘higher high and higher low’ since the correction to 25717.
Quarterly
The quarter ends at 31 March and the quarter candle is significantly strong to enable a rally for the next couple of quarters if the Sensex sustains a breakout and close above 30024.
Currently, the quarter closing is the highest and way above the previous quarter closing peak of 27957.
Trend based on Rate of Change (RoC)
Daily chart:
1-Day trend - Up
3-Day trend - Down
8-Day trend - Down
Weekly chart:
1-Week trend - Down
3-Week trend - Up
8-Week trend - Up
Monthly chart:
1-Month trend - Up
3-Month trend - Up
8-Month trend - Up
Quarterly chart:
1-Quarter trend - Up
3-Quarter trend - Up
8-Quarter trend - Up
Yearly chart:
1-Year trend - Up
3-Year trend - Up
8-Year trend - Up
The ROC trend on the daily chart shows an intra-week correction and the same was depicted on the weekly chart’s ROC trend.
BSE Mid-Cap Index
Trend based on RoC
Weekly chart:
1-Week trend - Down
3-Week trend - Up
8-Week trend - Up
A breakout was witnessed above 13713. As a result of the breakout, expect 15100 to be tested in due course of time.
A further rise will continue above 13962 for a follow-up tos the breakout that was seen above 13713.
Outperformance is likely to be witnessed in relation to the Sensex. A stock-wise outperformance will be witnessed.
Sensex Daily Trend DRV Weekly Trend WRV Monthly Trend MRV
Last Close 29431 Up 29035 Up 28397 Up 26674
(For Private Circulation- Subscriber only)
pg. 2
Weakness may return on a fall and close below 13300. Till then, expect correction and consolidation for the stocks to move higher.
BSE Small-Cap Index
1-Week trend - Up
3-Week trend - Up
8-Week trend - Up
The BSE Small-Cap index can rally to 14900 from the current level of 14012. Intra-week correction could be an opportunity for accumulation as long as 13200 is not violated.
The Small-Cap index showed dominance over the Sensex and the BSE Mid-Cap index as the ROC trend on the weekly chart is up on all time frames.
Strategy for the week
Traders already long can revise upwards their stop loss to 28700. Support to 29139 and the gap can provide support and a buying opportunity for the near-term till 28700 is not violated.
Profit-booking pressure at the higher range will remain in index and index-related stocks till the 30024 breakout is not witnessed. A breakout above 30024 is essential on Friday’s closing to generate a positive momentum for the next couple months with volatility.
Market Outlook- NIFTY
What was said last week? Nifty has registered a new historical high last week at 9218 whereas the SENSEX has yet to notch up the peak of 30024.
The SENSEX has to come in line with Nifty otherwise Nifty will have trouble in sustaining at higher range. It could be that for 1-2 week Nifty under performs SENSEX so it can catch up with Nifty.
A gap up opening was seen last week and the gap remained. Further upside movement was seen on daily chart with gap up but daily chart not strong enough to bring about conviction of the rally.
However, weekly chart candle was positive at the end of the week. The candle is like a stalled pattern candle which suggests that upside momentum will continue on sustained rise and close above 9218.
The gap at lower range now is 9060-8977 and the body gap gets closed at 8934.
The gap can be expected to provide the support or consolidation based to move higher and sustain at higher range.
The monthly and quarterly candles are strong enough to hold the trend and correction if any can provide entry opportunity as long as month low and quarter low are not violated at the end of March 2017.
The closing of March 2017 brings about quarter closing and month closing.
From the quarter chart angle on sustained rise and close above 9119, Nifty generate a potential to move towards 11412 with volatility.
The depth of the correction from 9119 to 6826, expect the same difference on the upside from 9119.
The correction from 2008 peak of 6357 to 2253, the breakout was witnessed in March 2014. The implication of that breakout sets a target of 10461 and the same has not been attained. Last time, we saw Nifty making 9119 and correcting down to 6826.
Now, as Nifty sustains above 9119, it can move higher to test 10461 and 11412 in time to come with volatility. Volatility bring about correction in lower degree chart like daily and weekly.
From the weekly chart angle, correction to support level and in the gap would be opportunity to accumulate as long as 8800 is not violated.
Support for the week can be 9146-9074 and the gap is 9060-8977.
Weaker opening and correction first to 9146-9074 or in the gap of 9060-8977 can be used for buying with a stop loss of 8800.
Investors can take the route of Nifty Bees or other Nifty based ETF to accumulate to avoid the risk of volatility of the futures market.
Higher range for the week can be 9232-9304-9390.
What happened last week? Nifty last week opened at 9166.95 and registered a high at 9167.60. Nifty fell to a low of 9019.30 and closed the week at 9108 thereby showed a net fall of 0.57% on week to week basis. Last week, we had mentioned that as long as 8800 is violated accumulation can be undertaken. Further, we had mentioned that correction to 9146-9074 or into the gap of 9060-8977 can be used for buying with a stop loss of 8800. The low registered was 9019.30 and closed at 9108. View for the week to come Weekly Chart:
1-week trend – Up
3-week trend - Down
8-week trend – Up
Correction to 9029-8950 can be used for accumulation and buying with a stop loss of 8800.
Resistance is at 9177-9218. Traders already long can take profits at 9177-9218 as the opportunity arises.
(For Private Circulation- Subscriber only)
pg. 3
Add further long or buy above 9218 with low of the week as the stop loss or 9019 whichever is lower.
On sustained rise and close above 9218 expect a rally to 10043-100461-11412.
BANK NIFTY FUTURES Weekly Chart:
1-week trend –Up
3-week trend - Down
8-week trend – Up
Traders long and holding the same can maintain the stop loss at 20400 to lock profit and lock the loss.
Accumulate at 20896-20652 can be used for buying with a stop loss of 20400.
Resistance will be a 21066-21250.
Buy above 21250 with low of the week as the stop loss or 20800 whichever is lower.
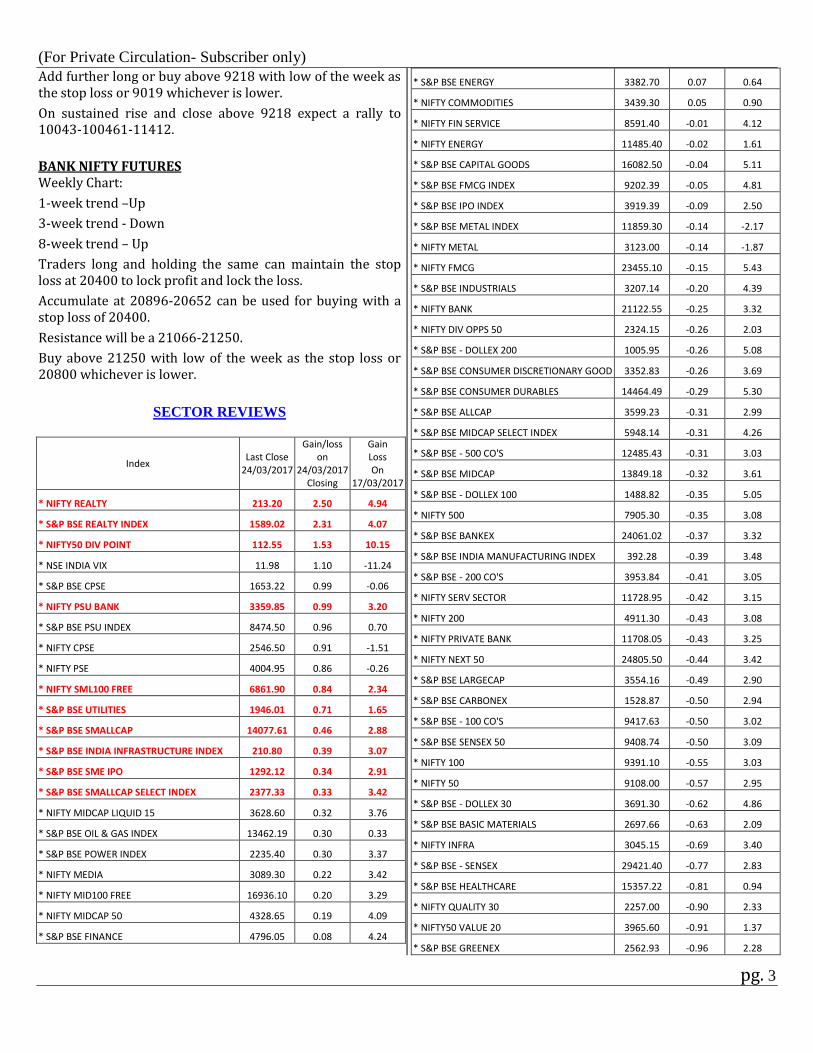
SECTOR REVIEWS
Index Last Close
24/03/2017
Gain/loss on
24/03/2017 Closing
Gain Loss On
17/03/2017
* NIFTY REALTY 213.20 2.50 4.94
* S&P BSE REALTY INDEX 1589.02 2.31 4.07
* NIFTY50 DIV POINT 112.55 1.53 10.15
* NSE INDIA VIX 11.98 1.10 -11.24
* S&P BSE CPSE 1653.22 0.99 -0.06
* NIFTY PSU BANK 3359.85 0.99 3.20
* S&P BSE PSU INDEX 8474.50 0.96 0.70
* NIFTY CPSE 2546.50 0.91 -1.51
* NIFTY PSE 4004.95 0.86 -0.26
* NIFTY SML100 FREE 6861.90 0.84 2.34
* S&P BSE UTILITIES 1946.01 0.71 1.65
* S&P BSE SMALLCAP 14077.61 0.46 2.88
* S&P BSE INDIA INFRASTRUCTURE INDEX 210.80 0.39 3.07
* S&P BSE SME IPO 1292.12 0.34 2.91
* S&P BSE SMALLCAP SELECT INDEX 2377.33 0.33 3.42
* NIFTY MIDCAP LIQUID 15 3628.60 0.32 3.76
* S&P BSE OIL & GAS INDEX 13462.19 0.30 0.33
* S&P BSE POWER INDEX 2235.40 0.30 3.37
* NIFTY MEDIA 3089.30 0.22 3.42
* NIFTY MID100 FREE 16936.10 0.20 3.29
* NIFTY MIDCAP 50 4328.65 0.19 4.09
* S&P BSE FINANCE 4796.05 0.08 4.24
* S&P BSE ENERGY 3382.70 0.07 0.64
* NIFTY COMMODITIES 3439.30 0.05 0.90
* NIFTY FIN SERVICE 8591.40 -0.01 4.12
* NIFTY ENERGY 11485.40 -0.02 1.61
* S&P BSE CAPITAL GOODS 16082.50 -0.04 5.11
* S&P BSE FMCG INDEX 9202.39 -0.05 4.81
* S&P BSE IPO INDEX 3919.39 -0.09 2.50
* S&P BSE METAL INDEX 11859.30 -0.14 -2.17
* NIFTY METAL 3123.00 -0.14 -1.87
* NIFTY FMCG 23455.10 -0.15 5.43
* S&P BSE INDUSTRIALS 3207.14 -0.20 4.39
* NIFTY BANK 21122.55 -0.25 3.32
* NIFTY DIV OPPS 50 2324.15 -0.26 2.03
* S&P BSE - DOLLEX 200 1005.95 -0.26 5.08
* S&P BSE CONSUMER DISCRETIONARY GOOD 3352.83 -0.26 3.69
* S&P BSE CONSUMER DURABLES 14464.49 -0.29 5.30
* S&P BSE ALLCAP 3599.23 -0.31 2.99
* S&P BSE MIDCAP SELECT INDEX 5948.14 -0.31 4.26
* S&P BSE - 500 CO'S 12485.43 -0.31 3.03
* S&P BSE MIDCAP 13849.18 -0.32 3.61
* S&P BSE - DOLLEX 100 1488.82 -0.35 5.05
* NIFTY 500 7905.30 -0.35 3.08
* S&P BSE BANKEX 24061.02 -0.37 3.32
* S&P BSE INDIA MANUFACTURING INDEX 392.28 -0.39 3.48
* S&P BSE - 200 CO'S 3953.84 -0.41 3.05
* NIFTY SERV SECTOR 11728.95 -0.42 3.15
* NIFTY 200 4911.30 -0.43 3.08
* NIFTY PRIVATE BANK 11708.05 -0.43 3.25
* NIFTY NEXT 50 24805.50 -0.44 3.42
* S&P BSE LARGECAP 3554.16 -0.49 2.90
* S&P BSE CARBONEX 1528.87 -0.50 2.94
* S&P BSE - 100 CO'S 9417.63 -0.50 3.02
* S&P BSE SENSEX 50 9408.74 -0.50 3.09
* NIFTY 100 9391.10 -0.55 3.03
* NIFTY 50 9108.00 -0.57 2.95
* S&P BSE - DOLLEX 30 3691.30 -0.62 4.86
* S&P BSE BASIC MATERIALS 2697.66 -0.63 2.09
* NIFTY INFRA 3045.15 -0.69 3.40
* S&P BSE - SENSEX 29421.40 -0.77 2.83
* S&P BSE HEALTHCARE 15357.22 -0.81 0.94
* NIFTY QUALITY 30 2257.00 -0.90 2.33
* NIFTY50 VALUE 20 3965.60 -0.91 1.37
* S&P BSE GREENEX 2562.93 -0.96 2.28
(For Private Circulation- Subscriber only)
pg. 4
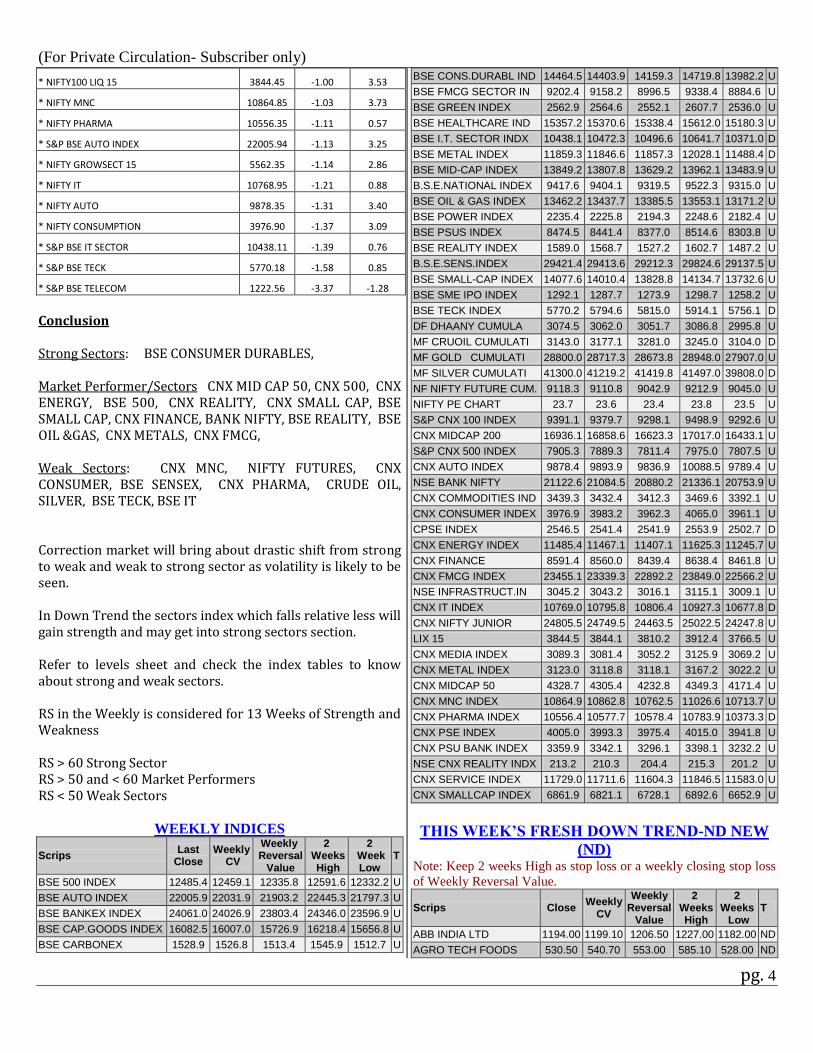
* NIFTY100 LIQ 15 3844.45 -1.00 3.53
* NIFTY MNC 10864.85 -1.03 3.73
* NIFTY PHARMA 10556.35 -1.11 0.57
* S&P BSE AUTO INDEX 22005.94 -1.13 3.25
* NIFTY GROWSECT 15 5562.35 -1.14 2.86
* NIFTY IT 10768.95 -1.21 0.88
* NIFTY AUTO 9878.35 -1.31 3.40
* NIFTY CONSUMPTION 3976.90 -1.37 3.09
* S&P BSE IT SECTOR 10438.11 -1.39 0.76
* S&P BSE TECK 5770.18 -1.58 0.85
* S&P BSE TELECOM 1222.56 -3.37 -1.28
Conclusion Strong Sectors: BSE CONSUMER DURABLES, Market Performer/Sectors CNX MID CAP 50, CNX 500, CNX ENERGY, BSE 500, CNX REALITY, CNX SMALL CAP, BSE SMALL CAP, CNX FINANCE, BANK NIFTY, BSE REALITY, BSE OIL &GAS, CNX METALS, CNX FMCG, Weak Sectors: CNX MNC, NIFTY FUTURES, CNX CONSUMER, BSE SENSEX, CNX PHARMA, CRUDE OIL, SILVER, BSE TECK, BSE IT Correction market will bring about drastic shift from strong to weak and weak to strong sector as volatility is likely to be seen. In Down Trend the sectors index which falls relative less will gain strength and may get into strong sectors section. Refer to levels sheet and check the index tables to know about strong and weak sectors. RS in the Weekly is considered for 13 Weeks of Strength and Weakness RS > 60 Strong Sector RS > 50 and < 60 Market Performers RS < 50 Weak Sectors
WEEKLY INDICES
Scrips Last
Close Weekly
CV
Weekly Reversal
Value
2 Weeks High
2 Week Low
T
BSE 500 INDEX 12485.4 12459.1 12335.8 12591.6 12332.2 U
BSE AUTO INDEX 22005.9 22031.9 21903.2 22445.3 21797.3 U
BSE BANKEX INDEX 24061.0 24026.9 23803.4 24346.0 23596.9 U
BSE CAP.GOODS INDEX 16082.5 16007.0 15726.9 16218.4 15656.8 U
BSE CARBONEX 1528.9 1526.8 1513.4 1545.9 1512.7 U
BSE CONS.DURABL IND 14464.5 14403.9 14159.3 14719.8 13982.2 U
BSE FMCG SECTOR IN 9202.4 9158.2 8996.5 9338.4 8884.6 U
BSE GREEN INDEX 2562.9 2564.6 2552.1 2607.7 2536.0 U
BSE HEALTHCARE IND 15357.2 15370.6 15338.4 15612.0 15180.3 U
BSE I.T. SECTOR INDX 10438.1 10472.3 10496.6 10641.7 10371.0 D
BSE METAL INDEX 11859.3 11846.6 11857.3 12028.1 11488.4 D
BSE MID-CAP INDEX 13849.2 13807.8 13629.2 13962.1 13483.9 U
B.S.E.NATIONAL INDEX 9417.6 9404.1 9319.5 9522.3 9315.0 U
BSE OIL & GAS INDEX 13462.2 13437.7 13385.5 13553.1 13171.2 U
BSE POWER INDEX 2235.4 2225.8 2194.3 2248.6 2182.4 U
BSE PSUS INDEX 8474.5 8441.4 8377.0 8514.6 8303.8 U
BSE REALITY INDEX 1589.0 1568.7 1527.2 1602.7 1487.2 U
B.S.E.SENS.INDEX 29421.4 29413.6 29212.3 29824.6 29137.5 U
BSE SMALL-CAP INDEX 14077.6 14010.4 13828.8 14134.7 13732.6 U
BSE SME IPO INDEX 1292.1 1287.7 1273.9 1298.7 1258.2 U
BSE TECK INDEX 5770.2 5794.6 5815.0 5914.1 5756.1 D
DF DHAANY CUMULA 3074.5 3062.0 3051.7 3086.8 2995.8 U
MF CRUOIL CUMULATI 3143.0 3177.1 3281.0 3245.0 3104.0 D
MF GOLD CUMULATI 28800.0 28717.3 28673.8 28948.0 27907.0 U
MF SILVER CUMULATI 41300.0 41219.2 41419.8 41497.0 39808.0 D
NF NIFTY FUTURE CUM. 9118.3 9110.8 9042.9 9212.9 9045.0 U
NIFTY PE CHART 23.7 23.6 23.4 23.8 23.5 U
S&P CNX 100 INDEX 9391.1 9379.7 9298.1 9498.9 9292.6 U
CNX MIDCAP 200 16936.1 16858.6 16623.3 17017.0 16433.1 U
S&P CNX 500 INDEX 7905.3 7889.3 7811.4 7975.0 7807.5 U
CNX AUTO INDEX 9878.4 9893.9 9836.9 10088.5 9789.4 U
NSE BANK NIFTY 21122.6 21084.5 20880.2 21336.1 20753.9 U
CNX COMMODITIES IND 3439.3 3432.4 3412.3 3469.6 3392.1 U
CNX CONSUMER INDEX 3976.9 3983.2 3962.3 4065.0 3961.1 U
CPSE INDEX 2546.5 2541.4 2541.9 2553.9 2502.7 D
CNX ENERGY INDEX 11485.4 11467.1 11407.1 11625.3 11245.7 U
CNX FINANCE 8591.4 8560.0 8439.4 8638.4 8461.8 U
CNX FMCG INDEX 23455.1 23339.3 22892.2 23849.0 22566.2 U
NSE INFRASTRUCT.IN 3045.2 3043.2 3016.1 3115.1 3009.1 U
CNX IT INDEX 10769.0 10795.8 10806.4 10927.3 10677.8 D
CNX NIFTY JUNIOR 24805.5 24749.5 24463.5 25022.5 24247.8 U
LIX 15 3844.5 3844.1 3810.2 3912.4 3766.5 U
CNX MEDIA INDEX 3089.3 3081.4 3052.2 3125.9 3069.2 U
CNX METAL INDEX 3123.0 3118.8 3118.1 3167.2 3022.2 U
CNX MIDCAP 50 4328.7 4305.4 4232.8 4349.3 4171.4 U
CNX MNC INDEX 10864.9 10862.8 10762.5 11026.6 10713.7 U
CNX PHARMA INDEX 10556.4 10577.7 10578.4 10783.9 10373.3 D
CNX PSE INDEX 4005.0 3993.3 3975.4 4015.0 3941.8 U
CNX PSU BANK INDEX 3359.9 3342.1 3296.1 3398.1 3232.2 U
NSE CNX REALITY INDX 213.2 210.3 204.4 215.3 201.2 U
CNX SERVICE INDEX 11729.0 11711.6 11604.3 11846.5 11583.0 U
CNX SMALLCAP INDEX 6861.9 6821.1 6728.1 6892.6 6652.9 U
THIS WEEK’S FRESH DOWN TREND-ND NEW
(ND) Note: Keep 2 weeks High as stop loss or a weekly closing stop loss
of Weekly Reversal Value.
Scrips Close Weekly
CV
Weekly Reversal
Value
2 Weeks High
2 Weeks Low
T
ABB INDIA LTD 1194.00 1199.10 1206.50 1227.00 1182.00 ND
AGRO TECH FOODS 530.50 540.70 553.00 585.10 528.00 ND
(For Private Circulation- Subscriber only)
pg. 5
ALEMBIC PHARMA 602.10 604.02 608.51 709.30 590.00 ND
ANANT RAJ INDUS 46.95 47.50 48.15 51.30 46.75 ND
BAJAJ AUTO 2846.35 2861.90 2864.35 2945.35 2832.30 ND
BAJAJ HOLDING 2054.00 2067.95 2082.00 2150.00 2045.00 ND
BALRAMPUR CHINI MILL 146.30 148.46 150.95 156.30 141.30 ND
BIRLA CORPORATION 691.00 693.08 694.00 710.00 685.00 ND
CLARIS LIFE 312.60 314.90 316.75 326.00 308.50 ND
D B CORPORATION 379.10 380.12 380.79 395.00 361.00 ND
DEN NETWORK 80.85 81.46 81.59 85.70 79.10 ND
DIVI'S LABORATORIES 623.00 669.12 725.75 795.00 611.00 ND
ENT NETWORK (INDIA) 827.45 825.70 827.76 870.00 790.00 ND
EXCEL CROP CARE 1757.05 1764.19 1771.40 1830.00 1700.00 ND
FUTURE CONSUMR LTD 28.45 28.78 28.89 31.25 28.35 ND
GALLIANT ISPAT 414.75 438.50 467.85 487.20 410.50 ND
GAYATRI PROJECTS 134.90 135.60 136.33 140.50 130.40 ND
GLAXO SMITH.CONS.H 5206.00 5287.98 5318.75 5580.00 5200.00 ND
GREAVES COTTON 159.20 160.83 161.00 171.65 158.45 ND
GUJRAT STAT PETRON 158.95 159.46 160.40 165.00 156.90 ND
HEXAWARE TECHNOLO 220.80 221.18 221.19 229.90 216.55 ND
HT MEDIA 81.50 82.15 82.87 84.70 80.65 ND
INDRAPRASTHA GAS 1005.25 1016.32 1028.77 1059.20 985.05 ND
JINDAL STEEL & POW 119.75 122.46 125.35 131.80 119.05 ND
JSW ENERGY 61.85 62.30 62.31 65.50 59.90 ND
JSW HOLDINGS 1524.25 1532.30 1532.31 1675.00 1501.50 ND
KNR CONSTRUCTIONS 181.40 181.06 181.13 184.85 178.30 ND
KWALITY LIMITED 156.90 157.27 157.76 162.30 154.85 ND
MAHINDRA CIE AUTOM 199.75 202.85 204.54 214.50 199.00 ND
MARKSANS PHARMA 47.35 48.24 48.95 52.75 47.20 ND
MCLEOD RUSSEL (I) 165.85 167.09 168.81 172.90 162.85 ND
MINDTREE 469.20 470.59 470.74 482.00 465.20 ND
MPS 678.00 678.90 679.25 694.00 666.00 ND
NILKAMAL 1857.00 1879.54 1917.25 1999.00 1830.00 ND
OIL INDIA 332.75 333.54 333.99 340.00 326.50 ND
PERSISTENT SYSTEMS 602.90 611.83 622.97 636.40 601.50 ND
POLY MEDICURE 248.25 258.30 264.62 316.45 246.45 ND
RESPROSSIVE INDUS 95.75 95.94 97.68 103.30 86.10 ND
STAMPDE CAPITAL LTD 20.10 20.49 20.70 22.60 19.55 ND
SUN PHARMA ADVAN. 324.25 325.62 329.10 345.60 320.00 ND
TATA COMMUNICATI 730.00 739.41 747.00 784.00 725.00 ND
TATA INVESTMENT CO 618.65 620.77 628.21 644.00 609.75 ND
TATA TELESERVICES 7.83 8.06 8.63 9.37 7.61 ND
TCS 2426.75 2459.44 2496.94 2584.00 2423.70 ND
TEXMACO RAIL & ENGN 89.25 90.31 90.84 96.40 89.00 ND
TRENT 241.10 242.62 242.70 256.75 238.25 ND
TVS MOTOR COMPANY 427.95 431.03 431.31 444.80 421.80 ND
UNITECH 5.74 5.80 5.91 6.18 5.38 ND
VARDHMAN TEXTILES 1306.00 1320.14 1337.25 1440.00 1283.00 ND
V-GUARD INDUSTRIES 169.10 170.58 171.70 185.00 168.75 ND
WIM PLAST 1355.00 1380.70 1404.25 1480.00 1350.00 ND
WOCKHARDT 719.00 724.77 727.50 759.00 715.00 ND
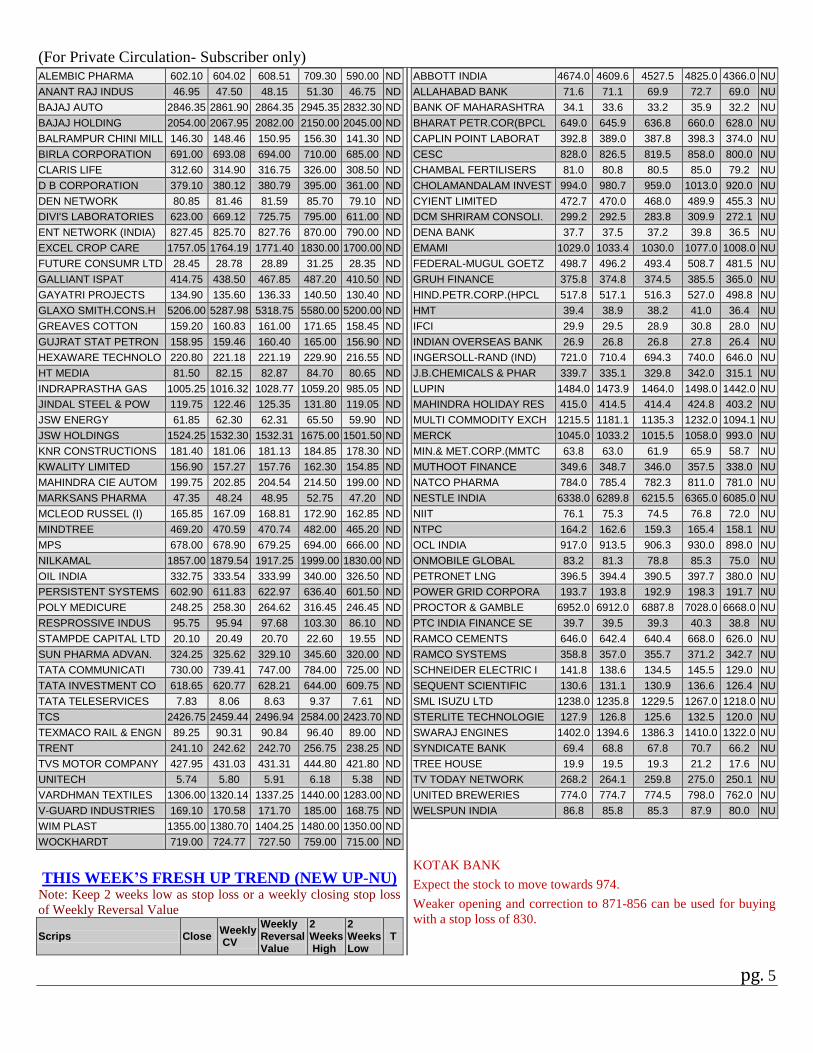
THIS WEEK’S FRESH UP TREND (NEW UP-NU) Note: Keep 2 weeks low as stop loss or a weekly closing stop loss
of Weekly Reversal Value
Scrips Close Weekly CV
Weekly Reversal Value
2 Weeks High
2 Weeks Low
T
ABBOTT INDIA 4674.0 4609.6 4527.5 4825.0 4366.0 NU
ALLAHABAD BANK 71.6 71.1 69.9 72.7 69.0 NU
BANK OF MAHARASHTRA 34.1 33.6 33.2 35.9 32.2 NU
BHARAT PETR.COR(BPCL 649.0 645.9 636.8 660.0 628.0 NU
CAPLIN POINT LABORAT 392.8 389.0 387.8 398.3 374.0 NU
CESC 828.0 826.5 819.5 858.0 800.0 NU
CHAMBAL FERTILISERS 81.0 80.8 80.5 85.0 79.2 NU
CHOLAMANDALAM INVEST 994.0 980.7 959.0 1013.0 920.0 NU
CYIENT LIMITED 472.7 470.0 468.0 489.9 455.3 NU
DCM SHRIRAM CONSOLI. 299.2 292.5 283.8 309.9 272.1 NU
DENA BANK 37.7 37.5 37.2 39.8 36.5 NU
EMAMI 1029.0 1033.4 1030.0 1077.0 1008.0 NU
FEDERAL-MUGUL GOETZ 498.7 496.2 493.4 508.7 481.5 NU
GRUH FINANCE 375.8 374.8 374.5 385.5 365.0 NU
HIND.PETR.CORP.(HPCL 517.8 517.1 516.3 527.0 498.8 NU
HMT 39.4 38.9 38.2 41.0 36.4 NU
IFCI 29.9 29.5 28.9 30.8 28.0 NU
INDIAN OVERSEAS BANK 26.9 26.8 26.8 27.8 26.4 NU
INGERSOLL-RAND (IND) 721.0 710.4 694.3 740.0 646.0 NU
J.B.CHEMICALS & PHAR 339.7 335.1 329.8 342.0 315.1 NU
LUPIN 1484.0 1473.9 1464.0 1498.0 1442.0 NU
MAHINDRA HOLIDAY RES 415.0 414.5 414.4 424.8 403.2 NU
MULTI COMMODITY EXCH 1215.5 1181.1 1135.3 1232.0 1094.1 NU
MERCK 1045.0 1033.2 1015.5 1058.0 993.0 NU
MIN.& MET.CORP.(MMTC 63.8 63.0 61.9 65.9 58.7 NU
MUTHOOT FINANCE 349.6 348.7 346.0 357.5 338.0 NU
NATCO PHARMA 784.0 785.4 782.3 811.0 781.0 NU
NESTLE INDIA 6338.0 6289.8 6215.5 6365.0 6085.0 NU
NIIT 76.1 75.3 74.5 76.8 72.0 NU
NTPC 164.2 162.6 159.3 165.4 158.1 NU
OCL INDIA 917.0 913.5 906.3 930.0 898.0 NU
ONMOBILE GLOBAL 83.2 81.3 78.8 85.3 75.0 NU
PETRONET LNG 396.5 394.4 390.5 397.7 380.0 NU
POWER GRID CORPORA 193.7 193.8 192.9 198.3 191.7 NU
PROCTOR & GAMBLE 6952.0 6912.0 6887.8 7028.0 6668.0 NU
PTC INDIA FINANCE SE 39.7 39.5 39.3 40.3 38.8 NU
RAMCO CEMENTS 646.0 642.4 640.4 668.0 626.0 NU
RAMCO SYSTEMS 358.8 357.0 355.7 371.2 342.7 NU
SCHNEIDER ELECTRIC I 141.8 138.6 134.5 145.5 129.0 NU
SEQUENT SCIENTIFIC 130.6 131.1 130.9 136.6 126.4 NU
SML ISUZU LTD 1238.0 1235.8 1229.5 1267.0 1218.0 NU
STERLITE TECHNOLOGIE 127.9 126.8 125.6 132.5 120.0 NU
SWARAJ ENGINES 1402.0 1394.6 1386.3 1410.0 1322.0 NU
SYNDICATE BANK 69.4 68.8 67.8 70.7 66.2 NU
TREE HOUSE 19.9 19.5 19.3 21.2 17.6 NU
TV TODAY NETWORK 268.2 264.1 259.8 275.0 250.1 NU
UNITED BREWERIES 774.0 774.7 774.5 798.0 762.0 NU
WELSPUN INDIA 86.8 85.8 85.3 87.9 80.0 NU
KOTAK BANK
Expect the stock to move towards 974.
Weaker opening and correction to 871-856 can be used for buying
with a stop loss of 830.
(For Private Circulation- Subscriber only)
pg. 6
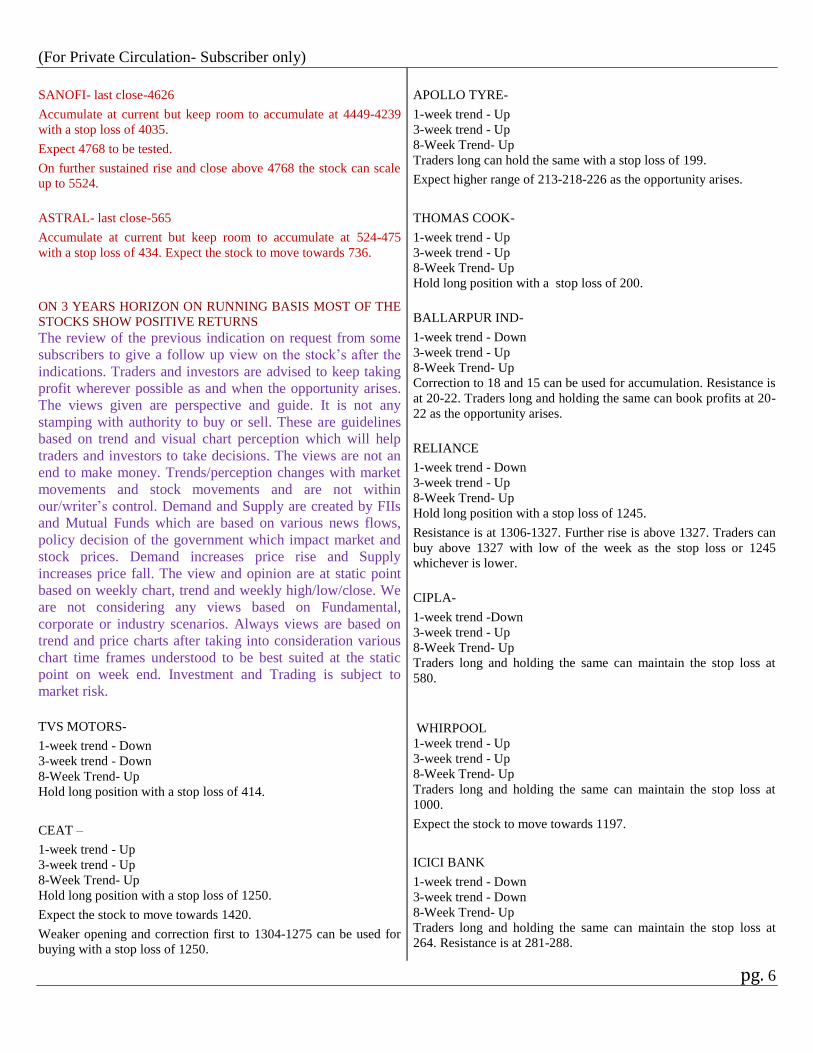
SANOFI- last close-4626
Accumulate at current but keep room to accumulate at 4449-4239
with a stop loss of 4035.
Expect 4768 to be tested.
On further sustained rise and close above 4768 the stock can scale
up to 5524.
ASTRAL- last close-565
Accumulate at current but keep room to accumulate at 524-475
with a stop loss of 434. Expect the stock to move towards 736.
ON 3 YEARS HORIZON ON RUNNING BASIS MOST OF THE
STOCKS SHOW POSITIVE RETURNS
The review of the previous indication on request from some
subscribers to give a follow up view on the stock’s after the
indications. Traders and investors are advised to keep taking
profit wherever possible as and when the opportunity arises.
The views given are perspective and guide. It is not any
stamping with authority to buy or sell. These are guidelines
based on trend and visual chart perception which will help
traders and investors to take decisions. The views are not an
end to make money. Trends/perception changes with market
movements and stock movements and are not within
our/writer’s control. Demand and Supply are created by FIIs
and Mutual Funds which are based on various news flows,
policy decision of the government which impact market and
stock prices. Demand increases price rise and Supply
increases price fall. The view and opinion are at static point
based on weekly chart, trend and weekly high/low/close. We
are not considering any views based on Fundamental,
corporate or industry scenarios. Always views are based on
trend and price charts after taking into consideration various
chart time frames understood to be best suited at the static
point on week end. Investment and Trading is subject to
market risk.
TVS MOTORS-
1-week trend - Down
3-week trend - Down
8-Week Trend- Up
Hold long position with a stop loss of 414.
CEAT –
1-week trend - Up
3-week trend - Up
8-Week Trend- Up
Hold long position with a stop loss of 1250.
Expect the stock to move towards 1420.
Weaker opening and correction first to 1304-1275 can be used for
buying with a stop loss of 1250.
APOLLO TYRE-
1-week trend - Up
3-week trend - Up
8-Week Trend- Up
Traders long can hold the same with a stop loss of 199.
Expect higher range of 213-218-226 as the opportunity arises.
THOMAS COOK-
1-week trend - Up
3-week trend - Up
8-Week Trend- Up
Hold long position with a stop loss of 200.
BALLARPUR IND-
1-week trend - Down
3-week trend - Up
8-Week Trend- Up
Correction to 18 and 15 can be used for accumulation. Resistance is
at 20-22. Traders long and holding the same can book profits at 20-
22 as the opportunity arises.
RELIANCE
1-week trend - Down
3-week trend - Up
8-Week Trend- Up
Hold long position with a stop loss of 1245.
Resistance is at 1306-1327. Further rise is above 1327. Traders can
buy above 1327 with low of the week as the stop loss or 1245
whichever is lower.
CIPLA-
1-week trend -Down
3-week trend - Up
8-Week Trend- Up
Traders long and holding the same can maintain the stop loss at
580.
WHIRPOOL
1-week trend - Up
3-week trend - Up
8-Week Trend- Up
Traders long and holding the same can maintain the stop loss at
1000.
Expect the stock to move towards 1197.
ICICI BANK
1-week trend - Down
3-week trend - Down
8-Week Trend- Up
Traders long and holding the same can maintain the stop loss at
264. Resistance is at 281-288.
(For Private Circulation- Subscriber only)
pg. 7
REC-
1-week trend - Up
3-week trend - Up
8-Week Trend- Up
Hold long position with a stop loss of 163.
Expect higher range of 178-183-191 to be tested and the same can
be used to take profits.
TRIDENT-
1-week trend - Up
3-week trend - Up
8-Week Trend- Up
Traders long and holding the same can maintain the stop loss at 73.
DREDGING COR-
1-week trend - Up
3-week trend - Up
8-Week Trend- Up
Hold long position with a stop loss of 657. Further rise is above
720. Traders can buy above 720 with low of the week as the stop
loss or 657 whichever is lower.
RCF
1-week trend - Up
3-week trend - Up
8-Week Trend- Up
Traders by CHANCE STILL LONG and holding the same can
maintain the stop loss at 61. The level of 74 can be used to profits.
ADANI PORT
1-week trend – Down
3-week trend - Up
8-Week Trend- Up
Hold long position with a stop loss of 290.
On sustained rise and close above 330 expect the stock to move
towards 372.
CHEENAI PETRO
1-week trend - Up
3-week trend -Down
8-Week Trend- Up
Traders can revise up the stop loss to 325.
EXIDE
1-week trend - Down
3-week trend - Up
8-Week Trend- Up
Accumulate at current and on decline to 207-190 can be used for
buying. Expect 294 to be tested in due course of time.
TATA CHEM
1-week trend - Down
3-week trend - Up
8-Week Trend- Up
Further rise is above 592. Traders can buy above 592 with low of
the week as the stop loss or 550 whichever is lower.
On sustained rise and close above 592 expect a rally to 727.
ZEE LERARNING
1-week trend - Up
3-week trend - Up
8-Week Trend- Up
Accumulate at 48.7-46.4 with a stop loss of 44.
GRINDWELL NORTON
1-week trend – Down
3-week trend – Up
8-Week Trend- Up
Long term investors can hold and accumulate on decline to 300 or
below with a stop loss of 285.
Whenever breakout and close above 350 is witnessed in time to
come the stock will resume a rally to get past the time.
CENTURY TEX
Weekly Chart:
1-week trend - Down
3-week trend – Up
8-Week Trend- Up
Traders long can revise up the stop loss to 950.
HDFC
Weekly Chart:
1-week trend - Up
3-week trend – Up
8-Week Trend- Up
Hold long position with a stop loss of 1350.
On sustained rise and close above 1475 expect a rally to 1744.
AIA ENG
Weekly Chart:
1-week trend – Up
3-week trend – Up
8-Week Trend- Up
Hold long position with a stop loss of 1360.
(For Private Circulation- Subscriber only)
pg. 8
IGL
1-week trend - Down
3-week trend – Down
8-Week Trend- Up
Exit long on rise from 986-1072.
VOLTAS
Weekly Chart:
1-week trend – Up
3-week trend - Up
8-week trend - Up
Traders long can keep the stop loss at 380.
Book profits at 394-401-408 as and when the opportunity arises.
HINDALCO
Weekly Chart:
1-week trend - Down
3-week trend – Down
8-week trend – Up
Traders by chance long and holding the same can maintain the stop
loss at 186.
INFOSYS
1-week trend - Down
3-week trend - Up
8-week trend – Up
Hold long position with a stop loss of 1000.
Add further on rise and close above 1044 for 1134 and 1178.
TCS
1-week trend - Down
3-week trend – Down
8-week trend – Up
Exit long and sell on rise from 2458-2494 with a stop loss of 2588.
Expect lower range of 2391-2356.
HDFC BANK
1-week trend - Down
3-week trend – Up
8-week trend – Up
Traders long and holding the same can maintain the stop loss at
1400.
FUTURES TRADING VIEWS
Risk is higher on account of the lot seizes. Asses individual risk
against the stop loss mentioned and then only trade otherwise
avoid.
YES BANK FUTURES
Hold long position with a stop loss of 1425. Expect 1561-1592 to
be tested.
HUL FUTURES
Hold long position with a stop loss of 880.
TISCO FUTURES
Hold long position with a stop loss of 464. Accumulate at 486 or
below as the opportunity arises. Buy above 504 with low of the
week as the stop loss or 464 whichever is lower.
HPCL FUTURES
Hold short position with a stop loss of 533.
LT FIN FUTURES
Traders long and holding the same can maintain the stop loss at
118. Expect 124-126 to be tested.
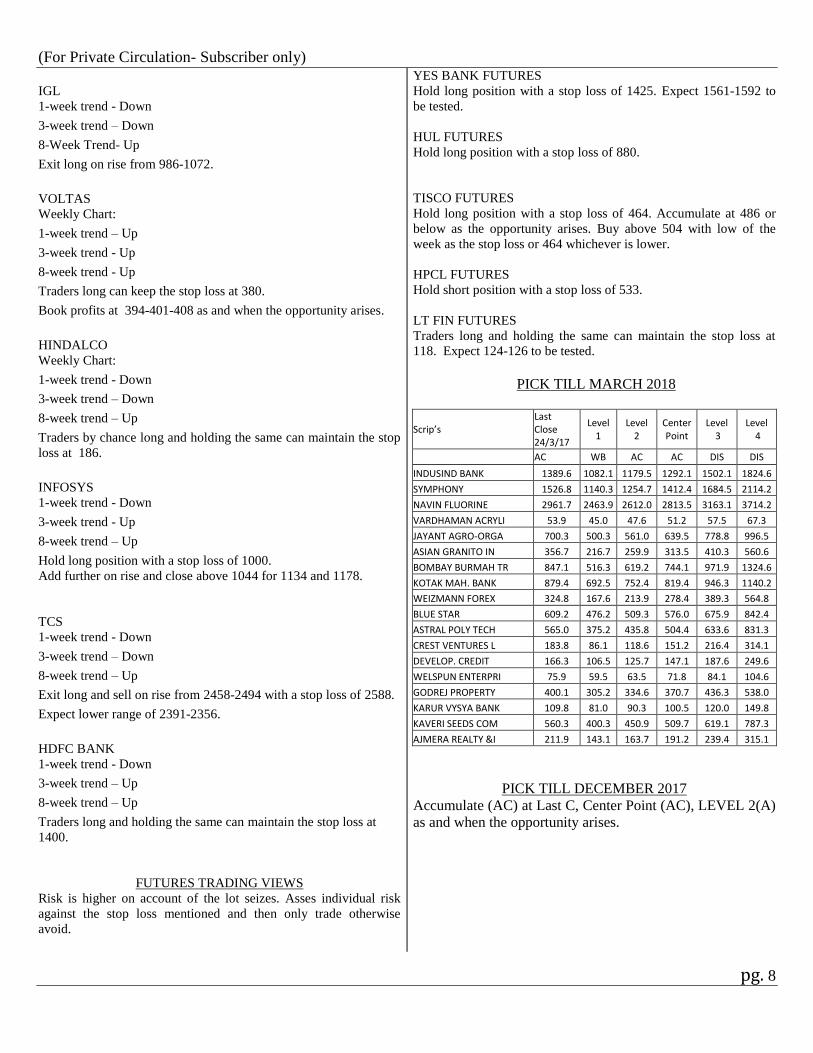
PICK TILL MARCH 2018
Scrip’s Last Close 24/3/17
Level 1
Level 2
Center Point
Level 3
Level 4
AC WB AC AC DIS DIS
INDUSIND BANK 1389.6 1082.1 1179.5 1292.1 1502.1 1824.6
SYMPHONY 1526.8 1140.3 1254.7 1412.4 1684.5 2114.2
NAVIN FLUORINE 2961.7 2463.9 2612.0 2813.5 3163.1 3714.2
VARDHAMAN ACRYLI 53.9 45.0 47.6 51.2 57.5 67.3
JAYANT AGRO-ORGA 700.3 500.3 561.0 639.5 778.8 996.5
ASIAN GRANITO IN 356.7 216.7 259.9 313.5 410.3 560.6
BOMBAY BURMAH TR 847.1 516.3 619.2 744.1 971.9 1324.6
KOTAK MAH. BANK 879.4 692.5 752.4 819.4 946.3 1140.2
WEIZMANN FOREX 324.8 167.6 213.9 278.4 389.3 564.8
BLUE STAR 609.2 476.2 509.3 576.0 675.9 842.4
ASTRAL POLY TECH 565.0 375.2 435.8 504.4 633.6 831.3
CREST VENTURES L 183.8 86.1 118.6 151.2 216.4 314.1
DEVELOP. CREDIT 166.3 106.5 125.7 147.1 187.6 249.6
WELSPUN ENTERPRI 75.9 59.5 63.5 71.8 84.1 104.6
GODREJ PROPERTY 400.1 305.2 334.6 370.7 436.3 538.0
KARUR VYSYA BANK 109.8 81.0 90.3 100.5 120.0 149.8
KAVERI SEEDS COM 560.3 400.3 450.9 509.7 619.1 787.3
AJMERA REALTY &I 211.9 143.1 163.7 191.2 239.4 315.1
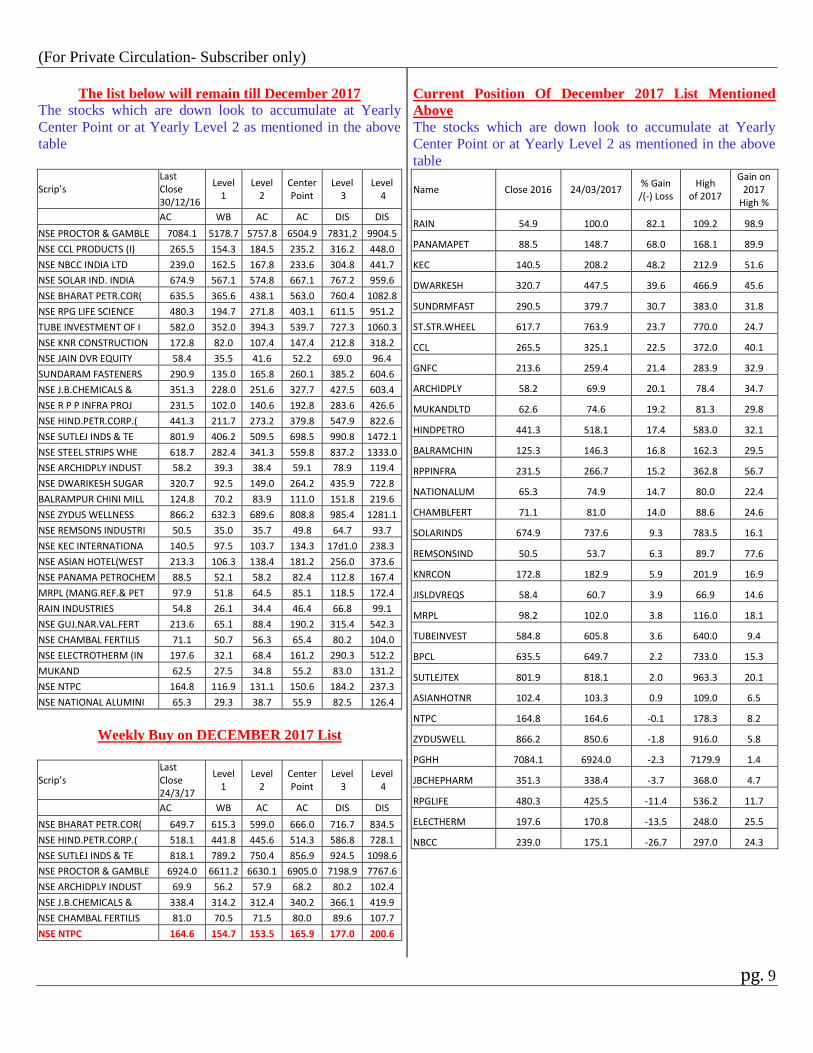
PICK TILL DECEMBER 2017
Accumulate (AC) at Last C, Center Point (AC), LEVEL 2(A)
as and when the opportunity arises.
(For Private Circulation- Subscriber only)
pg. 9
The list below will remain till December 2017
The stocks which are down look to accumulate at Yearly
Center Point or at Yearly Level 2 as mentioned in the above
table
Scrip’s Last Close 30/12/16
Level 1
Level 2
Center Point
Level 3
Level 4
AC WB AC AC DIS DIS
NSE PROCTOR & GAMBLE 7084.1 5178.7 5757.8 6504.9 7831.2 9904.5
NSE CCL PRODUCTS (I) 265.5 154.3 184.5 235.2 316.2 448.0
NSE NBCC INDIA LTD 239.0 162.5 167.8 233.6 304.8 441.7
NSE SOLAR IND. INDIA 674.9 567.1 574.8 667.1 767.2 959.6
NSE BHARAT PETR.COR( 635.5 365.6 438.1 563.0 760.4 1082.8
NSE RPG LIFE SCIENCE 480.3 194.7 271.8 403.1 611.5 951.2
TUBE INVESTMENT OF I 582.0 352.0 394.3 539.7 727.3 1060.3
NSE KNR CONSTRUCTION 172.8 82.0 107.4 147.4 212.8 318.2
NSE JAIN DVR EQUITY 58.4 35.5 41.6 52.2 69.0 96.4
SUNDARAM FASTENERS 290.9 135.0 165.8 260.1 385.2 604.6
NSE J.B.CHEMICALS & 351.3 228.0 251.6 327.7 427.5 603.4
NSE R P P INFRA PROJ 231.5 102.0 140.6 192.8 283.6 426.6
NSE HIND.PETR.CORP.( 441.3 211.7 273.2 379.8 547.9 822.6
NSE SUTLEJ INDS & TE 801.9 406.2 509.5 698.5 990.8 1472.1
NSE STEEL STRIPS WHE 618.7 282.4 341.3 559.8 837.2 1333.0
NSE ARCHIDPLY INDUST 58.2 39.3 38.4 59.1 78.9 119.4
NSE DWARIKESH SUGAR 320.7 92.5 149.0 264.2 435.9 722.8
BALRAMPUR CHINI MILL 124.8 70.2 83.9 111.0 151.8 219.6
NSE ZYDUS WELLNESS 866.2 632.3 689.6 808.8 985.4 1281.1
NSE REMSONS INDUSTRI 50.5 35.0 35.7 49.8 64.7 93.7
NSE KEC INTERNATIONA 140.5 97.5 103.7 134.3 17d1.0 238.3
NSE ASIAN HOTEL(WEST 213.3 106.3 138.4 181.2 256.0 373.6
NSE PANAMA PETROCHEM 88.5 52.1 58.2 82.4 112.8 167.4
MRPL (MANG.REF.& PET 97.9 51.8 64.5 85.1 118.5 172.4
RAIN INDUSTRIES 54.8 26.1 34.4 46.4 66.8 99.1
NSE GUJ.NAR.VAL.FERT 213.6 65.1 88.4 190.2 315.4 542.3
NSE CHAMBAL FERTILIS 71.1 50.7 56.3 65.4 80.2 104.0
NSE ELECTROTHERM (IN 197.6 32.1 68.4 161.2 290.3 512.2
MUKAND 62.5 27.5 34.8 55.2 83.0 131.2
NSE NTPC 164.8 116.9 131.1 150.6 184.2 237.3
NSE NATIONAL ALUMINI 65.3 29.3 38.7 55.9 82.5 126.4
Weekly Buy on DECEMBER 2017 List
Scrip’s Last Close 24/3/17
Level 1
Level 2
Center Point
Level 3
Level 4
AC WB AC AC DIS DIS
NSE BHARAT PETR.COR( 649.7 615.3 599.0 666.0 716.7 834.5
NSE HIND.PETR.CORP.( 518.1 441.8 445.6 514.3 586.8 728.1
NSE SUTLEJ INDS & TE 818.1 789.2 750.4 856.9 924.5 1098.6
NSE PROCTOR & GAMBLE 6924.0 6611.2 6630.1 6905.0 7198.9 7767.6
NSE ARCHIDPLY INDUST 69.9 56.2 57.9 68.2 80.2 102.4
NSE J.B.CHEMICALS & 338.4 314.2 312.4 340.2 366.1 419.9
NSE CHAMBAL FERTILIS 81.0 70.5 71.5 80.0 89.6 107.7
NSE NTPC 164.6 154.7 153.5 165.9 177.0 200.6
Current Position Of December 2017 List Mentioned
Above
The stocks which are down look to accumulate at Yearly
Center Point or at Yearly Level 2 as mentioned in the above
table
Name Close 2016 24/03/2017 % Gain /(-) Loss
High of 2017
Gain on 2017
High %
RAIN 54.9 100.0 82.1 109.2 98.9
PANAMAPET 88.5 148.7 68.0 168.1 89.9
KEC 140.5 208.2 48.2 212.9 51.6
DWARKESH 320.7 447.5 39.6 466.9 45.6
SUNDRMFAST 290.5 379.7 30.7 383.0 31.8
ST.STR.WHEEL 617.7 763.9 23.7 770.0 24.7
CCL 265.5 325.1 22.5 372.0 40.1
GNFC 213.6 259.4 21.4 283.9 32.9
ARCHIDPLY 58.2 69.9 20.1 78.4 34.7
MUKANDLTD 62.6 74.6 19.2 81.3 29.8
HINDPETRO 441.3 518.1 17.4 583.0 32.1
BALRAMCHIN 125.3 146.3 16.8 162.3 29.5
RPPINFRA 231.5 266.7 15.2 362.8 56.7
NATIONALUM 65.3 74.9 14.7 80.0 22.4
CHAMBLFERT 71.1 81.0 14.0 88.6 24.6
SOLARINDS 674.9 737.6 9.3 783.5 16.1
REMSONSIND 50.5 53.7 6.3 89.7 77.6
KNRCON 172.8 182.9 5.9 201.9 16.9
JISLDVREQS 58.4 60.7 3.9 66.9 14.6
MRPL 98.2 102.0 3.8 116.0 18.1
TUBEINVEST 584.8 605.8 3.6 640.0 9.4
BPCL 635.5 649.7 2.2 733.0 15.3
SUTLEJTEX 801.9 818.1 2.0 963.3 20.1
ASIANHOTNR 102.4 103.3 0.9 109.0 6.5
NTPC 164.8 164.6 -0.1 178.3 8.2
ZYDUSWELL 866.2 850.6 -1.8 916.0 5.8
PGHH 7084.1 6924.0 -2.3 7179.9 1.4
JBCHEPHARM 351.3 338.4 -3.7 368.0 4.7
RPGLIFE 480.3 425.5 -11.4 536.2 11.7
ELECTHERM 197.6 170.8 -13.5 248.0 25.5
NBCC 239.0 175.1 -26.7 297.0 24.3
(For Private Circulation- Subscriber only)
pg. 10
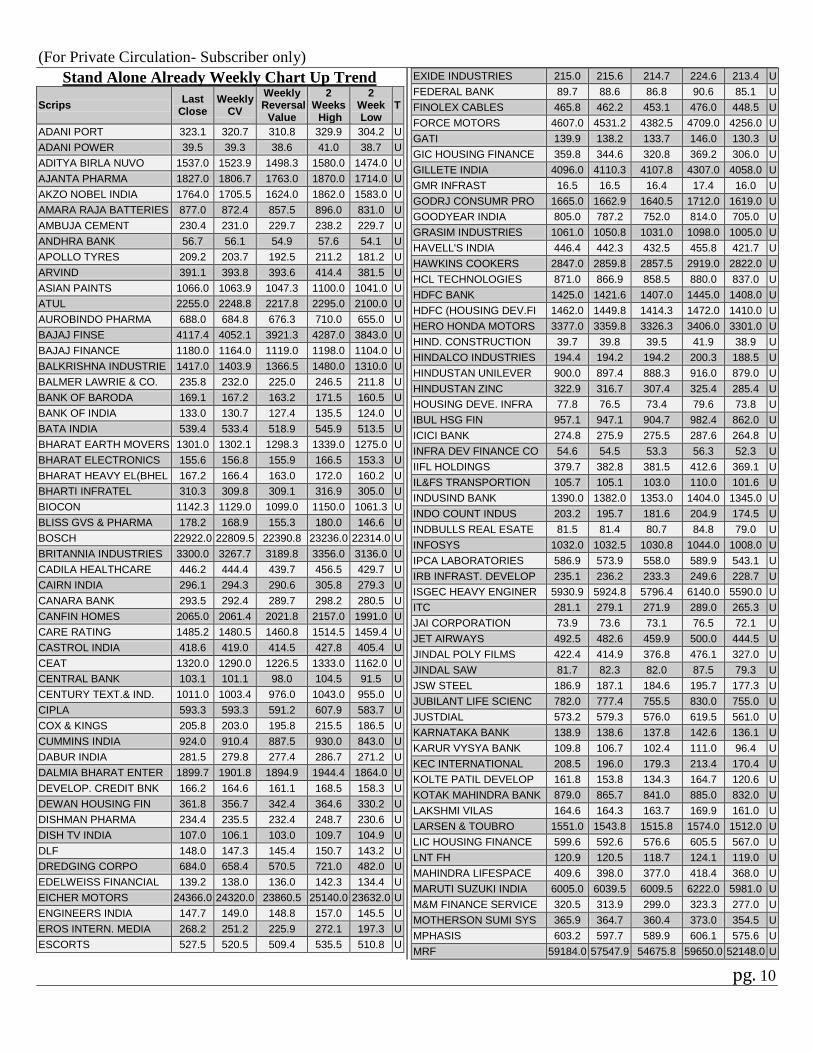
Stand Alone Already Weekly Chart Up Trend
Scrips Last
Close Weekly
CV
Weekly Reversal
Value
2 Weeks High
2 Week Low
T
ADANI PORT 323.1 320.7 310.8 329.9 304.2 U
ADANI POWER 39.5 39.3 38.6 41.0 38.7 U
ADITYA BIRLA NUVO 1537.0 1523.9 1498.3 1580.0 1474.0 U
AJANTA PHARMA 1827.0 1806.7 1763.0 1870.0 1714.0 U
AKZO NOBEL INDIA 1764.0 1705.5 1624.0 1862.0 1583.0 U
AMARA RAJA BATTERIES 877.0 872.4 857.5 896.0 831.0 U
AMBUJA CEMENT 230.4 231.0 229.7 238.2 229.7 U
ANDHRA BANK 56.7 56.1 54.9 57.6 54.1 U
APOLLO TYRES 209.2 203.7 192.5 211.2 181.2 U
ARVIND 391.1 393.8 393.6 414.4 381.5 U
ASIAN PAINTS 1066.0 1063.9 1047.3 1100.0 1041.0 U
ATUL 2255.0 2248.8 2217.8 2295.0 2100.0 U
AUROBINDO PHARMA 688.0 684.8 676.3 710.0 655.0 U
BAJAJ FINSE 4117.4 4052.1 3921.3 4287.0 3843.0 U
BAJAJ FINANCE 1180.0 1164.0 1119.0 1198.0 1104.0 U
BALKRISHNA INDUSTRIE 1417.0 1403.9 1366.5 1480.0 1310.0 U
BALMER LAWRIE & CO. 235.8 232.0 225.0 246.5 211.8 U
BANK OF BARODA 169.1 167.2 163.2 171.5 160.5 U
BANK OF INDIA 133.0 130.7 127.4 135.5 124.0 U
BATA INDIA 539.4 533.4 518.9 545.9 513.5 U
BHARAT EARTH MOVERS 1301.0 1302.1 1298.3 1339.0 1275.0 U
BHARAT ELECTRONICS 155.6 156.8 155.9 166.5 153.3 U
BHARAT HEAVY EL(BHEL 167.2 166.4 163.0 172.0 160.2 U
BHARTI INFRATEL 310.3 309.8 309.1 316.9 305.0 U
BIOCON 1142.3 1129.0 1099.0 1150.0 1061.3 U
BLISS GVS & PHARMA 178.2 168.9 155.3 180.0 146.6 U
BOSCH 22922.0 22809.5 22390.8 23236.0 22314.0 U
BRITANNIA INDUSTRIES 3300.0 3267.7 3189.8 3356.0 3136.0 U
CADILA HEALTHCARE 446.2 444.4 439.7 456.5 429.7 U
CAIRN INDIA 296.1 294.3 290.6 305.8 279.3 U
CANARA BANK 293.5 292.4 289.7 298.2 280.5 U
CANFIN HOMES 2065.0 2061.4 2021.8 2157.0 1991.0 U
CARE RATING 1485.2 1480.5 1460.8 1514.5 1459.4 U
CASTROL INDIA 418.6 419.0 414.5 427.8 405.4 U
CEAT 1320.0 1290.0 1226.5 1333.0 1162.0 U
CENTRAL BANK 103.1 101.1 98.0 104.5 91.5 U
CENTURY TEXT.& IND. 1011.0 1003.4 976.0 1043.0 955.0 U
CIPLA 593.3 593.3 591.2 607.9 583.7 U
COX & KINGS 205.8 203.0 195.8 215.5 186.5 U
CUMMINS INDIA 924.0 910.4 887.5 930.0 843.0 U
DABUR INDIA 281.5 279.8 277.4 286.7 271.2 U
DALMIA BHARAT ENTER 1899.7 1901.8 1894.9 1944.4 1864.0 U
DEVELOP. CREDIT BNK 166.2 164.6 161.1 168.5 158.3 U
DEWAN HOUSING FIN 361.8 356.7 342.4 364.6 330.2 U
DISHMAN PHARMA 234.4 235.5 232.4 248.7 230.6 U
DISH TV INDIA 107.0 106.1 103.0 109.7 104.9 U
DLF 148.0 147.3 145.4 150.7 143.2 U
DREDGING CORPO 684.0 658.4 570.5 721.0 482.0 U
EDELWEISS FINANCIAL 139.2 138.0 136.0 142.3 134.4 U
EICHER MOTORS 24366.0 24320.0 23860.5 25140.0 23632.0 U
ENGINEERS INDIA 147.7 149.0 148.8 157.0 145.5 U
EROS INTERN. MEDIA 268.2 251.2 225.9 272.1 197.3 U
ESCORTS 527.5 520.5 509.4 535.5 510.8 U
EXIDE INDUSTRIES 215.0 215.6 214.7 224.6 213.4 U
FEDERAL BANK 89.7 88.6 86.8 90.6 85.1 U
FINOLEX CABLES 465.8 462.2 453.1 476.0 448.5 U
FORCE MOTORS 4607.0 4531.2 4382.5 4709.0 4256.0 U
GATI 139.9 138.2 133.7 146.0 130.3 U
GIC HOUSING FINANCE 359.8 344.6 320.8 369.2 306.0 U
GILLETE INDIA 4096.0 4110.3 4107.8 4307.0 4058.0 U
GMR INFRAST 16.5 16.5 16.4 17.4 16.0 U
GODRJ CONSUMR PRO 1665.0 1662.9 1640.5 1712.0 1619.0 U
GOODYEAR INDIA 805.0 787.2 752.0 814.0 705.0 U
GRASIM INDUSTRIES 1061.0 1050.8 1031.0 1098.0 1005.0 U
HAVELL'S INDIA 446.4 442.3 432.5 455.8 421.7 U
HAWKINS COOKERS 2847.0 2859.8 2857.5 2919.0 2822.0 U
HCL TECHNOLOGIES 871.0 866.9 858.5 880.0 837.0 U
HDFC BANK 1425.0 1421.6 1407.0 1445.0 1408.0 U
HDFC (HOUSING DEV.FI 1462.0 1449.8 1414.3 1472.0 1410.0 U
HERO HONDA MOTORS 3377.0 3359.8 3326.3 3406.0 3301.0 U
HIND. CONSTRUCTION 39.7 39.8 39.5 41.9 38.9 U
HINDALCO INDUSTRIES 194.4 194.2 194.2 200.3 188.5 U
HINDUSTAN UNILEVER 900.0 897.4 888.3 916.0 879.0 U
HINDUSTAN ZINC 322.9 316.7 307.4 325.4 285.4 U
HOUSING DEVE. INFRA 77.8 76.5 73.4 79.6 73.8 U
IBUL HSG FIN 957.1 947.1 904.7 982.4 862.0 U
ICICI BANK 274.8 275.9 275.5 287.6 264.8 U
INFRA DEV FINANCE CO 54.6 54.5 53.3 56.3 52.3 U
IIFL HOLDINGS 379.7 382.8 381.5 412.6 369.1 U
IL&FS TRANSPORTION 105.7 105.1 103.0 110.0 101.6 U
INDUSIND BANK 1390.0 1382.0 1353.0 1404.0 1345.0 U
INDO COUNT INDUS 203.2 195.7 181.6 204.9 174.5 U
INDBULLS REAL ESATE 81.5 81.4 80.7 84.8 79.0 U
INFOSYS 1032.0 1032.5 1030.8 1044.0 1008.0 U
IPCA LABORATORIES 586.9 573.9 558.0 589.9 543.1 U
IRB INFRAST. DEVELOP 235.1 236.2 233.3 249.6 228.7 U
ISGEC HEAVY ENGINER 5930.9 5924.8 5796.4 6140.0 5590.0 U
ITC 281.1 279.1 271.9 289.0 265.3 U
JAI CORPORATION 73.9 73.6 73.1 76.5 72.1 U
JET AIRWAYS 492.5 482.6 459.9 500.0 444.5 U
JINDAL POLY FILMS 422.4 414.9 376.8 476.1 327.0 U
JINDAL SAW 81.7 82.3 82.0 87.5 79.3 U
JSW STEEL 186.9 187.1 184.6 195.7 177.3 U
JUBILANT LIFE SCIENC 782.0 777.4 755.5 830.0 755.0 U
JUSTDIAL 573.2 579.3 576.0 619.5 561.0 U
KARNATAKA BANK 138.9 138.6 137.8 142.6 136.1 U
KARUR VYSYA BANK 109.8 106.7 102.4 111.0 96.4 U
KEC INTERNATIONAL 208.5 196.0 179.3 213.4 170.4 U
KOLTE PATIL DEVELOP 161.8 153.8 134.3 164.7 120.6 U
KOTAK MAHINDRA BANK 879.0 865.7 841.0 885.0 832.0 U
LAKSHMI VILAS 164.6 164.3 163.7 169.9 161.0 U
LARSEN & TOUBRO 1551.0 1543.8 1515.8 1574.0 1512.0 U
LIC HOUSING FINANCE 599.6 592.6 576.6 605.5 567.0 U
LNT FH 120.9 120.5 118.7 124.1 119.0 U
MAHINDRA LIFESPACE 409.6 398.0 377.0 418.4 368.0 U
MARUTI SUZUKI INDIA 6005.0 6039.5 6009.5 6222.0 5981.0 U
M&M FINANCE SERVICE 320.5 313.9 299.0 323.3 277.0 U
MOTHERSON SUMI SYS 365.9 364.7 360.4 373.0 354.5 U
MPHASIS 603.2 597.7 589.9 606.1 575.6 U
MRF 59184.0 57547.9 54675.8 59650.0 52148.0 U
(For Private Circulation- Subscriber only)
pg. 11
MAH.TEL.NIGAM (MTNL) 24.4 24.5 24.1 26.0 23.1 U
NATIONAL ALUMINIUM C 74.9 74.2 74.2 76.0 70.3 U
NAVIN FLUORINS INTER 2957.0 2864.3 2693.8 3012.0 2560.0 U
NHPC 30.7 30.6 30.3 31.1 29.7 U
NOCIL (NAT.ORG.CHEM) 84.7 84.9 84.1 88.5 83.4 U
OMAXE 170.4 169.7 168.6 170.5 166.7 U
OBC 144.4 138.3 129.2 148.8 122.5 U
PC JEWELLER 410.1 407.7 394.6 444.3 378.8 U
PFIZER 1762.0 1767.4 1758.3 1810.0 1670.0 U
PIDILITE INDUSTRIES 689.0 690.9 687.5 711.0 683.0 U
POWER FINANCE COR 145.3 143.0 138.2 148.3 132.6 U
PNB 141.3 142.1 141.8 149.1 135.4 U
PURVANKARA PROJE 66.3 62.5 56.3 70.4 51.7 U
PVR 1425.8 1417.2 1392.5 1454.0 1364.8 U
RAJESH EXPORTS 560.8 557.8 548.1 573.8 544.4 U
RAYMOND 651.0 644.6 633.6 673.0 627.2 U
R.C.F.(RASHTRIYA CHE 68.7 65.8 60.4 71.2 54.8 U
RIL COMMUNICATONS 38.7 38.3 37.6 39.7 36.1 U
RELIANCE CAPITAL 600.4 593.1 567.4 618.8 542.5 U
RELIANCE INFRAS 571.2 572.8 571.4 598.7 559.3 U
RELIANCE INDUSTRIES 1286.0 1286.5 1281.5 1320.0 1248.0 U
RELIANCE POWER 48.2 47.8 47.0 49.0 46.8 U
REPCO HOME 669.8 674.0 660.8 727.6 628.0 U
RURAL ELECTRIFICATIO 173.8 170.2 162.1 176.0 155.1 U
SAIL (STEEL AUTHORIT 62.4 62.3 61.8 64.6 59.8 U
SANGHI INDUSTRIES 71.5 71.0 68.2 76.0 66.2 U
SHIP.CORP.OF IN(SCI) 67.2 66.2 64.5 71.7 62.4 U
SHOPPERS STOP 342.3 338.3 329.3 346.5 316.2 U
SHREE CEMENT 16250.0 16260.3 16143.0 16520.0 15800.0 U
SHRIRAM TRANSPORT 1030.0 1026.3 990.5 1090.0 980.0 U
SIEMENS 1243.0 1242.1 1223.8 1273.0 1207.0 U
SINTEX INDUSTRIES 99.9 99.5 98.1 103.0 95.6 U
SNOWMAN LOGISTICS 64.3 63.9 62.3 67.7 61.0 U
SOBHA LTD 362.9 346.6 326.3 388.0 301.9 U
SPICE JET 94.2 90.0 82.8 97.4 80.0 U
S.R.F. 1593.0 1594.6 1586.5 1644.0 1564.0 U
STATE BANK OF IN 276.1 275.0 271.8 280.0 266.7 U
SUN PHARMA 703.0 701.7 695.0 728.0 678.0 U
SUN TV NETWORK 754.8 751.7 743.9 769.3 738.0 U
SUZLON ENERGY 19.0 18.8 18.2 19.8 17.0 U
SYMPHONY 1518.0 1479.4 1394.0 1571.0 1321.0 U
TATA CHEMICALS 578.0 576.1 569.5 592.2 551.6 U
TATA ELXSI 1500.0 1498.0 1482.8 1545.0 1430.0 U
TATA MOTORS 470.5 471.4 469.0 484.3 458.6 U
TATA POWER CO. 86.5 85.9 84.1 88.0 82.4 U
TIME TECHNO PLAST 123.3 119.4 110.9 127.9 103.6 U
TATA STEEL 493.2 493.2 489.5 508.5 470.3 U
TITAN INDUSTRIES 447.9 450.4 448.4 470.5 442.0 U
TORRENT PHARMA 1412.0 1410.7 1383.3 1479.0 1331.0 U
TORRENT POWER 216.6 212.9 205.4 223.2 190.6 U
TRIDENT 86.3 84.5 80.2 90.3 77.6 U
TVS SRICHAKRA 3794.0 3586.1 3252.3 3934.0 3026.0 U
ULTRATECH CEMENT 3971.9 3970.1 3914.3 4088.0 3881.0 U
UNION BANK OF INDIA 153.9 152.9 149.4 158.8 147.0 U
UNITED PHOSPHERUS 722.0 718.7 708.5 735.0 694.0 U
VAKRANGEE LIMITED 328.4 324.2 316.5 329.9 309.0 U
VEDANTA LIMITED 266.9 264.9 261.8 270.2 251.2 U
VIP INDUSTRIES 173.3 171.8 163.8 185.9 159.6 U
VOLTAS 388.7 387.3 382.8 394.7 382.0 U
WABCO-TVS (INDIA) 6057.1 5854.8 5546.8 6150.0 5250.0 U
WELSPUN CORPOR 85.9 85.2 84.2 87.5 82.8 U
WHIRLPOOL OF INDIA 1152.0 1127.7 1077.3 1168.0 1031.0 U
WIPRO 512.5 507.8 498.9 514.0 489.5 U
YES BANK 1528.9 1517.3 1488.2 1546.6 1460.0 U
ZEE LEARN 49.8 48.3 46.7 51.4 44.9 U
ZEE ENTERTAINMENT 518.0 517.6 513.6 550.0 515.8 U
Z.F. STEERING GEAR 1298.0 1261.1 1206.5 1345.0 1155.0 U
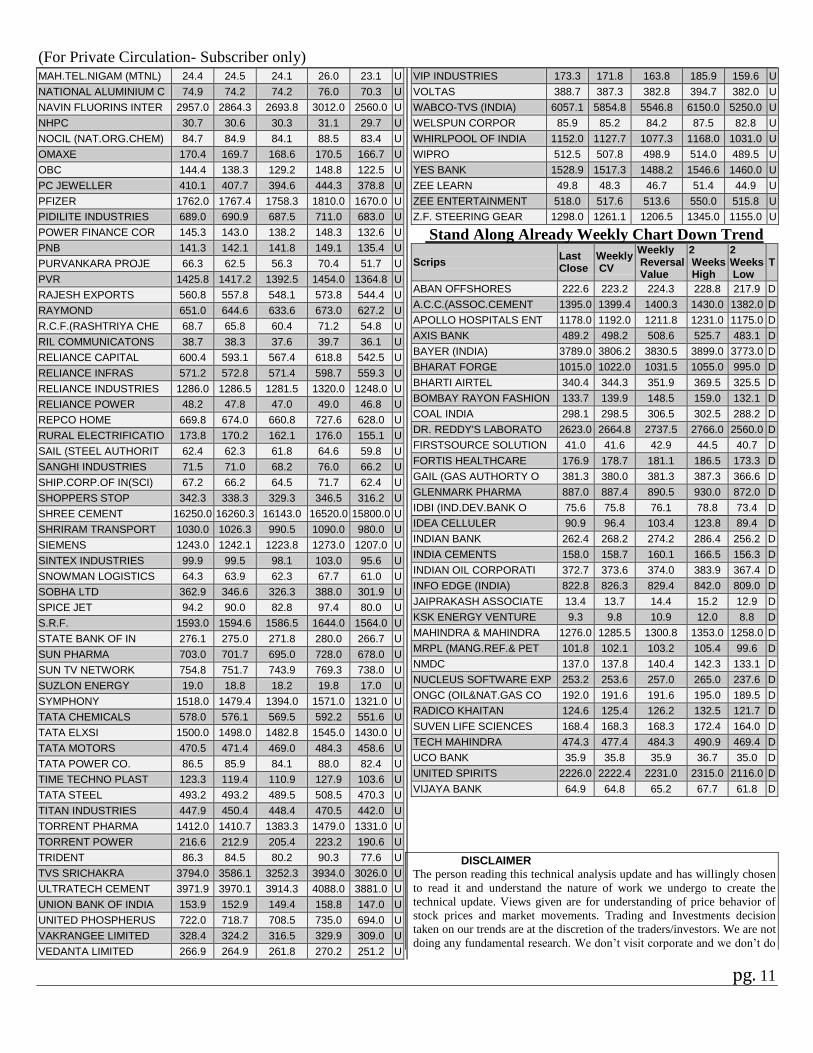
Stand Along Already Weekly Chart Down Trend
Scrips Last Close
Weekly CV
Weekly Reversal Value
2 Weeks High
2 Weeks Low
T
ABAN OFFSHORES 222.6 223.2 224.3 228.8 217.9 D
A.C.C.(ASSOC.CEMENT 1395.0 1399.4 1400.3 1430.0 1382.0 D
APOLLO HOSPITALS ENT 1178.0 1192.0 1211.8 1231.0 1175.0 D
AXIS BANK 489.2 498.2 508.6 525.7 483.1 D
BAYER (INDIA) 3789.0 3806.2 3830.5 3899.0 3773.0 D
BHARAT FORGE 1015.0 1022.0 1031.5 1055.0 995.0 D
BHARTI AIRTEL 340.4 344.3 351.9 369.5 325.5 D
BOMBAY RAYON FASHION 133.7 139.9 148.5 159.0 132.1 D
COAL INDIA 298.1 298.5 306.5 302.5 288.2 D
DR. REDDY'S LABORATO 2623.0 2664.8 2737.5 2766.0 2560.0 D
FIRSTSOURCE SOLUTION 41.0 41.6 42.9 44.5 40.7 D
FORTIS HEALTHCARE 176.9 178.7 181.1 186.5 173.3 D
GAIL (GAS AUTHORTY O 381.3 380.0 381.3 387.3 366.6 D
GLENMARK PHARMA 887.0 887.4 890.5 930.0 872.0 D
IDBI (IND.DEV.BANK O 75.6 75.8 76.1 78.8 73.4 D
IDEA CELLULER 90.9 96.4 103.4 123.8 89.4 D
INDIAN BANK 262.4 268.2 274.2 286.4 256.2 D
INDIA CEMENTS 158.0 158.7 160.1 166.5 156.3 D
INDIAN OIL CORPORATI 372.7 373.6 374.0 383.9 367.4 D
INFO EDGE (INDIA) 822.8 826.3 829.4 842.0 809.0 D
JAIPRAKASH ASSOCIATE 13.4 13.7 14.4 15.2 12.9 D
KSK ENERGY VENTURE 9.3 9.8 10.9 12.0 8.8 D
MAHINDRA & MAHINDRA 1276.0 1285.5 1300.8 1353.0 1258.0 D
MRPL (MANG.REF.& PET 101.8 102.1 103.2 105.4 99.6 D
NMDC 137.0 137.8 140.4 142.3 133.1 D
NUCLEUS SOFTWARE EXP 253.2 253.6 257.0 265.0 237.6 D
ONGC (OIL&NAT.GAS CO 192.0 191.6 191.6 195.0 189.5 D
RADICO KHAITAN 124.6 125.4 126.2 132.5 121.7 D
SUVEN LIFE SCIENCES 168.4 168.3 168.3 172.4 164.0 D
TECH MAHINDRA 474.3 477.4 484.3 490.9 469.4 D
UCO BANK 35.9 35.8 35.9 36.7 35.0 D
UNITED SPIRITS 2226.0 2222.4 2231.0 2315.0 2116.0 D
VIJAYA BANK 64.9 64.8 65.2 67.7 61.8 D
DISCLAIMER
The person reading this technical analysis update and has willingly chosen
to read it and understand the nature of work we undergo to create the
technical update. Views given are for understanding of price behavior of
stock prices and market movements. Trading and Investments decision
taken on our trends are at the discretion of the traders/investors. We are not
doing any fundamental research. We don’t visit corporate and we don’t do
(For Private Circulation- Subscriber only)
pg. 12
any industry scenario research. We are only using price charts and
technical’s to decide a view on a stock based of statistical application. We
do not know what will happen in futures as expectations are based on
technical price chart observation. We are not liable for any loss, which
occurs as a result of our trends. This document has been prepared on the
basis of publicly available information, internally developed data and other
sources believed to be reliable. While we are not soliciting any action
based upon this information, all care has been taken to ensure that the facts
are accurate and opinions given fair and reasonable. Neither, Hitendra
Vasudeo, Vasudeo Investments, www.stockmechanics.com, Profitak,
Money Times, Times Communications (I) Ltd nor any of its employees
shall be responsible for the contents. Our directors or employees, may from
time to time, have positions in, or options on, and buy and sell securities
referred in our reports