breast cancer in texas: a closer look - cprit
TRANSCRIPT
Breast Cancer in Texas: A Closer Look (Incidence and Mortality Data by Councils of Government and County)
Revised January 4, 2010
Acknowledgements
CPRIT wishes to thank the Texas Cancer Registry (TCR), Cancer Epidemiology and Surveillance Branch, Texas Department of State Health Services, for providing the tables, maps, and other information included in this document. CPRIT acknowledges the TCR’s commitment to collect, maintain, and disseminate the highest quality cancer data that will contribute towards cancer prevention and control, improving diagnoses, treatment, survival, and quality of life for all cancer patients. For questions regarding the cancer data provided in this document, or for additional cancer data questions and requests, please visit the TCR’s website at www.dshs.state.tx.us/tcr/, email [email protected], or call 1 (800) 252-8059.
Created by Cancer Epidemiology and Surveillance Branch. 11/19/2009. Incidence source: 1995-2006, NPCR CSS, 11/26/2008. Mortality source: Center for Health Statistics, DSHS, created 3/31/2009.
Female Breast Cancer in Texas
Breast cancer is the most commonly diagnosed cancer in women and second leading cause of cancer deaths in Texas women. In 2009, it is estimated that 15,110 Texas women will be newly diagnosed with invasive breast cancer, and 2,687 will die of the disease.
• From 2002–2006, a total of 61,446 cases of invasive breast cancer were newly diagnosed in Texas women, with an average of 12,289 cases per year.
• Breast cancer killed an average of 2,524 Texans annually from 2002–2006.
• From 2002–2006, non-Hispanic white females had the highest breast cancer incidence rate,
while black females had the highest mortality rate.
• Non-Hispanic white and Hispanic women along the Texas-Mexico border had lower incidence and but higher mortality rates than Non-Hispanic whites and Hispanics in non-border counties.
• From 2002–2006, there were higher female breast cancer incidence and mortality rates in urban
counties compared to rural counties.
Created by Cancer Epidemiology and Surveillance Branch. 11/19/2009. Incidence source: 1995-2006, NPCR CSS, 11/26/2008. Mortality source: Center for Health Statistics, DSHS, created 3/31/2009.
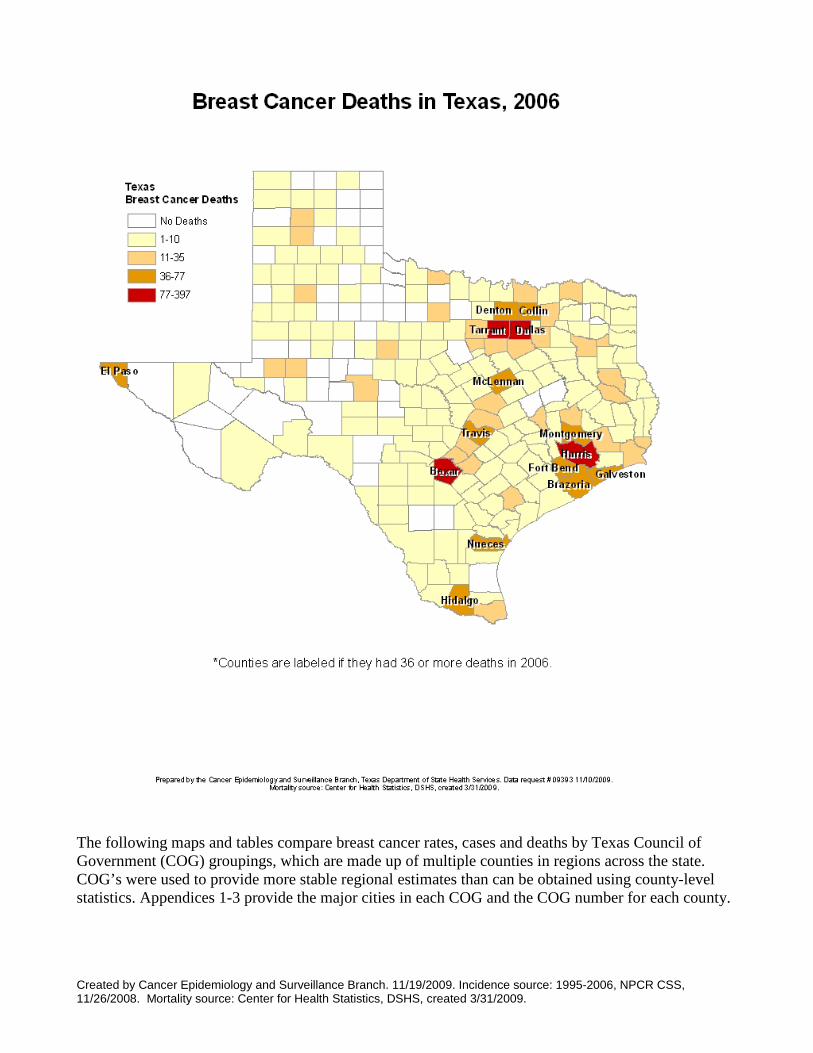
The following maps and tables compare breast cancer rates, cases and deaths by Texas Council of Government (COG) groupings, which are made up of multiple counties in regions across the state. COG’s were used to provide more stable regional estimates than can be obtained using county-level statistics. Appendices 1-3 provide the major cities in each COG and the COG number for each county.
Created by Cancer Epidemiology and Surveillance Branch. 11/19/2009. Incidence source: 1995-2006, NPCR CSS, 11/26/2008. Mortality source: Center for Health Statistics, DSHS, created 3/31/2009.
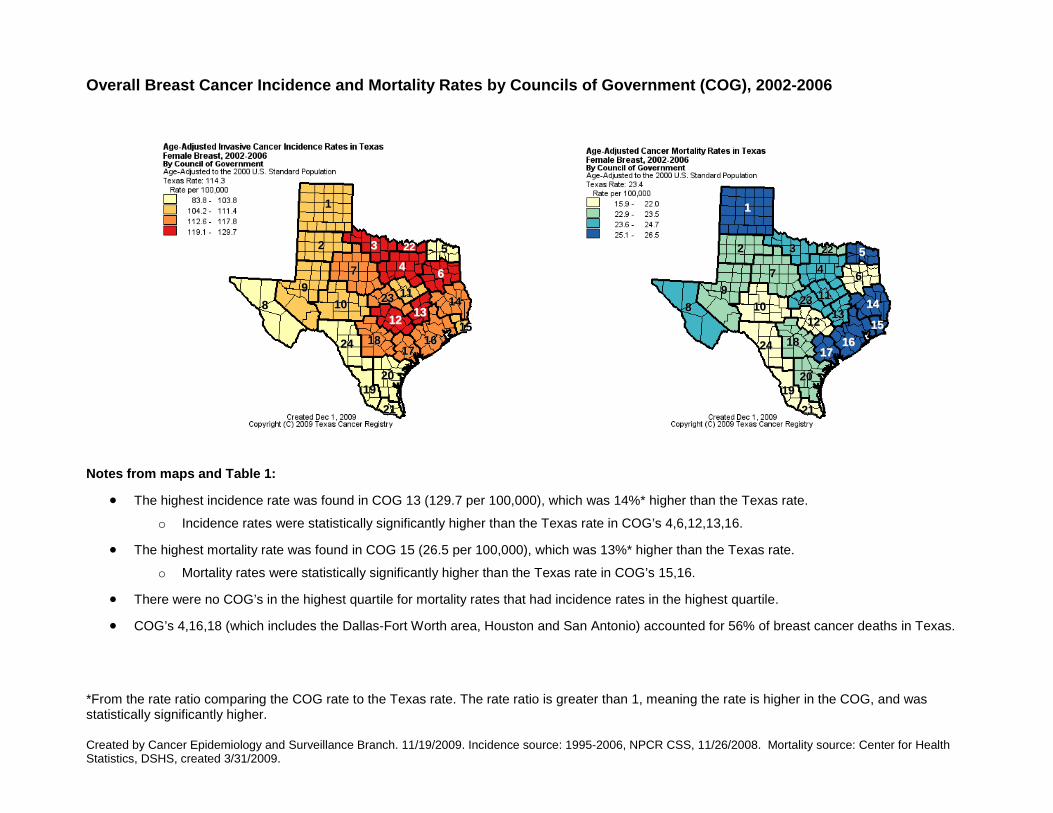
Overall Breast Cancer Incidence and Mortality Rates by Councils of Government (COG), 2002-2006
11
22 33
7799
88 1010
2424 18181212
2323
442222
1919
2121
2020
17171616
1515
14141313
111166
55
11
22 33
7799
88 1010
2424 18181212
2323
442222
1919
2121
2020
17171616
1515
14141313
111166
55
Notes from maps and Table 1:
• The highest incidence rate was found in COG 13 (129.7 per 100,000), which was 14%* higher than the Texas rate.
o Incidence rates were statistically significantly higher than the Texas rate in COG’s 4,6,12,13,16.
• The highest mortality rate was found in COG 15 (26.5 per 100,000), which was 13%* higher than the Texas rate.
o Mortality rates were statistically significantly higher than the Texas rate in COG’s 15,16.
• There were no COG’s in the highest quartile for mortality rates that had incidence rates in the highest quartile.
• COG’s 4,16,18 (which includes the Dallas-Fort Worth area, Houston and San Antonio) accounted for 56% of breast cancer deaths in Texas.
*From the rate ratio comparing the COG rate to the Texas rate. The rate ratio is greater than 1, meaning the rate is higher in the COG, and was statistically significantly higher.
Created by Cancer Epidemiology and Surveillance Branch. 11/19/2009. Incidence source: 1995-2006, NPCR CSS, 11/26/2008. Mortality source: Center for Health Statistics, DSHS, created 3/31/2009.
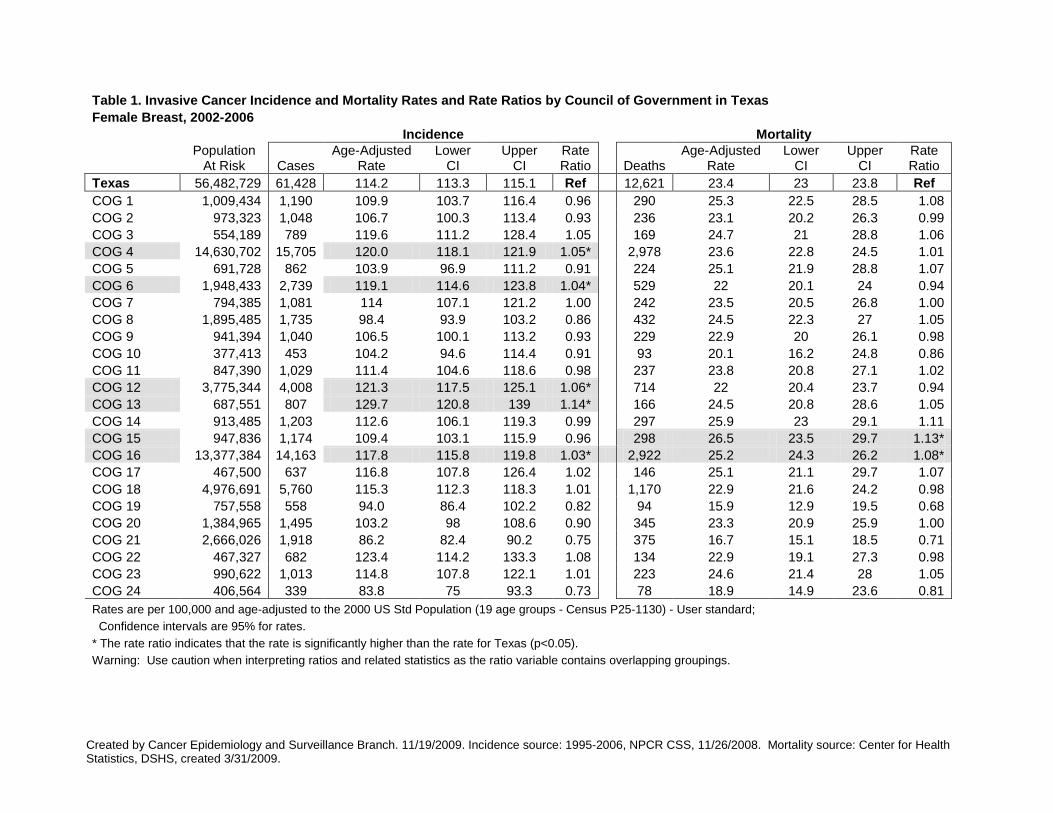
Table 1. Invasive Cancer Incidence and Mortality Rates and Rate Ratios by Council of Government in Texas Female Breast, 2002-2006 Incidence Mortality
Population
At Risk Cases Age-Adjusted
Rate Lower
CI Upper
CI Rate Ratio Deaths
Age-Adjusted Rate
Lower CI
Upper CI
Rate Ratio
Texas 56,482,729 61,428 114.2 113.3 115.1 Ref 12,621 23.4 23 23.8 Ref COG 1 1,009,434 1,190 109.9 103.7 116.4 0.96 290 25.3 22.5 28.5 1.08 COG 2 973,323 1,048 106.7 100.3 113.4 0.93 236 23.1 20.2 26.3 0.99 COG 3 554,189 789 119.6 111.2 128.4 1.05 169 24.7 21 28.8 1.06 COG 4 14,630,702 15,705 120.0 118.1 121.9 1.05* 2,978 23.6 22.8 24.5 1.01 COG 5 691,728 862 103.9 96.9 111.2 0.91 224 25.1 21.9 28.8 1.07 COG 6 1,948,433 2,739 119.1 114.6 123.8 1.04* 529 22 20.1 24 0.94 COG 7 794,385 1,081 114 107.1 121.2 1.00 242 23.5 20.5 26.8 1.00 COG 8 1,895,485 1,735 98.4 93.9 103.2 0.86 432 24.5 22.3 27 1.05 COG 9 941,394 1,040 106.5 100.1 113.2 0.93 229 22.9 20 26.1 0.98 COG 10 377,413 453 104.2 94.6 114.4 0.91 93 20.1 16.2 24.8 0.86 COG 11 847,390 1,029 111.4 104.6 118.6 0.98 237 23.8 20.8 27.1 1.02 COG 12 3,775,344 4,008 121.3 117.5 125.1 1.06* 714 22 20.4 23.7 0.94 COG 13 687,551 807 129.7 120.8 139 1.14* 166 24.5 20.8 28.6 1.05 COG 14 913,485 1,203 112.6 106.1 119.3 0.99 297 25.9 23 29.1 1.11 COG 15 947,836 1,174 109.4 103.1 115.9 0.96 298 26.5 23.5 29.7 1.13* COG 16 13,377,384 14,163 117.8 115.8 119.8 1.03* 2,922 25.2 24.3 26.2 1.08* COG 17 467,500 637 116.8 107.8 126.4 1.02 146 25.1 21.1 29.7 1.07 COG 18 4,976,691 5,760 115.3 112.3 118.3 1.01 1,170 22.9 21.6 24.2 0.98 COG 19 757,558 558 94.0 86.4 102.2 0.82 94 15.9 12.9 19.5 0.68 COG 20 1,384,965 1,495 103.2 98 108.6 0.90 345 23.3 20.9 25.9 1.00 COG 21 2,666,026 1,918 86.2 82.4 90.2 0.75 375 16.7 15.1 18.5 0.71 COG 22 467,327 682 123.4 114.2 133.3 1.08 134 22.9 19.1 27.3 0.98 COG 23 990,622 1,013 114.8 107.8 122.1 1.01 223 24.6 21.4 28 1.05 COG 24 406,564 339 83.8 75 93.3 0.73 78 18.9 14.9 23.6 0.81 Rates are per 100,000 and age-adjusted to the 2000 US Std Population (19 age groups - Census P25-1130) - User standard; Confidence intervals are 95% for rates. * The rate ratio indicates that the rate is significantly higher than the rate for Texas (p<0.05). Warning: Use caution when interpreting ratios and related statistics as the ratio variable contains overlapping groupings.
Created by Cancer Epidemiology and Surveillance Branch. 11/19/2009. Incidence source: 1995-2006, NPCR CSS, 11/26/2008. Mortality source: Center for Health Statistics, DSHS, created 3/31/2009.
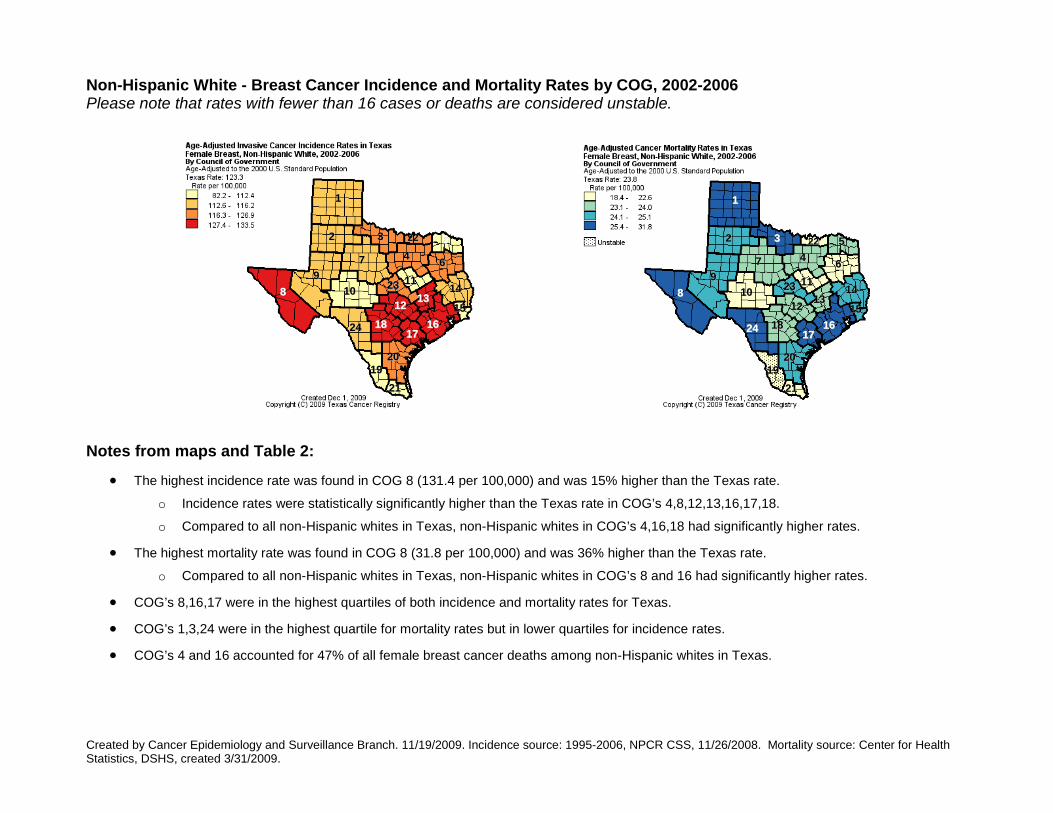
Non-Hispanic White - Breast Cancer Incidence and Mortality Rates by COG, 2002-2006 Please note that rates with fewer than 16 cases or deaths are considered unstable.
11
22 33
7799
88 1010
2424 18181212
2323
442222
1919
2121
2020
17171616
1515
14141313
111166
55
11
22 33
7799
88 1010
2424 18181212
2323
442222
1919
2121
2020
17171616
1515
14141313
111166
55
Notes from maps and Table 2:
• The highest incidence rate was found in COG 8 (131.4 per 100,000) and was 15% higher than the Texas rate.
o Incidence rates were statistically significantly higher than the Texas rate in COG’s 4,8,12,13,16,17,18.
o Compared to all non-Hispanic whites in Texas, non-Hispanic whites in COG’s 4,16,18 had significantly higher rates.
• The highest mortality rate was found in COG 8 (31.8 per 100,000) and was 36% higher than the Texas rate.
o Compared to all non-Hispanic whites in Texas, non-Hispanic whites in COG’s 8 and 16 had significantly higher rates.
• COG’s 8,16,17 were in the highest quartiles of both incidence and mortality rates for Texas.
• COG’s 1,3,24 were in the highest quartile for mortality rates but in lower quartiles for incidence rates.
• COG’s 4 and 16 accounted for 47% of all female breast cancer deaths among non-Hispanic whites in Texas.
Created by Cancer Epidemiology and Surveillance Branch. 11/19/2009. Incidence source: 1995-2006, NPCR CSS, 11/26/2008. Mortality source: Center for Health Statistics, DSHS, created 3/31/2009.
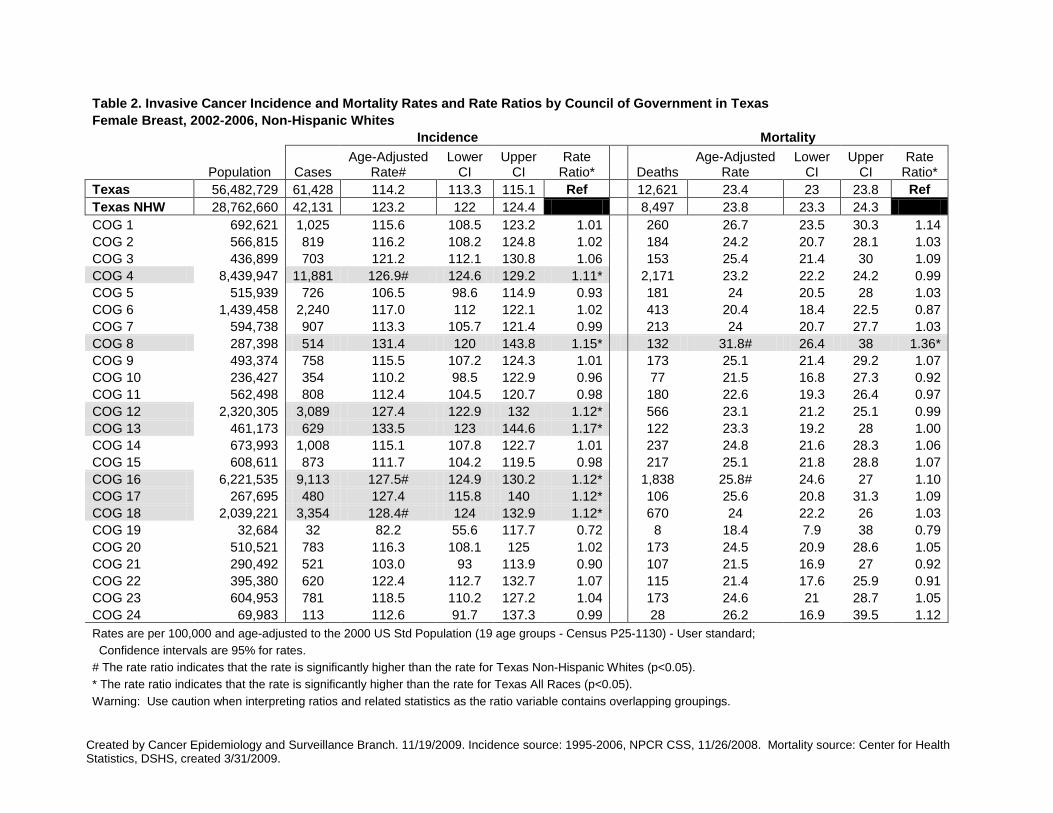
Table 2. Invasive Cancer Incidence and Mortality Rates and Rate Ratios by Council of Government in Texas Female Breast, 2002-2006, Non-Hispanic Whites Incidence Mortality
Population Cases Age-Adjusted
Rate# Lower
CI Upper
CI Rate
Ratio* Deaths Age-Adjusted
Rate Lower
CI Upper
CI Rate
Ratio* Texas 56,482,729 61,428 114.2 113.3 115.1 Ref 12,621 23.4 23 23.8 Ref Texas NHW 28,762,660 42,131 123.2 122 124.4 8,497 23.8 23.3 24.3 COG 1 692,621 1,025 115.6 108.5 123.2 1.01 260 26.7 23.5 30.3 1.14 COG 2 566,815 819 116.2 108.2 124.8 1.02 184 24.2 20.7 28.1 1.03 COG 3 436,899 703 121.2 112.1 130.8 1.06 153 25.4 21.4 30 1.09 COG 4 8,439,947 11,881 126.9# 124.6 129.2 1.11* 2,171 23.2 22.2 24.2 0.99 COG 5 515,939 726 106.5 98.6 114.9 0.93 181 24 20.5 28 1.03 COG 6 1,439,458 2,240 117.0 112 122.1 1.02 413 20.4 18.4 22.5 0.87 COG 7 594,738 907 113.3 105.7 121.4 0.99 213 24 20.7 27.7 1.03 COG 8 287,398 514 131.4 120 143.8 1.15* 132 31.8# 26.4 38 1.36* COG 9 493,374 758 115.5 107.2 124.3 1.01 173 25.1 21.4 29.2 1.07 COG 10 236,427 354 110.2 98.5 122.9 0.96 77 21.5 16.8 27.3 0.92 COG 11 562,498 808 112.4 104.5 120.7 0.98 180 22.6 19.3 26.4 0.97 COG 12 2,320,305 3,089 127.4 122.9 132 1.12* 566 23.1 21.2 25.1 0.99 COG 13 461,173 629 133.5 123 144.6 1.17* 122 23.3 19.2 28 1.00 COG 14 673,993 1,008 115.1 107.8 122.7 1.01 237 24.8 21.6 28.3 1.06 COG 15 608,611 873 111.7 104.2 119.5 0.98 217 25.1 21.8 28.8 1.07 COG 16 6,221,535 9,113 127.5# 124.9 130.2 1.12* 1,838 25.8# 24.6 27 1.10 COG 17 267,695 480 127.4 115.8 140 1.12* 106 25.6 20.8 31.3 1.09 COG 18 2,039,221 3,354 128.4# 124 132.9 1.12* 670 24 22.2 26 1.03 COG 19 32,684 32 82.2 55.6 117.7 0.72 8 18.4 7.9 38 0.79 COG 20 510,521 783 116.3 108.1 125 1.02 173 24.5 20.9 28.6 1.05 COG 21 290,492 521 103.0 93 113.9 0.90 107 21.5 16.9 27 0.92 COG 22 395,380 620 122.4 112.7 132.7 1.07 115 21.4 17.6 25.9 0.91 COG 23 604,953 781 118.5 110.2 127.2 1.04 173 24.6 21 28.7 1.05 COG 24 69,983 113 112.6 91.7 137.3 0.99 28 26.2 16.9 39.5 1.12 Rates are per 100,000 and age-adjusted to the 2000 US Std Population (19 age groups - Census P25-1130) - User standard; Confidence intervals are 95% for rates. # The rate ratio indicates that the rate is significantly higher than the rate for Texas Non-Hispanic Whites (p<0.05). * The rate ratio indicates that the rate is significantly higher than the rate for Texas All Races (p<0.05). Warning: Use caution when interpreting ratios and related statistics as the ratio variable contains overlapping groupings.
Created by Cancer Epidemiology and Surveillance Branch. 11/19/2009. Incidence source: 1995-2006, NPCR CSS, 11/26/2008. Mortality source: Center for Health Statistics, DSHS, created 3/31/2009.
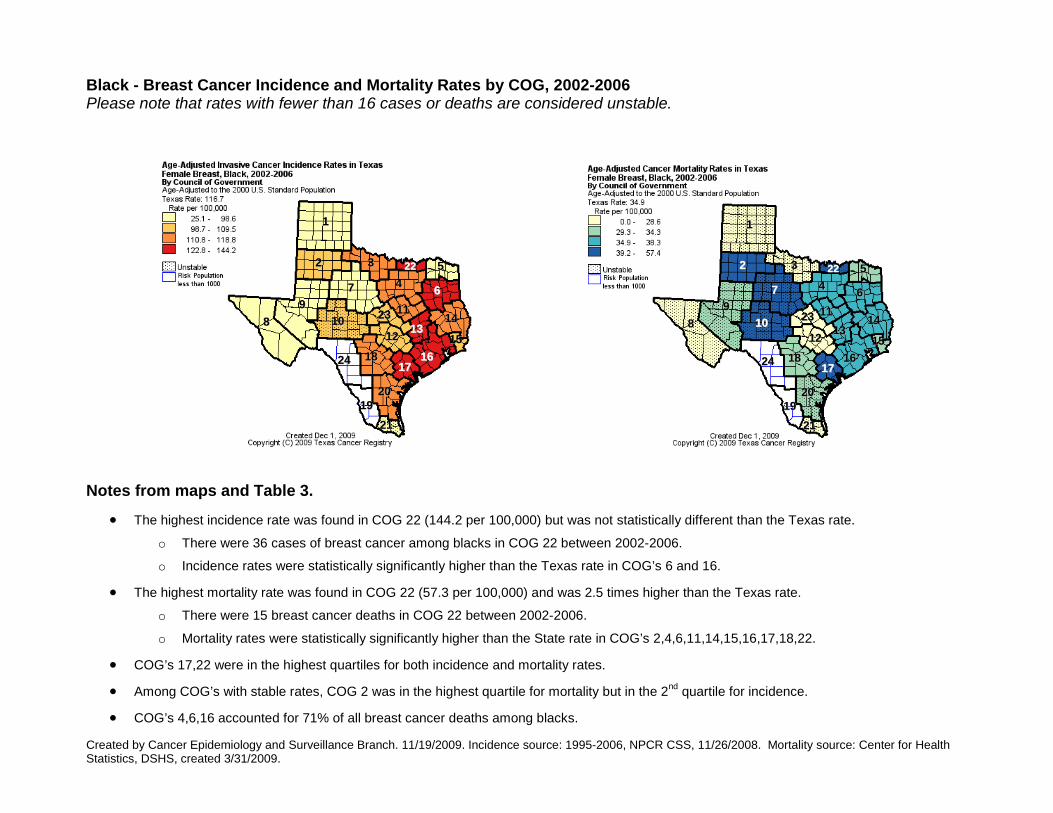
Black - Breast Cancer Incidence and Mortality Rates by COG, 2002-2006 Please note that rates with fewer than 16 cases or deaths are considered unstable.
11
22 33
7799
88 1010
2424 18181212
2323
442222
1919
2121
2020
17171616
1515
14141313
111166
55
11
22 33
7799
88 1010
2424 18181212
2323
442222
1919
2121
2020
17171616
1515
14141313
111166
55
Notes from maps and Table 3.
• The highest incidence rate was found in COG 22 (144.2 per 100,000) but was not statistically different than the Texas rate.
o There were 36 cases of breast cancer among blacks in COG 22 between 2002-2006.
o Incidence rates were statistically significantly higher than the Texas rate in COG’s 6 and 16.
• The highest mortality rate was found in COG 22 (57.3 per 100,000) and was 2.5 times higher than the Texas rate.
o There were 15 breast cancer deaths in COG 22 between 2002-2006.
o Mortality rates were statistically significantly higher than the State rate in COG’s 2,4,6,11,14,15,16,17,18,22.
• COG’s 17,22 were in the highest quartiles for both incidence and mortality rates.
• Among COG’s with stable rates, COG 2 was in the highest quartile for mortality but in the 2nd quartile for incidence.
• COG’s 4,6,16 accounted for 71% of all breast cancer deaths among blacks.
Created by Cancer Epidemiology and Surveillance Branch. 11/19/2009. Incidence source: 1995-2006, NPCR CSS, 11/26/2008. Mortality source: Center for Health Statistics, DSHS, created 3/31/2009.
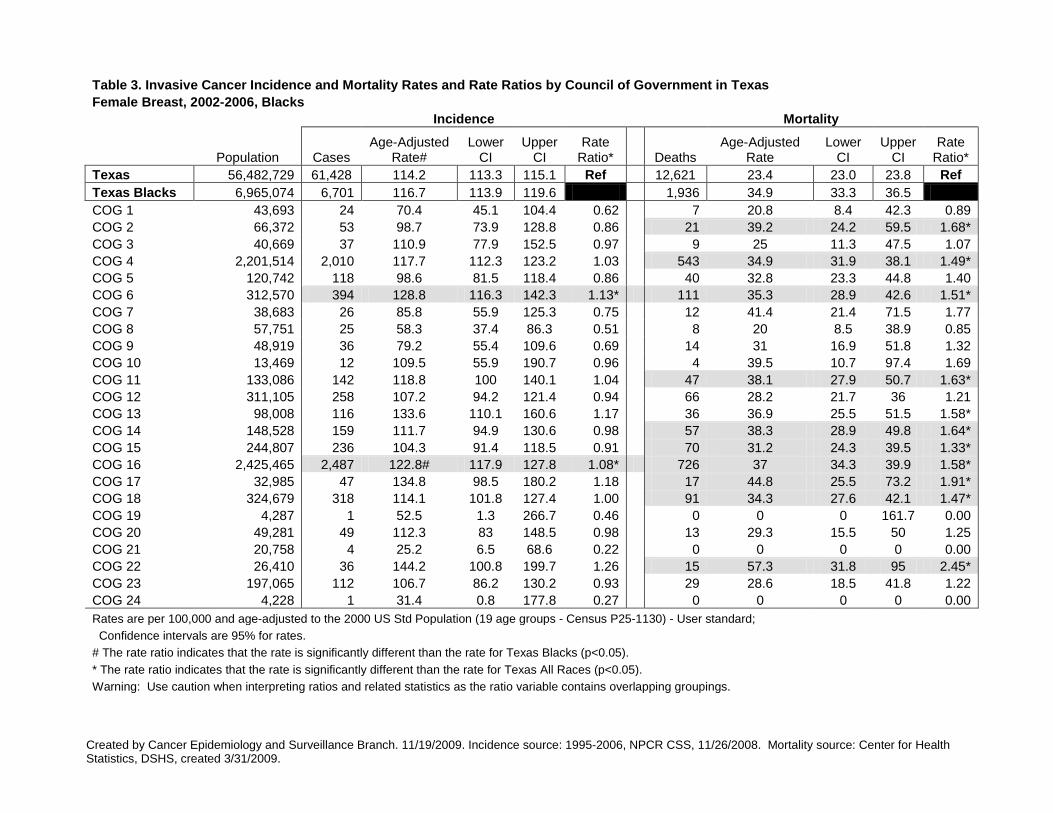
Table 3. Invasive Cancer Incidence and Mortality Rates and Rate Ratios by Council of Government in Texas Female Breast, 2002-2006, Blacks Incidence Mortality
Population Cases Age-Adjusted
Rate# Lower
CI Upper
CI Rate
Ratio* Deaths Age-Adjusted
Rate Lower
CI Upper
CI Rate
Ratio* Texas 56,482,729 61,428 114.2 113.3 115.1 Ref 12,621 23.4 23.0 23.8 Ref Texas Blacks 6,965,074 6,701 116.7 113.9 119.6 1,936 34.9 33.3 36.5 COG 1 43,693 24 70.4 45.1 104.4 0.62 7 20.8 8.4 42.3 0.89 COG 2 66,372 53 98.7 73.9 128.8 0.86 21 39.2 24.2 59.5 1.68* COG 3 40,669 37 110.9 77.9 152.5 0.97 9 25 11.3 47.5 1.07 COG 4 2,201,514 2,010 117.7 112.3 123.2 1.03 543 34.9 31.9 38.1 1.49* COG 5 120,742 118 98.6 81.5 118.4 0.86 40 32.8 23.3 44.8 1.40 COG 6 312,570 394 128.8 116.3 142.3 1.13* 111 35.3 28.9 42.6 1.51* COG 7 38,683 26 85.8 55.9 125.3 0.75 12 41.4 21.4 71.5 1.77 COG 8 57,751 25 58.3 37.4 86.3 0.51 8 20 8.5 38.9 0.85 COG 9 48,919 36 79.2 55.4 109.6 0.69 14 31 16.9 51.8 1.32 COG 10 13,469 12 109.5 55.9 190.7 0.96 4 39.5 10.7 97.4 1.69 COG 11 133,086 142 118.8 100 140.1 1.04 47 38.1 27.9 50.7 1.63* COG 12 311,105 258 107.2 94.2 121.4 0.94 66 28.2 21.7 36 1.21 COG 13 98,008 116 133.6 110.1 160.6 1.17 36 36.9 25.5 51.5 1.58* COG 14 148,528 159 111.7 94.9 130.6 0.98 57 38.3 28.9 49.8 1.64* COG 15 244,807 236 104.3 91.4 118.5 0.91 70 31.2 24.3 39.5 1.33* COG 16 2,425,465 2,487 122.8# 117.9 127.8 1.08* 726 37 34.3 39.9 1.58* COG 17 32,985 47 134.8 98.5 180.2 1.18 17 44.8 25.5 73.2 1.91* COG 18 324,679 318 114.1 101.8 127.4 1.00 91 34.3 27.6 42.1 1.47* COG 19 4,287 1 52.5 1.3 266.7 0.46 0 0 0 161.7 0.00 COG 20 49,281 49 112.3 83 148.5 0.98 13 29.3 15.5 50 1.25 COG 21 20,758 4 25.2 6.5 68.6 0.22 0 0 0 0 0.00 COG 22 26,410 36 144.2 100.8 199.7 1.26 15 57.3 31.8 95 2.45* COG 23 197,065 112 106.7 86.2 130.2 0.93 29 28.6 18.5 41.8 1.22 COG 24 4,228 1 31.4 0.8 177.8 0.27 0 0 0 0 0.00 Rates are per 100,000 and age-adjusted to the 2000 US Std Population (19 age groups - Census P25-1130) - User standard; Confidence intervals are 95% for rates. # The rate ratio indicates that the rate is significantly different than the rate for Texas Blacks (p<0.05). * The rate ratio indicates that the rate is significantly different than the rate for Texas All Races (p<0.05). Warning: Use caution when interpreting ratios and related statistics as the ratio variable contains overlapping groupings.
Created by Cancer Epidemiology and Surveillance Branch. 11/19/2009. Incidence source: 1995-2006, NPCR CSS, 11/26/2008. Mortality source: Center for Health Statistics, DSHS, created 3/31/2009.
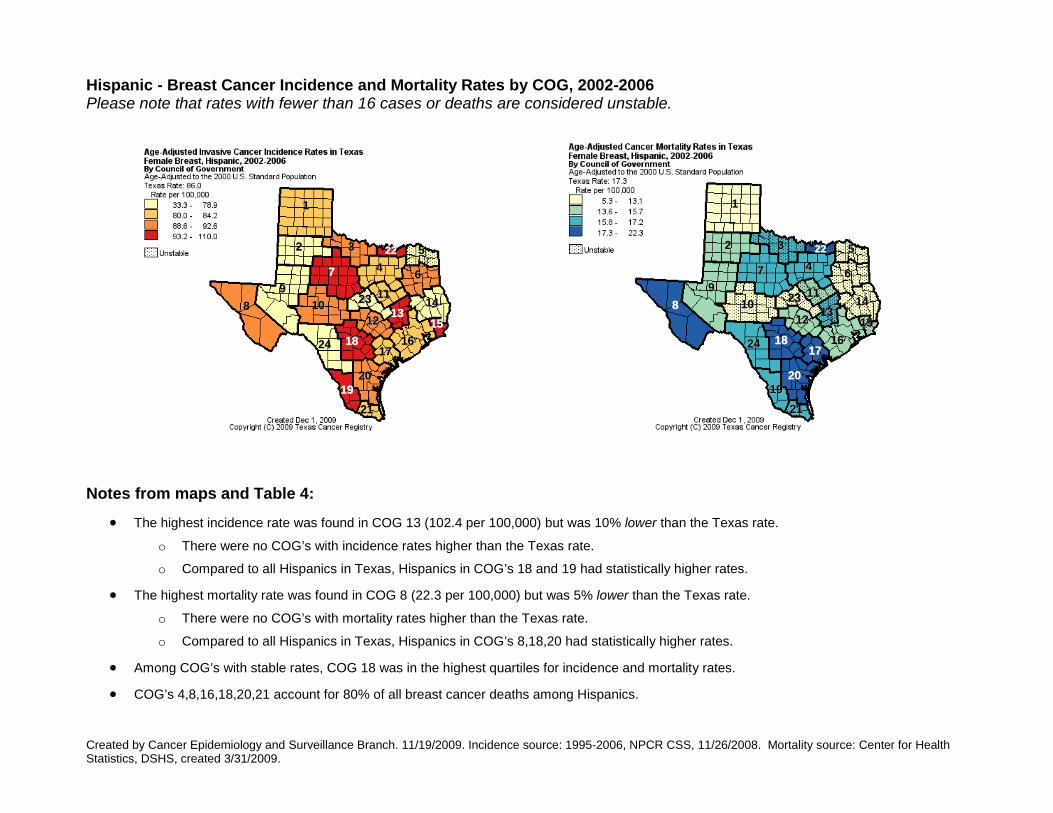
Hispanic - Breast Cancer Incidence and Mortality Rates by COG, 2002-2006 Please note that rates with fewer than 16 cases or deaths are considered unstable.
11
22 33
7799
88 1010
2424 18181212
2323
442222
1919
2121
2020
17171616
1515
14141313
111166
55
11
22 33
7799
88 1010
2424 18181212
2323
442222
1919
2121
2020
17171616
1515
14141313
111166
55
Notes from maps and Table 4:
• The highest incidence rate was found in COG 13 (102.4 per 100,000) but was 10% lower than the Texas rate.
o There were no COG’s with incidence rates higher than the Texas rate.
o Compared to all Hispanics in Texas, Hispanics in COG’s 18 and 19 had statistically higher rates.
• The highest mortality rate was found in COG 8 (22.3 per 100,000) but was 5% lower than the Texas rate.
o There were no COG’s with mortality rates higher than the Texas rate.
o Compared to all Hispanics in Texas, Hispanics in COG’s 8,18,20 had statistically higher rates.
• Among COG’s with stable rates, COG 18 was in the highest quartiles for incidence and mortality rates.
• COG’s 4,8,16,18,20,21 account for 80% of all breast cancer deaths among Hispanics.
Created by Cancer Epidemiology and Surveillance Branch. 11/19/2009. Incidence source: 1995-2006, NPCR CSS, 11/26/2008. Mortality source: Center for Health Statistics, DSHS, created 3/31/2009.
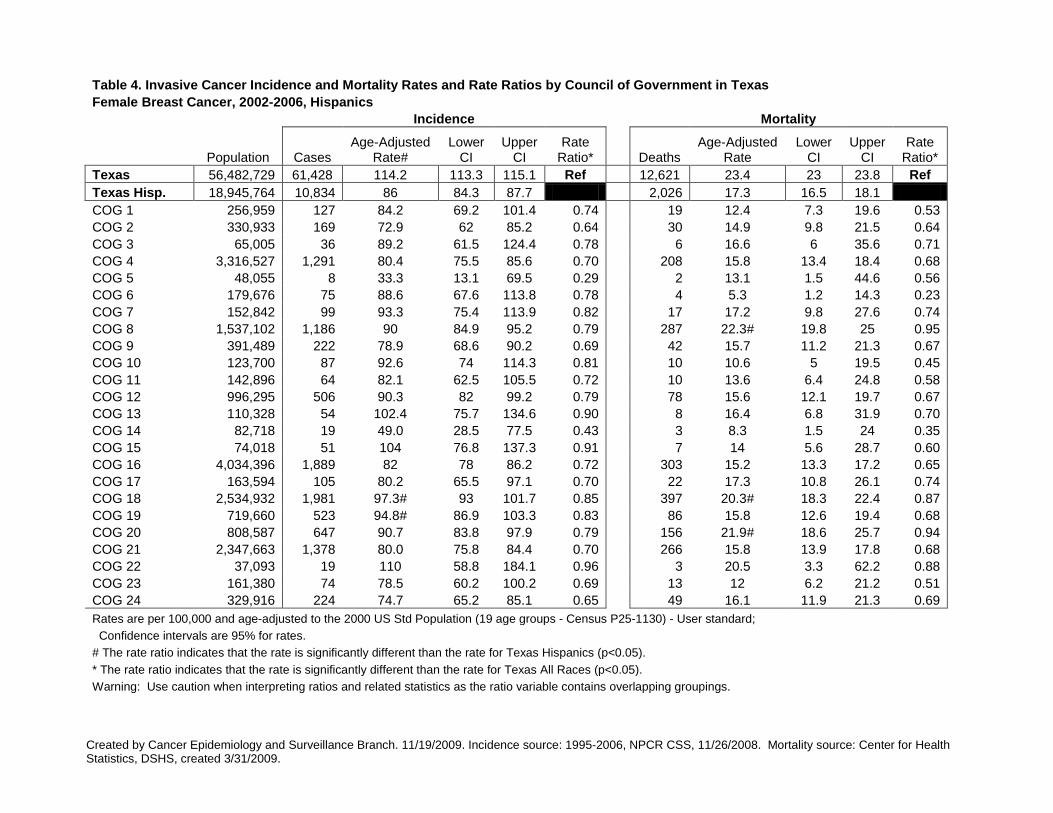
Table 4. Invasive Cancer Incidence and Mortality Rates and Rate Ratios by Council of Government in Texas Female Breast Cancer, 2002-2006, Hispanics Incidence Mortality
Population Cases Age-Adjusted
Rate# Lower
CI Upper
CI Rate
Ratio* Deaths Age-Adjusted
Rate Lower
CI Upper
CI Rate
Ratio* Texas 56,482,729 61,428 114.2 113.3 115.1 Ref 12,621 23.4 23 23.8 Ref Texas Hisp. 18,945,764 10,834 86 84.3 87.7 2,026 17.3 16.5 18.1 COG 1 256,959 127 84.2 69.2 101.4 0.74 19 12.4 7.3 19.6 0.53 COG 2 330,933 169 72.9 62 85.2 0.64 30 14.9 9.8 21.5 0.64 COG 3 65,005 36 89.2 61.5 124.4 0.78 6 16.6 6 35.6 0.71 COG 4 3,316,527 1,291 80.4 75.5 85.6 0.70 208 15.8 13.4 18.4 0.68 COG 5 48,055 8 33.3 13.1 69.5 0.29 2 13.1 1.5 44.6 0.56 COG 6 179,676 75 88.6 67.6 113.8 0.78 4 5.3 1.2 14.3 0.23 COG 7 152,842 99 93.3 75.4 113.9 0.82 17 17.2 9.8 27.6 0.74 COG 8 1,537,102 1,186 90 84.9 95.2 0.79 287 22.3# 19.8 25 0.95 COG 9 391,489 222 78.9 68.6 90.2 0.69 42 15.7 11.2 21.3 0.67 COG 10 123,700 87 92.6 74 114.3 0.81 10 10.6 5 19.5 0.45 COG 11 142,896 64 82.1 62.5 105.5 0.72 10 13.6 6.4 24.8 0.58 COG 12 996,295 506 90.3 82 99.2 0.79 78 15.6 12.1 19.7 0.67 COG 13 110,328 54 102.4 75.7 134.6 0.90 8 16.4 6.8 31.9 0.70 COG 14 82,718 19 49.0 28.5 77.5 0.43 3 8.3 1.5 24 0.35 COG 15 74,018 51 104 76.8 137.3 0.91 7 14 5.6 28.7 0.60 COG 16 4,034,396 1,889 82 78 86.2 0.72 303 15.2 13.3 17.2 0.65 COG 17 163,594 105 80.2 65.5 97.1 0.70 22 17.3 10.8 26.1 0.74 COG 18 2,534,932 1,981 97.3# 93 101.7 0.85 397 20.3# 18.3 22.4 0.87 COG 19 719,660 523 94.8# 86.9 103.3 0.83 86 15.8 12.6 19.4 0.68 COG 20 808,587 647 90.7 83.8 97.9 0.79 156 21.9# 18.6 25.7 0.94 COG 21 2,347,663 1,378 80.0 75.8 84.4 0.70 266 15.8 13.9 17.8 0.68 COG 22 37,093 19 110 58.8 184.1 0.96 3 20.5 3.3 62.2 0.88 COG 23 161,380 74 78.5 60.2 100.2 0.69 13 12 6.2 21.2 0.51 COG 24 329,916 224 74.7 65.2 85.1 0.65 49 16.1 11.9 21.3 0.69 Rates are per 100,000 and age-adjusted to the 2000 US Std Population (19 age groups - Census P25-1130) - User standard; Confidence intervals are 95% for rates. # The rate ratio indicates that the rate is significantly different than the rate for Texas Hispanics (p<0.05). * The rate ratio indicates that the rate is significantly different than the rate for Texas All Races (p<0.05). Warning: Use caution when interpreting ratios and related statistics as the ratio variable contains overlapping groupings.
Created by Cancer Epidemiology and Surveillance Branch. 11/19/2009. Incidence source: 1995-2006, NPCR CSS, 11/26/2008. Mortality source: Center for Health Statistics, DSHS, created 3/31/2009.
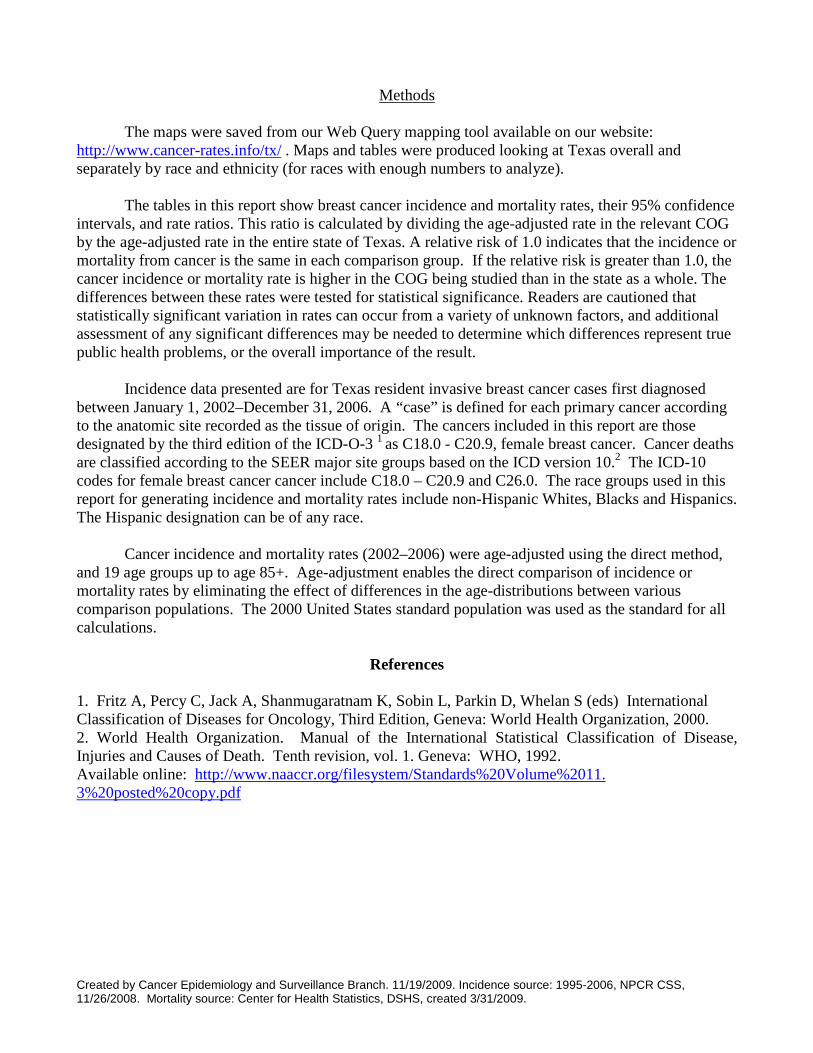
Methods
The maps were saved from our Web Query mapping tool available on our website: http://www.cancer-rates.info/tx/ . Maps and tables were produced looking at Texas overall and separately by race and ethnicity (for races with enough numbers to analyze).
The tables in this report show breast cancer incidence and mortality rates, their 95% confidence intervals, and rate ratios. This ratio is calculated by dividing the age-adjusted rate in the relevant COG by the age-adjusted rate in the entire state of Texas. A relative risk of 1.0 indicates that the incidence or mortality from cancer is the same in each comparison group. If the relative risk is greater than 1.0, the cancer incidence or mortality rate is higher in the COG being studied than in the state as a whole. The differences between these rates were tested for statistical significance. Readers are cautioned that statistically significant variation in rates can occur from a variety of unknown factors, and additional assessment of any significant differences may be needed to determine which differences represent true public health problems, or the overall importance of the result.
Incidence data presented are for Texas resident invasive breast cancer cases first diagnosed between January 1, 2002–December 31, 2006. A “case” is defined for each primary cancer according to the anatomic site recorded as the tissue of origin. The cancers included in this report are those designated by the third edition of the ICD-O-3 1 as C18.0 - C20.9, female breast cancer. Cancer deaths are classified according to the SEER major site groups based on the ICD version 10.2 The ICD-10 codes for female breast cancer cancer include C18.0 – C20.9 and C26.0. The race groups used in this report for generating incidence and mortality rates include non-Hispanic Whites, Blacks and Hispanics. The Hispanic designation can be of any race. Cancer incidence and mortality rates (2002–2006) were age-adjusted using the direct method, and 19 age groups up to age 85+. Age-adjustment enables the direct comparison of incidence or mortality rates by eliminating the effect of differences in the age-distributions between various comparison populations. The 2000 United States standard population was used as the standard for all calculations.
References
1. Fritz A, Percy C, Jack A, Shanmugaratnam K, Sobin L, Parkin D, Whelan S (eds) International Classification of Diseases for Oncology, Third Edition, Geneva: World Health Organization, 2000. 2. World Health Organization. Manual of the International Statistical Classification of Disease, Injuries and Causes of Death. Tenth revision, vol. 1. Geneva: WHO, 1992. Available online: http://www.naaccr.org/filesystem/Standards%20Volume%2011. 3%20posted%20copy.pdf
Created by Cancer Epidemiology and Surveillance Branch. 11/19/2009. Incidence source: 1995-2006, NPCR CSS, 11/26/2008. Mortality source: Center for Health Statistics, DSHS, created 3/31/2009.
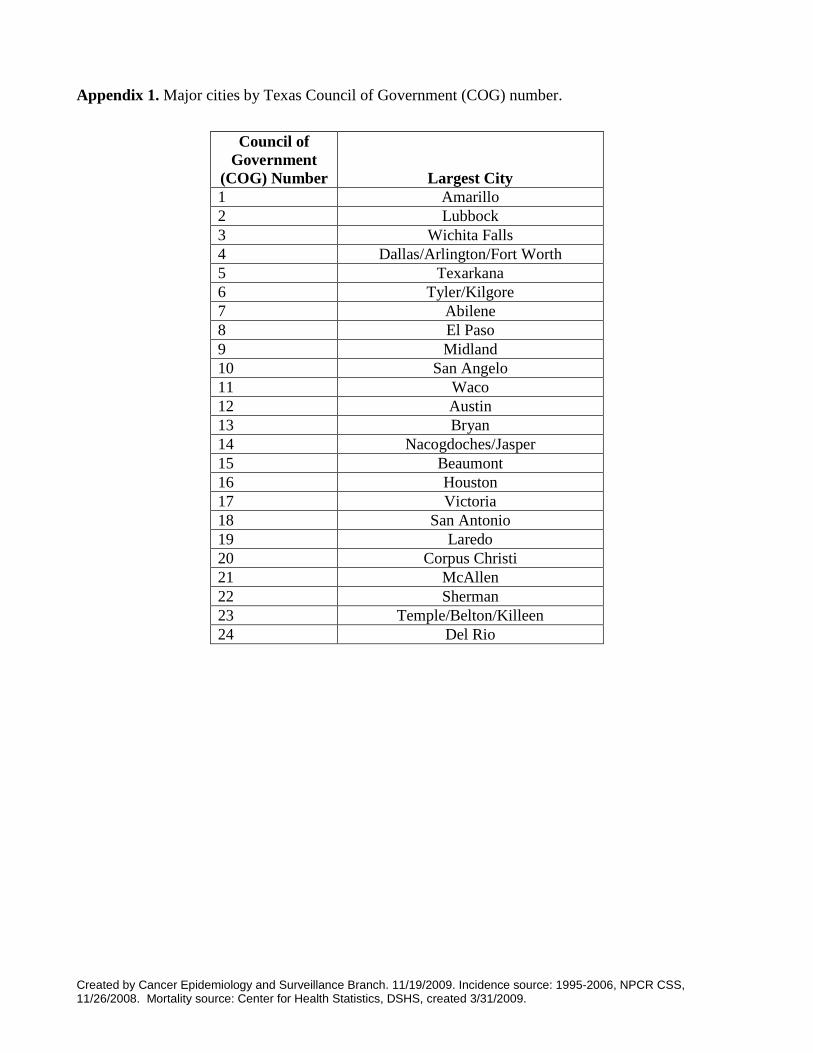
Appendix 1. Major cities by Texas Council of Government (COG) number.
Council of Government
(COG) Number Largest City 1 Amarillo 2 Lubbock 3 Wichita Falls 4 Dallas/Arlington/Fort Worth 5 Texarkana 6 Tyler/Kilgore 7 Abilene 8 El Paso 9 Midland 10 San Angelo 11 Waco 12 Austin 13 Bryan 14 Nacogdoches/Jasper 15 Beaumont 16 Houston 17 Victoria 18 San Antonio 19 Laredo 20 Corpus Christi 21 McAllen 22 Sherman 23 Temple/Belton/Killeen 24 Del Rio
Created by Cancer Epidemiology and Surveillance Branch. 11/19/2009. Incidence source: 1995-2006, NPCR CSS, 11/26/2008. Mortality source: Center for Health Statistics, DSHS, created 3/31/2009.
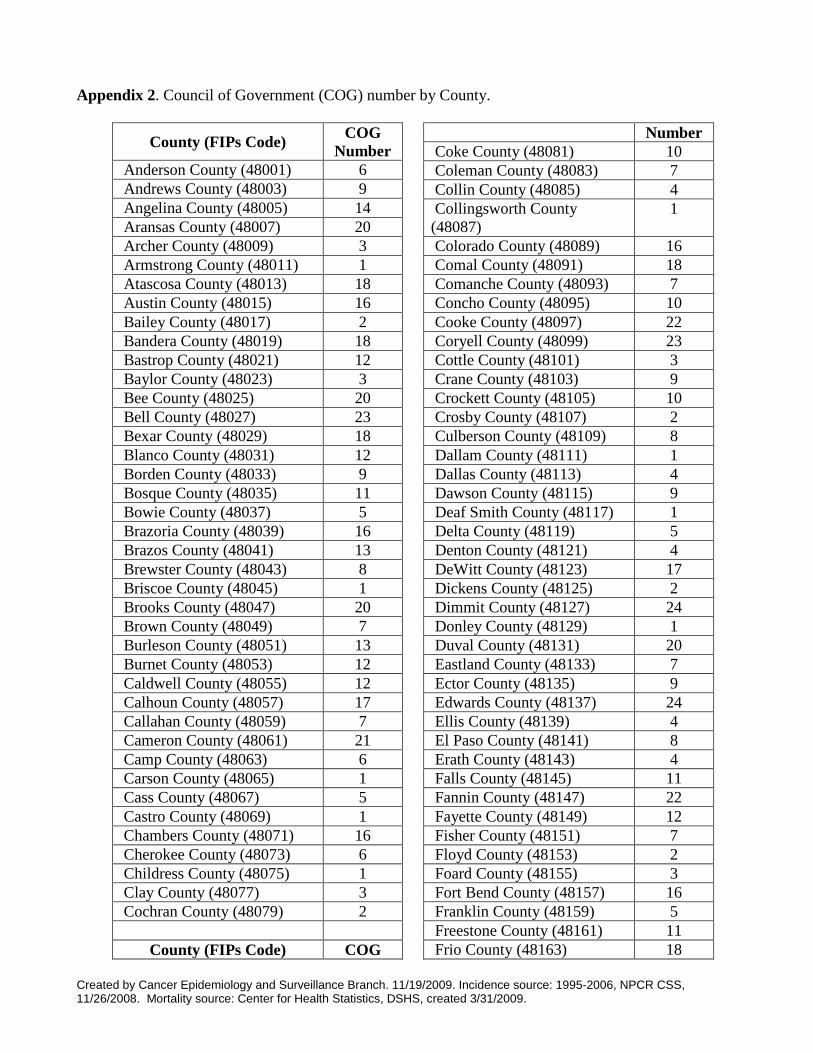
Appendix 2. Council of Government (COG) number by County.
County (FIPs Code) COG Number
Anderson County (48001) 6 Andrews County (48003) 9 Angelina County (48005) 14 Aransas County (48007) 20 Archer County (48009) 3 Armstrong County (48011) 1 Atascosa County (48013) 18 Austin County (48015) 16 Bailey County (48017) 2 Bandera County (48019) 18 Bastrop County (48021) 12 Baylor County (48023) 3 Bee County (48025) 20 Bell County (48027) 23 Bexar County (48029) 18 Blanco County (48031) 12 Borden County (48033) 9 Bosque County (48035) 11 Bowie County (48037) 5 Brazoria County (48039) 16 Brazos County (48041) 13 Brewster County (48043) 8 Briscoe County (48045) 1 Brooks County (48047) 20 Brown County (48049) 7 Burleson County (48051) 13 Burnet County (48053) 12 Caldwell County (48055) 12 Calhoun County (48057) 17 Callahan County (48059) 7 Cameron County (48061) 21 Camp County (48063) 6 Carson County (48065) 1 Cass County (48067) 5 Castro County (48069) 1 Chambers County (48071) 16 Cherokee County (48073) 6 Childress County (48075) 1 Clay County (48077) 3 Cochran County (48079) 2
County (FIPs Code) COG
Number Coke County (48081) 10 Coleman County (48083) 7 Collin County (48085) 4 Collingsworth County (48087)
1
Colorado County (48089) 16 Comal County (48091) 18 Comanche County (48093) 7 Concho County (48095) 10 Cooke County (48097) 22 Coryell County (48099) 23 Cottle County (48101) 3 Crane County (48103) 9 Crockett County (48105) 10 Crosby County (48107) 2 Culberson County (48109) 8 Dallam County (48111) 1 Dallas County (48113) 4 Dawson County (48115) 9 Deaf Smith County (48117) 1 Delta County (48119) 5 Denton County (48121) 4 DeWitt County (48123) 17 Dickens County (48125) 2 Dimmit County (48127) 24 Donley County (48129) 1 Duval County (48131) 20 Eastland County (48133) 7 Ector County (48135) 9 Edwards County (48137) 24 Ellis County (48139) 4 El Paso County (48141) 8 Erath County (48143) 4 Falls County (48145) 11 Fannin County (48147) 22 Fayette County (48149) 12 Fisher County (48151) 7 Floyd County (48153) 2 Foard County (48155) 3 Fort Bend County (48157) 16 Franklin County (48159) 5 Freestone County (48161) 11 Frio County (48163) 18
Created by Cancer Epidemiology and Surveillance Branch. 11/19/2009. Incidence source: 1995-2006, NPCR CSS, 11/26/2008. Mortality source: Center for Health Statistics, DSHS, created 3/31/2009.
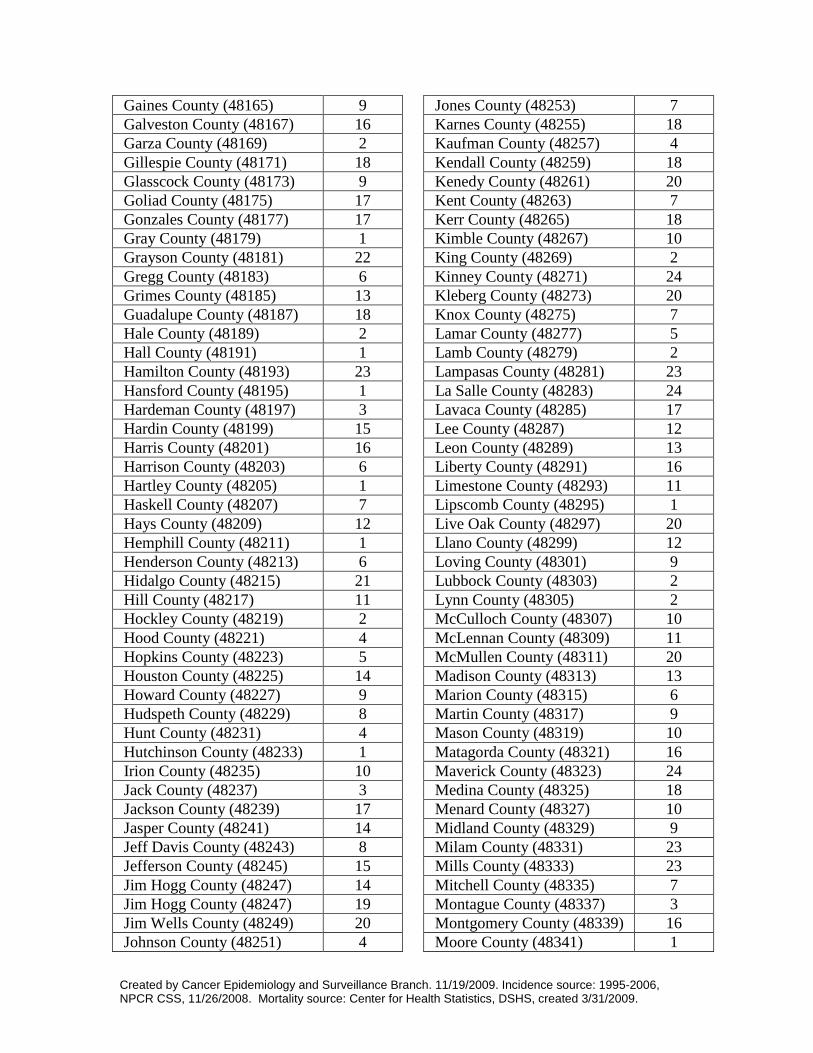
Gaines County (48165) 9 Galveston County (48167) 16 Garza County (48169) 2 Gillespie County (48171) 18 Glasscock County (48173) 9 Goliad County (48175) 17 Gonzales County (48177) 17 Gray County (48179) 1 Grayson County (48181) 22 Gregg County (48183) 6 Grimes County (48185) 13 Guadalupe County (48187) 18 Hale County (48189) 2 Hall County (48191) 1 Hamilton County (48193) 23 Hansford County (48195) 1 Hardeman County (48197) 3 Hardin County (48199) 15 Harris County (48201) 16 Harrison County (48203) 6 Hartley County (48205) 1 Haskell County (48207) 7 Hays County (48209) 12 Hemphill County (48211) 1 Henderson County (48213) 6 Hidalgo County (48215) 21 Hill County (48217) 11 Hockley County (48219) 2 Hood County (48221) 4 Hopkins County (48223) 5 Houston County (48225) 14 Howard County (48227) 9 Hudspeth County (48229) 8 Hunt County (48231) 4 Hutchinson County (48233) 1 Irion County (48235) 10 Jack County (48237) 3 Jackson County (48239) 17 Jasper County (48241) 14 Jeff Davis County (48243) 8 Jefferson County (48245) 15 Jim Hogg County (48247) 14 Jim Hogg County (48247) 19 Jim Wells County (48249) 20 Johnson County (48251) 4
Jones County (48253) 7 Karnes County (48255) 18 Kaufman County (48257) 4 Kendall County (48259) 18 Kenedy County (48261) 20 Kent County (48263) 7 Kerr County (48265) 18 Kimble County (48267) 10 King County (48269) 2 Kinney County (48271) 24 Kleberg County (48273) 20 Knox County (48275) 7 Lamar County (48277) 5 Lamb County (48279) 2 Lampasas County (48281) 23 La Salle County (48283) 24 Lavaca County (48285) 17 Lee County (48287) 12 Leon County (48289) 13 Liberty County (48291) 16 Limestone County (48293) 11 Lipscomb County (48295) 1 Live Oak County (48297) 20 Llano County (48299) 12 Loving County (48301) 9 Lubbock County (48303) 2 Lynn County (48305) 2 McCulloch County (48307) 10 McLennan County (48309) 11 McMullen County (48311) 20 Madison County (48313) 13 Marion County (48315) 6 Martin County (48317) 9 Mason County (48319) 10 Matagorda County (48321) 16 Maverick County (48323) 24 Medina County (48325) 18 Menard County (48327) 10 Midland County (48329) 9 Milam County (48331) 23 Mills County (48333) 23 Mitchell County (48335) 7 Montague County (48337) 3 Montgomery County (48339) 16 Moore County (48341) 1
Created by Cancer Epidemiology and Surveillance Branch. 11/19/2009. Incidence source: 1995-2006, NPCR CSS, 11/26/2008. Mortality source: Center for Health Statistics, DSHS, created 3/31/2009.
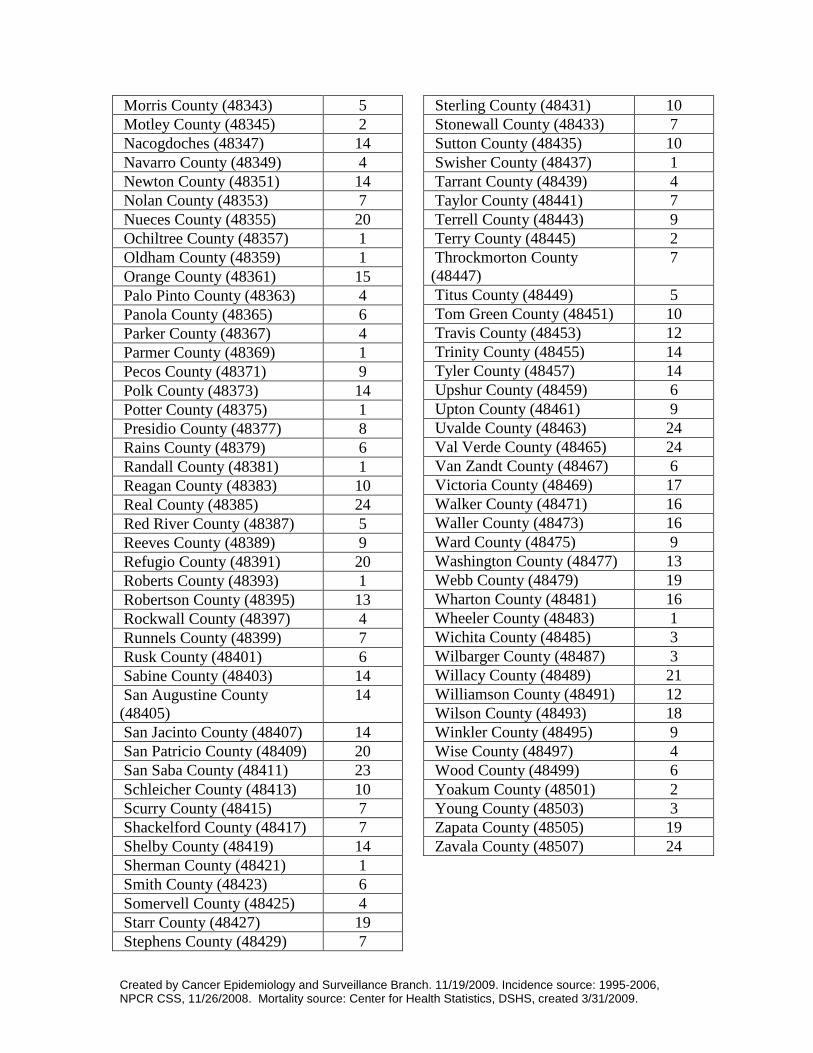
Morris County (48343) 5 Motley County (48345) 2 Nacogdoches (48347) 14 Navarro County (48349) 4 Newton County (48351) 14 Nolan County (48353) 7 Nueces County (48355) 20 Ochiltree County (48357) 1 Oldham County (48359) 1 Orange County (48361) 15 Palo Pinto County (48363) 4 Panola County (48365) 6 Parker County (48367) 4 Parmer County (48369) 1 Pecos County (48371) 9 Polk County (48373) 14 Potter County (48375) 1 Presidio County (48377) 8 Rains County (48379) 6 Randall County (48381) 1 Reagan County (48383) 10 Real County (48385) 24 Red River County (48387) 5 Reeves County (48389) 9 Refugio County (48391) 20 Roberts County (48393) 1 Robertson County (48395) 13 Rockwall County (48397) 4 Runnels County (48399) 7 Rusk County (48401) 6 Sabine County (48403) 14 San Augustine County (48405)
14
San Jacinto County (48407) 14 San Patricio County (48409) 20 San Saba County (48411) 23 Schleicher County (48413) 10 Scurry County (48415) 7 Shackelford County (48417) 7 Shelby County (48419) 14 Sherman County (48421) 1 Smith County (48423) 6 Somervell County (48425) 4 Starr County (48427) 19 Stephens County (48429) 7
Sterling County (48431) 10 Stonewall County (48433) 7 Sutton County (48435) 10 Swisher County (48437) 1 Tarrant County (48439) 4 Taylor County (48441) 7 Terrell County (48443) 9 Terry County (48445) 2 Throckmorton County (48447)
7
Titus County (48449) 5 Tom Green County (48451) 10 Travis County (48453) 12 Trinity County (48455) 14 Tyler County (48457) 14 Upshur County (48459) 6 Upton County (48461) 9 Uvalde County (48463) 24 Val Verde County (48465) 24 Van Zandt County (48467) 6 Victoria County (48469) 17 Walker County (48471) 16 Waller County (48473) 16 Ward County (48475) 9 Washington County (48477) 13 Webb County (48479) 19 Wharton County (48481) 16 Wheeler County (48483) 1 Wichita County (48485) 3 Wilbarger County (48487) 3 Willacy County (48489) 21 Williamson County (48491) 12 Wilson County (48493) 18 Winkler County (48495) 9 Wise County (48497) 4 Wood County (48499) 6 Yoakum County (48501) 2 Young County (48503) 3 Zapata County (48505) 19 Zavala County (48507) 24
Created by Cancer Epidemiology and Surveillance Branch. 11/19/2009. Incidence source: 1995-2006, NPCR CSS, 11/26/2008. Mortality source: Center for Health Statistics, DSHS, created 3/31/2009.
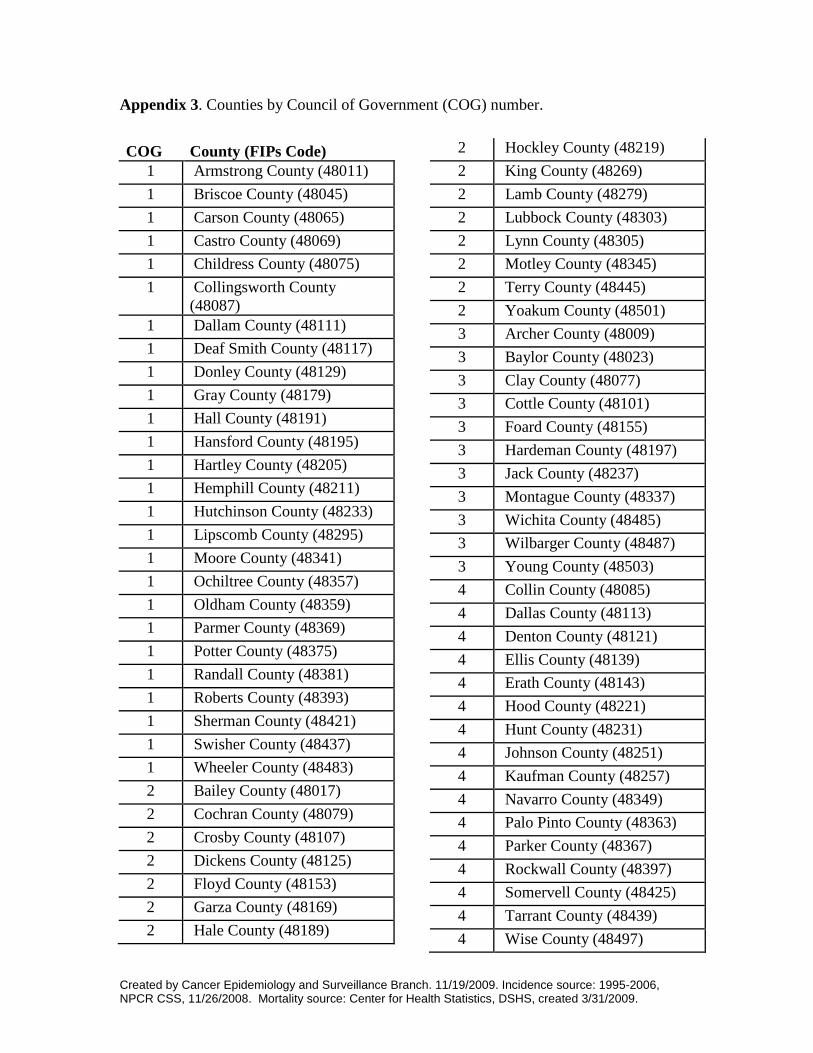
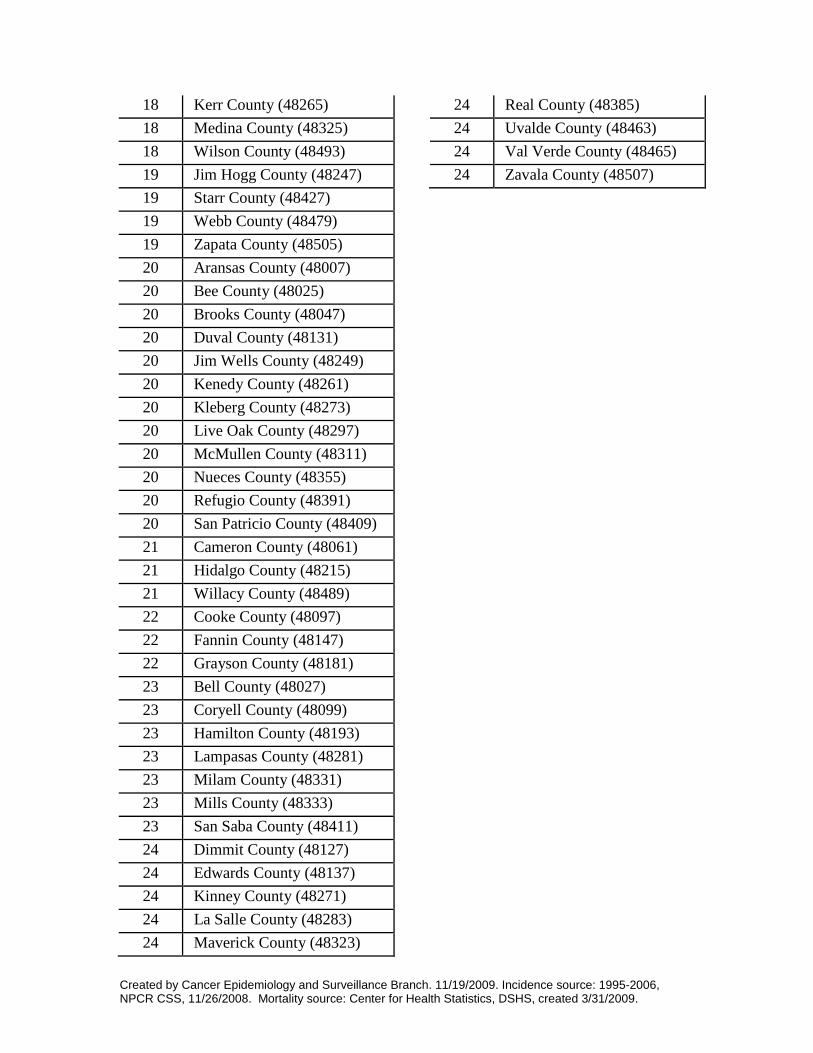
Appendix 3. Counties by Council of Government (COG) number. COG County (FIPs Code)
1 Armstrong County (48011) 1 Briscoe County (48045) 1 Carson County (48065) 1 Castro County (48069) 1 Childress County (48075) 1 Collingsworth County
(48087) 1 Dallam County (48111) 1 Deaf Smith County (48117) 1 Donley County (48129) 1 Gray County (48179) 1 Hall County (48191) 1 Hansford County (48195) 1 Hartley County (48205) 1 Hemphill County (48211) 1 Hutchinson County (48233) 1 Lipscomb County (48295) 1 Moore County (48341) 1 Ochiltree County (48357) 1 Oldham County (48359) 1 Parmer County (48369) 1 Potter County (48375) 1 Randall County (48381) 1 Roberts County (48393) 1 Sherman County (48421) 1 Swisher County (48437) 1 Wheeler County (48483) 2 Bailey County (48017) 2 Cochran County (48079) 2 Crosby County (48107) 2 Dickens County (48125) 2 Floyd County (48153) 2 Garza County (48169) 2 Hale County (48189)
2 Hockley County (48219) 2 King County (48269) 2 Lamb County (48279) 2 Lubbock County (48303) 2 Lynn County (48305) 2 Motley County (48345) 2 Terry County (48445) 2 Yoakum County (48501) 3 Archer County (48009) 3 Baylor County (48023) 3 Clay County (48077) 3 Cottle County (48101) 3 Foard County (48155) 3 Hardeman County (48197) 3 Jack County (48237) 3 Montague County (48337) 3 Wichita County (48485) 3 Wilbarger County (48487) 3 Young County (48503) 4 Collin County (48085) 4 Dallas County (48113) 4 Denton County (48121) 4 Ellis County (48139) 4 Erath County (48143) 4 Hood County (48221) 4 Hunt County (48231) 4 Johnson County (48251) 4 Kaufman County (48257) 4 Navarro County (48349) 4 Palo Pinto County (48363) 4 Parker County (48367) 4 Rockwall County (48397) 4 Somervell County (48425) 4 Tarrant County (48439) 4 Wise County (48497)
Created by Cancer Epidemiology and Surveillance Branch. 11/19/2009. Incidence source: 1995-2006, NPCR CSS, 11/26/2008. Mortality source: Center for Health Statistics, DSHS, created 3/31/2009.
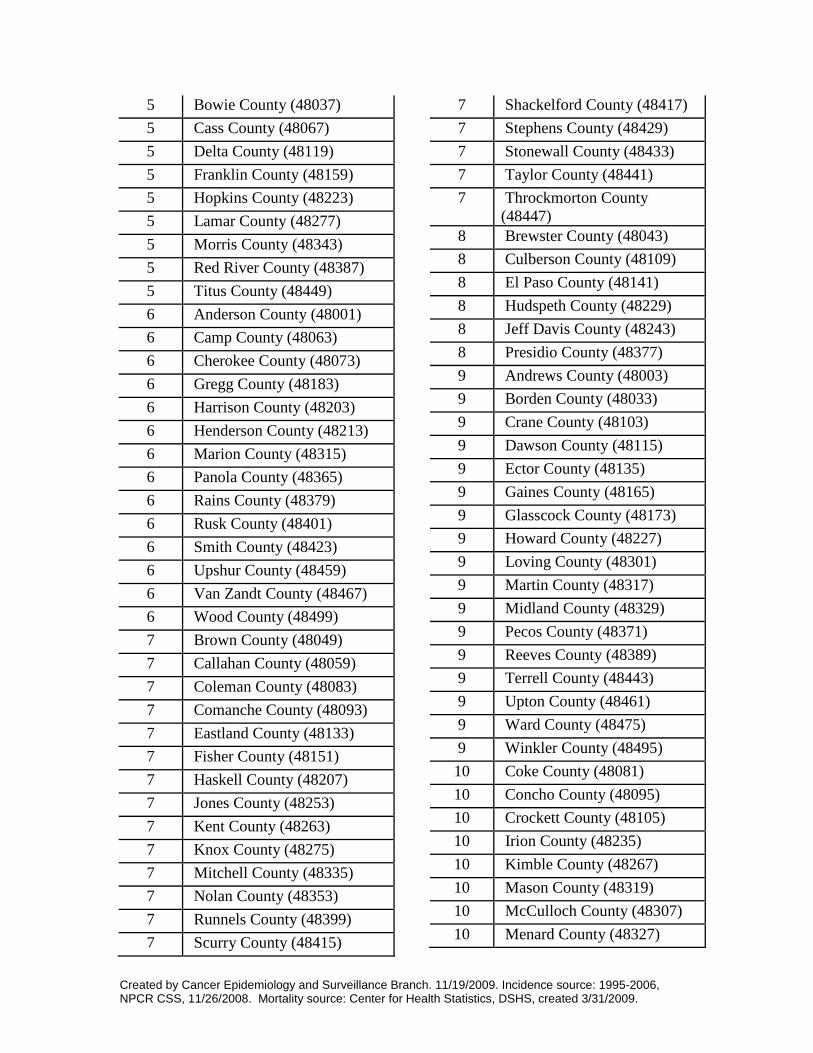
5 Bowie County (48037) 5 Cass County (48067) 5 Delta County (48119) 5 Franklin County (48159) 5 Hopkins County (48223) 5 Lamar County (48277) 5 Morris County (48343) 5 Red River County (48387) 5 Titus County (48449) 6 Anderson County (48001) 6 Camp County (48063) 6 Cherokee County (48073) 6 Gregg County (48183) 6 Harrison County (48203) 6 Henderson County (48213) 6 Marion County (48315) 6 Panola County (48365) 6 Rains County (48379) 6 Rusk County (48401) 6 Smith County (48423) 6 Upshur County (48459) 6 Van Zandt County (48467) 6 Wood County (48499) 7 Brown County (48049) 7 Callahan County (48059) 7 Coleman County (48083) 7 Comanche County (48093) 7 Eastland County (48133) 7 Fisher County (48151) 7 Haskell County (48207) 7 Jones County (48253) 7 Kent County (48263) 7 Knox County (48275) 7 Mitchell County (48335) 7 Nolan County (48353) 7 Runnels County (48399) 7 Scurry County (48415)
7 Shackelford County (48417) 7 Stephens County (48429) 7 Stonewall County (48433) 7 Taylor County (48441) 7 Throckmorton County
(48447) 8 Brewster County (48043) 8 Culberson County (48109) 8 El Paso County (48141) 8 Hudspeth County (48229) 8 Jeff Davis County (48243) 8 Presidio County (48377) 9 Andrews County (48003) 9 Borden County (48033) 9 Crane County (48103) 9 Dawson County (48115) 9 Ector County (48135) 9 Gaines County (48165) 9 Glasscock County (48173) 9 Howard County (48227) 9 Loving County (48301) 9 Martin County (48317) 9 Midland County (48329) 9 Pecos County (48371) 9 Reeves County (48389) 9 Terrell County (48443) 9 Upton County (48461) 9 Ward County (48475) 9 Winkler County (48495) 10 Coke County (48081) 10 Concho County (48095) 10 Crockett County (48105) 10 Irion County (48235) 10 Kimble County (48267) 10 Mason County (48319) 10 McCulloch County (48307) 10 Menard County (48327)
Created by Cancer Epidemiology and Surveillance Branch. 11/19/2009. Incidence source: 1995-2006, NPCR CSS, 11/26/2008. Mortality source: Center for Health Statistics, DSHS, created 3/31/2009.
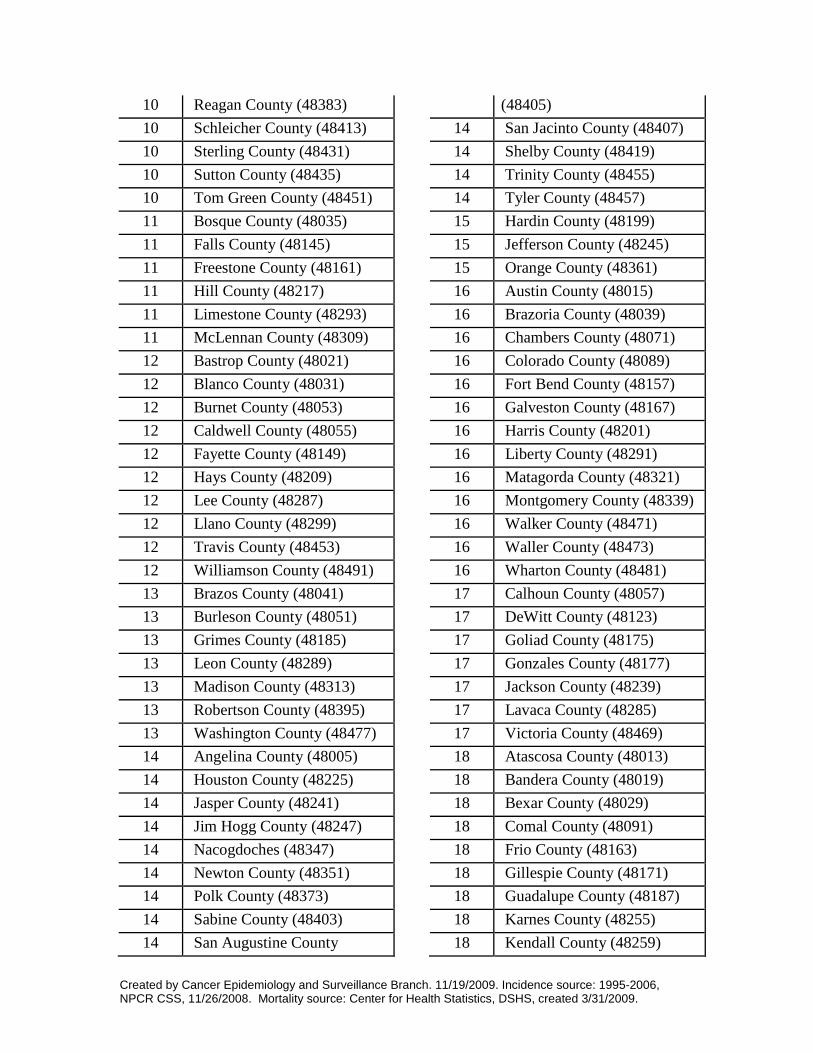
10 Reagan County (48383) 10 Schleicher County (48413) 10 Sterling County (48431) 10 Sutton County (48435) 10 Tom Green County (48451) 11 Bosque County (48035) 11 Falls County (48145) 11 Freestone County (48161) 11 Hill County (48217) 11 Limestone County (48293) 11 McLennan County (48309) 12 Bastrop County (48021) 12 Blanco County (48031) 12 Burnet County (48053) 12 Caldwell County (48055) 12 Fayette County (48149) 12 Hays County (48209) 12 Lee County (48287) 12 Llano County (48299) 12 Travis County (48453) 12 Williamson County (48491) 13 Brazos County (48041) 13 Burleson County (48051) 13 Grimes County (48185) 13 Leon County (48289) 13 Madison County (48313) 13 Robertson County (48395) 13 Washington County (48477) 14 Angelina County (48005) 14 Houston County (48225) 14 Jasper County (48241) 14 Jim Hogg County (48247) 14 Nacogdoches (48347) 14 Newton County (48351) 14 Polk County (48373) 14 Sabine County (48403) 14 San Augustine County
(48405) 14 San Jacinto County (48407) 14 Shelby County (48419) 14 Trinity County (48455) 14 Tyler County (48457) 15 Hardin County (48199) 15 Jefferson County (48245) 15 Orange County (48361) 16 Austin County (48015) 16 Brazoria County (48039) 16 Chambers County (48071) 16 Colorado County (48089) 16 Fort Bend County (48157) 16 Galveston County (48167) 16 Harris County (48201) 16 Liberty County (48291) 16 Matagorda County (48321) 16 Montgomery County (48339) 16 Walker County (48471) 16 Waller County (48473) 16 Wharton County (48481) 17 Calhoun County (48057) 17 DeWitt County (48123) 17 Goliad County (48175) 17 Gonzales County (48177) 17 Jackson County (48239) 17 Lavaca County (48285) 17 Victoria County (48469) 18 Atascosa County (48013) 18 Bandera County (48019) 18 Bexar County (48029) 18 Comal County (48091) 18 Frio County (48163) 18 Gillespie County (48171) 18 Guadalupe County (48187) 18 Karnes County (48255) 18 Kendall County (48259)
Created by Cancer Epidemiology and Surveillance Branch. 11/19/2009. Incidence source: 1995-2006, NPCR CSS, 11/26/2008. Mortality source: Center for Health Statistics, DSHS, created 3/31/2009.
18 Kerr County (48265) 18 Medina County (48325) 18 Wilson County (48493) 19 Jim Hogg County (48247) 19 Starr County (48427) 19 Webb County (48479) 19 Zapata County (48505) 20 Aransas County (48007) 20 Bee County (48025) 20 Brooks County (48047) 20 Duval County (48131) 20 Jim Wells County (48249) 20 Kenedy County (48261) 20 Kleberg County (48273) 20 Live Oak County (48297) 20 McMullen County (48311) 20 Nueces County (48355) 20 Refugio County (48391) 20 San Patricio County (48409) 21 Cameron County (48061) 21 Hidalgo County (48215) 21 Willacy County (48489) 22 Cooke County (48097) 22 Fannin County (48147) 22 Grayson County (48181) 23 Bell County (48027) 23 Coryell County (48099) 23 Hamilton County (48193) 23 Lampasas County (48281) 23 Milam County (48331) 23 Mills County (48333) 23 San Saba County (48411) 24 Dimmit County (48127) 24 Edwards County (48137) 24 Kinney County (48271) 24 La Salle County (48283) 24 Maverick County (48323)
24 Real County (48385) 24 Uvalde County (48463) 24 Val Verde County (48465) 24 Zavala County (48507)