breath holding reveals differences in fmri bold signal in...
TRANSCRIPT
www.elsevier.com/locate/ynimg
NeuroImage 25 (2005) 824–837
Breath holding reveals differences in fMRI BOLD signal in children
and adults
Moriah E. Thomason,a,* Brittany E. Burrows,b John D.E. Gabrieli,a,b and Gary H. Glovera,c
aDepartment of Psychology, Neurosciences Program, Stanford University, Jordan Hall, Building 420, Stanford, CA 94305-2130, USAbDepartment of Psychology, Stanford University, Stanford, CA 94305, USAcDepartment of Radiology, Stanford University, Stanford, CA 94305, USA
Received 21 May 2004; revised 19 November 2004; accepted 9 December 2004
Available online 2 March 2005
Application of fMRI to studies of cognitive development is of growing
interest because of its sensitivity and non-invasive nature. However,
interpretation of fMRI results in children is presently based on
vascular dynamics that have been studied primarily in healthy adults.
Comparison of the neurological basis of cognitive development is valid
to the extent that the neurovascular responsiveness between children
and adults is equal. The present study was designed to detect age-
related vascular differences that may contribute to altered BOLD fMRI
signal responsiveness. We examined BOLD signal changes in response
to breath holding, a global, systemic state change in brain oxygenation.
Children exhibited greater percent signal changes than adults in grey
and white matter, and this was accompanied by an increase in noise.
Consequently, the volume of activation exceeding statistical threshold
was reduced in children. The reduced activation in children was well
modeled by adding noise to adult data. These findings raise the
possibility that developmental differences in fMRI findings between
children and adults could, under some circumstances, reflect greater
noise in the BOLD response in the brains of children than adults.
BOLD responses varied across brain regions, but showed similar
regional variation in children and adults.
D 2004 Elsevier Inc. All rights reserved.
Keywords: Breath holding; BOLD contrast; Children; Adults; Noise
Introduction
The rapid cognitive and perceptual stages of development
through which children progress are directly linked to brain
development. Today, MRI is the most effective method available
for investigating functional and structural brain maturation in
children. In fact, functional magnetic resonance imaging (fMRI) is
one of the most widely used methods for studying the neural basis
of human cognition in and across all age groups and populations.
Indeed, substantial progress has been made in understanding brain
1053-8119/$ - see front matter D 2004 Elsevier Inc. All rights reserved.
doi:10.1016/j.neuroimage.2004.12.026
* Corresponding author. Fax: +1 650 725 5699.
E-mail address: [email protected] (M.E. Thomason).
Available online on ScienceDirect (www.sciencedirect.com).
development through use of fMRI in children (Adleman et al.,
2002; Booth et al., 1999, 2003; Bunge et al., 2002; Casey et al.,
1995, 1997; Gaillard et al., 2000; Klingberg et al., 2002; Luna et
al., 2001; Moses et al., 2002; Nelson et al., 2000; Rubia et al.,
2000; Sachs and Gaillard, 2003; Schlaggar et al., 2002; Thomas et
al., 1999; Turkeltaub et al., 2003), but attention to the methodo-
logical issues needs to focus future investigations using this
technique (Casey, 2002; Gaillard et al., 2001; Poldrack et al., 2002;
Stiles et al., 2003; Wenger et al., 2004).
One of the primary methodological issues in fMRI is that the
blood oxygen level dependent (BOLD) signal is only an indirect
measure of neuronal activity. Active neural circuits cause an increase
in local perfusion and slight increase in oxygen consumption. BOLD
signal results from changes in local oxygen tension consequent to
increased perfusion in microvasculature that in turn results from
increased neuronal metabolism (Bandettini et al., 1992; Kwong et
al., 1992; Ogawa et al., 1992; for a review, see Logothetis, 2002).
Therefore, inferences about inter-group differences in neural activity
drawn from BOLD signal intensity (SI) could be distorted by group
differences in hemodynamic responsiveness.
Two studies have begun to address this potential confound of
inter-group vascular differences by comparing BOLD hemody-
namic response in children and adults during simple visual and
motor tasks (Kang et al., 2003; Richter and Richter, 2003).
However, the use of tasks that require cognitive control, even
simple sensory paradigms, leads to questions of reproducibility and
confounds from psychophysical performance variables. In addi-
tion, such tasks only activate limited regions of the brain, thereby
leaving open the question of responsivity of non-sensory regions.
Alternatively, hypercapnia has been postulated to be a good
surrogate for simple visual and motor tasks with less possible
confound by neuronal differences. The proportionality of BOLD
signal changes during hypercapnia, a state of excess CO2 in the
blood that can result from breath holding or inhaling CO2 air
mixtures, and focal neuronal activation supports this position
(Bandettini and Wong, 1997; Davis et al., 1998; Riecker et al.,
2003; Thomason et al., 2004). To date, no study has used
hypercapnic methods to query potential differences in BOLD
M.E. Thomason et al. / NeuroImage 25 (2005) 824–837 825
signal characteristics across the entire brain in children and adults.
In the past few years, vascular challenges have been used to
delineate group and individual differences in hemodynamic
response by inducing state changes that do not derive from
modulation of neuronal metabolism alone. Intravenous injection of
acetazolamide (in its role as a vasoconstrictor) and inhalation of
CO2 gas mixtures (vasodilators in air mixtures of up to 5% CO2)
cause altered levels of cerebral blood flow (CBF) and modulate
local oxygen tension (Kastrup et al., 1998a, 2002; Reich and
Rusinek, 1989). In addition, breath holding (BH) causes autonomic
down-regulation of heart rate (HR) and concomitant reduction in
blood flow to the brain, resulting in hypercapnia and vasodilation
(Corfield et al., 2001; Kastrup et al., 1998b, 1999a,b,c; Li et al.,
1999a,b; Liu et al., 2002; Nakada et al., 2001). These methods
have been useful for determining differences in the BOLD effect
between different brain regions within-subject (Kastrup et al.,
1999b), as well as BOLD signal responsiveness between people of
different ages (Kastrup et al., 1998a; Reich and Rusinek, 1989;
Riecker et al., 2003; Yamamoto et al., 1980), and between patients
and healthy controls (Shiino et al., 2003; Yamaguchi et al., 1980;
Yamamoto et al., 1980), but never between children and adults.
Good correlation between global BOLD signal intensity changes
during BH and during CO2 inhalation (Kastrup et al., 2001), as
well as between acetazolamide and CO2 inhalation (Kimoto et al.,
1995), supports the essential equivalence of these approaches in
depicting vascular responsiveness. BH has the advantage of being
a simpler paradigm for evaluating hemodynamic responsiveness,
because it requires neither an exogenous source of CO2 nor an
acetazolamide injection, making it a good non-invasive alternative
for testing children. Furthermore, BOLD response to short duration
BH is robust. Measured signal changes driven by BH range from
0.8% to 5.1% in a 1.5-T MR system (Kastrup et al., 1998b, 1999b),
with a similar or larger effect observed at 3 T. The present study
considers differences in signal and noise features of BOLD signal
responsiveness between children and adults as well as between
cerebral regions within groups.
While BH can readily develop global BOLD signal changes, its
effectiveness as a surrogate for task activation may be questioned,
and it is instructive to compare the two. In task activation, increased
local perfusion in the capillary bed results from vasodilation of
arterioles supplying the spatially limited region of cortex involved in
the task. The vasomotor response is triggered by a (poorly
understood) combination of hypercapnia, increases in [NO] and
[H+], changes in [K+], [Na+], and [Ca+], and decreases in pO2 in
response to heightened glycolysis (Roland, 1993). Whatever the
exact chemical messengers, the hemodynamic perturbation from
task activation is confined to a small fraction of the vascular system.
By contrast, the BH task causes a modulation of CBF to the entire
brain, thereby involving the complete neurovascular system. In this
case, little or no cognitive or CMRO2 changes occur, and metabolic
activity remains at baseline levels of the resting-state brain (Kastrup
et al., 1999a). However, with reduced perfusion but continued
baseline metabolic activity, the same cascade of chemical processes
leads to vasodilation of arterioles characteristic of local reactivity.
Thus, the BOLD response to BH is similar to task-initiated
hypermetabolism in that it results identically from up-regulation of
local flow. It may be dissimilar in that with all cortical regions
responding to the external hypoCBF challenge, some vascular steal
processes may be operative.We believe this effect is small, however,
because direct comparisons of BH and task activation using a
sensorimotor paradigm show good agreement of effect size
(Bandettini and Wong, 1997; Davis et al., 1998; Riecker et al.,
2003; Thomason et al., 2004).
Therefore, BH can be thought of as a method for inducing
BOLD response in all vascularized tissue, with signal dependent
on local vascular reactivity and using the same basic vasodilation
mechanism for up-regulation as that in task activation, but with
some potential differences in details of response. Additionally,
because basal metabolism proceeds during BH, fluctuations in
BOLD signal level from concomitant baseline blood flow and
blood volume changes are expected to be similar to those in resting
state brain experiments. The present study is not the first to use a
global hypercapnic challenge to define nonneuronal contributions
to altered age-related activation patterns (Kastrup et al., 1998a;
Reich and Rusinek, 1989; Riecker et al., 2003; Yamaguchi et al.,
1980; Yamamoto et al., 1980), but it is the first to apply this to the
study of BOLD response in adults and children.
Methods
Subjects
Data were collected from 36 healthy, right-handed, native
English speakers (18 male, 18 female) after giving informed
consent as described by the Stanford Institutional Review Board.
Subjects were divided into two participant groups: children (range
7 to 12 years, 10 female, 9 male) and young adults (range 18 to 29
years, 8 female, 9 male). Three subjects were eliminated due to
movement exceeding the a priori maximum movement of 2 mm (3
females, 2 children), and a fourth was removed due to flawed data
collection (1 male, child). Therefore, the subjects included in all
data analysis include 16 children (mean age 9.8) and 16 adults
(mean age 22.8).
Experimental paradigm
Subjects performed seven repetitions of alternating 18-s blocks
of breath holding and self-paced breathing. Subject compliance to
task timing and ability to hold breath was measured using a
pneumatic belt and by subject report. Trial timing was cued by
visual stimulus which included a brestQ and bget readyQ phase
during self-paced breathing and a non-verbal stimulus (a circle that
diminished in size during breath holding and disappeared at the
end of the BH period). This visual cue undoubtedly introduced a
small activation in the visual cortex but the amount was not
measured.
MRI acquisition
Magnetic resonance imaging was performed on a 3.0-T GE
whole-body scanner with a custom quadrature birdcage head coil.
Head movement was minimized using a bite bar and foam padding.
Twenty-three oblique axial slices were taken parallel to the AC–PC
with 4-mm slice thickness, 1-mm skip. High-resolution T2-weighted
fast spin echo structural images (TR = 3000 ms, TE = 68 ms, ETL =
12, FOV = 24 cm, 192 � 256) were acquired for anatomical
reference. AT2*-sensitive gradient echo spiral in/out pulse sequence
(Glover and Law, 2001) was used for functional imaging (TR = 1500
ms, TE = 30 ms, flip angle = 708, FOV = 24 cm, 64 � 64). An
automated high-order shimming procedure based on spiral acquis-
itions was used to reduce B0 heterogeneity (Kim et al., 2002). Spiral
M.E. Thomason et al. / NeuroImage 25 (2005) 824–837826
in/out methods have been shown to increase the signal to noise ratio
(SNR) and BOLD contrast to noise ratio in uniform brain regions as
well as to reduce signal loss in regions compromised by suscept-
ibility-induced field gradients generated near air–tissue interfaces
such as PFC (Glover and Law, 2001). Compared to traditional spiral
imaging techniques, spiral in/out methods result in less signal
dropout and greater task-related activation in PFC regions (Preston
et al., 2004). A high-resolution volume scan (128 slices, 1.2 mm
thickness) was collected for every subject using an IR-prep 3D
FSPGR sequence for T1 contrast (TR = 8.9 ms, TE = 1.8 ms, TI =
300 ms, flip angle 158, FOV = 24 cm, 256 � 192 � 128).
Physiological monitoring
Previous studies have shown that the inspiration level during
the BH task can have an influence on the BOLD signal (Nakada et
al., 2001 as well as our own unpublished studies). In order to
examine potential performance and behavioral differences in the
subject populations during the BH task, respiration and cardiac
rates were recorded using a data logger (PowerLab, AD Instru-
ments, Inc. Castle Hill, NSW) connected to the scanner’s
monitoring system and sampling at 40 Hz. Respiration data were
acquired using the scanner’s pneumatic belt placed on the subject’s
abdomen. However, the scanner’s internal autogain/offset algo-
rithm is set to rezero the reading when there is no change in the
respiration level for a few seconds, as occurs during the 18-s BH
period (Fig. 4A). The resulting recorded waveforms are distorted
and cannot be directly used to quantify respiration amplitude.
Therefore, we measured the respiration amplitude of each BH
block by recording the difference in observed respiration signal just
before and after the BH transition, i.e., prior to the amplitude gain
correction. The inspiration amplitude for the scan was then
obtained as the average of readings for the 7 BH blocks. These
measures of inspiration were averaged within groups to obtain
mean inspiration amplitudes for children and adults. In order to
account for systematic size differences between the two groups, a
weighted average was also obtained. Subject inspiration-ampli-
tudes, which are a linear measurement of abdominal circum-
ference, were normalized by dividing by subject-height, and then
averaged over subjects.
The respiration amplitude results were used to assess whether
there were group differences in inspiration level that could
account for BOLD signal changes. In addition, group average
waveforms were obtained to examine temporal differences in
performing the BH task (see Temporal response of BOLD
signal). Differences were tested with a two-tailed t test across all
subjects.
Heart rate was measured with the scanner’s photoplethysmo-
graph on the subject’s index finger of the left, non-dominant hand
and recorded simultaneously with the respiration waveforms with
the data logger.
Anatomical data analysis
Each subject’s T1-weighted 3D volume scan was segmented
into grey and white matter volumes using SPM99 (Wellcome Dept
of Cognitive Neurology) [feasibility of using SPM in children:
Muzik et al., 2000]. Subject-specific grey and white matter
volumes were used for quantification of anatomical data and were
used to restrict examination of activation extent and magnitude
measures to each tissue type.
fMRI data analysis
fMRI data were preprocessed using SPM99 and custom
MATLAB routines. Preprocessing included time series image
realignment of all images to the first time frame and correction
for linear signal drift. fMRI signal during the task breath hold
epochs across the 23 slices was compared to baseline activity
during the normal breathing condition. Regressors for the
corresponding condition blocks were modeled as a boxcar
function convolved with the canonical HRF. Statistical analysis
at the single-subject level treated each voxel according to a
general linear model (Worsley et al., 2002). Single-subject level
statistics produced t values for all brain voxels or full brain
t maps. Individual subject t maps were used to calculate average
t values across all grey matter and white matter. Additionally,
subject activation volumes were measured at two thresholds, P b
0.0001, corrected for multiple comparisons, and P b 0.001
uncorrected. The more rigorous threshold of P b 0.0001 corrected
was of interest for this study because BOLD response to breath
holding is robust.
Regional analysis was performed to examine the response of
different tissue types and different brain regions. A set of 27 spatial
masks covering the area of the entire brain, as well as subject-
specific grey and white matter masks, was applied to each subject’s
normalized, smoothed (FWHM = 8 mm) data. For the activated
volume at corrected P b 0.0001 in each of these areas, both percent
signal change and voxel counts were measured. Voxel counts were
normalized to control for differences in the total area of the spatial
regions being queried. The number of total activated voxels was
divided by the total number of voxels in that area and voxel counts
were, therefore, expressed as percentages. For voxel counts in
subject-specific grey and white matter masks, percentage volumes
of activation at both P b 0.0001 corrected and P b 0.001
uncorrected were tested.
The BOLD signal and noise magnitudes were computed with a
Fourier analysis utilizing the first four harmonics of the task
frequency. The time series were obtained from activation volumes
within subject-specific segmented grey matter and white matter
areas in order to distinguish responses in different tissue types for
both groups. Because the block duration was short enough to
sharply attenuate the harmonics beyond the fundamental, the
Fourier model achieved very high correlation with the data, and
the residual had virtually no task-related signal as determined from
its spectral components at harmonics of the task frequency. Task-
related signal change magnitude for an area averaged across trials
was used as the signal estimate, and residual signal variance not
explained by the model was taken as a noise estimate. Analysis of
signal change and noise in grey and white matter was performed for
activation volumes produced at three thresholds: (1) P b 0.0001
corrected, (2) P b 0.001 corrected, and (3) P b 0.001 uncorrected.
Results
Anatomical differences between groups
From the segmentation analysis, significant group differences in
the number of voxels characterized as grey matter or as white matter
were found. The proportion of grey to white matter in children was
greater than the proportion in adults. Children exhibited a greater
mean grey matter volume than adults, and a smaller mean white
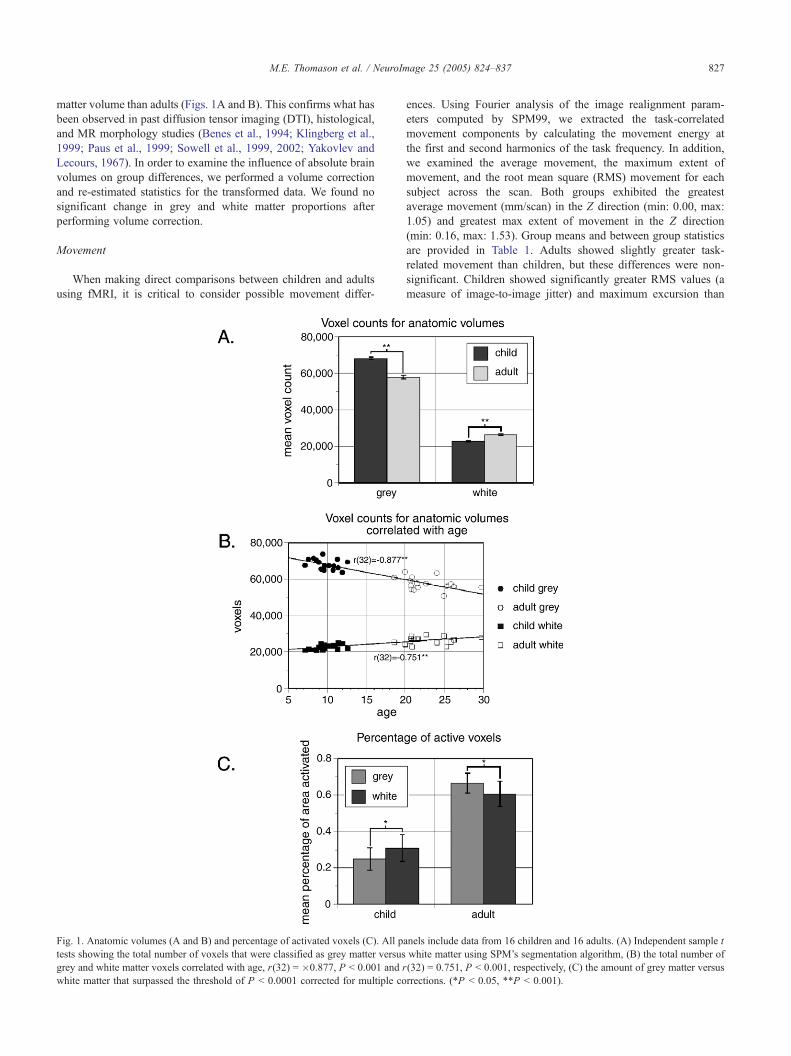
M.E. Thomason et al. / NeuroImage 25 (2005) 824–837 827
matter volume than adults (Figs. 1A and B). This confirms what has
been observed in past diffusion tensor imaging (DTI), histological,
and MR morphology studies (Benes et al., 1994; Klingberg et al.,
1999; Paus et al., 1999; Sowell et al., 1999, 2002; Yakovlev and
Lecours, 1967). In order to examine the influence of absolute brain
volumes on group differences, we performed a volume correction
and re-estimated statistics for the transformed data. We found no
significant change in grey and white matter proportions after
performing volume correction.
Movement
When making direct comparisons between children and adults
using fMRI, it is critical to consider possible movement differ-
Fig. 1. Anatomic volumes (A and B) and percentage of activated voxels (C). All p
tests showing the total number of voxels that were classified as grey matter versus
grey and white matter voxels correlated with age, r(32) = �0.877, P b 0.001 and r
white matter that surpassed the threshold of P b 0.0001 corrected for multiple co
ences. Using Fourier analysis of the image realignment param-
eters computed by SPM99, we extracted the task-correlated
movement components by calculating the movement energy at
the first and second harmonics of the task frequency. In addition,
we examined the average movement, the maximum extent of
movement, and the root mean square (RMS) movement for each
subject across the scan. Both groups exhibited the greatest
average movement (mm/scan) in the Z direction (min: 0.00, max:
1.05) and greatest max extent of movement in the Z direction
(min: 0.16, max: 1.53). Group means and between group statistics
are provided in Table 1. Adults showed slightly greater task-
related movement than children, but these differences were non-
significant. Children showed significantly greater RMS values (a
measure of image-to-image jitter) and maximum excursion than
anels include data from 16 children and 16 adults. (A) Independent sample t
white matter using SPM’s segmentation algorithm, (B) the total number of
(32) = 0.751, P b 0.001, respectively, (C) the amount of grey matter versus
rrections. (*P b 0.05, **P b 0.001).
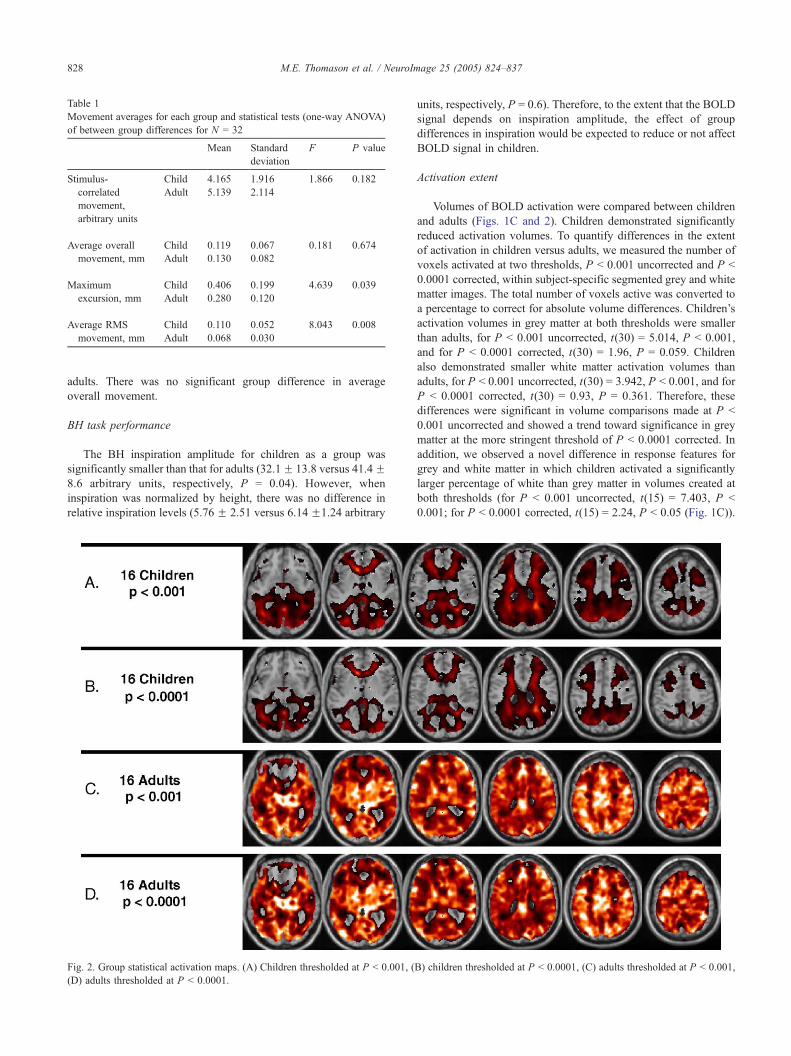
Table 1
Movement averages for each group and statistical tests (one-way ANOVA)
of between group differences for N = 32
Mean Standard
deviation
F P value
Stimulus-
correlated
movement,
arbitrary units
Child
Adult
4.165
5.139
1.916
2.114
1.866 0.182
Average overall
movement, mm
Child
Adult
0.119
0.130
0.067
0.082
0.181 0.674
Maximum
excursion, mm
Child
Adult
0.406
0.280
0.199
0.120
4.639 0.039
Average RMS
movement, mm
Child
Adult
0.110
0.068
0.052
0.030
8.043 0.008
M.E. Thomason et al. / NeuroImage 25 (2005) 824–837828
adults. There was no significant group difference in average
overall movement.
BH task performance
The BH inspiration amplitude for children as a group was
significantly smaller than that for adults (32.1F 13.8 versus 41.4F8.6 arbitrary units, respectively, P = 0.04). However, when
inspiration was normalized by height, there was no difference in
relative inspiration levels (5.76 F 2.51 versus 6.14 F1.24 arbitrary
Fig. 2. Group statistical activation maps. (A) Children thresholded at P b 0.001, (
(D) adults thresholded at P b 0.0001.
units, respectively, P = 0.6). Therefore, to the extent that the BOLD
signal depends on inspiration amplitude, the effect of group
differences in inspiration would be expected to reduce or not affect
BOLD signal in children.
Activation extent
Volumes of BOLD activation were compared between children
and adults (Figs. 1C and 2). Children demonstrated significantly
reduced activation volumes. To quantify differences in the extent
of activation in children versus adults, we measured the number of
voxels activated at two thresholds, P b 0.001 uncorrected and P b
0.0001 corrected, within subject-specific segmented grey and white
matter images. The total number of voxels active was converted to
a percentage to correct for absolute volume differences. Children’s
activation volumes in grey matter at both thresholds were smaller
than adults, for P b 0.001 uncorrected, t(30) = 5.014, P b 0.001,
and for P b 0.0001 corrected, t(30) = 1.96, P = 0.059. Children
also demonstrated smaller white matter activation volumes than
adults, for P b 0.001 uncorrected, t(30) = 3.942, P b 0.001, and for
P b 0.0001 corrected, t(30) = 0.93, P = 0.361. Therefore, these
differences were significant in volume comparisons made at P b
0.001 uncorrected and showed a trend toward significance in grey
matter at the more stringent threshold of P b 0.0001 corrected. In
addition, we observed a novel difference in response features for
grey and white matter in which children activated a significantly
larger percentage of white than grey matter in volumes created at
both thresholds (for P b 0.001 uncorrected, t(15) = 7.403, P b
0.001; for P b 0.0001 corrected, t(15) = 2.24, P b 0.05 (Fig. 1C)).
B) children thresholded at P b 0.0001, (C) adults thresholded at P b 0.001,
M.E. Thomason et al. / NeuroImage 25 (2005) 824–837 829
In contrast, young adults activated a larger percentage of grey than
white matter, consistent with prior reports (Kastrup et al., 1998b,
1999c).
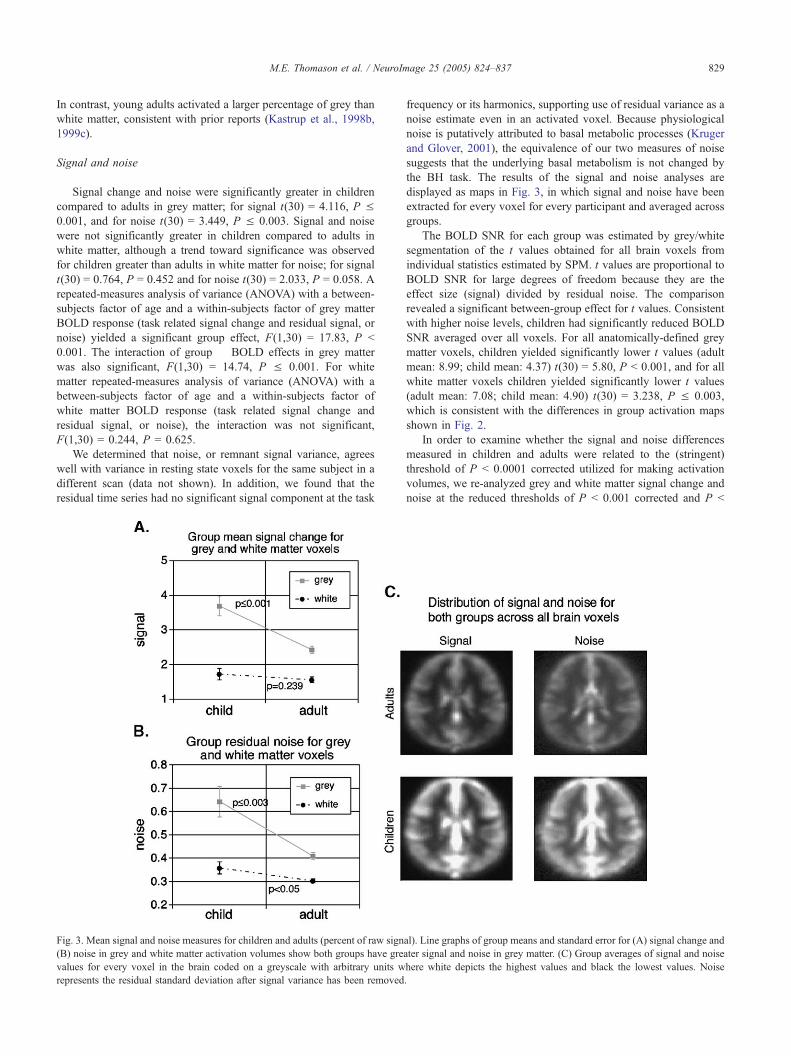
Signal and noise
Signal change and noise were significantly greater in children
compared to adults in grey matter; for signal t(30) = 4.116, P V0.001, and for noise t(30) = 3.449, P V 0.003. Signal and noise
were not significantly greater in children compared to adults in
white matter, although a trend toward significance was observed
for children greater than adults in white matter for noise; for signal
t(30) = 0.764, P = 0.452 and for noise t(30) = 2.033, P = 0.058. A
repeated-measures analysis of variance (ANOVA) with a between-
subjects factor of age and a within-subjects factor of grey matter
BOLD response (task related signal change and residual signal, or
noise) yielded a significant group effect, F(1,30) = 17.83, P b
0.001. The interaction of group � BOLD effects in grey matter
was also significant, F(1,30) = 14.74, P V 0.001. For white
matter repeated-measures analysis of variance (ANOVA) with a
between-subjects factor of age and a within-subjects factor of
white matter BOLD response (task related signal change and
residual signal, or noise), the interaction was not significant,
F(1,30) = 0.244, P = 0.625.
We determined that noise, or remnant signal variance, agrees
well with variance in resting state voxels for the same subject in a
different scan (data not shown). In addition, we found that the
residual time series had no significant signal component at the task
Fig. 3. Mean signal and noise measures for children and adults (percent of raw sign
(B) noise in grey and white matter activation volumes show both groups have gre
values for every voxel in the brain coded on a greyscale with arbitrary units w
represents the residual standard deviation after signal variance has been removed
frequency or its harmonics, supporting use of residual variance as a
noise estimate even in an activated voxel. Because physiological
noise is putatively attributed to basal metabolic processes (Kruger
and Glover, 2001), the equivalence of our two measures of noise
suggests that the underlying basal metabolism is not changed by
the BH task. The results of the signal and noise analyses are
displayed as maps in Fig. 3, in which signal and noise have been
extracted for every voxel for every participant and averaged across
groups.
The BOLD SNR for each group was estimated by grey/white
segmentation of the t values obtained for all brain voxels from
individual statistics estimated by SPM. t values are proportional to
BOLD SNR for large degrees of freedom because they are the
effect size (signal) divided by residual noise. The comparison
revealed a significant between-group effect for t values. Consistent
with higher noise levels, children had significantly reduced BOLD
SNR averaged over all voxels. For all anatomically-defined grey
matter voxels, children yielded significantly lower t values (adult
mean: 8.99; child mean: 4.37) t(30) = 5.80, P b 0.001, and for all
white matter voxels children yielded significantly lower t values
(adult mean: 7.08; child mean: 4.90) t(30) = 3.238, P V 0.003,
which is consistent with the differences in group activation maps
shown in Fig. 2.
In order to examine whether the signal and noise differences
measured in children and adults were related to the (stringent)
threshold of P b 0.0001 corrected utilized for making activation
volumes, we re-analyzed grey and white matter signal change and
noise at the reduced thresholds of P b 0.001 corrected and P b
al). Line graphs of group means and standard error for (A) signal change and
ater signal and noise in grey matter. (C) Group averages of signal and noise
here white depicts the highest values and black the lowest values. Noise
.
M.E. Thomason et al. / NeuroImage 25 (2005) 824–837830
0.001 uncorrected. Results for the entire cohort of 32 subjects were
similar at the 3 thresholds. Grey matter signal change and noise
extracted from volumes activated at three different thresholds are
summarized in Table 2. Consistency at different thresholds was
further confirmed by within-subject correlation analysis between
signal change estimates derived at P b 0.0001 and P b 0.001
corrected. The correlation value for percent signal change in grey
matter was r(31) = 0.998, P b 0.001 and the correlation value for
percent noise in grey matter was r(31) = 0.726, P b 0.001.
With a task like BH that elicits global signal change, some of
the significant group differences in BOLD signal and noise
demonstrated above could potentially have resulted from differ-
ences in motion characteristics not corrected by the image
realignment algorithm. We performed two additional analyses to
examine the effects of movement on BOLD signal and noise in our
groups, even though our motion analysis demonstrated very small
group differences and small overall movement (Table 1). First, we
assessed the degree to which group noise and signal measurements
in grey and white matter correlated with movement parameters,
and found none of the correlations were significant. Second, we
performed a post hoc analysis of a subset of 14 children and 14
adults where movement parameters did not differ for overall
movement, stimulus-correlated noise, and maximum excursion.
This analysis was of interest because if the small movement
differences between our groups contribute to the BOLD signal
effects we observed, then for this subset of subjects significance
would be reduced. We found that even with non-significant
differences in three critical movement measures, adults still
demonstrated a significantly greater number of activated voxels
than children, and children demonstrated significantly greater
signal and noise values than adults. Maintenance of the major
effects of this study in a subset where movement is even more
closely matched reduces the likelihood that movement differences
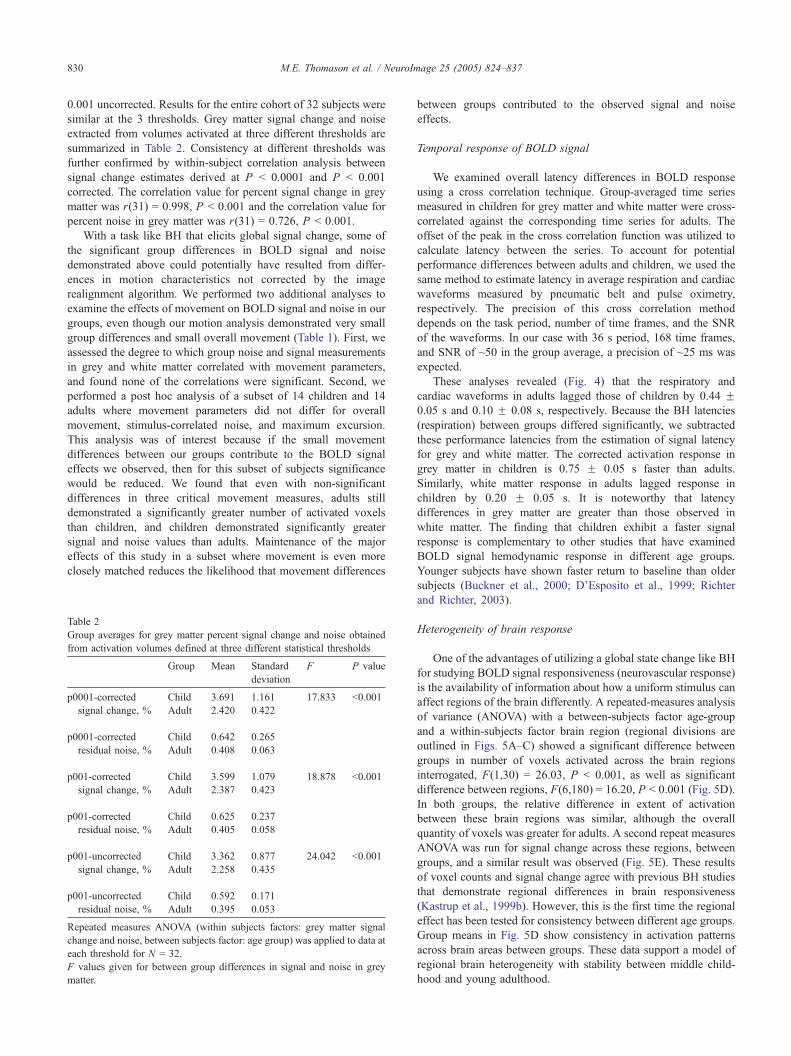
Table 2
Group averages for grey matter percent signal change and noise obtained
from activation volumes defined at three different statistical thresholds
Group Mean Standard
deviation
F P value
p0001-corrected
signal change, %
Child
Adult
3.691
2.420
1.161
0.422
17.833 b0.001
p0001-corrected
residual noise, %
Child
Adult
0.642
0.408
0.265
0.063
p001-corrected
signal change, %
Child
Adult
3.599
2.387
1.079
0.423
18.878 b0.001
p001-corrected
residual noise, %
Child
Adult
0.625
0.405
0.237
0.058
p001-uncorrected
signal change, %
Child
Adult
3.362
2.258
0.877
0.435
24.042 b0.001
p001-uncorrected
residual noise, %
Child
Adult
0.592
0.395
0.171
0.053
Repeated measures ANOVA (within subjects factors: grey matter signal
change and noise, between subjects factor: age group) was applied to data at
each threshold for N = 32.
F values given for between group differences in signal and noise in grey
matter.
between groups contributed to the observed signal and noise
effects.
Temporal response of BOLD signal
We examined overall latency differences in BOLD response
using a cross correlation technique. Group-averaged time series
measured in children for grey matter and white matter were cross-
correlated against the corresponding time series for adults. The
offset of the peak in the cross correlation function was utilized to
calculate latency between the series. To account for potential
performance differences between adults and children, we used the
same method to estimate latency in average respiration and cardiac
waveforms measured by pneumatic belt and pulse oximetry,
respectively. The precision of this cross correlation method
depends on the task period, number of time frames, and the SNR
of the waveforms. In our case with 36 s period, 168 time frames,
and SNR of ~50 in the group average, a precision of ~25 ms was
expected.
These analyses revealed (Fig. 4) that the respiratory and
cardiac waveforms in adults lagged those of children by 0.44 F0.05 s and 0.10 F 0.08 s, respectively. Because the BH latencies
(respiration) between groups differed significantly, we subtracted
these performance latencies from the estimation of signal latency
for grey and white matter. The corrected activation response in
grey matter in children is 0.75 F 0.05 s faster than adults.
Similarly, white matter response in adults lagged response in
children by 0.20 F 0.05 s. It is noteworthy that latency
differences in grey matter are greater than those observed in
white matter. The finding that children exhibit a faster signal
response is complementary to other studies that have examined
BOLD signal hemodynamic response in different age groups.
Younger subjects have shown faster return to baseline than older
subjects (Buckner et al., 2000; D’Esposito et al., 1999; Richter
and Richter, 2003).
Heterogeneity of brain response
One of the advantages of utilizing a global state change like BH
for studying BOLD signal responsiveness (neurovascular response)
is the availability of information about how a uniform stimulus can
affect regions of the brain differently. A repeated-measures analysis
of variance (ANOVA) with a between-subjects factor age-group
and a within-subjects factor brain region (regional divisions are
outlined in Figs. 5A–C) showed a significant difference between
groups in number of voxels activated across the brain regions
interrogated, F(1,30) = 26.03, P b 0.001, as well as significant
difference between regions, F(6,180) = 16.20, P b 0.001 (Fig. 5D).
In both groups, the relative difference in extent of activation
between these brain regions was similar, although the overall
quantity of voxels was greater for adults. A second repeat measures
ANOVA was run for signal change across these regions, between
groups, and a similar result was observed (Fig. 5E). These results
of voxel counts and signal change agree with previous BH studies
that demonstrate regional differences in brain responsiveness
(Kastrup et al., 1999b). However, this is the first time the regional
effect has been tested for consistency between different age groups.
Group means in Fig. 5D show consistency in activation patterns
across brain areas between groups. These data support a model of
regional brain heterogeneity with stability between middle child-
hood and young adulthood.
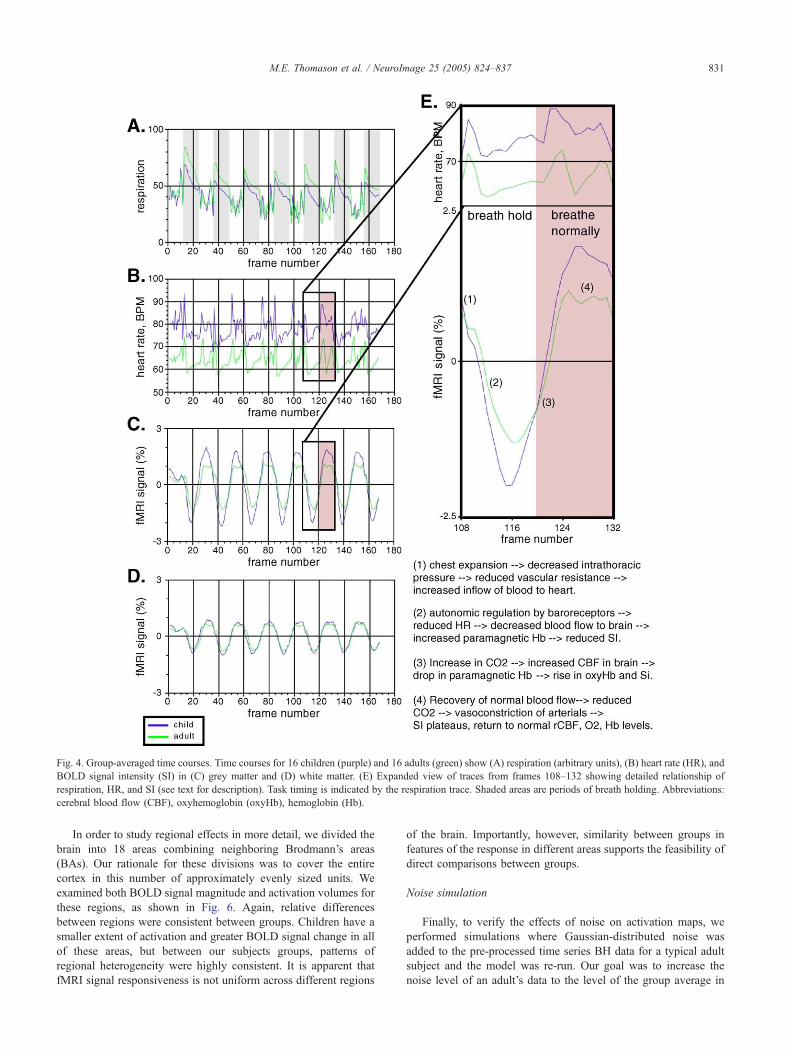
Fig. 4. Group-averaged time courses. Time courses for 16 children (purple) and 16 adults (green) show (A) respiration (arbitrary units), (B) heart rate (HR), and
BOLD signal intensity (SI) in (C) grey matter and (D) white matter. (E) Expanded view of traces from frames 108–132 showing detailed relationship of
respiration, HR, and SI (see text for description). Task timing is indicated by the respiration trace. Shaded areas are periods of breath holding. Abbreviations:
cerebral blood flow (CBF), oxyhemoglobin (oxyHb), hemoglobin (Hb).
M.E. Thomason et al. / NeuroImage 25 (2005) 824–837 831
In order to study regional effects in more detail, we divided the
brain into 18 areas combining neighboring Brodmann’s areas
(BAs). Our rationale for these divisions was to cover the entire
cortex in this number of approximately evenly sized units. We
examined both BOLD signal magnitude and activation volumes for
these regions, as shown in Fig. 6. Again, relative differences
between regions were consistent between groups. Children have a
smaller extent of activation and greater BOLD signal change in all
of these areas, but between our subjects groups, patterns of
regional heterogeneity were highly consistent. It is apparent that
fMRI signal responsiveness is not uniform across different regions
of the brain. Importantly, however, similarity between groups in
features of the response in different areas supports the feasibility of
direct comparisons between groups.
Noise simulation
Finally, to verify the effects of noise on activation maps, we
performed simulations where Gaussian-distributed noise was
added to the pre-processed time series BH data for a typical adult
subject and the model was re-run. Our goal was to increase the
noise level of an adult’s data to the level of the group average in
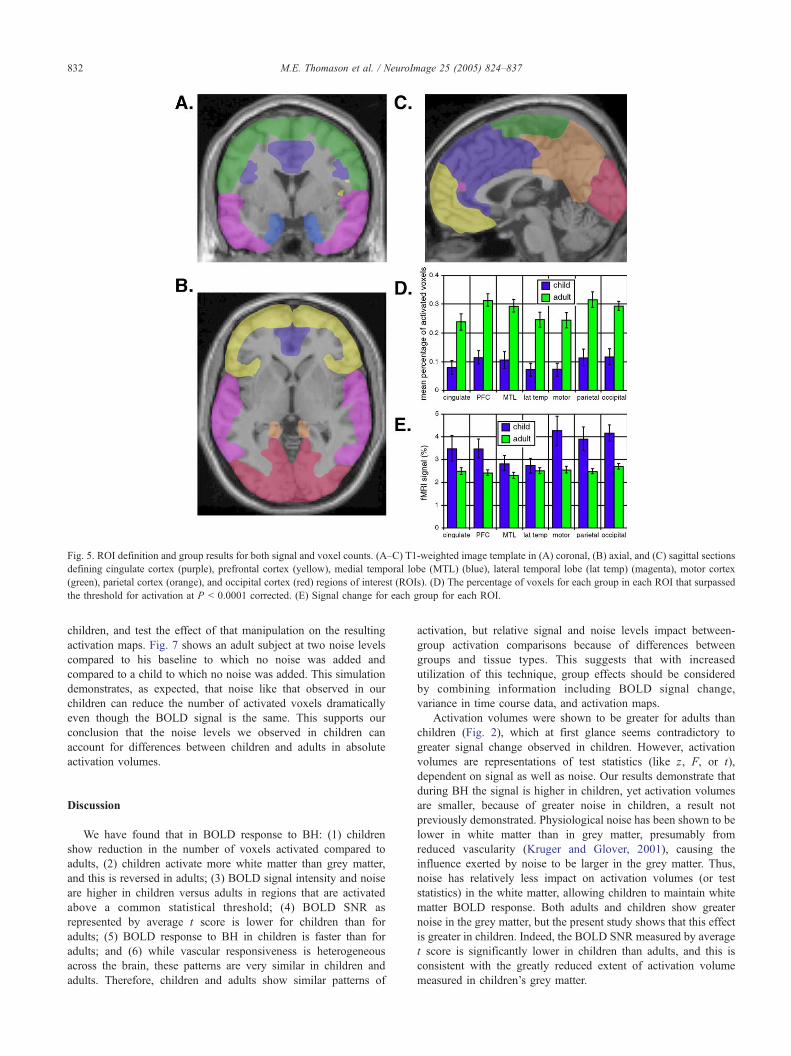
Fig. 5. ROI definition and group results for both signal and voxel counts. (A–C) T1-weighted image template in (A) coronal, (B) axial, and (C) sagittal sections
defining cingulate cortex (purple), prefrontal cortex (yellow), medial temporal lobe (MTL) (blue), lateral temporal lobe (lat temp) (magenta), motor cortex
(green), parietal cortex (orange), and occipital cortex (red) regions of interest (ROIs). (D) The percentage of voxels for each group in each ROI that surpassed
the threshold for activation at P b 0.0001 corrected. (E) Signal change for each group for each ROI.
M.E. Thomason et al. / NeuroImage 25 (2005) 824–837832
children, and test the effect of that manipulation on the resulting
activation maps. Fig. 7 shows an adult subject at two noise levels
compared to his baseline to which no noise was added and
compared to a child to which no noise was added. This simulation
demonstrates, as expected, that noise like that observed in our
children can reduce the number of activated voxels dramatically
even though the BOLD signal is the same. This supports our
conclusion that the noise levels we observed in children can
account for differences between children and adults in absolute
activation volumes.
Discussion
We have found that in BOLD response to BH: (1) children
show reduction in the number of voxels activated compared to
adults, (2) children activate more white matter than grey matter,
and this is reversed in adults; (3) BOLD signal intensity and noise
are higher in children versus adults in regions that are activated
above a common statistical threshold; (4) BOLD SNR as
represented by average t score is lower for children than for
adults; (5) BOLD response to BH in children is faster than for
adults; and (6) while vascular responsiveness is heterogeneous
across the brain, these patterns are very similar in children and
adults. Therefore, children and adults show similar patterns of
activation, but relative signal and noise levels impact between-
group activation comparisons because of differences between
groups and tissue types. This suggests that with increased
utilization of this technique, group effects should be considered
by combining information including BOLD signal change,
variance in time course data, and activation maps.
Activation volumes were shown to be greater for adults than
children (Fig. 2), which at first glance seems contradictory to
greater signal change observed in children. However, activation
volumes are representations of test statistics (like z, F, or t),
dependent on signal as well as noise. Our results demonstrate that
during BH the signal is higher in children, yet activation volumes
are smaller, because of greater noise in children, a result not
previously demonstrated. Physiological noise has been shown to be
lower in white matter than in grey matter, presumably from
reduced vascularity (Kruger and Glover, 2001), causing the
influence exerted by noise to be larger in the grey matter. Thus,
noise has relatively less impact on activation volumes (or test
statistics) in the white matter, allowing children to maintain white
matter BOLD response. Both adults and children show greater
noise in the grey matter, but the present study shows that this effect
is greater in children. Indeed, the BOLD SNR measured by average
t score is significantly lower in children than adults, and this is
consistent with the greatly reduced extent of activation volume
measured in children’s grey matter.

Fig. 6. Regional brain differences. Colors represent means across regional boundaries for (A) percent signal change and (B) number of activated voxels for
breath holding. Each of the 18 ROIs is labeled by the combined Brodmann’s areas that they encompass. Areas were selected in an effort to create approximately
equal partitions covering the brain. Values for each area were determined for each subject and averaged over all subjects (N = 32).
M.E. Thomason et al. / NeuroImage 25 (2005) 824–837 833
This is the first study to demonstrate higher grey matter
amplitude BOLD SI following vascular challenge in children than
in adults. This finding is likely to relate to blood kinetics and
oxygen extraction. For example, basal oxygenation levels or rates
of O2 consumption could differ between adults and children, and
this could exert an effect on BOLD signal change following both
neuronal events and physiological state changes. If children have a
higher metabolic rate of O2 and CMRO2, they would be expected
to show greater signal change such as that observed in the present
study, by the mechanisms modeled in Fig. 4. In addition, if they
have a higher rate of oxygen extraction, the brain would exhaust
stores of O2 faster during BH, again giving larger signal changes. It
could also be that re-oxygenation in the lung is different in children
such that more O2 enters the blood in inspiration, leading to higher
signal changes during BH. Furthermore, greater signal would be
expected if children breathed more deeply; however, our un-
normalized measurements showed just the opposite, or no differ-
ence when inspiration amplitudes were adjusted for subject height.
A final possibility is that because the BOLD signal timing is faster
in children (Fig. 4E), their hemodynamic response will reach a
greater degree of equilibration in the 18 s blocks, leading to greater
observed signal change.
BOLD signal time series in activated volumes were signifi-
cantly noisier in children than adults in BH, which may be
attributed to differences in the underlying physiology or to
aspects of the measurement. Because children are passing through
significant stages of development and have highly variable brain
structures (Wilke and Holland, 2003), developmental differences
are expected, and these may lead to greater signal variation or
residual noise. For example, it has been shown that metabolic
rates in children this age rise to a peak and then decline to adult
levels (Chugani et al., 1987). It is thought that changes in
metabolic rates accompany neuronal maturational processes, such
as synaptic pruning and myelination, and it is expected that
variations in metabolic rates would impact the BOLD signal.
Additionally, decreases in electroencephalograph (EEG) wave-
forms for delta, theta, alpha, and beta frequencies with age have
been described in children (Gasser et al., 1988; Wada et al.,
1996). Because the BOLD signal is shown to correlate with
electrical activity (Heeger et al., 2000), developmental differences
in electrical activity (increased levels in children) may contribute
to noisier BOLD signal measurements. A second potential
contribution to differences in noise may be related to data
collection. Non-correlated, physical head motion during a scan
session would have a tendency to reduce the number of activated
voxels, as opposed to correlated motion, which would induce
artifactual activation at the brain surface. In addition to the
average movement statistics traditionally reported, the present
study included between-group statistics for stimulus-correlated
noise, maximum excursion, and root mean square jitter. Groups
were well-matched across these measures. Also, a subset of 28
subjects where movement was more closely matched showed that
significance of signal and noise effects was maintained even with
the reduced power that resulted from removing subjects. The lack

Fig. 7. Noise simulation. (A) Activation map for a typical child subject, no noise added, noise level = 0.98%, (B) activation map for a typical adult subject, no
noise added, noise level = 0.38%, (C and D) activation maps for same adult subject with the addition of randomly distributed noise. For simulations, noise was
added to 168 preprocessed functional volume files spanning the scan and models were re-run, resulting in two new data sets differing only in noise levels. (C)
Adult subject, total noise level = 1.04%, (D) adult subject, total noise level = 2.03%. Similar extent in panels A and C, most closely matched for noise level,
shows remarkable consistency in activation when noise is held constant between groups.
M.E. Thomason et al. / NeuroImage 25 (2005) 824–837834
of motion-related differences is not unexpected, given the use of
head stabilization with a bite bar and image realignment. A third
possibility is that physiological contributions from vascular
pulsatility and breathing-related magnetic field changes are
greater for children than adults. Changes in magnetic field in
the brain due to movement of lungs and diaphragm can cause
additional noise in EPI or spiral imaging (Van de Moortele et al.,
2002). Children consistently demonstrate higher respiration rates,
heart rates, and variability in heart rate, which may add to the
residual variance in their BOLD time series. However, our
measurements of inspiration showed that children take smaller
breaths than adults, and since children are systematically smaller
than adults, these breathing-related physiological noise effects
were expected to be lower, not higher for children.
The present study suggests that when making direct
comparisons between adults and children in BOLD fMRI certain
cautions may need to be exercised. Comparisons are facilitated
by the remarkable similarity in activation patterns across brain
regions during BH. Regional differences are consistent across
groups, suggesting a similar distribution of response to BH
across cortical and subcortical regions. However, this study
provides evidence that hemodynamic responsiveness, upon which
the BOLD signal is reliant, has relatively more variability, or
noise, in children. Further, noise estimates are consistent within a
subject across scans (data not shown). Significant differences in
noise between groups during BH suggest that direct comparisons
made between adults and children using fMRI need to measure
noise as well as signal in both groups to determine equivalence
of variance. It may not be sufficient to consider only activation
volumes or BOLD signal change. Moreover, test statistics are
reliant upon correction for between-group differences in variance,
where assumptions of equal variance between groups are not
met. If basal metabolic and other physiological noise is greater
for one group, then studies and analyses should be designed in
consideration of this feature. For example, a signal amplitude
map as well as a map of time series standard deviation, in
addition to a conventional t map, may be useful in comparing
groups that have different noise features. Additionally, recruiting
additional child subjects in studies of development, or increasing
N, will likely combat the reduction in power introduced by
noise, but comparative statistics still need to take the noise
differences into account. Alternatively, noise quantification may
be used to determine the appropriate age-related thresholds for
the detection of activation (Gaillard et al., 2000). Because noise
cannot be modeled, or therefore removed from the data, this
approach may be the best way to weaken its impact on
interpretation of results.
Potential methodological limitations of the present study
include the observation that hemodynamic response to BH can
be complicated by individual subject differences in performance
M.E. Thomason et al. / NeuroImage 25 (2005) 824–837 835
of the BH maneuver. Although we measured inspiration levels,
this measure is not sensitive to potential differences in the
internal posturing of the muscles that contributes to aspects of the
BH response like intrathoracic pressure. However, inclusion of
large groups of subjects by fMRI standards reduces the likelihood
that individual differences in strategy interfered with our
between-group findings. In addition, our data (Table 1) and
clinical practice show no evidence that BH strategy differs
between children and adults. In fact, clinical tests of heart
dysfunction for both children and adults are routinely accom-
plished using the Valsalva maneuver, which involves expiratory
effort against a closed glottis, that in turn increases pressure
within the thoracic cavity and thereby impedes venous return of
blood to the heart. The response in these groups is similar enough
that this procedure is a medically established standard for
determining heart damage for both groups. Also, the timing of
the BH task maneuver between our groups was similar, as
demonstrated by the temporal analysis of respiration traces,
increasing our confidence in similarity in performance between
our groups.
Finally, this study suggests that a BH task may be useful for
calibration between groups of different developmental ages,
between patients and healthy volunteers in clinical studies,
between centers in multi-site studies, and within individual
subjects with regional injury or isolated brain damage. Calibration
is essential because it is possible that fMRI effects reported
between groups do not reflect differences in neural activity, but
instead reflect differences in the vascular response to neural
events. Differences in microvascular anatomy and baseline
cerebral blood volume could contribute to between-group differ-
ences that may be mistakenly interpreted as the effect of neural
differences (Chugani et al., 1987; Gaillard et al., 2001; Martin
and Marcar, 2001). Differences in neurovascular response may
occlude, or spuriously pronounce, the measured timing and
location of neural activity for all persons by the simple fact that
all brains differ slightly, and some more significantly than others
from group averages.
Acknowledgments
The authors thank Pamela Schraedley-Desmond, Sue Gabrieli,
Yuqing Gong, and Brian J. Lichtenstein for helpful discussions and
technical assistance, our study participants, and funding support
from NIH Grants MH-61426 and RR-09784.
References
Adleman, N., Menon, V., Blasey, C., White, C., Warsofsky, I., Glover, G.,
Reiss, A., 2002. A developmental fMRI study of the stroop color-word
task. NeuroImage 16, 61–75.
Bandettini, P.A., Wong, E.C., 1997. A hypercapnia-based normalization
method for improved spatial localization of human brain activation with
fMRI. NMR Biomed. 10, 197–203.
Bandettini, P.A., Wong, E.C., Hinks, R.S., Tikofsky, R.S., Hyde, J.S., 1992.
Time course EPI of human brain function during task activation. Magn.
Reson. Med. 25, 390–397.
Benes, F.M., Turtle, M., Khan, Y., Farol, P., 1994. Myelination of a key
relay zone in the hippocampal formation occurs in the human brain
during childhood, adolescence, and adulthood. Arch. Gen. Psychiatry
51, 477–484.
Booth, J.R., Macwhinney, B., Thulborn, K.R., Sacco, K., Voyvodic, J.,
Feldman, H.M., 1999. Functional organization of activation patterns in
children: whole brain fMRI imaging during three different cognitive
tasks. Prog. Neuro-Psychopharmacol. Biol. Psychiatry 23, 669–682.
Booth, J.R., Burman, D.D., Meyer, J.R., Lei, Z., Trommer, B.L.,
Davenport, N.D., Li, W., Parrish, T.B., Gitelman, D.R., Mesulam,
M.M., 2003. Neural development of selective attention and response
inhibition. NeuroImage 20, 737–751.
Buckner, R.L., Snyder, A.Z., Sanders, A.L., Raichle, M.E., Morris, J.C.,
2000. Functional brain imaging of young, nondemented, and demented
older adults. J. Cogn. Neurosci. 12 (Suppl. 2), 24–34.
Bunge, S., Dudukovic, N., Thomason, M., Vaidya, C., Gabrieli, J., 2002.
Immature frontal lobe contributions to cognitive control in children:
evidence from fMRI. Neuron 33, 301–311.
Casey, B., 2002. Windows into the human brain. Science 296, 1408–1409.
Casey, B., Cohen, J., Jezzard, P., Turner, R., Noll, D., Trainor, R., Giedd, J.,
Kaysen, D., Hertz-Pannier, L., Rapoport, J., 1995. Activation of
prefrontal cortex in children during a nonspatial working memory task
with functional MRI. NeuroImage 2, 221–229.
Casey, B.J., Trainor, R., Giedd, J., Vauss, Y., Vaituzis, C.K., Hamburger, S.,
Kozuch, P., Rapoport, J.L., 1997. The role of the anterior cingulate in
automatic and controlled processes: a developmental neuroanatomical
study. Dev. Psychobiol. 30, 61–69.
Chugani, H.T., Phelps, M.E., Mazziotta, J.C., 1987. Positron emission
tomography study of human brain functional development. Ann.
Neurol. 22, 487–497.
Corfield, D.R., Murphy, K., Josephs, O., Adams, L., Turner, R., 2001. Does
hypercapnia-induced cerebral vasodilation modulate the hemodynamic
response to neural activation? NeuroImage 13, 1207–1211.
Davis, T.L., Kwong, K.K., Weisskoff, R.M., Rosen, B.R., 1998. Calibrated
functional MRI: mapping the dynamics of oxidative metabolism. Proc.
Natl. Acad. Sci. U. S. A. 95, 1834–1839.
D’Esposito, M., Zarahn, E., Aguirre, G.K., Rypma, B., 1999. The effect of
normal aging on the coupling of neural activity to the bold
hemodynamic response. NeuroImage 10 (1), 6–14.
Gaillard, W.D., Hertz-Pannier, L., Mott, S.H., Barnett, A.S., LeBihan, D.,
Theodore, W.H., 2000. Functional anatomy of cognitive development:
fMRI of verbal fluency in children and adults. Neurology 54, 180–185.
Gaillard, W.D., Grandin, C.B., Xu, B., 2001. Developmental aspects of
pediatric fMRI: considerations for image acquisition, analysis, and
interpretation. NeuroImage 13, 239–249.
Gasser, T., Verleger, R., Bacher, P., Sroka, L., 1988. Development of the
EEG of school-age children and adolescents: I. Analysis of band power.
Electroencephalogr. Clin. Neurophysiol. 69, 91–99.
Glover, G., Law, C., 2001. Spiral-in/out BOLD fMRI for increased SNR
and reduced susceptibility artifacts. Magn. Reson. Med. 46, 515–522.
Heeger, D.J., Huk, A.C., Geisler, W.S., Albrecht, D.G., 2000. Spikes versus
BOLD: what does neuroimaging tell us about neuronal activity? Nat.
Neurosci. 3, 631–633.
Kang, H.C., Burgund, E.D., Lugar, H.M., Petersen, S.E., Schlaggar, B.L.,
2003. Comparison of functional activation foci in children and adults
using a common stereotactic space. NeuroImage 19, 16–28.
Kastrup, A., Dichgans, J., Niemeier, M., Schabet, M., 1998a. Changes
of cerebrovascular CO2 reactivity during normal aging. Stroke 29,
1311–1314.
Kastrup, A., Li, T.Q., Takahashi, A., Glover, G.H., Moseley, M.E., 1998b.
Functional magnetic resonance imaging of regional cerebral blood
oxygenation changes during breath holding. Stroke 29, 2641–2645.
Kastrup, A., Kruger, G., Glover, G.H., Moseley, M.E., 1999a. Assessment
of cerebral oxidative metabolism with breath holding and fMRI. Magn.
Reson. Med. 42, 608–611.
Kastrup, A., Kruger, G., Glover, G.H., Neumann-Haefelin, T., Moseley,
M.E., 1999b. Regional variability of cerebral blood oxygenation
response to hypercapnia. NeuroImage 10, 675–681.
Kastrup, A., Li, T.Q., Glover, G.H., Moseley, M.E., 1999c. Cerebral blood
flow-related signal changes during breath-holding. Am. J. Neuroradiol.
20, 1233–1238.
M.E. Thomason et al. / NeuroImage 25 (2005) 824–837836
Kastrup, A., Kruger, G., Neumann-Haefelin, T., Moseley, M.E., 2001.
Assessment of cerebrovascular reactivity with functional magnetic
resonance imaging: comparison of CO(2) and breath holding. Magn.
Reson. Imaging 19, 13–20.
Kastrup, A., Kruger, G., Neumann-Haefelin, T., Glover, G.H., Moseley,
M.E., 2002. Changes of cerebral blood flow, oxygenation, and
oxidative metabolism during graded motor activation. NeuroImage
15, 74–82.
Kim, D., Adalsteinsson, E., Glover, G., Spielman, D., 2002. Regularized
higher-order in vivo shimming. Man. Reson. Med. 48, 715–722.
Kimoto, H., Ohno, T., Takashima, S., Hirano, S., Ozaki, T., 1995. The
effect of acetazolamide and carbon dioxide on cerebral hemodynamic
changes on near-infrared spectroscopy in young rabbits. Brain Dev. 17,
261–263.
Klingberg, T., Vaidya, C., Gabrieli, J., Moseley, M., Hedehus, M., 1999.
Myelination and organization of the frontal white matter in children: a
diffusion tensor MRI study. NeuroReport 10, 2817–2821.
Klingberg, T., Forssberg, H., Westerberg, H., 2002. Increased brain
activity in frontal and parietal cortex underlies the development of
visuospatial working memory capacity during childhood. J. Cogn.
Neurosci. 14, 1–10.
Kruger, G., Glover, G.H., 2001. Physiological noise in oxygenation-
sensitive magnetic resonance imaging. Magn. Reson. Med. 46,
631–637.
Kwong, K.K., Belliveau, J.W., Chesler, D.A., Goldberg, I.E., Weisskoff,
R.M., Poncelet, B.P., Kennedy, D.N., Hoppel, B.E., Cohen, M.S.,
Turner, R., et al., 1992. Dynamic magnetic resonance imaging of human
brain activity during primary sensory stimulation. Proc. Natl. Acad. Sci.
U. S. A. 89, 5675–5679.
Li, T.Q., Kastrup, A., Takahashi, A.M., Moseley, M.E., 1999a. Functional
MRI of human brain during breath holding by BOLD and FAIR
techniques. NeuroImage 9, 243–249.
Li, T.Q., Moseley, M.E., Glover, G., 1999b. A FAIR study of motor cortex
activation under normo- and hypercapnia induced by breath challenge.
NeuroImage 10, 562–569.
Liu, H.L., Huang, J.C., Wu, C.T., Hsu, Y.Y., 2002. Detectability of blood
oxygenation level-dependent signal changes during short breath hold
duration. Magn. Reson. Imaging 20, 643–648.
Logothetis, N.K., 2002. The neural basis of the blood-oxygen-level-
dependent functional magnetic resonance imaging signal. Philos Trans.
R. Soc. Lond., Ser. B Biol. Sci. 357, 1003–1037.
Luna, B., Thulborn, K., Munoz, D., Merriam, E., Garver, K., Minshew, N.,
Keshavan, M., Genovese, C., Eddy, W., Sweeney, J., 2001. Maturation
of widely distributed brain function subserves cognitive development.
NeuroImage 13, 786–793.
Martin, E., Marcar, V.L., 2001. Functional MR imaging in pediatrics.
Magn. Reson. Imaging Clin. N. Am. 9, 231–246, ix–x.
Moses, P., Roe, K., Buxton, R., Wong, E., Frank, L., Stiles, J., 2002.
Functional MRI of global and local processing in children. NeuroImage
16, 415–424.
Muzik, O., Chugani, D., Juhasz, C., Shen, C., Chugani, H., 2000. Statistical
parametric mapping: assessment of application in children. NeuroImage
12, 538–549.
Nakada, K., Yoshida, D., Fukumoto, M., Yoshida, S., 2001. Chronological
analysis of physiological T2* signal change in the cerebrum during
breath holding. J. Magn. Reson. Imaging 13, 344–351.
Nelson, C.A., Monk, C.S., Lin, J., Carver, L.J., Thomas, K.M., Truwit,
C.L., 2000. Functional neuroanatomy of spatial working memory in
children. Dev. Psychol. 36, 109–116.
Ogawa, S., Tank, D.W., Menon, R., Ellermann, J.M., Kim, S.G., Merkle,
H., Ugurbil, K., 1992. Intrinsic signal changes accompanying sensory
stimulation: functional brain mapping with magnetic resonance
imaging. Proc. Natl. Acad. Sci. U. S. A. 89, 5951–5955.
Paus, T., Zijdenbos, A., Worsley, K., Collins, D., Blumenthal, J., Giedd,
J., Rapoport, J., Evans, A., 1999. Structural maturation of neural
pathways in children and adolescents: in vivo study. Science 283,
1908–1911.
Poldrack, R.A., Pare-Blagoev, E.J., Grant, P.E., 2002. Pediatric functional
magnetic resonance imaging: progress and challenges. Top. Magn.
Reson. Imaging 13, 61–70.
Preston, A.R., Thomason, M.E., Ochsner, K.N., Cooper, J.C., Glover, G.H.,
2004. Comparison of spiral-in/out and spiral-out BOLD fMRI at 1.5
and 3 T. NeuroImage 21, 291–301.
Reich, T., Rusinek, H., 1989. Cerebral cortical and white matter reactivity
to carbon dioxide. Stroke 20, 453–457.
Richter, W., Richter, M., 2003. The shape of the fMRI BOLD response in
children and adults changes systematically with age. NeuroImage 20,
1122–1131.
Riecker, A., Grodd, W., Klose, U., Schulz, J., Groschel, K., Erb, M.,
Ackermann, H., Kastrup, A., 2003. Relation between regional func-
tional MRI activation and vascular reactivity to carbon dioxide during
normal aging. J. Cereb. Blood Flow Metab. 23, 565–573.
Roland, P., 1993. Brain Activation. Wiley-Liss, New York.
Rubia, K., Overmeyer, S., Taylor, E., Brammer, M., Williams, S.C.,
Simmons, A., Andrew, C., Bullmore, E.T., 2000. Functional frontalisa-
tion with age: mapping neurodevelopmental trajectories with fMRI.
Neurosci. Biobehav. Rev. 24, 13–19.
Sachs, B.C., Gaillard, W.D., 2003. Organization of language networks in
children: functional magnetic resonance imaging studies. Curr. Neurol.
Neurosci. Rep. 3, 157–162.
Schlaggar, B., Brown, T., Lugar, H., Visscher, K., Miezin, F., Petersen, S.,
2002. Functional neuroanatomical differences between adults and
school-age children in the processing of single words. Science 296,
1476–1479.
Shiino, A., Morita, Y., Tsuji, A., Maeda, K., Ito, R., Furukawa, A.,
Matsuda, M., Inubushi, T., 2003. Estimation of cerebral perfusion
reserve by blood oxygenation level-dependent imaging: comparison
with single-photon emission computed tomography. J. Cereb. Blood
Flow Metab. 23, 121–135.
Sowell, E.R., Thompson, P.M., Holmes, C.J., Jernigan, T.L., Toga, A.W.,
1999. In vivo evidence for post-adolescent brain maturation in frontal
and striatal regions. Nat. Neurosci. 2, 859–861.
Sowell, E.R., Trauner, D.A., Gamst, A., Jernigan, T.L., 2002. Develop-
ment of cortical and subcortical brain structures in childhood and
adolescence: a structural MRI study. Dev. Med. Child Neurol. 44,
4–16.
Stiles, J., Moses, P., Passarotti, A., Dick, F.K., Buxton, R., 2003. Exploring
developmental change in the neural bases of higher cognitive functions:
the promise of functional magnetic resonance imaging. Dev. Neuro-
psychol. 24, 641–668.
Thomas, K.M., King, S.W., Franzen, P.L., Welsh, T.F., Berkowitz, A.L.,
Noll, D.C., Birmaher, V., Casey, B.J., 1999. A developmental
functional MRI study of spatial working memory. NeuroImage 10,
327–338.
Thomason, M.E., Foland, L., Glover, G.H., 1999. Calibration of fMRI
activation for the FIRST BIRN project. Paper presented at: ISMRM
12th Annual Meeting (Kyoto, Japan).
Turkeltaub, P.E., Gareau, L., Flowers, D.L., Zeffiro, T.A., Eden, G.F.,
2003. Development of neural mechanisms for reading. Nat. Neurosci.
6, 767–773.
Van de Moortele, P.F., Pfeuffer, J., Glover, G.H., Ugurbil, K., Hu, X., 2002.
Respiration-induced B0 fluctuations and their spatial distribution in the
human brain at 7 Tesla. Magn. Reson. Med. 47, 888–895.
Wada, M., Ogawa, T., Sonoda, H., Sato, K., 1996. Development of relative
power contribution ratio of the EEG in normal children: a multivariate
autoregressive modeling approach. Electroencephalogr. Clin. Neuro-
physiol. 98, 69–75.
Wenger, K.K., Visscher, K.M., Miezin, F.M., Petersen, S.E., Schlaggar,
B.L., 2004. Comparison of sustained and transient activity in children
and adults using a mixed blocked/event-related fMRI design. Neuro-
Image 22, 975–985.
Wilke, M., Holland, S.K., 2003. Variability of gray and white matter during
normal development: a voxel-based MRI analysis. NeuroReport 14,
1887–1890.

M.E. Thomason et al. / NeuroImage 25 (2005) 824–837 837
Worsley, K.J., Liao, C.H., Aston, J., Petre, V., Duncan, G.H., Morales, F.,
Evans, A.C., 2002. A general statistical analysis for fMRI data.
NeuroImage 15, 1–15.
Yakovlev, P.I., Lecours, A.R., 1967. The myelogenetic cycles of regional
maturation of the brain. In: Minkowski, A. (Ed.), Regional Develop-
ment of the Brain in Early Life. Davis, Philadelphia, pp. 3–70.
Yamaguchi, F., Meyer, J.S., Yamamoto, M., Sakai, F., Shaw, T., 1980.
Noninvasive regional cerebral blood flow measurements in dementia.
Arch. Neurol. 37, 410–418.
Yamamoto, M., Meyer, J.S., Sakai, F., Yamaguchi, F., 1980. Aging and
cerebral vasodilator responses to hypercarbia: responses in normal aging
and in persons with risk factors for stroke. Arch. Neurol. 37, 489–496.