breed effect on quality veal production in mountain areas ... · breed effect on quality veal...
TRANSCRIPT

�������� ����� ��
Breed effect on quality veal production in mountain areas: Emphasis on meatfatty acid composition
Noelia Aldai, Paz Lavın, John K.G. Kramer, Raquel Jaroso, Angel R.Mantecon
PII: S0309-1740(12)00236-7DOI: doi: 10.1016/j.meatsci.2012.06.024Reference: MESC 5768
To appear in: Meat Science
Received date: 19 January 2012Revised date: 12 June 2012Accepted date: 13 June 2012
Please cite this article as: Aldai, N., Lavın, P., Kramer, J.K.G., Jaroso, R. & Mantecon,A.R., Breed effect on quality veal production in mountain areas: Emphasis on meat fattyacid composition, Meat Science (2012), doi: 10.1016/j.meatsci.2012.06.024
This is a PDF file of an unedited manuscript that has been accepted for publication.As a service to our customers we are providing this early version of the manuscript.The manuscript will undergo copyediting, typesetting, and review of the resulting proofbefore it is published in its final form. Please note that during the production processerrors may be discovered which could affect the content, and all legal disclaimers thatapply to the journal pertain.

ACC
EPTE
D M
ANU
SCR
IPT
ACCEPTED MANUSCRIPT
1
Breed effect on quality veal production in mountain areas: emphasis on meat fatty acid
composition
Noelia Aldai1*
, Paz Lavín2, John K.G. Kramer
3, Raquel Jaroso
2, Angel R. Mantecón
2
1Food Science and Technology, Faculty of Pharmacy, Universidad del País Vasco/Euskal
Herriko Unibertsitatea, 01006 Vitoria-Gasteiz, Spain; 2Instituto de Ganadería de Montaña,
CSIC-ULE, Finca Marzanas, 24346 Grulleros, León, Spain; 3Guelph Food Research Centre,
Agriculture & Agri-Food Canada, Guelph, ON, Canada.
*Corresponding autor: N. Aldai ([email protected]; [email protected])

ACC
EPTE
D M
ANU
SCR
IPT
ACCEPTED MANUSCRIPT
2
ABSTRACT
This study was designed to compare the quality of veal produced from ‘Tudanca x Charolais’
cross (n=6) and Limousin (n=6) breeds when allowed to feed freely on mountain pastures and
suckle naturally from birth to 7 months of age. After 80 days of age calves also had access to
concentrate (maximum of 3 Kg/day), while mothers did not. At slaughter, Limousin calves
were heavier (P<0.01) and provided better carcass yield (P<0.05) and conformation
(P<0.001) than Tudanca calves. Tudanca beef provided higher fat content (P<0.05) was less
tough (P<0.05), and was scored as more tender and juicy (P<0.1) with higher acceptability
than Limousin beef (P<0.1). In general, Tudanca had a better fatty acid profile than Limousin
beef, especially in terms of the content of polyunsaturated (P<0.05), long-chain
polyunsaturated fatty acids (P<0.05) and their n-6/n-3 ratios (P<0.1), as well as vaccenic acid
(P<0.1) and the overall trans-18:1 isomer profile.
Key Words: carcass traits, fatty acids, meat quality, trans, ‘Tudanca’, veal.

ACC
EPTE
D M
ANU
SCR
IPT
ACCEPTED MANUSCRIPT
3
1. Introduction
Mountain areas of northern Spain are traditionally dedicated to beef production
utilizing mostly local breeds, including crossbred animals (Vieira, García, Cerdeño, &
Mantecón, 2005; Bispo et al., 2011; Humada, Serrano, Sañudo, Rolland, & Dugan, 2011;
Lavín, Jaroso, Palencia, & Mantecón, 2011a). Such a production system meets a number of
expectations in terms of sustainability and multifunctionality in rural areas. The most
common beef production system in this mountain region (steep topography; between 520-580
m above sea level; longitude -4º 51’, latitude 43º 25’) is centered on calf production and
farmers then selling them to bigger feedlots for final intensive-fattening and
commercialization; calves are generally 8-9 months of age at slaughter. According to recent
findings (Lavín, Jaroso, Palencia, & Mantecón, 2011b) it was concluded that this system did
not provide local farmers with significant economic benefits, and therefore it was decided to
evaluate an alternative system. The alternative production system focused on producing veal
locally instead of calves for intensive fattening. Calves would be reared outdoors on local
pastures and suckled naturally by their mothers from birth to 6-7 months of age, and were
subsequently slaughtered.
It is known that breed or genotype and production system are determinant factors of the
carcass and meat quality (Piedrafita et al., 2003; Vieira et al., 2005; Martínez et al., 2010),
and these will also affect the fatty acid composition of the meat (Aldai et al., 2006, 2011). In
order to test the present local production system and evaluate the quality of the meat, two
breeds were investigated reared under the same mountain pasture conditions to evaluate the
quality of the final beef produced. The study included a local cross (‘Tudanca x Charolais’)
and a foreign breed that has been well-adapted to the area (Limousin). These two breeds have
different maternal traits (personal communication).
ACC
EPTE
D M
ANU
SCR
IPT
ACCEPTED MANUSCRIPT
4
Economical comparisons associated with raising each breed under this local production
system have been reported elsewhere (Lavín et al., 2011b). In the present study a comparison
was undertaken of the carcass (i.e., EU classification) and meat quality (i.e., colour,
tenderness, and sensory analysis) characteristics with special emphasis of fatty acid (FA) in
meat having nutritional implications.
2. Materials and methods
2.1. Animals, management and diet composition
Twelve male calves from ‘Tudanca x Charolais’ cross (n = 6) and Limousin (n = 6)
were studied. From birth (March-April 2010), calves were naturally suckled by their mothers
in mountain areas of Cantabria (Nansa Valey, northern Spain). The major botanic species in
the fields were Lolium perenne, Agrostis capillaris and Trifolium repens. After an average of
79.3±1.55 days of age calves received ad libitum access to concentrate up to a maximum of 3
Kg/day/head, while mothers did not have access to concentrate (only access to pasture).
The concentrate meal was composed approximately by 40 % corn meal, 45 % barley
meal, 10 % soya meal, 2 % fat, 3 % minerals, vitamins and oligoelements. Samples were
analyzed for dry matter (DM; ISO, 1999), ash (ISO, 2002), and crude protein (CP; ISO,
2005). Ether extract (EE) was determined using the Ankom filter bag technology (American
Oil Chemists’ Society Official Procedure Am 5-04; AOCS, 2008) while the fatty acid
composition was determined using a direct transesterification procedure as detailed by Alves,
Cabrita, Fonseca, & Bessa (2008). Therefore, on DM basis, chemical composition of the
concentrate was as follows: 16.2 % CP, 6.7 % ash, and 3.9 % EE, while the percentages of
major FAs were as follows: 18 % 16:0, 2.1 % 18:0, 20 % 9c-18:1, 50 % 18:2n-6, and 3.3 %
18:3n-3.
ACC
EPTE
D M
ANU
SCR
IPT
ACCEPTED MANUSCRIPT
5
Calves were slaughtered in October at an average age of 7 months. At this point the
calves were subjectively inspected to see whether they reached an adequate conformation and
degree of fat cover. Live weight at slaughter (LWS) was recorded.
2.2. Carcass measurements and sample collection
Slaughtering was performed in a commercial abattoir according to standard procedures.
After dressing, carcasses were chilled at 2 ºC for 24 hours (h). Twenty-four h post-mortem,
cold carcass weight (Kg) and length (cm) were recorded. The carcass yield (%) was
calculated based on LWS and cold carcass weight, while carcass compactness was calculated
based on carcass weight and length as described in De Boer, Dumont, Pomeroy, & Weniger
(1974). Carcasses were classified by visual assessment on conformation and fat cover degree
by a trained and experienced evaluator. For conformation, development of carcass profiles
was taken into consideration according to SEUROP classification (S: super, E: excellent, U:
very good, R: good, O: fair, P: poor), and for fat cover degree the amount of fat on the
outside of the carcass and in the thoracic cavity using a classification range from 1 to 5 (1:
low, 2: slight, 3: average, 4: high, 5: very high; (OJEC, 1981a,b). Each level of both scales
(conformation and fat cover) was subdivided in 3 sub-classes (i.e., conformation: R+, R, R−
and fat cover: 3+, 3, 3−) to a transformed scale ranging from 1 to 18 for conformation (18
being the best conformation) and from 1 to 15 for fat cover (15 being the thickest fat cover).
Carcass pH (penetration portable pHMeter, Metrohm®, Switzerland) and colour (portable
Minolta® CM2002, Konica-Minolta Sensing, Inc., Germany) were also measured on the left
half carcass at 24 h post-mortem. Two pH measurements were taken in the longissimus
thoracis et lumborum muscle (LTL; 3rd
lumbar vertebrae). Colour (D65 illuminant and 10º
standard observer; L*, brightness; a*, red-green axis; b*, yellow-blue axis; Commission
Internationale de l’Eclairage, 1978) was measured at the pectoralis profundus muscle and
subcutaneous fat (6th
to 10th
rib area) with 3 measurements per tissue.

ACC
EPTE
D M
ANU
SCR
IPT
ACCEPTED MANUSCRIPT
6
After 5 days of ageing at 2 ºC in the abattoir cooler, commercial carcass fabrication was
performed and the percent of boxed beef (i.e., saleable meat) calculated relative to the cold
carcass weight. At 11 days post-mortem, the rib joint between the 5th
to the 9th
ribs of the left
half carcass was cut and transported to the laboratory for further analyses.
2.3. Meat quality
Drip loss was determined (Hönikel, 1998) on the first steak of the LTL muscle of the
rib joint. Approximately two 50 g samples of raw meat were sampled from the 5th
rib and
weighed. The two portions were placed within a container with a supporting mesh that was
then sealed in order to avoid water evaporation. After a period of 72 h at 4 ºC, the samples
were weighed again to determine water loss, and that weight difference was expressed as the
percentage of the initial weight. From the second steak (LTL muscle), colour measurements
were recorded after exposing the muscle to atmospheric oxygen for 20 min and using the
equipment and procedure described above. Then, the LT was ground and freeze-dried, and
percentages of moisture, EE, CP and ash were determined using standard procedures
described in section 2.1 as per feedstuff. A subsample of 15-20 g of freeze-dried meat was
stored at -80 ºC for subsequent FA determination.
From the last LTL portion three steaks of approximately 2 cm thickness were cut. The
first steak was used to determine shear force in cooked meat according to the Warner-Bratzler
test (Hönikel, 1997). Sensory analysis was performed using the other two steaks with an
eight-member trained panel who evaluated the samples for odour intensity, tenderness,
juiciness, flavour intensity, and overall acceptability (5-point scale). Details regarding shear
force, including equipment description and sensory analysis have been previously described
by Vieira, Cerdeño, Serrano, Lavín, & Mantecón (2007).
2.4. Fatty acid analysis

ACC
EPTE
D M
ANU
SCR
IPT
ACCEPTED MANUSCRIPT
7
Lipids were extracted from 1g of freeze-dried muscle using a mixture of chloroform -
methanol (1:1, v/v) (Kramer et al., 1998). Details of this procedure have been published
elsewhere (Aldai, Dugan, Rolland, & Kramer, 2009). Lipid aliquots (~10 mg) from each
steak were methylated separately using acidic (methanolic HCl) and basic (sodium
methoxide) reagents to ensure complete methylation of all lipids and avoid isomerisation of
conjugated linoleic acids (CLAs), respectively (Aldai, Murray, Nájera, Troy, & Osoro, 2005;
Kramer, Hernandez, Cruz-Hernandez, Kraft, & Dugan, 2008). For quantitative purposes, 1
mL of internal standard (1 mg / mL of 23:0 methyl ester, N-23-M from Nu-Chek Prep Inc.,
Elysian, MN, USA) was added prior to methylation. The contents of fatty acid methyl esters
(FAMEs) were expressed as mg per 100 g of fresh meat, and as percentage (%) of total
FAME quantified.
The FAMEs were analyzed using a gas chromatograph equipped with a flame
ionization detector (Agilent Technologies, Model 7890A, Wilmington, DE, USA) and an
automatic injector (Agilent Technologies, Model 7693 Autosampler). The FAMEs, including
the trans-18:1 isomers, were analyzed using a 100 m SP-2560 column (Supelco, Bellefonte,
PA, USA) and two complementary gas chromatography (GC) temperature programs
plateauing at 175 ºC and 150 ºC (Kramer et al., 2008) and a split ratio of 50:1. The CLA
isomers were separated and identified using a 100 m SLB-IL111 ionic liquid stationary phase
column (Supelco, Bellefonte, PA, USA) as described by Delmonte et al. (2011). On the ionic
liquid column the FAMEs were injected using a 20:1 split ratio and the following temperature
program: 168 ºC for 40 min, increased 6 ºC / min to 185 ºC, and maintained for 35 min. With
both columns hydrogen was used as carrier gas with a flow rate of 1 mL / min, and the
injector and detector temperatures were set at 250 ºC.
For identification of the FAMEs, reference standards #463 and #603, individual FAMEs
21:0 and 23:0, and CLA mixture #UC-59M (9c,11t-/8t,10c-/11c,13t-/10t,12c-/8c,10c-/9c,11c-

ACC
EPTE
D M
ANU
SCR
IPT
ACCEPTED MANUSCRIPT
8
/10c,12c-/11c,13c-/11t,13t-/10t,12t-/9t,11t-/8t,10t-18:2 isomers) were used, all obtained from
Nu-Chek Prep Inc. (Elysian, MN, USA). Branched-chain FAs (BCFA) were identified using
a bacterial FAME mixture purchased from Matreya (Pleasant Gap, PA, USA). Many of the
trans-18:1 and CLA isomers, not included in the standard mixtures, were identified by their
retention times and elution orders as reported in the literature (Cruz-Hernandez et al., 2004;
Cruz-Hernandez et al., 2006; Kramer et al., 2008; Alves & Bessa, 2009; Rego et al., 2009;
Delmonte et al., 2011). In general, only FAMEs representing over 0.05 % of the total FAME
content were included in the Tables and Figures, except for CLA that includes all quantified
isomers.
2.5. Statistical analysis
The statistical analysis was conducted using SPSS 19 for Windows (SPSS Inc., IBM
Corporation, NY, USA). One-way ANOVA analysis was applied to test differences between
breeds (‘Tudanca x Charolais’ cross, Limousin) for all variables studied. Significance was
declared at P<0.05 and trend was declared at P<0.1.
For abbreviation purposes, the ‘Tudanca x Charolais’ cross is referred to simply as
‘Tudanca’ throughout the text.
3. Results
3.1. Carcass measurements
At the time of slaughter (7 months of age), calves from the Limousin breed were
heavier (318 Kg) than those from Tudanca cross (256 Kg; P<0.01; Table 1). After harvest
and 24 h post-mortem, significant differences were also found in carcass weight (P<0.01),
yield (P<0.05) and compactness (P=0.001) with Limousin calves showing higher values,
while the carcass length of the two breeds was similar (P>0.05). Calves from the Limousin
breed had better conformation according to the EU classification system (P<0.001) while the
degree of fat cover was similar in both breeds (Table 1).
ACC
EPTE
D M
ANU
SCR
IPT
ACCEPTED MANUSCRIPT
9
The pH and colour measurements taken on the carcasses at 24 h post-mortem, showed
only few significant differences between the two breeds. The pH values measured in the LTL
muscle of the two genotypes were not statistically different (P>0.05). Pectoralis profundus
muscle was significantly lighter (L* = 42.5) and tended to have greater redness (a* value =
14.6) in Limousin carcasses compared to Tudanca carcasses (L* = 36.3, P<0.01 and a* =
13.2, P<0.1), while no differences were found in yellowness (P>0.05). In terms of backfat
colour, however, Tudanca presented greater redness (a* = 4.1) in comparison to Limousin
carcasses (a* = 1.88; P=0.001), while no differences were found in other colour parameters
(Table 1).
3.2. Meat quality
Carcasses from both breeds showed similar boxed beef (average of 78.6 %) and drip
loss percentages (average of 2.12 %; Table 2). After 11 days of ageing, Tudanca calves
presented a LTL muscle with darker colour (P<0.001), and increased redness (P=0.001), but
decreased yellowness (P<0.05) in comparison to Limousin calves (Table 2).
In general, there were no significant differences in chemical composition of the meat
except for fat content (EE, P<0.05). Tudanca contained 2.46 % fat compared to 1.44 % in
Limousin meat. According to Warner-Bratzler shear force values, beef obtained from the
Limousin breed was tougher (P<0.05) and had significantly less odour intensity (P<0.05) in
comparison to Tudanca meat. Tudanca beef was tended to be judged (P<0.1) as more tender,
juicier, more flavourful and more acceptable than Limousin beef (Table 2).
3.3. Fatty acid composition of intramuscular fat
Beef obtained from Tudanca calves had significantly greater amount of total FAMEs
per 100 g of fresh meat (Table 3) than in Limousin. In absolute amount all FAs (individual
and groups reported in Table 3) were significantly higher in Tudanca beef with few
exceptions. Two of the calculated ratios (n-6/n-3, P/S) were higher (P<0.1) in Limousin beef.

ACC
EPTE
D M
ANU
SCR
IPT
ACCEPTED MANUSCRIPT
10
In addition, the 10t-18:1 isomer tended to be greater in Limousin (11.3 mg / 100 g meat) than
in Tudanca beef (7.2 mg / 100 g meat, P<0.1) and the 11t-18:1 isomer (vaccenic acid, VA),
tended to be greater in Tudanca (57 mg / 100 g meat) than in Limousin beef (28 mg / 100 g
meat; P < 0.1). No significant differences (P>0.05) were found in the content of arachidonic
acid (20:4n-6, ArA), docosahexaenoic acid (22:6n-3, DHA), and total CLA (Table 3). Most
of the total CLA consisted of rumenic acid (RA, 9c,11t-18:2), which represented over 76 %
of the total CLA with no significant differences between breeds (P>0.05).
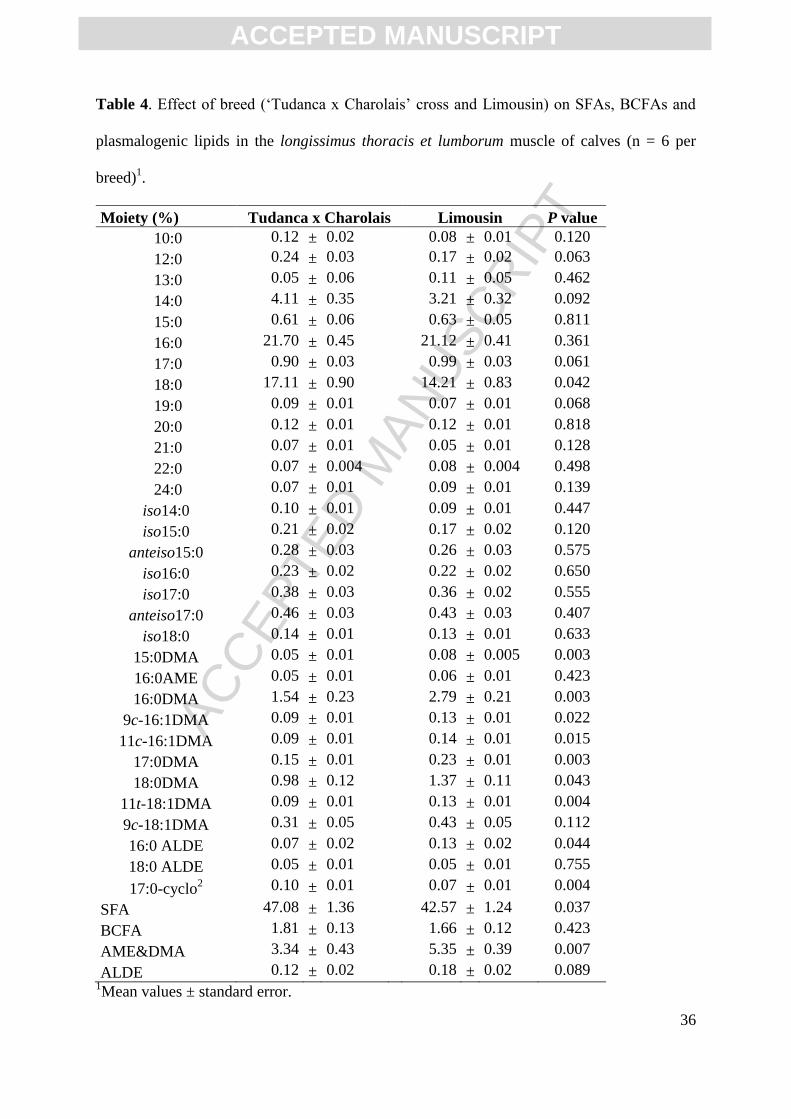
When the results were expressed on a percentage basis (Table 4), not many significant
differences were observed except for plasmalogenic lipids, identified mostly as their
dimetylacetals (DMA) after methylation. Meat from Limousin calves showed a greater
relative abundance of total and individual DMAs, while the sum of saturated FAs (SFA) was
significantly higher in Tudanca (47 %) in comparison to Limousin beef (43 %, P<0.05). This
was mainly influenced by the significantly higher level of 18:0 in Tudanca (17 %) than in
Limousin meat (14 %) (P<0.05). There were no differences in the level of BCFAs between
the two breeds.
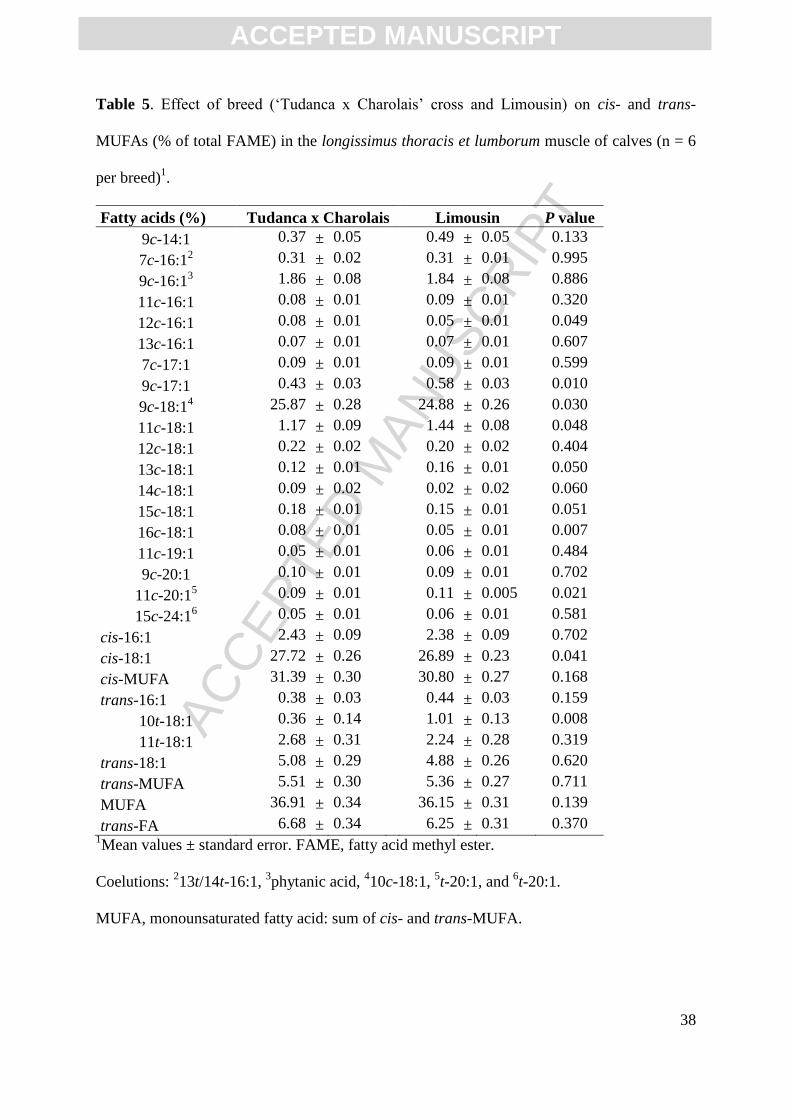
The relative abundance of total monounsaturated FAs (MUFA) expressed as percent
were not statistically different between the two breeds (Table 5). Significant differences were
only found for the total cis-18:1 (P<0.05) and several individual cis-MUFA like 12c-16:1
(P<0.05), 9c-17:1 (P=0.01), 9c-18:1 (P<0.05), 11c-18:1 (P<0.05), 16c-18:1 (P<0.01) and
11c-20:1 (P<0.05). This compared to the trans isomers that showed no significant differences
between breeds either in total trans-MUFA, or total trans-16:1 and trans-18:1 (Table 5). The
relative abundance of all the trans-18:1 isomers to total trans-18:1 are shown in Figure 1.
Several differences were found. Interestingly, 10t-18:1 was significantly lower (P<0.01) in
Tudanca compared to the Limousin breed. Moreover, 6t/7t/8t-18:1 also tended to be lower in

ACC
EPTE
D M
ANU
SCR
IPT
ACCEPTED MANUSCRIPT
11
Tudanca, while other isomers like 12t- (P<0.05), 13t/14t- (P<0.01), 15t- and 16t- 18:1 were
significantly or numerically higher in Tudanca.
The polyunsaturated FAs (PUFA), long-chain PUFAs (20-to-22 carbon FAs; LC-
PUFA), CLAs and non-conjugated 18:2 acids (NC-18:2) are presented in Table 6. In general,
total PUFA and LC-PUFA were significantly higher (P<0.05) in Limousin compared to
Tudanca beef. All n-6 PUFAs were significantly higher (P<0.05) in Limousin compared to
Tudanca, except for 18:3n-6, 20:2n-6, 22:2n-6 and 22:4n-6 (P>0.05). Within the n-3 PUFA
group, docosapentaenoic acid (22:5n-3, DPA) was significantly higher in Limousin (P<0.05),
while DHA (22:6n-3) only tended to be higher (P<0.1). No significant breed differences
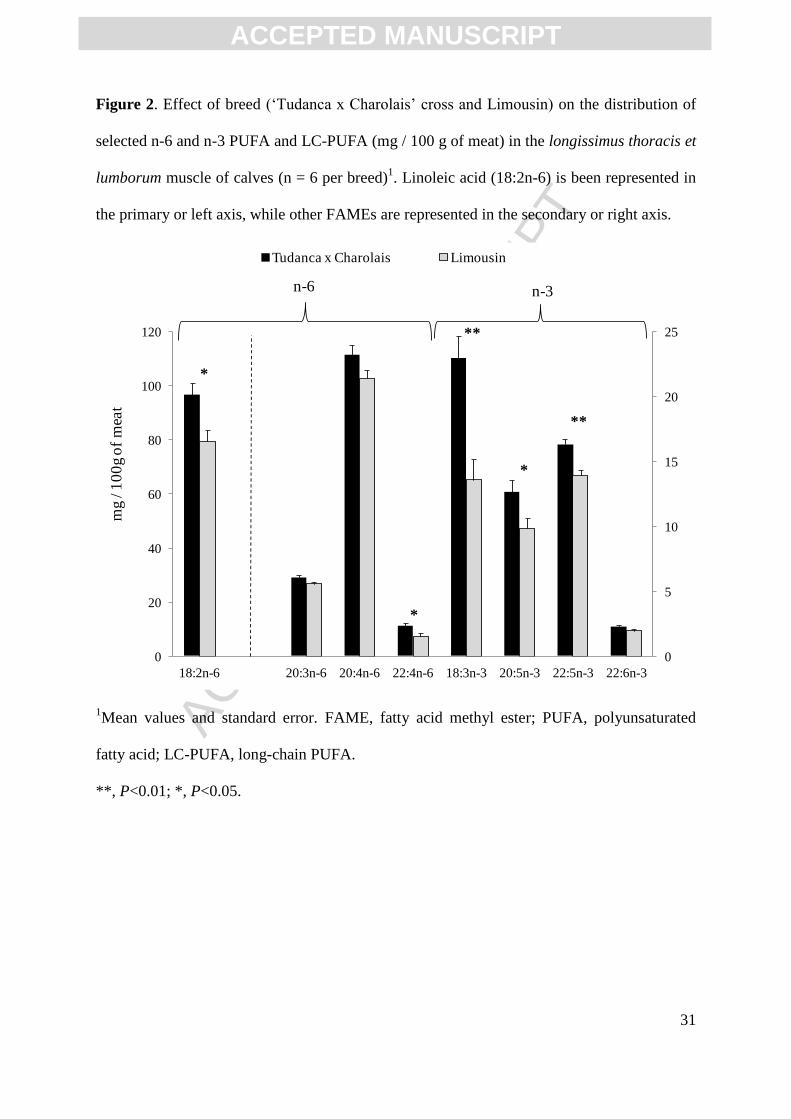
were found for linolenic (LNA) and eicosapentaenoic (EPA) acids (P>0.05). In Figure 2,
absolute amounts of selected PUFAs and LC-PUFAs are compared between the two breeds.
In general, all n-6 and n-3 PUFA and LC-PUFAs were either numerically or statistically
higher in Tudanca compared to Limousin breed.
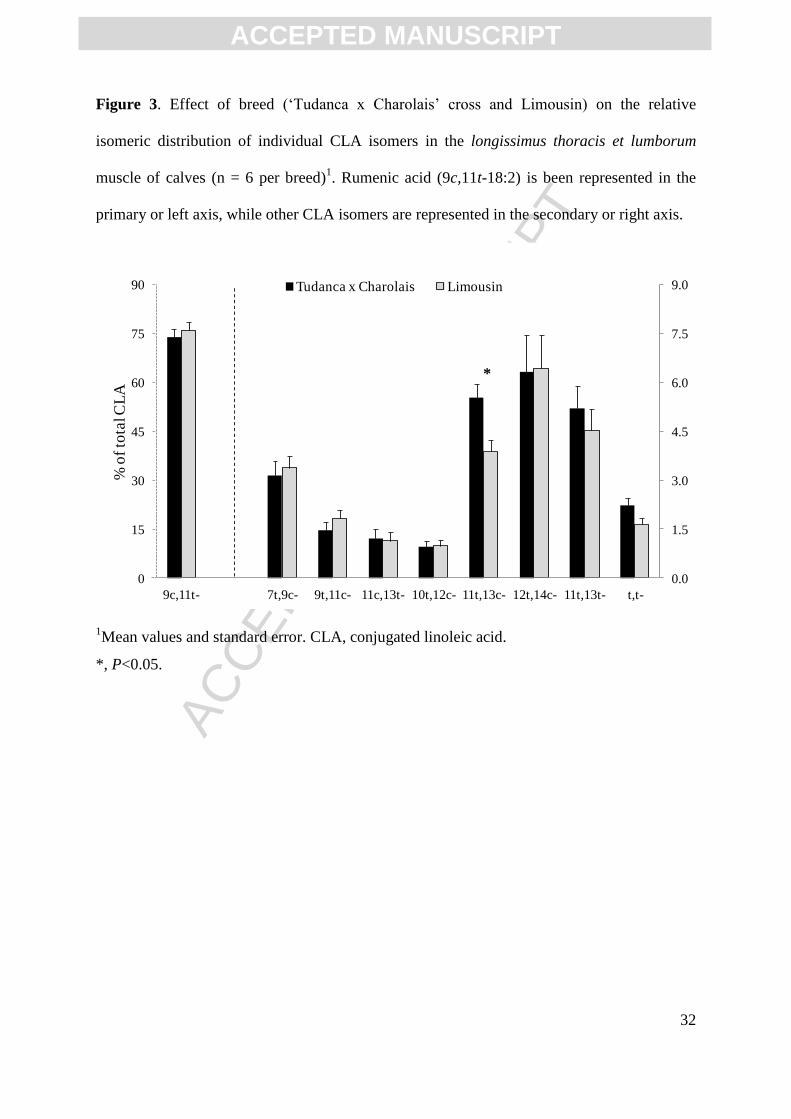
There were no significant differences in total CLA content (1.3 to 1.4 %; Table 6),
and only one isomer (11t,13c-) was significantly different between breeds when representing
the individual isomers relative to total CLA (Figure 3). Although not significant, the relative
abundance of most c/t –CLA isomers tended to be higher in Limousin, while the t/t –CLA
isomers tended to be more abundant in the Tudanca.
4. Discussion
To understand how different breeds behave under the same management conditions
and to choose the most advantageous from a profitability and nutritional standpoint is
extremely important when providing advice to producers in rural and mountain areas. In these
regions, calf production under intensive fattening will require special facilities and a larger
herd size. On the other hand, utilizing natural milking, local pastures and partial
supplementation of concentrate to produce veal directly was shown to be a more economical
ACC
EPTE
D M
ANU
SCR
IPT
ACCEPTED MANUSCRIPT
12
option (Lavín et al., 2011b). If it is also accompanied by an improved meat quality it could
provide an added benefit to local beef producers and consumers. This study was initiated
based on a previous observation of breed differences in profitability when conducted under a
direct meat production system.
The present results showed that Limousin breed had better carcass characteristics
attributed mainly to the higher LWS at the selected age of slaughter (7 months) compared to
Tudanca. This confirmed earlier studies that compared rustic or local breeds to genetically
more improved beef cattle breeds (Piedrafita et al., 2003; Aldai et al., 2006, 2007). There was
increased interest in the current study to evaluate the hitherto untested Tudanca breed that
was crossed with Charolais, which potentially provided the calves with improved growth and
good daily live weight gains.
The pH values of the LTL muscle of both breeds at 24h were not statistically different
(Table 1), but the slightly lower pH values of Limousin carcasses could be related to carcass
size and, therefore, slower temperature decreases with the subsequent more rapid metabolism.
The slight darkening observed in Tudanca meat (pectoralis profundus) could be related to a
lower extent of pH decline as previously reported by others (Aalhus, Janz, Tong, Jones, &
Robertson, 2001) but the speed or the kinetics of pH were not measured in the present study.
Unfortunately, carcass pH and colour were not measured in the same muscle.
After 11 days of ageing (Table 2), LTL muscle from Tudanca carcasses were less bright than
muscle obtained from Limousin carcasses. For a similar fat cover degree, Tudanca calves
have more intramuscular fat than the Limousin calves which could imply that the processes
of fat tissue distributions were different. The higher fat content in Tudanca calves could have
been related to increased number and size of adipocytes compared to Limousin calves as
shown by Mendizabal et al. (1999) for other Spanish cattle breeds. The higher intramuscular
fat content might explain the smaller shear force values obtained in Tudanca compared to

ACC
EPTE
D M
ANU
SCR
IPT
ACCEPTED MANUSCRIPT
13
Limousin beef. The increase in fat would dilute the relative protein content in meat, thereby
lowering the bulk density. In addition, the fat within the connective tissue could reduce the
force required to cut the meat although several studies (Smith et al., 1985) have reported
inconsistent results when linking fat content and texture / shear force. Apart from the fat
content, an explanation for the tougher meat obtained from Limousin calves is not
immediately apparent since the chilling rates were not fast enough to induce cold-shortening.
Interestingly, Smulders, Marsh, Swartz, Russell, & Hoenecke (1990) and Marsh, Ringkob,
Russell, Swartz, & Pagel (1987) have shown tenderness to be related to the rate of glycolysis,
and independent of the rate of chilling, which might have been the case in the present study.
The lubrication effect of marbling relies upon higher fat levels in marbled meat that
stimulates salivation giving the perception of increased juiciness of meat whilst chewing.
This is in agreement with earlier studies that found different fat levels play an important role
in juiciness and acceptability (Cross, Berry, & Wells, 1980; Savell et al., 1989), which may
have been the reason why Tudanca veal tended to show improved sensory scores (Table 2).
In contrast, Dikeman (1987) reviewed the literature on the relationship between marbling and
tenderness and reported that marbling accounted for only 5 % to 10 % of the variability in
beef palatability. In another extensive study, Wheeler, Cundiff and Koch (1994) evaluated
1667 steers and heifers and concluded that marbling explained at most 5% of the variation in
palatability traits.
The content and composition of specific FAs in meats has generally been an important
factor in assessing its nutritional quality. Of particular interest has been the type of trans FAs
present (Leheska et al., 2008; Aldai et al., 2009), the content of LC-PUFAs specifically EPA
and DHA, the type and amount of CLA, and the level of SFAs. Each will be discussed in turn
between these two breeds. The higher intramuscular fat content in Tudanca compared to the
Limousin (Table 3) affected the comparisons of all FAs (De Smet, Raes, & Demeyer, 2004),

ACC
EPTE
D M
ANU
SCR
IPT
ACCEPTED MANUSCRIPT
14
and for that reason both, the amount of selected FAs (or FA groups) per serving size (100 g
of meat), as well as their relative compositions, are presented. The FA composition of the
meat in this study could have been the result of cow’s milk composition, the supplement
available to the calves after 80 days of age, and any subsequent metabolism or synthesis of
dietary FAs in the calves. In fact, Lavín et al. (2011a) showed that Limousin calves consumed
significantly higher amounts of concentrate (346 Kg/head) over the period from 80 days to 7
months when concentrate was available to the calves than the Tudanca calves (253 Kg/head)
over the same time period.
It is well known that during the early stage of development the reticular groove in
calves is normally closed, delivering suckled milk directly into the abomasum bypassing the
rumen (Ørskov, Benzie, & Kay, 1970; Hornick, Clinquart, Van Eenaeme, Diez, & Istasse,
1996). We hypothesize that would, in part, explain the presence of trans FAs in veal since the
calves derived their complete diet during the initial suckling period from the cow’s milk.
Among the trans-FAs, VA (11t-18:1) would have been the predominant trans-18:1 isomer in
the milk because the dams of both breeds were exclusively pasture-fed with no access to
concentrate at any time. And, in the absence of a fully functioning rumen in the calves, the
FA composition of cow’s milk would not be expected to be altered by rumen bacteria. After
80 days of age, all calves had free access to concentrate that provided them with dietary
18:2n-6 and 18:3n-3 from the barley and soybean meal and oil in the diet. These PUFAs
could be converted to either 11t- and/or 10t-18:1 in the developing rumen of the calves,
depending on the amount of concentrate consumed. A 10t- shift, also expressed as a lower
11t-/10t-18:1 ratio, is well recognized when barley based diets are fed to ruminants because
of its content of rapidly fermentable starch (Dugan et al., 2007; Aldai et al., 2010;
Mohammed et al., 2010). Increased dietary PUFA are known to exacerbate the 10t- shift
(Griinari et al., 1998; Cruz-Hernandez et al., 2007). The content of 10t-18:1 isomer tended to
ACC
EPTE
D M
ANU
SCR
IPT
ACCEPTED MANUSCRIPT
15
be higher in Limousin compared to Tudanca meat when expressed as mg / 100 g of meat
(Table 3), and that difference was significant when expressed in terms of relative percent
(Figure 1). The higher level of 10t-18:1 was consistent with the greater consumption of
concentrate by Limousin calves. The increased consumption of concentrate by the Limousin
calves could have been a consequence of the lower milk production of their dams compared
to Tudanca dams (personal communication). Moreover, Limousin calves were also larger in
size. Tudanca calves were smaller in size (breed-related) and the milk production of their
dams was greater decreasing their need for additional energy (Lavín et al., 2011a), which was
also observed with other northern Spanish breeds (e.g., Galician Blonde; Bispo et al., 2011).
As a consequence, it could be hypothesized that Limousin calves would probably had a more
developed rumen at the time of slaughter compared to Tudanca calves because of their higher
consumption of concentrate and PUFAs. This would also explain the trend to higher level of
10t-18:1 (Figure 1, Table 3), lower 11t-/10t-18:1 ratio (Table 3), and higher ratios of n-6/n-3
PUFA and P/S (Table 3) compared to Tudanca beef (Table 3, Figure 1).
There were also differences in the relative amounts of several of the other trans-18:1
isomers. In Tudanca veal 11t-, 12t-, 13t/14t-, 15t- and 16t-18:1 were either numerically or
statistically higher than in Limousin meat, while 6t/7t/8t-, 9t- and 10t-18:1 were higher in
Limousin meat (Figure 1). At this time it is not possible to assess the health implication of
each of all the individual trans-18:1 isomers apart from VA (11t-18:1), the major trans-18:1
isomer in both meats (Gebauer, Psota, & Kris-Etherton, 2007; Field, Blewett, Proctor, &
Vine, 2009). For example, VA has been shown to suppress the development of premalignant
lesions in rat mammary gland (Banni et al., 2001), and produce a hypocholesterolaemic
effects in rabbits (Bauchart et al., 2007). It has been well established that the other trans-18:1
isomers are associated with negative health effects (Mensink, Zock, Kester, & Katan, 2003).
Therefore, in view of our current understanding of the health effects of trans FAs, though

ACC
EPTE
D M
ANU
SCR
IPT
ACCEPTED MANUSCRIPT
16
incomplete, one could conclude that the meat with the highest absolute quantities of VA and
least absolute quantities of the other trans-18:1 isomers should be considered healthier.
It was interesting to note that neither the absolute nor the relative content of RA
(9c11t-18:2) or total CLA were significantly different between these two breeds (Table 3 and
6). However, Tudanca meat had numerically, and occasionally significantly higher levels of
NC-18:2 metabolites compared to the Limousin breed, whether expressed on an absolute
(Table 3) and relative basis (Table 6). Jerónimo et al. (2011) recently showed that trans
containing metabolites found in ruminants are preferentially incorporated into neutral lipids,
which explains why there is little difference whether the results are presented as absolute or
relative percent. Tudanca veal also provided significantly higher contents of recognized
metabolites of LNA (18:3n-3) including dienes (9c,13t-18:2; Table 6), CLA (11t,13c-18:2;
Figure 3) and monoenes (13t/14t-18:1; Figure 1). Other LNA recognized metabolites, even
not statistically significant, were also numerically higher in Tudanca meat as identified in a
number of other studies (Destaillats, Trottier, Galvez, & Angers, 2005; Bessa et al., 2007;
Nassu et al., 2011). Potential health effects of all these new metabolites required further
investigation (Dugan, Aldai, Aalhus, Rolland, & Kramer, 2011).
An evaluation of meats for its content of essential FA should involve an assessment of
both the absolute and relative amounts of the n-6 and n-3 PUFAs and the LC-PUFA
metabolites derived from 18:2n-6 and 18:3n-3 (Gebauer, Harris, Kris-Etherton, & Etherton,
2005). The n-3 LC-PUFAs are of special interest because of the limited conversion of 18:3n-
3 to 22:6n-3 in humans (Barcelo-Coblijn & Murphy 2009), and the need to find alternate
sources of n-3 LC-PUFAs other than marine products because of increased demand,
decreasing availability, and concern about contamination (Hibbeln et al., 2007; Brunner,
Jones, Friel, & Bartley, 2009). In general, the content of n-3 PUFAs in beef meat is low even
when they are pasture-fed that is high in 18:3n-3 (De Smet et al., 2004; Scollan et al., 2006),
ACC
EPTE
D M
ANU
SCR
IPT
ACCEPTED MANUSCRIPT
17
because of extensive rumen biohydrogenation (Harfoot & Hazlewood, 1997). However, the
results of this study showed that the content of total n-3 PUFAs, 18:3n-3, and the n-3 LC-
PUFA 20:5n-3 and 22:5n-3 in the meat was significantly higher in the Tudanca compared to
the Limousin breed, except for 22:6n-3 (Table 3). This breed difference in the n-3 FAs
content of meat, except 22:6n-3, were unlikely due to the concentrate available to both
calves, since it was not particularly high in 18:3n-3 (3.3 %; 2.1. section). In fact, Limousin
calves who consumed more concentrate (Lavín et al., 2011a) still had less 18:3n-3 in their
meat compared to Tudanca calves (Table 3). This would support the hypothesis that these
breed differences could be primarily due to differences in milk consumption and its fat
composition, which was the main source of food for these calves. Perhaps a bigger
substitution effect of concentrates in Limousin calves could have been another reason to
explain a higher L* values in Limousin meat as reported by Realini, Duckett, Brito, Dalla
Rizza, & De Mattos (2004) when pasture versus concentrate fed beef was compared.
The fact that there were no differences in the content of 22:6n-3 in meat between breeds
appears to indicate that the metabolism of 18:3n-3 to 22:6n-3 was low in both, cows and
calves. It is difficult to assess whether there are differences in the de novo desaturation and
chain elongation of 18:3n-3 between these two breeds that could have contributed to
differences in the n-3 LC-PUFA in meat, since Tudanca had a significantly higher FAME
content than Limousin beef (2039 mg compared to 1191 mg per 100 g meat; Table 3). A
comparison of 18:3n-3 and its long-chain metabolites shows that all of them were
significantly higher in 100 g of Tudanca than in Limousin veal (Figure 2). However, the
quantitative ratio of n-3 LC-PUFA to 18:3n-3 is greater in Limousin (1.9) than in Tudanca
(1.4) (Table 3), which would suggest a higher conversion rate of 18:3n-3 to n-3 LC-PUFA in
Limousin than in Tudanca, provided none of the n-3 LC-PUFA were diet derived. When the
FAs were expressed as percent of total FAMEs, the reverse trend was evident (Table 6).
ACC
EPTE
D M
ANU
SCR
IPT
ACCEPTED MANUSCRIPT
18
Higher levels of fat in meats are generally due to increased levels of neutral rather than
phospholipids, while LC-PUFAs are mainly associated with the phospholipid fraction in beef
muscle (Fritsche, Rumsey, Yurawecz, Ku, & Fritsche, 2001). This would explain the
decreases in the relative proportion of the LC-PUFAs in Tudanca meat when expressed on a
percentage basis (Table 6).
Similar breed differences were observed when 18:2n-6 and the n-6 LC-PUFAs were
compared. Tudanca veal tended to have higher levels of these FAs in 100 g of meat than were
found in Limousin veal (Figure 2), but those differences were smaller when these FAs were
expressed as percent of total FAMEs (Table 6). The n-6/n-3 PUFA and LC-PUFA ratios were
generally lower in Tudanca compared to Limousin meat (Table 3). Therefore, based on the
amount of n-3 LC-PUFA and their n-6/n-3 in the meats, the Tudanca appears to provide a
meat with a healthier FA profile. On the other hand, the Limousin breed, known for their high
muscle and low adipocyte cells, had a lower content of LC-PUFA compared to the Tudanca
both in absolute (Table 3) and relative amount (Figure 2), which appears to be related to the
lower total fat content in that breed. The age of the animals could also be a factor that might
explain the low LC-PUFA content in the calves. Potential differences between calves and
mature animals in terms of adipocity, muscle density, desaturation and elongation capacity,
and final FA profile of meat was previously demonstrated between Limousin and several
other beef cattle breeds (Mendizabal et al., 1999; Kraft, Kramer, Schoene, Chambers, &
Jahreis, 2008). To establish differences in the de novo desaturation and chain elongation
between these calves would require an assessment of the conversion of the two essential FA
families by the Δ6- and Δ
5-elongases.
The fat in meat from ruminants is known to be high in SFA, but it also has a wider
range of different chain length FAs compared to other meats (Woods & Fearon, 2009). Since
the individual SFA cause different serum lipid responses (Mensink et al., 2003), the

ACC
EPTE
D M
ANU
SCR
IPT
ACCEPTED MANUSCRIPT
19
composition of SFAs needs to be considered as well as their interaction with other dietary
FAs. For instance, the main SFA in veal was 16:0 that has generally been implicated in
increasing total and low density lipoprotein cholesterol concentrations. However, it was
shown that this effect was reversed in the presence of an adequate supply of 18:2n-6 in the
human diet (Clandinin, Cook, Konrad, & French, 2000). Furthermore, 18:0 that comprises
about one third of the SFAs in calf meats (33 % in Tudanca and 36 % in Limousin), is a FA
known to lower total cholesterol and show a favorable total : HDL cholesterol ratio (Mensink
et al., 2003). The high content of 18:0 in these meats appears to be related to the high
consumption of milk by the calves from cows that were solely pasture-fed (Enser et al.,
1998). Tudanca cows produce more milk than Limousin cows, and are thus able to provide
their calves with more milk. The higher milk consumption would also be consistent with the
backfat color in Tudanca carcasses possibly due to the carotenoid pigments from the milk
obtained from the pasture-fed cows (Yang, Larsen, & Tume, 1992).
Meat has additional minor lipid components such as the BCFAs. Higher levels of
BCFAs typically result when readily fermentable carbohydrate sources are available, causing
an increase in propionate production (Wood, 1984). It seemed that the level of concentrate
ingested by the animals in the present study was not enough to provide differences in the
BCFA percentages (Table 4). The plasmalogenic lipids are also minor lipid constituents
present in beef. Previous results reported that the Limousin breed studied under intensive
feeding conditions showed the highest relative percent of plasmalogenic lipid among the four
breeds examined, but not on an absolute basis (Kraft et al., 2008). In the current study, veal
from the Limousin breed did not show higher levels of plasmalogenic lipids on absolute bases
(Table 3), but the difference was significant when expressed in relative amounts (Table 4).
Differences on the percent basis would be expected since plasmalogens occur primarily as
phospholipids (Horrocks, 1972), and the lean Limousin meat would be higher in these polar
ACC
EPTE
D M
ANU
SCR
IPT
ACCEPTED MANUSCRIPT
20
lipids. The results of this study also showed the presence of trans double bonds in the
aldehyde moiety of the plasmalogenic lipids, evidenced by the presence of 11t-18:1 DMA
(Table 4). These findings are consistent with those reported by Wolff (2002), and later
confirmed by Kraft et al. (2008) and Aldai et al. (2011).
When assessing the overall nutritional value of meat, health regulatory agencies are
recognizing that there are inherent limitations when only specific FAs or FA groups are
considered in developing dietary recommendations (FAO, 2010). FAs with unique biological
properties and health effects also need to be assessed in terms of the energy intake of
individuals, and their relationship to the whole diet consumed. In the case of these veal
products, this includes the physical properties of the meat discussed above, and other
nutrients not assessed such as protein quality and the mineral content. For instance, it is
evident that one serving size of 100 g of fresh meat alone does not meet the recommended
intake of 5-8 % of daily energy for n-6 and 1-2 % of energy for n-3 PUFA (FAO/WHO,
2003; Gebauer et al., 2005). However, veal contributes to the total n-6 (about 120 mg) and n-
3 PUFA content (about 40 mg), and more importantly to the n-6 (about 30 mg) and n-3 LC-
PUFA content (about 20 mg). Furthermore, veal from both breeds have a favorable balance
of total n-6 to n-3 PUFAs of less than 2.8, and an n-6/n-3 LC-PUFA ratio of less than 1.2
(Table 3), which is below the recommended ratio of 5:1 or 3:1. But in each assessment,
Tudanca veal provided more of these essential FAs than Limousin veal and a slightly better
ratio.
Currently the trans issue is of special concern. Most regulatory agencies have
excluded ruminant meat or dairy products from mandatory labeling of the trans FA content
based on the absence of a negative response for VA (11t-18:1) and RA (9c,11t-18:2) to
changes in serum lipoproteins (Department of Health and Human Services, U.S. Food and
Drug Administration. 2003; Department of Health, 2003; Health Canada, 2006).

ACC
EPTE
D M
ANU
SCR
IPT
ACCEPTED MANUSCRIPT
21
Furthermore, there is an assumption that the main trans-18:1 isomer in ruminant fats is VA
and the major CLA isomer is RA, and both of these FAs have reported beneficial effects
(Gebauer et al., 2007; Field et al., 2009). However, this assumption may not be valid under
some feeding practices when ruminants are fed high concentrate diets (Dugan et al., 2007;
Leheska et al., 2008; Aldai et al., 2009). If total trans from ruminant fats would need to be
declared per serving size, the total trans would be 138 mg and 75 mg for Tudanca and
Limousin meat, respectively (Table 3). Even including VA, the total trans would be below
the trans regulation limits of 0.2 g per serving size in Canada and 0.5 g per serving size in the
USA.
5. Conclusions
From the present study it can be concluded that even though most carcass parameters
of Limousin calves are better, the meat obtained from Tudanca calves tend to have an
improved sensorial acceptability with a better FA profile especially in terms of the content of
highly unsaturated long-chain fatty acid metabolites, vaccenic and rumenic acids, as well as
the ratio of n-6/n-3 highly unsaturated fatty acids, and overall trans-18:1 isomer profile. In
general, meat obtained from calves under the described mountain production system, is of
high nutritional quality according to the present nutritional guidelines. Interestingly,
considering the amount of concentrate consumed by these calves (2.6 Kg/day/head Limousin
vs 2.1 Kg/day/head Tudanca cross), the price of cereals, and lack of fat cover degree
differences obtained between the studied genotypes, it might be concluded that Limousin
calves, being a late-maturing breed, could be a more suitable option if heavier carcass is the
target or meat quality parameters are not taken into consideration.
Acknowledgements

ACC
EPTE
D M
ANU
SCR
IPT
ACCEPTED MANUSCRIPT
22
This work was undertaken within the agreement between Fundación Botín and CSIC (2010)
to study and develop a beef production and commercialization system in Nansa - Peñarrubia
valley. Help provided by farmers, IGM staff and Rubén Plano from Semark AC Group S.A.
is very much appreciated. N. Aldai thanks the European Commission for the contract through
the ‘Marie Curie (SPACANBEEF, PIOF-GA-2008-220730)’ international program and the
Spanish Ministry of Science and Innovation for the recent contract through the ‘Ramón y
Cajal (RYC-2011-08593)’ program.
References
Aalhus, J. L., Janz, J. A. M., Tong, A. K. W., Jones, S. D. M., & Robertson, W. M. (2001).
The influence of chilling rate and fat cover on beef quality. Canadian Journal of Animal
Science, 81, 321-330.
Aldai, N., Dugan, M. E. R., Kramer, J. K. G., Martínez, A., López-Campos, O., Mantecón, A.
R., & Osoro, K. (2011). Length of concentrate finishing affects the fatty acid composition
of grass-fed and genetically lean beef: an emphasis on trans-18:1 and conjugated linoleic
acid profiles. Animal, 5, 1643-1652.
Aldai, N., Dugan, M. E. R., Kramer, J. K. G., Robertson, W. M., Juárez, M., & Aalhus, J. L.
(2010) Trans-18:1 and conjugated linoleic acid profiles after the inclusion of buffer,
sodium sesquicarbonate, in the concentrate of finishing steers. Meat Science, 84, 735-741.
Aldai, N., Dugan, M. E. R., Rolland, D. C., & Kramer, J. K. G. (2009). Survey of the fatty
acid composition of Canadian beef: Backfat and longissimus lumborum muscle. Canadian
Journal of Animal Science, 89, 315-329.
Aldai, N., Murray, B. E., Nájera, A. I., Troy, D. J., & Osoro, K. (2005). Review:
Derivatization of fatty acids and its application for conjugated linoleic acid studies in
ruminant meat lipids. Journal of the Science of Food and Agriculture, 85, 1073-1083.
Aldai, N., Murray, B. E., Oliván, M., Martínez, A., Troy, D. J., Osoro, K., & Nájera, A. I.
(2006). The influence of breed and mh-genotype on carcass conformation, meat physico-
chemical characteristics, and the fatty acid profile of muscle from yearling bulls. Meat
Science, 72, 486-495.
Aldai, N., Nájera, A. I., Dugan, M. E. R., Celaya, R., & Osoro, K. (2007). Characterisation of
intramuscular, intermuscular and subcutaneous adipose tissues in yearling bulls of
different genetic groups. Meat Science, 76, 682-691.
ACC
EPTE
D M
ANU
SCR
IPT
ACCEPTED MANUSCRIPT
23
Alves, S. P., & Bessa, R. J. B. (2009). Comparison of two gas-liquid chromatograph columns
for the analysis of fatty acids in ruminant meat. Journal of Chromatography A, 1216,
5130-5139.
Alves, S. P., Cabrita, A. R. J., Fonseca, A. J. M., & Bessa, R. J. B. (2008). Improved method
for fatty acid analysis in herbage based on direct trasesterification followed by solid-phase
extraction. Journal of Chromatography A, 1209, 212-219.
AOCS (2008). Official Methods and Recommended Practices of the American Oil Chemists’
Society. 5th ed. AOCS, Urbana, IL.
Banni, S., Angioni, E., Murru, E., Carta, G., Melis, M. P., Bauman, D., Dong, Y., & Ip, C.
(2001). Vaccenic acid feeding increases tissue levels of conjugated linoleic acid and
suppresses development of premalignant lesions in rat mammary gland. Nutrition and
Cancer, 41, 91-97.
Barceló-Coblijn G., & Murphy, E. J. (2009). Alpha-linolenic acid and its conversion to
longer chain n-3 fatty acids: Benefits for human health and a role in maintaining tissue n-3
fatty acid levels. Progress in Lipid Research, 48, 355-374.
Bauchart, D., Roy, A., Lorenz, S., Chardigny, J.-M., Ferlay, A., Gruffat, D., Sébédio, J.-L.,
Chilliard, Y., & Durand, D. (2007) Butters varying in trans 18:1 and cis-9,trans-11
conjugated linoleic acid modify plasma lipoproteins in the hypercholesterolemic rabbit.
Lipids, 42, 123-133.
Bessa, R. J. B., Alves, S. P., Jerónimo, E., Alfaia, C. M., Prates, J. A. M., & Santos-Silva, J.
(2007) Effect of lipid supplements on ruminal biohydrogenation intermediates and muscle
fatty acids in lambs. European Journal of Lipid Science and Technology, 109, 868-878.
Bispo, E., Moreno, T., Thomas, A., Durand, D., Monserrat, L., González, L., & Bauchart, D.
(2011). Effects of weaning and finishing feeding treatment on fatty acids, especially cis
and trans C18:1 isomers, in the Longissimus thoracis muscle of Galician Blond calves.
Animal, 5, 802-812.
Brunner, E. J., Jones, P. J. S, Friel, S., & Bartley, M. (2009). Fish, human health and marine
ecosystem health: policies in collision. International Journal of Epidemiology, 38, 93-100.
Clandinin, M. T., Cook, S. L., Konrad, S. D., & French, M. A. (2000). The effect of palmitic
acid on lipoprotein cholesterol levels. International Journal of Food Science and
Nutrition, 51, S61-S71.
Commission Internationale de l’Eclairage (1978). Recommendations on uniform color spaces
– color difference equations – psychometric color terms (CIE publication no. 15 (E-
1.3.3)1971/(TC-1.3), supplement no. 2, pp. 8-12). Paris, France.
Cross, H., Berry, B., & Wells, L. (1980). Effects of fat level and source on the chemical,
sensory and cooking properties of ground beef patties. Journal of Food Science, 45, 791-
794.

ACC
EPTE
D M
ANU
SCR
IPT
ACCEPTED MANUSCRIPT
24
Cruz-Hernandez, C., Deng, Z., Zhou, J., Hill, A. R., Yurawecz, M. P., Delmonte, P.,
Mossoba, M. M., Dugan, M. E. R, & Kramer, J. K. G. (2004). Methods to analyze
conjugated linoleic acids (CLA) and trans-18:1 isomers in dairy fats using a combination
of GC, silver ion TLC-GC, and silver ion HPLC. Journal of AOAC International, 87, 545-
560.
Cruz-Hernandez, C., Kramer, J. K. G., Kennelly, J. J., Glimm, D. R., Sorensen, B. M., Okine,
E., Goonewardene, L. A., & Weselake, R. J. (2007). Evaluating the conjugated linoleic
acid and trans 18:1 isomers in milk fat of dairy cows fed increasing amounts of sunflower
oil and a constant level of fish oil. Journal of Dairy Science, 90, 3786-3801.
Cruz-Hernandez, C., Kramer, J. K. G., Kraft, J., Santercole, V., Or-Rashid, M., Deng, Z.,
Dugan, M. E. R., Delmonte, P., & Yurawecz, M. P. (2006). Systematic analysis of trans
and conjugated linoleic acids in the milk and meat of ruminants. In M. P. Yurawecz, J. K.
G. Kramer, O. Gudmundsen, M. W. Pariza, & S. Banni (Eds.), Advances in conjugated
linoleic acid research, Vol. 3 (pp. 45-93). Champaign, IL: AOCS Press.
De Boer, H., Dumont, B. L., Pomeroy, R. J., & Weniger, J. H. (1974). Manual on E.A.A.P.
reference methods for the assessment of carcass characteristics in cattle. Livestock
Production Science, 1, 151-164.
De Smet, S., Raes, K., & Demeyer, D. (2004) Meat fatty acid composition as affected by
fatness and genetic factors: a review. Animal Research, 53, 81-98.
Delmonte, P., Fardin Kia, A. R., Kramer, J. K. G., Mossoba, M. M., Sidisky, L., & Rader, J.
I. (2011). Separation characteristics of fatty acid methyl esters using SLB-IL111, a new
ionic liquid coated capillary gas chromatographic column. Journal of Chromagrography
A, 1218, 545-554.
Department of Health and Human Services, U.S. Food and Drug Administration (2003). Food
labeling; trans fatty acids in nutrition labeling; nutrient content claims, and health claims;
Final rule, July 11, 2003. Federal Register 68 (No. 133): 41434-41506.
Department of Health (2003). Regulations amending the food and drug regulations
(Nutritional labeling, nutrient content claims and health claims), Canada Gazette, Part II
(Ottawa, Canada) 137, No 1, 2-499.
Destaillats, F., Trottier, J. P., Galvez, J. M. G., & Angers, P. (2005). Analysis of α-linolenic
acid biohydrogenation intermediates in milk fat with emphasis on conjugated linolenic
acids. Journal of Dairy Science, 88, 3231-3239.
Dikeman, M. (1987). Fat reduction in animals and the effects on palatability and consumer
acceptance of meat products. Proceedings of the Reciprocal Meat Conference, 40, 93-103.
Dugan, M. E. R., Kramer, J. K. G., Robertson, W. M., Meadus, W. J., Aldai, N., & Rolland,
D. C. (2007). Comparing subcutaneous adipose tissue in beef and muskox with emphasis
on trans 18:1 and conjugated linoleic acids. Lipids, 42, 509-518.

ACC
EPTE
D M
ANU
SCR
IPT
ACCEPTED MANUSCRIPT
25
Dugan, M.E.R., Aldai, N., Aalhus, J.L., Rolland, D.C. and Kramer, J.K.G. (2011) Trans-
forming beef to provide healthier fatty acid profiles. Canadian Journal of Animal Science
(in press).
Enser, M., Hallett, K. G., Hewlett, B., Fursey, G. A. J., Wood, J. D., & Harrington, G. (1998)
Fatty acid content and composition of UK beef and lamb muscle in relation to production
system and implications for human health. Meat Science, 49, 329-341.
FAO/WHO (2003). Diet, Nutrition and the Prevention of Chronic Diseases. Report of a Joint
WHO/FAO Expert Consultation. WHO Technical Report Series 916. Geneva
(Switzerland).
FAO (2010). Fats and fatty acids in human nutrition. Report of an expert consultation. FAO
Food and Nutrition Paper 91. Food and Agriculture Organization of the United Nations,
Rome, 2010 (Italy).
Field, C. J., Blewett, H. H., Proctor, S., & Vine, D. (2009). Human health benefits of
vaccenic acid. Applied Physiology, Nutrition and Metabolism, 34, 979-991.
Fritsche, S., Rumsey, T. S., Yurawecz, M. P., Ku, Y., & Fritsche, J. (2001). Influence of
growth promoting implants on fatty acid composition including conjugated linoleic acid
isomers in beef fat. European Food Research and Technology, 212, 621-629.
Gebauer, S. K., Psota T. L., & Kris-Etherton, P. M. (2007) The diversity of health effects of
individual trans fatty acid isomers. Lipids, 42, 787-799.
Gebauer, S., Harris, W. S., Kris-Etherton, P. M., & Etherton, T. D. (2005) Dietary n-6:n-3
fatty acid ratio and health. In C. C. Akoh, & O-M. Lai (Eds.), Healthful lipids (pp. 221-
248). Champaign, IL: AOCS Press.
Griinari, J. M., Dwyer, D. A., McGuire, M. A., Bauman, D. E., Palmquist, D. L., & Nurmela,
K. V. V. (1998) Trans-octadecenoic acids and milk fat depression in lactating dairy cows.
Journal of Dairy Science, 81, 1251-1261.
Harfoot, C. G., & Hazlewood, G. P. (1997). Lipid metabolism in the rumen. In P.N. Hobson,
& C.S. Stewart (Eds.), The Rumen Microbial Ecosystem (pp. 382–426). London, UK:
Chapman & Hall.
Health Canada. 2006. Food and nutrition. TRANSforming the food supply. Report of the
Trans Fat Task Force Submitted to the Minister of Health. [Online] Available:
http://www.hcsc. gc.ca/fn-an/alt_formats/hpfb-dgpsa/pdf/nutrition/tf-gt_reprap- eng.pdf.
Hibbeln, J. R., Davis, J. M., Steer, C., Emmett, P., Rogers, I., Williams, C., & Golding, J.
(2007) Maternal seafood consumption in pregnancy and neurodevelopmental outcomes in
childhood (ALSPAC study): An observational cohort study. Lancet, 369, 578-585.
Hönikel, K. O. (1997). Reference methods supported by OECD and their use in
Mediterranean meat products. Food Chemistry, 69, 573-582.
ACC
EPTE
D M
ANU
SCR
IPT
ACCEPTED MANUSCRIPT
26
Hönikel, K. O. (1998). Reference methods for the assessment of physical characteristics of
meat. Meat Science, 49, 447-457.
Hornick, J. L., Clinquart, A., Van Eenaeme, C., Diez, M., & Istasse, L. (1996) Influence of
whole milk in diet of growing fattening Belgian Blue bulls on animal performances and on
fatty acid composition in subcutaneous, intermuscular and intramuscular fats. Livestock
Production Science, 48, 51-58.
Horrocks, L. A. (1972) Content, composition, and metabolism of mammalian and avian lipids
that contain ether groups. In F. Snyder (Ed.), Ether Lipids, Chemistry and Biology (pp.
177-272). New York: Academic Press.
Humada, M. J., Serrano, E., Sañudo, C., Rolland, D. C., & Dugan, M. E. R. (2011).
Production system and slaughter age effects on intramuscular fatty acids from youthful
Tudanca bulls. Meat Science (in press).
ISO (1999). Animal feeding stuffs—Determination of moisture and other volatile matter
content. Standard 6496:1999. International Organisation for Standardisation (ISO),
Geneva, Switzerland.
ISO (2002). Animal feeding stuffs—Determination of crude ash. Standard 5984:2002.
International Organisation for Standardisation (ISO), Geneva, Switzerland.
ISO (2005). Animal feeding stuffs—Determination of nitrogen content and calculation of
crude protein content—Part 2: Block digestion and steam distillation method. International
Standard ISO 5983-2:2005. International Organisation for Standardisation (ISO), Geneva,
Switzerland.
Jerónimo, E., Alves, S. P., Alfaia, C. M., Prates, J. A. M., Santos-Silva, J., & Bessa, R. J. B.
(2011) Biohydrogenation intermediates are differentially deposited between polar and
neutral intramuscular lipids of lambs. European Journal of Lipid Science and Technology,
113, 924-934.
Kraft, J., Kramer, J. K. G., Schoene, F., Chambers, J. R., & Jahreis, G. (2008). Extensive
analysis of long-chain polyunsaturated fatty acids, CLA, trans-18:1 isomers, and
plasmalogenic lipids in different retail beef types. Journal of Agricultural Food Chemistry,
56, 4775-4782.
Kramer, J. K. G., Hernandez, M., Cruz-Hernandez, C., Kraft, J., & Dugan, M. E. R. (2008).
Combining results of two GC separations partly achieves determination of all cis and trans
16:1, 18:1, 18:2, 18:3 and CLA isomers of milk fat as demonstrated using Ag-ion SPE
fractionation. Lipids, 43, 259-273.
Kramer, J. K. G., Sehat, N., Dugan, M. E. R., Mossoba, M. M., Yurawecz, M. P., Roach, J.
A. G., Eulitz, K., Aalhus, J. L., Schaefer, A. L., & Ku, Y. (1998). Distribution of
conjugated linoleic acid (CLA) isomers in tissue lipid classes of pigs fed a commercial
CLA mixture determined by GC and silver ion-HPLC. Lipids, 33, 549-558.

ACC
EPTE
D M
ANU
SCR
IPT
ACCEPTED MANUSCRIPT
27
Lavín, P., Jaroso, R., Palencia, P., & Mantecón, A. R. (2011a). Alternativas en la producción
de ganado vacuno de carne en zonas de montaña (Nansa-Cantabria). XVI Congreso
Internacional ANEMBE de Medicina Bovina, pp. 217-219.
Lavín, P., Jaroso, R., Palencia, P., & Mantecón, A. R. (2011b). Caracterización de las
explotaciones de ganado vacuno de carne en el Valle del Nansa (Cantabria). ITEA - AIDA,
XIV Jornadas sobre Producción Animal, Tomo I, 67-69.
Leheska, J. M., Thompson, L. D., Howe, J. C., Hentges, E., Boyce, J., Brooks, J. C., Shriver,
B., Hoover, L., & Miller, M. F. (2008). Effects of conventional and grass feeding systems
on the nutrient composition of beef. Journal of Animal Science, 88, 3575-3585.
Marsh, B. B., Ringkob, T. P., Russell, R. L., Swartz, D. R., & Pagel, L. A. (1987). Effects of
early-postmortem glycolytic rate on beef tenderness. Meat Science, 21, 241-248.
Martínez, A., Aldai, N., Celaya, R., & Osoro, K. (2010). Effect of breed body size and the
muscular hypertrophy gene in the production and carcass parameters of concentrate-
finished yearling bulls. Journal of Animal Science, 88, 1229-1239.
Mendizabal, J. A., Alberti, P., Eguinoa, P., Arana, A., Soret, B., & Purroy, A. (1999)
Adipocyte size and lipogenic enzyme activities in different adipose tissue depots in steers
of local Spanish breeds. Animal Science, 69, 115-121.
Mensink, R. P., Zock, P. L., Kester, A. D. M., & Katan, M. B. (2003) Effects of dietary fatty
acids and carbohydrates on the ratio of serum total to HDL cholesterol and on serum lipids
and apolipoproteins: A Meta-analysis of 60 Controlled Trials. American Journal of
Clinical Nutrition, 77, 1146-1155.
Mohammed, R., Kennelly, J. J., Kramer, J. K. G., Beauchemin, K. A., Stanton, C. S., &
Murphy, J. J. (2010) Effect of grain type and processing method on rumen fermentation
and milk rumenic acid production. Animal, 4, 1425-1444.
Nassu, R. T., Dugan, M. E. R., He, M. L., McAllister, T. A., Aalhus, J. L., Aldai, N., &
Kramer, J. K. G. (2011) The effects of feeding flaxseed to beef cows given forage based
diets on fatty acids of longissimus thoracis muscle and backfat. Meat Science, 89, 469-
477.
Nürnberg, K., Ender, B., Papstein, H. J.,Wegner, J., Ender, K., & Nurnberg, G. (1999).
Effects of growth and breed on the fatty acid composition of muscle lipids in cattle.
Zeitschrift für Lebensmittel-Untersuchung und Forschung, 208, 332-335.
OJEC (1981a). Council Regulation (EEC) No 1208/81 of 28 April 1981 Determining the
Community Scale for the Classification of Carcasses of Adult Bovine Animals. Official
Journal, L123, p. 3. 7.5.1981.
OJEC (1981b). Commission Regulation (EEC) No 2930/81 of 12 October 1981 Adopting
Additional Provisions for the Application of the Community Scale for the Classification of
Carcasses of Adult Bovine Animals. Official Journal, L293, p. 6. 13.10.1981.
ACC
EPTE
D M
ANU
SCR
IPT
ACCEPTED MANUSCRIPT
28
Ørskov, E. R., Benzie, D., & Kay, R. N. B. (1970) The effects of feeding procedure on
closure of the oesophageal groove in young sheep. British Journal of Nutrition, 24, 785-
795.
Piedrafita, J., Quintanilla, R., Sañudo, C., Olleta, J. L., Campo, M. M., Panea, B., Renand, G.,
Turin, F., Jabet, S., Osoro, K., Oliván, M. C., Noval, G., García, P., García, M. D., Oliver,
M. A., Gispert, M., Serra, X., Espejo, M., García, S., López, M., & Izquierdo, M. (2003).
Carcass quality of 10 beef cattle breeds of the Southwest of Europe in their typical
production systems. Livestock Production Science, 82, 1-13.
Realini, C. E., Duckett, S, K., Brito, G. W., Dalla Rizza, M., & De Mattos, D. (2004). Effect
of pasture vs. concentrate feeding with or without antioxidants on carcass characteristics,
fatty acid composition, and quality of Uruguayan beef. Meat Science, 66, 567-577.
Rego, O. A., Alves, S. P., Antunes, L. M. S., Rosa, H. J. D., Alfaia, C. F. M., Prates, J. A. M.,
Cabrita, A. R. J., Fonseca, A. J. M., & Bessa, J. B. (2009). Rumen biohydrogenation-
derived fatty acids in milk from grazing dairy cows supplemented with rapeseed,
sunflower, or linseed oils. Journal of Dairy Science, 92, 4530-4540.
Savell, J., Cross, H., Francis, J., Wise, J., Hale, D., Wilkes, D., & Smith, G. (1989). National
consumer retail beef study: Interaction of trim level, price and grade on consumer acceptance
of beef steaks and roasts. Journal of Food Quality, 12, 251-274.
Scollan, N., Hocquette, J-F., Nuernberg, K., Dannenberger, D., Richardson, I., & Moloney,
A. (2006). Innovations in beef production systems that enhance the nutritional and health
value of beef lipids and their relationship with meat quality. Meat Science, 74, 17-33.
Smith, G. C., Carpenter, Z. L., Cross, H. R., Murphey, C. E., Abraham, H. C., Savell, J. W.,
Davis, G. W., Berry, B. W., Parrish, F. C. Jr. (1985). Relationship of USDA marbling
groups to palatability of cooked beef. Journal of Food Quality, 7, 289-308.
Smulders, F. J. M., Marsh, B. B., Swartz, D. R., Russell, R. L., & Hoenecke, M. E. (1990).
Beef tenderness and sarcomere length. Meat Science, 28, 349-363.
Vieira, C., Cerdeño, A., Serrano, E., Lavín, P., & Mantecón, A. R. (2007). Breed and ageing
extent on carcass and meat quality of beef from adult steers (oxen). Livestock Science,
107, 62-69.
Vieira, C., García, M. D., Cerdeño, A., & Mantecón, A. R. (2005). Effect of diet composition
and slaughter weight on animal performance, carcass and meat quality, and fatty acid
composition in veal calves. Livestock Production Science, 93, 263-275.
Wheeler, T. L., Cundiff, L. V., & Koch, R. M. (1994). Effect of marbling degree on beef
palatability in Bos Taurus and Bos indicus cattle. Journal of Animal Science, 72, 3145-
3151.
Wolff, R. L. (2002) Characterization of trans-monounsaturated alkenyl chains in total
plasmalogens (1-O-alk-1 -enyl-2-acyl glycerophospholipids) from sheep heart. Lipids, 37,
811-816.

ACC
EPTE
D M
ANU
SCR
IPT
ACCEPTED MANUSCRIPT
29
Wood, J. D. (1984). Fat deposition and the quality of fat tissues in meat animals. In J.
Wiseman (Ed.), Fats in animal nutrition (pp. 407–436). Toronto, ON: Butterworths.
Woods, V. B., & Fearon, A. M. (2009) Dietary sources of unsaturated fatty acids for animals
and their transfer into meat, milk and eggs: A review. Livestock Science, 126, 1-20.
Yang, A., Larsen, T. W., & Tume, R. K. (1992). Carotenoid and retinol concentrations in
serum, adipose tissue and liver and carotenoid transport in sheep, goats and cattle.
Australian Journal of Agricultural Research, 43, 1809-1817.

ACC
EPTE
D M
ANU
SCR
IPT
ACCEPTED MANUSCRIPT
30
Figure 1. Effect of breed (‘Tudanca x Charolais’ cross and Limousin) on the relative
isomeric distribution of individual trans-18:1 isomers in the longissimus thoracis et
lumborum muscle of calves (n = 6 per breed)1.
0
10
20
30
40
50
60
4t- 5t- 6t/7t/8t- 9t- 10t- 11t- 12t- 13t/14t- 15t- 16t-
% o
f to
tal t
ran
s-1
8:1
Tudanca x Charolais
Limousin
**
*
**
+
+
1Mean values and standard error.
**, P<0.01; *, P<0.05; +, P<0.1.
ACC
EPTE
D M
ANU
SCR
IPT
ACCEPTED MANUSCRIPT
31
Figure 2. Effect of breed (‘Tudanca x Charolais’ cross and Limousin) on the distribution of
selected n-6 and n-3 PUFA and LC-PUFA (mg / 100 g of meat) in the longissimus thoracis et
lumborum muscle of calves (n = 6 per breed)1. Linoleic acid (18:2n-6) is been represented in
the primary or left axis, while other FAMEs are represented in the secondary or right axis.
0
5
10
15
20
25
0
20
40
60
80
100
120
18:2n-6 20:3n-6 20:4n-6 22:4n-6 18:3n-3 20:5n-3 22:5n-3 22:6n-3
mg / 1
00
g o
f m
eat
Tudanca x Charolais Limousin
*
*
n-6 n-3
**
*
**
1Mean values and standard error. FAME, fatty acid methyl ester; PUFA, polyunsaturated
fatty acid; LC-PUFA, long-chain PUFA.
**, P<0.01; *, P<0.05.
ACC
EPTE
D M
ANU
SCR
IPT
ACCEPTED MANUSCRIPT
32
Figure 3. Effect of breed (‘Tudanca x Charolais’ cross and Limousin) on the relative
isomeric distribution of individual CLA isomers in the longissimus thoracis et lumborum
muscle of calves (n = 6 per breed)1. Rumenic acid (9c,11t-18:2) is been represented in the
primary or left axis, while other CLA isomers are represented in the secondary or right axis.
0.0
1.5
3.0
4.5
6.0
7.5
9.0
0
15
30
45
60
75
90
9c,11t- 7t,9c- 9t,11c- 11c,13t- 10t,12c- 11t,13c- 12t,14c- 11t,13t- t,t-
% o
f to
tal C
LA
Tudanca x Charolais Limousin
*
1Mean values and standard error. CLA, conjugated linoleic acid.
*, P<0.05.

ACC
EPTE
D M
ANU
SCR
IPT
ACCEPTED MANUSCRIPT
33
Table 1. Effect of breed (‘Tudanca x Charolais’ cross and Limousin) on live weight at
slaughter and carcass measurements at 24 hours post-mortem of calves (n = 6 per breed)1.
Tudanca x Charolais Limousin P value
Live weight at slaughter (Kg) 255.80 ± 10.50
318.00 ± 14.53 0.009
Cold carcass weight (Kg) 144.00 ± 8.32
192.50 ± 9.52 0.005
Carcass yield (%) 56.16 ± 1.24
60.51 ± 0.69 0.011
Carcass length (cm) 106.80 ± 1.50
105.00 ± 1.84 0.480
Compactness index (Kg/cm) 1.37 ± 0.06
1.87 ± 0.07 0.001
Conformation+ 6.60 ± 0.40
10.50 ± 0.43 <0.001
Fat cover degree++
5.00 ± 0.00
4.33 ± 0.49 0.254
pH, LTL 5.68 ± 0.07
5.45 ± 0.06 0.100
L*, pectoralis profundus 36.33 ± 1.49
42.45 ± 0.94 0.002
a* 13.21 ± 0.83
14.61 ± 0.33 0.076
b* 3.99 ± 0.72
5.50 ± 0.59 0.128
L*, subcutaneous fat 69.46 ± 1.26
69.77 ± 1.12 0.856
a* 4.07 ± 0.46
1.88 ± 0.34 0.001
b* 13.26 ± 0.87 11.19 ± 1.06 0.151 1Mean values ± standard error.
LTL, longissimus thoracis et lumborum.
+ 1 to 18 scale (18 being the best conformation).
++ 1 to 15 scale (15 being the thickest fat cover).

ACC
EPTE
D M
ANU
SCR
IPT
ACCEPTED MANUSCRIPT
34
Table 2. Effect of breed (‘Tudanca x Charolais’ cross and Limousin) on boxed beef
percentage and meat quality attributes of the longissimus thoracis et lumborum muscle of
calves after 11 days of ageing (n = 6 per breed)1.
Tudanca x Charolais Limousin P value
Boxed beef (%) 77.55 ± 0.88
79.56 ± 1.03 0.161
Drip loss (%) 2.34 ± 0.33
1.90 ± 0.27 0.311
L*, LTL 43.30 ± 0.24
47.14 ± 0.59 <0.001
a* 11.99 ± 0.38
7.99 ± 0.82 0.001
b* 4.25 ± 0.22
5.25 ± 0.37 0.037
Moisture (%) 75.59 ± 0.14
75.86 ± 0.22 0.353
Ether extract (%) 2.46 ± 0.38
1.44 ± 0.11 0.022
Crude protein (%) 21.74 ± 0.34
22.19 ± 0.61 0.555
Ash (%) 1.37 ± 0.04
1.29 ± 0.03 0.201
Shear force (Kg) 3.94 ± 0.31
5.10 ± 0.30 0.026
Odour intensity+ 3.88 ± 0.07
3.59 ± 0.08 0.022
Tenderness+ 4.50 ± 0.13
4.02 ± 0.19 0.077
Juiciness+ 4.00 ± 0.23
3.38 ± 0.20 0.072
Flavour intensity+ 3.91 ± 0.03
3.77 ± 0.06 0.077
Overall acceptabilily+ 4.18 ± 0.07 3.79 ± 0.17 0.081
1Mean values ± standard error.
LTL, longissimus thoracis et lumborum.
+ Sensory parameters: a scale from 1 (low) to 5 (high) was used.

ACC
EPTE
D M
ANU
SCR
IPT
ACCEPTED MANUSCRIPT
35
Table 3. Effect of breed (‘Tudanca x Charolais’ cross and Limousin) on total FAME content
(mg / 100 g meat) and summary of FAMEs and ratios of nutritional interest (mg / 100 g meat)
in the longissimus thoracis et lumborum muscle of calves (n = 6 per breed)1.
Fatty acids (mg/100g) Tudanca x Charolais Limousin P value
FAME 2039.41 ± 185.03 1190.51 ± 168.91 0.008
SFA 971.06 ± 105.91 513.03 ± 96.68 0.011
BCFA 37.31 ± 4.71 20.39 ± 4.30 0.026
AME&DMA 64.40 ± 1.07 61.63 ± 0.97 0.088
MUFA 753.48 ± 69.70 431.64 ± 63.62 0.008
cis-MUFA 639.21 ± 56.74 367.06 ± 51.80 0.006
trans-MUFA 114.27 ± 14.00 64.59 ± 12.78 0.028
10t-18:1 7.22 ± 1.41 11.33 ± 1.28 0.059
11t-18:1 56.63 ± 9.56 27.77 ± 8.72 0.053
11t-/10t-18:1 7.64 ± 1.17 3.05 ± 1.06 0.017
PUFA 186.77 ± 6.71 150.02 ± 6.12 0.003
n-6 130.88 ± 5.01 109.75 ± 4.57 0.012
18:2n-6 96.82 ± 4.27 79.50 ± 3.90 0.015
n-3 54.83 ± 2.53 39.69 ± 2.31 0.002
18:3n-3 22.95 ± 1.71 13.58 ± 1.56 0.003
n-6/n-3 2.41 ± 0.13 2.78 ± 0.12 0.060
LC-PUFA 64.94 ± 1.97 55.69 ± 1.80 0.007
n-6 LC-PUFA 33.07 ± 0.96 29.59 ± 0.88 0.025
20:4n-6 23.23 ± 0.73 21.43 ± 0.67 0.103
n-3 LC-PUFA 31.88 ± 1.19 26.11 ± 1.09 0.006
20:5n-3 12.68 ± 0.87 9.84 ± 0.79 0.038
22:5n-3 16.30 ± 0.45 13.92 ± 0.41 0.003
22:6n-3 2.25 ± 0.14 1.97 ± 0.12 0.161
n-6/n-3 LC-PUFA 1.04 ± 0.03 1.14 ± 0.03 0.060
P/S 0.21 ± 0.04 0.31 ± 0.03 0.048
CLA 27.88 ± 5.38 17.29 ± 4.91 0.180
9c,11t-18:2 21.18 ± 4.73 13.47 ± 4.32 0.259
NC-18:2 22.11 ± 2.38 9.62 ± 2.17 0.004
trans FA 138.20 ± 16.43 75.24 ± 15.00 0.020 1Mean values ± standard error. FAME, fatty acid methyl ester; SFA, saturated fatty acid;
BCFA, branched-chain fatty acid; AME, alk-1-enyl methyl ether; DMA, dimethyl acetal;
MUFA, monounsaturated fatty acid; PUFA, polyunsaturated fatty acid; LC-PUFA, long-
chain PUFA; CLA, conjugated linoleic acid; NC-18:2, non-conjugated 18:2 acid.
See Tables 4, 5, and 6 for group details.
ACC
EPTE
D M
ANU
SCR
IPT
ACCEPTED MANUSCRIPT
36
Table 4. Effect of breed (‘Tudanca x Charolais’ cross and Limousin) on SFAs, BCFAs and
plasmalogenic lipids in the longissimus thoracis et lumborum muscle of calves (n = 6 per
breed)1.
Moiety (%) Tudanca x Charolais Limousin P value
10:0 0.12 ± 0.02 0.08 ± 0.01 0.120
12:0 0.24 ± 0.03 0.17 ± 0.02 0.063
13:0 0.05 ± 0.06 0.11 ± 0.05 0.462
14:0 4.11 ± 0.35 3.21 ± 0.32 0.092
15:0 0.61 ± 0.06 0.63 ± 0.05 0.811
16:0 21.70 ± 0.45 21.12 ± 0.41 0.361
17:0 0.90 ± 0.03 0.99 ± 0.03 0.061
18:0 17.11 ± 0.90 14.21 ± 0.83 0.042
19:0 0.09 ± 0.01 0.07 ± 0.01 0.068
20:0 0.12 ± 0.01 0.12 ± 0.01 0.818
21:0 0.07 ± 0.01 0.05 ± 0.01 0.128
22:0 0.07 ± 0.004 0.08 ± 0.004 0.498
24:0 0.07 ± 0.01 0.09 ± 0.01 0.139
iso14:0 0.10 ± 0.01 0.09 ± 0.01 0.447
iso15:0 0.21 ± 0.02 0.17 ± 0.02 0.120
anteiso15:0 0.28 ± 0.03 0.26 ± 0.03 0.575
iso16:0 0.23 ± 0.02 0.22 ± 0.02 0.650
iso17:0 0.38 ± 0.03 0.36 ± 0.02 0.555
anteiso17:0 0.46 ± 0.03 0.43 ± 0.03 0.407
iso18:0 0.14 ± 0.01 0.13 ± 0.01 0.633
15:0DMA 0.05 ± 0.01 0.08 ± 0.005 0.003
16:0AME 0.05 ± 0.01 0.06 ± 0.01 0.423
16:0DMA 1.54 ± 0.23 2.79 ± 0.21 0.003
9c-16:1DMA 0.09 ± 0.01 0.13 ± 0.01 0.022
11c-16:1DMA 0.09 ± 0.01 0.14 ± 0.01 0.015
17:0DMA 0.15 ± 0.01 0.23 ± 0.01 0.003
18:0DMA 0.98 ± 0.12 1.37 ± 0.11 0.043
11t-18:1DMA 0.09 ± 0.01 0.13 ± 0.01 0.004
9c-18:1DMA 0.31 ± 0.05 0.43 ± 0.05 0.112
16:0 ALDE 0.07 ± 0.02 0.13 ± 0.02 0.044
18:0 ALDE 0.05 ± 0.01 0.05 ± 0.01 0.755
17:0-cyclo2 0.10 ± 0.01 0.07 ± 0.01 0.004
SFA 47.08 ± 1.36 42.57 ± 1.24 0.037
BCFA 1.81 ± 0.13 1.66 ± 0.12 0.423
AME&DMA 3.34 ± 0.43 5.35 ± 0.39 0.007
ALDE 0.12 ± 0.02 0.18 ± 0.02 0.089 1Mean values ± standard error.

ACC
EPTE
D M
ANU
SCR
IPT
ACCEPTED MANUSCRIPT
37
2Cyclohexylundecanoic acid.
SFA, saturated fatty acid: sum of 10:0, 12:0, 13:0, 14:0, 15:0, 16:0, 17:0, 18:0, 19:0, 20:0,
21:0, 22:0, 24:0, iso14:0, iso15:0, anteiso15:0, iso16:0, iso17:0, anteiso17:0, iso18:0.
BCFA, branched-chain fatty acid: sum of iso14:0, iso15:0, anteiso15:0, iso16:0, iso17:0,
anteiso17:0, iso18:0.
AME, alk-1-enyl methyl ether & DMA, dimethyl acetal: sum of 15:0DMA, 16:0AME,
16:0DMA, 9c-16:1DMA, 11c-16:1DMA, 17:0DMA, 18:0DMA, 11t-18:1DMA, 9c-
18:1DMA.
ALDE, aldehyde: sum of 16:0 aldehyde, 18:0 aldehyde.
ACC
EPTE
D M
ANU
SCR
IPT
ACCEPTED MANUSCRIPT
38
Table 5. Effect of breed (‘Tudanca x Charolais’ cross and Limousin) on cis- and trans-
MUFAs (% of total FAME) in the longissimus thoracis et lumborum muscle of calves (n = 6
per breed)1.
Fatty acids (%) Tudanca x Charolais Limousin P value
9c-14:1 0.37 ± 0.05 0.49 ± 0.05 0.133
7c-16:12 0.31 ± 0.02 0.31 ± 0.01 0.995
9c-16:13 1.86 ± 0.08 1.84 ± 0.08 0.886
11c-16:1 0.08 ± 0.01 0.09 ± 0.01 0.320
12c-16:1 0.08 ± 0.01 0.05 ± 0.01 0.049
13c-16:1 0.07 ± 0.01 0.07 ± 0.01 0.607
7c-17:1 0.09 ± 0.01 0.09 ± 0.01 0.599
9c-17:1 0.43 ± 0.03 0.58 ± 0.03 0.010
9c-18:14 25.87 ± 0.28 24.88 ± 0.26 0.030
11c-18:1 1.17 ± 0.09 1.44 ± 0.08 0.048
12c-18:1 0.22 ± 0.02 0.20 ± 0.02 0.404
13c-18:1 0.12 ± 0.01 0.16 ± 0.01 0.050
14c-18:1 0.09 ± 0.02 0.02 ± 0.02 0.060
15c-18:1 0.18 ± 0.01 0.15 ± 0.01 0.051
16c-18:1 0.08 ± 0.01 0.05 ± 0.01 0.007
11c-19:1 0.05 ± 0.01 0.06 ± 0.01 0.484
9c-20:1 0.10 ± 0.01 0.09 ± 0.01 0.702
11c-20:15 0.09 ± 0.01 0.11 ± 0.005 0.021
15c-24:16 0.05 ± 0.01 0.06 ± 0.01 0.581
cis-16:1 2.43 ± 0.09 2.38 ± 0.09 0.702
cis-18:1 27.72 ± 0.26 26.89 ± 0.23 0.041
cis-MUFA 31.39 ± 0.30 30.80 ± 0.27 0.168
trans-16:1 0.38 ± 0.03 0.44 ± 0.03 0.159
10t-18:1 0.36 ± 0.14 1.01 ± 0.13 0.008
11t-18:1 2.68 ± 0.31 2.24 ± 0.28 0.319
trans-18:1 5.08 ± 0.29 4.88 ± 0.26 0.620
trans-MUFA 5.51 ± 0.30 5.36 ± 0.27 0.711
MUFA 36.91 ± 0.34 36.15 ± 0.31 0.139
trans-FA 6.68 ± 0.34 6.25 ± 0.31 0.370 1Mean values ± standard error. FAME, fatty acid methyl ester.
Coelutions: 213t/14t-16:1,
3phytanic acid,
410c-18:1,
5t-20:1, and
6t-20:1.
MUFA, monounsaturated fatty acid: sum of cis- and trans-MUFA.

ACC
EPTE
D M
ANU
SCR
IPT
ACCEPTED MANUSCRIPT
39
cis-MUFA: sum of 9c-14:1, 9c-15:1, 7c-16:1, 9c-16:1, 10c-16:1, 11c-16:1, 12c-16:1, 13c-
16:1, 7c-17:1, 9c-17:1, 11c-17:1, 9c-18:1, 11c-18:1, 12c-18:1, 13c-18:1, 14c-18:1, 15c-18:1,
16c-18:1, 11c-19:1, 9c-20:1, 11c-20:1, 15c-24:1.
trans-MUFA: sum of 6t/7t/8t-16:1, 9t-16:1, 10t-16:1, 11t-16:1, 4t-18:1, 5t-18:1, 6t/7t/8t-18:1,
9t-18:1, 10t-18:1, 11t-18:1, 12t-18:1, 13t/14t-18:1, 15t-18:1, 16t-18:1, t-20:1.
trans FA: trans-MUFA plus other non-conjugated (t,t-/c,t)-18:2.

ACC
EPTE
D M
ANU
SCR
IPT
ACCEPTED MANUSCRIPT
40
Table 6. Effect of breed (‘Tudanca x Charolais’ cross and Limousin) on PUFA, LC-PUFA,
CLA and NC-18:2 isomers (% of total FAME) in the longissimus thoracis et lumborum
muscle of calves (n = 6 per breed)1.
Fatty acids (%) Tudanca x Charolais Limousin P value
PUFA 9.58 ± 1.14 13.09 ± 1.04 0.049
20:3n-9 0.05 ± 0.01 0.05 ± 0.01 0.563
18:2n-6 4.96 ± 0.63 6.94 ± 0.57 0.045
18:3n-6 0.05 ± 0.01 0.06 ± 0.01 0.340
20:2n-6 0.06 ± 0.01 0.07 ± 0.01 0.267
20:3n-6 0.31 ± 0.04 0.48 ± 0.04 0.019
20:4n-6 1.21 ± 0.19 1.88 ± 0.17 0.027
22:2n-6 0.02 ± 0.003 0.02 ± 0.002 0.402
22:4n-6 0.11 ± 0.01 0.14 ± 0.01 0.250
n-6 6.72 ± 0.87 9.59 ± 0.79 0.037
18:3n-3 1.15 ± 0.08 1.17 ± 0.07 0.879
20:3n-3 0.03 ± 0.003 0.03 ± 0.002 0.918
20:5n-3 0.66 ± 0.10 0.86 ± 0.09 0.181
22:5n-3 0.85 ± 0.11 1.22 ± 0.10 0.038
22:6n-3 0.12 ± 0.02 0.18 ± 0.02 0.087
n-3 2.81 ± 0.30 3.45 ± 0.28 0.148
LC-PUFA 3.37 ± 0.47 4.87 ± 0.43 0.041
n-6 LC-PUFA 1.71 ± 0.25 2.59 ± 0.23 0.027
n-3 LC-PUFA 1.66 ± 0.23 2.28 ± 0.21 0.073
9c,11t-18:2 1.00 ± 0.17 1.09 ± 0.16 0.705
CLA 1.32 ± 0.18 1.41 ± 0.16 0.714
t,t-18:2 0.08 ± 0.02 0.06 ± 0.02 0.475
t,t-18:2 0.07 ± 0.01 0.05 ± 0.01 0.098
9c,13t-/8t,12c-18:2 0.28 ± 0.01 0.18 ± 0.01 <0.001
8t,13c/9c,12t-18:2 0.17 ± 0.01 0.12 ± 0.005 <0.001
9t,12c-18:2 0.06 ± 0.01 0.05 ± 0.005 0.198
11t,15c-18:2 0.33 ± 0.04 0.27 ± 0.03 0.250
9c,15c-18:2 0.05 ± 0.01 0.05 ± 0.01 0.589
NC-18:2 1.08 ± 0.05 0.80 ± 0.05 0.003 1Mean values ± standard error. FAME, fatty acid methyl ester.
PUFA, polyunsaturated fatty acid: sum of 20:3n-9, 18:2n-6, 18:3n-6, 20:2n-6, 20:3n-6,
20:4n-6, 22:2n-6, 22:4n-6, 18:3n-3, 20:3n-3, 20:5n-3, 22:5n-3, 22:6n-3.
n-6, sum of 18:2n-6, 18:3n-6, 20:2n-6, 20:3n-6, 20:4n-6, 22:2n-6, 22:4n-6.
n-3, sum of 18:3n-3, 20:3n-3, 20:5n-3, 22:5n-3, 22:6n-3.
ACC
EPTE
D M
ANU
SCR
IPT
ACCEPTED MANUSCRIPT
41
LC-PUFA, long-chain PUFA: sum of 20:2n-6, 20:3n-6, 20:4n-6, 22:2n-6, 22:4n-6, 20:3n-3,
20:5n-3, 22:5n-3, 22:6n-3.
n-6 LC-PUFA, sum of 20:2n-6, 20:3n-6, 20:4n-6, 22:2n-6, 22:4n-6.
n-3 LC-PUFA, sum of 20:3n-3, 20:5n-3, 22:5n-3, 22:6n-3.
CLA, conjugated linoleic acid: sum of 9c,11t-18:2, 7t,9c-18:2, 9t,11c-18:2, 11c,13t-18:2,
10t,12c-18:2, 11t,13c-18:2, 12t,14c-18:2, 11t,13t-18:2, t,t-18:2.
NC-18:2, non-conjugated 18:2 acid: sum of t,t-18:2 (2 different isomers), 9t,12t-18:2, 9c,13t-
/8t,12c-18:2, 8t,13c-/9c,12t-18:2, 9t,12c-18:2, 11t,15c-18:2, 9c,15c-18:2.

ACC
EPTE
D M
ANU
SCR
IPT
ACCEPTED MANUSCRIPT
42
Highlights
- Veal production in mountain areas using an economically more profitable production system for local producers. - Genotype comparison (Tudanca x Charolais and Limousin) in mountain conditions: carcass and meat quality, sensory analysis and muscle fatty acid composition. - Very few differences on carcass and meat quality between genotypes. - Veal obtained from Tudanca x Charolais tended to be more acceptable according to the sensory panel and provided nutritionally healthier profile in terms of trans-18:1, CLA and polyunsaturated fatty acids.