brevard county public schoolsaccountabilityandtesting.brevardschools.org/school impr… · web...
TRANSCRIPT

Brevard County Public SchoolsSchool Improvement Plan
2012-2013
Name of School: Area:
Principal: Area Superintendent:
SAC Chairperson:
Superintendent: Dr. Brian Binggeli
Mission Statement: James Madison Middle School’s mission is to meet the
educational needs of each student.
Vision Statement:
James Madison Middle School’s vision is a safe, relevant learning community that promotes academic excellence through high expectations, mutual respect, and positive role models.
JAMES MADISON MIDDLE SCHOOL NORTH BREVARD
SHERRY TOMLINSON DR. RONALD BOBAY
LORRAINE DEBAUN
Page 1

Brevard County Public SchoolsSchool Improvement Plan
2012-2013RATIONAL – Continuous Improvement Cycle Process
Data Analysis from multiple data sources: (Needs assessment that supports the need for improvement)
For the first time since 2005, James Madison Middle School did not earn an “A” under the Florida Grading System. Cut scores were raised in the state of Florida, causing decline across all districts in the state. The number of points earned by Madison in 2012 would equate to a grade of “C”, however legislators anticipated the decline and mandated that schools could only drop one letter grade maximum from 2011 to 2012.
READING: Utilizing ALL student data (rather than “A+ data”), the percent of seventh grade students scoring at grade level (Level 3) or above (Levels 4, 5) on 2012 FCAT 2.0 Reading declined 4% (69% to 65%). Brevard declined 9% (78% to 69%) and Florida declined 10% (68% to 58%). Eighth grade students showed a greater decline (60% to 53%) with Brevard only declining 1% (65% to 64%) and Florida remaining the same at 55%. Specifically there was a 4% decline (75% to 71%) in the percent of Vocabulary questions answered correctly, and a 5% decline (69% to 64%) in Literacy Analysis at the eighth grade level. Eighth grade students did perform better in Reading Application (69% to 73%). Seventh grade students declined in Informational Text/Research Process. When reviewing school regression data, Madison’s students have historically performed just below expectation in reading. Madison’s students identified as black, as well as students identified as exceptional education (ESE) have the lowest percentage of students performing on grade level or above in 2012 (39% and 31%). Eighth grade ESE students performed the lowest overall. However, Madison’s black students showed the greatest learning gains of any subgroups tracked. Madison Middle School had 58% of its students scoring at or above grade level in 2012 (from 64%) according to FCAT Reading 2.0. Further data is disaggregated on the below charts for Reading:
Grade and Subject Madison Brevard Florida
Seventh Grade Reading 2010 324 73% 337 79% 322 68%
Seventh Grade Reading 2011 320 69% 335 78% 322 68%
Seventh Grade Reading 2012 233 65% 237 69% 231 58%
Eighth Grade Reading 2010 315 59% 324 66% 312 55%Eighth Grade Reading 2011 317 60% 324 65% 313 55%Eighth Grade Reading 2012 238 53% 242 64% 237 55%
Page 2
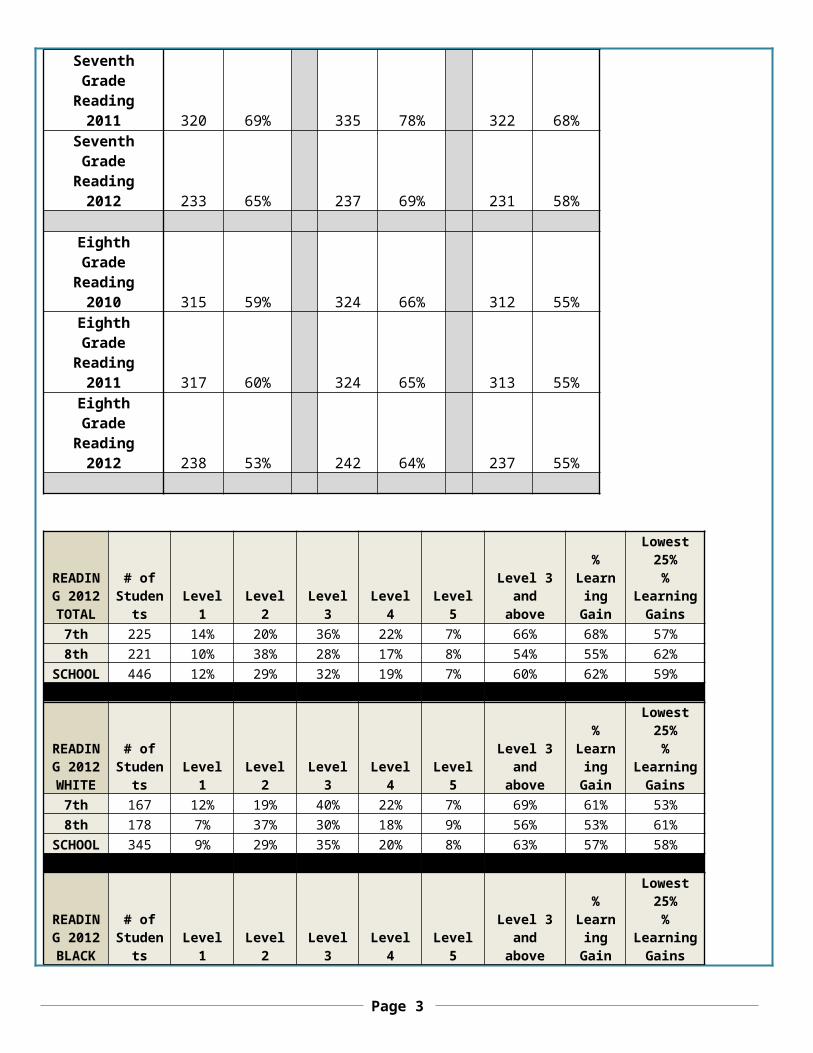
READING 2012 TOTAL
# of Student
s Level 1 Level 2 Level 3 Level 4 Level 5Level 3 and
above
% Learning Gain
Lowest 25%
% Learning Gains
7th 225 14% 20% 36% 22% 7% 66% 68% 57%8th 221 10% 38% 28% 17% 8% 54% 55% 62%
SCHOOL 446 12% 29% 32% 19% 7% 60% 62% 59%
READING 2012 WHITE
# of Student
s Level 1 Level 2 Level 3 Level 4 Level 5Level 3 and
above
% Learning Gain
Lowest 25%
% Learning Gains
7th 167 12% 19% 40% 22% 7% 69% 61% 53%8th 178 7% 37% 30% 18% 9% 56% 53% 61%
SCHOOL 345 9% 29% 35% 20% 8% 63% 57% 58%
READING 2012 BLACK
# of Student
s Level 1 Level 2 Level 3 Level 4 Level 5Level 3 and
above
% Learning Gain
Lowest 25%
% Learning Gains
7th 30 23% 37% 20% 13% 7% 40% 64% 59%8th 23 22% 43% 26% 4% 4% 34% 61% 78%
SCHOOL 53 22% 40% 24% 9% 6% 39% 63% 65%
READING 2012
ED
# of Student
s Level 1 Level 2 Level 3 Level 4 Level 5Level 3 and
above
% Learning Gain
Lowest 25%
% Learning Gains
7th 122 20% 23% 30% 21% 6% 57% 40% 56%8th 90 12% 44% 27% 12% 4% 43% 77% 54%
SCHOOL 212 16% 33% 30% 17% 5% 52% 56% 55%
READING 2012
ESE
# of Student
s Level 1 Level 2 Level 3 Level 4 Level 5Level 3 and
above
% Learning Gain
Lowest 25%
% Learning Gains
7th 24 46% 25% 29% 0% 0% 29% 65% 56%8th 22 41% 50% 9% 0% 0% 9% 38% 55%
SCHOOL 46 43% 37% 19% 0% 0% 31% 51% 56%
READING 2012 GIFTED
# of Student
s Level 1 Level 2 Level 3 Level 4 Level 5Level 3 and
above
% Learning Gain
Lowest 25%
% Learning Gains
7th 9 0% 0% 22% 33% 44% 100% 56% N/A8th 15 0% 0% 15% 46% 39% 100% 69% N/A
SCHOOL 24 0% 0% 18% 41% 41% 100% 64% N/A
READING 2012 FEMALE
# of Student
s Level 1 Level 2 Level 3 Level 4 Level 5Level 3 and
above
% Learning Gain
Lowest 25%
% Learning Gains
Page 3

7th 109 14% 17% 37% 24% 9% 70% 53% 58%8th 112 8% 33% 32% 20% 7% 59% 55% 58%
SCHOOL 221 11% 26% 34% 21% 8% 64% 54% 58%
READING 2012 MALE
# of Student
s Level 1 Level 2 Level 3 Level 4 Level 5Level 3 and
above
% Learning Gain
Low 25% % Learning
Gains7th 116 15% 24% 36% 21% 4% 61% 39% 65%8th 109 11% 42% 23% 15% 9% 47% 55% 56%
SCHOOL 225 12% 33% 31% 17% 7% 56% 47% 60%
Reading
Total # of Students Level 1, 2 Level 4, 5Level 3 and
above Learning GainsLowest 25%
Learning Gains
2010 541 34% 23% 66% 55% 51%
2011 513 36% 25% 64% 56% 52%
2012 446 41% 27% 60% 62% 59%
White # of Students Level 1, 2 Level 4, 5 Level 3 and above
2010 421 32% 26% 68%
2011 385 32% 27% 68%
2012 345 38% 28% 63%
Black # of Students Level 1, 2 Level 4, 5 Level 3 and above
2010 79 52% 5% 48%
2011 66 54% 6% 45%
2012 53 62% 15% 39%
Female # of Students Level 1, 2 Level 4, 5 Level 3 and above
2010 275 29% 28% 71%
2011 270 34% 28% 66%
2012 221 36% 30% 64%
Page 4

Male # of Students Level 1, 2 Level 4, 5 Level 3 and above
2010 264 39% 20% 61%
2011 243 38% 22% 61%
2012 225 45% 24% 56%
ED # of Students Level 1, 2 Level 4, 5 Level 3 and above
2010 227 39% 20% 61%
2011 244 44% 18% 60%
2012 212 49% 22% 52%
ESE # of Students Level 1, 2 Level 4, 5 Level 3 and above
2010 91 68% 4% 31%
2011 73 70% 6% 31%
2012 46 81% 0% 31%
READING 7th Grade 8th Grade 2011 2012 2011 2012VOCABULARY 75% 78% 75% 71%READING APPLICATION 71% 73% 69% 73%LITERARY ANALYSIS 73% 80% 69% 64%INFORMATIONAL TEXT / RESEARCH PROCESS 67% 64% 75% 75%
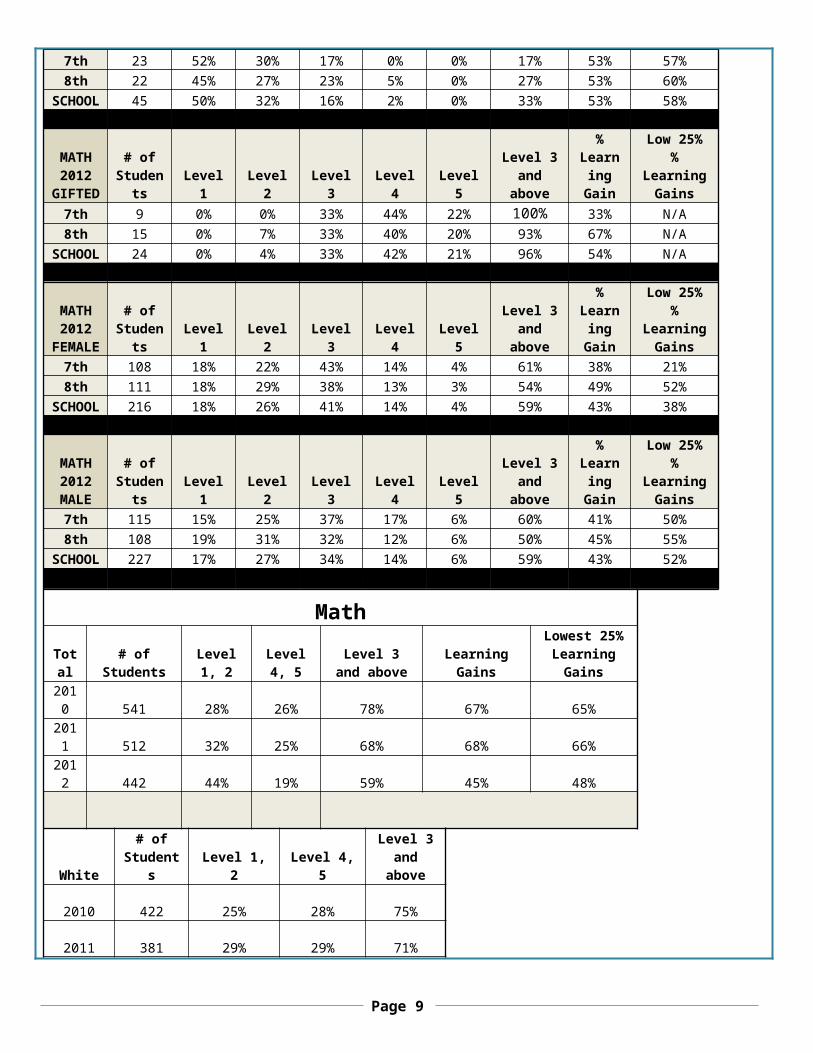
MATH: Utilizing ALL student data (rather than “A+ data”), the percent of seventh grade students scoring at grade level (Level 3) or above (Levels 4, 5) on 2012 FCAT 2.0 Math declined 2% (62% to 60%). Brevard declined 5% (71% to 66%) and Florida declined 6% (62% to 56%). Eighth grade students showed a great decline (74% to 52%) with Brevard and Florida declining 11% (76% to 65% for Brevard and 68% to 57% for Florida). Specifically there was a 6% decline (53% to 47%) in the percent of Geometry/Measurement questions answered correctly. This decline in Geometry/Measurement was also
Page 5

noted at the seventh grade level (56% to 54%) showing a common need school wide. Eighth grade students did perform better in Expressions/Equations/Functions (53% to 58%). In addition, seventh grade students declined in Number/Base Ten (64% to 55%) while performing better in Ratios/Proportional Relationships (50% to 58%). When reviewing school regression data, Madison’s students have historically performed right above expectation in math. On the 2012 Seventh Grade Math FCAT 2.0, Madison ranked 411 of the 1091 middle schools in the state with a mean DSS of 235. Madison ranked 318 in regards to the percentage of students at or above Level 3. On the 2012 Eighth Grade Math FCAT 2.0, Madison ranked 455 of the 1091 middle schools in the state with a mean DSS of 241. Madison ranked 476 in regards to the percentage of students at or above Level 3. In Brevard, however, Madison’s eighth grade Math ranking by mean DSS was 16 out of 16. As seen on FCAT Reading, Madison’s students identified as black, as well as students identified as exceptional education (ESE) have the lowest percentage of students performing on grade level or above on FCAT Math 2.0 2012 (48% and 33%). In addition, those students identified as Economically Disadvantaged joined these identified lowest performing subgroups with 50% performing at or above grade level. Seventh grade ESE students performed the lowest overall. However, Madison’s ESE students showed the greatest learning gains overall of any subgroups tracked. Madison Middle School had 56% of its students scoring at or above grade level in 2012 (from 68%) according to FCAT Math 2.0. Further data is disaggregated on the below charts for Math:
Grade and Subject Madison Brevard Florida
Seventh Grade Math 2010 315 66% 327 73% 314 61%
Seventh Grade Math 2011 313 62% 326 71% 314 62%
Seventh Grade Math 2012 235 60% 240 66% 236 56%
Eighth Grade Math 2010 330 78% 335 79% 324 68%
Eighth Grade Math 2011 325 74% 333 76% 325 68%
Eighth Grade Math 2012 241 52% 247 65% 243 57%
MATH 2012
TOTAL# of
Students Level 1 Level 2 Level 3 Level 4 Level 5Level 3 and
above
% Learning
Gain
Low 25% % Learning
Gains7th 223 16% 24% 40% 15% 5% 62% 39% 35%8th 219 19% 29% 34% 13% 4% 55% 53% 47%
SCHOOL 442 18% 27% 37% 14% 5% 59% 42% 45%
Page 6

MATH 2012
WHITE# of
Students Level 1 Level 2 Level 3 Level 4 Level 5Level 3 and
above
% Learning
Gain
Low 25% % Learning
Gains7th 165 14% 23% 41% 16% 5% 62% 42% 33%8th 176 17% 30% 35% 13% 5% 53% 44% 48%
SCHOOL 341 16% 27% 38% 14% 5% 61% 43% 40%
MATH 2012
BLACK# of
Students Level 1 Level 2 Level 3 Level 4 Level 5Level 3 and
above
% Learning
Gain
Low 25% % Learning
Gains7th 30 30% 23% 37% 10% 0% 47% 29% 36%8th 23 26% 30% 39% 4% 0% 43% 60% 70%
SCHOOL 53 28% 26% 38% 7% 0% 48% 43% 52%
MATH 2012 ED
# of Students Level 1 Level 2 Level 3 Level 4 Level 5
Level 3 and above
% Learning
Gain
Low 25% % Learning
Gains7th 120 21% 27% 36% 14% 3% 53% 38% 37%8th 89 24% 35% 30% 10% 1% 41% 52% 42%
SCHOOL 209 22% 30% 33% 12% 2% 50% 41% 40%
MATH 2012 ESE
# of Students Level 1 Level 2 Level 3 Level 4 Level 5
Level 3 and above
% Learning
Gain
Low 25% % Learning
Gains7th 23 52% 30% 17% 0% 0% 17% 53% 57%8th 22 45% 27% 23% 5% 0% 27% 53% 60%
SCHOOL 45 50% 32% 16% 2% 0% 33% 53% 58%
MATH 2012
GIFTED# of
Students Level 1 Level 2 Level 3 Level 4 Level 5Level 3 and
above
% Learning
Gain
Low 25% % Learning
Gains7th 9 0% 0% 33% 44% 22% 100% 33% N/A8th 15 0% 7% 33% 40% 20% 93% 67% N/A
SCHOOL 24 0% 4% 33% 42% 21% 96% 54% N/A
MATH 2012
FEMALE# of
Students Level 1 Level 2 Level 3 Level 4 Level 5Level 3 and
above
% Learning
Gain
Low 25% % Learning
Gains7th 108 18% 22% 43% 14% 4% 61% 38% 21%8th 111 18% 29% 38% 13% 3% 54% 49% 52%
SCHOOL 216 18% 26% 41% 14% 4% 59% 43% 38%
MATH 2012 MALE
# of Students Level 1 Level 2 Level 3 Level 4 Level 5
Level 3 and above
% Learning
Gain
Low 25% % Learning
Gains7th 115 15% 25% 37% 17% 6% 60% 41% 50%8th 108 19% 31% 32% 12% 6% 50% 45% 55%
SCHOOL 227 17% 27% 34% 14% 6% 59% 43% 52%
Page 7

Math
Total # of Students Level 1, 2 Level 4, 5Level 3 and
above Learning GainsLowest 25%
Learning Gains
2010 541 28% 26% 78% 67% 65%
2011 512 32% 25% 68% 68% 66%
2012 442 44% 19% 59% 45% 48%
White# of
Students Level 1, 2 Level 4, 5Level 3 and
above
2010 422 25% 28% 75%
2011 381 29% 29% 71%
2012 341 42% 20% 61%
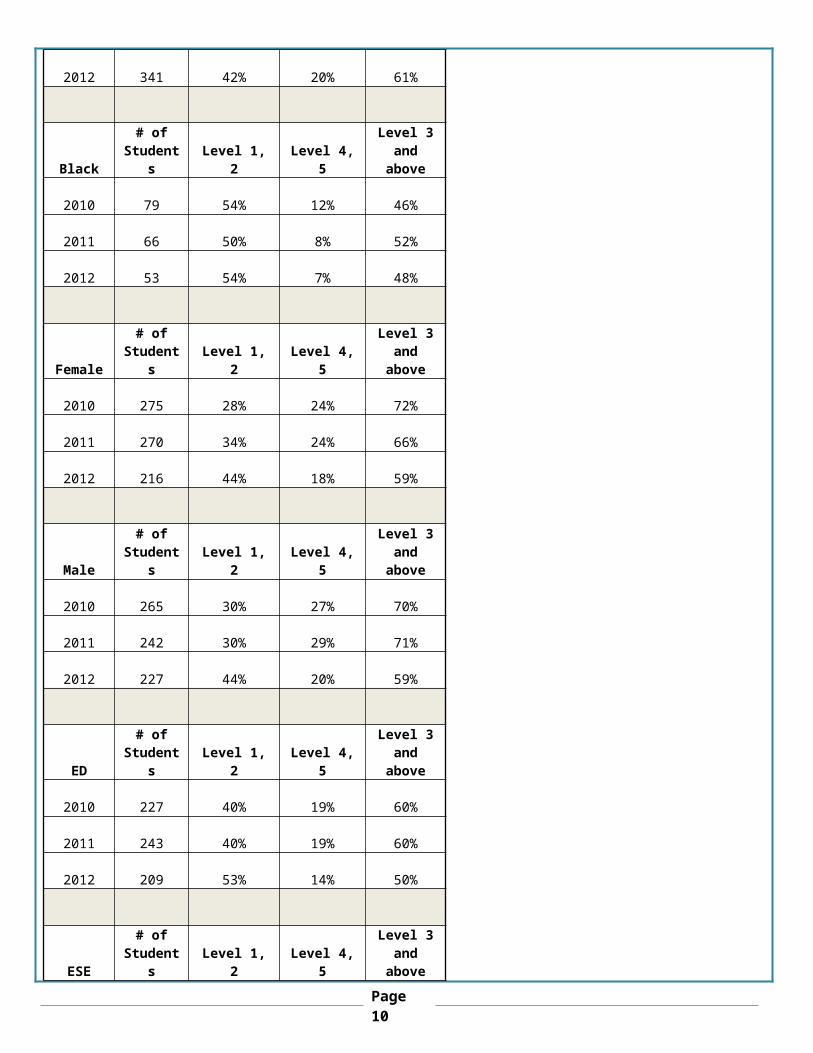
Black# of
Students Level 1, 2 Level 4, 5Level 3 and
above
2010 79 54% 12% 46%
2011 66 50% 8% 52%
2012 53 54% 7% 48%
Female# of
Students Level 1, 2 Level 4, 5Level 3 and
above
2010 275 28% 24% 72%
2011 270 34% 24% 66%
2012 216 44% 18% 59%
Male# of
Students Level 1, 2 Level 4, 5Level 3 and
above
2010 265 30% 27% 70%
2011 242 30% 29% 71%
2012 227 44% 20% 59%
ED# of
Students Level 1, 2 Level 4, 5Level 3 and
above
Page 8
2010 227 40% 19% 60%
2011 243 40% 19% 60%
2012 209 53% 14% 50%
ESE# of
Students Level 1, 2 Level 4, 5Level 3 and
above
2010 91 59% 8% 41%
2011 73 66% 3% 34%
2012 45 82% 2% 33%
MATH 7th Grade 2011 2012NUMBER / BASE TEN 64% 55%RATIOS / PROPORTIONAL RELATIONSHIPS 50% 58%GEOMETRY AND MEASUREMENT 56% 54%STATISTICS AND PROBABILITY 63% 63%
MATH 8th Grade 2011 2012
NUMBER, OPERATIONS, PROBLEMS AND STATISTICS 58% 58%EXPRESSIONS, EQUATIONS AND FUNCTIONS 53% 58%GEOMETRY AND MEASUREMENT 53% 47%
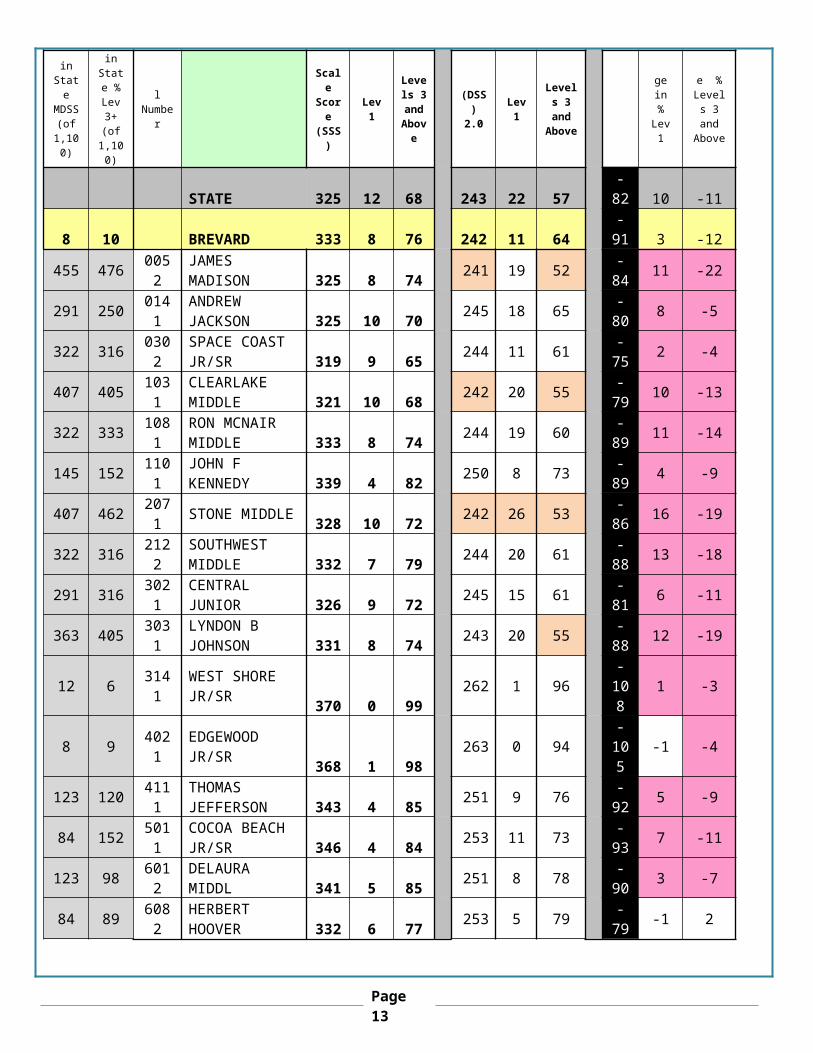
2012 GRADE 7 FCAT MATH IN ALPHA ORDER MATH GRADE 7 2011 2012 2011-2012 Change
Rank in State MDSS
Rank in State % Lev
School Number SCHOOL NAME
Mean Scale Score
% Lev 1
% Levels 3 and
Mean (DSS) 2.0
% Lev 1
% Levels 3
and
Change in
% Lev
Change % Levels
3 and
Page 9
(of 1,091)
3+ (of
1,091)(SSS) Above Above 1 Above
STATE 314 19 62 236 20 56 -78 1 -66 8 BREVARD 326 13 71 237 10 69 -89 -3 -2
411 318 0052 JAMES MADISON 313 21 62 235 16 60 -78 -5 -2191 204 0141 ANDREW JACKSON 322 15 65 241 12 68 -81 -3 3
321 318 0302SPACE COAST JR/SR 317 11 68 237 12 60 -80 1 -8
411 449 1031CLEARLAKE MIDDLE 315 15 64 235 15 53 -80 0 -11
250 304 1081RON MCNAIR MIDDLE 322 14 75 239 15 61 -83 1 -14
141 158 1101 JOHN F KENNEDY 338 7 81 243 11 71 -95 4 -10485 449 2071 STONE MIDDLE 321 18 65 233 25 53 -88 7 -12
321 270 2122SOUTHWEST MIDDLE 314 17 61 237 17 63 -77 0 2
367 345 3021 CENTRAL JUNIOR 314 18 64 236 16 59 -78 -2 -5367 363 3031 LYNDON B JOHN 323 11 69 236 18 58 -87 7 -11
4 4 3141 WEST SHORE JR/SR 369 0 98 259 0 99 -
110 0 1
6 4 4021 EDGEWOOD JR/SR 363 0 98 258 1 99 -
105 1 1
141 150 4111THOMAS JEFFERSON 338 6 83 243 10 72 -95 4 -11
68 915011
COCOA BEACH JR/SR 350 6 84
247 7 77
-103 1 -7
68 71 6012 DELAURA MIDDLE 345 5 86 247 5 80 -98 0 -655 46 6082 HERBERT HOOVER 344 5 82 248 6 84 -96 1 2
2012 GRADE 8 FCAT MATH IN ALPHA ORDER MATH GRADE 8 2011 2012 2011-2012 Change
Rank in
State MDSS
(of 1,100)
Rank in
State % Lev
3+ (of
1,100)
School Numbe
rSCHOOL NAME
Mean Scale Score (SSS)
% Lev 1
% Level
s 3 and
Above
Mean (DSS)
2.0
% Lev 1
% Levels 3 and Above
Change in
% Lev 1
Change %
Levels 3 and
Above
STATE 325 12 68 243 22 57 -82 10 -118 10 BREVARD 333 8 76 242 11 64 -91 3 -12
455 476 0052 JAMES MADISON 325 8 74 241 19 52 -84 11 -22
291 250 0141 ANDREW JACKSON 325 10 70 245 18 65 -80 8 -5
322 316 0302 SPACE COAST JR/SR 319 9 65 244 11 61 -75 2 -4
407 405 1031 CLEARLAKE MIDDLE 321 10 68 242 20 55 -79 10 -13
322 333 1081 RON MCNAIR MIDDLE 333 8 74 244 19 60 -89 11 -14
Page 10

145 152 1101 JOHN F KENNEDY 339 4 82 250 8 73 -89 4 -9407 462 2071 STONE MIDDLE 328 10 72 242 26 53 -86 16 -19
322 316 2122 SOUTHWEST MIDDLE 332 7 79 244 20 61 -88 13 -18
291 316 3021 CENTRAL JUNIOR 326 9 72 245 15 61 -81 6 -11
363 405 3031 LYNDON B JOHNSON 331 8 74 243 20 55 -88 12 -19
12 6 3141 WEST SHORE JR/SR 370 0 99
262 1 96
-108
1 -3
8 9 4021 EDGEWOOD JR/SR368 1 98
263 0 94
-105
-1 -4
123 120 4111 THOMAS JEFFERSON 343 4 85 251 9 76 -92 5 -9
84 152 5011 COCOA BEACH JR/SR 346 4 84 253 11 73 -93 7 -11
123 98 6012 DELAURA MIDDL 341 5 85 251 8 78 -90 3 -7
84 89 6082 HERBERT HOOVER332 6 77
253 5 79
-79 -1 2
WRITING: Utilizing ALL student data (rather than “A+ data”), the percent of students scoring at Level 3 or above on 2012 FCAT 2.0 FCAT Writes declined 3% (83% to 80%). This was a trend noted across the State due to the difference in how the test was being scored. Brevard and Florida declined 4% (82% to 78%). When reviewing school regression data, Madison’s students have historically performed just below expectation in writing. Of note is that none of Madison’s students scored at Level 6 and fewer than 10% scored above Level 4. Of note also is that there were no students identified as Gifted who scored above grade level in Writing. On the 2012 FCAT Writes, Madison ranked 7 out of 16 middle schools in Brevard. Madison’s students identified as black, economically disadvantaged, as well as students identified as exceptional education (ESE) once again (just like Reading and Math) had the lowest percentage of students performing on grade level or above in 2012 (77%, 77% and 52%). Further data is disaggregated on the below charts for Writing:
Grade and Subject Madison Brevard Florida
Eighth Grade Writing 2010 4.0 73% 4.1 97% 4.1 96%Eighth Grade Writing 2011 4.2 83% 4.2 82% 4.2 82%Eighth Grade Writing 2012 3.3 80% 3.3 78% 3.3 78%
Page 11

WRITING 2012
TOTAL
# of Student
s Level 1Level 1.5 Level 2
Level 2.5
Level 3
Level 3.5 Level 4
Level 4.5 Level 5
Level 5.5 Level 6
219 2% 1% 7% 10% 28% 19% 24% 7% 2% <.5 0%
WRITING 2012
WHITE
# of Student
s Level 1Level 1.5 Level 2
Level 2.5
Level 3
Level 3.5 Level 4
Level 4.5 Level 5
Level 5.5 Level 6
173 1% 1% 7% 10% 27% 18% 23% 8% 2% 1% 0%
WRITING 2012
BLACK
# of Student
s Level 1Level 1.5 Level 2
Level 2.5
Level 3
Level 3.5 Level 4
Level 4.5 Level 5
Level 5.5 Level 6
25 <.5 0% 0% 19% 23% 19% 31% 4% 0% 0% 0%
WRITING 2012 ED
# of Student
s Level 1Level 1.5 Level 2
Level 2.5
Level 3
Level 3.5 Level 4
Level 4.5 Level 5
Level 5.5 Level 6
92 2% 1% 9% 12% 34% 18% 18% 4% 0% 1% 0%
WRITING 2012 ESE
# of Student
s Level 1Level 1.5 Level 2
Level 2.5
Level 3
Level 3.5 Level 4
Level 4.5 Level 5
Level 5.5 Level 6
21 20% 0% 20% 15% 20% 20% 0% 0% 5% 0% 0%
WRITING 2012
GIFTED
# of Student
s Level 1Level 1.5 Level 2
Level 2.5
Level 3
Level 3.5 Level 4
Level 4.5 Level 5
Level 5.5 Level 6
15 0% 0% 1% 0% 13% 20% 53% 7% 0% 0% 0%
WRITING 2012
FEMALE
# of Student
s Level 1Level 1.5 Level 2
Level 2.5
Level 3
Level 3.5 Level 4
Level 4.5 Level 5
Level 5.5 Level 6
111 0% 0% 2% 7% 27% 23% 28% 10% 3% 0% 0%
WRITING 2012 MALE
# of Student
s Level 1Level 1.5 Level 2
Level 2.5
Level 3
Level 3.5 Level 4
Level 4.5 Level 5
Level 5.5 Level 6
108 4% 2% 12% 14% 28% 15% 20% 5% 1% 1% 0%
Page 12
Writing
Total # of Students Level 1 Level 6 Level 3 and above Level 3.5 and above Level 4 and above2010 255 <.5 4% 98% 88% 73%2011 262 <.5 5% 88% 83%2012 219 2% 0% 80% 53% 34%
White # of Students Level 1 Level 6 Level 3 and above Level 3.5 and above Level 4 and above2010 199 <.5 3% 97% 75%2011 163 <.5 5% 99% 82%2012 173 1% 0% 80% 52% 34%
Black # of Students Level 1 Level 6 Level 3 and above Level 3.5 and above Level 4 and above2010 37 <.5 5% 100% 62%2011 33 <.5 <.5 100% 85%2012 25 4% 0% 77% 54% 35%
Female # of Students Level 1 Level 6 Level 3 and above Level 3.5 and above Level 4 and above2010 131 <.5 5% 98% 86%2011 139 <.5 5% 100% 90%2012 111 0% 0% 91% 64% 41%
Male # of Students Level 1 Level 6 Level 3 and above Level 3.5 and above Level 4 and above2010 124 <.5 2% 97% 60%2011 123 <.5 4% 98% 76% 76%2012 108 44% 0% 69% 41% 26%
ED # of Students Level 1 Level 6 Level 3 and above Level 3.5 and above Level 4 and above2010 91 <.5 3% 95% 65%2011 121 <.5 3% 100% 79%2012 92 2% 0% 77% 42% 24%
ESE # of Students Level 1 Level 6 Level 3 and above Level 3.5 and above Level 4 and above2010 40 <.5 <0.5% 90% 58%2011 33 <.5 3% 97% 58%2012 21 19% 0% 52% 24% 5%
Page 13

2012 Grade 8 FCAT WRITING RESULTS Alphabetical
Scho
ol N
umbe
r
Scho
ol N
ame
% a
t Pro
ficie
ncy
4.0
+
% a
t Pro
ficie
ncy
3.0
+
11-1
2 in
cr/d
ecr
% a
t pro
ficie
ncy
Mea
n Es
say
Scor
e
Mea
n Es
say
Scor
e
11-1
2 in
cr/d
ecr
Mea
n Es
say
% a
t 3.5
% a
t 4.0
2011 2012 2011 2012 2012 2012 State 82 78 -4 4.2 3.3 -0.9 52 33 Brevard 82 78 -4 4.2 3.3 -0.9 52 330141 ANDREW JACKSON 77 74 -3 4.0 3.2 -0.8 43 263021 CENTRAL 80 76 -4 4.1 3.2 -0.9 45 261031 CLEARLAKE 79 77 -2 4.0 3.2 -0.8 42 245011 COCOA BEACH 92 86 -6 4.4 3.7 -0.7 71 546012 DELAURA 88 87 -1 4.4 3.5 -0.9 68 474021 EDGEWOOD 92 94 2 4.6 3.6 -1.0 71 446082 HERBERT HOOVER 78 84 6 4.1 3.3 -0.8 51 300052 JAMES MADISON 83 80 -3 4.2 3.3 -0.9 53 341101 JOHN KENNEDY 89 87 -2 4.4 3.5 -0.9 63 413031 LYNDON JOHNSON 82 67 -15 4.1 3 -1.1 38 211081 RONALD MCNAIR 82 83 1 4.3 3.4 -0.9 58 392122 SOUTHWEST 74 66 -8 4.0 3 -1.0 36 210302 SPACE COAST 81 75 -6 4.4 3.3 -1.1 49 312071 STONE 80 78 -2 4.1 3.2 -0.9 52 31
4111 THOMAS JEFFERSON 89 78 -11 4.4 3.3 -1.1 53 34
3141 WEST SHORE JR 96 98 2 4.8 4 -0.8 88 71
SCIENCE: Utilizing ALL student data (rather than “A+ data”), the percent of students scoring at grade level (Level 3) or above (Levels 4, 5) on 2012 FCAT 2.0 Science declined 2% (50% to 48%). Brevard declined 1% (60% to 59%) and Florida remained the same (46%). Specifically there was a 14% decline (69% to 55%) in the percent of Nature of Science questions answered correctly, and a 4% decline (64% to 60%) in Earth/Space Science and Physical Science. Life Science improved (62% to 67%) in 2012. Madison did score higher than the state average in science, but lower than the district average. On the 2012 Science FCAT 2.0, Madison ranked 343 of the 1091 middle schools in the state with a mean DSS of 320. In Brevard, Madison’s Science ranking by mean DSS was 12 out of 16. When reviewing school regression data, Madison’s students have historically performed just below expectation in science. Madison’s students identified as black, as well as students identified as exceptional education (ESE) once again (just like Reading and Math) have the lowest percentage of students performing on grade level or above in 2012 (33% and 28%). Further data is disaggregated on the below charts for Science:
Page 14

Grade and Subject Madison Brevard Florida
Eighth Grade Science 2010 321 48% 333 58% 310 43%Eighth Grade Science 2011 323 50% 338 60% 315 46%Eighth Grade Science 2012 320 48% 335 59% 316 46%
SCIENCE 2012
TOTAL# of
Students Level 1 Level 2 Level 3 Level 4 Level 5Level 3 and
aboveSCHOOL 219 16% 36% 41% 4% 3% 49%
SCIENCE
2012 WHITE
# of Students Level 1 Level 2 Level 3 Level 4 Level 5
Level 3 and above
SCHOOL 174 14% 36% 42% 4% 3% 51%
SCIENCE 2012
BLACK# of
Students Level 1 Level 2 Level 3 Level 4 Level 5Level 3 and
aboveSCHOOL 25 28% 36% 36% 0% 0% 33%
SCIENCE
2012 ED
# of Students Level 1 Level 2 Level 3 Level 4 Level 5
Level 3 and above
SCHOOL 93 22% 39% 38% 2% 0% 40%
SCIENCE 2012 ESE
# of Students Level 1 Level 2 Level 3 Level 4 Level 5
Level 3 and above
SCHOOL 21 48% 38% 14% 0% 0% 28%
SCIENCE 2012
GIFTED# of
Students Level 1 Level 2 Level 3 Level 4 Level 5Level 3 and
aboveSCHOOL 15 0% 0% 67% 27% 7% 100%
SCIENCE
2012 FEMALE
# of Students Level 1 Level 2 Level 3 Level 4 Level 5
Level 3 and above
SCHOOL 111 21% 40% 35% 4% 1% 41%
SCIENCE 2012 MALE
# of Students Level 1 Level 2 Level 3 Level 4 Level 5
Level 3 and above
SCHOOL 109 12% 32% 47% 5% 5% 57%
Page 15

Science
Total # of Students Level 1, 2 Level 4, 5 Level 3 and above2010 254 52% 8% 48%2011 265 50% 11% 50%2012 220 52% 7% 48%
White # of Students Level 1, 2 Level 4, 5 Level 3 and above2010 198 49% 10% 51%2011 195 41% 18% 59%2012 173 51% 8% 49%
Black # of Students Level 1, 2 Level 4, 5 Level 3 and above2010 36 72% 0% 28%2011 34 77% 4% 23%2012 25 64% 0% 33%
Female # of Students Level 1, 2 Level 4, 5 Level 3 and above2010 128 59% 5% 41%2011 140 57% 11% 43%2012 111 60% 5% 40%
Male # of Students Level 1, 2 Level 4, 5 Level 3 and above2010 125 55% 12% 55%2011 125 52% 14% 48%2012 109 44% 9% 56%
ED # of Students Level 1, 2 Level 4, 5 Level 3 and above2010 88 64% 6% 36%2011 122 67% 6% 33%2012 93 60% 2% 40%
ESE # of Students Level 1, 2 Level 4, 5 Level 3 and above2010 40 78% 3% 23%2011 32 82% 3% 18%2012 21 86% 0% 28%
SCIENCE 8th Grade 2011 2012NATURE OF SCIENCE 69% 55%EARTH AND SPACE 64% 60%
Page 16

SCIENCEPHYSICAL SCIENCE 64% 60%LIFE SCIENCE 62% 67%
2012 GRADE 8 FCAT SCIENCE IN ALPHA ORDER SCIENCE GRADE 8 2011 2012 2011-2012 Change
Rank in State MDSS
(of 1094)
Rank in State
% Lev 3+ (of
1094)
School Numbe
rSCHOOL NAME
Mean
Scale Score (SSS)
% Lev 1
% Levels 3 and Above
Mean
(DSS) 2.0
% Lev 1
% Levels 3 and Above
Change
in % Lev 1
Change % Levels 3 and
Above
STATE 315 23 46 316 22 46 1 -1 05 6 BREVARD 338 12 60 335 13 59 -3 1 -1
343 343 0052 JAMES MADISON 323 14 50 320 16 48 -3 2 -2175 213 0141 ANDREW JACKSON 328 14 53 335 13 57 7 -1 4254 227 0302 SPACE COAST JR/SR 332 9 56 328 9 56 -4 0 0343 370 1031 CLEARLAKE MIDDLE 314 20 44 320 16 47 6 -4 3
145 133 1081 RON MCNAIR MIDDLE 346 8 64 339 10 63 -7 2 -1
166 185 1101 JOHN F KENNEDY 339 11 65 336 12 59 -3 1 -6392 412 2071 STONE MIDDLE 326 19 52 317 20 45 -9 1 -7
392 394 2122 SOUTHWEST MIDDLE 332 13 56 317 20 46 -15 7 -10
306 302 3021 CENTRAL JUNIOR 327 14 53 323 15 51 -4 1 -2
356 343 3031 LYNDON B JOHNSON 330 13 55 319 17 48 -11 4 -7
6 6 3141 WEST SHORE JR/SR 392 0 98 387 0 91 -5 0 -7
15 94021
EDGEWOOD JR/SR 387 0 93 372 0 88 -15 0 -5
54 54 4111 THOMAS JEFFERSON 347 8 68 352 7 72 5 -1 4
14 24 5011 COCOA BEACH JR/SR 364 6 75 373 6 80 9 0 5
29 30 6012 DELAURA MIDDL 361 6 75 363 4 77 2 -2 262 35 6082 HERBERT HOOVER 337 12 57 351 7 76 14 -5 19
below state
average decrease from previous year
Overall, the data illustrates that a decline in students scoring at or above grade level on FCAT 2.0 2012 was realized across the state and the district at the Middle School level.
In reading and math, Madison’s 7th grade students did not decline in performance at the same pace as those in Brevard and Florida. Madison’s 8th grade students declined greater than those in Brevard and Florida.In science, Madison’s students declined just slightly greater than the district and state. In writing, Madison’s students did not decline as much as the district and state.
Page 17

READINGMadison
7th Grade Compared
to 2011
Florida 7th Grade Compared
to 2011
Brevard 7th Grade Compared
to 2011
Madison 8th Grade Compared
to 2011
Florida 8th Grade Compared
to 2011
Brevard 8th Grade Compared
to 2011-4% -10% -9% -7% -1% 0%
MathMadison
7th Grade Compared
to 2011
Florida 7th Grade Compared
to 2011
Brevard 7th Grade Compared
to 2011
Madison 8th Grade Compared
to 2011
Florida 8th Grade Compared
to 2011
Brevard 8th Grade Compared
to 2011-2% -6% -5% -22% -11% -11%
Writing ScienceMadison
Compared to 2011
Florida Compared
to 2011
Brevard Compared
to 2011
Madison Compared
to 2011
Florida Compared
to 2011
Brevard Compared
to 2011-3% -4% -4% -2% 0% -1%
James Madison Middle School Regression Data (Standard Deviation from the Mean)
2007 2008 2009201
0201
1201
2
Reading Proficiency -0.87 -0.08 -0.54-
0.25-
0.33 Mathematics Proficiency 0.73 0.83 0.38 0.34 0.15
Science Proficiency 0.23 0.28 0.96-
0.56-
0.39
Writing Proficiency not avail not avail not avail-
3.07-
0.04
Total Points not avail not avail below-
1.12-
0.95
Analysis of Current Practice: (How do we currently conduct business?)
“Since the early 1960s, middle-level schools have been consistently and continually working to improve the ways that the pre- and early adolescent child is taught. Middle schools were among the first schools in the country to use flexible block schedules, giving more time and more flexibility to teachers and teams.” [Best Practices from America’s Middle Schools,
Page 18

1999]. James Madison Middle School is the only middle school in Brevard County currently utilizing the block schedule. Students from Madison continue into Astronaut High School which also utilizes the block schedule. Neither school has participated in block scheduling professional development for many years, and thus it can be assumed that there are teachers on campus who have never experienced this type of training and others who may not be applying some of the knowledge gained with consistency.
As is typical in most secondary classrooms, teachers traditionally have utilized a lecture format, followed by practice time as this seemed to be the most efficient manner to provide exposure to content when teachers are faced with a 40 to 45 minute class period. As is known through our B.E.S.T. training, the lecture followed by practice time is probably not the most effective way to engage students and allow for their mastery of the content.
To gain an understanding from the student population at Madison as to what they feel helps them learn best, students were surveyed while in their homeroom class on September 20, 2012 (approximately 6 weeks into the school year). The responses were varied but in commonality was engagement, as is seen in the following noted responses:Hands-on activities, group work, small group, partner work, projects, one-on-one with the teacher, visuals (movies, PowerPoints, Video Clips), teacher demonstrations/presentations/modeling, working on the computer, examples/explanations, diagrams/drawings/games, white boards, being able to move around, fun activities, calm room.
When asked what interferes with their learning in the classroom, the following responses were noted: students talking/playing/joking/screaming/throwing things/off task/rude/bad/bullying/tapping/misbehaving, really big words, dim lights, mean teachers, hunger, presenting by myself, writing definitions, stuff with lots of instructions, teacher lectures, getting an assignment and then the teacher just goes on, pretty girls.
Further information was gleaned from the 2011-2012 BPS Student Survey. Students indicated that they are most interested in learning when they “choose the way they do an assignment”.
A review of the BPS 2011-2012 Parent Survey shows that nearly 57% of the 176 Madison parents who responded rated their satisfaction with classroom instruction as “Good”, while 27% rated it as “Excellent”. This was a most positive response. In regards to specific curricular subjects, the results were again highly favorable:
Reading/LA 48% Good; 39% ExcellentMathematics 40% Good; 31% Excellent
Science 50% Good; 37% ExcellentSocial Studies 53% Good; 39% Excellent
Electives 51% Good; 32% ExcellentIn addition, parents rated how satisfied they were with the overall quality of Madison. 49% rated Madison “Good” and 40% rated us “Excellent”.
On August 24, 2012, thirty-one faculty members completed a 22 question survey relative to their understanding and use of various teaching/learning strategies. Teachers responded to each strategy utilizing a Likert scale of 1-4:
4 = I understand and already fully implement this strategy in each of my classes.
3 = I understand and use this strategy, but I need to practice using it more in my classroom.
2 = I can explain this strategy, but I am not currently using it often or at all in my classroom.
1 = I do not understand this strategy, and I do not currently use it in my classroom.
In response to use of “small group instruction, 5 teachers reported an answer of “2”, with 13 more reporting an answer of “3”. Thirteen teachers reported full understanding and use of small group instruction in each of their classes. In response to “student interest surveys”, 2 teachers reported an answer of “1”, 11 reported an answer of “2”, 7 reported an answer of “3”, and 4 reported understanding and using interest surveys in each of their classes. In response to
Page 19

“learning profile surveys”, 11 teachers reported an answer of “1”, 11 reported an answer of “2”, 5 reported an answer of “3”, and 4 reported understanding and using interest surveys in each of their classes.
For student options on assignments, homework, and assessment, the following responses were noted: Assignment Options: Homework Options: Assessment Options# responses of “1” 2 4 3# responses of “2” 16 15 19# responses of “3” 9 7 6# responses of “4” 4 1 3 In response to product assignments and assessments: In response to utilizing visual organizers like Thinking Maps:# responses of “1” 16 2# responses of “2” 4 3 # responses of “3” 7 11 # responses of “4” 4 15
Other strategies on the survey were: “hook” prior to start of unit/lesson, engaging students in debate, individual student goal setting, student led conferences, providing justification and student friendly objective prior to start of lesson, furniture arrangement and time allocated for student collaboration, grading with rubrics, pre-assessment followed by changing lesson plan based upon result, response solicitation other than hands raised (clickers, white boards, fist to five, pair/share, jigsaw), curriculum compacting, standards-based grading, higher order questioning, word wall and use of vocabulary in context, and non-verbal representations (graphs, charts, maps).
Thus, while the Madison community is pleased with the instruction happening at Madison, the data reveals that we must continue to face the challenge of utilizing the block schedule to our best advantage and rise to the high rigor that is facing us with implementation of Common Core Standards. These surveys reinforced to us that some of our faculty could benefit from staff development relative to varied teaching/learning strategies to help engage students in a block schedule, as well as utilization of differentiated instruction. It also reinforced that some of our faculty could benefit from support to implement teaching/learning strategies with fidelity as many have an understanding of the strategies but are not successfully utilizing them consistently.
Madison is one of four schools to receive a Literacy and Writing Design Collaborative grant to integrate higher level Common Core Standards across the curriculum. Teachers involved in this grant are creating modules based on the Literacy Design Collaborative that support CORE content teachers in implementing common core standards. A standard format provides clarity and support for teachers as well as the flexibility to be creative. Each module focuses on a specific teaching task and includes: the skills students need to be successful, a set of mini-tasks to guide instruction, and a scoring guide or rubric to help assess the students’ rate of success. All of Madison’s teachers will be exposed to these teaching tasks in school year 2012-2013.
Functioning as a Professional Learning Community, the Madison faculty will meet monthly with departments in school year 2012-2013. This time will be utilized to share best practice, plan together, disaggregate data, align curriculum, unpack Common Core Standards, and create/analyze common assessments. Teachers will also participate in a cross-curricular team of teachers who share at least some common students. This team will identify students who scored in the lowest 25% on FCAT 2.0 Reading whom they can impact through instruction and/or mentoring. Collaborative tracking of these students’ data will assist with targeting the individual student’s needs. These small groups will meet each Thursday, while the faculty meets together each Tuesday morning prior to school.
Realizing that all aspects of learning are critical to student development, Madison provides opportunities for extended school enrichment. These activities address interests of many students to include: Basketball, Track, Cheerleading, Forensics, National Junior Honor Society, Odyssey of the Mind, Lego Robotics Team, SECME, Band, Chorus, Orchestra,
Page 20

Guitar, and Mohawk Patrol.
Best Practice: (What does research tell us we should be doing as it relates to data analysis above?)
Members of the National Education Commission on Time and Learning, which was established in 1991 by Congress to conduct a comprehensive study of the relationship between learning and scheduled time in America’s schools, reported that “the degree to which today’s American school is controlled by the dynamics of clock and calendar is surprising, even to people who understand school operations”. [National Education Commission on Time and Learning, 1994, p.7]
Schools on a traditional schedule were found to have specific scheduling criticisms to include the following: 1. Contributing to impersonal nature; 2. Exacerbating discipline problems directly related to transitions/class changes; 3. Offering less room for any electives with increased curricular/graduation requirements; 4. Limiting instructional possibilities for teachers. A block schedule can work to the benefit of all of the criticisms noted. However, for a block schedule school to succeed, teachers must alter their techniques to utilize extended blocks of time effectively. They cannot simply “dispense knowledge in lecture format, assign and grade homework/class work, and give quizzes/tests” as is common in many secondary traditional scheduled schools. Teachers who are most successful in block scheduling typically plan lessons in multiple chunks: Direct instruction, application “hands-on”, and synthesis utilizing such instructional strategies as reviewed in B.E.S.T.: relationship/class/team building, cooperative learning, Socratic/Paideaia Seminars, inquiry-based instruction, simulations, technology, and learning centers/stations. [Block Scheduling: A Catalyst for Change in High Schools, 1995]
Increased time per class period provides teachers more opportunities to individualize instruction, time to fully understand the specific learning needs of students. It also allows students more chances to receive personalized differentiated instruction. New York University, in 2008, addressed the use of Differentiated Instruction as an approach to teaching and learning for students with different abilities in the same classroom. The theory behind differentiated instruction is that teachers should vary and adapt their approaches to fit the vast diversity of students in the classroom. Differentiated instruction recognizes that students differ in many ways, including prior knowledge, culture, learning preferences and interests. The block schedule allows greater opportunity for all students to learn on their level, and requires that teachers must change the way they teach in a traditional schedule. Block scheduling allows a workshop environment that can contribute to the success of differentiated instruction. (Hess, 1999)
While there is no recipe for differentiation, there are certain broad principles and characteristics involved. Teachers must ensure “respectful activities” for all students, allow for flexible clusters of students, and recognize and embrace cultural diversity within the classroom. (Villegas & Lucas, 2002) Student readiness and interest are key components to consider when preparing for the differentiated classroom and differentiation can occur through content, process, and products. “The goal of differentiated instruction is to make certain that everyone grows in all key skills and knowledge areas, moving on from the students’ starting points to achieve academic excellence, personal success and self discipline by utilizing higher order thinking skills for real world problem solving. Teachers guide students to explore topics through a teaching approach that best meets their learning style, while examining the values, beliefs, and ideas that shape their experiences.” (How to Differentiate Instruction in Mixed-Ability Classrooms, 2001)
According to Carol Ann Tomlinson, “the need for emotional safety, appropriate challenge, and self-constructed meaning suggests that a one-size-fits-all approach to classroom teaching is ineffective for most students and harmful to some. In order to create meaning in each individual brain, learners need entryways to make sense of the world around them. They need a brain-friendly classroom in which instruction is varied, diversified, and differentiated. Because differentiation provides this variation, it fully supports the uniqueness of every brain.” [Supporting Differentiated Instruction: A Professional Learning Communities Approach, 2011]
CONTENT AREA: Reading Math Writing Science Parental
InvolvementDrop-out Programs
Page 21

Language Arts
Social Studies
Arts/PE Other:
School Based Objective: (Action statement: What will we do to improve programmatic and/or instructional effectiveness?)Every teacher at James Madison Middle School will use Differentiated Instruction effectively to actively engage students bell to bell.
Strategies: (Small number of action oriented staff performance objectives)
Barrier Action Steps Person Responsible
Timetable Budget In-ProcessMeasure
Teacher Buy-inLack of Application
1.Provide Professional Development on Differentiated Instruction during faculty meetings -to include BEST strategies
Sherry Tomlinson and Sharon Tolson
Monthly:9/18; 10/16; 11/13; 1/22; 2/19; 3/19;
0 Inservice Records
Teacher Buy-inLack of Application
2.Provide “Engaging Students within Block Schedule” Professional Development
Dr. Queen 10/11 and 10/12 $2400.00 from district
Attendance sheet
Teacher Availability
3. Sharing of information from MESH teachers who attend Block Scheduling professional development with departments
MESH trained teachers
Department meetings October through May
0 Department agenda
Faculty not reading/studying assigned chapters Lack of application
4. Book study: How to Differentiate Instruction in Mixed-Ability Classrooms
Sherry Tomlinson and Sharon Tolson
Tuesdays of each month beginning 8-28; 9/18; 10/16; 11/13; 1/22; 2/19; 3/19;
Books borrowed from another school
Faculty Meeting attendance sign in sheet
Teacher resistance to Reading Coach Input
5.Utilize Reading Coach to model engagement strategies and Differentiated Instruction techniques
Rhonda Marynec On-going August through May
0 Calendar and/or Coach’s log
Teacher Buy-inLack of Application
6. Provide “School-wide Discipline” Professional Development
Ron Shaw October 12 0 Inservice Records
Teacher Availability
7. Provide vertical articulation for science departments of
Joyce Smolik November 9 Title II Grant will Fund Substitutes
Meeting Agenda
Page 22

Astronaut High School and Madison Middle School
Teacher Buy-inLack of Application
8. Provide district resource support for Common Core math implementation
Sherry TomlinsonKim Bragg
November 15 and December 4
Title II Grant will Fund Substitutes
Meeting Agenda
Availability of District Personnel
9. Provide district resource support for Common Core ELA implementation across content areas as well as engagement strategies for the block schedule
Sherry TomlinsonNancy GrayDistrict Resource Teachers
Faculty meeting September 4, 2012 and Department Meetings Ongoing (to include August 21)
0 Faculty attendance
EVALUATION – Outcome Measures and Reflection Qualitative and Quantitative Professional Practice Outcomes: (Measures the level of implementation of the professional practices throughout the school)
Qualitative Professional Practice Outcome: Due to an increase in bell-to-bell active student engagement lessons with use of
differentiated instruction, the faculty at James Madison Middle School will trust their peers to observe them and provide
feedback to them; allowing for honest reflection; showing pride in their students’ growth along with ownership of their own
professional growth.
Quantitative Professional Practice Outcome: There will be an increase in bell-to-bell active student engagement lessons with
use of differentiated instruction, evidenced through at least 75% of teacher Professional Growth Plan (PGP) goals [tied to this
School Improvement Plan] being met.
Qualitative and Quantitative Student Achievement Expectations: (Measures of student achievement)
Qualitative Student Achievement Expectations: Due to an increase in bell-to-bell active student engagement lessons with use of
differentiated instruction, the students at James Madison Middle School will show improvement in their behavior, academics,
and attendance.
Quantitative Student Achievement Expectations: Due to an increase in bell-to-bell active student engagement lessons with use
of differentiated instruction, in 2012-2013, James Madison Middle School will earn enough points to merit being awarded an “A”
school under Florida’s grading system.
APPENDIX A
(ALL SCHOOLS)Reading Goal: 2012 Current 2013 Expected
Page 23

Madison will increase the percentage of students scoring level 3 or above from 59% to 64% as measured by FCAT 2.0 Reading.
Level of Performance
(Enter percentage information and the number of students that percentage reflects ie.
28%=129 students)
Level of Performance
(Enter percentage information and the
number of students that percentage reflects ie. 31%=1134 students)
Anticipated Barrier(s):1. Time to incorporate additional reading or DI strategies into instructional time.
Strategy(s):1. Incorporate higher level questioning.2. Utilize the FCAT 2.0 data from the FLDOE website to plan lessons that correlate with the Next Generation Florida
Sunshine State Standards.3. Implement activity driven flexible grouping of students through Differentiated Instruction.4. Align curriculum with Common Core Standards.
FCAT 2.0Students scoring at Achievement Level 3 and above
Barrier(s): Stress from additional expectations on teachers
Strategy(s):1. Implement activity driven flexible grouping of students
59% = 264 students out of 446 students
64% = 319 students out of 498 students
Florida Alternate Assessment: Students scoring at levels 4, 5, and 6 in Reading
Barrier(s): Engaging students who have difficulties listening and following directions
Strategy(s):
1. Implement activity driven flexible grouping of students
11% = 1 student out of 9 students
10% = 1 student out of 10 students
FCAT 2.0Students scoring at or above Achievement Levels 4 and 5 in Reading
Barrier(s): Competition with area programs for high level students, such as Cambridge Program at Jackson Middle School and the IB Program at Edgewood Jr./Sr. High School.
Strategy(s):1. Make our College Readiness Program appealing to our community so that parents will choose our school for their high level students.
26% = 116 students out of 446 students
34% = 170 students out of 498 students
Florida Alternate Assessment:Students scoring at or above Level 7 in Reading
Barrier(s) Engaging students who have difficulties listening and following directions
Strategy(s):1. Implement activity driven flexible grouping of students
67% = 6 students out of 9 students
70% = 7 students out of 10 students
Florida Alternate Assessment:Percentage of students making learning Gains in Reading
Barrier(s): Engaging students who have difficulties listening and following directions
Strategy(s):
86% = 6 students out of 7 students
90% = 9 students out of 10 students
Page 24

1. Implement activity driven flexible grouping of students
FCAT 2.0Percentage of students in lowest 25% making learning gains in Reading
Barrier(s): Time to work with/mentor students individually
Strategy(s): 1. PLC Members will adopt a small group of students from the
lowest 25% list and will mentor and encourage them to make learning gains
59% = 59 students out of 100 students
64% = 69 students out of 107 students
Florida Alternate Assessment:Percentage of students in Lowest 25% making learning gains in Reading
Barrier(s): Engaging students who have difficulties listening and following directions
Strategy(s):1. Implement activity driven flexible grouping of students
86% = 6 students out of 7 students
90% = 9 students out of 10 students
Ambitious but Achievable Annual Measurable Objectives (AMOs). In six years school will reduce their Achievement Gap by 50%: 2012-2013 64%2013-2014 68%2014-2015 71%2015-2016 75%2016-2017 79%
Baseline data 2010-11: 57% Level 3 and above; 2011-12 60% Level 3 and aboveStudent subgroups by ethnicity NOT making satisfactory progress in reading :
White:
Black:
Hispanic:
Asian:
American Indian:
Enter numerical data for current level of
performance
37% = 128 students out of 345 students
61% = 33 studentsout of 53 students
36% = 9 students out of 25 students
0% = 0 students out of 4 students
50% = 1 student out of 2 students
Enter numerical data for expected
level of performance
33% = 120 students out of 362 students
56% = 46 students out of 82 students
33% = 6 students out of 17 students
0% = 0 students out of 4 students
50% = 1 student out of 2 students
English Language Learners (ELL) not making satisfactory progress in Reading
Barrier(s): Lack of knowledge and understanding of ELL accommodations
Strategy(s):1. Ensure that ELL accommodations are known and followed.
No data 33% = 1 student out of 3 students
Page 25

Students with Disabilities (SWD) not making satisfactory progress in Reading
Barrier(s): Improper grouping and student buy-in
Strategy(s): 1. Implement activity driven flexible grouping of students
69% = 38 students out of 55 students
(including 9 FAA students)
59% = 66 students out of 111 students (including 10 FAA
students)Economically Disadvantaged Students not making satisfactory progress in Reading
Barrier(s): Improper grouping and student buy-in
Strategy(s):1. Implement activity driven flexible grouping of students
48% = 102 students out of 212 students
43% = 119 students out of 275 students
Reading Professional DevelopmentPD Content/Topic/Focus Target
Dates/ScheduleStrategy(s) for follow-up/monitoring
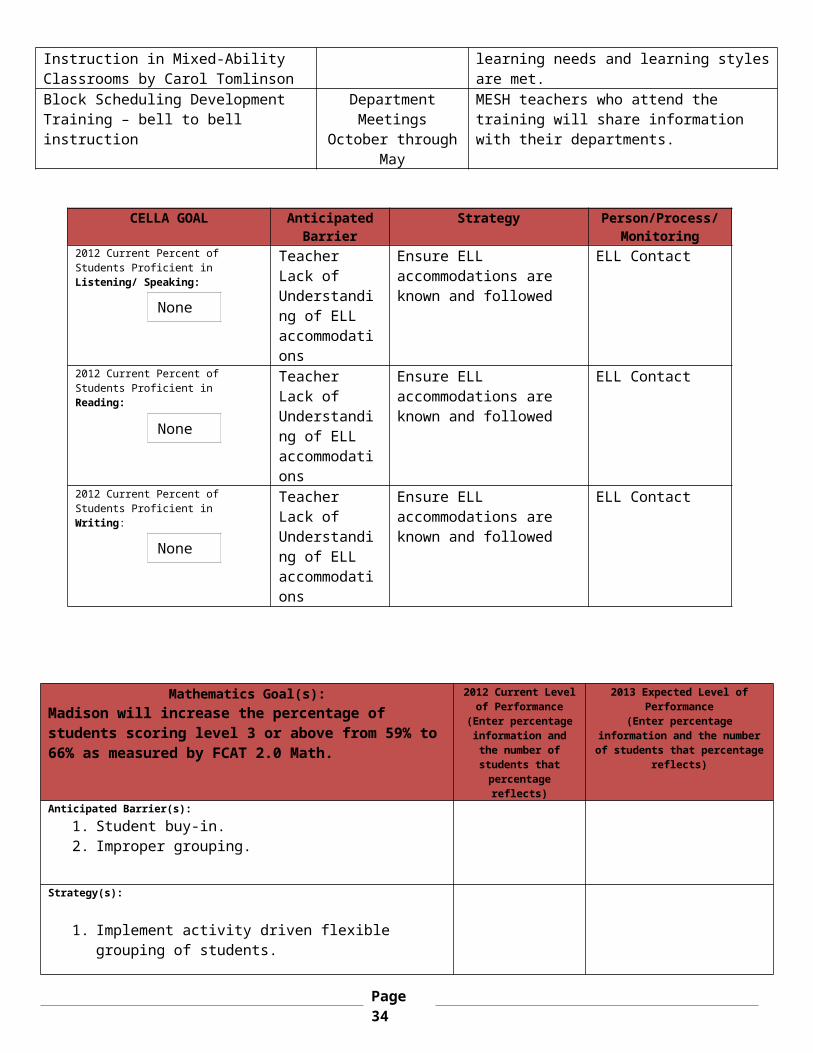
Book Study and Professional Development with Sharon Tolson: How to Differentiate Instruction in Mixed-Ability Classrooms by Carol Tomlinson
9/18; 10/16; 11/13; 1/22; 2/19; 3/19
Teachers will implement differentiated instructional techniques so that all students learning needs and learning styles are met.
Block Scheduling Development Training – bell to bell instruction
Department Meetings October through May
MESH teachers who attend the training will share information with their departments.
CELLA GOAL Anticipated Barrier
Strategy Person/Process/
Monitoring2012 Current Percent of Students Proficient in Listening/ Speaking: Teacher Lack of
Understanding of ELL accommodations
Ensure ELL accommodations are known and followed
ELL Contact
2012 Current Percent of Students Proficient in Reading: Teacher Lack of
Understanding of ELL accommodations
Ensure ELL accommodations are known and followed
ELL Contact
2012 Current Percent of Students Proficient in Writing: Teacher Lack of
Understanding of ELL accommodations
Ensure ELL accommodations are known and followed
ELL Contact
Mathematics Goal(s):Madison will increase the percentage of students scoring level 3 or above from 59% to 66% as measured by FCAT 2.0 Math.
2012 Current Level of Performance
(Enter percentage information and the number of students that percentage
reflects)
2013 Expected Level of Performance
(Enter percentage information and the number of students that percentage
reflects)
Anticipated Barrier(s):1. Student buy-in.
None tested
None
None
Page 26

2. Improper grouping.
Strategy(s):
1. Implement activity driven flexible grouping of students.
FCAT 2.0Students scoring at Achievement Level 3
Barrier(s): 1. Improper grouping.
Strategy(s):1. Implement activity driven flexible grouping of students.
59% = 261 students out of 442 students
66% = 329 students out of 498 students
Florida Alternate Assessment: Students scoring at levels 4, 5, and 6 in Mathematics
Barrier(s): Engaging students who have difficulties listening and following directions
Strategy(s):1. Implement activity driven flexible grouping of students.
22% = 2 students out of 9 students
30% = 3 students out of 10 students
FCAT 2.0Students scoring at or above Achievement Levels 4 and 5 in Mathematics
Barrier(s): 1. Improper grouping.
2. Student buy-in.
Strategy(s):2. Implement activity driven flexible grouping of students.
19% = 84 students out of 442 students
28% = 140 students out of 498 students
Florida Alternate Assessment:Students scoring at or above Level 7 in Mathematics
Barrier(s): Engaging students who have difficulties listening and following directions
Strategy(s):1. Implement activity driven flexible grouping of students.
67% = 6 students out of 9 students
70% = 7 students out of 10 students
Florida Alternate Assessment:Percentage of students making learning Gains in Mathematics
Barrier(s): Engaging students who have difficulties listening and following directions
Strategy(s):1. Implement activity driven flexible grouping of students.
86% = 6 students out of 7 students
90% = 9 students out of 10 students
FCAT 2.0Percentage of students in lowest 25% making learning gains in Mathematics
Barrier(s): Engaging students who have difficulties listening and following directions
45% = 45 students out of 100 students
51% = 53 students out of 104 students
Page 27

Strategy(s): 1. Implement activity driven flexible grouping of students.
Florida Alternate Assessment:Percentage of students in Lowest 25% making learning gains in Mathematics
Barrier(s): Engaging students who have difficulties listening and following directions
Strategy(s):1. Implement activity driven flexible grouping of students.
86% = 6 students out of 7 students
90% = 9 students out of 10 students
Ambitious but Achievable Annual Measurable Objectives (AMOs). In six years school will reduce their Achievement Gap by 50%: 2012-2013 66%2013-2014 69%2014-2015 73%2015-2016 76%2016-2017 80%
Baseline Data 2010-11: 59% Level 3 and above2011-12 59% Level 3 and above
Student subgroups by ethnicity NOT making satisfactory progress in math :
White:
Black:
Hispanic:
Asian:
American Indian:
39% = 133 students out of 341 students
52% = 28 students out of 53 students
40% = 10 students out of 25 students
0% = 0 students out of 4 students
50% = 1 student out of 2 students
32% = 116 students out of 362 students
48% = 40 students out of 82 students
26% = 5 students out of 17 students
0% = 0 students out of 4 students
50% = 1 student out of 2 students
English Language Learners (ELL) not making satisfactory progress in Mathematics No data 33% = 1 student out of 3
studentsStudents with Disabilities (SWD) not making satisfactory progress in Mathematics 67% = 37 students
out of 54 students (including 9 FAA)
58% = 65 students out of 111 students (including 10 FAA)
Economically Disadvantaged Students not making satisfactory progress in Mathematics 53% = 111 students
out of 209 students41% = 113 students of 275
students
Mathematics Professional DevelopmentPD Content/Topic/Focus Target
Dates/ScheduleStrategy(s) for follow-up/monitoring
Curriculum Guide and Math Common Core November 15, December 4
Dept meetings
Page 28

Book Study with Sharon Tolson: How to Differentiate Instruction in Mixed-Ability Classrooms
9/18; 10/16; 11/13; 1/22; 2/19; 3/19
Teachers will implement differentiated instructional techniques so that all students learning needs and learning styles are met.
Block Scheduling Development Training – bell to bell instruction
Department Meetings October through May
MESH teachers who attend the training will share information with their departments.
Writing Goal:Madison will increase the
percentage of students scoring level 3 or above from 80% to 82%
as measured on the 2013 FCAT Writes.
2012 Current Level of Performance
(Enter percentage information and the number of students
that percentage reflects)
2013 Expected Level of
Performance(Enter percentage information and the number of students that percentage
reflects)Barrier(s): Time to meet with
Page 29

individual students
Strategy(s):1. Provide individual writing
conferencing
FCAT: Students scoring at Achievement level 3.0 and higher in writing 80% = 176 students
out of 220 students82% = 206 students out of 251 students
Florida Alternate Assessment: Students scoring at 4 or higher in writing 80% = 4 students
out of 5 students83% = 5 out of 6
students
Science Goal(s)(Elementary and Middle)
Madison will increase the percentage of students scoring level
3 or above from 48% to 54% as measured by FCAT 2.0 Science.
2012 Current Level of Performance
(Enter percentage information and the number of students
that percentage reflects)
2013 Expected Level of
Performance(Enter percentage information and the number of students that percentage
reflects)Barrier(s): 1. Possible gaps in background knowledge/teaching at elementary school level.
Strategy(s): Implement differentiated instruction with particular focus on the Nature of Science through engagement in hands-on instruction and inquiry, critical thinking and fluid grouping. Students scoring at Achievement level 3 in Science: 48% = 106 students
out of 221 students54% = 136 students out of 251 students
Florida Alternate Assessment: Students scoring at levels 4, 5, and 6 in Science:
0% = 0 students out of 5 students
10% = 1 student out of 10 students
Students scoring at or above Achievement Levels 4 and 5 in Science:
7% = 16 students out of 221 students
12% = 31 students out of 251 students
Florida Alternate Assessment:Students scoring at or above Level 7 in Science:
80% = 4 students out of 5 students
83% = 5 students out of 6 students
APPENDIX B
(SECONDARY SCHOOLS ONLY)
Algebra 1 EOC Goal
Madison will increase the percentage of students scoring level
2012 Current Level of Performance
(Enter percentage information and the number of students
2013 Expected Level of Performance
(Enter percentage information and the number of students
Page 30

3 or above from 91% to 92% as measured Algebra I EOC.
that percentage reflects)
that percentage reflects)
Barrier(s): 1. Student buy-in.2. Improper grouping.
Strategy(s):1. Implement activity driven
flexible grouping of students.
Students scoring at Achievement level 3 in Algebra: 91% = 68 students
out of 75 students92% = 81 students out of 88 students
Students scoring at or above Achievement Levels 4 and 5 in Algebra: 39% = 29 Students
out of 75 students45% = 40 students out of 88 students
Ambitious but Achievable Annual Measurable Objectives (AMOs). In six years school will reduce their Achievement Gap by 50%: Baseline Data **2011-2012**Student subgroups by ethnicity (White, Black, Hispanic, Asian, American Indian) not making satisfactory progress in Algebra:
White:
Black:
Hispanic:
8% = 5 students out of 63 students
33% = 3 Students out of 9 students
0% = 0 students out of 3 students
7% = 6 students out of 75 students
17% = 1 student out of 6 students
0% = 0 students out of 1 student
English Language Learners (ELL) not making satisfactory progress in Algebra No data No data
Students with Disabilities (SWD) not making satisfactory progress in Algebra No data No data
Economically Disadvantaged Students not making satisfactory progress in Algebra
12% = 3 students out of 25 students
10% = 3 students out of 31 students
Geometry EOC Goal
N/A
2012 Current Level of Performance(Enter
percentage information and the number of students
that percentage reflects)
2013 Expected Level of Performance
(Enter percentage information and the number of students
that percentage reflects)
Barrier(s):
Strategy(s):1.
91%
Page 31

Students scoring at Achievement level 3 in Geometry:
Students scoring at or above Achievement Levels 4 and 5 in Geometry:
Ambitious but Achievable Annual Measurable Objectives (AMOs). In six years school will reduce their Achievement Gap by 50%: Baseline Data 2010-11
Student subgroups by ethnicity (White, Black, Hispanic, Asian, American Indian) not making satisfactory progress in Geometry.
White:
Black:
Hispanic:
English Language Learners (ELL) not making satisfactory progress in GeometryStudents with Disabilities (SWD) not making satisfactory progress in GeometryEconomically Disadvantaged Students not making satisfactory progress in Geometry
Biology EOC Goal
N/A
2012 Current Level of
Performance(Enter
percentage information
and the number of
students that percentage
reflects)
2013 Expected Level of
Performance(Enter
percentage information
and the number of
students that percentage
reflects)Students scoring at Achievement level 3 in Biology:Students scoring at or above Achievement Levels 4 and 5 in Biology:Civics EOC
N/A
2012 Current Level of
Performance(Enter
percentage information
and the number of
students that percentage
reflects)
2013 Expected Level of
Performance(Enter
percentage information
and the number of
students that percentage
reflects)Students scoring at Achievement level 3 in Civics:Students scoring at or above
Page 32

Achievement Levels 4 and 5 in Civics:
U.S. History EOC
N/A
2012 Current Level of
Performance(Enter
percentage information
and the number of
students that percentage
reflects)
2013 Expected Level of
Performance(Enter
percentage information
and the number of
students that percentage
reflects)Students scoring at Achievement level 3 in U. S. History:Students scoring at or above Achievement Levels 4 and 5 in U. S. History:
Science, Technology, Engineering, and
Mathematics (STEM) Goal(s)
N/A
Anticipated Barrier
Strategy Person/Process/Monitoring
Based on the analysis of school data, identify and define areas in need of improvement:
Goal 1:
Goal 2:
Career and Technical Education (CTE) Goal(s)
N/A
Anticipated Barrier
Strategy Person/Process/Monitoring
Based on the analysis of school data, identify and define areas in need of improvement:
Goal 1:
Goal 2:
Page 33
Additional Goal(s) Anticipated Barrier
Strategy Person/Process/Monitoring
Based on the analysis of school data, identify and define areas in need of improvement:
Goal 1:
Goal 2:
APPENDIX C
N/A(TITLE 1 SCHOOLS ONLY)
Highly Effective Teachers Describe the school based strategies that will be used to recruit and retain high quality, highly effective teachers to the school.
Descriptions of Strategy Person Responsible Projected Completion Date
1.2.3.
Page 34

Non-Highly Effective Instructors Provide the number of instructional staff and paraprofessionals that are teaching out-of-field and/or who are not highly effective. *When using percentages, include the number of teachers the percentage represents (e.g., 70% [35]).
Number of staff and paraprofessionals that are teaching out-of-field/and who are not highly
effective
Provide the strategies that are being implemented to support the staff in becoming
highly effective
For the following areas, please write a brief narrative that includes the data for the year 2011-12 and a description of changes you intend to incorporate to improve the data for the year 2012-13.
MULTI-TIERED SYSTEM OF SUPPORTS (MTSS)/RtI (Identify the MTSS leadership team and it role in development and implementation of the SIP along with data sources, data management and how staff is trained in MTSS)
James Madison Middle School has small collaborative teams which meet as Professional Learning Communities on Thursday mornings. It is noted that these teams could be much more effective if the majority of their students were shared and it is a goal of Madison Middle to eventually be able to “team” students. Teachers within this cross-curricular team then identify students whose data reveal that they are not as successful as their peers (behavior or academic or both). Interventions are identified and implemented through teacher collaboration. If the response to the interventions is not successful as compared to the rest of the class (with at least 80% of the rest of the class proving success), the student's data is then brought before the MTSS leadership team (to include any and all of the following individuals: administrator, school counselor, reading coach, ESE coordinator, GSP counselor, staffing specialist, school psychologist, school behavior analyst, classroom teachers) to further diagnose and provide more intensive interventions, moving the student into receiving Tier II interventions or beyond. Madison’s MTSS Leadership team utilizes the Problem Solving Steps - 1. Problem Identification (What's the problem?) 2. Problem Analysis (Why is it occurring?) 3. Intervention Design (What are we going to do about it?) 4. Response to Intervention (Is it working?) Teachers maintain data on the Edline/A3 data system. In addition, some teachers work with students to set goals and track their own progress. Data is disaggregated and utilized as the needs assessments to drive all school improvement decisions. The MTSS Leadership Team participates in data analysis which helps to decide the necessary professional development to support better instruction in addition to identifying objectives for the year. Faculty is invited to help develop the focus of the School Improvement Plan through disaggregation of data. The School Improvement Plan draft is presented to the faculty for input and to ensure proper monitoring.
Madison Middle School's Principal attended Response to Intervention (RtI) training on November 18, 2009 when it was first introduced from the district level. This information was brought back to the Madison campus. A RtI Leadership Team was formed. The RtI Leadership Team attended district training in September of 2010 and understanding of the MTSS process is still ongoing with support from Madison’s staffing specialist. The below is data relative to the last two years of students:
2011 20127th Grade Retentions 35 78th Grade Retentions 21 10
Page 35

TOTAL Retentions 56 177th Grade Good Cause Exemptions 37 398th Grade Good Cause Exemptions 29 38TOTAL Good Cause Exemptions 66 77 7th Grade First Semester # Fs 118 718th Grade First Semester # Fs 38 41 7th Grade Second Semester # Fs 161 748th Grade Second Semester # Fs 81 58 7th Grade First Semester # Students with Fs 56 388th Grade First Semester # Students with Fs 36 22 7th Grade Second Semester # Students with Fs 71 368th Grade Second Semester # Students with Fs 51 42 7th Grade Final # Fs 85 378th Grade Final # Fs 36 20 7th Grade Final # Students with Fs 38 178th Grade Final # Students with Fs 23 11
PARENT INVOLVEMENT:
Involving parents and community members in school activities and decision making strengthens and improves student achievement according to Cook Herman, Phillips, and Settersten (2002). Englund, Luckner, Whaley and Byron (2004) found communication between the parent and teacher, parent’s communication with their child at home, hours parents volunteered in schools or school functions, attendance at conferences, helping with homework, and parental expectations regarding educational achievement positively affected student achievement.
According to Williams and Chavkin (1989), "Essential Elements of Strong Parent Involvement Programs", the more parents participate in schooling, in a sustained way, at every level – in advocacy, decision-making, and oversight roles, as fund-raisers and boosters, as volunteers and paraprofessionals, and as home teachers – the better for student achievement.
Dr. Joyce Epstein maps out the six essential types of parental involvement which include1. Parenting-help all families establish home environments2. Communication - design effective forms of school-to-home and home-to-school communications about school programs and children's progress.3. Volunteering - recruit and organize parent help and support.4. Learning at home - provide information and ideas to families about how to help students at home with homework and other curriculum-related activities, decisions, and planning.5. Decision-Making - include parents in school decisions, developing parent leaders and representatives.6. Collaborating with Community -identify and integrate resources and services from the community to strengthen school programs, family practices, and student learning and development.
Parent and community members are encouraged to participate in school activities and to volunteer. Volunteers documented 7,852.98 hours during the 2010-2011 school year, and 9829.4 hours during the 2011-2012 school year.
Page 36

Madison sets up a table at registration to encourage parents to sign up to volunteer, and information for volunteering is shared during times such as Open House. Parents and community members assisted teachers by chaperoning field trips, assisting with tutoring, fundraising, and collecting materials and supplies for needy students. Many parents visited Madison for our Back to School Night, Parent Conference Night and Awards Night. Astronaut High School students also volunteer on the campus of Madison Middle School.
Madison Middle School utilizes planners for students to document information in for parents. In addition, teachers’ use of Edline is an effective manner of sharing information with parents. Madison also electronically posts date and announcement updates weekly in Edline for parents and prints and sends home a monthly newsletter. Synervoice (an electronic system which calls the student’s home) is utilized for important information sharing, as is Madison’s marquee.
Parents, staff, students, and community members are encouraged to participate in the School Advisory Council. Parents are encouraged to contact the teacher or school with any concerns or questions, and we utilize a parent to represent Madison at BPS parent meetings.
Madison Middle School maintains a closet of donated clothing for students in need, and also maintains some school supplies. In addition, Brevard County offers a website, "Center for the Whole Child Connection", to assist families in learning the resources available for them.
One hundred eighty-eight parents responded to the 2011-2012 BPS Parent Survey (compared to 94 in 2010-2011). Parents indicated that the best ways to communicate with them are email and Edline. Ninety-nine percent (99%) of parents responded either “Good” (14.4%) or “Excellent” (84.6%) to the question, “When you visit your child’s school, how welcoming is the front office staff?”. Nearly 77% percent responded that they have attended an informational meeting or academic event at Madison, and 87% stated that the information was useful. Tuesday mornings, Saturday afternoons, and Thursday evenings were the times noted as best for school events, with the evening times getting the most responses. Forty-five percent of those who responded stated that they feel well informed and satisfied with their level of participation in school decision making, while another 19% responded that they participate and feel valued. Approximately 15% stated that they do not have time to participate, and another 9% (8.8%) stated that they prefer not to be involved in decision making.
ATTENDANCE: (Include current and expected attendance rates, excessive absences and tardies)
James Madison Middle School students missed a total of 2837 unexcused days from school during the 2011-12 school year, while compiling 675 tardies. This was a huge loss of instructional time. As of the first nine weeks (August/September) of the 2012-13 school year, Madison students have compiled 390 unexcused absences and 118 tardies. The district report for the first 20 days of attendance in 2012-2013 shows that Madison Middle School has the lowest rate of attendance of any regular public school in Brevard (94.41%). This is a decline as in school year 2011-2012, Madison achieved 96.52%. Classroom teachers and administration continue to track data to monitor student attendance. In addition, the District Truancy Office conducts home visits.
SUSPENSION:
James Madison Middle School students were referred to the front office 983 times for disciplinary reasons during the 2011-12 School year, earning a total of 586 suspension days for 113 students. Madison’s 2011-12 discipline data for the entire year was reviewed with the faculty, with special attention given to peak months (October, February, March). It is recognized through the student surveys as well as the discipline data indicates that student behavior is impacting student achievement on Madison’s campus.
Month Data 2009 2010 2011 2012 2013 Average
Page 37

Incident # N/A N/A 1094 901 997.5 Student # N/A N/A 220 182 201
August Incident # 1 16 23 31 35 21.2 Student # 1 13 20 23 27 16.8
September Incident # 103 91 64 99 129 97.2 Student # 51 50 49 48 79 55.4
*October* Incident # 203 128 104 139 143.5 Student # 93 64 65 75 74.25
November Incident # 146 91 98 112 111.75 Student # 70 54 71 59 63.5
December Incident # 125 74 59 67 81.25 Student # 77 54 40 42 53.25
January Incident # 135 103 122 64 106 Student # 69 57 80 46 63
*February* Incident # 413 160 165 94 208 Student # 127 81 92 57 89.25
*March* Incident # 238 129 179 114 165 Student # 92 72 89 72 81.25
April Incident # 129 123 147 96 123.75 Student # 72 66 81 58 69.25
May Incident # 137 74 132 71 103.5 Student # 82 53 76 52 65.75
Discipline Referrals 2011 2012
# Male Event 677 692# Female Event 372 178
% Majority Event 66% 70% # White 693 609
% Minority Event 44% 30%
# Asian 2 1# Black 249 187# Hispanic 54 34# Indian 13 13# Mixed 40 26
Page 38

DROP-OUT (High Schools only):
POSTSECONDARY READINESS: (How does the school incorporate students’ academic and career planning, as well as promote student course selections, so that students’ course of study is personally meaningful? Describe strategies for improving student readiness for the public postsecondary level based on annual analysis of the High School Feedback Report.)
Page 39