brevard public schools croton elementary school
TRANSCRIPT

Brevard Public Schools
Croton ElementarySchool
2020-21 Schoolwide ImprovementPlan

Table of Contents
3School Demographics
4Purpose and Outline of the SIP
5School Information
10Needs Assessment
16Planning for Improvement
23Positive Culture & Environment
0Budget to Support Goals
Brevard - 3091 - Croton Elementary School - 2020-21 SIP
Last Modified: 11/13/2020 https://www.floridacims.org Page 2 of 24

Croton Elementary School1449 CROTON RD, Melbourne, FL 32935
http://www.croton.brevard.k12.fl.us
Demographics
Principal: Roseann Bennett M Start Date for this Principal: 7/1/2011
2019-20 Status(per MSID File) Active
School Type and Grades Served(per MSID File)
Elementary SchoolPK-6
Primary Service Type(per MSID File) K-12 General Education
2018-19 Title I School No2018-19 Economically
Disadvantaged (FRL) Rate(as reported on Survey 3)
72%
2018-19 ESSA Subgroups Represented(subgroups with 10 or more students)
(subgroups in orange are below the federal threshold)
Black/African American StudentsEconomically Disadvantaged StudentsEnglish Language LearnersHispanic StudentsMultiracial StudentsStudents With DisabilitiesWhite Students
School Grades History
2018-19: C (53%)
2017-18: C (49%)
2016-17: B (59%)
2015-16: C (49%)
2019-20 School Improvement (SI) Information*SI Region Northeast
Regional Executive Director Dustin SimsTurnaround Option/Cycle N/A
YearSupport TierESSA Status TS&I
Brevard - 3091 - Croton Elementary School - 2020-21 SIP
Last Modified: 11/13/2020 https://www.floridacims.org Page 3 of 24

* As defined under Rule 6A-1.099811, Florida Administrative Code. For more information, clickhere.
School Board Approval
This plan is pending approval by the Brevard County School Board.
SIP Authority
Section 1001.42(18), Florida Statutes, requires district school boards to annually approve andrequire implementation of a Schoolwide Improvement Plan (SIP) for each school in the districtthat has a school grade of D or F. This plan is also a requirement for Targeted Support andImprovement (TS&I) and Comprehensive Support and Improvement (CS&I) schools pursuant to1008.33 F.S. and the Every Student Succeeds Act (ESSA).
To be designated as TS&I, a school must have one or more ESSA subgroup(s) with a FederalIndex below 41%. This plan shall be approved by the district. There are three ways a school canbe designated as CS&I:
1. have a school grade of D or F2. have a graduation rate of 67% or lower3. have an overall Federal Index below 41%.
For these schools, the SIP shall be approved by the district as well as the Bureau of SchoolImprovement.
The Florida Department of Education (FDOE) SIP template meets all statutory and rulerequirements for traditional public schools and incorporates all components required for schoolsreceiving Title I funds. This template is required by State Board of Education Rule 6A-1.099811,Florida Administrative Code, for all non-charter schools with a current grade of D or F, or agraduation rate 67% or less. Districts may opt to require a SIP using a template of its choosingfor schools that do not fit the aforementioned conditions. This document was prepared by schooland district leadership using the FDOE's school improvement planning web application located atwww.floridacims.org.
Purpose and Outline of the SIP
The SIP is intended to be the primary artifact used by every school with stakeholders to reviewdata, set goals, create an action plan and monitor progress. The Florida Department of Educationencourages schools to use the SIP as a “living document” by continually updating, refining andusing the plan to guide their work throughout the year. This printed version represents the SIP asof the “Date Modified” listed in the footer.
Brevard - 3091 - Croton Elementary School - 2020-21 SIP
Last Modified: 11/13/2020 https://www.floridacims.org Page 4 of 24

Part I: School Information
School Mission and Vision
Provide the school's mission statement
Empower every student to succeed. (Revised August 2020)
Provide the school's vision statement
A positive community of respectful, responsible, and educated citizens of tomorrow.(Continued/ Approved August 2020)
School Leadership Team
MembershipIdentify the name, email address, position title, and job duties/responsibilities for eachmember of the school leadership team.:
Brevard - 3091 - Croton Elementary School - 2020-21 SIP
Last Modified: 11/13/2020 https://www.floridacims.org Page 5 of 24

Name Title Job Duties and Responsibilities
Bennett,Roseann Principal
Dr. Bennett is the principal of Croton Elementary and ensuresthat quality instruction and student safety are occurring at theschool on a daily basis. She allocates human and materialresources on campus to the greatest advantage in the serviceto students.
Responsibilities include School Leadership Team, ProgressMonitoring, Data collection, ESSA subgroup data identification,instructional coaching, professional development, studentconferencing, Classroom Walkthroughs, meet with SAC, otherstakeholder groups, and participation in Family Engagementactivities.
Kuntz-Murphy,Alicia
InstructionalCoach
Mrs. Kuntz-Murphy serves as a resource of professionaldevelopment, progress monitoring, and student data analysisthroughout Croton to generate improvement in readinginstruction and achievement. Part of her role includes utilizingthe Coaching Cycle to support improvement in teacher'sinstructional craft.
Mrs. Kuntz-Murphy is Croton's PBiS Coach, on the SchoolBased Leadership Team, offers intervention assistance andinstructional design.
Hitchcock,Amanda
Teacher,ESE
As an ESE teacher, Mrs. Hitchcock works closely with allteachers and staff on inclusive practices and data tracking forstudents. She is a member of our BPIE team, the school'sMTSS facilitator, and a collaborator between generaleducation teachers/ students and ESE teachers/ students.
Mrs. Hitchcock is our SAC Chair.
Susin,Jennifer
AssistantPrincipal
Mrs. Susin is the assistant principal at Croton Elementary. Shedemonstrates communication skills, interpersonal skills andabilities and knowledge of curriculum. Mrs. Susin showsevidence of effective decision-making skills and managementskills.
Responsibilities include Discipline data and intervention,professional development, instructional coaching, schoolleadership team, and student conferences.
Schollmeyer,Diana
Teacher,K-12
Mrs. Schollmeyer is the Title I science teacher. She overseesresearch of various programs and instruction related toscience to ensure quality teaching is taking place in gradesK-6 following the 5E instructional model. Mrs. Schollmeyermodels science instruction to allow teachers to grow in theirconcept knowledge. Mrs. Schollmeyer tracks student data
Brevard - 3091 - Croton Elementary School - 2020-21 SIP
Last Modified: 11/13/2020 https://www.floridacims.org Page 6 of 24

Name Title Job Duties and Responsibilities
from the Brevard Public Schools Science SummativeAssessments.
Luznar,Gayle
Teacher,K-12
Mrs. Luznar is a teacher leader, specifically with mathinstruction. She supports teachers with implementing theEureka Math program and other instructional resourcesrelated to math to ensure quality teaching is taking place ingrades K-6. Mrs. Luznar models math instruction to allowteachers to grow in their concept knowledge. Mrs. Luznartracks student data from the mid-Module and End of ModuleAssessments.
Jones,Patricia
Teacher,K-12
Mrs. Jones has knowledge of curriculum and childdevelopment. She supports teachers with instruction andintervention in both reading and math.
Mrs. Jones is our Title I coordinator. She plans and organizesall school-wide events for Family and CommunityEngagement. Mrs. Jones also insures our Title I program is incompliance. She works diligently with the principal on the TitleI budget and framework.
Demographic Information
Principal start dateFriday 7/1/2011, Roseann Bennett MNumber of teachers with a 2019 3-year aggregate or a 1-year Algebra state VAMrating of Highly Effective. Note: For UniSIG Supplemental Teacher Allocation, teachersmust have at least 10 student assessments.1Number of teachers with a 2019 3-year aggregate or a 1-year Algebra state VAMrating of Effective. Note: For UniSIG Supplemental Teacher Allocation, teachers musthave at least 10 student assessments.8Total number of teacher positions allocated to the school39Demographic Data
2020-21 Status(per MSID File) Active
School Type and Grades Served(per MSID File)
Elementary SchoolPK-6
Brevard - 3091 - Croton Elementary School - 2020-21 SIP
Last Modified: 11/13/2020 https://www.floridacims.org Page 7 of 24

Primary Service Type(per MSID File) K-12 General Education
2018-19 Title I School No2018-19 Economically
Disadvantaged (FRL) Rate(as reported on Survey 3)
72%
2018-19 ESSA Subgroups Represented(subgroups with 10 or more students)
(subgroups in orange are below the federalthreshold)
Black/African American StudentsEconomically DisadvantagedStudentsEnglish Language LearnersHispanic StudentsMultiracial StudentsStudents With DisabilitiesWhite Students
School Grades History
2018-19: C (53%)2017-18: C (49%)2016-17: B (59%)2015-16: C (49%)
2019-20 School Improvement (SI) Information*SI Region Northeast
Regional Executive Director Dustin SimsTurnaround Option/Cycle N/A
YearSupport TierESSA Status TS&I
* As defined under Rule 6A-1.099811, Florida Administrative Code. For more information,click here.
Early Warning Systems
Current Year
The number of students by grade level that exhibit each early warningindicator listed:
Brevard - 3091 - Croton Elementary School - 2020-21 SIP
Last Modified: 11/13/2020 https://www.floridacims.org Page 8 of 24

Grade LevelIndicator
K 1 2 3 4 5 6 7 8 9 10 11 12Total
Number of students enrolled 73 73 63 63 66 65 64 0 0 0 0 0 0 467Attendance below 90 percent 2 14 12 4 6 6 12 0 0 0 0 0 0 56One or more suspensions 0 5 0 0 1 2 4 0 0 0 0 0 0 12Course failure in ELA 0 0 0 0 1 1 0 0 0 0 0 0 0 2Course failure in Math 0 0 0 0 2 2 0 0 0 0 0 0 0 4Level 1 on 2019 statewide ELAassessment 0 0 0 0 3 6 18 0 0 0 0 0 0 27
Level 1 on 2019 statewide Mathassessment 0 0 0 0 2 5 11 0 0 0 0 0 0 18
The number of students with two or more early warning indicators:
Grade LevelIndicator
K 1 2 3 4 5 6 7 8 9 10 11 12Total
Students with two or more indicators 0 0 0 0 3 3 15 0 0 0 0 0 0 21
The number of students identified as retainees:
Grade LevelIndicator
K 1 2 3 4 5 6 7 8 9 10 11 12Total
Retained Students: Current Year 2 8 5 3 1 0 0 0 0 0 0 0 0 19Students retained two or more times 0 0 0 0 0 1 4 0 0 0 0 0 0 5
Date this data was collected or last updatedMonday 6/8/2020
Prior Year - As Reported
The number of students by grade level that exhibit each early warningindicator:
Grade LevelIndicator
K 1 2 3 4 5 6 7 8 9 10 11 12Total
Number of students enrolled 73 81 68 67 69 67 79 0 0 0 0 0 0 504Attendance below 90 percent 2 7 4 4 9 7 12 0 0 0 0 0 0 45One or more suspensions 2 0 1 0 4 4 3 0 0 0 0 0 0 14Course failure in ELA or Math 0 0 0 1 5 5 10 0 0 0 0 0 0 21Level 1 on statewide assessment 0 0 0 0 0 0 1 0 0 0 0 0 0 1
The number of students with two or more early warning indicators:
Grade LevelIndicator
K 1 2 3 4 5 6 7 8 9 10 11 12Total
Students with two or more indicators 0 0 0 1 5 5 10 0 0 0 0 0 0 21
Brevard - 3091 - Croton Elementary School - 2020-21 SIP
Last Modified: 11/13/2020 https://www.floridacims.org Page 9 of 24

The number of students identified as retainees:
Grade LevelIndicator
K 1 2 3 4 5 6 7 8 9 10 11 12Total
Retained Students: Current Year 1 6 0 4 1 1 0 0 0 0 0 0 0 13Students retained two or more times 0 0 0 0 1 3 0 0 0 0 0 0 0 4
Prior Year - Updated
The number of students by grade level that exhibit each early warningindicator:
Grade LevelIndicator
K 1 2 3 4 5 6 7 8 9 10 11 12Total
Number of students enrolled 73 81 68 67 69 67 79 0 0 0 0 0 0 504Attendance below 90 percent 2 7 4 4 9 7 12 0 0 0 0 0 0 45One or more suspensions 2 0 1 0 4 4 3 0 0 0 0 0 0 14Course failure in ELA or Math 0 0 0 1 5 5 10 0 0 0 0 0 0 21Level 1 on statewide assessment 0 0 0 0 0 0 1 0 0 0 0 0 0 1
The number of students with two or more early warning indicators:
Grade LevelIndicator
K 1 2 3 4 5 6 7 8 9 10 11 12Total
Students with two or more indicators 0 0 0 1 5 5 10 0 0 0 0 0 0 21
The number of students identified as retainees:
Grade LevelIndicator
K 1 2 3 4 5 6 7 8 9 10 11 12Total
Retained Students: Current Year 1 6 0 4 1 1 0 0 0 0 0 0 0 13Students retained two or more times 0 0 0 0 1 3 0 0 0 0 0 0 0 4
Part II: Needs Assessment/Analysis
School DataPlease note that the district and state averages shown here represent the averages for similarschool types (elementary, middle, high school, or combination schools).
2019 2018School Grade Component School District State School District StateELA Achievement 56% 62% 57% 51% 60% 56%ELA Learning Gains 56% 60% 58% 53% 54% 55%ELA Lowest 25th Percentile 64% 57% 53% 38% 46% 48%Math Achievement 64% 63% 63% 58% 62% 62%Math Learning Gains 55% 65% 62% 52% 59% 59%Math Lowest 25th Percentile 43% 53% 51% 45% 49% 47%Science Achievement 36% 57% 53% 45% 57% 55%
Brevard - 3091 - Croton Elementary School - 2020-21 SIP
Last Modified: 11/13/2020 https://www.floridacims.org Page 10 of 24

EWS Indicators as Input Earlier in the Survey
Grade Level (prior year reported)Indicator K 1 2 3 4 5 6 Total(0) (0) (0) (0) (0) (0) (0) 0 (0)
Grade Level DataNOTE: This data is raw data and includes ALL students who tested at the school.This is not school grade data.
ELA
Grade Year School DistrictSchool-District
ComparisonState
School-State
Comparison03 2019 65% 64% 1% 58% 7%
2018 51% 63% -12% 57% -6%Same Grade Comparison 14%
Cohort Comparison04 2019 55% 61% -6% 58% -3%
2018 45% 57% -12% 56% -11%Same Grade Comparison 10%
Cohort Comparison 4%05 2019 42% 60% -18% 56% -14%
2018 51% 54% -3% 55% -4%Same Grade Comparison -9%
Cohort Comparison -3%06 2019 55% 60% -5% 54% 1%
2018 54% 63% -9% 52% 2%Same Grade Comparison 1%
Cohort Comparison 4%
MATH
Grade Year School DistrictSchool-District
ComparisonState
School-State
Comparison03 2019 74% 61% 13% 62% 12%
2018 69% 62% 7% 62% 7%Same Grade Comparison 5%
Cohort Comparison04 2019 68% 64% 4% 64% 4%
2018 63% 59% 4% 62% 1%Same Grade Comparison 5%
Cohort Comparison -1%05 2019 48% 60% -12% 60% -12%
2018 60% 58% 2% 61% -1%Same Grade Comparison -12%
Cohort Comparison -15%06 2019 58% 67% -9% 55% 3%
Brevard - 3091 - Croton Elementary School - 2020-21 SIP
Last Modified: 11/13/2020 https://www.floridacims.org Page 11 of 24

MATH
Grade Year School DistrictSchool-District
ComparisonState
School-State
Comparison2018 33% 68% -35% 52% -19%
Same Grade Comparison 25%Cohort Comparison -2%
SCIENCE
Grade Year School DistrictSchool-District
ComparisonState
School-State
Comparison05 2019 35% 56% -21% 53% -18%
2018 43% 57% -14% 55% -12%Same Grade Comparison -8%
Cohort Comparison
Subgroup Data2019 SCHOOL GRADE COMPONENTS BY SUBGROUPS
Subgroups ELAAch.
ELALG
ELALG
L25%MathAch.
MathLG
MathLG
L25%Sci
Ach.SS
Ach.MS
Accel.GradRate
2016-17
C & CAccel
2016-17SWD 32 42 48 44 42 21 6ELL 48 75 48 65 36BLK 39 50 50 45HSP 56 64 80 54 58 58 29MUL 69 56WHT 57 53 58 70 53 27 38FRL 53 60 68 61 59 47 35
2018 SCHOOL GRADE COMPONENTS BY SUBGROUPS
Subgroups ELAAch.
ELALG
ELALG
L25%MathAch.
MathLG
MathLG
L25%Sci
Ach.SS
Ach.MS
Accel.GradRate
2015-16
C & CAccel
2015-16SWD 29 38 26 44 55 33ELL 38 40 59 50BLK 33 56 36 47HSP 43 64 69 52 47 50 21MUL 44 50 31 42WHT 56 52 24 64 54 46 55FRL 46 48 32 55 49 37 35
ESSA DataThis data has been updated for the 2018-19 school year as of 7/16/2019.
ESSA Federal IndexESSA Category (TS&I or CS&I) TS&IOVERALL Federal Index – All Students 54
Brevard - 3091 - Croton Elementary School - 2020-21 SIP
Last Modified: 11/13/2020 https://www.floridacims.org Page 12 of 24

ESSA Federal IndexOVERALL Federal Index Below 41% All Students NOTotal Number of Subgroups Missing the Target 1Progress of English Language Learners in Achieving English Language Proficiency 58Total Points Earned for the Federal Index 432Total Components for the Federal Index 8Percent Tested 99%
Subgroup Data
Students With DisabilitiesFederal Index - Students With Disabilities 34Students With Disabilities Subgroup Below 41% in the Current Year? YESNumber of Consecutive Years Students With Disabilities Subgroup Below 32% 0
English Language LearnersFederal Index - English Language Learners 55English Language Learners Subgroup Below 41% in the Current Year? NONumber of Consecutive Years English Language Learners Subgroup Below 32% 0
Asian StudentsFederal Index - Asian StudentsAsian Students Subgroup Below 41% in the Current Year? N/ANumber of Consecutive Years Asian Students Subgroup Below 32% 0
Black/African American StudentsFederal Index - Black/African American Students 46Black/African American Students Subgroup Below 41% in the Current Year? NONumber of Consecutive Years Black/African American Students Subgroup Below 32% 0
Hispanic StudentsFederal Index - Hispanic Students 57Hispanic Students Subgroup Below 41% in the Current Year? NONumber of Consecutive Years Hispanic Students Subgroup Below 32% 0
Multiracial StudentsFederal Index - Multiracial Students 63Multiracial Students Subgroup Below 41% in the Current Year? NONumber of Consecutive Years Multiracial Students Subgroup Below 32% 0
Brevard - 3091 - Croton Elementary School - 2020-21 SIP
Last Modified: 11/13/2020 https://www.floridacims.org Page 13 of 24

Native American StudentsFederal Index - Native American StudentsNative American Students Subgroup Below 41% in the Current Year? N/ANumber of Consecutive Years Native American Students Subgroup Below 32% 0
Pacific Islander StudentsFederal Index - Pacific Islander StudentsPacific Islander Students Subgroup Below 41% in the Current Year? N/ANumber of Consecutive Years Pacific Islander Students Subgroup Below 32% 0
White StudentsFederal Index - White Students 51White Students Subgroup Below 41% in the Current Year? NONumber of Consecutive Years White Students Subgroup Below 32% 0
Economically Disadvantaged StudentsFederal Index - Economically Disadvantaged Students 54Economically Disadvantaged Students Subgroup Below 41% in the Current Year? NONumber of Consecutive Years Economically Disadvantaged Students Subgroup Below32% 0
Analysis
Data ReflectionAnswer the following reflection prompts after examining any/all relevant school datasources (see guide for examples for relevant data sources).
Which data component showed the lowest performance? Explain thecontributing factor(s) to last year’s low performance and discuss any trends
Croton Elementary showed the lowest performance in fifth grade science on thestatewide assessments during the Spring 2019 testing administration. Croton had anoverall percentage of thirty-five percent of students scoring a level three or above whichis loss of eight percentage points when compared to the previous school year(2017-2018). Upon reflection, we concluded that we did not fully focus on scienceintegration into the Language Arts Block with complete fidelity. In addition, Croton alsofound that this decrease in test scores could be due to having a scarce amount of“hands-on” science experiences through scientific inquiry based investigation. The trendindicates that our science scores have decreased since 2016 an average of sevenpercentage points each year.
Which data component showed the greatest decline from the prior year?Explain the factor(s) that contributed to this decline
When analyzing Croton’s overall performance on statewide assessments during the2018-2019 testing administration, Croton staff and School Advisory Council (SAC)
Brevard - 3091 - Croton Elementary School - 2020-21 SIP
Last Modified: 11/13/2020 https://www.floridacims.org Page 14 of 24

members determined that the greatest decline for the 2017-2018 testing administrationwas on the Science Assessment with a decline of nine points.After further analysis, Croton staff, parents and community members also determinedthat when looking at individual grade level data the area where Croton has shown thegreatest decline in test scores was in fifth grade math. For the 2018-2019 school year,forty-eight percent of the fifth graders scored a level three or above while during the2017-2018 school year the percentage of level three or above was at sixty percent. Thisshows that there was a twelve percent decline from the 2017-2018 school year.
Which data component had the greatest gap when compared to the stateaverage? Explain the factor(s) that contributed to this gap and any trends
The state average for Science is fifty-three percent of students showing a proficiencyunderstanding of level three and above while Croton’s fifth grade science scores resultedin only thirty-five percent of students scoring a level three and above in proficiencyunderstanding of grades K-5 science concepts. Croton eighteen percentage points belowthe state average. Upon reflection, Croton staff and its other stakeholders from theSchool Advisory Council (SAC) which is made up of parents and other communitymembers came to the conclusion that we did not fully focus on science integration in theLanguage Arts Block or provide enough “hands-on” or inquiry based scienceinvestigations to our students in previous years. The trend indicates that our sciencescores have decreased since 2016 an average of seven percentage points each year.
Which data component showed the most improvement? What new actions didyour school take in this area?
Croton staff and School Advisory Council (SAC) members determined that the componentthat has shown the most improvement from 2017-2018 to the 2018-2019 school yearwas the lowest twenty-five percent scoring a level three and above in Language Arts.This score improved from thirty-eight percent to sixty-four percent which is a twenty-six-point increase. Croton utilized a walk to intervention model in ELA for the lowest twenty-five percent of students in each grade level kindergarten through sixth grade. Thisallowed us to help struggling students and provide an in depth focus on monitoringstudent progress through the Multi-tiered Systems of Support (MTSS) .
In addition, Croton worked hard on providing students with exceptional needs a moreinclusive education by including students within the general education classes morefrequently so all students are afforded the least restrictive environment as possible.
Further analysis of Croton’s state assessment data show that sixth grade math alsoimproved greatly from the 2017-2018 school year. According to the assessment data,Croton’s test scores went from thirty-three percent of level three and above in the2017-2018 school year to fifty-eight percent in the 2018-2019 school year. This increasein test scores showed a gain of twenty-five percentage points. An action that supportedthis improvement was the continuation in the 2018-2019 school year of Eureka Math.The use of Eureka Math for two consecutive years prior helped to build a foundation forstudent understanding of math concepts.
Reflecting on the EWS data from Part I (D), identify one or two potential areasof concern?
An area of concern from the Early Warning Systems data are the attendance rate. Crotonwill work on various ways to improve student attendance to include student and staffincentives.
Brevard - 3091 - Croton Elementary School - 2020-21 SIP
Last Modified: 11/13/2020 https://www.floridacims.org Page 15 of 24

Another area of concern reflected in the Early Warning System data is the number ofstudents earning a Level 1 on FSA Assessments. Through our Plan and Areas of Focus, wewill work to decrease this number at every grade level.
Rank your highest priorities (maximum of 5) for schoolwide improvement inthe upcoming school year
Through careful analysis, the Croton staff, parents and community partners all decidedthat the top priorities for Croton Elementary to focus on for the 2019-2020 school yearare:
*Science proficiency of level three and above on the statewide Science assessment forthe Spring 2020 testing administration. This includes opportunities for Scienceintegration into the Language Arts block. Incorporating Science into the Language Artsblock will help to develop and enrich a science vocabulary that aligns with a contentbased integrated curriculum school wide. We will increase our inclusive practices for allstudents with disabilities in Science.
*Maintain a concentration on Math instruction utilizing the Eureka Math program withfidelity. Teachers will utilize the mid- and end of Module assessments to analyze students'understanding of standards and drive their instruction. Students with disabilities will beincluded in General Education instruction as applicabe. This will also support theLearning Gains of our lowest twenty-five percent in math school wide.
*Continue to focus on implementing rigorous and remedial reading opportunities toimprove and maintain our proficiency levels in test scores for English/ Language Arts.Incorporating the Standards Focus Boards in all General Education classrooms for ELAand aligning student tasks to the standards will provide students the opportunity to takemore ownership of their learning. The use of the i-Ready program will provide us anopportunity to monitor growth as well as trach student demographics. We will continueto utilize the Multi-Tier System of Support to provide intervention to students that mayhave skill gaps. Including our students with disabilities will allow us to maintain ourgrowth with students in the lowest 25%.
Part III: Planning for Improvement
Areas of Focus:
Brevard - 3091 - Croton Elementary School - 2020-21 SIP
Last Modified: 11/13/2020 https://www.floridacims.org Page 16 of 24
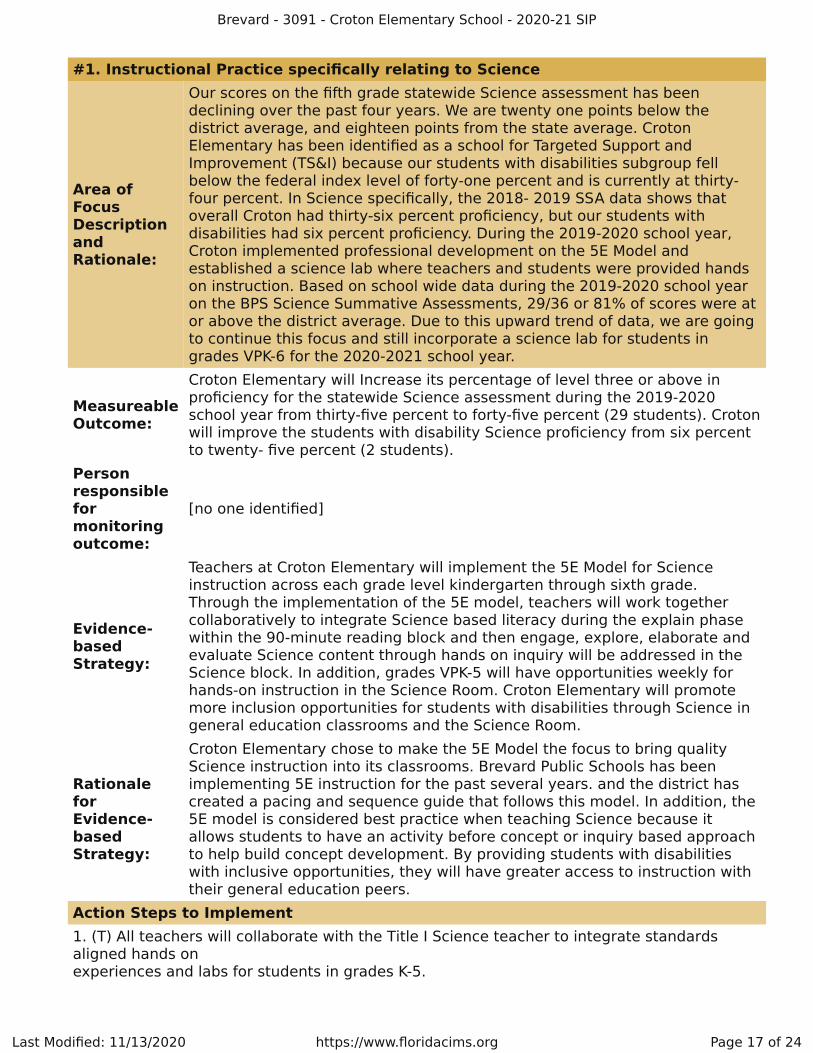
#1. Instructional Practice specifically relating to Science
Area ofFocusDescriptionandRationale:
Our scores on the fifth grade statewide Science assessment has beendeclining over the past four years. We are twenty one points below thedistrict average, and eighteen points from the state average. CrotonElementary has been identified as a school for Targeted Support andImprovement (TS&I) because our students with disabilities subgroup fellbelow the federal index level of forty-one percent and is currently at thirty-four percent. In Science specifically, the 2018- 2019 SSA data shows thatoverall Croton had thirty-six percent proficiency, but our students withdisabilities had six percent proficiency. During the 2019-2020 school year,Croton implemented professional development on the 5E Model andestablished a science lab where teachers and students were provided handson instruction. Based on school wide data during the 2019-2020 school yearon the BPS Science Summative Assessments, 29/36 or 81% of scores were ator above the district average. Due to this upward trend of data, we are goingto continue this focus and still incorporate a science lab for students ingrades VPK-6 for the 2020-2021 school year.
MeasureableOutcome:
Croton Elementary will Increase its percentage of level three or above inproficiency for the statewide Science assessment during the 2019-2020school year from thirty-five percent to forty-five percent (29 students). Crotonwill improve the students with disability Science proficiency from six percentto twenty- five percent (2 students).
Personresponsibleformonitoringoutcome:
[no one identified]
Evidence-basedStrategy:
Teachers at Croton Elementary will implement the 5E Model for Scienceinstruction across each grade level kindergarten through sixth grade.Through the implementation of the 5E model, teachers will work togethercollaboratively to integrate Science based literacy during the explain phasewithin the 90-minute reading block and then engage, explore, elaborate andevaluate Science content through hands on inquiry will be addressed in theScience block. In addition, grades VPK-5 will have opportunities weekly forhands-on instruction in the Science Room. Croton Elementary will promotemore inclusion opportunities for students with disabilities through Science ingeneral education classrooms and the Science Room.
RationaleforEvidence-basedStrategy:
Croton Elementary chose to make the 5E Model the focus to bring qualityScience instruction into its classrooms. Brevard Public Schools has beenimplementing 5E instruction for the past several years. and the district hascreated a pacing and sequence guide that follows this model. In addition, the5E model is considered best practice when teaching Science because itallows students to have an activity before concept or inquiry based approachto help build concept development. By providing students with disabilitieswith inclusive opportunities, they will have greater access to instruction withtheir general education peers.
Action Steps to Implement1. (T) All teachers will collaborate with the Title I Science teacher to integrate standardsaligned hands onexperiences and labs for students in grades K-5.
Brevard - 3091 - Croton Elementary School - 2020-21 SIP
Last Modified: 11/13/2020 https://www.floridacims.org Page 17 of 24

2. (T) All teachers will administer and analyze results of district summative assessments totrack studentunderstanding of Florida Science Standards monitored in Performance Matters.3. (T) Administration will provide professional development for all teachers related to the 5EModel and bestpractices for Science instruction.4. (T) Administration will provide collaborative planning opportunities for teachers to workwith grade levelteams to prepare and plan standards aligned instruction based on student data. All teacherswill meet toinclude ESE in response to our BPIE results.5. Students will engage, explore, and elaborate Science content.6. Students will utilize the Expanding Expressions Tool and Thinking Maps to help buildScientific reasoning.7. Teachers, administrators, and parents will meet to review student progress in Science.PersonResponsible Diana Schollmeyer ([email protected])
Brevard - 3091 - Croton Elementary School - 2020-21 SIP
Last Modified: 11/13/2020 https://www.floridacims.org Page 18 of 24

#2. Instructional Practice specifically relating to Math
Area ofFocusDescriptionandRationale:
Based on 2018-2019 FSA Math data, it is of note that the percentage ofstudents achieving Learning Gains and Learning Gains of the lowest twenty-five percent decreased. Specifically, our scores on the fifth grade statewidemath assessment declined from fifty-one percent to forty two percent. Inaddition, Croton Elementary has been identified as a school for TargetedSupport and Improvement (TS&I) because our students with disabilitiessubgroup fell below the federal index level of forty-one percent and iscurrently at thirty-four percent. For the 2019-2020 school year, our overallproficiency level on the Eureka Math Module Assessments increased. Due tothe lack of statewide testing, we do not have appropriate data from thestatewide math assessment to determine the percentage of studentsachieving learning gains.
MeasureableOutcome:
The implementation of Eureka Math for the 2019-2020 school year reflectmath scores at or above the district average for schools using Eureka Math.Based on this trend data, our goal remains to increase from forty-two percentlevel three and above to sixty percent (39 of the current 5th grade students)level three and above during the Spring 2021 school administration of theFlorida Standards Math Assessment. In addition, Croton will improve theirfederal index status from thirty-four percent to forty-five percent (20students) in the 2020-2021 school year. Furthermore, our i-Ready Diagnosticindicated 16% of students (63 students) in grades 1-6 were on level (green).Our goals are to have 70% of students (275 students) reach their typicalgrowth and increase the number of students achieving on grade levelperformance (green) to 30% (118 students).
Personresponsibleformonitoringoutcome:
Gayle Luznar ([email protected])
Evidence-basedStrategy:
Teachers in each grade level will implement the Eureka Math program withfidelity to ensure mastery of the grade level standards and the mathematicalshifts. Croton Elementary will continue to promote more inclusionopportunities for students with disabilities through Math in general educationclassrooms.
RationaleforEvidence-basedStrategy:
When addressing the Florida Shifts in Mathematics, the use of focus,coherence, and rigor will assist in improving student understanding of mathconcepts. Data show that Croton's third grade students from the 2018-2019school year that used Eureka Math the two previous years, scored at seventyfour percent level three and above and surpassed the district average bythirteen percent and the state average by twelve percent. By providing allstudents, including those with disabilities, the opportunity of a leastrestrictive environment, this student population will be exposed to gradelevel content with their on grade level peers. The achievement continues toshow an increase in data points for the 2019-2020 Croton fourth graders witha seventy-eight percent average compared to district fourth grade average ofsixty-eight percent.
Action Steps to Implement1. (T) All teachers will collaboratively plan using Eureka Math curriculum, including the BPSEureka Math Pacing and Sequence guide.
Brevard - 3091 - Croton Elementary School - 2020-21 SIP
Last Modified: 11/13/2020 https://www.floridacims.org Page 19 of 24

2. (T) All teachers will administer and analyze results of Eureka Exit Slips (with immediatereteach), Math Mid and End of Module Assessments, and i-Ready Math Diagnostics.3. (T) Administration will provide professional development for teachers related to EurekaMath.4. (T) Administration will provide collaborative planning opportunities for teachers to workwith grade level teams to prepare and plan standards aligned instruction based on studentdata. All teachers will meet to include ESE in response to our BPIE results.5. Students will complete all components of Eureka Math to promote balanced and rigorousinstruction content.6. Students will utilize the Expanding Expressions Tool and Thinking Maps to buildMathematical Practices.7. Teachers, administrators, and parents will meet to review student progress in Math skillswith Eureka and i-Ready data.PersonResponsible [no one identified]
Brevard - 3091 - Croton Elementary School - 2020-21 SIP
Last Modified: 11/13/2020 https://www.floridacims.org Page 20 of 24

#3. Instructional Practice specifically relating to ELA
Area ofFocusDescriptionandRationale:
In 2018-2019 Croton showed growth in learning gains in ELA scores for thelowest twenty-five percent due to its structured reading program andinterventions. Croton will maintain this focus in the area of reading so wecontinue to see steady gains. Literacy encompasses both reading andwriting. The writing component of our ELA scores will be addressed in orderto provide an overall score increase. Our implementation of the ExpandingExpression Tool throughout all Areas of Focus will be enhanced through theuse of evidence-researched programs that provide curriculum, materials, andsupports for both students and teachers.
Croton Elementary has been identified as a school for Targeted Support andImprovement (TS&I) because our students with disabilities subgroup fellbelow the federal index level of forty-one percent and is currently at thirty-four percent. Specifically, our scores for overall ELA proficiency is at fifty-sixpercent, while students with disabilities is thirty- two percent.
MeasureableOutcome:
Croton will improve the overall ELA proficiency from fifty-six percent to sixtypercent. Croton will improve their federal index status from thirty-fourpercent to forty-five percent in the 2020-2021 school year. Croton will alsoimprove the students with disability ELA proficiency from thirty-two percentto forty percent (18 students). In addition, at least fifty percent of ourstudents with disabilities will achieve their typical growth as measured by i-Ready at the end of the year.
Personresponsibleformonitoringoutcome:
Alicia Kuntz-Murphy ([email protected])
Evidence-basedStrategy:
Croton Elementary will continue to use the Multi-Tiered System of Support(MTSS) to track student performance in reading skills. In addition, Croton willcontinue the walk to intervention model to support students who arestruggling with their reading development. Croton Elementary will promotemore inclusion opportunities for students with disabilities through ELA ingeneral education classrooms. We will utilize the i-Ready program to monitorstudent progress with ELA standards.
RationaleforEvidence-basedStrategy:
Croton will continue to utilize the i-Ready program to support student workwith the ELA standards. The utilization of i-Ready will provide an opportunityto assess, monitor, and intervene to assist with student success. The MTSSand walk to intervention models will continue to be implemented so thatstudents who are struggling can bridge or close the gaps in their readingperformance. Continuing this model at Croton, students will improve ELAproficiency. By providing students with disabilities inclusive opportunities,they will have greater access to instruction with their general educationpeers. i-Ready resources will include the student's path determined by thediagnostics, Teacher Toolbox that provides lesson plans where a gap exists inreading components, and analyzing the Standards Mastery assessments(grades 2-6).
Action Steps to Implement1. All teachers will collaborate to plan literacy instruction, integrating science and socialstudies, and building concept understanding in the ELA block using rigorous text and literacy
Brevard - 3091 - Croton Elementary School - 2020-21 SIP
Last Modified: 11/13/2020 https://www.floridacims.org Page 21 of 24

strategies, focusing on intervention and the lowest twenty-five percent.2. All teachers, Title I personnel, and administration will meet to monitor literacy data,problem solve and plan intervention for students in the lowest twenty-five percent.3. Administration will provide professional development for all teachers related to StandardsFocus Boards,Literacy, i-Ready, and MTSS process.4. Administration will provide collaborative opportunities for teachers to work with gradelevelsto prepare and plan standards aligned instruction based on student data. All teachers willmeet toinclude ESE in response to our BPIE results.5. Students will complete literacy activities.6. Students will utilize the Expanding Expressions Tool and Thinking Maps to build literacyskills.7. Teachers, administrators, and parents will review student progress with literacy.PersonResponsible Alicia Kuntz-Murphy ([email protected])
Additional Schoolwide Improvement Priorities
Brevard - 3091 - Croton Elementary School - 2020-21 SIP
Last Modified: 11/13/2020 https://www.floridacims.org Page 22 of 24

After choosing your Area(s) of Focus, explain how you will address the remaining schoolwideimprovement priorities.As we are aligning our Instructional Areas of Focus and moving towards a morepositive culture, we realize there are additional priorities that we need tocontinue, and others that we need to be included in our SIP.
The school wide initiatives Croton will continue to utilize are:-Expanding Expressions Tool - ensures vocabulary is being developed. TheExpanding Expressions Tool willalso be used to text code and build responses with writing.-Thinking Maps across all content areas to show conceptual understanding ofstrategies through patterns.-Positive Behavior Intervention Support (PBiS) that supports rewarding positivebehavior in meeting ourschool-wide expectations.
SIP priorities need to include chances for us to improve our attendance rates andacademic outcomes (Early Warning Systems indicators) by providingopportunities that students in non-Title I schools may receive. Funding will beallocated to maintaining supplies/ materials for instructional use and hand-onlearning activities. In addition, we will include incentives and motivation forstudent achievement through educational Field Trips that align with academicAreas of Focus, as well as those that provide an experience for education afterelementary reinforcing the K-20 (kindergarten to college) continuum. We believethat these experiences allow students to see an example of their future.
Furthermore, it is imperative that we address students' social and emotionallearning. Through professional development and application of ConsciousDiscipline, one-on-one goal setting conferences, the implementation of Sanford-Harmony curriculum and CIRCLES, our students' attitudes toward school willimprove and their stress will be reduced. This will enable them to be affordedpositive social relationships with others as well as a greater awareness of theiremotions, strengths, areas to improve and goals.
Action Steps:1.) Maintain necessary supplies for teacher and student engagement ininstruction and learning to improve academic proficiency.2.) Organize and attend educational field trips in content areas as well as thoseto post-elementary schools.3.) Provide professional development to staff on Conscious Discipline andmonitor its implementation.
Part IV: Positive Culture & Environment
Brevard - 3091 - Croton Elementary School - 2020-21 SIP
Last Modified: 11/13/2020 https://www.floridacims.org Page 23 of 24

A positive school culture and environment reflects: a supportive and fulfilling environment,learning conditions that meet the needs of all students, people who are sure of their roles andrelationships in student learning, and a culture that values trust, respect and highexpectations. Consulting with various stakeholder groups to employ school improvementstrategies that impact the positive school culture and environment are critical. Stakeholdergroups more proximal to the school include teachers, students, and families of students,volunteers, and school board members. Broad stakeholder groups include early childhoodproviders, community colleges and universities, social services, and business partners.Stakeholders play a key role in school performance and addressing equity. Consulting variousstakeholder groups is critical in formulating a statement of vision, mission, values, goals, andemploying school improvement strategies.Describe how the school addresses building a positive school culture and environmentensuring all stakeholders are involved.
Croton will build positive relationships with parents, families, and other communitystakeholders by providing opportunities for them to be involved in making decisions in regardsto our Title I program. We will host an Annual Meeting to offer assistance in understanding thestate standards and how families can support Croton students and their achievement. Basedon parent survey results, Croton will host several events that will allow families to learn howthey can encourage and support their children at home. We will provide information in aformat and language that parents can understand and offer information in other languageswhen feasible. Croton will host a Community Meeting that allows families and communitystakeholders the opportunity to evaluate our Title I program and offer feedback for changes.
Parent Family and Engagement Plan (PFEP) LinkThe school completes a Parental Involvement Plan (PFEP), which is available at the schoolsite.
Brevard - 3091 - Croton Elementary School - 2020-21 SIP
Last Modified: 11/13/2020 https://www.floridacims.org Page 24 of 24