brexit and the health & social care workforce in … · occupations in health and social care...
TRANSCRIPT

BREXIT AND THE HEALTH & SOCIAL CARE WORKFORCE IN THE UK
Date: 6 November 2018
Prepared for the Cavendish Coalition for the project
“Incentivising the domestic workforce and securing clear, reasonable routes
for immigration both during and after the UK’s exit from the EU”
Da Peter Dolton, David Nguyen,
Maria Castellanos and Heather Rolfe
Da
About the National Institute of Economic and Social Research
The National Institute of Economic and Social Research is Britain's longest established independent
research institute, founded in 1938. The vision of our founders was to carry out research to improve
understanding of the economic and social forces that affect people’s lives, and the ways in which
policy can bring about change. Seventy-five years later, this remains central to NIESR’s ethos. We
continue to apply our expertise in both quantitative and qualitative methods and our understanding
of economic and social issues to current debates and to influence policy. The Institute is
independent of all party political interests.
National Institute of Economic and Social Research
2 Dean Trench St
London SW1P 3HE
T: +44 (0)20 7222 7665
niesr.ac.uk
Registered charity no. 306083
This policy report was first published in November 2018
© National Institute of Economic and Social Research 2018

3 | Brexit and the Health & Social Care Workforce in the UK National Institute of Economic and Social Research
NIESR Policy Report
Brexit and the Health and Social Care Workforce in the UK
Peter Dolton, David Nguyen, Maria Castellanos and Heather Rolfe
Prepared for the Cavendish Coalition for the project
“Incentivising the domestic workforce and securing clear, reasonable routes for
immigration both during and after the UK’s exit from the EU”
Contact details
Prof Peter Dolton ([email protected])
Dr David Nguyen ([email protected])
Dr Heather Rolfe ([email protected])
National Institute of Economic and Social Research
2 Dean Trench Street, London SW1P 3HE
4 | Brexit and the Health & Social Care Workforce in the UK National Institute of Economic and Social Research
Structure and content of this report
This report is divided into six parts:
1. We have undertaken a substantial review of existing evidence from the literature from a variety
of sources. The aim was to provide a comprehensive overview of the health and social care
workforce (H&SC) in all constituent countries of the UK. We found it beneficial to not only
highlight trends over time but also across regions and job roles.
2. We also looked at the training and supply of the future health workers in the UK system. We
examine the past pattern of application and recruits to nursing and medicine over the previous
ten years.
3. We conducted a number of focus groups and group interviews with a total of 34 representatives
of a range of health and social care occupations. These included social care, medicine and
dentistry, nursing, and physiotherapy.
4. Based on the quantitative and qualitative evidence we provided a number of simulations on the
workforce in the next few years. Specifically, we have examined data on joiners and leavers over
the years before and after the Brexit referendum to produce some baseline estimations of the
workforce impact on the first stage of the Brexit process up until mid-2017.
5. In a preliminary effort to understand the potential implications of Brexit on the NHS in England
staff numbers and how this relates to patients we model statistically the relationship between
staff turnover share from the European Economic Area (EEA) and the variation in patient waiting
times across NHS Trusts over the last three years.
6. At the end of this report we have provided series of annexes and tables which demonstrate in
more detail the quantitative grounding for our analysis and recommendations.
As usual there are many caveats and qualifications to the data and conclusions in this report. Most
obviously we are limited by the available sources of statistical data, its accuracy and reliability. In
addition, our conclusions could well be changed quite quickly by upcoming events. It should also be
stressed that describing the likely scenarios of what might be the position in the UK after Brexit is
uncertain.
5 | Brexit and the Health & Social Care Workforce in the UK National Institute of Economic and Social Research
Executive summary
The UK’s H&SC workforce is under considerable strain to provide services for an ageing population
with increasingly complex needs. While many of the problems supplying new recruits into the sector
pre-date the 2016 Brexit referendum, the vote to leave the European Union (EU) has added another
layer of challenge and uncertainty for planning this future workforce.
This report examines recent trends in the UK’s H&SC workforce and the critical role of EEA nationals
within it. This is a vital issue because the vote to leave the EU and ongoing uncertainty regarding any
deal between the UK and EU, will undoubtedly impact on their decision whether or not to stay with
significant implications for the sector. It can also impact the decision of EEA nationals to move to the
UK in the future.
Below we present a number of key findings and recommendations. These are designed to ensure
that Brexit works in the interests of patient care, and to make sure that the H&SC sector is able to
secure the skills and people it needs to continue to provide good care going forward.
Our key findings are:
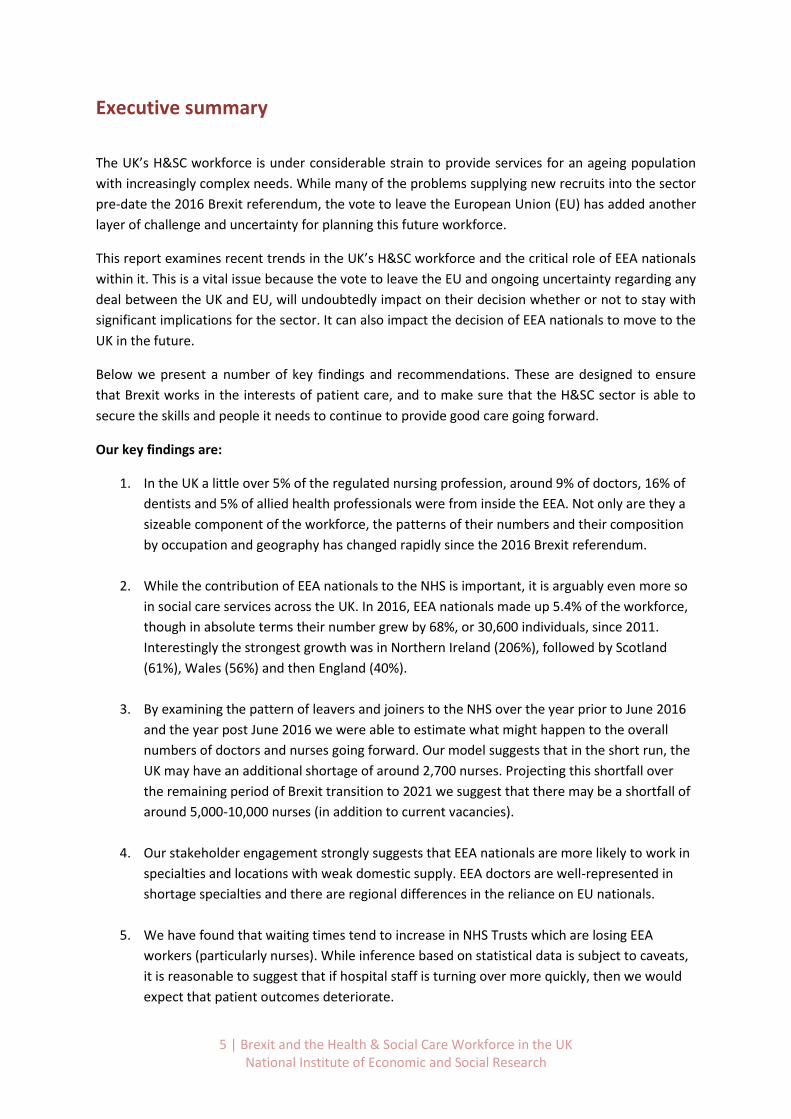
1. In the UK a little over 5% of the regulated nursing profession, around 9% of doctors, 16% of
dentists and 5% of allied health professionals were from inside the EEA. Not only are they a
sizeable component of the workforce, the patterns of their numbers and their composition
by occupation and geography has changed rapidly since the 2016 Brexit referendum.
2. While the contribution of EEA nationals to the NHS is important, it is arguably even more so
in social care services across the UK. In 2016, EEA nationals made up 5.4% of the workforce,
though in absolute terms their number grew by 68%, or 30,600 individuals, since 2011.
Interestingly the strongest growth was in Northern Ireland (206%), followed by Scotland
(61%), Wales (56%) and then England (40%).
3. By examining the pattern of leavers and joiners to the NHS over the year prior to June 2016
and the year post June 2016 we were able to estimate what might happen to the overall
numbers of doctors and nurses going forward. Our model suggests that in the short run, the
UK may have an additional shortage of around 2,700 nurses. Projecting this shortfall over
the remaining period of Brexit transition to 2021 we suggest that there may be a shortfall of
around 5,000-10,000 nurses (in addition to current vacancies).
4. Our stakeholder engagement strongly suggests that EEA nationals are more likely to work in
specialties and locations with weak domestic supply. EEA doctors are well-represented in
shortage specialties and there are regional differences in the reliance on EU nationals.
5. We have found that waiting times tend to increase in NHS Trusts which are losing EEA
workers (particularly nurses). While inference based on statistical data is subject to caveats,
it is reasonable to suggest that if hospital staff is turning over more quickly, then we would
expect that patient outcomes deteriorate.
6 | Brexit and the Health & Social Care Workforce in the UK National Institute of Economic and Social Research
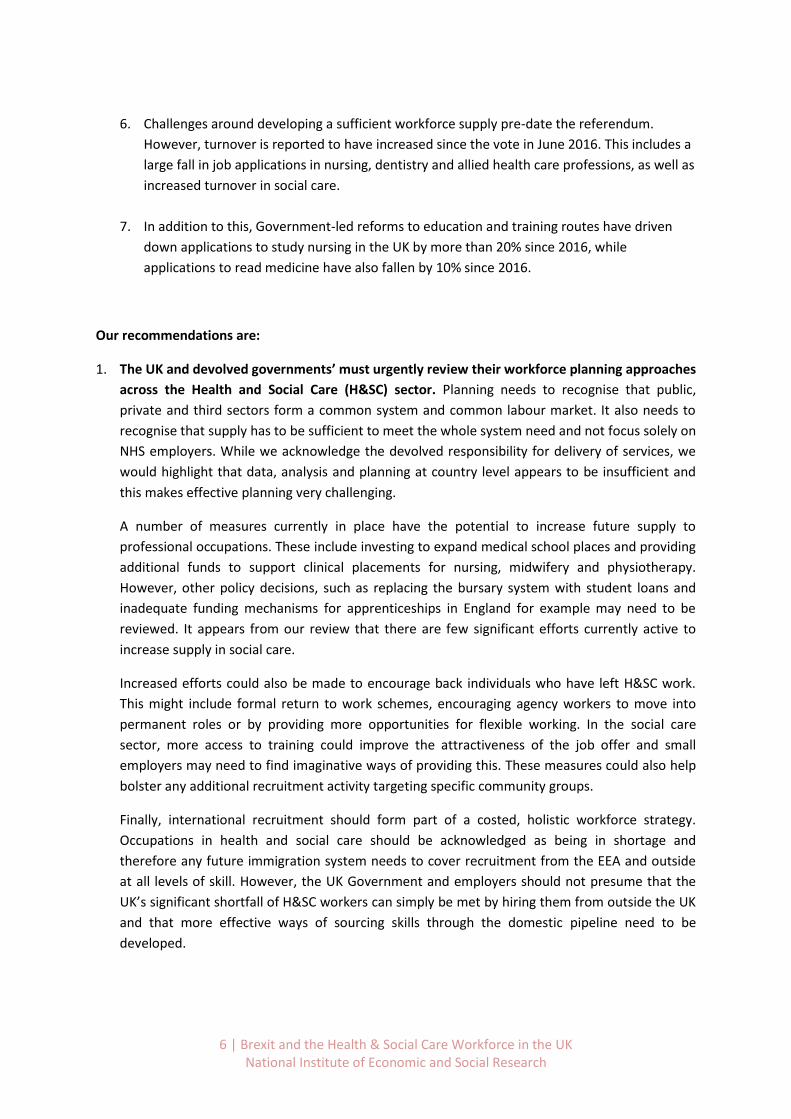
6. Challenges around developing a sufficient workforce supply pre-date the referendum.
However, turnover is reported to have increased since the vote in June 2016. This includes a
large fall in job applications in nursing, dentistry and allied health care professions, as well as
increased turnover in social care.
7. In addition to this, Government-led reforms to education and training routes have driven
down applications to study nursing in the UK by more than 20% since 2016, while
applications to read medicine have also fallen by 10% since 2016.
Our recommendations are:
1. The UK and devolved governments’ must urgently review their workforce planning approaches
across the Health and Social Care (H&SC) sector. Planning needs to recognise that public,
private and third sectors form a common system and common labour market. It also needs to
recognise that supply has to be sufficient to meet the whole system need and not focus solely on
NHS employers. While we acknowledge the devolved responsibility for delivery of services, we
would highlight that data, analysis and planning at country level appears to be insufficient and
this makes effective planning very challenging.
A number of measures currently in place have the potential to increase future supply to
professional occupations. These include investing to expand medical school places and providing
additional funds to support clinical placements for nursing, midwifery and physiotherapy.
However, other policy decisions, such as replacing the bursary system with student loans and
inadequate funding mechanisms for apprenticeships in England for example may need to be
reviewed. It appears from our review that there are few significant efforts currently active to
increase supply in social care.
Increased efforts could also be made to encourage back individuals who have left H&SC work.
This might include formal return to work schemes, encouraging agency workers to move into
permanent roles or by providing more opportunities for flexible working. In the social care
sector, more access to training could improve the attractiveness of the job offer and small
employers may need to find imaginative ways of providing this. These measures could also help
bolster any additional recruitment activity targeting specific community groups.
Finally, international recruitment should form part of a costed, holistic workforce strategy.
Occupations in health and social care should be acknowledged as being in shortage and
therefore any future immigration system needs to cover recruitment from the EEA and outside
at all levels of skill. However, the UK Government and employers should not presume that the
UK’s significant shortfall of H&SC workers can simply be met by hiring them from outside the UK
and that more effective ways of sourcing skills through the domestic pipeline need to be
developed.

7 | Brexit and the Health & Social Care Workforce in the UK National Institute of Economic and Social Research
2. Any future immigration system needs to be uncomplicated to operate. It should also be
transparent and cost effective for applicants, responsive to the changing health needs of the
population and agile to meet the needs of employers. At present, many H&SC jobs do not fulfil
the requirements for the minimum skills or salary levels of the current non-EEA immigration
system. If a future immigration system is to be modelled on the current non-EEA system, it will
need to acknowledge the value and contribution of the H&SC workforce and adjust skill and
salary levels accordingly to minimise any further detrimental impact to workforce supply.
In addition to reviewing how Tier 2 works for employers in health and social care we suggest
that the post-study route also needs to be reviewed. It currently has significant restrictions
which limit the ability for skilled individuals to access the UK labour market. International
students are a valuable source of talent and their skills could be harnessed by health and social
care employers.
3. The Home Office should guarantee that its settled status programme for EU nationals will be
honoured in the event of a no-deal Brexit. Stemming the outward flow of EU nationals could be
achieved by strengthening assurances about their long-term right to settle in the UK. Health and
social care employers also need to consider ways in which they could help EEA staff (and other
non-UK nationals) to register for settled status, leave to remain or citizenship.
4. All levels of Government should work together to review career routes within social care. In
particular, we would advise that they look into the potential for opening up routes from support
and social care roles into nursing and allied health professions.
5. Professional regulators should regularly review their processes for registering international
professionals. This needs to ensure that they are proportionate and do not unnecessarily hinder
international recruitment.
6. The UK Government should introduce measures to monitor and address the decline in the
number of applications to medical schools. This holds for UK and EU applicants, though the
decrease is sharpest for prospective EU students. Applications to training places need to be
monitored and action taken to mitigate changes which may have a negative impact on future
supply of the workforce.
8 | Brexit and the Health & Social Care Workforce in the UK National Institute of Economic and Social Research
Acknowledgements
We would like to thank the Cavendish Coalition for their support and guidance throughout the
research project. We also acknowledge the role of the Local Government Association as part of the
project steering group and for their useful observations.
We would like to thank all participants of the focus groups for medicine and dentistry, nursing, social
care and physiotherapy for the time and thought they gave in responding to our research questions.
Their identities and those of their organisations have been anonymised within the report. In
addition, a number of organisations supplied valuable datasets and research reports used in various
parts of the report. They include Cavendish Coalition members (NHS Employers, NHS Partners, the
Royal College of Nursing, and Skills for Care England) and the Scottish Social Services Council.
Responsibility for the interpretation of the data is the authors’ alone.
Finally, this report has benefitted greatly from internal discussion with colleagues at NIESR. We are
particularly grateful to Jagjit Chadha, who has commented extensively on various versions of the
report.
9 | Brexit and the Health & Social Care Workforce in the UK National Institute of Economic and Social Research
Contents Executive summary ............................................................................................................ 5
Acknowledgements ............................................................................................................ 8
Contents .............................................................................................................................. 9
1. Introduction ................................................................................................................... 10
2. The Health and Social Care Workforce in the UK: The role of EU nationals ............. 13
2.1 Composition and trends for Health Care Workforce in the UK ................................... 13
2.1.1 Additional findings for Doctors and Dentists ........................................................ 15
2.1.2 Additional findings for Nurses .............................................................................. 19
2.2 Overview of Social Care workforce composition and trends by nationality ................. 23
3. Training of clinical staff: Becoming a health care professional in the UK ................ 27
3.1 Becoming a registered nurse ..................................................................................... 29
3.2 Becoming a licensed doctor in the UK ....................................................................... 32
4. Considerations for future staffing in the health and social care sector .................... 36
4.1 Current status of the negotiations between the UK and the EU on future mobility of
citizens ............................................................................................................................ 36
4.2 Potential scenarios for international migration post-2020 ........................................... 37
4.3 Implications of uncertainty over future immigration system ........................................ 39
5. Conclusions and implications ...................................................................................... 44
5.1 Summary of findings .................................................................................................. 44
5.2 Consequences & Implications .................................................................................... 46
5.3 Future supply of the Health and Social Care workforce: What can be done to address
current difficulties?........................................................................................................... 50
5.4 Some implications of the Present Research and Future Research of Importance to the
Cavendish Coalition when the Outcome of the Brexit Negotiations are Known ................ 53
References ........................................................................................................................ 57
Abbreviations .................................................................................................................... 63
List of tables ...................................................................................................................... 64
List of figures .................................................................................................................... 65
Appendices ....................................................................................................................... 67
Appendix A. Additional analysis for England .................................................................... 67
Composition by job role ................................................................................................ 69
Composition by region ................................................................................................. 71
Pre-referendum trends ................................................................................................. 73
Post-referendum trends (Q2-2016 to Q2-2017) ............................................................ 77
Additional trends in social care for England .................................................................. 84
10 | Brexit and the Health & Social Care Workforce in the UK National Institute of Economic and Social Research
Composition and trends by occupation ........................................................................ 85
Composition and trends by region ................................................................................ 87
Appendix B. NHS England Staff by Nationality, Job Role, and HEE region ..................... 91
Appendix C. Joiners and leavers to NHS England before and after the referendum, by job
role and region .............................................................................................................. 101
Appendix D. Qualitative research: Methods and additional findings ............................... 112
Appendix E. Regression analysis of trends in NHS in England hospital waiting times ... 117
Waiting times as a measure of quality ........................................................................ 117
Waiting times in the NHS ........................................................................................... 119
Statistical analysis of waiting times and nationality of hospital staff ............................ 127
1. Introduction
The health and social care (H&SC) workforce in the UK is under considerable strain to provide
services for an increasingly ageing population. Brexit adds another layer of uncertainty and
complexity when planning for the future workforce in the health and social care sector. Any deal
that is concluded between the UK and the EU has long-term implications for patients and people
receiving care and support in the UK (Nuffield Trust, 2017).
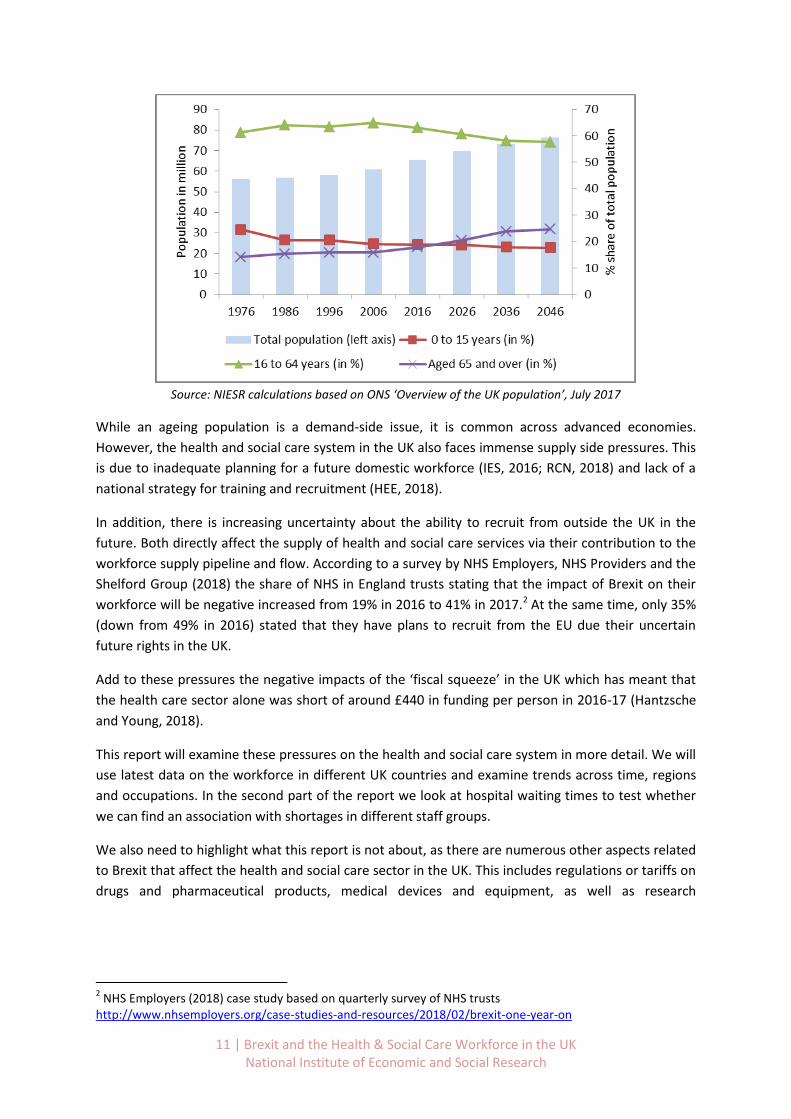
Between 1976 and 2016 the share of people aged 65 and over increased from 14.2% to 18%, while
the population increased by 9.5 million to 65.5 million (see Figure 1). The total number of finished
consultant episodes in the NHS increased from 6.3 million in 1970 to almost 21 million in 2012, while
the average number of available beds per 1,000 people fell from 8.8 in 1975 to 2.9 in 2012 (Office of
Health Economics, 2013).
Clearly this increase in service was only possible due to an increase in the H&SC workforce. For
example, the number of nurses and midwives increased from 441,000 in 1975 to 467,000 in 2012,
though per 100,000 people their number fell from 784 to 739.
The ONS projects the share of elderly in the population to increase to almost 25% by 2046. Hence it
is likely that the pressure on the health and social care system to deliver more services is also going
to increase further.
Decreased levels of international migration are likely to exacerbate this problem as migrants tend to
be younger and healthier,1 which means that the share of GDP spent on health care is lower (OBR,
2015).
Figure 1. UK population by size and age composition, past and future trends, 1976-2046.
1 The Migration Observatory (2016) reports that 83% of foreign-born people in the UK were under the age of
35, based on the 2011 Census conducted by the ONS. The Migration Advisory Committee (2018) reports that migrants have less reported health problems.
11 | Brexit and the Health & Social Care Workforce in the UK National Institute of Economic and Social Research
Source: NIESR calculations based on ONS ‘Overview of the UK population’, July 2017
While an ageing population is a demand-side issue, it is common across advanced economies.
However, the health and social care system in the UK also faces immense supply side pressures. This
is due to inadequate planning for a future domestic workforce (IES, 2016; RCN, 2018) and lack of a
national strategy for training and recruitment (HEE, 2018).
In addition, there is increasing uncertainty about the ability to recruit from outside the UK in the
future. Both directly affect the supply of health and social care services via their contribution to the
workforce supply pipeline and flow. According to a survey by NHS Employers, NHS Providers and the
Shelford Group (2018) the share of NHS in England trusts stating that the impact of Brexit on their
workforce will be negative increased from 19% in 2016 to 41% in 2017.2 At the same time, only 35%
(down from 49% in 2016) stated that they have plans to recruit from the EU due their uncertain
future rights in the UK.
Add to these pressures the negative impacts of the ‘fiscal squeeze’ in the UK which has meant that
the health care sector alone was short of around £440 in funding per person in 2016-17 (Hantzsche
and Young, 2018).
This report will examine these pressures on the health and social care system in more detail. We will
use latest data on the workforce in different UK countries and examine trends across time, regions
and occupations. In the second part of the report we look at hospital waiting times to test whether
we can find an association with shortages in different staff groups.
We also need to highlight what this report is not about, as there are numerous other aspects related
to Brexit that affect the health and social care sector in the UK. This includes regulations or tariffs on
drugs and pharmaceutical products, medical devices and equipment, as well as research
2 NHS Employers (2018) case study based on quarterly survey of NHS trusts
http://www.nhsemployers.org/case-studies-and-resources/2018/02/brexit-one-year-on
12 | Brexit and the Health & Social Care Workforce in the UK National Institute of Economic and Social Research
collaborations, procurement rules, and basic reciprocal health care for citizens that are travelling to
the EEA. Some of these are discussed elsewhere and we would refer the interested reader there.3
3 Nuffield Trust (2017); The Kings Fund (2017); The UK in a Changing Europe (2018); NHS Confederation (2018);
British Medical Association (2018)
13 | Brexit and the Health & Social Care Workforce in the UK National Institute of Economic and Social Research
2. The Health and Social Care Workforce in the UK: The role of EU
nationals
2.1 Composition and trends for Health Care Workforce in the UK
The health and social care sector is a large employer in the UK. However, since health care provision
is devolved to the individual countries there is no unified source of data on the workforce in the
health or social care sector. This presents a challenge to the provision of a complete picture of the
composition of the workforce and trends in staffing across occupations, regions and nationalities.
We have collected available data from the national health care providers individually and
complemented them with data from the social care sector, as well as the Nursing and Midwifery
Council, the General Medical Council and the independent sector. Where there are still gaps in the
data we aim to highlight those as well.
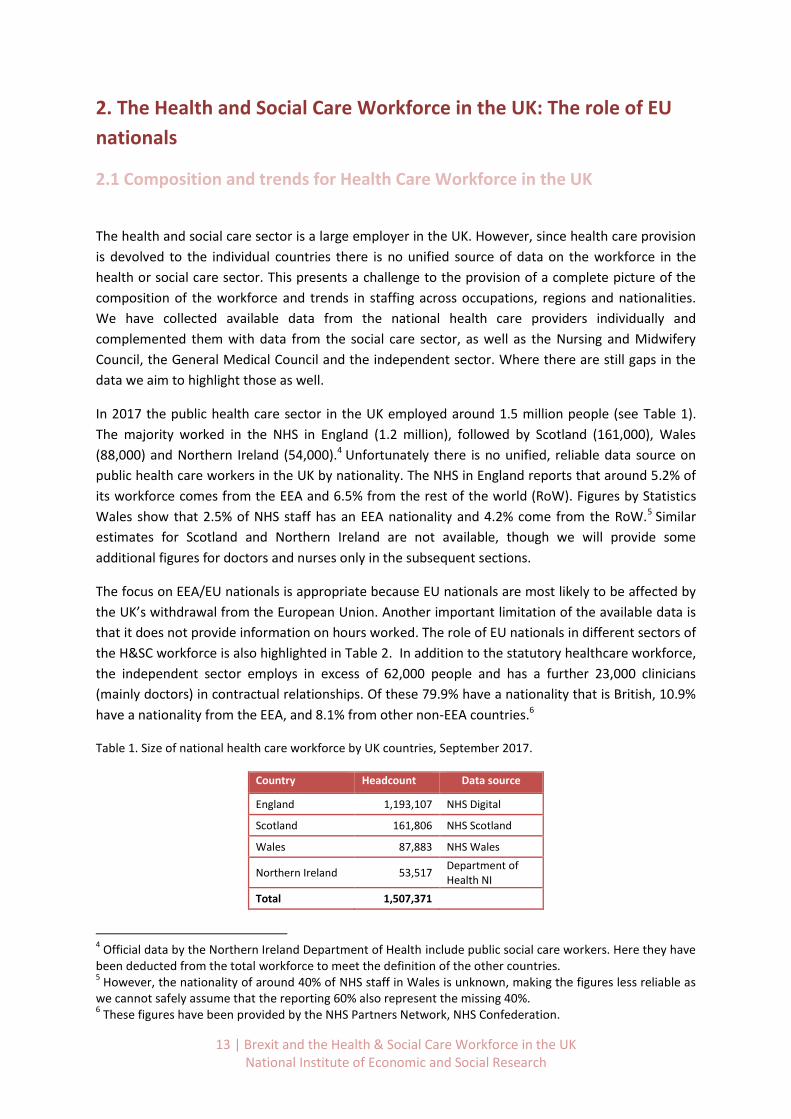
In 2017 the public health care sector in the UK employed around 1.5 million people (see Table 1).
The majority worked in the NHS in England (1.2 million), followed by Scotland (161,000), Wales
(88,000) and Northern Ireland (54,000).4 Unfortunately there is no unified, reliable data source on
public health care workers in the UK by nationality. The NHS in England reports that around 5.2% of
its workforce comes from the EEA and 6.5% from the rest of the world (RoW). Figures by Statistics
Wales show that 2.5% of NHS staff has an EEA nationality and 4.2% come from the RoW.5 Similar
estimates for Scotland and Northern Ireland are not available, though we will provide some
additional figures for doctors and nurses only in the subsequent sections.
The focus on EEA/EU nationals is appropriate because EU nationals are most likely to be affected by
the UK’s withdrawal from the European Union. Another important limitation of the available data is
that it does not provide information on hours worked. The role of EU nationals in different sectors of
the H&SC workforce is also highlighted in Table 2. In addition to the statutory healthcare workforce,
the independent sector employs in excess of 62,000 people and has a further 23,000 clinicians
(mainly doctors) in contractual relationships. Of these 79.9% have a nationality that is British, 10.9%
have a nationality from the EEA, and 8.1% from other non-EEA countries.6
Table 1. Size of national health care workforce by UK countries, September 2017.
Country Headcount Data source
England 1,193,107 NHS Digital
Scotland 161,806 NHS Scotland
Wales 87,883 NHS Wales
Northern Ireland 53,517 Department of Health NI
Total 1,507,371
4 Official data by the Northern Ireland Department of Health include public social care workers. Here they have
been deducted from the total workforce to meet the definition of the other countries. 5 However, the nationality of around 40% of NHS staff in Wales is unknown, making the figures less reliable as
we cannot safely assume that the reporting 60% also represent the missing 40%. 6 These figures have been provided by the NHS Partners Network, NHS Confederation.
14 | Brexit and the Health & Social Care Workforce in the UK National Institute of Economic and Social Research
Table 2. The place of EU migrants in the health and social care workforce: Case studies based on focus groups.
The place of EU migrants in the medical and dentistry workforce
Overseas doctors and dentists deliver a significant proportion of the service across the UK, and even more so in areas of social deprivation. EEA doctors are well-represented in shortage specialties, including General Practice and there have been particular efforts to attract them to work in the UK. EU dentists have formed an increasing proportion of migrant practitioners because of mutual recognition of qualifications and the absence of visa controls. There is an increasing shortage of practising doctors. There are multiple reasons and factors affecting this. Dentists are being attracted to the private sector at an early stage in their working lives.
The place of EU migrants in the adult social care workforce
Because of long-standing recruitment difficulties the sector has historically relied on migrants from the EU and outside the EU. There are large regional variations in recruitment difficulty and, consequently, the proportion of migrants in the workforce. Migrants are recruited into social care roles because of long-standing difficulties in attracting British workers. This is explained partly by the image of the sector and lack of understanding and appeal among young people, their parents and careers advisers.
The place of EU migrants in the nursing workforce
Registered nurses and others in nursing roles are recruited from the EU. The NHS is reliant on overseas recruitment because of failures in workforce planning which have led to under-supply of newly qualified nurses and insufficient numbers of experienced staff. Many EU recruits are newly qualified because of over-supply of training in countries such as Spain, Portugal and Italy. Levels of demand are particularly high in London and the South East, but turnover of EU nurses is also high. Recruitment of nurses from outside the EU has historically been more important in meeting shortages than EU recruitment and even before the referendum vote employers were experiencing some reduction in supply.
The place of EU migrants in the physiotherapy workforce7
All physiotherapists qualifying outside of the UK are required to register before practising, a process which takes a number of months and includes an assessment of skills, knowledge and English language ability. The proportion of physiotherapists with overseas qualifications is relatively small (14%), and the split between EU and non-EU qualifiers is roughly equal. Nevertheless, given the current shortage or physiotherapists, the sector is reliant on overseas qualifiers and to benefit from their different experiences and skills. There are reports of some proactive recruitment from outside the UK, in particular from Ireland by private sector providers.
Source: Qualitative research findings based on focus groups conducted by NIESR
7 Following the Health and Care Professions Council (2017) there were close to 5,000 physiotherapists from the
EEA (i.e. country of origin) registered in the UK in July 2016. Considering that the total number of physiotherapists was reported by the same council in 2016 to be 51,747 this means that around 9.7% of all physiotherapists came from the EEA.
15 | Brexit and the Health & Social Care Workforce in the UK National Institute of Economic and Social Research
2.1.1 Additional findings for Doctors and Dentists
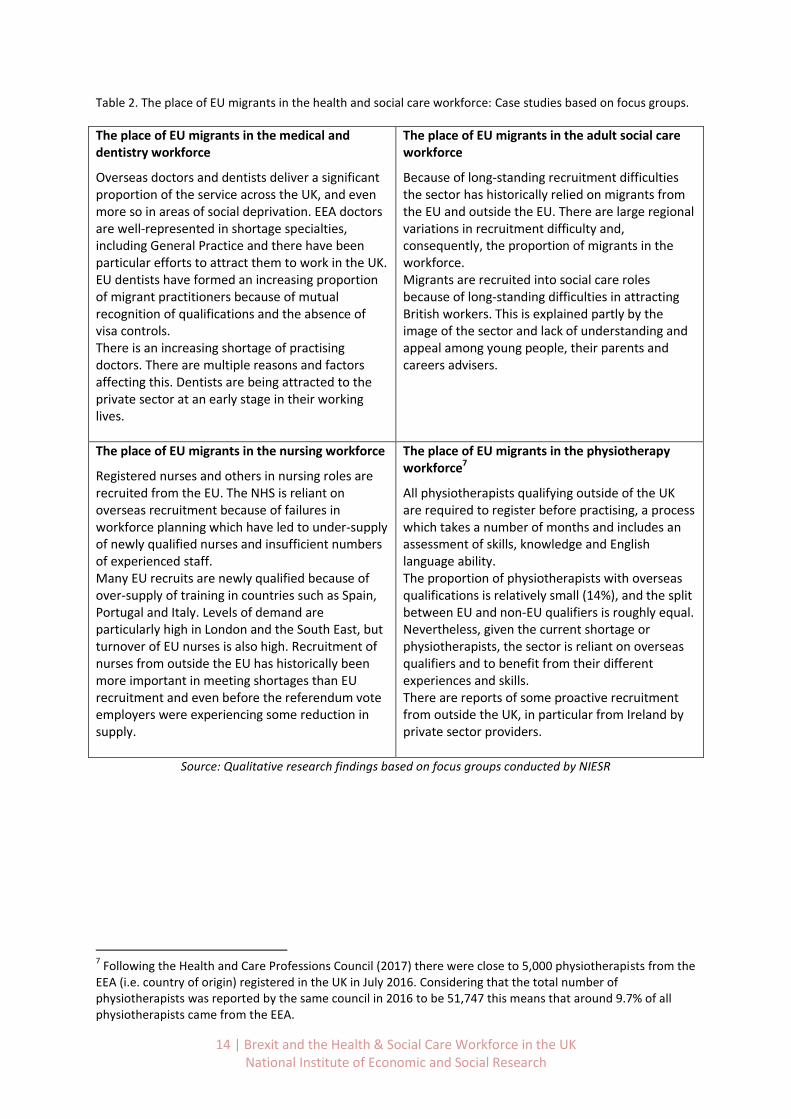
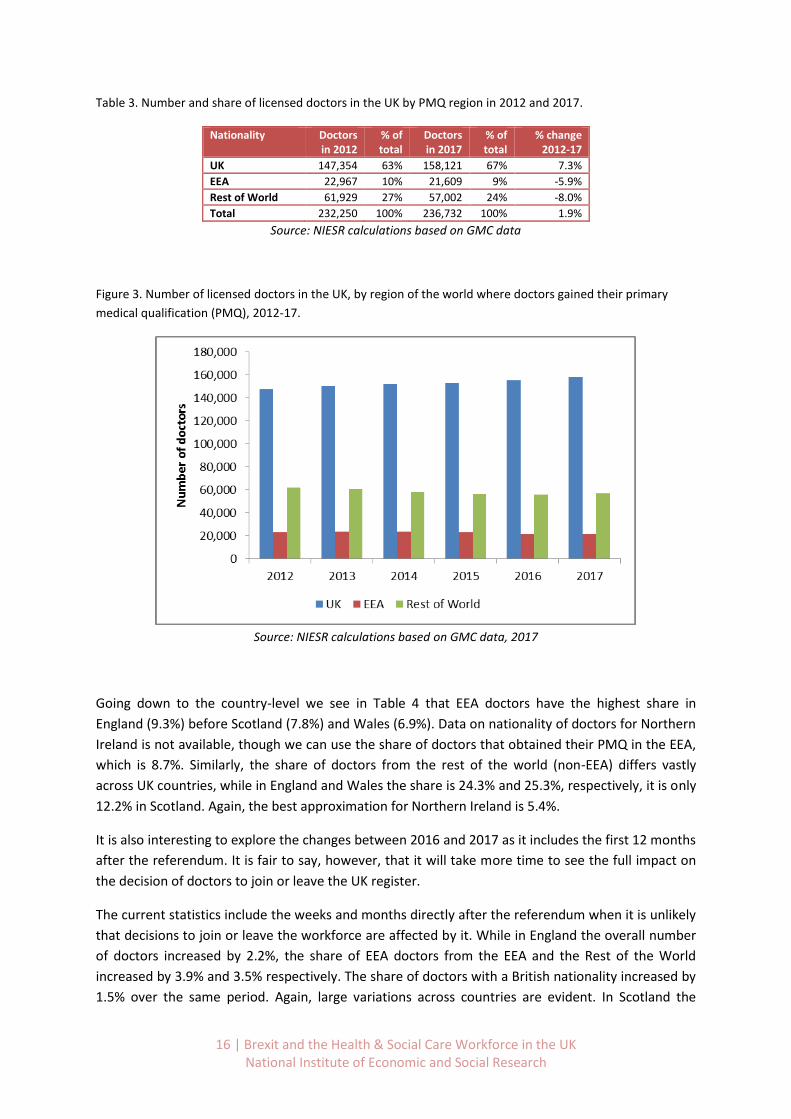
The General Medical Council (GMC) reported that in 2017 there were a total of 236,732 licensed
doctors on the register for the UK as a whole.8 Of these, 84.4% worked in England, 8.6% in Scotland,
4.3% in Wales and 2.7% in Northern Ireland (Figure 2). In terms of nationality, around 10.5% came
from another EEA country and 22.9% from outside the EEA (GMC, 2017).9 Figures are comparable
when looking the region where doctors obtained their Primary Medical Qualification (PMQ), as 9.1%
did so in an EEA country (excluding UK) and 24.1% in a non-EEA country (Table 3).10 As data on the
PMQ include Northern Ireland we will use both in the remainder of the section. When looking at the
trends over time we can see that the number and share of non-British doctors has declined since
2012 (Table 3 and Figure 3). At the same time the total number of doctors increased by 1.9% to
almost 237,000 in 2017. This is driven by an increase of supply of British doctors from 147,000 in
2012 to 158,000 in 2017.
Figure 2. Share of licensed doctors in the UK by country, 2017.
Source: NIESR calculations based on GMC data
8 We report figures for licensed doctors as opposed to registered doctors as the latter are not licensed to
practice, but for a variety of reasons choose to remain on the GMC register. The number of registered doctors in 2017 is around 45,000 higher than the number of licensed doctors. 9 GMC Working Paper 4, December 2017: https://www.gmc-uk.org/-/media/documents/final-nationality-
update_pdf-74268027.pdf (accessed 5. April 2018) 10
The number of doctors obtaining their PMQ in the EEA technically includes British doctors that graduated in an EEA country (e.g. Republic of Ireland). On the other hand, it also includes EEA nationals that graduate in the UK in the UK figures. This can also explain the slightly lower share of EEA nationals in the figures by PMQ region.
16 | Brexit and the Health & Social Care Workforce in the UK National Institute of Economic and Social Research
Table 3. Number and share of licensed doctors in the UK by PMQ region in 2012 and 2017.
Nationality Doctors in 2012
% of total
Doctors in 2017
% of total
% change 2012-17
UK 147,354 63% 158,121 67% 7.3%
EEA 22,967 10% 21,609 9% -5.9%
Rest of World 61,929 27% 57,002 24% -8.0%
Total 232,250 100% 236,732 100% 1.9%
Source: NIESR calculations based on GMC data
Figure 3. Number of licensed doctors in the UK, by region of the world where doctors gained their primary
medical qualification (PMQ), 2012-17.
Source: NIESR calculations based on GMC data, 2017
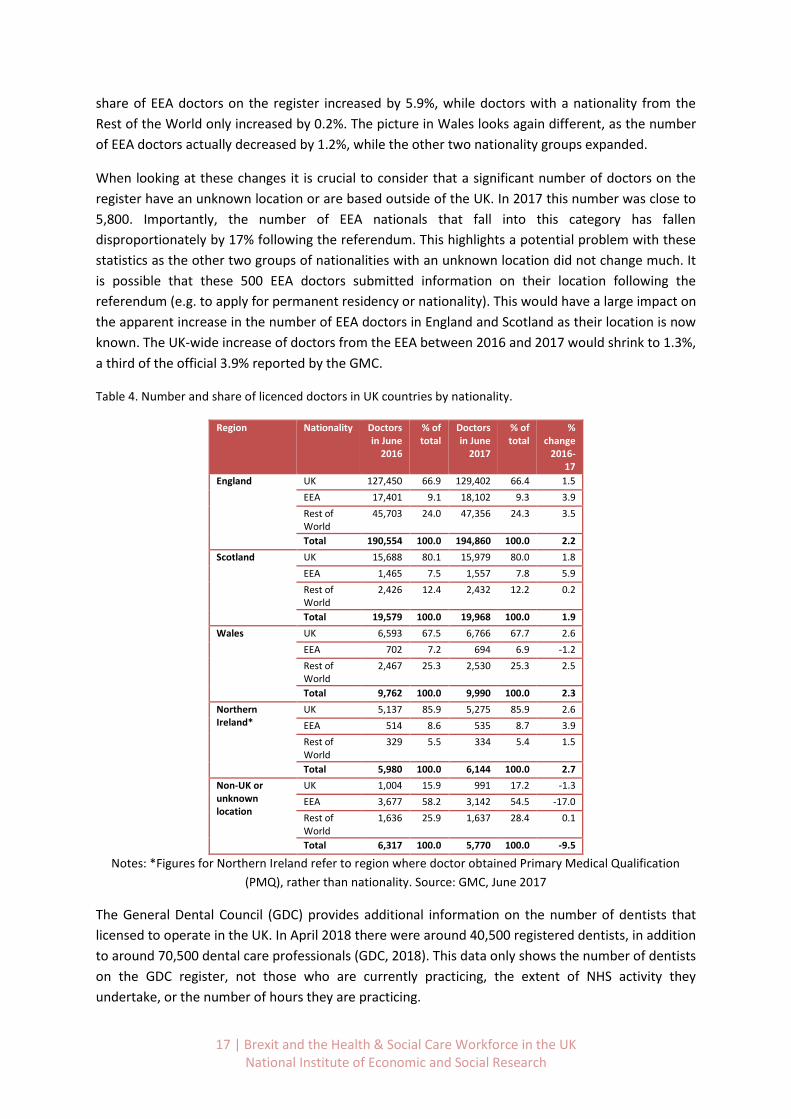
Going down to the country-level we see in Table 4 that EEA doctors have the highest share in
England (9.3%) before Scotland (7.8%) and Wales (6.9%). Data on nationality of doctors for Northern
Ireland is not available, though we can use the share of doctors that obtained their PMQ in the EEA,
which is 8.7%. Similarly, the share of doctors from the rest of the world (non-EEA) differs vastly
across UK countries, while in England and Wales the share is 24.3% and 25.3%, respectively, it is only
12.2% in Scotland. Again, the best approximation for Northern Ireland is 5.4%.
It is also interesting to explore the changes between 2016 and 2017 as it includes the first 12 months
after the referendum. It is fair to say, however, that it will take more time to see the full impact on
the decision of doctors to join or leave the UK register.
The current statistics include the weeks and months directly after the referendum when it is unlikely
that decisions to join or leave the workforce are affected by it. While in England the overall number
of doctors increased by 2.2%, the share of EEA doctors from the EEA and the Rest of the World
increased by 3.9% and 3.5% respectively. The share of doctors with a British nationality increased by
1.5% over the same period. Again, large variations across countries are evident. In Scotland the
17 | Brexit and the Health & Social Care Workforce in the UK National Institute of Economic and Social Research
share of EEA doctors on the register increased by 5.9%, while doctors with a nationality from the
Rest of the World only increased by 0.2%. The picture in Wales looks again different, as the number
of EEA doctors actually decreased by 1.2%, while the other two nationality groups expanded.
When looking at these changes it is crucial to consider that a significant number of doctors on the
register have an unknown location or are based outside of the UK. In 2017 this number was close to
5,800. Importantly, the number of EEA nationals that fall into this category has fallen
disproportionately by 17% following the referendum. This highlights a potential problem with these
statistics as the other two groups of nationalities with an unknown location did not change much. It
is possible that these 500 EEA doctors submitted information on their location following the
referendum (e.g. to apply for permanent residency or nationality). This would have a large impact on
the apparent increase in the number of EEA doctors in England and Scotland as their location is now
known. The UK-wide increase of doctors from the EEA between 2016 and 2017 would shrink to 1.3%,
a third of the official 3.9% reported by the GMC.
Table 4. Number and share of licenced doctors in UK countries by nationality.
Region Nationality Doctors in June
2016
% of total
Doctors in June
2017
% of total
% change
2016-17
England UK 127,450 66.9 129,402 66.4 1.5
EEA 17,401 9.1 18,102 9.3 3.9
Rest of World
45,703 24.0 47,356 24.3 3.5
Total 190,554 100.0 194,860 100.0 2.2
Scotland UK 15,688 80.1 15,979 80.0 1.8
EEA 1,465 7.5 1,557 7.8 5.9
Rest of World
2,426 12.4 2,432 12.2 0.2
Total 19,579 100.0 19,968 100.0 1.9
Wales UK 6,593 67.5 6,766 67.7 2.6
EEA 702 7.2 694 6.9 -1.2
Rest of World
2,467 25.3 2,530 25.3 2.5
Total 9,762 100.0 9,990 100.0 2.3
Northern Ireland*
UK 5,137 85.9 5,275 85.9 2.6
EEA 514 8.6 535 8.7 3.9
Rest of World
329 5.5 334 5.4 1.5
Total 5,980 100.0 6,144 100.0 2.7
Non-UK or unknown location
UK 1,004 15.9 991 17.2 -1.3
EEA 3,677 58.2 3,142 54.5 -17.0
Rest of World
1,636 25.9 1,637 28.4 0.1
Total 6,317 100.0 5,770 100.0 -9.5
Notes: *Figures for Northern Ireland refer to region where doctor obtained Primary Medical Qualification
(PMQ), rather than nationality. Source: GMC, June 2017
The General Dental Council (GDC) provides additional information on the number of dentists that
licensed to operate in the UK. In April 2018 there were around 40,500 registered dentists, in addition
to around 70,500 dental care professionals (GDC, 2018). This data only shows the number of dentists
on the GDC register, not those who are currently practicing, the extent of NHS activity they
undertake, or the number of hours they are practicing.
18 | Brexit and the Health & Social Care Workforce in the UK National Institute of Economic and Social Research
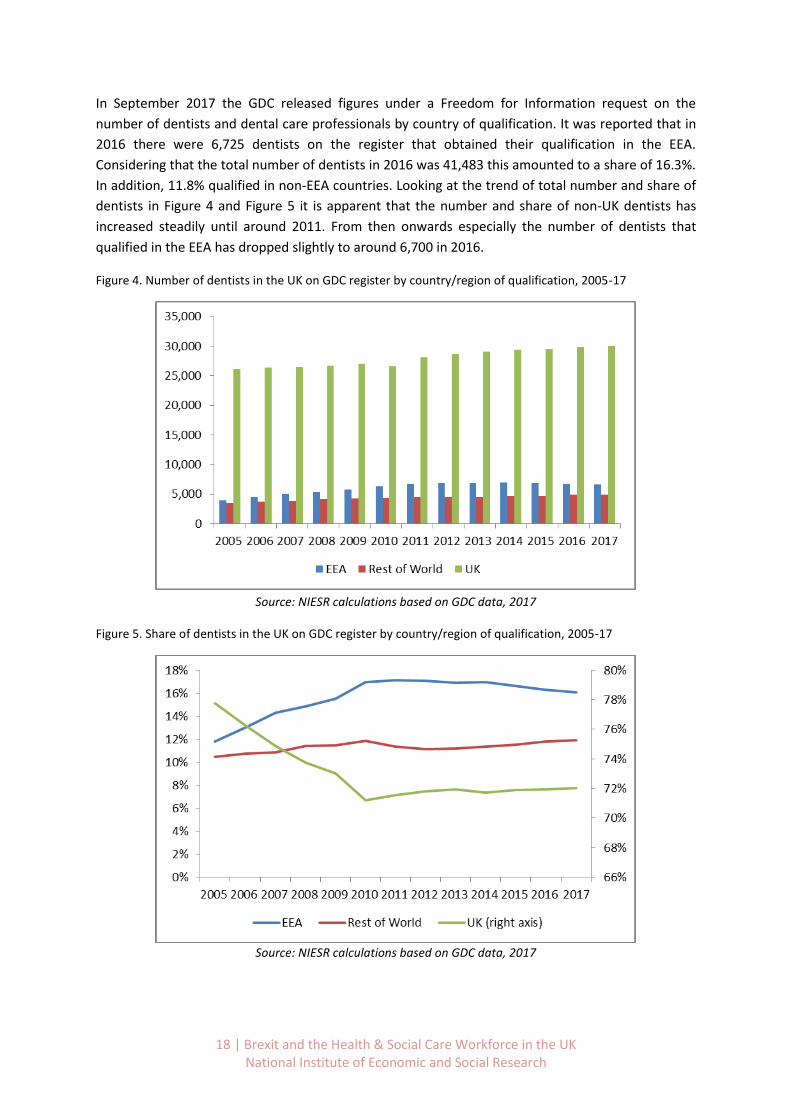
In September 2017 the GDC released figures under a Freedom for Information request on the
number of dentists and dental care professionals by country of qualification. It was reported that in
2016 there were 6,725 dentists on the register that obtained their qualification in the EEA.
Considering that the total number of dentists in 2016 was 41,483 this amounted to a share of 16.3%.
In addition, 11.8% qualified in non-EEA countries. Looking at the trend of total number and share of
dentists in Figure 4 and Figure 5 it is apparent that the number and share of non-UK dentists has
increased steadily until around 2011. From then onwards especially the number of dentists that
qualified in the EEA has dropped slightly to around 6,700 in 2016.
Figure 4. Number of dentists in the UK on GDC register by country/region of qualification, 2005-17
Source: NIESR calculations based on GDC data, 2017
Figure 5. Share of dentists in the UK on GDC register by country/region of qualification, 2005-17
Source: NIESR calculations based on GDC data, 2017
19 | Brexit and the Health & Social Care Workforce in the UK National Institute of Economic and Social Research
2.1.2 Additional findings for Nurses
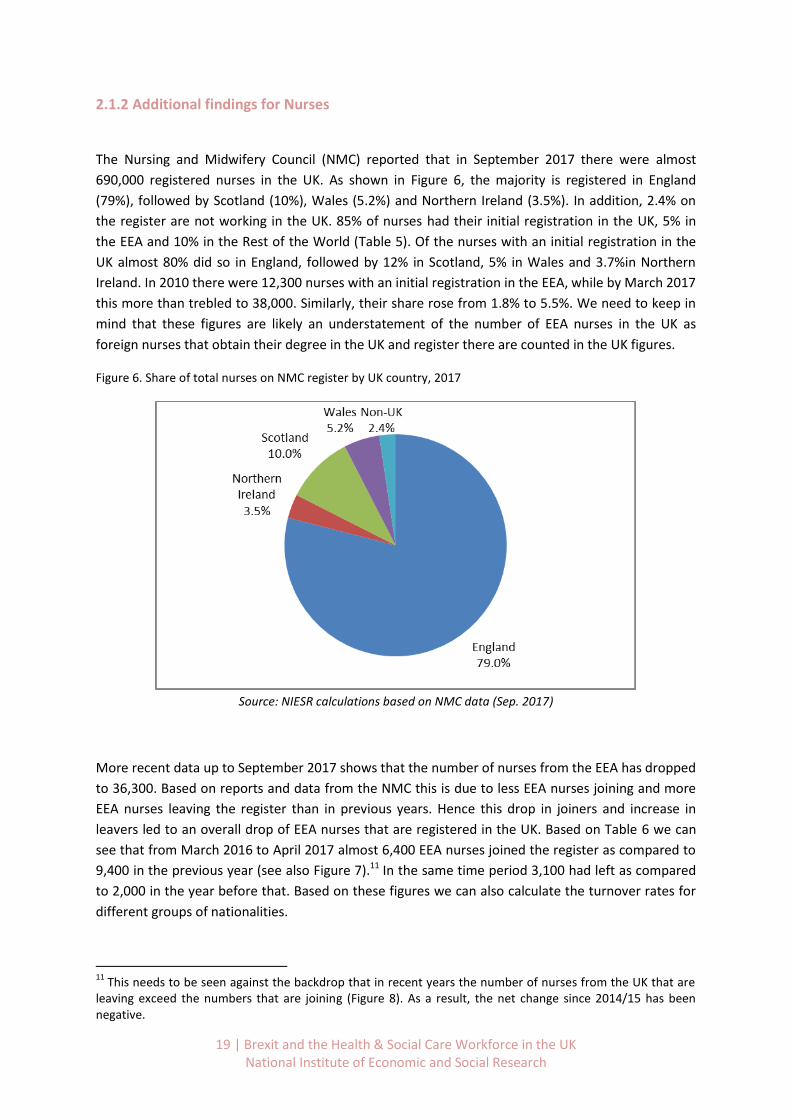
The Nursing and Midwifery Council (NMC) reported that in September 2017 there were almost
690,000 registered nurses in the UK. As shown in Figure 6, the majority is registered in England
(79%), followed by Scotland (10%), Wales (5.2%) and Northern Ireland (3.5%). In addition, 2.4% on
the register are not working in the UK. 85% of nurses had their initial registration in the UK, 5% in
the EEA and 10% in the Rest of the World (Table 5). Of the nurses with an initial registration in the
UK almost 80% did so in England, followed by 12% in Scotland, 5% in Wales and 3.7%in Northern
Ireland. In 2010 there were 12,300 nurses with an initial registration in the EEA, while by March 2017
this more than trebled to 38,000. Similarly, their share rose from 1.8% to 5.5%. We need to keep in
mind that these figures are likely an understatement of the number of EEA nurses in the UK as
foreign nurses that obtain their degree in the UK and register there are counted in the UK figures.
Figure 6. Share of total nurses on NMC register by UK country, 2017
Source: NIESR calculations based on NMC data (Sep. 2017)
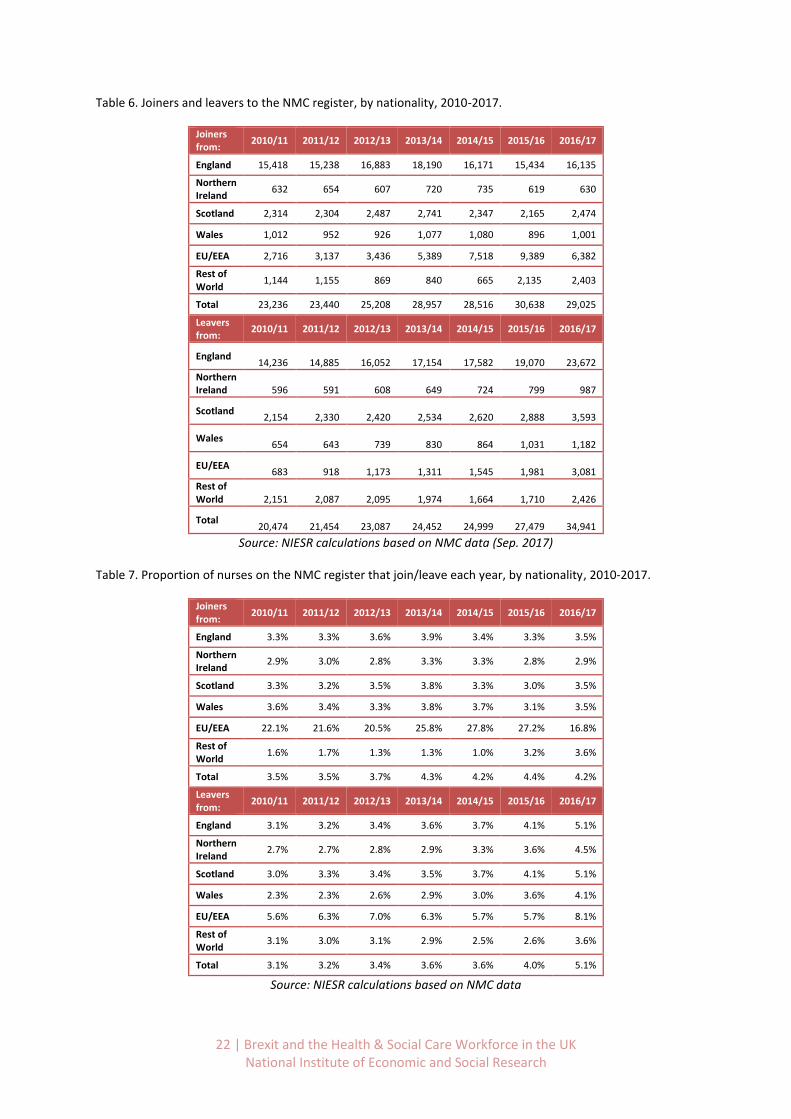
More recent data up to September 2017 shows that the number of nurses from the EEA has dropped
to 36,300. Based on reports and data from the NMC this is due to less EEA nurses joining and more
EEA nurses leaving the register than in previous years. Hence this drop in joiners and increase in
leavers led to an overall drop of EEA nurses that are registered in the UK. Based on Table 6 we can
see that from March 2016 to April 2017 almost 6,400 EEA nurses joined the register as compared to
9,400 in the previous year (see also Figure 7).11 In the same time period 3,100 had left as compared
to 2,000 in the year before that. Based on these figures we can also calculate the turnover rates for
different groups of nationalities.
11
This needs to be seen against the backdrop that in recent years the number of nurses from the UK that are leaving exceed the numbers that are joining (Figure 8). As a result, the net change since 2014/15 has been negative.
20 | Brexit and the Health & Social Care Workforce in the UK National Institute of Economic and Social Research
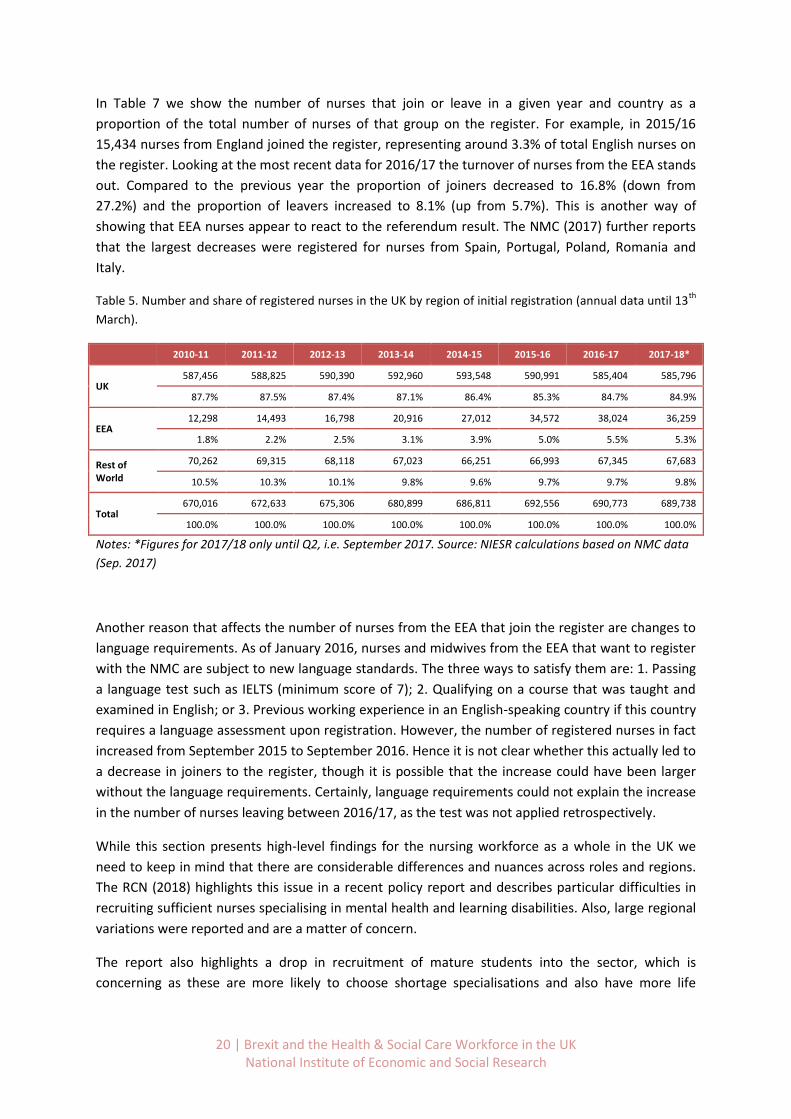
In Table 7 we show the number of nurses that join or leave in a given year and country as a
proportion of the total number of nurses of that group on the register. For example, in 2015/16
15,434 nurses from England joined the register, representing around 3.3% of total English nurses on
the register. Looking at the most recent data for 2016/17 the turnover of nurses from the EEA stands
out. Compared to the previous year the proportion of joiners decreased to 16.8% (down from
27.2%) and the proportion of leavers increased to 8.1% (up from 5.7%). This is another way of
showing that EEA nurses appear to react to the referendum result. The NMC (2017) further reports
that the largest decreases were registered for nurses from Spain, Portugal, Poland, Romania and
Italy.
Table 5. Number and share of registered nurses in the UK by region of initial registration (annual data until 13th
March).
2010-11 2011-12 2012-13 2013-14 2014-15 2015-16 2016-17 2017-18*
UK 587,456 588,825 590,390 592,960 593,548 590,991 585,404 585,796
87.7% 87.5% 87.4% 87.1% 86.4% 85.3% 84.7% 84.9%
EEA 12,298 14,493 16,798 20,916 27,012 34,572 38,024 36,259
1.8% 2.2% 2.5% 3.1% 3.9% 5.0% 5.5% 5.3%
Rest of World
70,262 69,315 68,118 67,023 66,251 66,993 67,345 67,683
10.5% 10.3% 10.1% 9.8% 9.6% 9.7% 9.7% 9.8%
Total 670,016 672,633 675,306 680,899 686,811 692,556 690,773 689,738
100.0% 100.0% 100.0% 100.0% 100.0% 100.0% 100.0% 100.0%
Notes: *Figures for 2017/18 only until Q2, i.e. September 2017. Source: NIESR calculations based on NMC data
(Sep. 2017)
Another reason that affects the number of nurses from the EEA that join the register are changes to
language requirements. As of January 2016, nurses and midwives from the EEA that want to register
with the NMC are subject to new language standards. The three ways to satisfy them are: 1. Passing
a language test such as IELTS (minimum score of 7); 2. Qualifying on a course that was taught and
examined in English; or 3. Previous working experience in an English-speaking country if this country
requires a language assessment upon registration. However, the number of registered nurses in fact
increased from September 2015 to September 2016. Hence it is not clear whether this actually led to
a decrease in joiners to the register, though it is possible that the increase could have been larger
without the language requirements. Certainly, language requirements could not explain the increase
in the number of nurses leaving between 2016/17, as the test was not applied retrospectively.
While this section presents high-level findings for the nursing workforce as a whole in the UK we
need to keep in mind that there are considerable differences and nuances across roles and regions.
The RCN (2018) highlights this issue in a recent policy report and describes particular difficulties in
recruiting sufficient nurses specialising in mental health and learning disabilities. Also, large regional
variations were reported and are a matter of concern.
The report also highlights a drop in recruitment of mature students into the sector, which is
concerning as these are more likely to choose shortage specialisations and also have more life

21 | Brexit and the Health & Social Care Workforce in the UK National Institute of Economic and Social Research
experience in general. We acknowledge all of these concerns, which were also partially confirmed by
our focus group interviews.
In the following section most of these will be addressed in more detail, though for the NHS in
England only. Unfortunately, a more detailed analysis is not feasible at this point, due to the lack of
appropriate data of joiners and leavers by nursing specialisation, region and age.
Figure 7. Number of nurses from EEA joining and leaving the NMC register, 2010-17.
Source: NIESR calculations based on NMC data, 2017
Figure 8. Number of nurses from UK joining and leaving the NMC register, 2010-17.
22 | Brexit and the Health & Social Care Workforce in the UK National Institute of Economic and Social Research
Table 6. Joiners and leavers to the NMC register, by nationality, 2010-2017.
Joiners from:
2010/11 2011/12 2012/13 2013/14 2014/15 2015/16 2016/17
England 15,418 15,238 16,883 18,190 16,171 15,434 16,135
Northern Ireland
632 654 607 720 735 619 630
Scotland 2,314 2,304 2,487 2,741 2,347 2,165 2,474
Wales 1,012 952 926 1,077 1,080 896 1,001
EU/EEA 2,716 3,137 3,436 5,389 7,518 9,389 6,382
Rest of World
1,144 1,155 869 840 665 2,135 2,403
Total 23,236 23,440 25,208 28,957 28,516 30,638 29,025
Leavers from:
2010/11 2011/12 2012/13 2013/14 2014/15 2015/16 2016/17
England
14,236
14,885
16,052
17,154
17,582
19,070
23,672
Northern Ireland
596
591
608
649
724
799
987
Scotland
2,154
2,330
2,420
2,534
2,620
2,888
3,593
Wales
654
643
739
830
864
1,031
1,182
EU/EEA
683
918
1,173
1,311
1,545
1,981
3,081
Rest of World
2,151
2,087
2,095
1,974
1,664
1,710
2,426
Total
20,474
21,454
23,087
24,452
24,999
27,479
34,941
Source: NIESR calculations based on NMC data (Sep. 2017)
Table 7. Proportion of nurses on the NMC register that join/leave each year, by nationality, 2010-2017.
Joiners from:
2010/11 2011/12 2012/13 2013/14 2014/15 2015/16 2016/17
England 3.3% 3.3% 3.6% 3.9% 3.4% 3.3% 3.5%
Northern Ireland
2.9% 3.0% 2.8% 3.3% 3.3% 2.8% 2.9%
Scotland 3.3% 3.2% 3.5% 3.8% 3.3% 3.0% 3.5%
Wales 3.6% 3.4% 3.3% 3.8% 3.7% 3.1% 3.5%
EU/EEA 22.1% 21.6% 20.5% 25.8% 27.8% 27.2% 16.8%
Rest of World
1.6% 1.7% 1.3% 1.3% 1.0% 3.2% 3.6%
Total 3.5% 3.5% 3.7% 4.3% 4.2% 4.4% 4.2%
Leavers from:
2010/11 2011/12 2012/13 2013/14 2014/15 2015/16 2016/17
England 3.1% 3.2% 3.4% 3.6% 3.7% 4.1% 5.1%
Northern Ireland
2.7% 2.7% 2.8% 2.9% 3.3% 3.6% 4.5%
Scotland 3.0% 3.3% 3.4% 3.5% 3.7% 4.1% 5.1%
Wales 2.3% 2.3% 2.6% 2.9% 3.0% 3.6% 4.1%
EU/EEA 5.6% 6.3% 7.0% 6.3% 5.7% 5.7% 8.1%
Rest of World
3.1% 3.0% 3.1% 2.9% 2.5% 2.6% 3.6%
Total 3.1% 3.2% 3.4% 3.6% 3.6% 4.0% 5.1%
Source: NIESR calculations based on NMC data
23 | Brexit and the Health & Social Care Workforce in the UK National Institute of Economic and Social Research
2.2 Overview of Social Care workforce composition and trends by nationality
According to the ONS the social care sector employs around 2 million people in the UK. In terms of
employment this makes it larger than the national health care sector. To get an initial overview of
the social care workforce in the UK as a whole we analyse data prepared by the ONS based on the
Annual Population Survey (APS) for 2011 to 2016.12
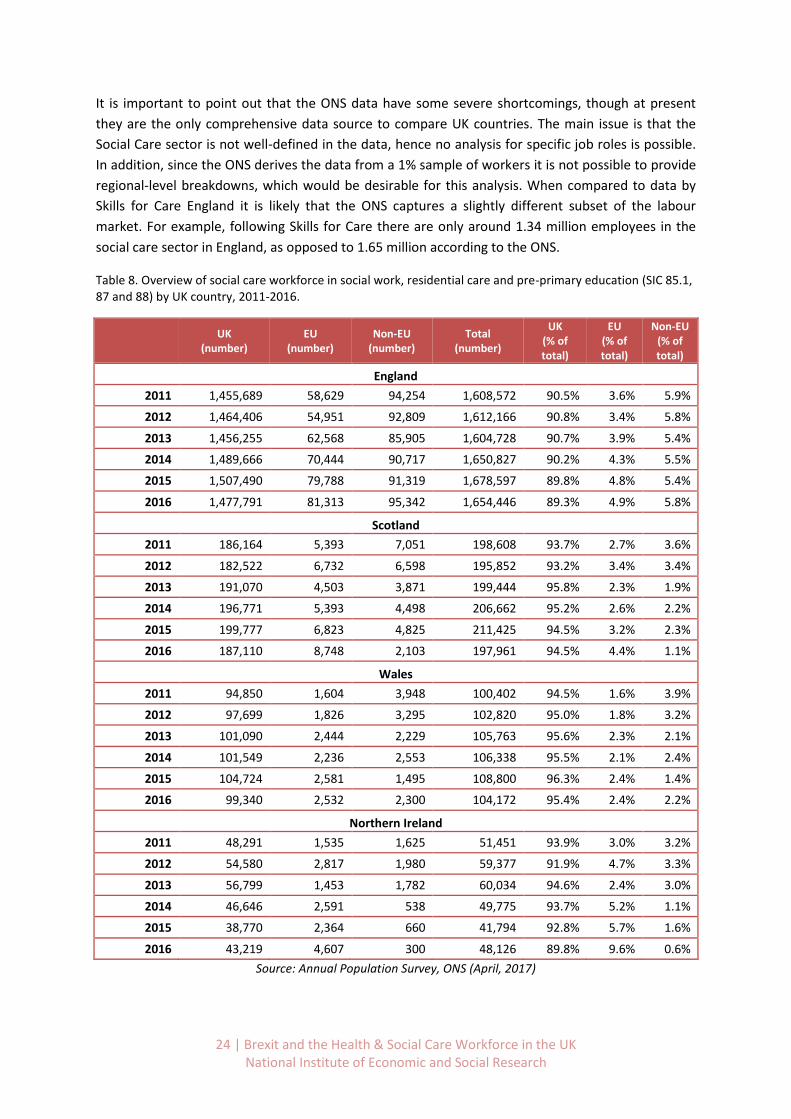
In 2016 there were around 1.65 million social care workers in England, 198,000 in Scotland, 100,000
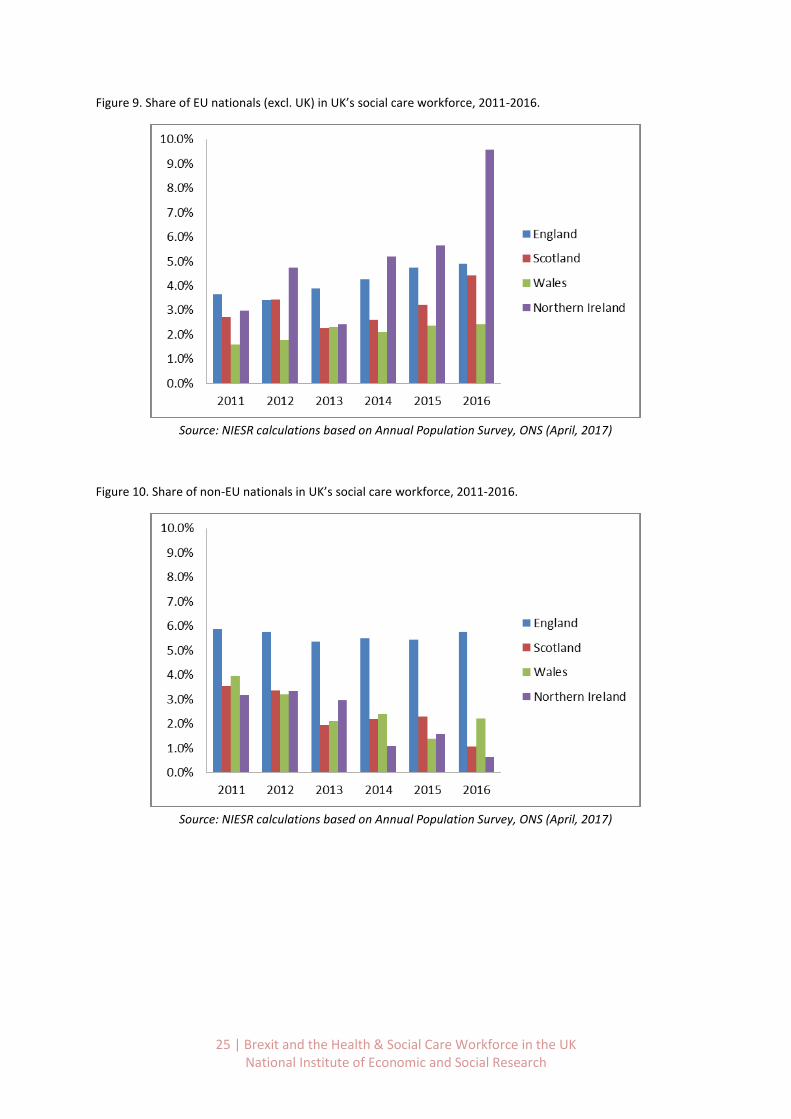
in Wales and 48,000 in Northern Ireland (see Table 8). Based on Figure 9 we can see that the share
of EU nationals in the social care workforce differs across countries in the UK. It is highest in
Northern Ireland (9.6%), followed by England (4.9%), Scotland (4.4%), and lowest in Wales (2.4%).
The trend is pointing upwards as the comparable figures in 2011 were 3% for Northern Ireland, 3.6%
for England, 2.7% for Scotland and 1.6% for Wales.
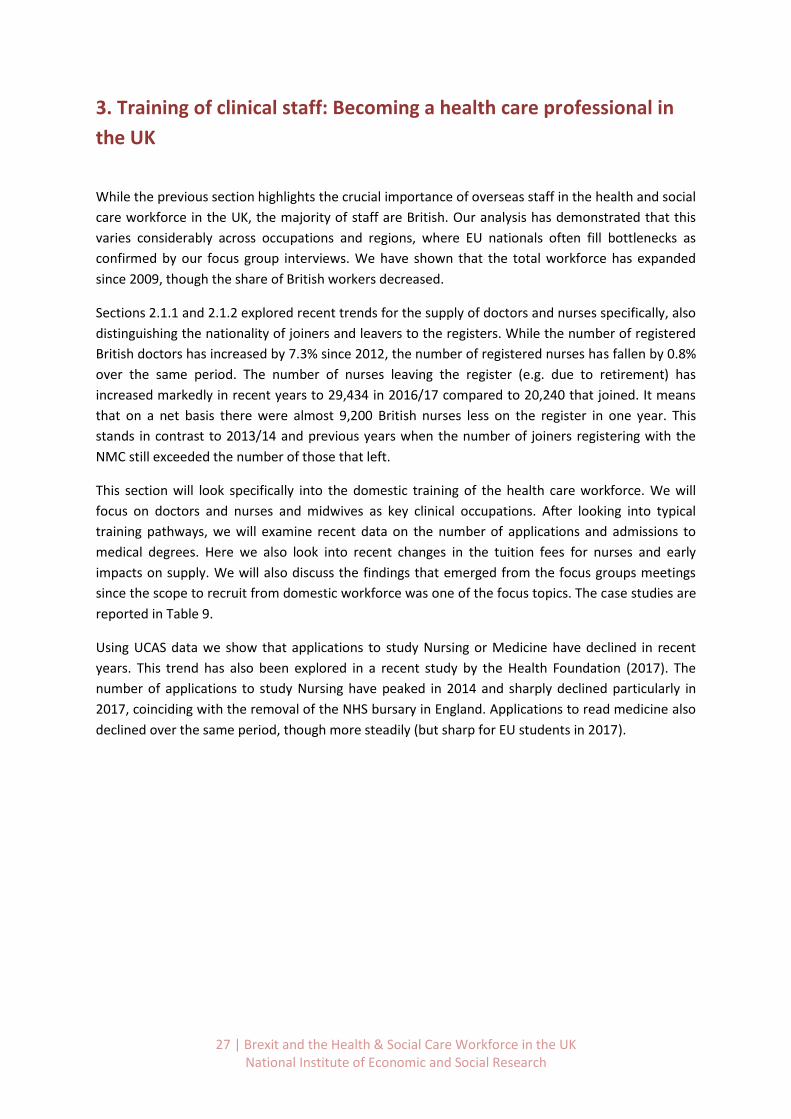
Looking at the total number of EU nationals in the social care workforce in Figure 11 we see that it
has been increasing in recent years. Between 2011 and 2016 the total number in England increased
from 58,000 to 81,300 (+40%), in Scotland from 5,400 to 8,700 (+61%) and in Wales from 1,600 to
2,500 (+56%). In Northern Ireland it increased by 206% from 1,500 to 4,600.13 It is important to note
that these figures show that more EU nationals are employed in the social care sector (total and
relative). This does not necessarily mean that more of them have moved to the UK, though this is
possible.
These figures have to be compared against the fact that the overall number of workers that are
British has declined between 2015 and 2016, though not in Northern Ireland. In England around
30,000 (-2%) British workers left the sector, 12,500 in Scotland (-6.3%) and 5,000 in Wales (-5.1%).
The scale of these numbers is very different to the total number of EU workers that are joining the
sector that we can exclude any large-scale displacement effects.
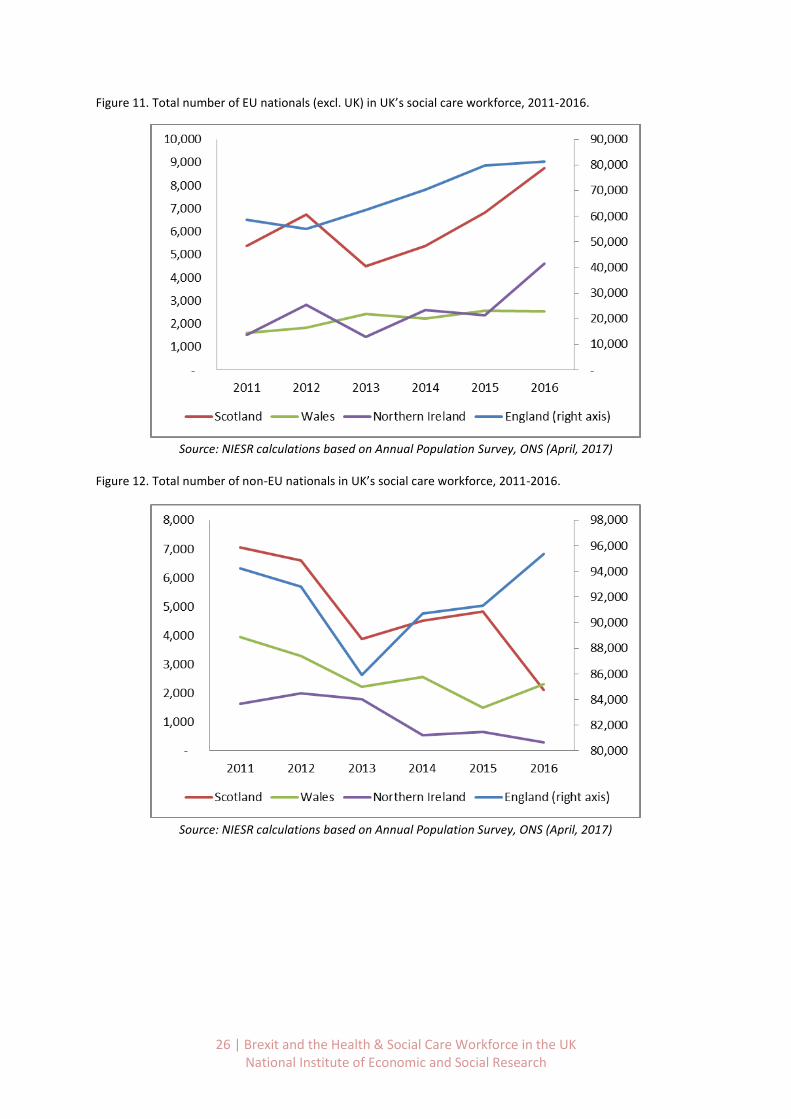
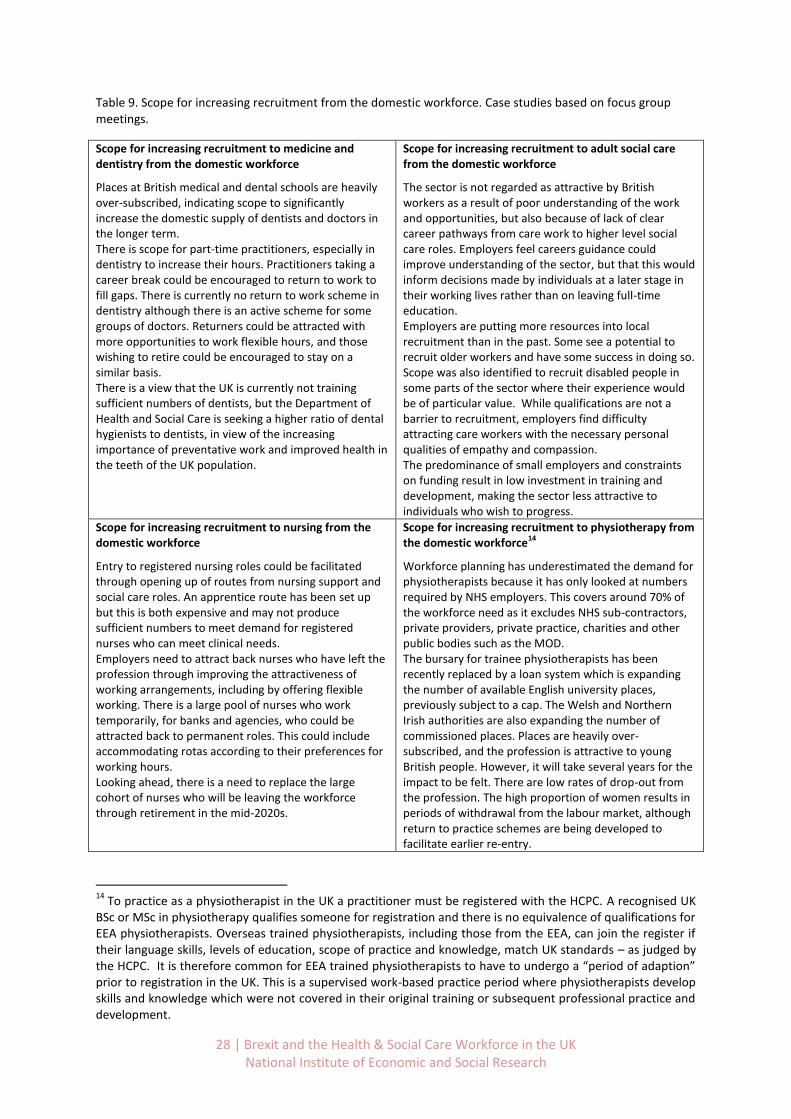
The data also holds information on non-EU workers in social care (Figure 10-11, and Table 8) and the
picture looks more mixed. The total number and share has been stable in England, though with an
upward trend since 2013. In Scotland and Northern Ireland their number has dropped significantly.
Scotland experienced a decline in the share from 3.6% in 2011 to 1.1% in 2016, while in Northern
Ireland the share of non-EU nationals dropped from 3.2% to 0.6% over the same period. Wales
experienced a more moderate but still significant decrease from 3.9% to 2.2%. It is important to
keep these numbers in mind when looking at potential scenarios going forward. Considering that in
recent years it has been mainly EU nationals joining the social care workforce and non-EU nationals
dropped out, this highlights an increasing dependence on EU nationals to fill jobs in the social care
sector.
12
This includes workers in Pre-primary education, Residential care activities, and Social work activities without accommodation (SIC codes 85.1, 87 and 88). The APS reports nationalities of workers, rather than country of birth as in the Census. Hence it does not include people that have migrated to the UK and subsequently became British citizens. 13
2016 figures for Northern Ireland look irregular, though it could be that in 2016 a number of Irish nationals registered in Northern Ireland as a result of the Brexit referendum. We also note that these are official figures coming from the ONS.
24 | Brexit and the Health & Social Care Workforce in the UK National Institute of Economic and Social Research
It is important to point out that the ONS data have some severe shortcomings, though at present
they are the only comprehensive data source to compare UK countries. The main issue is that the
Social Care sector is not well-defined in the data, hence no analysis for specific job roles is possible.
In addition, since the ONS derives the data from a 1% sample of workers it is not possible to provide
regional-level breakdowns, which would be desirable for this analysis. When compared to data by
Skills for Care England it is likely that the ONS captures a slightly different subset of the labour
market. For example, following Skills for Care there are only around 1.34 million employees in the
social care sector in England, as opposed to 1.65 million according to the ONS.
Table 8. Overview of social care workforce in social work, residential care and pre-primary education (SIC 85.1, 87 and 88) by UK country, 2011-2016.
UK
(number) EU
(number) Non-EU
(number) Total
(number)
UK (% of total)
EU (% of total)
Non-EU (% of total)
England
2011 1,455,689 58,629 94,254 1,608,572 90.5% 3.6% 5.9%
2012 1,464,406 54,951 92,809 1,612,166 90.8% 3.4% 5.8%
2013 1,456,255 62,568 85,905 1,604,728 90.7% 3.9% 5.4%
2014 1,489,666 70,444 90,717 1,650,827 90.2% 4.3% 5.5%
2015 1,507,490 79,788 91,319 1,678,597 89.8% 4.8% 5.4%
2016 1,477,791 81,313 95,342 1,654,446 89.3% 4.9% 5.8%
Scotland
2011 186,164 5,393 7,051 198,608 93.7% 2.7% 3.6%
2012 182,522 6,732 6,598 195,852 93.2% 3.4% 3.4%
2013 191,070 4,503 3,871 199,444 95.8% 2.3% 1.9%
2014 196,771 5,393 4,498 206,662 95.2% 2.6% 2.2%
2015 199,777 6,823 4,825 211,425 94.5% 3.2% 2.3%
2016 187,110 8,748 2,103 197,961 94.5% 4.4% 1.1%
Wales
2011 94,850 1,604 3,948 100,402 94.5% 1.6% 3.9%
2012 97,699 1,826 3,295 102,820 95.0% 1.8% 3.2%
2013 101,090 2,444 2,229 105,763 95.6% 2.3% 2.1%
2014 101,549 2,236 2,553 106,338 95.5% 2.1% 2.4%
2015 104,724 2,581 1,495 108,800 96.3% 2.4% 1.4%
2016 99,340 2,532 2,300 104,172 95.4% 2.4% 2.2%
Northern Ireland
2011 48,291 1,535 1,625 51,451 93.9% 3.0% 3.2%
2012 54,580 2,817 1,980 59,377 91.9% 4.7% 3.3%
2013 56,799 1,453 1,782 60,034 94.6% 2.4% 3.0%
2014 46,646 2,591 538 49,775 93.7% 5.2% 1.1%
2015 38,770 2,364 660 41,794 92.8% 5.7% 1.6%
2016 43,219 4,607 300 48,126 89.8% 9.6% 0.6%
Source: Annual Population Survey, ONS (April, 2017)
25 | Brexit and the Health & Social Care Workforce in the UK National Institute of Economic and Social Research
Figure 9. Share of EU nationals (excl. UK) in UK’s social care workforce, 2011-2016.
Source: NIESR calculations based on Annual Population Survey, ONS (April, 2017)
Figure 10. Share of non-EU nationals in UK’s social care workforce, 2011-2016.
Source: NIESR calculations based on Annual Population Survey, ONS (April, 2017)
26 | Brexit and the Health & Social Care Workforce in the UK National Institute of Economic and Social Research
Figure 11. Total number of EU nationals (excl. UK) in UK’s social care workforce, 2011-2016.
Source: NIESR calculations based on Annual Population Survey, ONS (April, 2017)
Figure 12. Total number of non-EU nationals in UK’s social care workforce, 2011-2016.
Source: NIESR calculations based on Annual Population Survey, ONS (April, 2017)
27 | Brexit and the Health & Social Care Workforce in the UK National Institute of Economic and Social Research
3. Training of clinical staff: Becoming a health care professional in
the UK
While the previous section highlights the crucial importance of overseas staff in the health and social
care workforce in the UK, the majority of staff are British. Our analysis has demonstrated that this
varies considerably across occupations and regions, where EU nationals often fill bottlenecks as
confirmed by our focus group interviews. We have shown that the total workforce has expanded
since 2009, though the share of British workers decreased.
Sections 2.1.1 and 2.1.2 explored recent trends for the supply of doctors and nurses specifically, also
distinguishing the nationality of joiners and leavers to the registers. While the number of registered
British doctors has increased by 7.3% since 2012, the number of registered nurses has fallen by 0.8%
over the same period. The number of nurses leaving the register (e.g. due to retirement) has
increased markedly in recent years to 29,434 in 2016/17 compared to 20,240 that joined. It means
that on a net basis there were almost 9,200 British nurses less on the register in one year. This
stands in contrast to 2013/14 and previous years when the number of joiners registering with the
NMC still exceeded the number of those that left.
This section will look specifically into the domestic training of the health care workforce. We will
focus on doctors and nurses and midwives as key clinical occupations. After looking into typical
training pathways, we will examine recent data on the number of applications and admissions to
medical degrees. Here we also look into recent changes in the tuition fees for nurses and early
impacts on supply. We will also discuss the findings that emerged from the focus groups meetings
since the scope to recruit from domestic workforce was one of the focus topics. The case studies are
reported in Table 9.
Using UCAS data we show that applications to study Nursing or Medicine have declined in recent
years. This trend has also been explored in a recent study by the Health Foundation (2017). The
number of applications to study Nursing have peaked in 2014 and sharply declined particularly in
2017, coinciding with the removal of the NHS bursary in England. Applications to read medicine also
declined over the same period, though more steadily (but sharp for EU students in 2017).
28 | Brexit and the Health & Social Care Workforce in the UK National Institute of Economic and Social Research
Table 9. Scope for increasing recruitment from the domestic workforce. Case studies based on focus group meetings.
Scope for increasing recruitment to medicine and dentistry from the domestic workforce
Places at British medical and dental schools are heavily over-subscribed, indicating scope to significantly increase the domestic supply of dentists and doctors in the longer term. There is scope for part-time practitioners, especially in dentistry to increase their hours. Practitioners taking a career break could be encouraged to return to work to fill gaps. There is currently no return to work scheme in dentistry although there is an active scheme for some groups of doctors. Returners could be attracted with more opportunities to work flexible hours, and those wishing to retire could be encouraged to stay on a similar basis. There is a view that the UK is currently not training sufficient numbers of dentists, but the Department of Health and Social Care is seeking a higher ratio of dental hygienists to dentists, in view of the increasing importance of preventative work and improved health in the teeth of the UK population.
Scope for increasing recruitment to adult social care from the domestic workforce
The sector is not regarded as attractive by British workers as a result of poor understanding of the work and opportunities, but also because of lack of clear career pathways from care work to higher level social care roles. Employers feel careers guidance could improve understanding of the sector, but that this would inform decisions made by individuals at a later stage in their working lives rather than on leaving full-time education. Employers are putting more resources into local recruitment than in the past. Some see a potential to recruit older workers and have some success in doing so. Scope was also identified to recruit disabled people in some parts of the sector where their experience would be of particular value. While qualifications are not a barrier to recruitment, employers find difficulty attracting care workers with the necessary personal qualities of empathy and compassion. The predominance of small employers and constraints on funding result in low investment in training and development, making the sector less attractive to individuals who wish to progress.
Scope for increasing recruitment to nursing from the domestic workforce
Entry to registered nursing roles could be facilitated through opening up of routes from nursing support and social care roles. An apprentice route has been set up but this is both expensive and may not produce sufficient numbers to meet demand for registered nurses who can meet clinical needs. Employers need to attract back nurses who have left the profession through improving the attractiveness of working arrangements, including by offering flexible working. There is a large pool of nurses who work temporarily, for banks and agencies, who could be attracted back to permanent roles. This could include accommodating rotas according to their preferences for working hours. Looking ahead, there is a need to replace the large cohort of nurses who will be leaving the workforce through retirement in the mid-2020s.
Scope for increasing recruitment to physiotherapy from the domestic workforce14
Workforce planning has underestimated the demand for physiotherapists because it has only looked at numbers required by NHS employers. This covers around 70% of the workforce need as it excludes NHS sub-contractors, private providers, private practice, charities and other public bodies such as the MOD. The bursary for trainee physiotherapists has been recently replaced by a loan system which is expanding the number of available English university places, previously subject to a cap. The Welsh and Northern Irish authorities are also expanding the number of commissioned places. Places are heavily over-subscribed, and the profession is attractive to young British people. However, it will take several years for the impact to be felt. There are low rates of drop-out from the profession. The high proportion of women results in periods of withdrawal from the labour market, although return to practice schemes are being developed to facilitate earlier re-entry.
14
To practice as a physiotherapist in the UK a practitioner must be registered with the HCPC. A recognised UK BSc or MSc in physiotherapy qualifies someone for registration and there is no equivalence of qualifications for EEA physiotherapists. Overseas trained physiotherapists, including those from the EEA, can join the register if their language skills, levels of education, scope of practice and knowledge, match UK standards – as judged by the HCPC. It is therefore common for EEA trained physiotherapists to have to undergo a “period of adaption” prior to registration in the UK. This is a supervised work-based practice period where physiotherapists develop skills and knowledge which were not covered in their original training or subsequent professional practice and development.
29 | Brexit and the Health & Social Care Workforce in the UK National Institute of Economic and Social Research
3.1 Becoming a registered nurse
Becoming a registered nurse with the Nursing and Midwifery Council (NMC) requires a 3-year
bachelor’s degree in nursing, with a specialisation in adult, child, mental health or learning disability.
Applications are processed by the Universities and Colleges Admissions Service (UCAS) and it is
possible to study on a part-time basis. Upon completion of the programme a graduate can register
within 5 years with the NMC online, for a fee of £120. The registration should be completed within
10 working days.
The NMC lists online 163 approved programmes in the UK for a specialisation in adult care, 143 for
mental health care, 109 for childcare and 48 for learning disabilities.15
Costs vary mainly across UK countries, rather than universities. In England the NHS stopped its
bursaries for nursing, midwifery and other health degrees on the 1st August 2017. Instead applicants
are referred to the same student loan system as for other students.16 Some bursaries remain for
eligible students with children or those facing severe hardship. Students only need to pay back the
loan once they are in employment and earn above £25,000. For UK and EU nationals it currently
costs around £9,250 in tuition per year to become an adult care nurse in England. Fees for overseas
students can be significantly higher, sometimes exceeding £15,000 per year (e.g. University of
Lincoln, London South Bank University).
In Scotland students are eligible for the NHS bursary under the Student Awards Agency Scotland
(SAAS) if they are domiciled in Scotland or EU nationals. Students from the rest of the UK (not
domiciled in Scotland) need to pay the full £9,250 per year, and fees for international students can
exceed £23,000 in the case of the University of Edinburgh.
In Wales, eligibility for the NHS bursary depends on whether the student lived in the UK for 3 years
prior to starting the course and commits to working for a minimum of 2 years in Wales upon
graduation. Additional means-tested financial support is available. Fees for UK and EU students
without the bursary are £9,000 and fees for international students can be considerably higher.
Finally, in Northern Ireland tuition fees for nursing are fully funded by the Department for Health. To
be eligible students need to live for 3 years in Northern Ireland prior to starting the degree or be an
EU national (apart from rest of the UK).
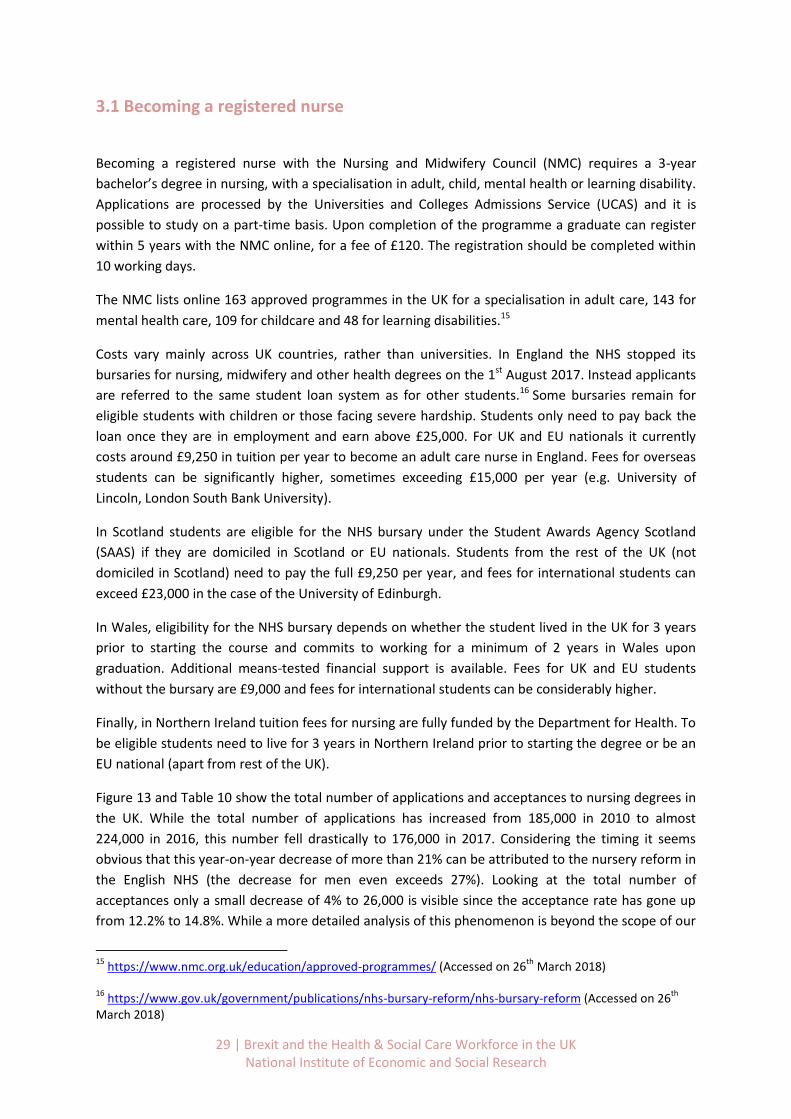
Figure 13 and Table 10 show the total number of applications and acceptances to nursing degrees in
the UK. While the total number of applications has increased from 185,000 in 2010 to almost
224,000 in 2016, this number fell drastically to 176,000 in 2017. Considering the timing it seems
obvious that this year-on-year decrease of more than 21% can be attributed to the nursery reform in
the English NHS (the decrease for men even exceeds 27%). Looking at the total number of
acceptances only a small decrease of 4% to 26,000 is visible since the acceptance rate has gone up
from 12.2% to 14.8%. While a more detailed analysis of this phenomenon is beyond the scope of our
15
https://www.nmc.org.uk/education/approved-programmes/ (Accessed on 26th
March 2018)
16 https://www.gov.uk/government/publications/nhs-bursary-reform/nhs-bursary-reform (Accessed on 26
th
March 2018)
30 | Brexit and the Health & Social Care Workforce in the UK National Institute of Economic and Social Research
study a continuation of these trends has potential implications for the quality of the workforce as
the pool to choose applicants from is smaller.
A study by the Royal College of Nursing (2018) reports that only around 70-75% of nurses that are
accepted will in the end register with the NMC (based on graduate figures in England for 2015 and
2016). This implies that of the 26,000 accepted nurses in the class of 2017 only around 19,500 would
actually enter the nursing workforce when they graduate in September 2020.
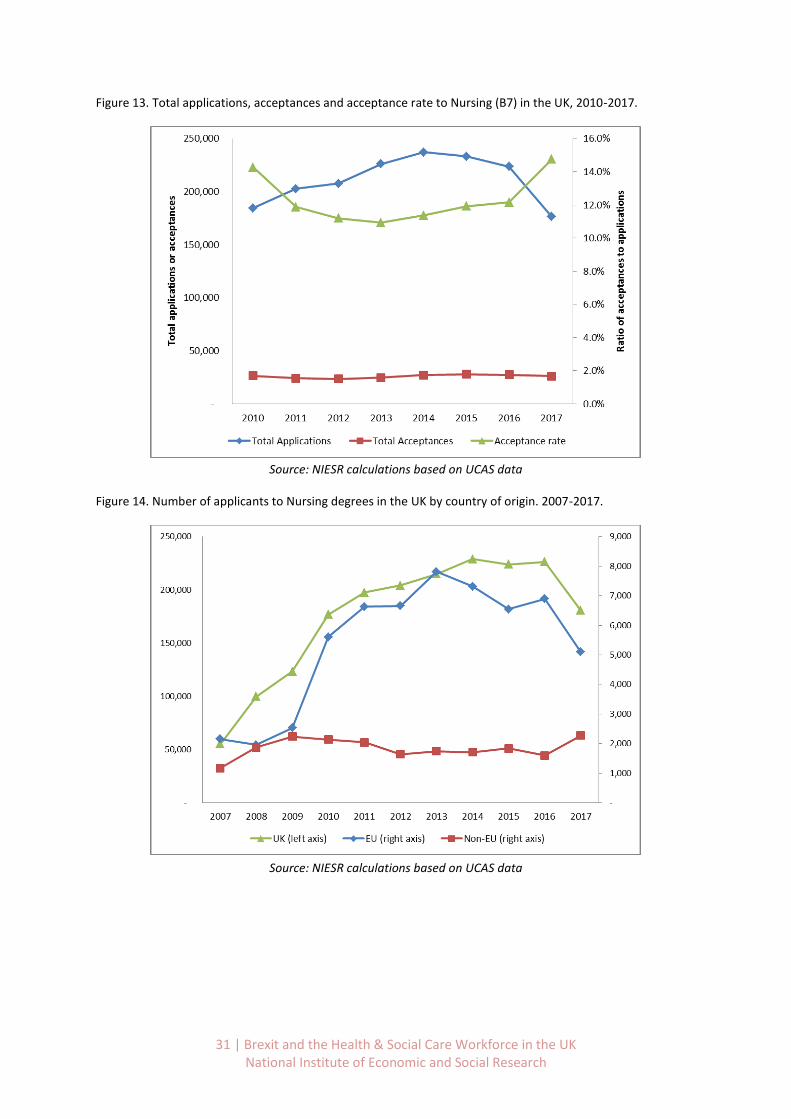
Based on Figure 14 we can furthermore see that not only the number of British applicants
decreased, but also the number of applicants from the EU dropped by 26% between 2016 and 2017.
Applications from non-EU countries on the other hand increased by 30%, though in absolute terms
this only makes up for 1.4% of the total decrease from the UK and EU. The decreasing popularity of
nursing degrees is also discussed in a recent report by the Royal College of Nursing (2018) and
though the Secretary of State for Health and Social Care announced to expand the number of funded
clinical placements, this must be seen against the backdrop of fewer applicants. Unless application
criteria will be dropped it is unlikely that these places can be filled with equally good candidates. The
RCN also reports that application for 2018 intake has again fallen.
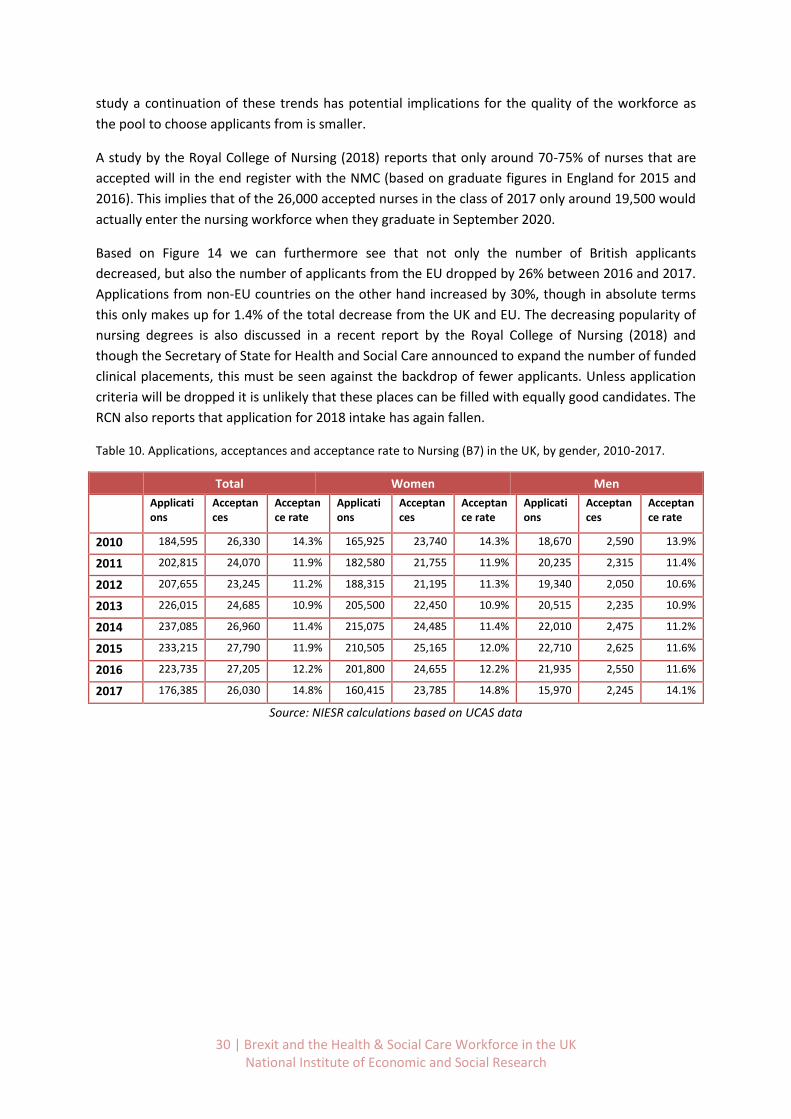
Table 10. Applications, acceptances and acceptance rate to Nursing (B7) in the UK, by gender, 2010-2017.
Total Women Men
Applications
Acceptances
Acceptance rate
Applications
Acceptances
Acceptance rate
Applications
Acceptances
Acceptance rate
2010 184,595 26,330 14.3% 165,925 23,740 14.3% 18,670 2,590 13.9%
2011 202,815 24,070 11.9% 182,580 21,755 11.9% 20,235 2,315 11.4%
2012 207,655 23,245 11.2% 188,315 21,195 11.3% 19,340 2,050 10.6%
2013 226,015 24,685 10.9% 205,500 22,450 10.9% 20,515 2,235 10.9%
2014 237,085 26,960 11.4% 215,075 24,485 11.4% 22,010 2,475 11.2%
2015 233,215 27,790 11.9% 210,505 25,165 12.0% 22,710 2,625 11.6%
2016 223,735 27,205 12.2% 201,800 24,655 12.2% 21,935 2,550 11.6%
2017 176,385 26,030 14.8% 160,415 23,785 14.8% 15,970 2,245 14.1%
Source: NIESR calculations based on UCAS data
31 | Brexit and the Health & Social Care Workforce in the UK National Institute of Economic and Social Research
Figure 13. Total applications, acceptances and acceptance rate to Nursing (B7) in the UK, 2010-2017.
Source: NIESR calculations based on UCAS data
Figure 14. Number of applicants to Nursing degrees in the UK by country of origin. 2007-2017.
Source: NIESR calculations based on UCAS data
32 | Brexit and the Health & Social Care Workforce in the UK National Institute of Economic and Social Research
3.2 Becoming a licensed doctor in the UK
To become a doctor in the UK, students first enrol in an undergraduate medical degree that takes
four to six years depending on the circumstances or choices of the student, though the majority of
students will complete their degree in five years. This is followed by the two year foundation
programme after which students train to become a clinical specialist or GP. A significant number will
also end up in non-training posts, as shown in Figure 15, prepared by the GMC (2017). The figure
shows the total number of medical students and doctors at different stages of medical education.
In 2016 there were around 58,500 GPs, 72,000 specialists and 41,500 doctors in non-training posts.
In addition, there were around 40,000 medical students, 24,000 students in their foundation years
or core training programmes, 11,000 doctors in GP specialty training and 25,500 in specialty training.
As we know that most students graduate after five years, GPs take around ten years to train,
whereas specialists can take between 12-15 years as a minimum. This does not account for time out
of training (for reasons such as research and career breaks), less than full time training or education
reasons to delay training. The time lag between entering medical school and a fully trained doctor is
considerable, though not uncommon in international comparisons.
Funding for medical and dental students differs between UK countries. Students that are classed as
domiciled in England are entitled to a student loan by Student Finance England that will cover tuition
costs for the first 4 years of studies in the form of a repayable loan. Years four and five will be paid
by the NHS Bursaries Scheme. Similar arrangements are in place for students that are classed as
domiciled in Northern Ireland, where the Northern Ireland Department of Health covers costs from
year 5 onwards. Before that, students can apply for student loans and a means-tested grant.
Students classed as domiciled in Wales can apply for a means-tested bursary provided by the NHS
Welsh Bursary Scheme. Funding from year 5 onwards is covered automatically. In Scotland the
government pays for the tuition fees if students are classed as domiciled there or qualify as home
students.
In 2017 there were 6,071 medical school places in England. Most are allocated to King’s College
(401)17, University of Birmingham (374) and University of Manchester (371). In addition, there are
809 dental school places.
17
Higher Education Funding Council for England (13th
April 2017). http://www.hefce.ac.uk/lt/healthcare/intake/ (accessed on 27
th March 2018)

33 | Brexit and the Health & Social Care Workforce in the UK National Institute of Economic and Social Research
Figure 15. GMC graph on number of medical students and doctors at different stages of their education in 2016.
Source: GMC (2017) report “The State of medical education and practice in the UK” (p.60)
The Department for Health and Social Care first announced in October 2016 that the number of
medical undergraduate places in England will be expanded by 1,500.18 Of these, 500 are to be
offered in September 2018 and the remaining 1,000 in the year after, both following a competitive
bidding process. This process has now concluded, and has led to the creation of new medical schools
that will begin teaching in the coming years. The plan also includes potentially charging international
students. The GMC welcomes this initiative but acknowledges there is a long time lag between
offering a place in a medical degree and becoming a full trained doctor. It estimates that earliest in
2028 these additional doctors would become fully trained as GPs or 2033 as hospital specialists.19
Also, the Department of Health states that “there is a lag in the time it takes to train a new member
18
https://www.gov.uk/government/news/1500-extra-medical-undergraduate-places-confirmed (accessed on 27
th March 2018)
19https://www.gov.uk/government/uploads/system/uploads/attachment_data/file/693470/General_Medical_
Council.pdf (accessed on 27th
March 2018)
34 | Brexit and the Health & Social Care Workforce in the UK National Institute of Economic and Social Research
of staff, especially for medics and therefore continued migration across the NHS is vital to maintain
service levels”.20
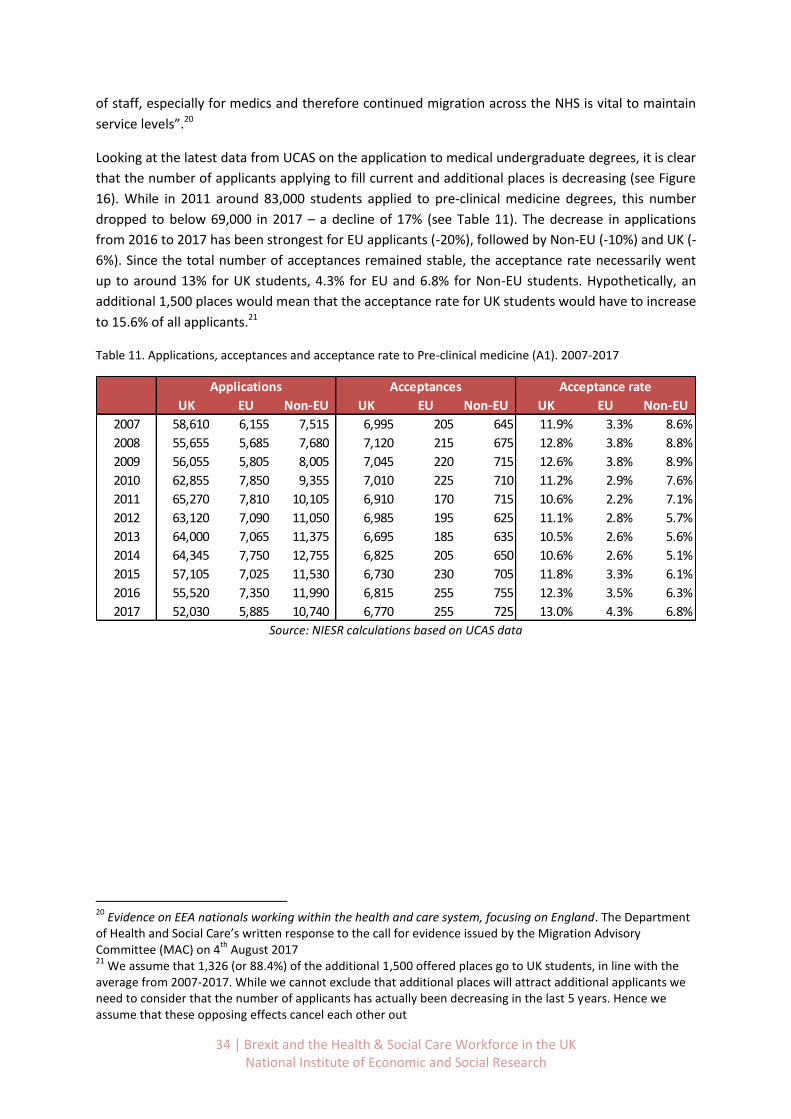
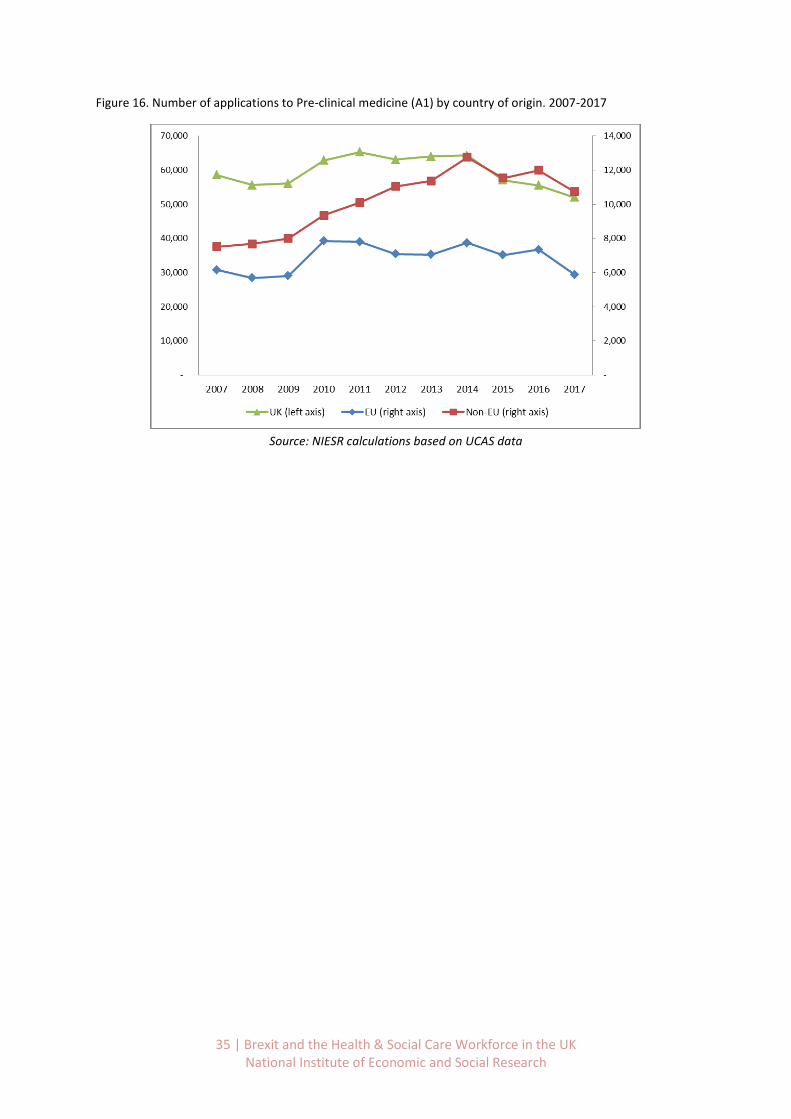
Looking at the latest data from UCAS on the application to medical undergraduate degrees, it is clear
that the number of applicants applying to fill current and additional places is decreasing (see Figure
16). While in 2011 around 83,000 students applied to pre-clinical medicine degrees, this number
dropped to below 69,000 in 2017 – a decline of 17% (see Table 11). The decrease in applications
from 2016 to 2017 has been strongest for EU applicants (-20%), followed by Non-EU (-10%) and UK (-
6%). Since the total number of acceptances remained stable, the acceptance rate necessarily went
up to around 13% for UK students, 4.3% for EU and 6.8% for Non-EU students. Hypothetically, an
additional 1,500 places would mean that the acceptance rate for UK students would have to increase
to 15.6% of all applicants.21
Table 11. Applications, acceptances and acceptance rate to Pre-clinical medicine (A1). 2007-2017
Source: NIESR calculations based on UCAS data
20
Evidence on EEA nationals working within the health and care system, focusing on England. The Department of Health and Social Care’s written response to the call for evidence issued by the Migration Advisory Committee (MAC) on 4
th August 2017
21 We assume that 1,326 (or 88.4%) of the additional 1,500 offered places go to UK students, in line with the
average from 2007-2017. While we cannot exclude that additional places will attract additional applicants we need to consider that the number of applicants has actually been decreasing in the last 5 years. Hence we assume that these opposing effects cancel each other out
UK EU Non-EU UK EU Non-EU UK EU Non-EU
2007 58,610 6,155 7,515 6,995 205 645 11.9% 3.3% 8.6%
2008 55,655 5,685 7,680 7,120 215 675 12.8% 3.8% 8.8%
2009 56,055 5,805 8,005 7,045 220 715 12.6% 3.8% 8.9%
2010 62,855 7,850 9,355 7,010 225 710 11.2% 2.9% 7.6%
2011 65,270 7,810 10,105 6,910 170 715 10.6% 2.2% 7.1%
2012 63,120 7,090 11,050 6,985 195 625 11.1% 2.8% 5.7%
2013 64,000 7,065 11,375 6,695 185 635 10.5% 2.6% 5.6%
2014 64,345 7,750 12,755 6,825 205 650 10.6% 2.6% 5.1%
2015 57,105 7,025 11,530 6,730 230 705 11.8% 3.3% 6.1%
2016 55,520 7,350 11,990 6,815 255 755 12.3% 3.5% 6.3%
2017 52,030 5,885 10,740 6,770 255 725 13.0% 4.3% 6.8%
Applications Acceptances Acceptance rate
35 | Brexit and the Health & Social Care Workforce in the UK National Institute of Economic and Social Research
Figure 16. Number of applications to Pre-clinical medicine (A1) by country of origin. 2007-2017
Source: NIESR calculations based on UCAS data
36 | Brexit and the Health & Social Care Workforce in the UK National Institute of Economic and Social Research
4. Considerations for future staffing in the health and social care
sector
4.1 Current status of the negotiations between the UK and the EU on future
mobility of citizens
On the 8th December 2017 the UK and the EU reached an agreement during Phase I of the
negotiations on the orderly withdrawal of the UK from the EU.22 It was approved by the European
Council and subsequently the negotiations on the actual Withdrawal Agreement commenced. It
covered the three main areas of protection of citizens’ rights, the issue of Northern Ireland, and
outstanding financial settlements. As the present study is mainly concerned with issues related to
immigration we will place a focus on the rights to free movement of citizens. The agreement set out
a reciprocal right of citizens to have their full rights protected under EU law until the UK leaves on
29. March 2019.
In addition, both parties published a draft Withdrawal Agreement on the 19. March 2018 that sets
out a 21-month transition period from the 29. March 2019 to the 31 December 2020.23 Regarding
the movement of labour, the draft states that UK and EU nationals that move during the transition
period will have the same rights as those that did before Brexit.
At his stage little is known about the future immigration system that the UK will put in place post
2020. A report by the Home Office on the delivery of Brexit and immigration states that:24 “The
Government has not yet provided details about what the post-Brexit immigration arrangements
might look like, what the costs and benefits might be or what it hopes to achieve—beyond reducing
immigration and continuing to attract the ‘brightest and the best’.” (p.14).
The government commissioned the Migration Advisory Committee (MAC) to examine the impact of
Brexit on the UK labour market and a future immigration system that reflects the UK’s ‘deep and
special partnership with the EU’.25 The MAC reported their findings in September 2018.26 We expect
their findings will be one factor among many in determining the Government’s new policies. This
means that we need to make assumptions and work with different scenarios, of which some might
be more likely than others, though these probabilities keep changing.
Though we are mainly interested in the movement of labour during and after the transition period, it
is clear that this is closely linked to other aspects of Brexit such as future access to the EU market.
22
https://www.gov.uk/government/publications/joint-report-on-progress-during-phase-1-of-negotiations-under-article-50-teu-on-the-uks-orderly-withdrawal-from-the-eu (Accessed on 20. March 2018) 23
https://www.gov.uk/government/publications/draft-withdrawal-agreement-19-march-2018 (Accessed on 20. March 2018) 24
https://publications.parliament.uk/pa/cm201719/cmselect/cmhaff/421/421.pdf (Accessed on 20. March 2018) 25
https://www.gov.uk/government/publications/commissioning-letter-to-the-migration-advisory-committee (Accessed on 20. March 2018) 26
https://www.gov.uk/government/publications/migration-advisory-committee-mac-report-eea-migration

37 | Brexit and the Health & Social Care Workforce in the UK National Institute of Economic and Social Research
In a comprehensive review of the Brexit options for the UK, Amit et al. (2018) describe this as the
‘great British trade-off’. From their analysis it becomes clear that a higher level of access to the EU
market goes hand in hand with concessions on the freedom of movement of labour. It remains to be
seen which compromise will be struck between the UK government and the EU.
Since the current position of the UK government is to remain outside the Customs Union one
possible scenario is restricted freedom of movement of EU citizens to the UK – and vice-versa.
However, the future immigration regime that will be put in place is unknown at this stage, making it
extremely difficult to project any of the trends into the future.
It is important to point out that most of the discussions about the future of the UK after Brexit have
focussed predominantly on the implications for trade. Comparatively little attention has been
devoted to what might replace the Free Movement of Labour. This is despite the topic of
immigration being one of the key drivers leading up to the Brexit campaign. It is evident that this
lower immigration could be achieved by the strict control of the UK borders and ending free
movement. However, this may only be accomplished by giving up access to the EU single market.
4.2 Potential scenarios for international migration post-2020
Inevitably there will need to be many compromises – but it is likely that Free Movement of Labour
will end, at least as it exists currently. There has been much discussion of possible future Brexit
‘scenarios’. We review these different visions and focus on what they may mean for the HSC
workforce.
The Fahy et al. (2017) paper in the Lancet attempts to set out the possible scenarios which are likely
in the near future over the possible forms that Brexit may take and the likely consequences. They
distinguish between a ‘Soft Brexit’, a ‘Hard Brexit’ and a ‘Failed Brexit’. The Box below sets out their
definitions of these three concepts (see Table 12).
To develop a clear view of what the main scenarios are for UK immigration policy – during the
transition process and after Brexit - is fraught with uncertainty. It is fair to say that nobody knows for
sure exactly what will happen in the next 2-5 years. For developing some final implications of this
research, we need to consider what might happen with respect to various domains of policy:
Different possible options on movement of labour in a post Brexit UK
Arrangements for EU nationals currently living in the UK.
The timeline of immigration policy changes and implementation.
Assumptions about what happens to UK nationals presently abroad.
Below we consider the possibilities in each of these domains and develop two basic scenarios: Hard
Brexit and Soft Brexit. These terms are somewhat clichéd and overused, but we define what we
mean quite precisely and then we will use this as our two possible extremes. This will allow us to
make projections from our review of relevant statistics which will bound the set of reasonable and
feasible outcomes. We used the stakeholder engagement focus groups to investigate if any of the
stakeholders believe that other scenarios are possible (see also Table 16).
38 | Brexit and the Health & Social Care Workforce in the UK National Institute of Economic and Social Research
Since any agreement on immigration will be tied up with an agreement on trade we must consider
the different possibilities as arrangements which cover both aspects of Brexit. There are many
alternatives (for a more complete description see Ntampoudi, 2017) but there are three main
positive possibilities. To this a fourth pessimistic scenario has been gaining ground (Portes, 2018).
These possibilities are summarised in Table 12.
Table 12. Brexit Scenarios based on Fahy et al. (2017) and Portes (2018).
The basic language which has been used up to date is conveniently described by Fahy et al (2017) in the Lancet:
Soft Brexit: Basically, this amounts to continued integration with the EEA single market. As a likely
consequence of this access of the UK to the single market, the UK is likely to be forced to forgo the
complete control of their own immigration. This may not mean complete free movement of labourbut
certainly the EU will insist on continued access to the UK labour market for its citizen on preferential terms.
Hard Brexit: This means a new set of wide ranging free trade deals and being outside the customs union of
the EU. In this case the UK would not have to be open to EU citizens and Free Movement would no longer
operate.
Failed Brexit: In this case the UK would need to fall back on WTO rules for trade. In this event the UK
would not have to be open to EU citizens and Free Movement of Labour would end.
An alternative interpretation of what might be the different post-Brexit scenarios has been provided by Portes
(2018). This report is a summary of the different possible deals which might be adopted after Brexit:
EEA Rules (like Norway, Lichtenstein and Iceland) – Free movement of labour – this would entitle the UK to
have access to the single market for goods and services. In many respects this is the same as a ‘Soft Brexit’
as outlined above.
No Deal, WTO Rules – No free movement of labour (and no access to the single market) at all. In which
case it would be down to the UK to determine what visas or quota system it wanted to put on the entry of
EU nationals. One possibility is that we use similar rules to those that presently apply to the Non-EU
immigrants. This would mean the use of a points based system. In many respects this is the same as a
‘Failed Brexit’ as outlined above.
EFTA Rules (like Switzerland) – Entry possible for EU nationals provided you have a job already lined up
before enter the country and other restrictions apply like – jobs being first offered to nationals. In many
respects this is a specific version of a ‘Soft Brexit’ as outlined above.
May’s Bespoke Option: Current reports of the negotiated settlement that is sought by the current
government would involve trade deals with whichever countries can be agreed, a new customs union deal
and not the one which operates currently in the EU, and the removal of free movement of Labour to be
replaced by whatever immigration arrangements are necessary for the needs of the UK economy. In some
respects this is a version of a ‘Hard Brexit’ as outlined above – but it seems very unlikely that all the desired
features that the present Government seeks would be attainable.
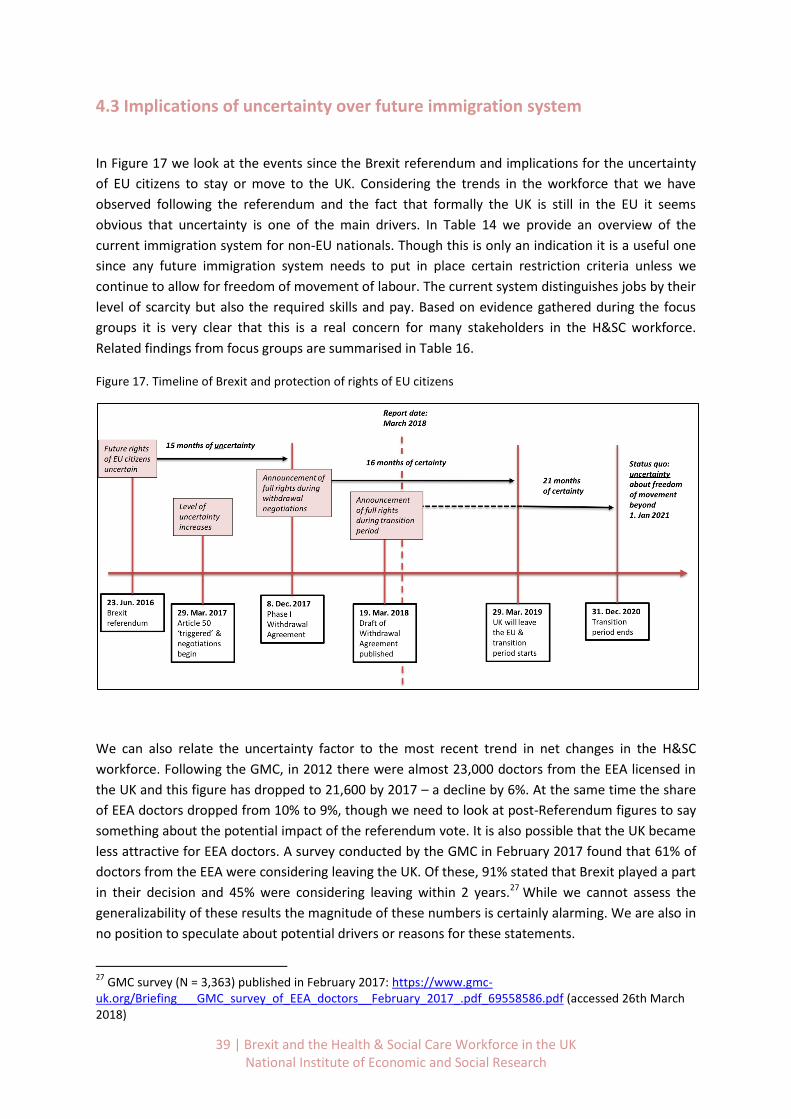
39 | Brexit and the Health & Social Care Workforce in the UK National Institute of Economic and Social Research
4.3 Implications of uncertainty over future immigration system
In Figure 17 we look at the events since the Brexit referendum and implications for the uncertainty
of EU citizens to stay or move to the UK. Considering the trends in the workforce that we have
observed following the referendum and the fact that formally the UK is still in the EU it seems
obvious that uncertainty is one of the main drivers. In Table 14 we provide an overview of the
current immigration system for non-EU nationals. Though this is only an indication it is a useful one
since any future immigration system needs to put in place certain restriction criteria unless we
continue to allow for freedom of movement of labour. The current system distinguishes jobs by their
level of scarcity but also the required skills and pay. Based on evidence gathered during the focus
groups it is very clear that this is a real concern for many stakeholders in the H&SC workforce.
Related findings from focus groups are summarised in Table 16.
Figure 17. Timeline of Brexit and protection of rights of EU citizens
We can also relate the uncertainty factor to the most recent trend in net changes in the H&SC
workforce. Following the GMC, in 2012 there were almost 23,000 doctors from the EEA licensed in
the UK and this figure has dropped to 21,600 by 2017 – a decline by 6%. At the same time the share
of EEA doctors dropped from 10% to 9%, though we need to look at post-Referendum figures to say
something about the potential impact of the referendum vote. It is also possible that the UK became
less attractive for EEA doctors. A survey conducted by the GMC in February 2017 found that 61% of
doctors from the EEA were considering leaving the UK. Of these, 91% stated that Brexit played a part
in their decision and 45% were considering leaving within 2 years.27 While we cannot assess the
generalizability of these results the magnitude of these numbers is certainly alarming. We are also in
no position to speculate about potential drivers or reasons for these statements.
27
GMC survey (N = 3,363) published in February 2017: https://www.gmc-uk.org/Briefing___GMC_survey_of_EEA_doctors__February_2017_.pdf_69558586.pdf (accessed 26th March 2018)
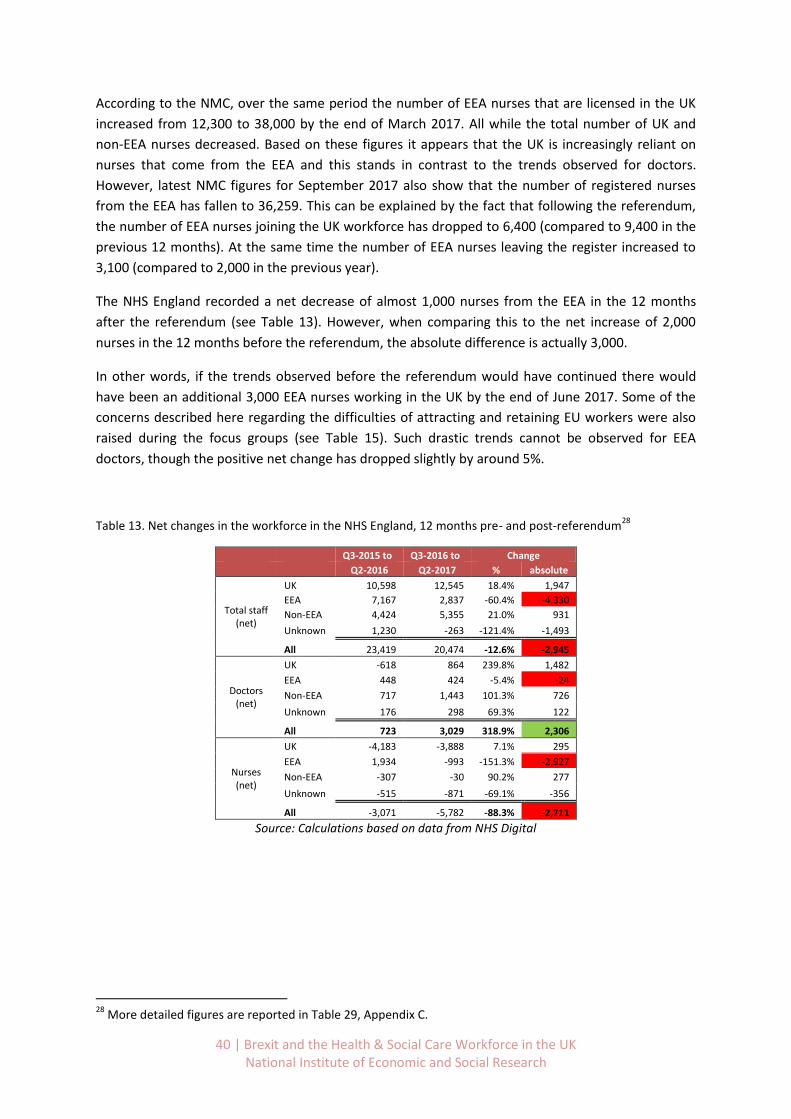
40 | Brexit and the Health & Social Care Workforce in the UK National Institute of Economic and Social Research
According to the NMC, over the same period the number of EEA nurses that are licensed in the UK
increased from 12,300 to 38,000 by the end of March 2017. All while the total number of UK and
non-EEA nurses decreased. Based on these figures it appears that the UK is increasingly reliant on
nurses that come from the EEA and this stands in contrast to the trends observed for doctors.
However, latest NMC figures for September 2017 also show that the number of registered nurses
from the EEA has fallen to 36,259. This can be explained by the fact that following the referendum,
the number of EEA nurses joining the UK workforce has dropped to 6,400 (compared to 9,400 in the
previous 12 months). At the same time the number of EEA nurses leaving the register increased to
3,100 (compared to 2,000 in the previous year).
The NHS England recorded a net decrease of almost 1,000 nurses from the EEA in the 12 months
after the referendum (see Table 13). However, when comparing this to the net increase of 2,000
nurses in the 12 months before the referendum, the absolute difference is actually 3,000.
In other words, if the trends observed before the referendum would have continued there would
have been an additional 3,000 EEA nurses working in the UK by the end of June 2017. Some of the
concerns described here regarding the difficulties of attracting and retaining EU workers were also
raised during the focus groups (see Table 15). Such drastic trends cannot be observed for EEA
doctors, though the positive net change has dropped slightly by around 5%.
Table 13. Net changes in the workforce in the NHS England, 12 months pre- and post-referendum28
Q3-2015 to Q3-2016 to Change
Q2-2016 Q2-2017 % absolute
Total staff (net)
UK 10,598 12,545 18.4% 1,947
EEA 7,167 2,837 -60.4% -4,330
Non-EEA 4,424 5,355 21.0% 931
Unknown 1,230 -263 -121.4% -1,493
All 23,419 20,474 -12.6% -2,945
Doctors (net)
UK -618 864 239.8% 1,482
EEA 448 424 -5.4% -24
Non-EEA 717 1,443 101.3% 726
Unknown 176 298 69.3% 122
All 723 3,029 318.9% 2,306
Nurses (net)
UK -4,183 -3,888 7.1% 295
EEA 1,934 -993 -151.3% -2,927
Non-EEA -307 -30 90.2% 277
Unknown -515 -871 -69.1% -356
All -3,071 -5,782 -88.3% -2,711
Source: Calculations based on data from NHS Digital
28
More detailed figures are reported in Table 29, Appendix C.
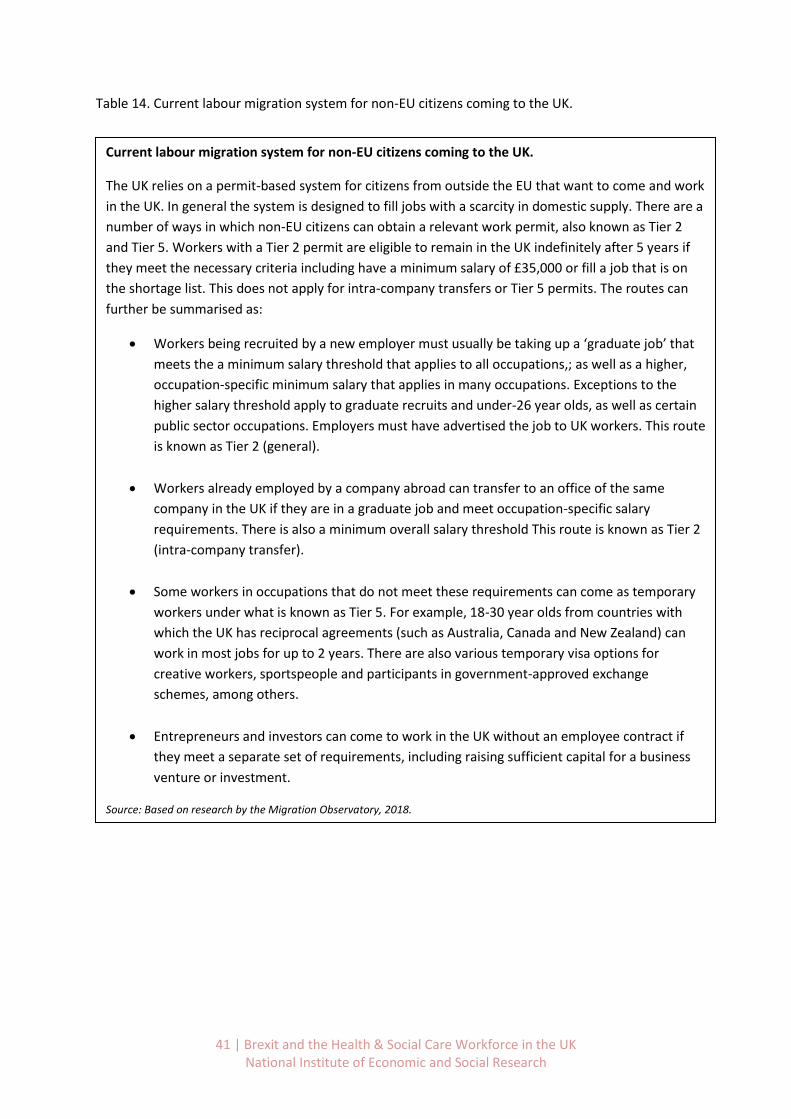
41 | Brexit and the Health & Social Care Workforce in the UK National Institute of Economic and Social Research
Table 14. Current labour migration system for non-EU citizens coming to the UK.
Current labour migration system for non-EU citizens coming to the UK.
The UK relies on a permit-based system for citizens from outside the EU that want to come and work
in the UK. In general the system is designed to fill jobs with a scarcity in domestic supply. There are a
number of ways in which non-EU citizens can obtain a relevant work permit, also known as Tier 2
and Tier 5. Workers with a Tier 2 permit are eligible to remain in the UK indefinitely after 5 years if
they meet the necessary criteria including have a minimum salary of £35,000 or fill a job that is on
the shortage list. This does not apply for intra-company transfers or Tier 5 permits. The routes can
further be summarised as:
Workers being recruited by a new employer must usually be taking up a ‘graduate job’ that
meets the a minimum salary threshold that applies to all occupations,; as well as a higher,
occupation-specific minimum salary that applies in many occupations. Exceptions to the
higher salary threshold apply to graduate recruits and under-26 year olds, as well as certain
public sector occupations. Employers must have advertised the job to UK workers. This route
is known as Tier 2 (general).
Workers already employed by a company abroad can transfer to an office of the same
company in the UK if they are in a graduate job and meet occupation-specific salary
requirements. There is also a minimum overall salary threshold This route is known as Tier 2
(intra-company transfer).
Some workers in occupations that do not meet these requirements can come as temporary
workers under what is known as Tier 5. For example, 18-30 year olds from countries with
which the UK has reciprocal agreements (such as Australia, Canada and New Zealand) can
work in most jobs for up to 2 years. There are also various temporary visa options for
creative workers, sportspeople and participants in government-approved exchange
schemes, among others.
Entrepreneurs and investors can come to work in the UK without an employee contract if
they meet a separate set of requirements, including raising sufficient capital for a business
venture or investment.
Source: Based on research by the Migration Observatory, 2018.
http://www.migrationobservatory.ox.ac.uk/resources/reports/labour-immigration-brexit-trade-offs-questions-policy-
design
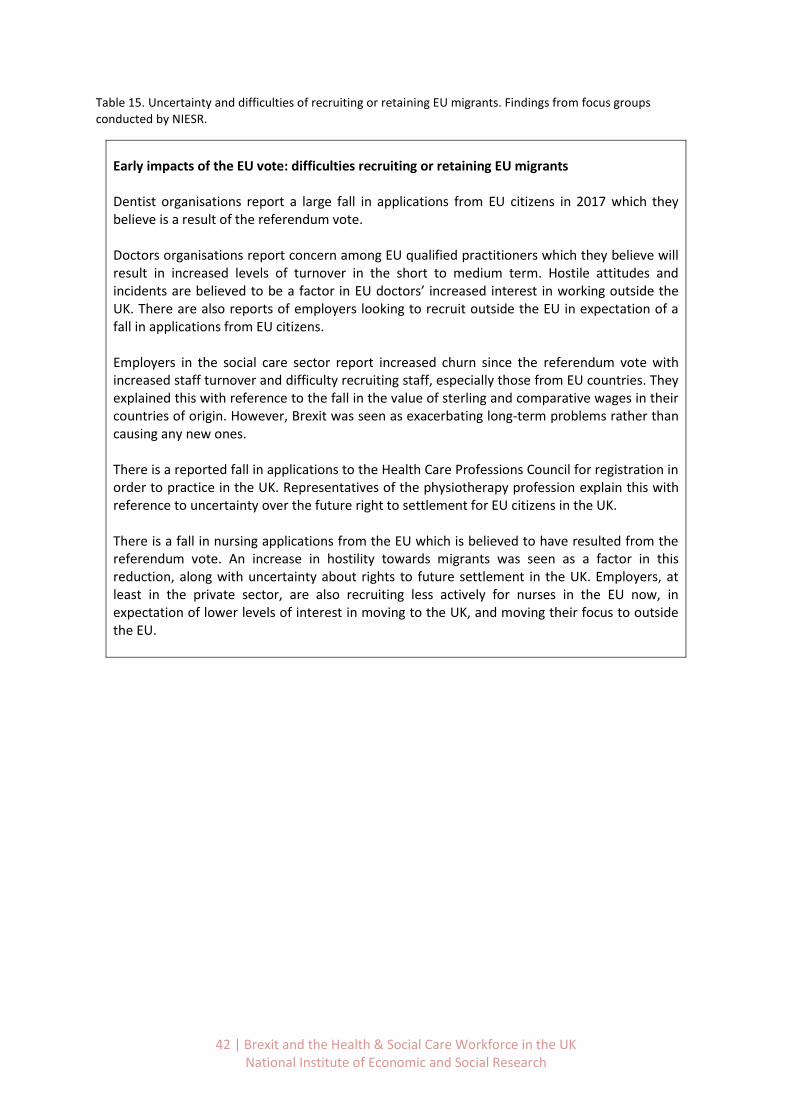
42 | Brexit and the Health & Social Care Workforce in the UK National Institute of Economic and Social Research
Table 15. Uncertainty and difficulties of recruiting or retaining EU migrants. Findings from focus groups conducted by NIESR.
Early impacts of the EU vote: difficulties recruiting or retaining EU migrants Dentist organisations report a large fall in applications from EU citizens in 2017 which they believe is a result of the referendum vote. Doctors organisations report concern among EU qualified practitioners which they believe will result in increased levels of turnover in the short to medium term. Hostile attitudes and incidents are believed to be a factor in EU doctors’ increased interest in working outside the UK. There are also reports of employers looking to recruit outside the EU in expectation of a fall in applications from EU citizens. Employers in the social care sector report increased churn since the referendum vote with increased staff turnover and difficulty recruiting staff, especially those from EU countries. They explained this with reference to the fall in the value of sterling and comparative wages in their countries of origin. However, Brexit was seen as exacerbating long-term problems rather than causing any new ones. There is a reported fall in applications to the Health Care Professions Council for registration in order to practice in the UK. Representatives of the physiotherapy profession explain this with reference to uncertainty over the future right to settlement for EU citizens in the UK. There is a fall in nursing applications from the EU which is believed to have resulted from the referendum vote. An increase in hostility towards migrants was seen as a factor in this reduction, along with uncertainty about rights to future settlement in the UK. Employers, at least in the private sector, are also recruiting less actively for nurses in the EU now, in expectation of lower levels of interest in moving to the UK, and moving their focus to outside the EU.
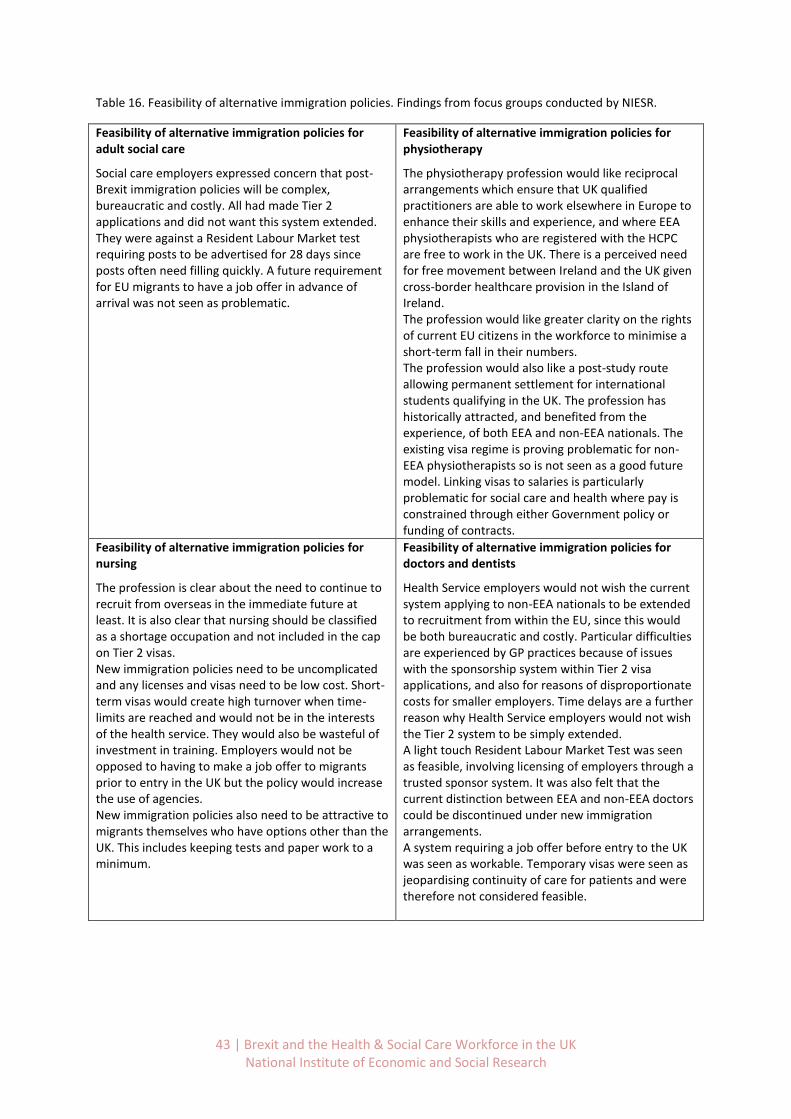
43 | Brexit and the Health & Social Care Workforce in the UK National Institute of Economic and Social Research
Table 16. Feasibility of alternative immigration policies. Findings from focus groups conducted by NIESR.
Feasibility of alternative immigration policies for adult social care
Social care employers expressed concern that post-Brexit immigration policies will be complex, bureaucratic and costly. All had made Tier 2 applications and did not want this system extended. They were against a Resident Labour Market test requiring posts to be advertised for 28 days since posts often need filling quickly. A future requirement for EU migrants to have a job offer in advance of arrival was not seen as problematic.
Feasibility of alternative immigration policies for physiotherapy
The physiotherapy profession would like reciprocal arrangements which ensure that UK qualified practitioners are able to work elsewhere in Europe to enhance their skills and experience, and where EEA physiotherapists who are registered with the HCPC are free to work in the UK. There is a perceived need for free movement between Ireland and the UK given cross-border healthcare provision in the Island of Ireland. The profession would like greater clarity on the rights of current EU citizens in the workforce to minimise a short-term fall in their numbers. The profession would also like a post-study route allowing permanent settlement for international students qualifying in the UK. The profession has historically attracted, and benefited from the experience, of both EEA and non-EEA nationals. The existing visa regime is proving problematic for non-EEA physiotherapists so is not seen as a good future model. Linking visas to salaries is particularly problematic for social care and health where pay is constrained through either Government policy or funding of contracts.
Feasibility of alternative immigration policies for nursing
The profession is clear about the need to continue to recruit from overseas in the immediate future at least. It is also clear that nursing should be classified as a shortage occupation and not included in the cap on Tier 2 visas. New immigration policies need to be uncomplicated and any licenses and visas need to be low cost. Short-term visas would create high turnover when time-limits are reached and would not be in the interests of the health service. They would also be wasteful of investment in training. Employers would not be opposed to having to make a job offer to migrants prior to entry in the UK but the policy would increase the use of agencies. New immigration policies also need to be attractive to migrants themselves who have options other than the UK. This includes keeping tests and paper work to a minimum.
Feasibility of alternative immigration policies for doctors and dentists
Health Service employers would not wish the current system applying to non-EEA nationals to be extended to recruitment from within the EU, since this would be both bureaucratic and costly. Particular difficulties are experienced by GP practices because of issues with the sponsorship system within Tier 2 visa applications, and also for reasons of disproportionate costs for smaller employers. Time delays are a further reason why Health Service employers would not wish the Tier 2 system to be simply extended. A light touch Resident Labour Market Test was seen as feasible, involving licensing of employers through a trusted sponsor system. It was also felt that the current distinction between EEA and non-EEA doctors could be discontinued under new immigration arrangements. A system requiring a job offer before entry to the UK was seen as workable. Temporary visas were seen as jeopardising continuity of care for patients and were therefore not considered feasible.
44 | Brexit and the Health & Social Care Workforce in the UK National Institute of Economic and Social Research
5. Conclusions and implications
5.1 Summary of findings
In the UK in 2017 a little over 5% of nurses, around 9% of doctors, 16% of dentists and 5% of
allied health professionals were from inside the EEA. They are a sizeable component of our H&SC
workforce. The patterns in terms of their total number and composition by occupation and
geography have been changing rapidly since the Brexit Referendum.
Overall, examining the pattern of the NHS in England leavers and joiners over the 12 months
since the Brexit Referendum, we found that the number of EEA joiners has fallen by 17.6% while
the number of leavers has risen by 15.3%. These are large relative changes before the UK has
even formally left the EU.
The share of nurses from the EEA that work in the UK has increased the most across all health
occupations, from 1.8% in 2010 to more than 5% in 2016. This shows an increasing reliance on
nurses from the EEA. Similar trends are not observed for EEA doctors, though the number of
dentists has increased markedly until 2011.
The pattern of leaving the H&SC workforce is very different by occupation and by geographical
region and locality. Specifically, London areas and parts of the South and South West have a
much higher concentration of EEA workers than the rest of the UK. Accordingly, the turnover of
these employees in terms of the fraction who leave jobs each year (or quarter) is higher.
Our qualitative findings confirm this in the sense that EU nationals are more likely to work in
specialties and locations with weak domestic supply. EEA doctors are well-represented in
shortage specialties and there are regional differences in the extent of reliance on EU nationals.
Our qualitative findings confirmed this through recruiters’ reports of weak domestic supply
being met by EU and non-EEA nationals.
Weak domestic supply results from a range of factors, including for example, in medicine and
dentistry high rates of part-time working and turnover. Real wage levels may also make a
contribution. Workforce planning has not adequately taken account of such factors. Workforce
need has also been underestimated in allied professions, for example physiotherapy.
Examining the composition and trends in the Social Care workforce we see that a relatively small
proportion come from the EU (between 2.4% and 4.9%), although this fraction had been growing
up until 2016. Again, there are considerable differences across occupations and geography.
However, our qualitative research indicates that, given recruitment and retention difficulties,
the sector places a high value on their availability particularly in regions with labour shortages.
45 | Brexit and the Health & Social Care Workforce in the UK National Institute of Economic and Social Research
There have been significant changes in the funding of higher education (HE) support for clinical
undergraduates. Specifically, the support of fees for nursing and allied health profession
students was withdrawn in 2016 and impacts have varied across professions. Applications for HE
places to study nursing have fallen by more than 20% since 2016. Applications to read medicine
have also fallen by 10% since 2016. Physiotherapy places, however, expanded as a result of the
change lifting an artificial cap on places. It is uncertain what the knock-on consequences of these
changes will be on numbers graduating and entering training in 5 years’ time. Further changes to
university fees are being proposed by both major political parties which may impact application
numbers. It is also possible that lower fees or the abolition of fees being mooted could solve the
problems of future potential supply of health workers. However, it should be stressed that this
may only solve problems in 10 or more years’ time as it takes a long time (5-15 years) to train as
a fully qualified clinical specialist.
By examining the pattern of leavers and joiners to the NHS in England over the year prior to June
2016 and the year post June 2016 we were able to estimate what might happen to the overall
numbers of doctors and nurses. If we project this existing pattern forward it suggests that in the
short run we may have a shortage of around 2,700 nurses. Projecting this shortfall over the
remaining period of Brexit uncertainty over the 3 years into 2021 we suggest that there may be
a shortfall of around 5,000-10,000 nurses in the NHS in England alone.
Although the patterns of workforce movement since 2016 are quantifiable it is much harder to
measure and document how these patterns might have affected patient outcomes. We have
attempted to do this by exploiting data on the variation in relative share of EEA workers leaving
by NHS trust over the last 3 years and relating this to the waiting times for those patients
awaiting treatment of over 18 weeks. We find that there is a significant negative association
between the share of EEA nationals in total staff turnover and patient waiting times. While the
effect is small, it can be measured and is robust to various econometric robustness checks. One
explanation could be that EEA nationals occupied key clinical roles (potentially in niche
occupations or specific regions), that makes it difficult to replace them in the short-term.
The qualitative research confirmed that problems of sufficient supply of recruits across the H&SC
sector pre-date the referendum and in some cases are of long-standing. However, turnover is
reported to have increased since the decision to leave. This includes a large fall in job
applications in nursing, dentistry and allied health care professions, as well as increased turnover
in social care. Some of the reasons mentioned include the fall in the value of sterling, reports of
hostile attitudes and incidents, and general uncertainty about the outcome of the negotiations.
The fall in EU applications has placed increased pressure the UK’s visa’s system as employers are
switching recruitment strategies to outside the EU.

46 | Brexit and the Health & Social Care Workforce in the UK National Institute of Economic and Social Research
5.2 Consequences & Implications
It will become harder to recruit HSC workers from Europe.
We have already seen in this report that the UK has become less attractive to EU workers after the
Referendum due to the uncertain future of their worker status. This trend will be very likely to
continue. However, it is not completely straightforward to distinguish between:
1. The effect of Brexit uncertainty around future right to work status. The extent to which EEA
citizens have left the UK directly because of the uncertainty surrounding their work status
because of Brexit is not clear. It is even more uncertain how many EEA citizens might return to
the UK at some stage in the future depending on immigration rules as yet to be determined.
2. The effect of declining real wages and pension changes in the public sector since 2008. This has
been clearly documented in Dolton et al. (2018) and it is clear that for H&SC workers their real
earnings have fallen by between 10-15% over the period 2008-2018. Although there is a clear
difference between workers who are on different grades and different levels of seniority. Public
sector pensions have also been reformed and have declined in real terms of a component of
Total Reward (See Danzer and Dolton 2014). This means that the value of their future income in
retirement has fallen since Defined Benefit pension schemes have been replaced by Career
Average schemes.
3. The declining value of the pound. Clearly foreign workers – especially those who seek to send
remittances home to their family in foreign countries – are a lot worse off by coming to the UK
now to work than they were a few years ago. As a result, it will be much harder to recruit
workers from other countries as the wage offer is significantly lower that is was in 2008 – for
example. How much this might change if the pound was to retrieve some of its former value is
unclear.
What is actually likely to happen post Brexit?
• No Free Movement of Labour: One way or another, under nearly any scenario, it is unlikely
that Free Movement of Labour will continue after the transition period since the Government
has strongly indicated that it is not prepared to sign a deal with the EU which includes such
provision.
• It will be harder to recruit from EEA: All the evidence on this report and our analysis of the
turnover and trends on immigration from the EEA over the period from 2015-2018 suggests
that EEA citizens are leaving in relatively large numbers – sufficient that they outweigh the
numbers arriving. This shortfall will not easily be made up from other non-EEA countries,
although the government has currently exempted nurses and doctors from the cap on
immigration with this aim in mind. It is uncertain how the flow of migrants to the UK may pick
up again after the full transition out of the EU by the UK is complete. Depending on the system
in place this can take years. At this point in the negotiations, it appears that they will face new
restrictions on getting into the country in the first place and possibly new regulations about
47 | Brexit and the Health & Social Care Workforce in the UK National Institute of Economic and Social Research
how long they may stay. This will inevitably affect their choices about the UK as a possible
destination.
• Will the shortfall be made up from outside the EEA? It seems clear that there is a presumption
by the UK government that should there be a significant shortfall of H&SC workers then the UK
can simply hire them from the other countries in the world outside the EEA. There is little
evidence about whether this presumption is correct, although the current changes to the
immigration cap for doctors and nurses may provide an indication in the coming months.
How will the Home Office administer migration into the UK after Brexit?
Assuming that the UK eventually leaves the EU - what might be the real consequences for
immigration policy in the UK? At this current time, the answer is not known.
However, various commentators (Charter 2016) have made some well-informed guesses. The reality
is that if the UK is not subject to rules on Free Movement of Labour from the EEA then it will need to
regulate migrants coming into this country much as it does for those arriving from the non-EEA.
However, it would also be possible for the UK to put in place a system which would give priority to
EEA applicants.
Specifically, the UK currently has a range of policies to regulate this flow:
• Arrangements for applicants according to their skills and occupation and the shortage status in
the UK for labour of that type, in particular through Tier 2.
• Eligibility based on the salary of the job which the applicant has been considered for. At
present various bounds and limits on salary apply which act as a crude proxy for the shortage
and skill level of the job.
• Requirements that the applicant for immigration already has a job lined up and offered in the
UK
Other policies which are variously used by other countries could also be used or adopted or adapted
to the UK’s needs:
• Quotas
• Immigration Points Systems
• AdHoc Rules for immigration as Needs Arise. It is always possible that there may be short run
crises in the provision of skills and labour in the event of sudden resignations. It may always be
necessary to change the rules on quotas, tiers, or points in the event of sudden needs
• Recruitment and Retention Allowances on Ad Hoc basis. In some cases it may well be
appropriate to have policies to induce personnel in key occupations to stay in their jobs –
rather than trying to hire new people. Such recruitment and retention bonuses are paid, for
example by the Armed Forces in the UK. The problem they face is exactly analogous – namely
48 | Brexit and the Health & Social Care Workforce in the UK National Institute of Economic and Social Research
to have to replace key personnel at short notice. The solution is frequently to pay retention
bonuses to prevent people leaving. (See e.g. AFPRB report 2017)
Which jobs are eligible in any future immigration system: Workable future immigration policies for
the Health and Social Care sector?
In light of the analysis presented in this report, the question arises of which jobs are eligible in any
future immigration system. This is a very relevant question as many jobs in the health and social care
sector do not fulfil the current requirements for minimum skill or salary levels.
This concern is shared by recent research, arguing that care workers, nursing assistants and
infrastructure support in particular are prone to be placed in the lower skilled category and hence
this could lead to additional pressure on the NHS (Menon et al., 2018).
The health and social care sector has historically recruited more migrants from outside the EU than
from within it, although the analysis we have presented shows that there has been an increase in
flow from the EU for some occupations in recent years. The data coupled with the focus group
contributions show that the sector requires and values both EU and international recruitment.
Following the Migration Advisory Committee (2018), any future immigration system needs to look
beyond skill levels and acknowledge the value and contribution of the health and social care
workforce to the population in the UK.
Research participants were clear that occupations in health and social care should be acknowledged
to have shortages and therefore covered by a future immigration system.
When discussing the value of a preferential system for EU nationals in the focus groups, participants
found it difficult to justify the benefits of a preferential system. As drawn out in the findings section
of this report, the health and social care sector use and value the contributions made by EU and
international staff and any future immigration system would need to enable both.
However, in terms of current policy and process, the restrictive rules on recruiting non-EU nationals
through the Tier 2 visa system were already causing problems for the health service. This is
especially so because the cap on Tier 2 visas was being reached and only occupations with high
salary levels were being approved. For this reason, the rules were altered, temporarily, in June 2018.
More generally, health and social care employers identify a number of problems in extending
immigration policies as they currently apply to non-EEA nationals to EU citizens. They include:
The use of salary and qualifications criteria which excludes medium and lower skilled jobs
found particularly in social care;
The costs of visas and other charges both to employers and employees, including the
immigration health surcharge;
The relatively complex application process;
The requirement to carry out a Resident Labour Market test for occupations not on the
shortage list, which is not feasible where posts need to be filled at short notice, as in social
care

49 | Brexit and the Health & Social Care Workforce in the UK National Institute of Economic and Social Research
New immigration policies therefore need to be uncomplicated for health and social care employers
to operate and visas need to be low cost.
Our qualitative research shows that employers would not object to having to provide proof that they
could not fill a vacancy with a local worker, and to do so by registering as a trusted sponsor of
migrant employees.
Short term visas, of two years or less, would create high turnover when time limits are reached. They
would be wasteful of training and impact on patient care.
The post-study route could be used to meet staffing needs and should be made more open to help
meet current and future shortages.
Health and social care employers would not object to a requirement to offer a job to a non-British
national in advance of their arrival in the UK. However, this would be likely to encourage large
recruitment programmes overseas and use of recruitment agencies. Both of these would be costly
for health and social care employers.

50 | Brexit and the Health & Social Care Workforce in the UK National Institute of Economic and Social Research
5.3 Future supply of the Health and Social Care workforce: What can be done
to address current difficulties?
Current difficulties recruiting sufficient health and social care staff could be addressed
through a range of measures. In the short term, the outward flow of EU nationals might be
reduced through assurances about their long-term right to settle in the UK. This appears to
be now guaranteed as a result of agreement between the UK Government and EU in March.
However, health and social care employers might consider ways in which they could help EU
staff (and other non-UK nationals) to apply for settled status, leave to remain or citizenship.
Procedures which act as barriers to recruitment, for example unnecessarily strict language
tests (language test per se are still important), or which create lengthy periods to obtain
professional registration and complete checks to work, should be reviewed.
It is clear that some measures need to be put in place to monitor the trends in applications
to health and care professional training across all parts of the UK and take appropriate
action to address issues. For example, there has been a decline in the number of
applications to medical schools from both UK and EU applicants, though the decrease is
sharpest for prospective EU students.
Increased efforts could be made to encourage back individuals who have left health and
social care work. This might include encouraging agency workers to move into permanent
roles or by providing more opportunities for flexible working. Opportunities to update skills
through refresher training or formal return to work programmes may also attract returners.
In the social care sector, training could improve the attractiveness of the job offer and small
employers may need to find imaginative ways of providing a range of on-the-job training
experiences.
There may also be scope for local recruitment campaigns both to attract back qualified and
experienced staff. Employers in the social care sector could target groups such as the early
retired and disabled people, who may have the skills and attributes needed.
Workforce planning needs to be reviewed across the healthcare sector. Planning needs to
recognise that public, private and third sectors form a common system and common labour
market. Supply needs to be sufficient to meet the whole system need and not focus solely
on NHS employers. A number of measures currently in place have the potential to increase
future supply. These include investing to expand midwifery and physiotherapy places. At the
same time, the replacement of a bursary system with student loans – as currently done in
England - may deter applicants concerned about debt, so that application trends should be
monitored.
Apprenticeships may be helpful in meeting some future needs. However, employers see the
lack of flexibility in being able to use the funding to support the whole apprenticeship as a
barrier to increasing uptake. It is therefore difficult to see how employers will use these
51 | Brexit and the Health & Social Care Workforce in the UK National Institute of Economic and Social Research
apprenticeships as a major source of future skills. The development of higher level
apprenticeships will take time to increase domestic workforce supply for professionals.
Career routes within social care need to be reviewed, particularly the potential for opening
up routes from nursing support and social care roles into nursing and allied health
professions.
There are currently too many restrictions on the post-study route, yet international students
are a valuable source of current and future skills across the healthcare sector.
Social Care Sector: In this report we have been mindful that H&SC segment of the economy consists
of two sectors – Health and Social Care – which are very different in many ways:
The Health Care sector consists mainly of highly qualified professionals who take 3-10 years
to train and the Social Care sector mainly employs less skilled workers who work at the level
of the Living Wage and can be trained on a shorted time scale.
One of the key differences between Health and Social care is the reliance on highly paid
skilled labour in healthcare, against the greater reliance on relatively low-skilled and low-
paid labour in social care. Recent Low Pay Commission Reports highlight the large difference
in the on the share of minimum wage workers in the social care and/or care home
workforce.
The average wage in Health Care against average wages in Social Care is radically different
and consequently there may be very different elasticity of labour supply responses to
immigration changes in these two sectors.
Health Care is a predominantly public sector activity, while social care is a publicly funded
activity which is carried out by private and third sector entities. This means that the different
sectors are variously and distinctly dependent on changes in public funding and potential
changes in tax policy – e.g. vis-a-vis inheritance tax and social care funding rules.
Social Care relies on local authority funding on a per-case basis, and may have a limited
ability to adjust wages to respond to staff shortages, unless local authority funding were to
increases commensurately which in turn requires an increase in funding from national
Government to cover the known shortfall and provide greater purchasing power in future to
cope with demand. Data provided by the Local Government Association shows that adult
social care now consumes almost 40 per cent of council budgets and faces a shortfall in
funding of £3.5 billion by 2025.
The NHS has been affected by public sector wage freeze over the last 8 years. Similarly, any
real-terms increases in pay to replace and retain non-UK staff would either need to come
out of real-terms increases in NHS funding or cut-backs in services. In Social Care the
intensive margin for economies has been to force workers to pay more of their own work
costs e.g. in terms of the allowed travel time between seeing patients. These factors will all
play into the extent to which further recruitment in the future may or may not be more
difficult.
52 | Brexit and the Health & Social Care Workforce in the UK National Institute of Economic and Social Research
Common issues and differences across health and social care sectors: It is clear that there are a
number of issues that are common across both sectors, while there are also others that are
somewhat different. In this section we aim to spell these out in more detail to inform targeted
policy-making.
Common issues across sectors/stakeholders:
Pressure on existing and future staff due to ageing population affecting demand and supply
of health and social care services;
The concentration of EU workers varies across job roles and geographies;
Increasing reliance on EU workers in recent years, though to varying degrees across job
roles, countries and regions;
Lack of coherent, reliable data sources across countries and sectors that include breakdown
by job roles and nationality;
Potential issue of low wages in some occupations for design of criteria in future immigration
system;
Differences across sectors/stakeholders:
Higher share of EU workers in the NHS, particularly the South-East;
Government focus often placed on NHS and healthcare;
Views on specific policies such as resident labour market tests, prior job offers; temporary
visas;
Average skill and wage level of workers;
Treatment of EEA vs non-EEA workers in future immigration system.

53 | Brexit and the Health & Social Care Workforce in the UK National Institute of Economic and Social Research
5.4 Some implications of the Present Research and Future Research of
Importance to the Cavendish Coalition when the Outcome of the Brexit
Negotiations are Known
After consultation with the Cavendish Coalition and considerations of data collected from the focus
groups we explored the consequences of different Brexit scenarios for the H&SC workforce. In
conjunction with our detailed analysis of all the statistical evidence and basic econometric analysis
we suggest that there are many implications of Brexit for the H&SC sector workforce generally.
Many of these implications merit much more research – especially in the medium to long run when
more details are known about the exact form that the migration policies post Brexit will take. We
summarise a number of areas that are likely to become more relevant:
1. Exploring other Sources of Data relating to H&SC Workers. We have scoped out the likely
short-term losses of EU employees to the UK by occupation based on the trends over the
year before and year after the Brexit Referendum. So far this has been based on the
aggregate and trust-level data from NHS Digital. Further prescriptive analysis could be
undertaken based on modelling data from the QLFS, LFS, ASHE, APS and potentially Burning
Glass.
2. Detailed Analysis of open Vacancies by Occupation, Trust and CCG over time. To appreciate
the nature of how difficult it is to hire into specific jobs and locations it is necessary to
understand exactly how many vacancies are arising and how long it is taking to fill specific
jobs or whether they remain unfilled. If vacancies remain unfilled exactly what contingency
arrangements are made to cover shifts by extending existing workers contracts – particularly
part time staff -, hiring agency or temporary staff, or meeting existing demand from reduced
complement of staff. If the latter is the case how is this affecting patient care? It is clear
from our analysis of staff turnover that these issues will be markedly different by region and
locality.
3. The Aggregate Effects of Falling Net-migration. The immediate consequences on the UK
leaving the EU have already been documented. There has been a large and dramatic fall in
net migration into the UK. What is less clear is what the impact of this has been and will be
into the future on employment and earnings of the indigenous population. There is a vast
literature on the effects of migration on employment and wages. It is fair to say that there is
still some considerable controversy over the conclusions though (Whyman and Petrescu,
2017; Dustman et al., 2017; Borjas, 2014). The usual context for all of the applied
econometric work in the USA and UK in recent years has been on the consequences of rising
net migration on employment and wages. What has not been studied is the effect of falling
net migration. It is not necessarily obvious that the impact will be symmetrically opposite to
rising net migration. These consequences need to be studied and specifically what might be
the impact of losing between 10,000 and 100,000 foreign born workers from the H&SC
workforce. We do not know, but it is surely our responsibility to pose and attempt to answer
this question if it is a possibility.
54 | Brexit and the Health & Social Care Workforce in the UK National Institute of Economic and Social Research
4. The Fiscal and Funding Consequences of Brexit. One of the most important consequences
of Brexit will be the fiscal consequences of either the new trade deal or a no-deal scenario.
Various projections of these consequences predict a fall in trade and lower GDP growth. This
will, in turn have clear knock-on consequences (see Whyman and Petrescu, 2017) for public
sector spending and the NHS and Social Care specifically. Interestingly, Portes (2018) has
distilled his predictions of the adverse consequences of Brexit into the size of the potential
‘direct hit’ for the NHS as a way of calibrating the impact. Although the impact of future
public-sector finances would not all fall on the NHS it is a useful way to calibrate the impact
and clarify the mind. His analysis is a stark reminder that the actual position relating to
Brexit is that it may mean less can be spent on the NHS under the various Brexit scenarios.29
If we add to this picture the increasing demand for health care as predicted by Centre for
Workforce Intelligence, CfWI (2015), and the NHS Draft Health and Care Workforce Strategy
(2018) along with predictions of the black hole for NHS funding of up to £30bn (see Dolton,
2017) then we will need to be appraised on how these challenges will be faced in the NHS.
5. The Long-Run Future of Demand for H&SC Workers. The nature of the future demand for
H&SC workforce numbers is crucial in the next 20 years. The rising tide of demand for health
care given an aging population is well documented. What is less clear are the detailed
implications for the demand for nurses, doctors and social workers into the future. The
Centre for Workforce Intelligence (CfWI 2015) was, until recently, responsible for examining
and documenting the NHS in England workforce needs into the future. This responsibility has
now been passed back into the Department of Health and Social Care and Health Education
England.. It is unclear exactly what workforce planning is taking place and how this has been
able to take on board the impact of Brexit (NHS Draft Health and Social Care Workforce
Strategy, 2018). Whatever research work is being done on future H&SC workforce needs are
should be rigorously examined by the Cavendish Coalition and taken into account in future
long term planning.
6. Consequences of Skill Shortages. One of the most important aspects of the increased
turnover of EU H&SC workers is the extent to which it may have knock on consequences for
remaining existing UK workers in terms of: Overtime, shift-working, the employment of
temporary and agency staff and the duration of unfilled vacancies. These consequences may
have importance for stress and the burn-out of existing staff and longer run impacts on
patients. Further study of these consequences is necessary if the Cavendish Coalition is to
understand the needs of its members.
7. How Long Until the EU Worker Numbers Return to Normal. Any prediction of how long the
loss of EU employees will go on for is problematic. At present, since we don’t know the
arrangements which will be in place it is hard to predict how, in the medium and long-term
EU workers will react to the possibility of working in health and social care in the UK in
29
Portes (2018): EEA model: £260m per week (equivalent to about 9% of what the UK currently spends on the NHS); FTA model: £875m per week (equivalent to about 31% of what is currently spent on the NHS); WTO model: £1.25bn per week (equivalent to about 44% of what is currently spent on the NHS); Government preferred bespoke model: £615 million per week (equivalent to about 22% of what it currently spends on the NHS).

55 | Brexit and the Health & Social Care Workforce in the UK National Institute of Economic and Social Research
future. This should be studied as it has a direct impact on how many H&SC workers the UK
will need to attract and train in the future.
8. The likely differential impact of these changes by region of the UK. The report has offered a
regional and detailed geographic breakdown of where the UK is losing EU workers and
turnover is the greatest. There is great variation within the NHS in different locations.
Further research work will be necessary to map these changes over the next 2-5 years to see
exactly what the consequences of Brexit are on the spatial demand for H&SC workers.
9. The Implications of EU Worker Turnover for Patient Outcomes. This report has made a
tentative start in trying to consider the implications of NHS staff turnover from the EU on
patient outcomes. The Appendix to the report looks at a simple econometric model of the
variation in patient waiting times and the impact that EU staff turnover has on this key
patient outcome. We find – controlling for the size of the Trust and the total staff turnover
that the higher the share of EU leavers the longer are waiting times for patients. A further
assessment of the wider likely possible health outcome consequences of having a shortage
of skills in terms of patient health outcomes is necessary. Specifically, we would suggest that
an analysis in the long run be undertaken which studied the possible effect of EU workers
leaving on: A&E admissions, Hospital admissions, Length of hospital stay and mortality. It is
possible that the impact of higher EU staff turnover in the NHS could be felt on all of these
indicators in the longer run.
10. A review of the options of recruiting more UK workers into H&SC occupations. This report
has examined and described the impact of the recent changes in Higher Education in Section
3. There has been a reduction of around 20% in nursing applications to universities. The
rising acceptance rates for applicants kept the number of acceptances to those degree
courses relatively stable. The central issue here is whether or not bursaries should be
replaced and what form they should take. A specific concern is the extent to which the
removal of bursaries has caused a disproportionate fall in applications from mature student
applicants (RCN, 2018) and what impact this may have on future recruits who bring a
different level of life experiences to the job and the potential pool of trained recruits. The
long run consequences of higher student debt on graduation from health professional
courses also need examination. It is possible that the escalation of debt by graduates from
these courses will cause a further reduction in future applications. The extent to which the
various interventions to increase recruitment have had a positive impact on recruiting into
training and employment across health and social care is unknown. It is critical that there is a
co-ordinated and evidence based approach to reviewing current activity and determining
next steps.
11. The Potential for Inducing the Return of Former H&SC Workers. Another area where
evidence is scant is the extent to which former H&SC workers might be encouraged back
into the profession. Specifically, for example, a question which is commonly asked is - by
how much would earnings in nursing jobs need to be raised to induce former employees
back into nursing. Analytically this is not a very straightforward question to answer. This is

56 | Brexit and the Health & Social Care Workforce in the UK National Institute of Economic and Social Research
because former employees who have left their job and the profession may have done so for
pay, lifestyle or other reasons (Hudson-Sharp et al, 2017). In principle, with cohort and panel
data over a number of years one may address this question. It has been done for the case of
teachers (see Dolton, 1990; Dolton & Van der Klaauw, 1995a, 1995b) and so, in principle,
with the appropriate data could be investigated for nurses and the range of other
professionals working in health and social care.
12. A review of the possibilities of recruiting more international, non-EU workers in the key
occupations. This requires an assessment of the past pattern of recruitment from different
countries in the rest of the world – outside the EEA – and their likely future prospects as a
source of future supply of qualified workers. This will require a substantial effort to collect
data from each country that has sent workers to the UK in the past and the likely prospects
for future recruitment. It is unclear if the whether the detailed data exists to perform this
analysis or use the data gathered to predict supply into the future. There are also many
other considerations relating to the sourcing of qualified workers from overseas as this could
easily impose a considerable burden on those countries and the ethical issues of poaching
labour from abroad requires careful analysis. At the same time many countries are content
to see their workers emigrate to the UK as remittances sent home to the family can be a
much-needed substantial source of revenue for the country’s balance of trade.
57 | Brexit and the Health & Social Care Workforce in the UK National Institute of Economic and Social Research
References
Armed Forces’ Pay Review Body (2017). Forty-Sixth Report 2017. Presented to Parliament by the
Prime Minister and the Secretary of State for Defence by Command of Her Majesty, March 2017.
https://assets.publishing.service.gov.uk/government/uploads/system/uploads/attachment_data/file
/603494/58422_Armed_Forces_Pay_Web_Accessible.pdf (accessed on 26th April 2018)
Borjas, George J. (2014). Immigration Economics. Harvard University Press
Charlesworth, A. & Johnson, P. (2018). Securing the future: funding health and social care to the
2030s. Institute for Fiscal Studies and The Health Foundation.
Charter, D. (2016) Europe: In or Out, Biteback Publishing, London.
Centre for Workforce Intelligence, CfWI (2015) Future demand for skills: Initial results. August 2015
https://assets.publishing.service.gov.uk/government/uploads/system/uploads/attachment_data/file
/507498/CfWI_Horizon_2035_Future_demand_for_skills.pdf (accessed on 27th April 2018)
Cullis, John G and Jones, Philip R, (1986), Rationing by Waiting Lists: An Implication, American
Economic Review, 76, issue 1, p. 250-56.
Chevalier, A., Dolton, P. and McIntosh, S. (2007) ‘Recruiting and Retaining Teachers in the UK: An
Analysis of Graduate Occupation Choice from the 1960s to the 1990s. Economica., vol.74, pp.69-96.
2007
Danzer, A. and Dolton, P. (2012) Total Reward and Pensions in the UK in the Public and Private
Sectors. (with Alexander M.), in Labour Economics vol.19, pp. 584-594.
Danzer, A. and Dolton, P. Dolton, P., and C. Rosazza-Bondibene (2016) Who Wins?: Evaluating the
Impact of UK Public Sector Pension Scheme Reforms, National Institute Economic Review. vol 237,
R38-R46.
Dawson, D., Gravelle, H. , Jacobs, R. , Martin, S. and Smith, P. C. (2007), The effects of expanding
patient choice of provider on waiting times: evidence from a policy experiment. Health Econ., 16:
113-128. doi:10.1002/hec.1146
Department of Health and Social Care (2017). Evidence on EEA nationals working within the health
and care system, focusing on England. The Department of Health and Social Care’s written response
to the call for evidence issued by the Migration Advisory Committee (MAC) on 4 August 2017.
https://www.gov.uk/government/uploads/system/uploads/attachment_data/file/693468/Departme
nt_of_Health.pdf (accessed on 26th March 2018)
Dimakou, S., Parkin, D., Devlin, N. & Appleby, J. 2009. Identifying the impact of government targets
on waiting times in the NHS. Health Care Management Science, 12, 1-10.
Dolton, P., Hantzsche, A. and Kara, A. (2018). Follow the leader? The interaction between public and
private sector wage growth in the UK, Presentation at Royal Economic Society Annual Conference,
March 2018.

58 | Brexit and the Health & Social Care Workforce in the UK National Institute of Economic and Social Research
Dolton, P. and Van der Klaauw, W. (1995a) ‘The Turnover of UK Teachers: A Competing Risks
Explanation’ New York University Discussion Paper, Review of Economics and Statistics. Vol.81(3),
August 1999, pp.543-552.
Dolton, P. and Van der Klaauw, W. (1995b) ‘Leaving Teaching in the UK: A Duration Analysis’,
Economic Journal, Vol.105, pp. 431-44.
Dolton, P. (1990) ‘The Economics of Teacher Supply’ Economic Journal, Vol.100, pp. 91-104.
Dunt, I. (2016) Brexit: What the Hell Happens Next?, Canbury Press, St Ives.
Dustmann, Christian, Uta Schönberg, and Jan Stuhler. (2017). Labor Supply Shocks, Native Wages,
and the Adjustment of Local Employment, The Quarterly Journal of Economics, Volume 132, Issue 1,
1 February 2017, Pages 435–483
Fahy, N., Harvey, T. Jarman, H., Stuckler, D. Galsworthy, M., and McKee, M. (2017) How will Brexit
affect health and health services in the UK? Evaluating three possible scenarios, The Lancet, 390,
2110-2118.
Gaynor, Martin and William B. Vogt. "Competition among Hospitals." The RAND Journal of
Economics 34, 4 (Winter 2003): 764-785
General Dental Council (2017). Information released under the Freedom of Information Act: Request
for dataset on the number of UK-based dentists classified by the country in which they qualified,
September 2017. https://www.gdc-uk.org/about/freedom-of-information/foi-release (accessed 24th
April 2018)
General Dental Council (2018). Registration Report – April 2018. https://www.gdc-
uk.org/about/who-we-regulate (accessed on 24th April 2018)
General Medical Council (2017). GMC Survey of EEA Doctors. Published on 28. February 2017.
https://www.gmc-
uk.org/Briefing___GMC_survey_of_EEA_doctors__February_2017_.pdf_69558586.pdf (accessed on
26th March 2018)
General Medical Council (2017). The state of medical education and practice in the UK. December
2017.
https://www.gmc-uk.org/static/documents/content/SoMEP-2017-final-full.pdf (accessed on 26th
March 2018)
General Medical Council (2017). Our data about doctors with a European primary medical
qualification in 2017. Working paper 3. November 2017.
https://www.gmc-
uk.org/GMC_data_about_doctors_with_EEA_PMQ__November_2017__FINAL.PDF_72545961.PDF
(accessed on 26th March 2018)
General Medical Council (2017). The relationship between primary medical education and
nationality, 2016 and 2017. Working paper 4th December 2017.
59 | Brexit and the Health & Social Care Workforce in the UK National Institute of Economic and Social Research
https://www.gmc-uk.org/-/media/documents/final-nationality-update_pdf-74268027.pdf (accessed
on 26th March 2018)
General Medical Council (2018). GMC response to call for evidence on the economic and social
impacts of UK’s exit from the European Union. 27th March 2018.
https://www.gov.uk/government/uploads/system/uploads/attachment_data/file/693470/General_
Medical_Council.pdf (accessed on 27th March 2018)
Godden, S, McCoy, D & Pollock, AM 2009, 'Policy on the rebound: trends and causes of delayed
discharges in the NHS' Journal of the Royal Society of Medicine, vol 102, no. 1, pp. 22-28
Gravelle, H., Smith, P., & Xavier, A. (2003). Performance signals in the public sector: the case of
health care. Oxford Economic Papers, 55(1), 81-103.
Hantzsche, A., and Young, G. (2018). Commentary: Light at the End of the Fiscal Tunnel? National
Institute Economic Review 244.1: F4-F10.
Harrison, A. and Appleby, J. (2009). Reducing waiting times for hospital treatment: lessons from the
English NHS. J Health Serv Res Policy. 14(3):168-73
Health and Care Professions Council (2016). Number of Physiotherapists by region - October 2016.
http://www.hcpc-uk.co.uk/publications/foi/index.asp?id=1278 (accessed 24th April 2018)
Health and Care Professions Council (2017). Professions Gender Breakdown - EEA. Published 1.
August 2017. http://www.hcpc-uk.co.uk/publications/reports/index.asp?id=1225 (accessed on 24th
April 2018)
Health Education England (2017). Facing the Facts, Shaping the Future: A draft health and care
workforce strategy for England to 2027. December 2017.
https://hee.nhs.uk/our-work/workforce-strategy (accessed on 27th March 2018)
Hudson-Sharp, N., Runge, J. and Rolfe, H. (2017) Use of Agency Workers in the Public Sector, London:
Office of Manpower Economics
Institute for Employment Studies (2016). The labour market for nurses in the UK and its relationship
to the demand for, and supply of, international nurses in the NHS. Final Report. July 2016.
https://www.gov.uk/government/uploads/system/uploads/attachment_data/file/535657/The_labo
ur_market_for_nurses_in_the_UK.pdf (accessed 26th April 2018)
Kara, A. et al. (2018). Prospects for the UK Economy. National Institute Economic Review No 243:
F10. February 2018.
Kreindler, Sara. (2010). Policy strategies to reduce waits for elective care: A synthesis of international
evidence. British Medical Bulletin. 95. 7-32.
Laudicella, Mauro & Siciliani, Luigi & Cookson, Richard. (2012). Waiting Times and Socioeconomic
Status: Evidence from England. Social science & medicine (1982). 74. 1331-41.
Martin, S. & Smith, P. C. 1999. Rationing by Waiting Lists: An Empirical Investigation. Journal of
Public Economics, 71, 141-64.

60 | Brexit and the Health & Social Care Workforce in the UK National Institute of Economic and Social Research
Migration Advisory Committee (2018). EEA-workers in the UK labour market: Interim Update. March
2018.
https://www.gov.uk/government/publications/eea-workers-in-the-uk-labour-market-interim-update
(accessed on 27th March 2018)
Migration Advisory Committee (2018). EEA-workers in the UK labour market: Annexes. March 2018.
https://www.gov.uk/government/uploads/system/uploads/attachment_data/file/694498/eea-
workers-uk-labour-market-interim-update-annexes.pdf (accessed on 27th March 2018)
Migration Observatory (2016). Young People and Migration in the UK: An Overview. Report
published on 19 December 2016.
http://www.migrationobservatory.ox.ac.uk/resources/reports/young-people-migration-uk-
overview/ (accessed on 26th March 2018)
NHS Employers (2018). Brexit - One year on. Case study published on 7. February 2018.
http://www.nhsemployers.org/case-studies-and-resources/2018/02/brexit-one-year-on (accessed
on 26th March 2018)
NHS (2018). Facing the Facts, Shaping the Future: A draft health and care workforce strategy for
England to 2027.
https://hee.nhs.uk/our-work/workforce-strategy (accessed on 26th April 2018)
Ntampoudi, I. (2017) ‘Post Brexit Models and Migration Policies: Possible Citizenship and Welfare
Implications for EU Nationals in the UK.’ Chapter 12 in Cabral , N. Goncalves and Rodrigues, N ‘After
Brexit: Consequences for the European Union’, Palgrave Macmillan.
Nuffield Trust (2017). How will our future relationship with the EU shape the NHS? Briefing.
November 2017.
https://www.nuffieldtrust.org.uk/files/2017-11/1509990492_nt-future-relationship-with-eu-after-
brexit-web.pdf (accessed on 26th March 2018)
Nursing and Midwifery Council (2017). The NMC Register. 30. September 2017
https://www.nmc.org.uk/globalassets/sitedocuments/other-publications/the-nmc-register-30-
september-2017.pdf (accessed on 26th March 2018)
Office for Budget Responsibility (2015). Fiscal Sustainability Report. Presented to Parliament
pursuant to Section 8 of the Budget Responsibility and National Audit Act 2011 on June 2015.
http://obr.uk/fsr/fiscal-sustainability-report-june-2015/ (accessed on 26th March 2018)
Office of Health Economics (2013). OHE Guide to UK Health and Health Care Statistics. 2nd edition.
OHE Research
https://www.ohe.org/publications/ohe-guide-uk-health-and-health-care-statistics (accessed on 26th
March 2018)
Office for National Statistics (2017). Tables looking at both 2 digit and 3 digit social care employment
by nationality. User requested data. Reference number: 006895. 4. April 2017.
https://www.ons.gov.uk/employmentandlabourmarket/peopleinwork/labourproductivity/adhocs/0
61 | Brexit and the Health & Social Care Workforce in the UK National Institute of Economic and Social Research
06895tableslookingatboth2digitand3digitsocialcareemploymentbynationalityusingannualpopulation
surveyapsforjd11tojd16 (accessed on 27th March 2018)
Portes, J. (2016) ‘Immigration, Free Movement and the EU Referendum, National Institute Economic
Review, 236 (May): 14-21.
Portes, J. (2016b) ‘Immigration after Brexit’, National Institute Economic Review, 238 (May): 13-21.
Portes, J (2018) ‘Too high a price? The cost of Brexit – what the public thinks’, Gobal Future.
http://ourglobalfuture.com/reports/too-high-a-price-the-cost-of-brexit-what-the-public-thinks/
(accessed on 27th April 2018)
Portes, J. and Forte, G. (2017) ‘The economic impact of Brexit-induced reduction in migration’,
Oxford Review of Economic Policy, 33(S1), S31-S44.
Propper C, Sutton M, Whitnall C, Windmeijer Fet al., 2010, Incentives and targets in hospital care:
Evidence from a natural experiment, Journal of Public Economics, Vol: 94, Pages: 318-335
Royal College of Nursing (2018). Left to chance: the health and care nursing workforce supply in
England. Policy Report. 2nd February 2018
https://www.rcn.org.uk/professional-development/publications/pdf-006682 (accessed on 26th
March 2018)
Schaafsma, J. (2006). Are there better ways to determine wait times? Canadian Medical Association
Journal, 174(11): 1551–1552.
Siciliani, Luigi, Moran, Valerie and Borowitz, Michael (2014). Measuring and comparing health care
waiting times in OECD countries. Health Policy. Volume 118, Issue 3, December 2014, Pages 292-303
Skills for Care (2017). The size and structure of the adult social care sector and workforce in England,
2017.
https://www.nmds-sc-online.org.uk/Get.aspx?id=1038871 (accessed on the 24th April)
The Health Foundation (2017). Rising pressure: the NHS workforce challenge. Research Paper,
October 2017.
The Kings Fund (2017). Brexit: the implications for health and social care. 13. December 2017.
https://www.kingsfund.org.uk/publications/articles/brexit-implications-health-social-care (accessed
on 26th March 2018)
The Migration Observatory (2018). Labour Immigration after Brexit: Trade-offs and Questions about
Policy Design. Report 27. January 2017. http://www.migrationobservatory.ox.ac.uk/wp-
content/uploads/2017/01/Report-Labour_Immigration_Policy_Brexit.pdf (accessed on 27th March
2018)
The Migration Observatory (2018). The Burden of Proof: How Will the Application Process Work for
EU Citizens After Brexit? Report 13. December 2017.
http://www.migrationobservatory.ox.ac.uk/wp-content/uploads/2017/12/Report-
Burden_of_Proof_EU_Citizens.pdf (accessed on 27th March 2018)

62 | Brexit and the Health & Social Care Workforce in the UK National Institute of Economic and Social Research
Menon et al. (2018). Brexit and the NHS. Research Paper: Public Policy. The UK in a Changing Europe,
14th March 2018.
http://ukandeu.ac.uk/research-papers/brexit-and-the-nhs/ (accessed on 26th March 2018)
Whyman, Philip, Petrescu, Alina I. (2017). The Economics of Brexit: A Cost-Benefit Analysis of the UK’s
Economic Relationship with the EU. Palgrave Macmillan.

63 | Brexit and the Health & Social Care Workforce in the UK National Institute of Economic and Social Research
Abbreviations
APS Annual Population Survey
CCG Clinical Commissioning Group
EEA European Economic Area
EU European Union
FTE Full Time Equivalent
GMC General Medical Council
HC Headcount
HCHS Hospital and Community Health Service
H&SC Health and Social Care
HE Higher Education
HEE Health Education England
IELTS International English Language Testing System
NHS National Health Service
NMC Nursing and Midwifery Council
ONS Office for National Statistics
PCT Primary Care Trust
PMQ Primary Medical Qualification
RCN Royal College of Nurses
RoW Rest of the World (i.e. non-UK, non-EEA)
RTT Referral to Treatment
UCAS Universities and Colleges Admissions Service
UK United Kingdom
Y/Y Year-on-year

64 | Brexit and the Health & Social Care Workforce in the UK National Institute of Economic and Social Research
List of tables Table 1. Size of national health care workforce by UK countries, September 2017. Table 2. The place of EU migrants in the health and social care workforce: Case studies based on focus groups. Table 3. Number and share of licensed doctors in the UK by PMQ region in 2012 and 2017. Table 4. Number and share of licenced doctors in UK countries by nationality. Table 5. Number and share of registered nurses in the UK by region of initial registration (annual data until 13
th
March). Table 6. Joiners and leavers to the NMC register, by nationality, 2010-2016. Table 7. Proportion of nurses on the NMC register that join/leave each year, by nationality, 2011-2017. Table 8. Overview of social care workforce in social work, residential care and pre-primary education (SIC 85.1, 87 and 88) by UK country, 2011-2016. Table 9. Scope for increasing recruitment from the domestic workforce. Case studies based on focus group meetings. Table 10. Applications, acceptances and acceptance rate to Nursing (B7) in the UK, by gender, 2010-2017. Table 11. Applications, acceptances and acceptance rate to Pre-clinical medicine (A1). 2007-2017 Table 12. Brexit Scenarios based on Fahy et al. (2017) and Portes (2018). Table 13. Net changes in the workforce in the NHS England, 12 months pre- and post-referendum Table 14. Current labour migration system for non-EU citizens coming to the UK. Table 15. Uncertainty and difficulties of recruiting or retaining EU migrants. Findings from focus groups conducted by NIESR. Table 16. Feasibility of alternative immigration policies. Findings from focus groups conducted by NIESR. Table 17. NHS in England staff (headcount) by nationality and broad job categories
30
Table 18. NHS in England staff by nationality and job role (headcount) Table 19. NHS Staff by Nationality and HEE Region (headcounts), March 2017 Table 20. Year-on-year growth of NHS Joiners and Leavers by Nationality, Q2 2017 vs Q2 2016. Table 21. Annual growth of NHS Joiners and Leavers by Nationality and Job Role, Q2 2017-Q2 2016 Table 22. Annual growth of NHS Joiners and Leavers by Nationality and HEE Region, Q2 2017 vs Q2 2016 Table 23. Adult social care staff in England by nationality, 2016/17 – totals and by broad occupation and workplace type Table 24. Adult social care staff in England by nationality, 2016/17 – by selected detailed occupations Table 25. Adult social care staff in England by nationality, 2016/17 – by English region Table 26. Adult social care staff by nationality, 2016/17 – Regulated professions, by region Table 27. Adult social care staff by nationality, 2016/17 – Direct care, by region Table 28. Adult social care staff by nationality, 2016/17 – Managerial, by English region Table 29. Joiners and leavers in the NHS in England workforce, Q3-2015 to Q2-2017. Table 30. Description of different patient pathways in the NHS Table 31a. Percentage of patient pathways waiting to start treatment, average by year, Wales. Source: NHS Wales Informatics Services (NWIS) Table 31b. Percentage of patient pathways closed, average by year, Wales. Source: NHS Wales Informatics Services (NWIS) Table 32. Inpatient waiting times, Northern Ireland. Source: NI Department of Health Table 33. List and coverage of datasets used in statistical analysis Table 34. List of variables used in regression analysis Table 35. Regression results (preferred models). Q3-2015 – Q2-2017 Table 36. Regression results (doctors only, impact on trauma & orthopaedics). Q3-2015 – Q2-2017 Table 37. Regression results (nurses & health visitors only, impact on all treatments). Q3-2015 – Q2-2017 Table 38. Correlation matrix for variables used in regression analysis Table 39. List of treatments available in waiting times data Table 40. Detailed staff occupation categories in joiners-leavers data and workforce data Table 41. Regression results (preferred models, showing time dummies). Q3-2015 – Q2-2017 Table 42. Regression results (additional lags). Q3-2015 – Q2-2017 Table 43. Regression results (support staff only, impact on all treatments). Q3-2015 – Q2-2017
30
Headcount totals are unlikely to equal the sum of components due to some staff working in more than one role.
65 | Brexit and the Health & Social Care Workforce in the UK National Institute of Economic and Social Research
List of figures Figure 1. UK population by size and age composition, past and future trends, 1976-2046. Figure 2. Share of licensed doctors in the UK by country, 2017. Figure 3. Number of licensed doctors in the UK, by region of the world where doctors gained their primary medical qualification (PMQ), 2012-17. Figure 4. Number of dentists by region of qualification, 2005-16 Figure 5. Share of dentists by region of qualification, 2005-16 Figure 6. Share of total nurses on NMC register by UK country, 2017 Figure 7. Number of nurses from EEA joining and leaving the NMC register, 2010-17. Figure 8. Number of nurses from UK joining and leaving the NMC register, 2010-17. Figure 9. Share of EU nationals (excl. UK) in UK’s social care workforce, 2011-2016. Figure 10. Share of non-EU nationals in UK’s social care workforce, 2011-2016. Figure 11. Total number of EU nationals (excl. UK) in UK’s social care workforce, 2011-2016. Figure 12. Total number of non-EU nationals in UK’s social care workforce, 2011-2016. Figure 13. Total applications, acceptances and acceptance rate to Nursing (B7) in the UK, 2010-2017. Figure 14. Number of applicants to Nursing degrees in the UK by country of origin. 2007-2017. Figure 15. GMC graph on number of medical students and doctors at different stages of their education in 2016. Figure 16. Number of applications to Pre-clinical medicine (A1) by country of origin. 2007-2017 Figure 17. Timeline of Brexit and protection of rights of EU citizens Figure 18. NHS in England staff by nationality, March 2017. Figure 19. Age composition of NHS in England staff, UK vs. EU, Sep. 2017 Figure 20. Age composition of NHS in England doctors, UK vs. EU. Sep. 2017 Figure 21. Age composition of NHS in England nurses, UK vs. EU. Sep.2017 Figure 22. Nationality of NHS in England staff in broad categories (share of total), March 2017. Figure 23. NHS in England staff (share of total) by nationality and detailed job categories Figure 24. NHS Staff by Nationality and HEE Region, March 2017. Figure 25. NHS Staff by Nationality (FTE), September 2009 to September 2016. Figure 26. NHS Staff by Nationality (share of total), September 2009 to September 2016. Figure 27. Changes in the workforce (FTE) of NHS staff by nationality and job role (total changes), September 2009 vs September 2016. Figure 28. Changes in the share in total workforce (FTE) of NHS staff by nationality and job role, September 2009 vs September 2016. Figure 29. NHS Staff by nationality and HEE region, relative change Sep. 2009 – Sep. 2016 Figure 30. NHS Staff by nationality and HEE region, absolute change Sep. 2009 – Sep. 2016 Figure 31. NHS Joiners by nationality (headcounts), Q2 2017 vs Q2 2016. Figure 32. NHS Leavers by nationality (headcounts), Q2 2017 vs Q2 2016. Figure 33. NHS Joiners by Nationality and Job Role (headcounts), Q2 2017-Q2 2016 Figure 34. NHS Leavers by Nationality and Job Role (headcounts), Q2 2017-Q2 2016 Figure 35. NHS Joiners by Nationality and HEE Region (headcounts), Q2 2017 vs Q2 2016 Figure 36. NHS Leavers by Nationality and HEE Region (headcounts), Q2 2017 vs Q2 2016 Figure 37. Adult social care workforce by nationality, shares, 2012/13 to 2016/17. Figure 38. Adult social care workforce by nationality, levels, 2012/13 to 2016/17. Figure 39. Trends in adult social care workforce in England by nationality and occupation - shares Figure 40. Trends in adult social care workforce by nationality and region - shares Figure 41. HCHS doctors in NHS England by nationality and HEE region (share and total), March 2017. Figure 42. Midwives in the NHS in England by nationality and HEE region (share and total), March 2017. Figure 43. Nurses and health visitors by Nationality and HEE Region, March 2017. Figure 44. Scientific, therapeutic and technical staff in NHS England by nationality and HEE region (share and total), March 2017. Figure 45. Support to clinical and ambulance staff in NHS England by nationality and HEE region (share and total), March 2017. Figure 46. Infrastructure support staff in NHS England by nationality and HEE region (share and total), March 2017. Figure 47. HCSC Doctors in NHS England: Joiners and Leavers by Nationality and HEE Region (headcounts), Q2 2017 vs Q2 2016
66 | Brexit and the Health & Social Care Workforce in the UK National Institute of Economic and Social Research
Figure 48. Midwives in NHS England: Joiners and Leavers by Nationality and HEE Region (headcounts), Q2 2017 vs Q2 2016 Figure 49. Nurses and health visitors in NHS England: Joiners and Leavers by Nationality and HEE Region (headcounts), Q2 2017 vs Q2 2016 Figure 50. Scientific, therapeutic and technical staff in NHS England: Joiners and Leavers by Nationality and HEE Region (headcounts), Q2 2017 vs Q2 2016 Figure 51. Support to clinical and ambulance staff in NHS England: Joiners and Leavers by Nationality and HEE Region (headcounts), Q2 2017 vs Q2 2016 Figure 52. Infrastructure support staff in NHS England: Joiners and Leavers by Nationality and HEE Region (headcounts), Q2 2017 vs Q2 2016 Figure 53. Incomplete RTT patient pathways, England, Apr 2008 – Jan 2018. Figure 54. Admitted RTT patient pathways, England, Apr 2008 – Jan 2018. Figure 55. Share of patients below 18 week RTT target, Scotland, Jan 2011 – Dec 2017. Figure 56. Admitted RTT pathways, % within 12 weeks. Scotland, Q4 2012 – Q4 2017. Figure 57. Percentage of patient pathways waiting to start treatment by month and grouped weeks, Wales. Source: NHS Wales Informatics Services (NWIS) Figure 58. Percentage of patient pathways closed by month and grouped weeks, Wales. Source: NHS Wales Informatics Services (NWIS) Figure 59. Inpatient waiting times by share of total patients and time bands, Northern Ireland. Source: Calculations based on data from Northern Ireland Department of Health. Figure 60. Share of inpatients waiting less than 13 weeks for admission to hospital, Northern Ireland. Source: NIESR calculations based on data from Northern Ireland Department of Health. Figure 61. Scatter plot of share treated within 18 weeks and share of leavers from the EU: trusts by quarter (complete and incomplete pathways), Q2-2015 to Q2-2017 Figure 62. Scatter plot of share treated within 18 weeks and hospital size: trusts by quarter (complete and incomplete pathways), Q2-2015 to Q2-2017 Figure 63. Scatter plot of share treated within 18 weeks and overall staff turnover: trusts by quarter (complete and incomplete pathways), Q2-2015 to Q2-2017

67 | Brexit and the Health & Social Care Workforce in the UK National Institute of Economic and Social Research
Appendices
Appendix A. Additional analysis for England
Health Education England (HEE) predicts that by 2027 the NHS in England alone will need an
additional 190,000 workers, while supply at the current rate would only add 72,000. Hence the
country faces a very real gap of 118,000 workers within the next 9 years. In other words, it would
need to add a net total of 13,100 workers every year from now on, including 2018. The reality is that
the NHS in England is losing a net total of 3,000 workers annually and by adding these figures up it
would even need an additional 16,100 workers joining every year. Against the backdrop of Brexit
and increasing number of leavers and decreasing number of joiners from the EU this appears to be a
bleak future.
Considering that around 80% of doctors and nurses are working in England, this section will focus on
the nationality of the NHS workforce at a more detailed occupational level. We also present trends
for English regions and over time, with a particular focus on the post-referendum period. A similar
analysis for other UK countries is not possible at this stage, as fine-grained data is not available.
Throughout the section we focus particularly on EU nationals in clinical occupations. The impact on
the clinical workforce is important because their higher skill levels and degree of specialisation may
make it challenging to replace any lost staff in the short term, with potential impacts on NHS
capacity and the quality of service delivery.
As shown in Figure 18, the majority of the staff in the NHS in England are British, but an important
minority are not. According to NHS Digital, as of March 2017 around 137,000 NHS workers reported
a non-British nationality,31 equivalent to 12.4% of all the NHS staff members for whom a nationality
is known.32 Around 5.6%, or 62,000 of these workers are nationals of another EU country. The
remaining 6.8% come from the Rest of the World (RoW). When looking at the age composition of
the NHS in England workforce in Figures 19-21, a few additional observations emerge. The largest
age group for UK staff is 50-54 (15% of staff), followed by 45-49 and 55-69. On the other hand, more
than half of EU staff are found in age groups 25-29, 30-34, and 35-39. The somewhat different
demographic age structure can shed additional light on the importance of the EU workforce for the
NHS in England. Considering that in the NHS the normal retirement age is between 60 to 65, it is
clear that in the coming years absolutely and relatively more UK than EU nationals are going to
retire.33
31
NHS Digital data do not include GPs, healthcare workers that are independent or contracted-out, and the social care sector. The latter will be analysed in more detail in Section 2.4, while GPs are included in Section 2.1.1. 32
NHS Digital states that nationality is self-reported and may in some cases refer to cultural heritage rather than country of birth. ‘Unknown’ nationality refers to staff that choose not to or are not asked to provide this kind of information. In March 2017 this category included a total of 80,822 staff. 33
The retirement age for some staff categories in post before 1995 is 55. Source: NHS Pensions Scheme Guide: http://www.wsh.nhs.uk/CMS-Documents/Staff/General-Documents/NHSPensionSchemeBooklet.pdf, Accessed on 7
th March 2018.
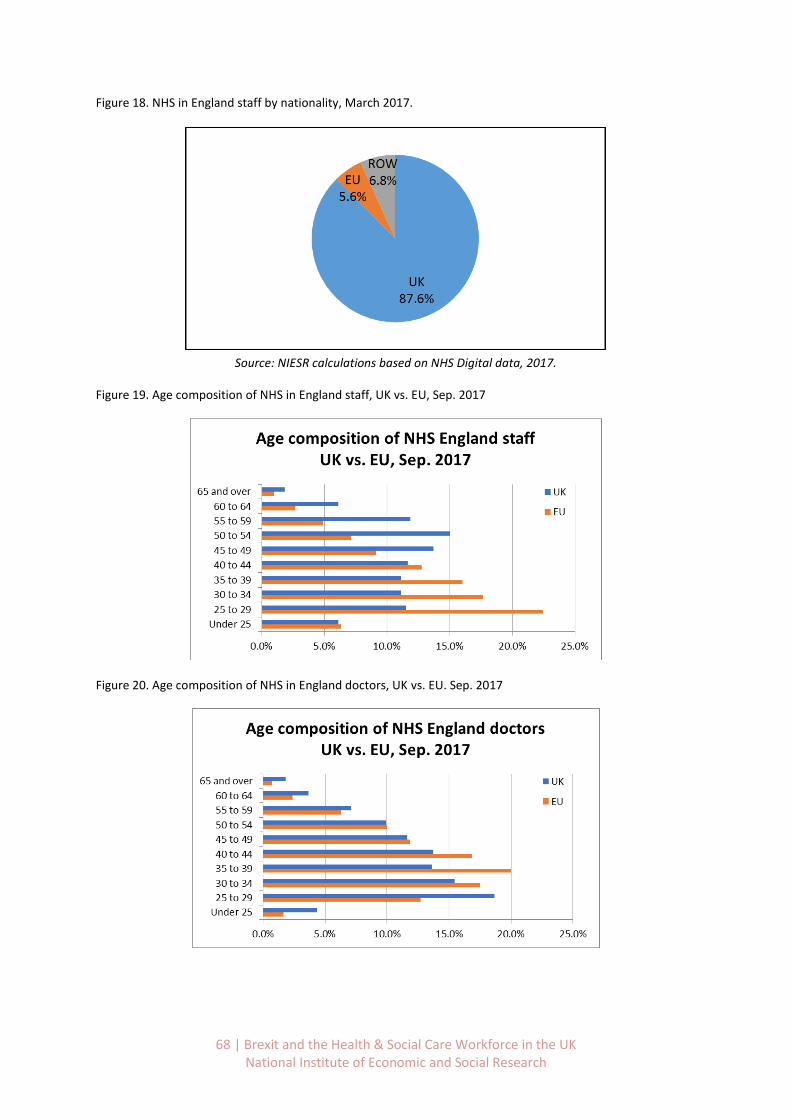
68 | Brexit and the Health & Social Care Workforce in the UK National Institute of Economic and Social Research
Figure 18. NHS in England staff by nationality, March 2017.
Source: NIESR calculations based on NHS Digital data, 2017.
Figure 19. Age composition of NHS in England staff, UK vs. EU, Sep. 2017
Figure 20. Age composition of NHS in England doctors, UK vs. EU. Sep. 2017
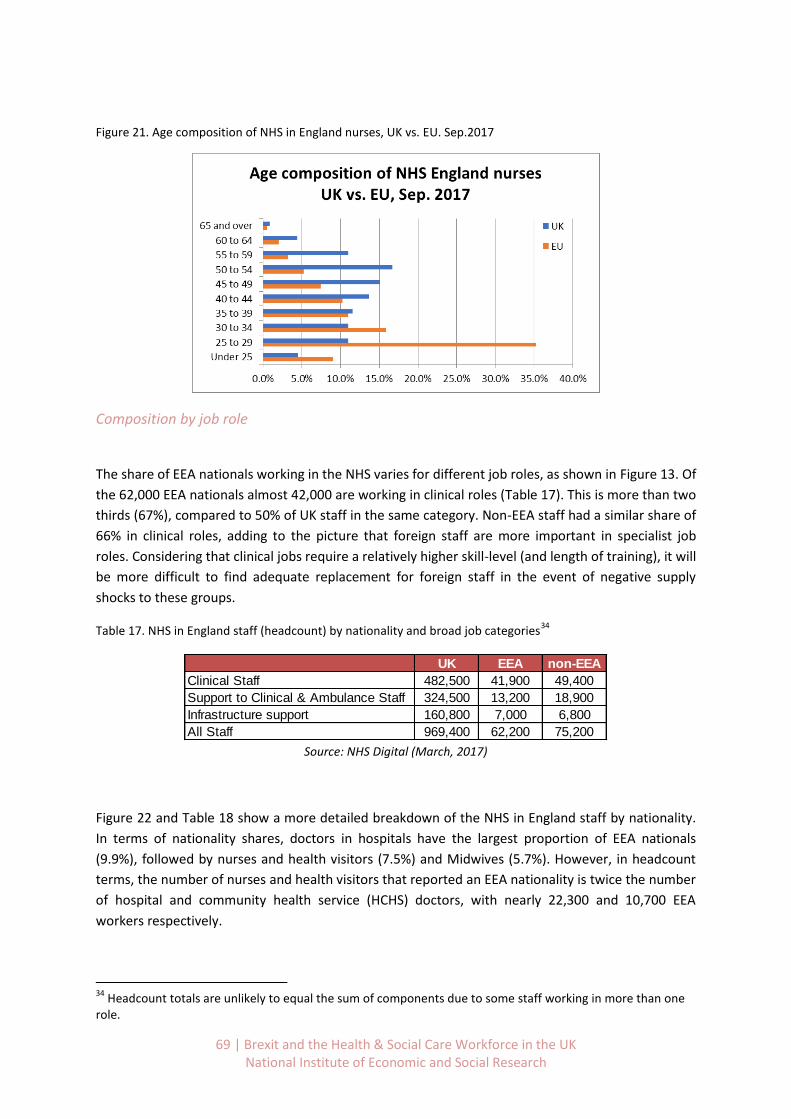
69 | Brexit and the Health & Social Care Workforce in the UK National Institute of Economic and Social Research
Figure 21. Age composition of NHS in England nurses, UK vs. EU. Sep.2017
Composition by job role
The share of EEA nationals working in the NHS varies for different job roles, as shown in Figure 13. Of
the 62,000 EEA nationals almost 42,000 are working in clinical roles (Table 17). This is more than two
thirds (67%), compared to 50% of UK staff in the same category. Non-EEA staff had a similar share of
66% in clinical roles, adding to the picture that foreign staff are more important in specialist job
roles. Considering that clinical jobs require a relatively higher skill-level (and length of training), it will
be more difficult to find adequate replacement for foreign staff in the event of negative supply
shocks to these groups.
Table 17. NHS in England staff (headcount) by nationality and broad job categories34
Source: NHS Digital (March, 2017)
Figure 22 and Table 18 show a more detailed breakdown of the NHS in England staff by nationality.
In terms of nationality shares, doctors in hospitals have the largest proportion of EEA nationals
(9.9%), followed by nurses and health visitors (7.5%) and Midwives (5.7%). However, in headcount
terms, the number of nurses and health visitors that reported an EEA nationality is twice the number
of hospital and community health service (HCHS) doctors, with nearly 22,300 and 10,700 EEA
workers respectively.
34
Headcount totals are unlikely to equal the sum of components due to some staff working in more than one role.
UK EEA non-EEA
Clinical Staff 482,500 41,900 49,400
Support to Clinical & Ambulance Staff 324,500 13,200 18,900
Infrastructure support 160,800 7,000 6,800
All Staff 969,400 62,200 75,200
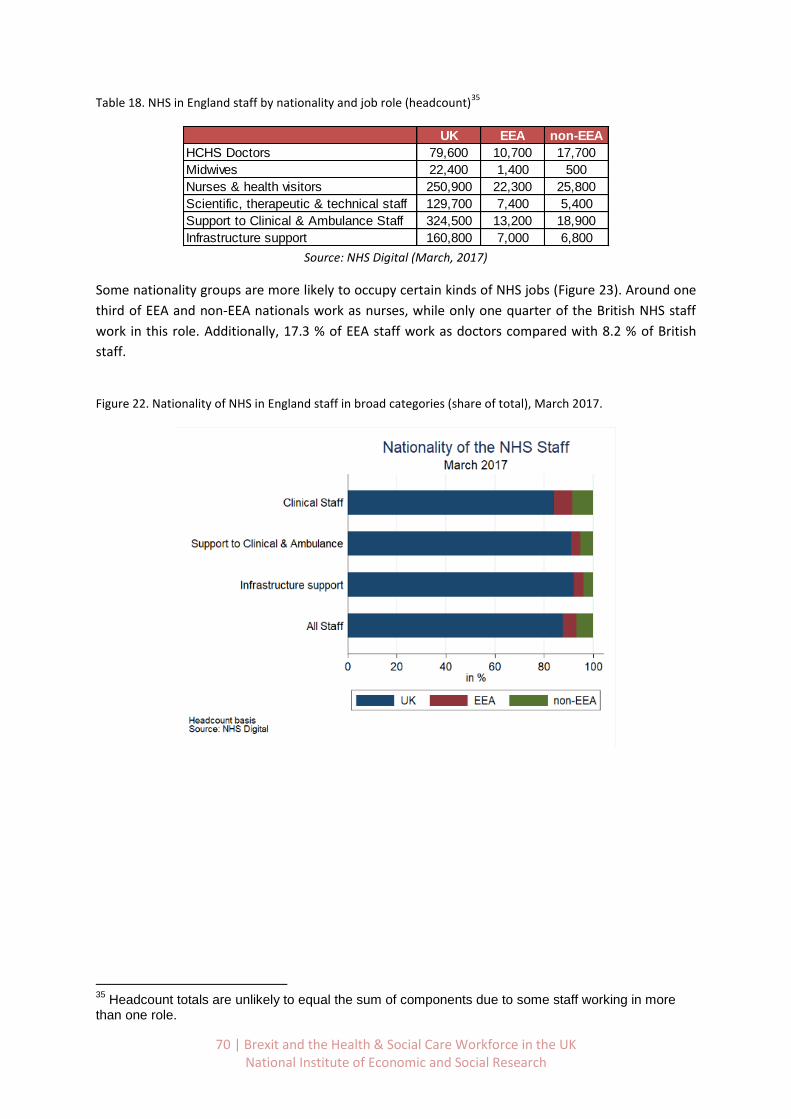
70 | Brexit and the Health & Social Care Workforce in the UK National Institute of Economic and Social Research
Table 18. NHS in England staff by nationality and job role (headcount)35
Source: NHS Digital (March, 2017)
Some nationality groups are more likely to occupy certain kinds of NHS jobs (Figure 23). Around one
third of EEA and non-EEA nationals work as nurses, while only one quarter of the British NHS staff
work in this role. Additionally, 17.3 % of EEA staff work as doctors compared with 8.2 % of British
staff.
Figure 22. Nationality of NHS in England staff in broad categories (share of total), March 2017.
35
Headcount totals are unlikely to equal the sum of components due to some staff working in more than one role.
UK EEA non-EEA
HCHS Doctors 79,600 10,700 17,700
Midwives 22,400 1,400 500
Nurses & health visitors 250,900 22,300 25,800
Scientific, therapeutic & technical staff 129,700 7,400 5,400
Support to Clinical & Ambulance Staff 324,500 13,200 18,900
Infrastructure support 160,800 7,000 6,800
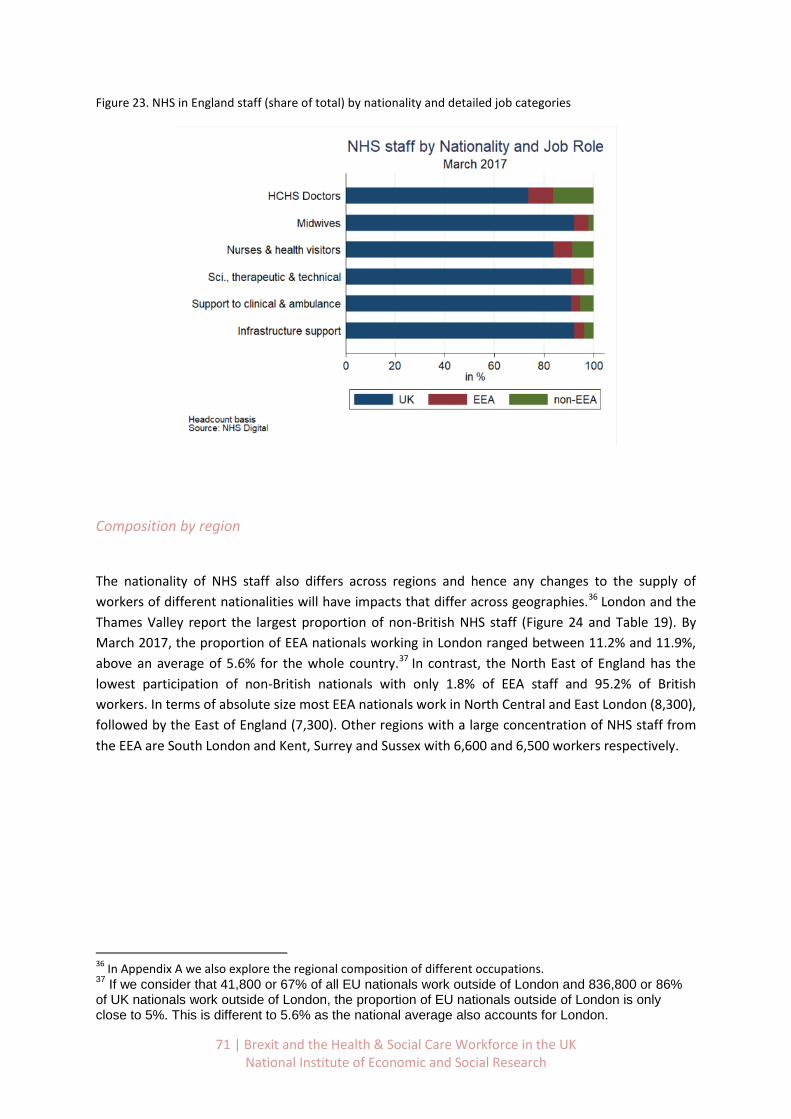
71 | Brexit and the Health & Social Care Workforce in the UK National Institute of Economic and Social Research
Figure 23. NHS in England staff (share of total) by nationality and detailed job categories
Composition by region
The nationality of NHS staff also differs across regions and hence any changes to the supply of
workers of different nationalities will have impacts that differ across geographies.36 London and the
Thames Valley report the largest proportion of non-British NHS staff (Figure 24 and Table 19). By
March 2017, the proportion of EEA nationals working in London ranged between 11.2% and 11.9%,
above an average of 5.6% for the whole country.37 In contrast, the North East of England has the
lowest participation of non-British nationals with only 1.8% of EEA staff and 95.2% of British
workers. In terms of absolute size most EEA nationals work in North Central and East London (8,300),
followed by the East of England (7,300). Other regions with a large concentration of NHS staff from
the EEA are South London and Kent, Surrey and Sussex with 6,600 and 6,500 workers respectively.
36
In Appendix A we also explore the regional composition of different occupations. 37
If we consider that 41,800 or 67% of all EU nationals work outside of London and 836,800 or 86% of UK nationals work outside of London, the proportion of EU nationals outside of London is only close to 5%. This is different to 5.6% as the national average also accounts for London.
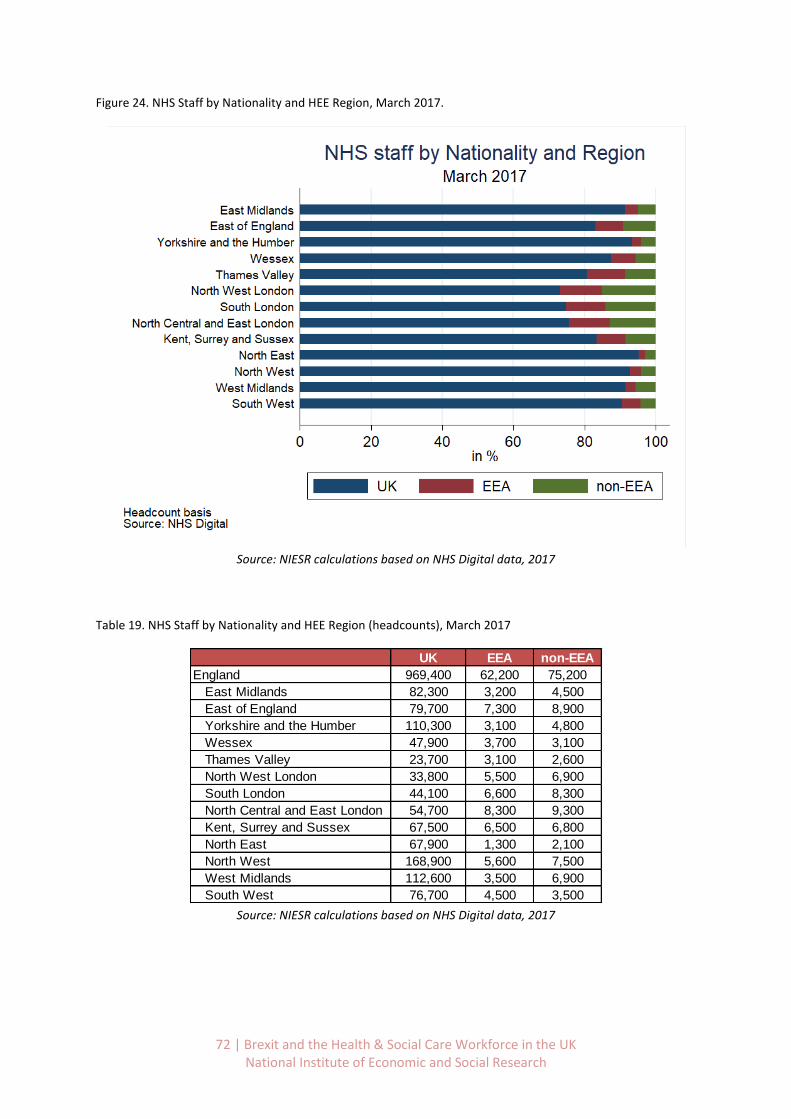
72 | Brexit and the Health & Social Care Workforce in the UK National Institute of Economic and Social Research
Figure 24. NHS Staff by Nationality and HEE Region, March 2017.
Source: NIESR calculations based on NHS Digital data, 2017
Table 19. NHS Staff by Nationality and HEE Region (headcounts), March 2017
Source: NIESR calculations based on NHS Digital data, 2017
UK EEA non-EEA
England 969,400 62,200 75,200
East Midlands 82,300 3,200 4,500
East of England 79,700 7,300 8,900
Yorkshire and the Humber 110,300 3,100 4,800
Wessex 47,900 3,700 3,100
Thames Valley 23,700 3,100 2,600
North West London 33,800 5,500 6,900
South London 44,100 6,600 8,300
North Central and East London 54,700 8,300 9,300
Kent, Surrey and Sussex 67,500 6,500 6,800
North East 67,900 1,300 2,100
North West 168,900 5,600 7,500
West Midlands 112,600 3,500 6,900
South West 76,700 4,500 3,500
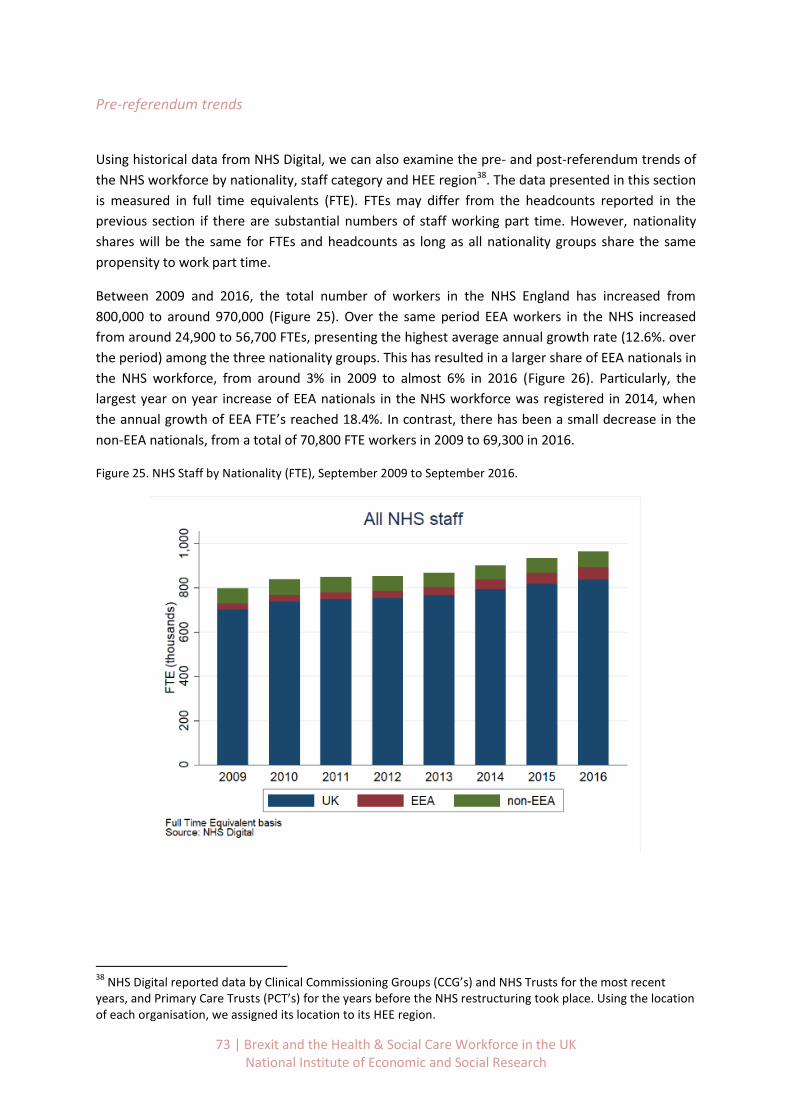
73 | Brexit and the Health & Social Care Workforce in the UK National Institute of Economic and Social Research
Pre-referendum trends
Using historical data from NHS Digital, we can also examine the pre- and post-referendum trends of
the NHS workforce by nationality, staff category and HEE region38. The data presented in this section
is measured in full time equivalents (FTE). FTEs may differ from the headcounts reported in the
previous section if there are substantial numbers of staff working part time. However, nationality
shares will be the same for FTEs and headcounts as long as all nationality groups share the same
propensity to work part time.
Between 2009 and 2016, the total number of workers in the NHS England has increased from
800,000 to around 970,000 (Figure 25). Over the same period EEA workers in the NHS increased
from around 24,900 to 56,700 FTEs, presenting the highest average annual growth rate (12.6%. over
the period) among the three nationality groups. This has resulted in a larger share of EEA nationals in
the NHS workforce, from around 3% in 2009 to almost 6% in 2016 (Figure 26). Particularly, the
largest year on year increase of EEA nationals in the NHS workforce was registered in 2014, when
the annual growth of EEA FTE’s reached 18.4%. In contrast, there has been a small decrease in the
non-EEA nationals, from a total of 70,800 FTE workers in 2009 to 69,300 in 2016.
Figure 25. NHS Staff by Nationality (FTE), September 2009 to September 2016.
38
NHS Digital reported data by Clinical Commissioning Groups (CCG’s) and NHS Trusts for the most recent years, and Primary Care Trusts (PCT’s) for the years before the NHS restructuring took place. Using the location of each organisation, we assigned its location to its HEE region.
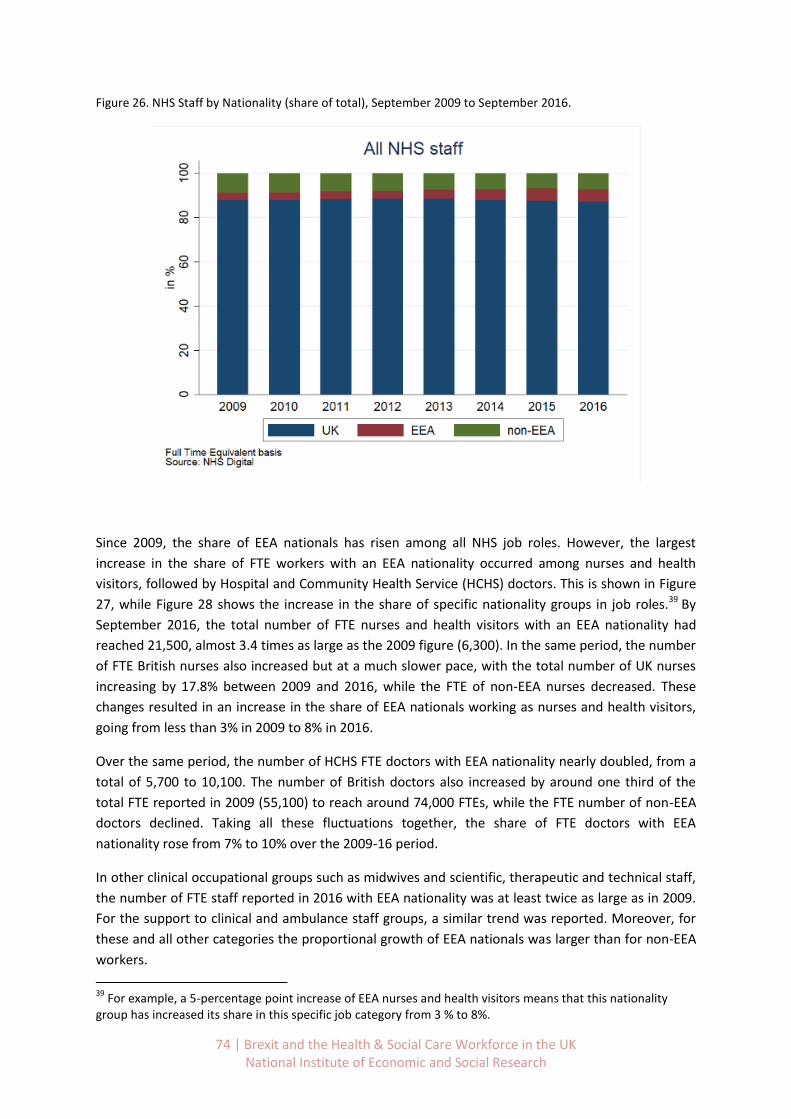
74 | Brexit and the Health & Social Care Workforce in the UK National Institute of Economic and Social Research
Figure 26. NHS Staff by Nationality (share of total), September 2009 to September 2016.
Since 2009, the share of EEA nationals has risen among all NHS job roles. However, the largest
increase in the share of FTE workers with an EEA nationality occurred among nurses and health
visitors, followed by Hospital and Community Health Service (HCHS) doctors. This is shown in Figure
27, while Figure 28 shows the increase in the share of specific nationality groups in job roles.39 By
September 2016, the total number of FTE nurses and health visitors with an EEA nationality had
reached 21,500, almost 3.4 times as large as the 2009 figure (6,300). In the same period, the number
of FTE British nurses also increased but at a much slower pace, with the total number of UK nurses
increasing by 17.8% between 2009 and 2016, while the FTE of non-EEA nurses decreased. These
changes resulted in an increase in the share of EEA nationals working as nurses and health visitors,
going from less than 3% in 2009 to 8% in 2016.
Over the same period, the number of HCHS FTE doctors with EEA nationality nearly doubled, from a
total of 5,700 to 10,100. The number of British doctors also increased by around one third of the
total FTE reported in 2009 (55,100) to reach around 74,000 FTEs, while the FTE number of non-EEA
doctors declined. Taking all these fluctuations together, the share of FTE doctors with EEA
nationality rose from 7% to 10% over the 2009-16 period.
In other clinical occupational groups such as midwives and scientific, therapeutic and technical staff,
the number of FTE staff reported in 2016 with EEA nationality was at least twice as large as in 2009.
For the support to clinical and ambulance staff groups, a similar trend was reported. Moreover, for
these and all other categories the proportional growth of EEA nationals was larger than for non-EEA
workers.
39
For example, a 5-percentage point increase of EEA nurses and health visitors means that this nationality group has increased its share in this specific job category from 3 % to 8%.
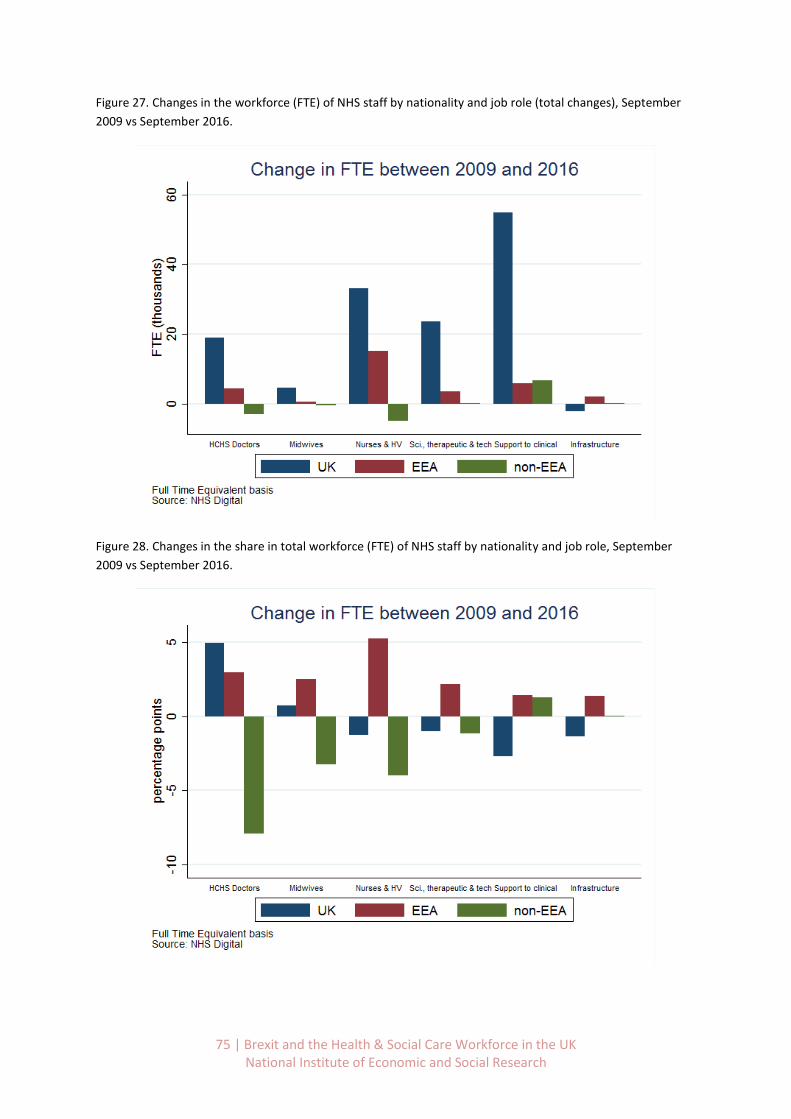
75 | Brexit and the Health & Social Care Workforce in the UK National Institute of Economic and Social Research
Figure 27. Changes in the workforce (FTE) of NHS staff by nationality and job role (total changes), September
2009 vs September 2016.
Figure 28. Changes in the share in total workforce (FTE) of NHS staff by nationality and job role, September
2009 vs September 2016.

76 | Brexit and the Health & Social Care Workforce in the UK National Institute of Economic and Social Research
Across HEE regions, London, the East of England and Kent, Surrey and Sussex reported the largest
increase of EEA FTE workers, both in numbers and in shares (Figure 29 and Figure 30). In the three
HEE regions in London, the share of EEA nationals increased from an average of 8% in 2009 to 12% in
2016. On average, the increase of FTEs in each London region was around 3,500, which adds up to a
total of 10,300 additional EEA staff for the three London regions between 2009 and 2016. While the
number of FTEs with an EEA nationality increased, the net change of non-EEA nationals was only
positive for North West London. This resulted in an aggregate net figure of only 300 additional FTEs
from non-EEA nationalities for the three London areas, which also resulted in a lower share of non-
EEA staff.
In the East of England and Kent Surrey and Sussex, the share of EEA FTE staff almost doubled
between 2009 and 2016. In both regions, this figure went from nearly 4% in 2009 to over 8% in
2016. More specifically, the East of England registered an increase of nearly 4,200 FTE workers with
an EEA nationality during this period, the largest among all individual HEE regions. In Kent Surrey and
Sussex, 3,300 additional FTE’s with an EEA nationality were reported between 2009 and 2016.
Additionally, both regions had a slight decrease in the share of non-EEA FTE staff working in the NHS.
Figure 29. NHS Staff by nationality and HEE region, relative change Sep. 2009 – Sep. 2016
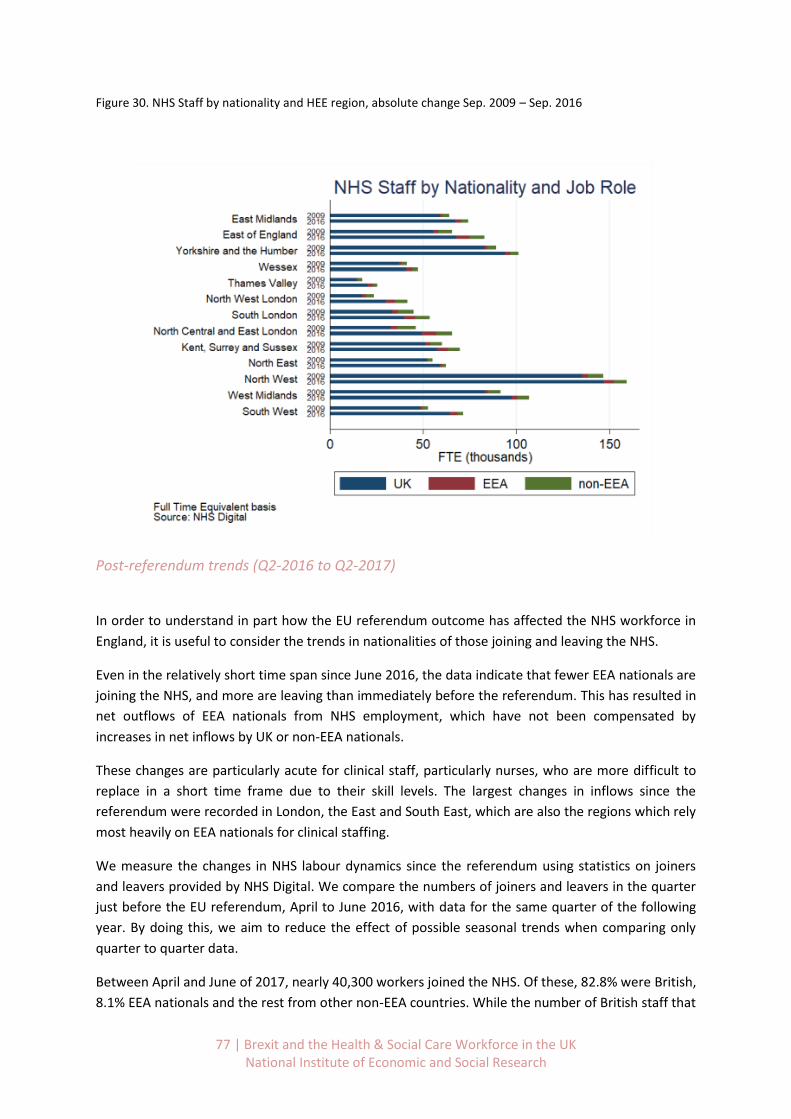
77 | Brexit and the Health & Social Care Workforce in the UK National Institute of Economic and Social Research
Figure 30. NHS Staff by nationality and HEE region, absolute change Sep. 2009 – Sep. 2016
Post-referendum trends (Q2-2016 to Q2-2017)
In order to understand in part how the EU referendum outcome has affected the NHS workforce in
England, it is useful to consider the trends in nationalities of those joining and leaving the NHS.
Even in the relatively short time span since June 2016, the data indicate that fewer EEA nationals are
joining the NHS, and more are leaving than immediately before the referendum. This has resulted in
net outflows of EEA nationals from NHS employment, which have not been compensated by
increases in net inflows by UK or non-EEA nationals.
These changes are particularly acute for clinical staff, particularly nurses, who are more difficult to
replace in a short time frame due to their skill levels. The largest changes in inflows since the
referendum were recorded in London, the East and South East, which are also the regions which rely
most heavily on EEA nationals for clinical staffing.
We measure the changes in NHS labour dynamics since the referendum using statistics on joiners
and leavers provided by NHS Digital. We compare the numbers of joiners and leavers in the quarter
just before the EU referendum, April to June 2016, with data for the same quarter of the following
year. By doing this, we aim to reduce the effect of possible seasonal trends when comparing only
quarter to quarter data.
Between April and June of 2017, nearly 40,300 workers joined the NHS. Of these, 82.8% were British,
8.1% EEA nationals and the rest from other non-EEA countries. While the number of British staff that

78 | Brexit and the Health & Social Care Workforce in the UK National Institute of Economic and Social Research
joined the NHS is quite similar compared with the same period of 2016, the number of joiners from
other EEA countries decreased by around 17.6% as shown in Table 20 (equivalent to around 700
fewer joiners).
In addition to a reduction in the number of EEA joiners, a larger number of leavers from these
countries was also registered. Between April and June 2017, around 3,300 workers that had
reported a non-British EEA nationality left the NHS, 15.3% more than in the same period of 2016.
These figures have resulted in a net outflow of NHS workers (joiners minus leavers). By nationality,
British net figures added up to and outflow of around 2,550, comparable to the 2016 figures.
For EEA nationals, the net figures for 2017 indicated an outflow of almost 100, in stark contrast to
the net inflow of almost 1,000 EEA workers reported to have joined the year before. On the other
hand, the NHS joiners from non-EEA regions continue to outnumber the leavers.
During the second quarter of 2017 there was a net inflow of nearly 1,000 non-EEA workers into the
NHS, similar to that recorded in 2016.
Overall, while UK and non-EEA net flows of workers did not change much after the referendum,
there has been a registered outflow of EEA staff in the official statistics. This is clearly visible in
Figure 31 and Figure 32 as the red bar in 2017 is smaller for joiners and larger for leavers than in
2016.
Table 20. Year-on-year growth of NHS Joiners and Leavers by Nationality, Q2 2017 vs Q2 2016.
Source: NIESR calculations based on data from NHS Digital
UK EEA non-EEA UK EEA non-EEA
Clinical Staff -0.9% -24.2% 8.7% -2.0% 15.8% -3.5%
Support to Clinical & Ambulance Staff 0.3% -2.5% 1.7% 3.6% 11.9% 17.8%
Infrastructure support 4.1% -19.7% -18.1% -1.1% 21.1% 7.8%
All Staff 0.3% -17.6% 2.8% 0.2% 15.3% 3.3%
Joiners Leavers

79 | Brexit and the Health & Social Care Workforce in the UK National Institute of Economic and Social Research
Figure 31. NHS Joiners by nationality (headcounts), Q2 2017 vs Q2 2016.
Figure 32. NHS Leavers by nationality (headcounts), Q2 2017 vs Q2 2016.
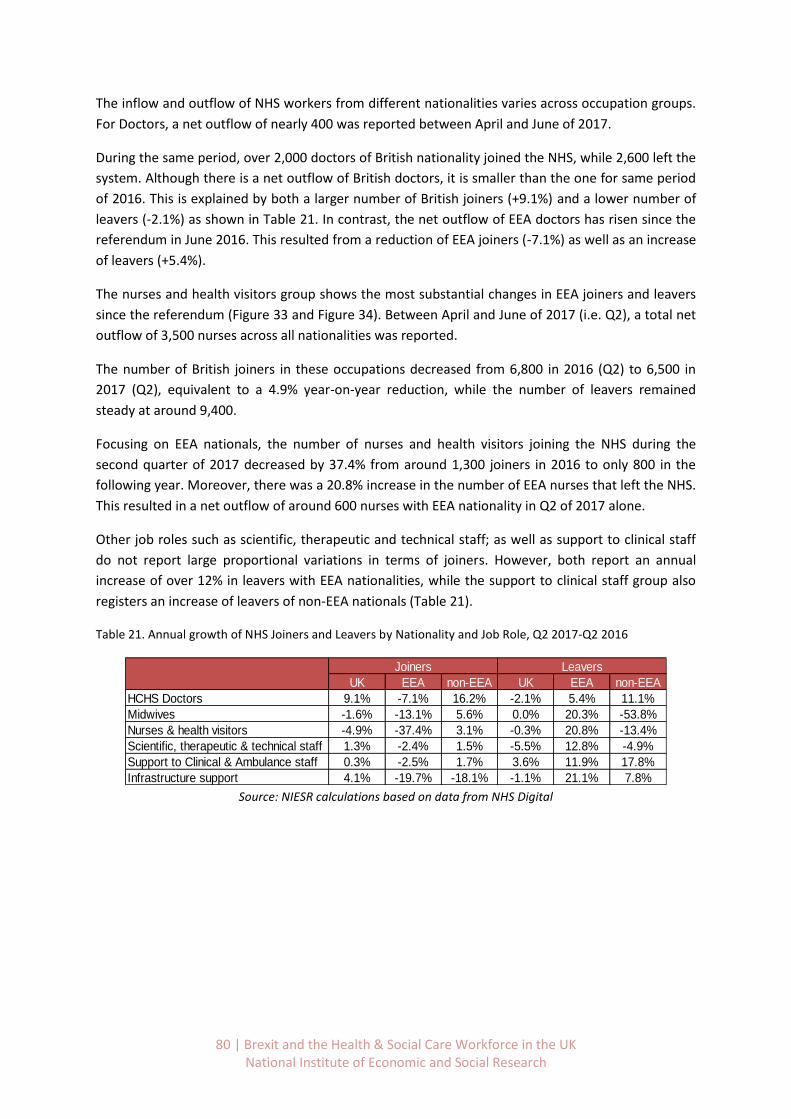
80 | Brexit and the Health & Social Care Workforce in the UK National Institute of Economic and Social Research
The inflow and outflow of NHS workers from different nationalities varies across occupation groups.
For Doctors, a net outflow of nearly 400 was reported between April and June of 2017.
During the same period, over 2,000 doctors of British nationality joined the NHS, while 2,600 left the
system. Although there is a net outflow of British doctors, it is smaller than the one for same period
of 2016. This is explained by both a larger number of British joiners (+9.1%) and a lower number of
leavers (-2.1%) as shown in Table 21. In contrast, the net outflow of EEA doctors has risen since the
referendum in June 2016. This resulted from a reduction of EEA joiners (-7.1%) as well as an increase
of leavers (+5.4%).
The nurses and health visitors group shows the most substantial changes in EEA joiners and leavers
since the referendum (Figure 33 and Figure 34). Between April and June of 2017 (i.e. Q2), a total net
outflow of 3,500 nurses across all nationalities was reported.
The number of British joiners in these occupations decreased from 6,800 in 2016 (Q2) to 6,500 in
2017 (Q2), equivalent to a 4.9% year-on-year reduction, while the number of leavers remained
steady at around 9,400.
Focusing on EEA nationals, the number of nurses and health visitors joining the NHS during the
second quarter of 2017 decreased by 37.4% from around 1,300 joiners in 2016 to only 800 in the
following year. Moreover, there was a 20.8% increase in the number of EEA nurses that left the NHS.
This resulted in a net outflow of around 600 nurses with EEA nationality in Q2 of 2017 alone.
Other job roles such as scientific, therapeutic and technical staff; as well as support to clinical staff
do not report large proportional variations in terms of joiners. However, both report an annual
increase of over 12% in leavers with EEA nationalities, while the support to clinical staff group also
registers an increase of leavers of non-EEA nationals (Table 21).
Table 21. Annual growth of NHS Joiners and Leavers by Nationality and Job Role, Q2 2017-Q2 2016
Source: NIESR calculations based on data from NHS Digital
UK EEA non-EEA UK EEA non-EEA
HCHS Doctors 9.1% -7.1% 16.2% -2.1% 5.4% 11.1%
Midwives -1.6% -13.1% 5.6% 0.0% 20.3% -53.8%
Nurses & health visitors -4.9% -37.4% 3.1% -0.3% 20.8% -13.4%
Scientific, therapeutic & technical staff 1.3% -2.4% 1.5% -5.5% 12.8% -4.9%
Support to Clinical & Ambulance staff 0.3% -2.5% 1.7% 3.6% 11.9% 17.8%
Infrastructure support 4.1% -19.7% -18.1% -1.1% 21.1% 7.8%
Joiners Leavers
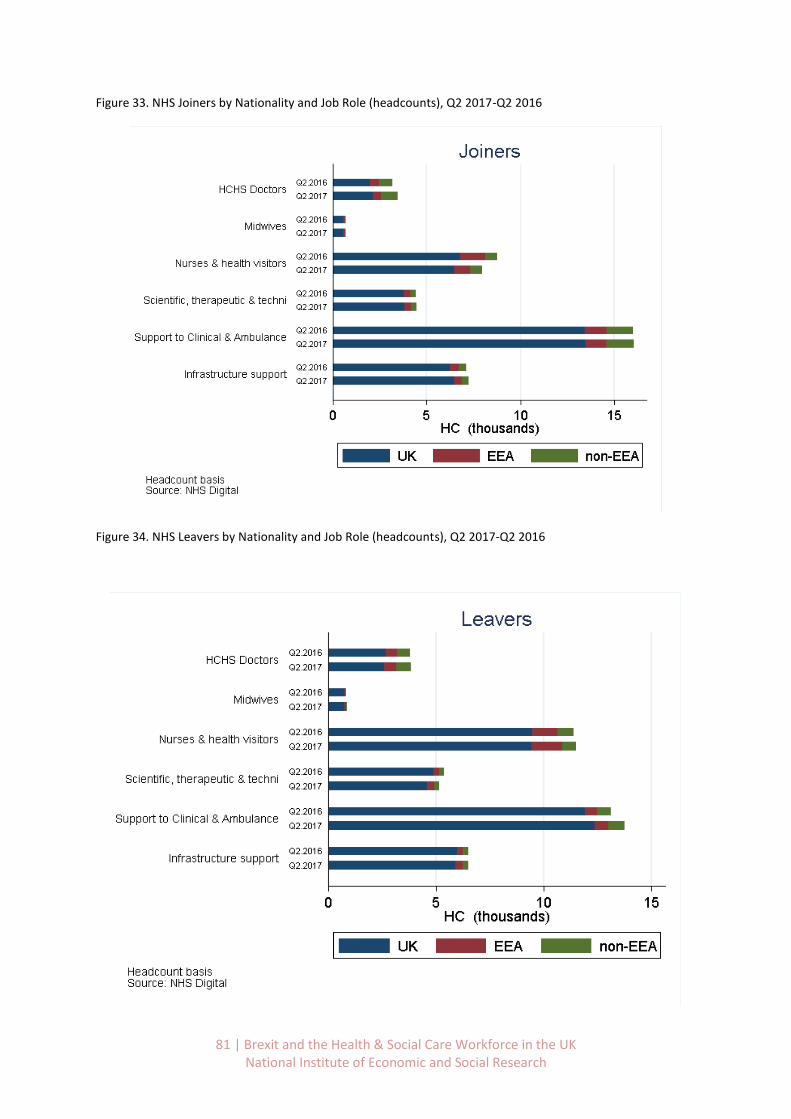
81 | Brexit and the Health & Social Care Workforce in the UK National Institute of Economic and Social Research
Figure 33. NHS Joiners by Nationality and Job Role (headcounts), Q2 2017-Q2 2016
Figure 34. NHS Leavers by Nationality and Job Role (headcounts), Q2 2017-Q2 2016

82 | Brexit and the Health & Social Care Workforce in the UK National Institute of Economic and Social Research
Differences across regions
Across all Health Education England (HEE) regions, the net inflow of EEA workers to the NHS either
decreased or became negative (a net outflow) between the second quarter of 2016 and the same
period in 2017.
This situation stems both from a generalised reduction in the number of EEA joiners, as well as an
increase in the number of EEA workers that left the NHS, with very few exceptions (North East and
West Midlands). This is shown in Table 22, Figure 35 and Figure 36.
This pattern of decreases in EEA joiners and increases in leavers holds particularly for the regions
that reported the largest shares of EEA workers. The number of joiners with EEA nationality ranged
from 300 to 400 in the three London regions between April and June 2017, an average annual
reduction of almost 12%. North Central London reported the largest increase in leavers among the
three HEE London regions, as the number of EEA leavers reached 438, 11.5% more than the year
before.
Table 22. Annual growth of NHS Joiners and Leavers by Nationality and HEE Region, Q2 2017 vs Q2 2016
Source: NIESR calculations based on NHS Digital data
UK EEA non-EEA UK EEA non-EEA
England 0.3% -17.6% 2.8% 0.2% 15.3% 3.3%
East Midlands 28.8% -15.3% 27.8% -2.2% 26.6% 4.9%
East of England 2.5% -27.7% 7.2% 8.6% 30.0% 6.7%
Yorkshire and the Humber 1.6% -15.6% -21.9% 8.5% 17.7% -8.2%
Wessex 13.8% -6.6% 19.4% -12.2% 43.2% -24.0%
Thames Valley -6.1% -20.6% 16.5% 4.0% 22.9% -1.1%
North West London 27.1% -10.1% 6.9% -5.6% 4.9% -3.6%
South London 1.0% -14.3% -6.4% 15.9% 8.1% 11.9%
North Central and East London -2.9% -11.0% 7.5% 1.5% 11.5% -1.9%
Kent, Surrey and Sussex 2.4% -19.4% -7.6% 0.5% 30.3% 40.5%
North East 4.1% -6.0% 34.8% -4.8% -8.5% 13.3%
North West 0.3% -18.3% 17.1% 8.6% 9.6% 11.2%
West Midlands -7.9% -16.9% -13.5% -7.7% -2.3% -10.2%
South West -26.8% -28.6% -14.7% -13.1% 1.6% 2.3%
Joiners Leavers
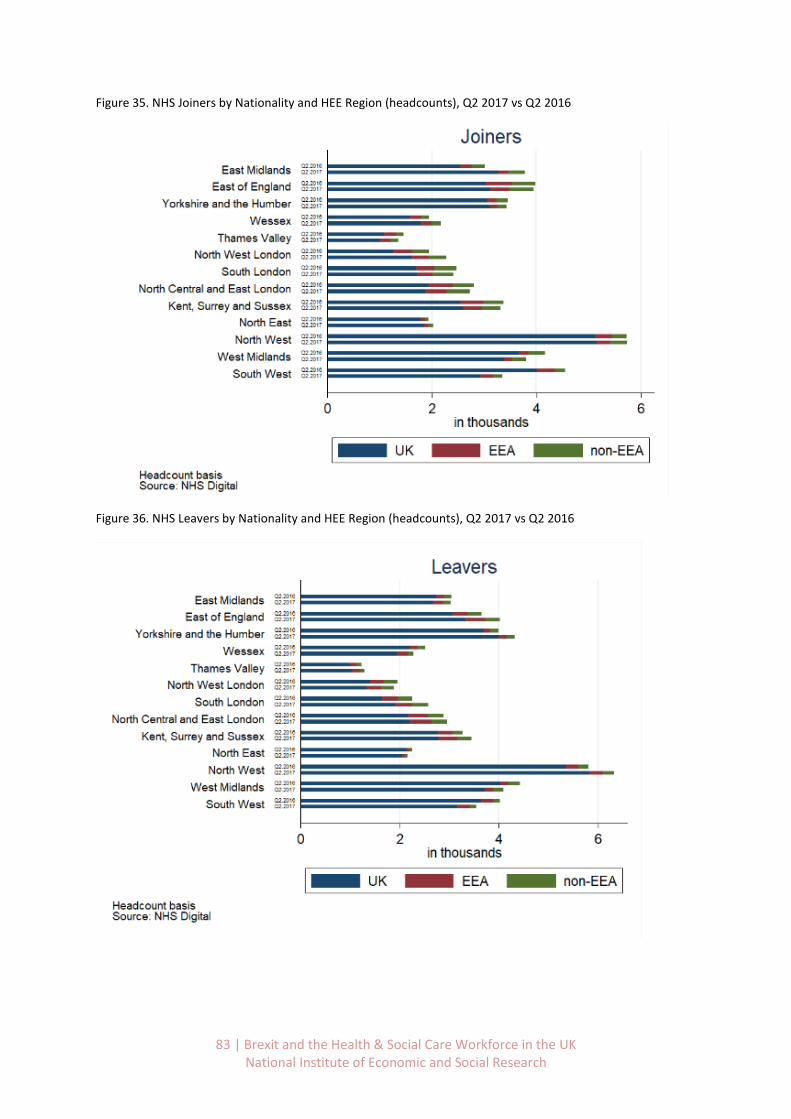
83 | Brexit and the Health & Social Care Workforce in the UK National Institute of Economic and Social Research
Figure 35. NHS Joiners by Nationality and HEE Region (headcounts), Q2 2017 vs Q2 2016
Figure 36. NHS Leavers by Nationality and HEE Region (headcounts), Q2 2017 vs Q2 2016

84 | Brexit and the Health & Social Care Workforce in the UK National Institute of Economic and Social Research
Additional trends in social care for England
Using data provided by Skills for Care (2017) we can look at more detailed trends in the social care
workforce by occupation and region. Data are based on the National Minimum Dataset for Social
Care (NMDS-SC) published in March 2017.40 Similar data do not exist for Scotland, Wales and
Northern Ireland.41
Results presented in Figure 37 indicate that since 2012/13 the share of EEA nationals rose from 5%
to 7%. In relative terms this displaced non-EEA nationals, whose share declined from 13% to 9%.
Turning to absolute number in Figure 38 we see that over the same period the adult social care
workforce has expanded by 75,000 workers, from 1,265,000 to 1,340,000.
While the number of EEA nationals working in adult social care increased by nearly 65%, from 62,000
to 95,000, the number of non-EEA nationals fell by over 20%, from 160,000 to 127,000. Thus, in net
terms, 33,000 non-EEA nationals were replaced by 33,000 additional EEA nationals in the social care
workforce between 2012/13 and 2016/17. At the same time, the number of UK nationals grew by
75,000, representing an increase of about 7%.
Figure 37. Adult social care workforce by nationality, shares, 2012/13 to 2016/17.
Source: NIESR calculations based on Skills for Care data (March 2017)
40
The NMDS-SC covers 1.34 million of 1.58 million jobs in the adult social care sector as it is based on local authority and independent sector employers. Though data provision is voluntary it has a large sample and hence allows for the creation of workforce estimates at national and local levels. A full explanation of the survey can be found in Appendix 1 of the Skills for Care report The size and structure of the adult social care sector and workforce in England, 2017. 41
This has been confirmed by the Scottish Social Services Council, Social Care Wales, and the Northern Ireland Social Care Council.

85 | Brexit and the Health & Social Care Workforce in the UK National Institute of Economic and Social Research
Figure 38. Adult social care workforce by nationality, levels, 2012/13 to 2016/17.
Source: NIESR calculations based on Skills for Care data (March 2017)
Composition and trends by occupation
Across adult social care occupations, the regulated professions (incl. social workers, occupational
therapists, and registered nurses) stand out as having particularly large shares of EEA and non-EEA
nationals at 12% and 15% respectively (Table 23).
Taking a closer look at occupations reveals that these large shares of non-UK nationals in regulated
professions are primarily due to their high share among registered nurses (Table 24).
EEA nationals make up 16% of registered nurses working in adult social care, while the share of non-
EEA nationals among registered nurses is even larger at 20%, with only 64% of registered nurses
working in social care reporting UK nationality.
In contrast, the shares of EEA and non-EEA nationals among social workers and occupational
therapists are much smaller than average, only about half as large as the averages across all
occupations. While members of regulated professions make up only a relative small proportion of
the total adult social care workforce (64,500 out of 1.34 million, or about 5%), their relatively high
skill levels make replacing them in a short time frame more challenging than other parts of the social
care workforce.
Direct care and senior direct care workers form by far the largest group of adult social care workers
in England (985,000 or about 74% of the total adult social care workforce), and EEA nationals make
up about 7% of this occupational group, compared to 10% non-EEA nationals and 82% UK nationals.

86 | Brexit and the Health & Social Care Workforce in the UK National Institute of Economic and Social Research
EEA and non-EEA nationals are somewhat underrepresented in managerial roles, particular at more
senior levels.
Table 23. Adult social care staff in England by nationality, 2016/17 – totals and by broad occupation and workplace type
Total jobs UK EEA non-EEA
All job roles 1,340,000 83% 7% 9%
Direct care 985,000 82% 7% 10%
Regulated profession 64,500 73% 12% 15%
Managerial 115,000 92% 4% 5%
Other 175,000 89% 6% 5%
Independent 1,230,000 82% 8% 10%
Local authority 112,800 95% 2% 3%
Domiciliary care services 505,000 84% 6% 9%
Care home services without nursing 305,000 85% 6% 8%
Care home services with nursing 290,000 76% 11% 13%
Source: NIESR calculations based on Skills for Care data (March 2017)
Table 24. Adult social care staff in England by nationality, 2016/17 – by selected detailed occupations
Total Jobs UK EEA non-EEA
Managerial 115,000 92% 4% 5%
Senior management 16,000 94% 2% 3%
Registered manager 22,500 93% 3% 4%
Regulated profession 64,500 73% 12% 15%
Social worker 17,000 92% 3% 5%
Occupational therapist 3,000 93% 4% 4%
Registered nurse 43,000 64% 16% 20%
Direct Care 985,000 82% 7% 10%
Senior care worker 85,000 83% 6% 11%
Care worker 815,000 82% 8% 11%
Other 175,000 89% 6% 5%
Support and outreach 60,000 89% 4% 7%
Source: NIESR calculations based on Skills for Care data (March 2017)
In Figure 39 we examine the trends in the broad occupations in terms of relative numbers
respectively between 2012/13 and 2016/17. Direct care registered the largest increase in EEA
nationals of all social care occupations, rising from 5% to 7% of employees.
There was also a substantial increase in EEA nationals employed in the much smaller group of
regulated professionals, from 6% in 2012/13 to 12% in 2016/17, driven by registered nurses.
This increase is set against a backdrop of declining numbers of regulated professionals working in
adult social care overall, driven by non-EEA and UK nationals. The numbers of EEA nationals also
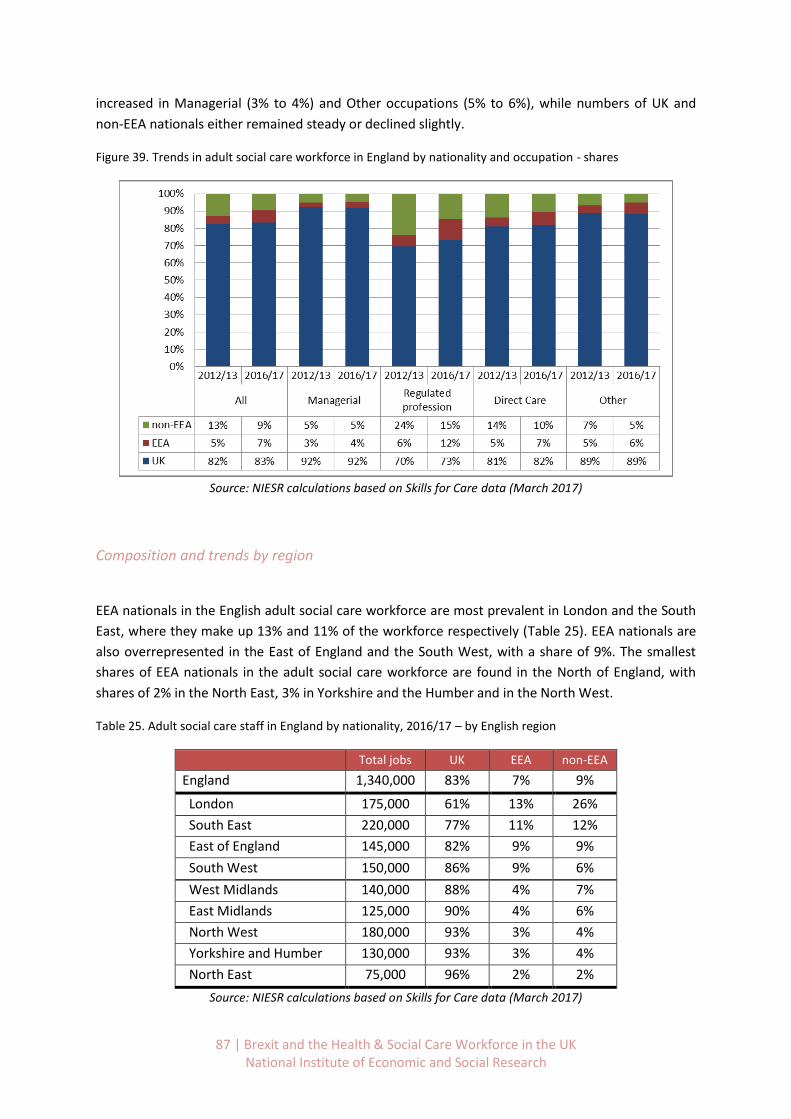
87 | Brexit and the Health & Social Care Workforce in the UK National Institute of Economic and Social Research
increased in Managerial (3% to 4%) and Other occupations (5% to 6%), while numbers of UK and
non-EEA nationals either remained steady or declined slightly.
Figure 39. Trends in adult social care workforce in England by nationality and occupation - shares
Source: NIESR calculations based on Skills for Care data (March 2017)
Composition and trends by region
EEA nationals in the English adult social care workforce are most prevalent in London and the South
East, where they make up 13% and 11% of the workforce respectively (Table 25). EEA nationals are
also overrepresented in the East of England and the South West, with a share of 9%. The smallest
shares of EEA nationals in the adult social care workforce are found in the North of England, with
shares of 2% in the North East, 3% in Yorkshire and the Humber and in the North West.
Table 25. Adult social care staff in England by nationality, 2016/17 – by English region
Total jobs UK EEA non-EEA
England 1,340,000 83% 7% 9%
London 175,000 61% 13% 26%
South East 220,000 77% 11% 12%
East of England 145,000 82% 9% 9%
South West 150,000 86% 9% 6%
West Midlands 140,000 88% 4% 7%
East Midlands 125,000 90% 4% 6%
North West 180,000 93% 3% 4%
Yorkshire and Humber 130,000 93% 3% 4%
North East 75,000 96% 2% 2%
Source: NIESR calculations based on Skills for Care data (March 2017)

88 | Brexit and the Health & Social Care Workforce in the UK National Institute of Economic and Social Research
The regional patterns in adult social care employment are remarkably similar across occupations
(Tables 26-28).
For all three major occupational groups - direct care, regulated professions and managerial – London
and the South East have shares of EEA nationals in the adult social care workforce that is
substantially above the English average.
The shares of direct care workers and regulated professionals are also above average in the East and
South West. The shares of EEA nationals are also consistently below average for all occupations in
the North East, North West, Yorkshire and Humber, as well as in the East and West Midlands.
The occupational patterns are also quite similar across English regions. The highest shares of EEA
nationals are consistently found in the regulated professions, followed by direct care and
management.
Accordingly, the highest concentration of EEA nationals is found in the regulated professions in the
South East, with a 20% share, followed by the share of EEA nationals among regulated professionals
in London at 17%.
In contrast, the lowest shares of EEA nationals at 1% are found among adult social care managers in
the East Midlands, West Midlands and Yorkshire/Humber.
Table 26. Adult social care staff by nationality, 2016/17 – Regulated professions, by region
Total
jobs UK EEA non-EEA
England 64,500 73% 12% 15%
South East 11,500 61% 20% 19%
London 8,900 60% 17% 23%
East 6,500 70% 15% 16%
South West 7,100 70% 15% 15%
East Midlands 5,100 79% 8% 13%
West Midlands 6,900 80% 7% 13%
Yorkshire and Humber 6,100 83% 7% 11%
North West 8,900 86% 6% 8%
North East 3,700 89% 5% 7%
Source: NIESR calculations based on Skills for Care data (March 2017)
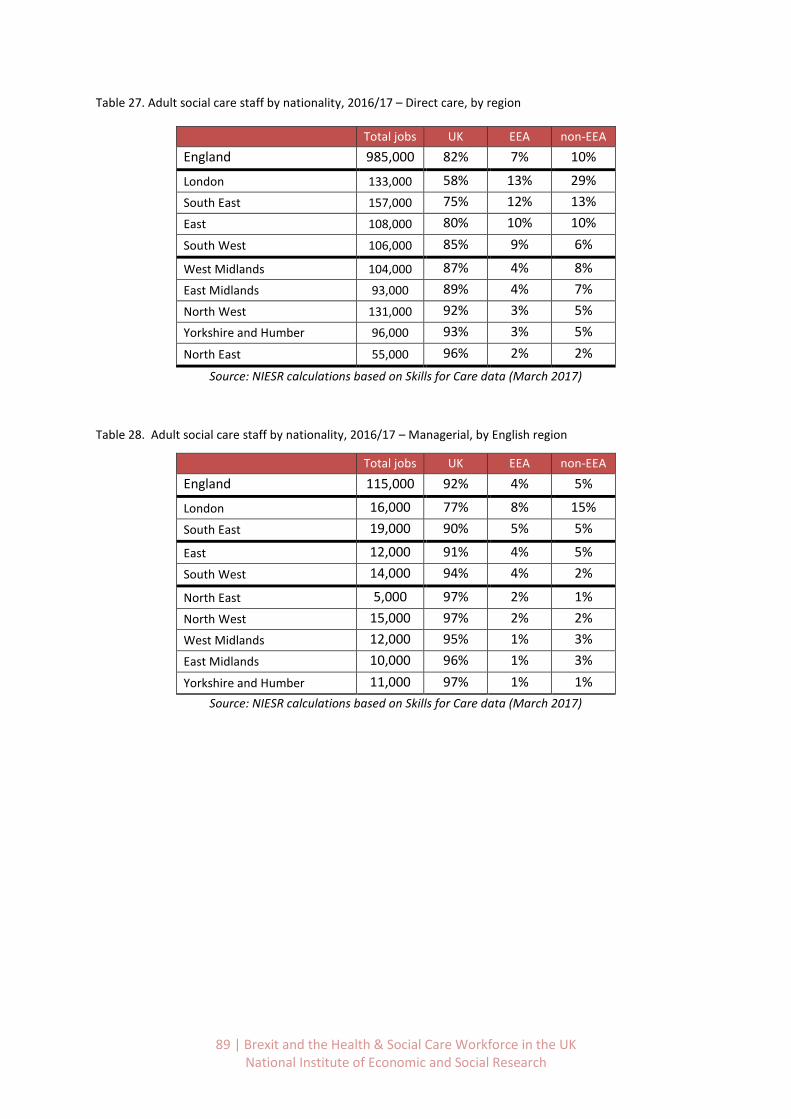
89 | Brexit and the Health & Social Care Workforce in the UK National Institute of Economic and Social Research
Table 27. Adult social care staff by nationality, 2016/17 – Direct care, by region
Total jobs UK EEA non-EEA
England 985,000 82% 7% 10%
London 133,000 58% 13% 29%
South East 157,000 75% 12% 13%
East 108,000 80% 10% 10%
South West 106,000 85% 9% 6%
West Midlands 104,000 87% 4% 8%
East Midlands 93,000 89% 4% 7%
North West 131,000 92% 3% 5%
Yorkshire and Humber 96,000 93% 3% 5%
North East 55,000 96% 2% 2%
Source: NIESR calculations based on Skills for Care data (March 2017)
Table 28. Adult social care staff by nationality, 2016/17 – Managerial, by English region
Total jobs UK EEA non-EEA
England 115,000 92% 4% 5%
London 16,000 77% 8% 15%
South East 19,000 90% 5% 5%
East 12,000 91% 4% 5%
South West 14,000 94% 4% 2%
North East 5,000 97% 2% 1%
North West 15,000 97% 2% 2%
West Midlands 12,000 95% 1% 3%
East Midlands 10,000 96% 1% 3%
Yorkshire and Humber 11,000 97% 1% 1%
Source: NIESR calculations based on Skills for Care data (March 2017)

90 | Brexit and the Health & Social Care Workforce in the UK National Institute of Economic and Social Research
Across English regions, trends in nationality shares of the adult social care workforce have been
remarkably similar qualitatively since 2012/13 (Figure 40).
Increases in the shares of EEA nationals have been balanced by decreases in shares of non-EEA
nationals. However, the magnitudes of these increases are much larger in London, and somewhat
larger in the South East, East and South West than in the northern regions.
In London, the share of EEA nationals in the adult social care workforce went from 9% in 2012/13 to
13% in 2016/17, while the share of non-EEA nationals decreased from 35% to 26% over the same
period. In contrast, the share of UK nationals employed in adult social care has been quite stable
over this time period, except in London, where it declined from 56% to 61%.
Figure 40. Trends in adult social care workforce by nationality and region - shares
Source: NIESR calculations based on Skills for Care data (March 2017)
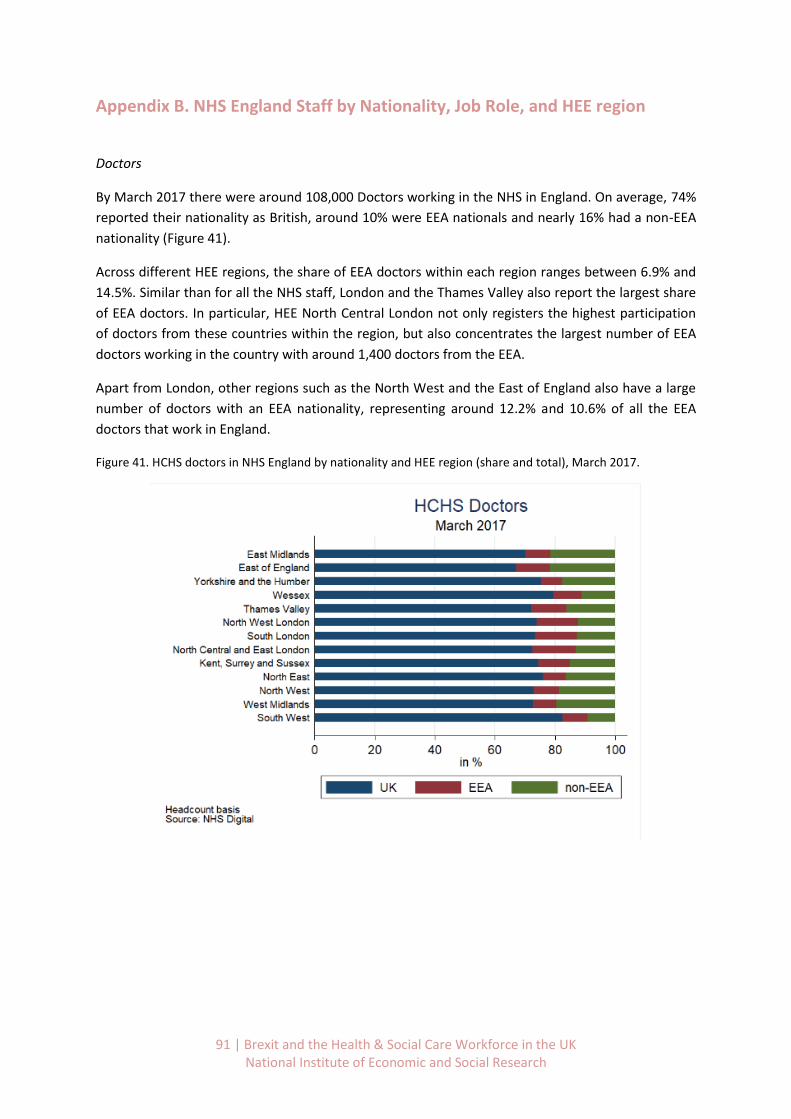
91 | Brexit and the Health & Social Care Workforce in the UK National Institute of Economic and Social Research
Appendix B. NHS England Staff by Nationality, Job Role, and HEE region
Doctors
By March 2017 there were around 108,000 Doctors working in the NHS in England. On average, 74%
reported their nationality as British, around 10% were EEA nationals and nearly 16% had a non-EEA
nationality (Figure 41).
Across different HEE regions, the share of EEA doctors within each region ranges between 6.9% and
14.5%. Similar than for all the NHS staff, London and the Thames Valley also report the largest share
of EEA doctors. In particular, HEE North Central London not only registers the highest participation
of doctors from these countries within the region, but also concentrates the largest number of EEA
doctors working in the country with around 1,400 doctors from the EEA.
Apart from London, other regions such as the North West and the East of England also have a large
number of doctors with an EEA nationality, representing around 12.2% and 10.6% of all the EEA
doctors that work in England.
Figure 41. HCHS doctors in NHS England by nationality and HEE region (share and total), March 2017.

92 | Brexit and the Health & Social Care Workforce in the UK National Institute of Economic and Social Research
Midwives
Around 24,000 midwives worked in the English NHS by March 2017. Over 90% of these had a British
nationality, while around 6% reported being from another EEA country (Figure 42).
While for most HEE regions the participation of EEA midwives within each region remains below the
national average, in London the presence of midwives from these countries represents up to 20% of
all the midwives working in the area.
In total, around 750 EEA midwives work in the three London HEE areas, which represents more than
half of all the midwives with an EEA nationality that work in England.
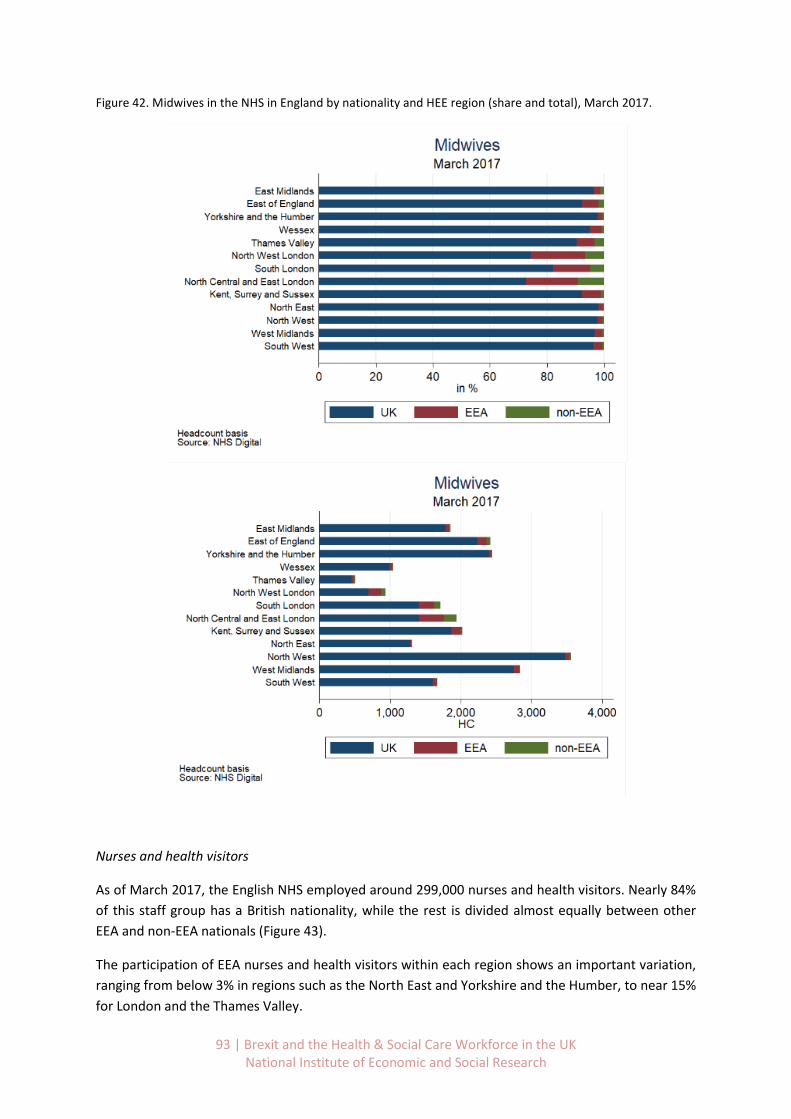
93 | Brexit and the Health & Social Care Workforce in the UK National Institute of Economic and Social Research
Figure 42. Midwives in the NHS in England by nationality and HEE region (share and total), March 2017.
Nurses and health visitors
As of March 2017, the English NHS employed around 299,000 nurses and health visitors. Nearly 84%
of this staff group has a British nationality, while the rest is divided almost equally between other
EEA and non-EEA nationals (Figure 43).
The participation of EEA nurses and health visitors within each region shows an important variation,
ranging from below 3% in regions such as the North East and Yorkshire and the Humber, to near 15%
for London and the Thames Valley.

94 | Brexit and the Health & Social Care Workforce in the UK National Institute of Economic and Social Research
In total, the number of EEA nurses and health visitors working in London reaches almost 7,600,
equivalent to one third of nurses with an EEA nationality working in England.
Other regions that have a relatively large proportion of nurses from EEA countries are the East of
England and Kent Surrey and Sussex. In these two regions, there were reported around 2,900 and
2,300 EEA nurses and health visitors, respectively. In total, the nurses and health visitors from both
regions represent around 23% of the total EEA nationals from these occupations that work in
England.
Figure 43. Nurses and health visitors by Nationality and HEE Region, March 2017.
95 | Brexit and the Health & Social Care Workforce in the UK National Institute of Economic and Social Research
Scientific, therapeutic & technical staff
As of March 2017 there are nearly 143,000 NHS workers in scientific, therapeutic and technical roles.
More than 90% of this staff group is British, followed by 5% EEA nationals and 4% non-EEA nationals
(Figure 44).
Similar to other occupations London presents a higher participation of EEA workers within the
region, with around 11% of the workforce in scientific, therapeutic and technical roles reporting an
EEA nationality.
The EEA nationals working in London for scientific, therapeutic and technical staff add up to almost
2,900 workers, which represents 38.4% of EEA nationals in this staff category that work in England.
Other regions that concentrate a substantial number of EEA scientific, therapeutic and technical staff
are the North West and the East of England, with 800 and 700 workers that reported an EEA
nationality, respectively. The total for the two regions is equivalent to 20.3% of all the EEA staff
working in the country for the analysed occupations.

96 | Brexit and the Health & Social Care Workforce in the UK National Institute of Economic and Social Research
Figure 44. Scientific, therapeutic and technical staff in NHS England by nationality and HEE region (share and total), March 2017.

97 | Brexit and the Health & Social Care Workforce in the UK National Institute of Economic and Social Research
Support to clinical & ambulance staff
The support to clinical and ambulance staff category constitutes the largest NHS staff group in terms
of number of workers, with around 357,000 people working in these positions as of March 2017
(Figure 45).
As it was shown at the beginning of this report, the share of EEA nationals working in these roles is
generally lower than for clinical staff groups. In England, around 91% of the support to clinical staff
were reported to be British, followed by 5% non-EEA nationals and 4% EEA nationals, the lowest
share.
While London again has the largest share of EEA workers within the region (8.6% on average), it is
worth noticing that the number of non-EEA nationals working in clinical support and ambulance staff
roles in London (8,200) is almost double the number of EEA workers (4,200).
For the analysed support to clinical roles, regions such as Kent, Surrey and Sussex and the East of
England also present a share of EEA nationals within each region above the English average.
Moreover, with around 1,400 EEA workers in each of these regions, the total number of EEA workers
for the two regions is equivalent to almost 20% of all the EEA workers occupying these jobs in the
NHS.

98 | Brexit and the Health & Social Care Workforce in the UK National Institute of Economic and Social Research
Figure 45. Support to clinical and ambulance staff in NHS England by nationality and HEE region (share and total), March 2017.

99 | Brexit and the Health & Social Care Workforce in the UK National Institute of Economic and Social Research
Infrastructure support
As of March 2017, there were approximately 175,000 workers that provided infrastructure support42
in the NHS in England. Around 92% had a British nationality, while the difference was almost equally
divided between EEA and non-EEA nationals (Figure 46).
Compared with the clinical categories, the infrastructure and support staff has the lowest
participation of EEA nationals across most of the HEE regions.
Looking at individual HEE regions, Kent, Surrey and Sussex reported the largest number of EEA
nationals working in these roles. Particularly, there were 1,200 EEA workers in this region which
represented 8.5% of the infrastructure support workers within the region, and 17.1% of all the EEA
workers occupying these positions across the country.
In London, less than 8% of the infrastructure and support workers reported a nationality from an
EEA country, and a slightly higher proportion reported non-EEA nationalities.
In total, there were around 1,700 EEA infrastructure support workers in the three London HEE
regions, equivalent to almost one quarter of all the EEA nationals that worked as infrastructure
support in all the NHS in England.
42
This includes managers, central functions staff and hotel, property and estates workers.
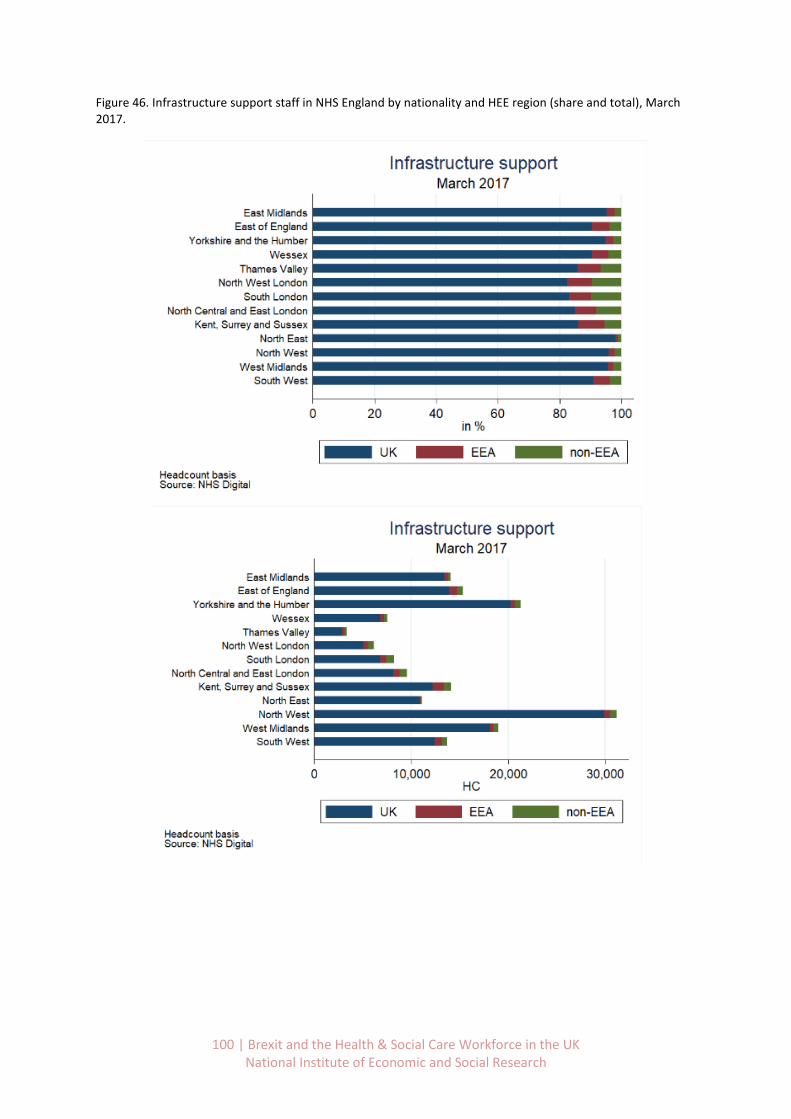
100 | Brexit and the Health & Social Care Workforce in the UK National Institute of Economic and Social Research
Figure 46. Infrastructure support staff in NHS England by nationality and HEE region (share and total), March 2017.

101 | Brexit and the Health & Social Care Workforce in the UK National Institute of Economic and Social Research
Appendix C. Joiners and leavers to NHS England before and after the
referendum, by job role and region
Doctors
Between March and June 2017, a net outflow of almost 100 doctors with an EEA nationality was
registered. Across the different HEE regions, the North West and West Midlands show the largest
net outflow of EEA doctors with a total of 25 net leavers each (Figure 47). In the North West of
England, 34 EEA doctors joined the NHS, 27.7% fewer than in the same period of 2016. Additionally,
a total of 65 leavers was reported for 2017 (Q2), 34.1% more than the year before. In the West
Midlands, the annual drop of joiners was larger (38.7% y/y change) reaching a total of 19 new EEA
doctors during Q2 2017. Also, the number of leavers arrived to 44 showing an annual increase of
18.9%.43
For the three HEE regions of London a total net outflow of 33 EEA doctors for the second quarter of
2017 was reported. On the one side, there were 155 EEA doctors that joined the NHS in these
regions, 13.9% fewer than the number reported to have joined during the same period of 2016. In
addition, a total of 188 EEA doctors were registered as having left the NHS, quite close to the 2016
figure (2.2% year-on-year increase).
In the East of England, an increase in net outflows of EEA nationals are compensated by decrease in
outflows of UK nationals and an increase in the inflows of non-EEA doctors.
In contrast, the South West reported the largest net inflow of EEA doctors, with a total of 13 doctors
between March and June of 2016. This figure contrasts with the net outflow that was reported the
year before, and results from both an increase in EEA joiners compared with 2016 (16 additional
joiners equivalent to a 76.2% y/y growth) and a drop in EEA leavers (13 fewer leavers, equivalent to
a 35.1% decrease).44
43
It is important to bear in mind that these are small sample sizes, so that it is not surprising to observe a large amount of variability in percentage terms from year to year. However the patterns observed – a decrease in EEA joiners and an increase in EEA leavers – are consistent with those in regions with larger samples. 44
The same caveat as in footnote 6 applies here.
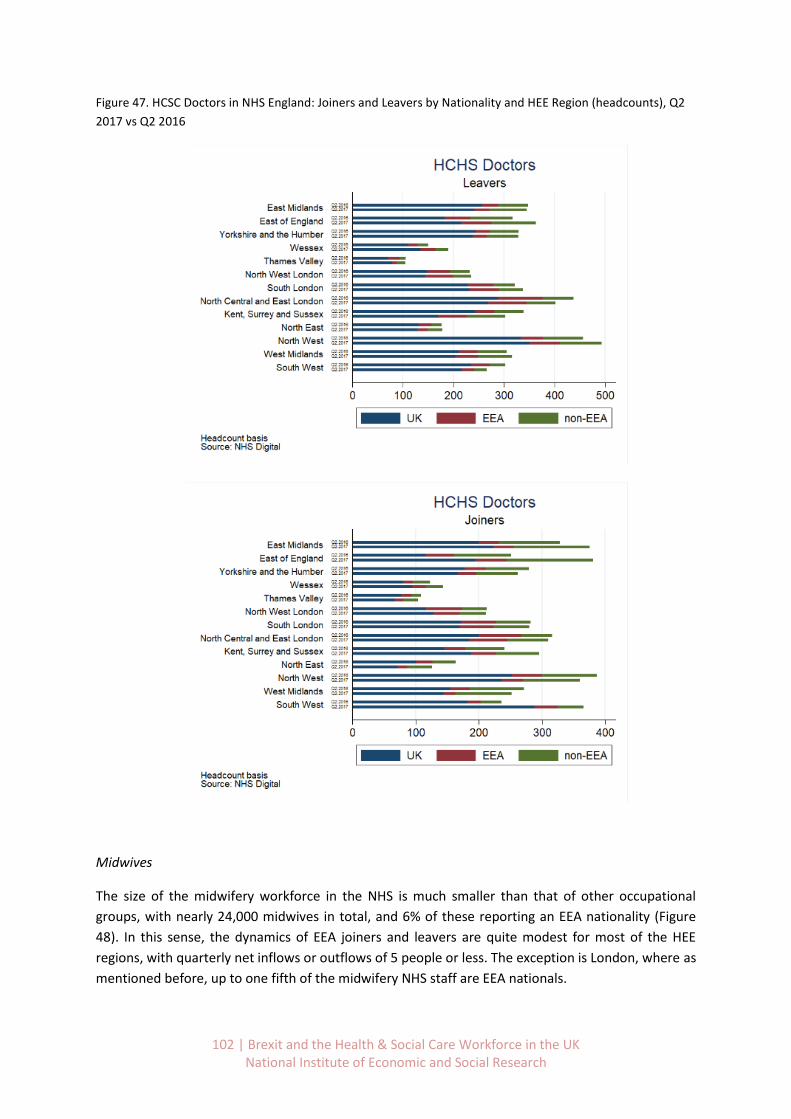
102 | Brexit and the Health & Social Care Workforce in the UK National Institute of Economic and Social Research
Figure 47. HCSC Doctors in NHS England: Joiners and Leavers by Nationality and HEE Region (headcounts), Q2
2017 vs Q2 2016
Midwives
The size of the midwifery workforce in the NHS is much smaller than that of other occupational
groups, with nearly 24,000 midwives in total, and 6% of these reporting an EEA nationality (Figure
48). In this sense, the dynamics of EEA joiners and leavers are quite modest for most of the HEE
regions, with quarterly net inflows or outflows of 5 people or less. The exception is London, where as
mentioned before, up to one fifth of the midwifery NHS staff are EEA nationals.
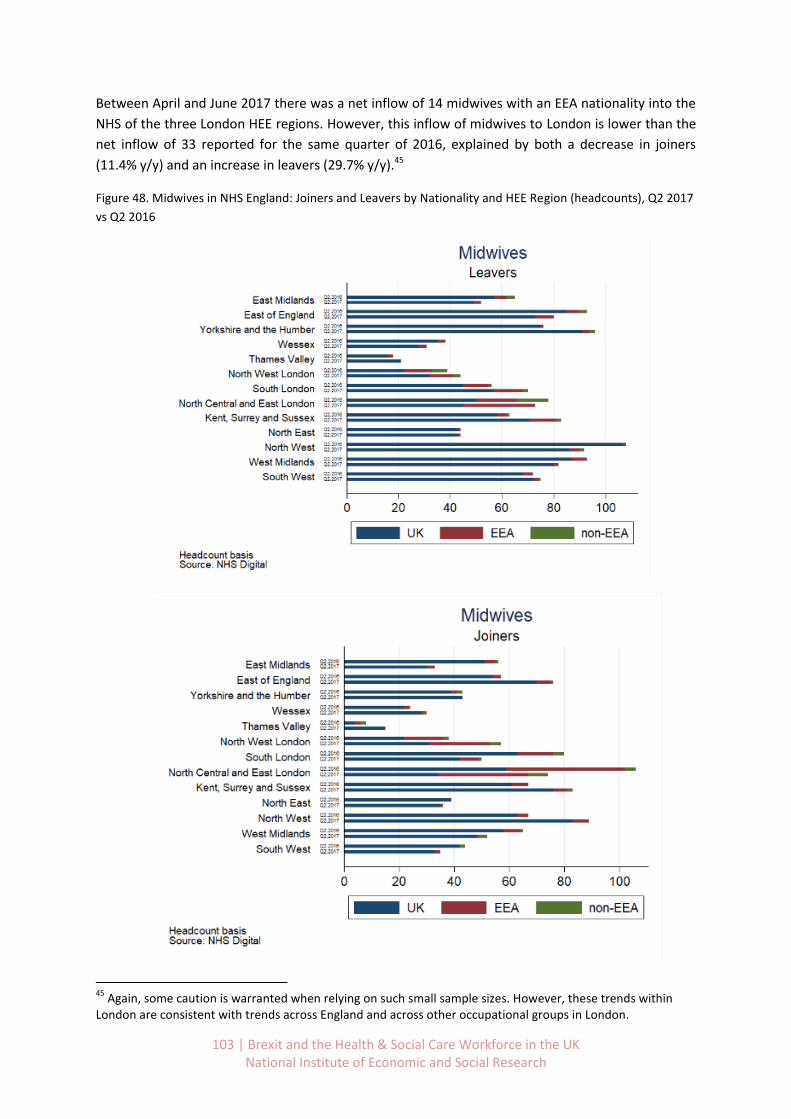
103 | Brexit and the Health & Social Care Workforce in the UK National Institute of Economic and Social Research
Between April and June 2017 there was a net inflow of 14 midwives with an EEA nationality into the
NHS of the three London HEE regions. However, this inflow of midwives to London is lower than the
net inflow of 33 reported for the same quarter of 2016, explained by both a decrease in joiners
(11.4% y/y) and an increase in leavers (29.7% y/y).45
Figure 48. Midwives in NHS England: Joiners and Leavers by Nationality and HEE Region (headcounts), Q2 2017
vs Q2 2016
45
Again, some caution is warranted when relying on such small sample sizes. However, these trends within London are consistent with trends across England and across other occupational groups in London.
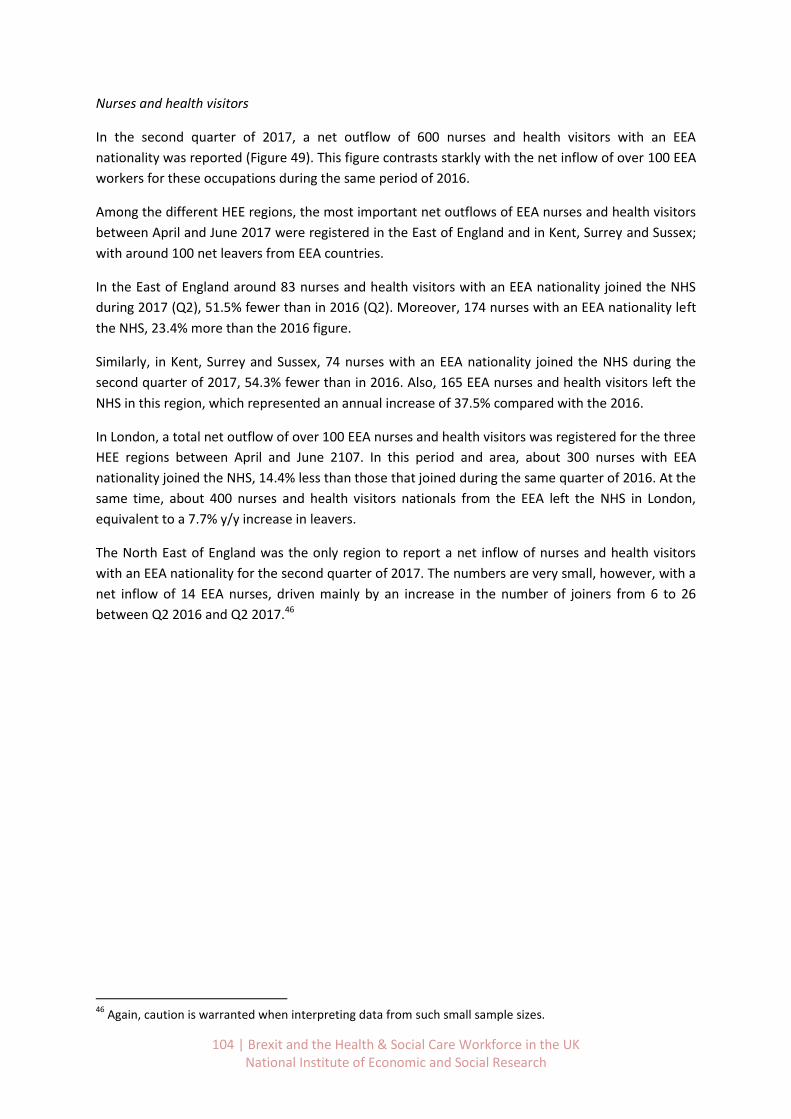
104 | Brexit and the Health & Social Care Workforce in the UK National Institute of Economic and Social Research
Nurses and health visitors
In the second quarter of 2017, a net outflow of 600 nurses and health visitors with an EEA
nationality was reported (Figure 49). This figure contrasts starkly with the net inflow of over 100 EEA
workers for these occupations during the same period of 2016.
Among the different HEE regions, the most important net outflows of EEA nurses and health visitors
between April and June 2017 were registered in the East of England and in Kent, Surrey and Sussex;
with around 100 net leavers from EEA countries.
In the East of England around 83 nurses and health visitors with an EEA nationality joined the NHS
during 2017 (Q2), 51.5% fewer than in 2016 (Q2). Moreover, 174 nurses with an EEA nationality left
the NHS, 23.4% more than the 2016 figure.
Similarly, in Kent, Surrey and Sussex, 74 nurses with an EEA nationality joined the NHS during the
second quarter of 2017, 54.3% fewer than in 2016. Also, 165 EEA nurses and health visitors left the
NHS in this region, which represented an annual increase of 37.5% compared with the 2016.
In London, a total net outflow of over 100 EEA nurses and health visitors was registered for the three
HEE regions between April and June 2107. In this period and area, about 300 nurses with EEA
nationality joined the NHS, 14.4% less than those that joined during the same quarter of 2016. At the
same time, about 400 nurses and health visitors nationals from the EEA left the NHS in London,
equivalent to a 7.7% y/y increase in leavers.
The North East of England was the only region to report a net inflow of nurses and health visitors
with an EEA nationality for the second quarter of 2017. The numbers are very small, however, with a
net inflow of 14 EEA nurses, driven mainly by an increase in the number of joiners from 6 to 26
between Q2 2016 and Q2 2017.46
46
Again, caution is warranted when interpreting data from such small sample sizes.
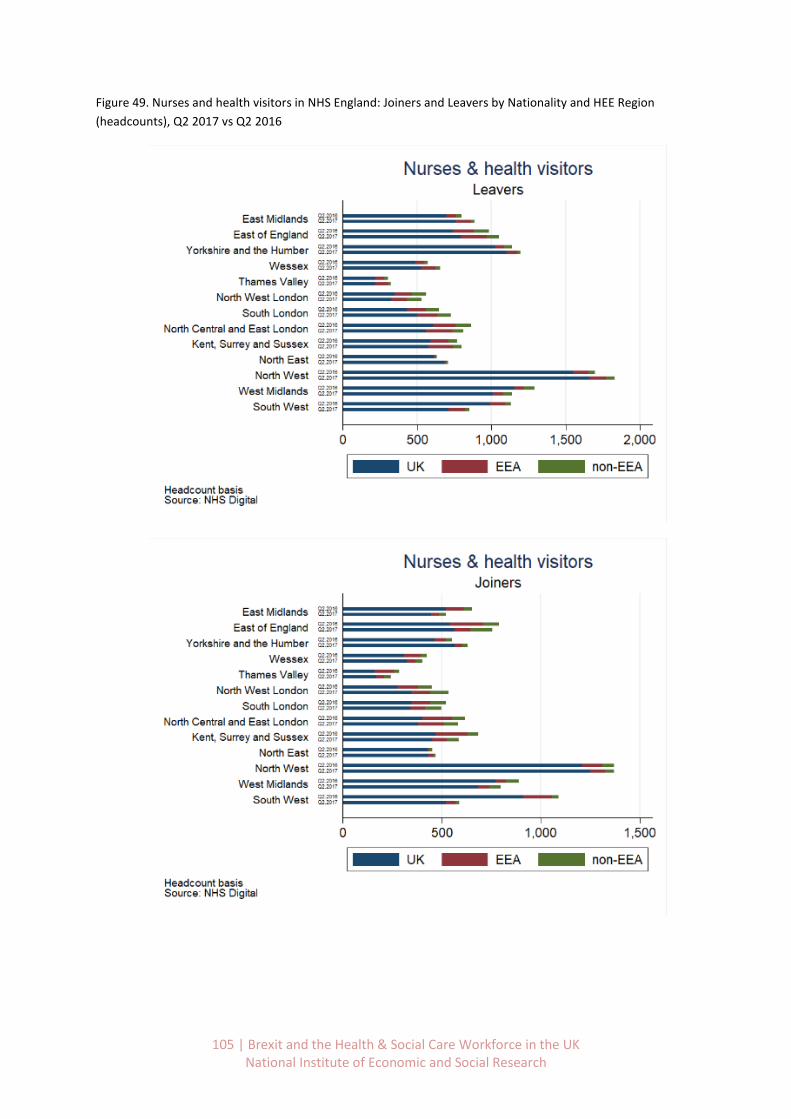
105 | Brexit and the Health & Social Care Workforce in the UK National Institute of Economic and Social Research
Figure 49. Nurses and health visitors in NHS England: Joiners and Leavers by Nationality and HEE Region
(headcounts), Q2 2017 vs Q2 2016

106 | Brexit and the Health & Social Care Workforce in the UK National Institute of Economic and Social Research
Scientific, therapeutic & technical staff
Compared with other job roles, the shares of EEA nationals in scientific, therapeutic and technical
staff is relatively low. Likewise, looking at data for the entire country, the annual change of EEA
joiners between Q2 2017 and Q2 2016 was below 3% while the increase of total EEA leavers was
around 13% (Figure 50).
In general, the sample sizes are too small to draw reliable conclusions about the changes in job flows
at a regional level for scientific, therapeutic and technical staff. We include the tables for
information only.
Figure 50. Scientific, therapeutic and technical staff in NHS England: Joiners and Leavers by Nationality and HEE
Region (headcounts), Q2 2017 vs Q2 2016
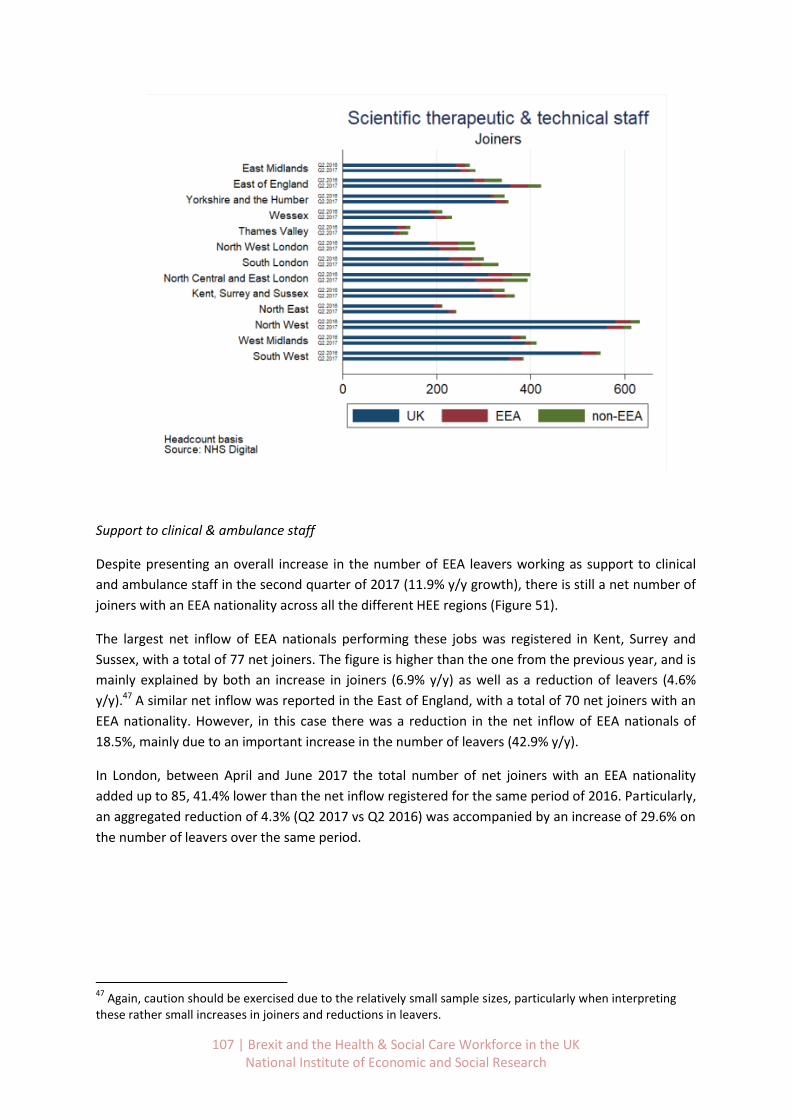
107 | Brexit and the Health & Social Care Workforce in the UK National Institute of Economic and Social Research
Support to clinical & ambulance staff
Despite presenting an overall increase in the number of EEA leavers working as support to clinical
and ambulance staff in the second quarter of 2017 (11.9% y/y growth), there is still a net number of
joiners with an EEA nationality across all the different HEE regions (Figure 51).
The largest net inflow of EEA nationals performing these jobs was registered in Kent, Surrey and
Sussex, with a total of 77 net joiners. The figure is higher than the one from the previous year, and is
mainly explained by both an increase in joiners (6.9% y/y) as well as a reduction of leavers (4.6%
y/y).47 A similar net inflow was reported in the East of England, with a total of 70 net joiners with an
EEA nationality. However, in this case there was a reduction in the net inflow of EEA nationals of
18.5%, mainly due to an important increase in the number of leavers (42.9% y/y).
In London, between April and June 2017 the total number of net joiners with an EEA nationality
added up to 85, 41.4% lower than the net inflow registered for the same period of 2016. Particularly,
an aggregated reduction of 4.3% (Q2 2017 vs Q2 2016) was accompanied by an increase of 29.6% on
the number of leavers over the same period.
47
Again, caution should be exercised due to the relatively small sample sizes, particularly when interpreting these rather small increases in joiners and reductions in leavers.

108 | Brexit and the Health & Social Care Workforce in the UK National Institute of Economic and Social Research
Figure 51. Support to clinical and ambulance staff in NHS England: Joiners and Leavers by Nationality and HEE
Region (headcounts), Q2 2017 vs Q2 2016
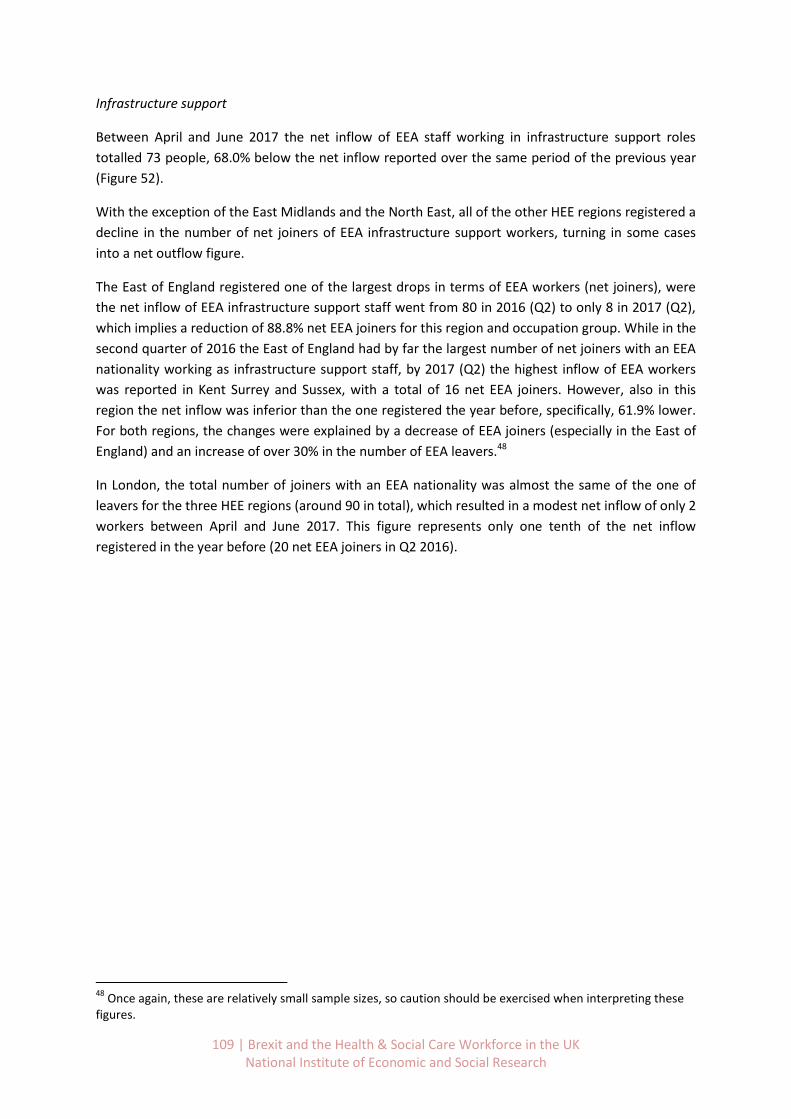
109 | Brexit and the Health & Social Care Workforce in the UK National Institute of Economic and Social Research
Infrastructure support
Between April and June 2017 the net inflow of EEA staff working in infrastructure support roles
totalled 73 people, 68.0% below the net inflow reported over the same period of the previous year
(Figure 52).
With the exception of the East Midlands and the North East, all of the other HEE regions registered a
decline in the number of net joiners of EEA infrastructure support workers, turning in some cases
into a net outflow figure.
The East of England registered one of the largest drops in terms of EEA workers (net joiners), were
the net inflow of EEA infrastructure support staff went from 80 in 2016 (Q2) to only 8 in 2017 (Q2),
which implies a reduction of 88.8% net EEA joiners for this region and occupation group. While in the
second quarter of 2016 the East of England had by far the largest number of net joiners with an EEA
nationality working as infrastructure support staff, by 2017 (Q2) the highest inflow of EEA workers
was reported in Kent Surrey and Sussex, with a total of 16 net EEA joiners. However, also in this
region the net inflow was inferior than the one registered the year before, specifically, 61.9% lower.
For both regions, the changes were explained by a decrease of EEA joiners (especially in the East of
England) and an increase of over 30% in the number of EEA leavers.48
In London, the total number of joiners with an EEA nationality was almost the same of the one of
leavers for the three HEE regions (around 90 in total), which resulted in a modest net inflow of only 2
workers between April and June 2017. This figure represents only one tenth of the net inflow
registered in the year before (20 net EEA joiners in Q2 2016).
48
Once again, these are relatively small sample sizes, so caution should be exercised when interpreting these figures.

110 | Brexit and the Health & Social Care Workforce in the UK National Institute of Economic and Social Research
Figure 52. Infrastructure support staff in NHS England: Joiners and Leavers by Nationality and HEE Region
(headcounts), Q2 2017 vs Q2 2016
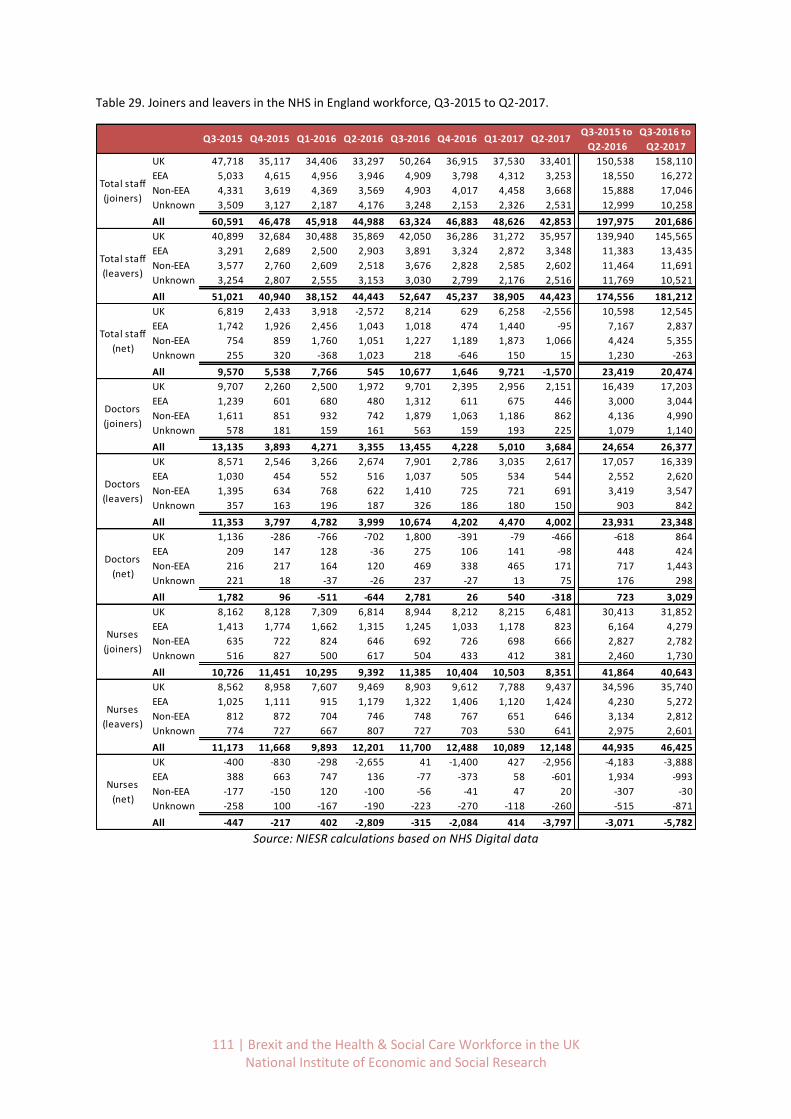
111 | Brexit and the Health & Social Care Workforce in the UK National Institute of Economic and Social Research
Table 29. Joiners and leavers in the NHS in England workforce, Q3-2015 to Q2-2017.
Source: NIESR calculations based on NHS Digital data
Q3-2015 to Q3-2016 to
Q2-2016 Q2-2017
UK 47,718 35,117 34,406 33,297 50,264 36,915 37,530 33,401 150,538 158,110
EEA 5,033 4,615 4,956 3,946 4,909 3,798 4,312 3,253 18,550 16,272
Non-EEA 4,331 3,619 4,369 3,569 4,903 4,017 4,458 3,668 15,888 17,046
Unknown 3,509 3,127 2,187 4,176 3,248 2,153 2,326 2,531 12,999 10,258
All 60,591 46,478 45,918 44,988 63,324 46,883 48,626 42,853 197,975 201,686
UK 40,899 32,684 30,488 35,869 42,050 36,286 31,272 35,957 139,940 145,565
EEA 3,291 2,689 2,500 2,903 3,891 3,324 2,872 3,348 11,383 13,435
Non-EEA 3,577 2,760 2,609 2,518 3,676 2,828 2,585 2,602 11,464 11,691
Unknown 3,254 2,807 2,555 3,153 3,030 2,799 2,176 2,516 11,769 10,521
All 51,021 40,940 38,152 44,443 52,647 45,237 38,905 44,423 174,556 181,212
UK 6,819 2,433 3,918 -2,572 8,214 629 6,258 -2,556 10,598 12,545
EEA 1,742 1,926 2,456 1,043 1,018 474 1,440 -95 7,167 2,837
Non-EEA 754 859 1,760 1,051 1,227 1,189 1,873 1,066 4,424 5,355
Unknown 255 320 -368 1,023 218 -646 150 15 1,230 -263
All 9,570 5,538 7,766 545 10,677 1,646 9,721 -1,570 23,419 20,474
UK 9,707 2,260 2,500 1,972 9,701 2,395 2,956 2,151 16,439 17,203
EEA 1,239 601 680 480 1,312 611 675 446 3,000 3,044
Non-EEA 1,611 851 932 742 1,879 1,063 1,186 862 4,136 4,990
Unknown 578 181 159 161 563 159 193 225 1,079 1,140
All 13,135 3,893 4,271 3,355 13,455 4,228 5,010 3,684 24,654 26,377
UK 8,571 2,546 3,266 2,674 7,901 2,786 3,035 2,617 17,057 16,339
EEA 1,030 454 552 516 1,037 505 534 544 2,552 2,620
Non-EEA 1,395 634 768 622 1,410 725 721 691 3,419 3,547
Unknown 357 163 196 187 326 186 180 150 903 842
All 11,353 3,797 4,782 3,999 10,674 4,202 4,470 4,002 23,931 23,348
UK 1,136 -286 -766 -702 1,800 -391 -79 -466 -618 864
EEA 209 147 128 -36 275 106 141 -98 448 424
Non-EEA 216 217 164 120 469 338 465 171 717 1,443
Unknown 221 18 -37 -26 237 -27 13 75 176 298
All 1,782 96 -511 -644 2,781 26 540 -318 723 3,029
UK 8,162 8,128 7,309 6,814 8,944 8,212 8,215 6,481 30,413 31,852
EEA 1,413 1,774 1,662 1,315 1,245 1,033 1,178 823 6,164 4,279
Non-EEA 635 722 824 646 692 726 698 666 2,827 2,782
Unknown 516 827 500 617 504 433 412 381 2,460 1,730
All 10,726 11,451 10,295 9,392 11,385 10,404 10,503 8,351 41,864 40,643
UK 8,562 8,958 7,607 9,469 8,903 9,612 7,788 9,437 34,596 35,740
EEA 1,025 1,111 915 1,179 1,322 1,406 1,120 1,424 4,230 5,272
Non-EEA 812 872 704 746 748 767 651 646 3,134 2,812
Unknown 774 727 667 807 727 703 530 641 2,975 2,601
All 11,173 11,668 9,893 12,201 11,700 12,488 10,089 12,148 44,935 46,425
UK -400 -830 -298 -2,655 41 -1,400 427 -2,956 -4,183 -3,888
EEA 388 663 747 136 -77 -373 58 -601 1,934 -993
Non-EEA -177 -150 120 -100 -56 -41 47 20 -307 -30
Unknown -258 100 -167 -190 -223 -270 -118 -260 -515 -871
All -447 -217 402 -2,809 -315 -2,084 414 -3,797 -3,071 -5,782
Total staff
(leavers)
Total staff
(net)
Doctors
(net)
Nurses
(net)
Q3-2015 Q4-2015 Q1-2016 Q2-2016 Q3-2016 Q4-2016 Q1-2017 Q2-2017
Total staff
(joiners)
Doctors
(leavers)
Doctors
(joiners)
Nurses
(leavers)
Nurses
(joiners)
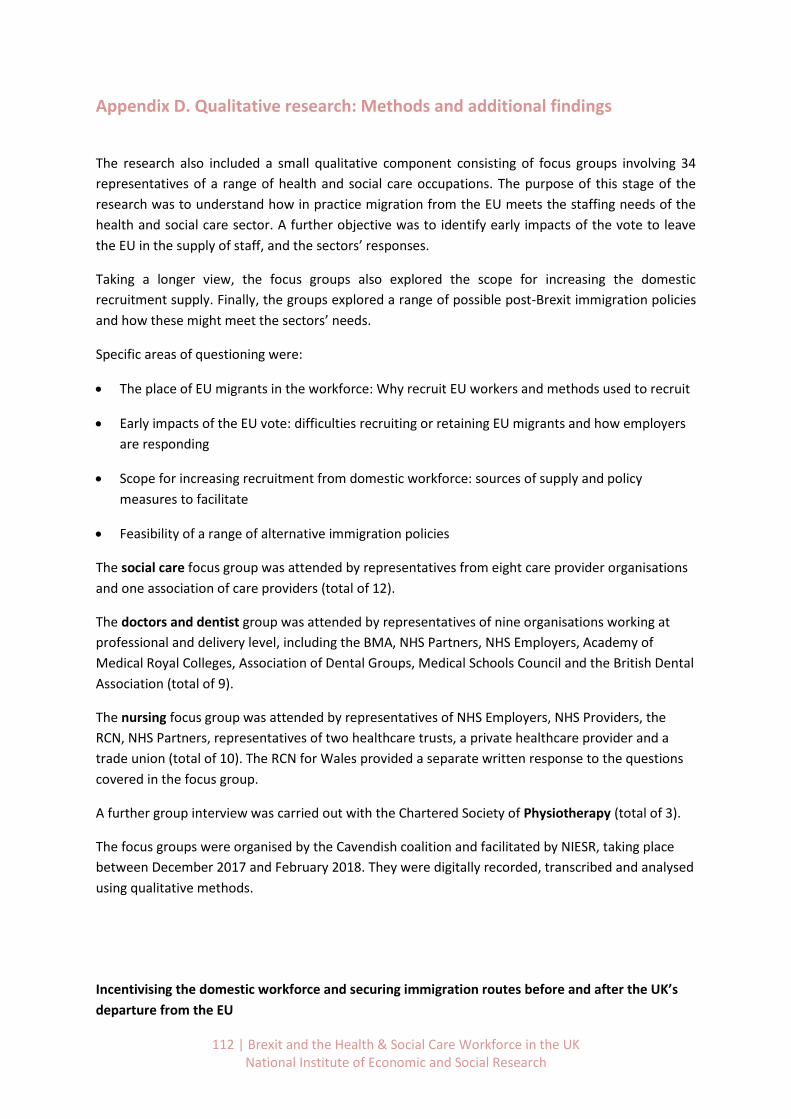
112 | Brexit and the Health & Social Care Workforce in the UK National Institute of Economic and Social Research
Appendix D. Qualitative research: Methods and additional findings
The research also included a small qualitative component consisting of focus groups involving 34
representatives of a range of health and social care occupations. The purpose of this stage of the
research was to understand how in practice migration from the EU meets the staffing needs of the
health and social care sector. A further objective was to identify early impacts of the vote to leave
the EU in the supply of staff, and the sectors’ responses.
Taking a longer view, the focus groups also explored the scope for increasing the domestic
recruitment supply. Finally, the groups explored a range of possible post-Brexit immigration policies
and how these might meet the sectors’ needs.
Specific areas of questioning were:
The place of EU migrants in the workforce: Why recruit EU workers and methods used to recruit
Early impacts of the EU vote: difficulties recruiting or retaining EU migrants and how employers
are responding
Scope for increasing recruitment from domestic workforce: sources of supply and policy
measures to facilitate
Feasibility of a range of alternative immigration policies
The social care focus group was attended by representatives from eight care provider organisations
and one association of care providers (total of 12).
The doctors and dentist group was attended by representatives of nine organisations working at
professional and delivery level, including the BMA, NHS Partners, NHS Employers, Academy of
Medical Royal Colleges, Association of Dental Groups, Medical Schools Council and the British Dental
Association (total of 9).
The nursing focus group was attended by representatives of NHS Employers, NHS Providers, the
RCN, NHS Partners, representatives of two healthcare trusts, a private healthcare provider and a
trade union (total of 10). The RCN for Wales provided a separate written response to the questions
covered in the focus group.
A further group interview was carried out with the Chartered Society of Physiotherapy (total of 3).
The focus groups were organised by the Cavendish coalition and facilitated by NIESR, taking place
between December 2017 and February 2018. They were digitally recorded, transcribed and analysed
using qualitative methods.
Incentivising the domestic workforce and securing immigration routes before and after the UK’s
departure from the EU

113 | Brexit and the Health & Social Care Workforce in the UK National Institute of Economic and Social Research
Focus Group Discussion Guide
Timing overview
10:30 – 10.35 Arrival, consent form, tea and coffee
10.35- 10.40 [1] Introductions from NIESR and from Cavendish Coalition
10.40 – 10.50 [2] Introduction from participants on their interest in workforce issues and
immigration
10.50-11.10 [3] The place of EU migrants in the workforce: Why recruit EU workers &
methods used to recruit
11.10-11.30 [1] Early impacts of the EU vote: difficulties recruiting or retaining EU migrants
and how employers are responding
11.30-12.00 [6] Scope for increasing recruitment from domestic workforce: sources of supply
and policy measures to facilitate
12.00-12.30 [7] Feasibility of a range of alternative immigration policies
10.30 –10.35
Arrival, consent form, tea and coffee
Participants to complete consent form
10.35 – 10.40
[1] Introductions from NIESR and Cavendish Coalition
Brief project background
Research aims and objectives
Place of the focus groups within the research.
We are interested in perspective of your organisation and work you are doing on
Brexit and immigration.
Housekeeping
The session will be recorded and transcribed. The content will be accessed only
by the research team and contributions will be kept anonymous.
Introduction from Cavendish Coalition – background to the project, plans for
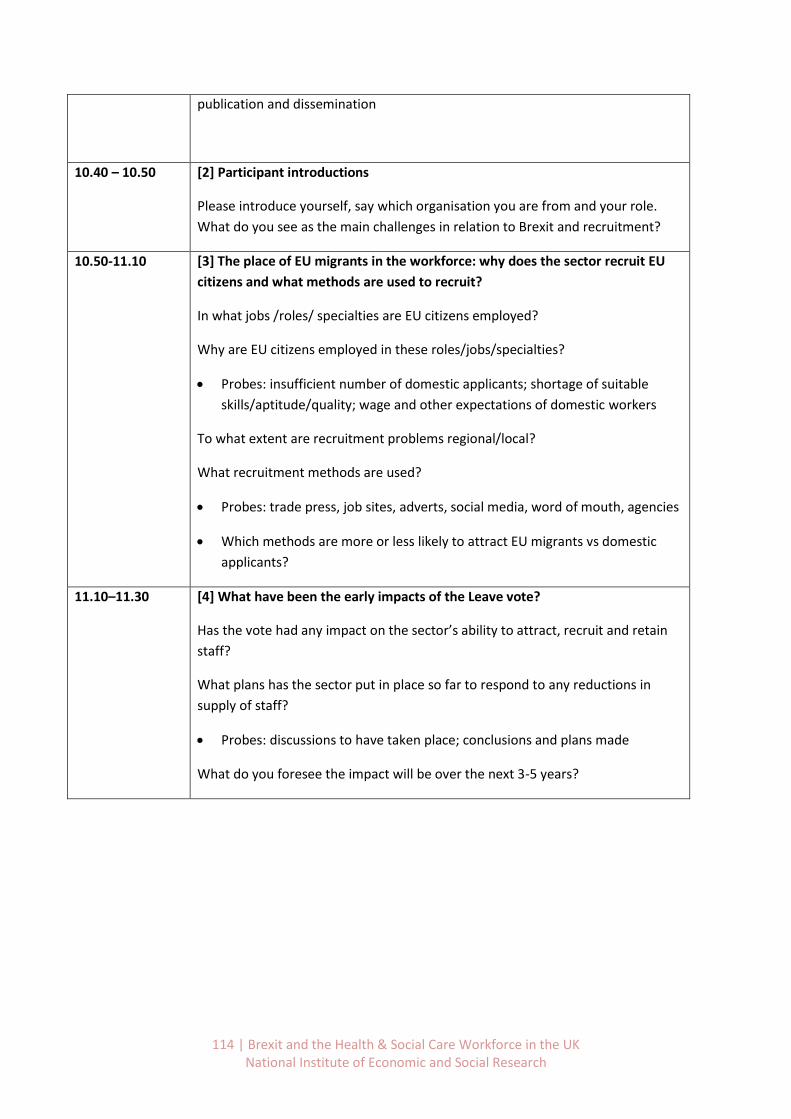
114 | Brexit and the Health & Social Care Workforce in the UK National Institute of Economic and Social Research
publication and dissemination
10.40 – 10.50 [2] Participant introductions
Please introduce yourself, say which organisation you are from and your role.
What do you see as the main challenges in relation to Brexit and recruitment?
10.50-11.10
[3] The place of EU migrants in the workforce: why does the sector recruit EU
citizens and what methods are used to recruit?
In what jobs /roles/ specialties are EU citizens employed?
Why are EU citizens employed in these roles/jobs/specialties?
Probes: insufficient number of domestic applicants; shortage of suitable
skills/aptitude/quality; wage and other expectations of domestic workers
To what extent are recruitment problems regional/local?
What recruitment methods are used?
Probes: trade press, job sites, adverts, social media, word of mouth, agencies
Which methods are more or less likely to attract EU migrants vs domestic
applicants?
11.10–11.30 [4] What have been the early impacts of the Leave vote?
Has the vote had any impact on the sector’s ability to attract, recruit and retain
staff?
What plans has the sector put in place so far to respond to any reductions in
supply of staff?
Probes: discussions to have taken place; conclusions and plans made
What do you foresee the impact will be over the next 3-5 years?

115 | Brexit and the Health & Social Care Workforce in the UK National Institute of Economic and Social Research
11.30 – 12.00 [6] What is the scope for increasing recruitment from the domestic workforce?
What alternatives does your sector have to recruiting EU migrants?
Probes: domestic workforce as appropriate: older employees, unemployed &
inactive people, private practitioners, women returners
What measures could the sector take to improve the flow of domestic recruits?
Probes: expand/improve training, improve reward package/contracts,
improve working conditions, improve sector image, improve knowledge of
sector and opportunities, improve career paths
Could any other measures be taken to deal with any skills/labour shortages?
Probes: automation, reorganisation of services…….
12.00- 12.30 [7] What immigration policies would be feasible for the sector once the UK
leaves the EU?
How important is it for the sector to continue to access EU citizens post-Brexit?
Does it accept that there will be some controls?
What controls could the sector work with?
Probes for highly skilled: expansion of existing Tier 2 or other type of
scheme?
Probes for sectors/occupations not covered by existing Tier 2: Would the
following work?
o a sector based scheme
o quotas
o regional quotas
o temporary visas
o job offer before entry to the UK
o Priority to EU citizens or greater parity between EU and non-EU
New immigration policies may place more administration & enforcement
responsibilities on employers. What are your expectations, how do you think
employers in your sector will cope with new requirements?
116 | Brexit and the Health & Social Care Workforce in the UK National Institute of Economic and Social Research
Brexit and employment in the social care sector
Recruitment to the social care sector
The sector has historically had recruitment difficulties which are being exacerbated by Brexit. There
has been no Brexit committee impact assessment for health or social care, which employers see as
reflecting the lack of importance attached to the sector.
Recruitment from inside and outside the EU has been important in meeting skill shortages which
have been of long-standing. There are large regional variations in recruitment difficulty and,
consequently proportion of migrants in the workforce. The sector sets high standards for recruits, in
terms of personal qualities such as empathy and compassion.
There was general agreement that the social care sector needs to be made more attractive to British
workers, including young people. Better careers guidance might make young people more likely to
consider working in social care at a later stage in their lives, if not as an initial choice of career.
Training
Pay and conditions of employment are two factors which lead to recruitment difficulties. The poor
and outdated image of social care work is a further issue. However, lack of clear career pathways is a
problem, particularly access to higher level qualifications in social care.
The sector is highly fragmented and consists of a large number of small care homes, as well as large
providers. Workforce investment in training and development is restricted by constraints on funding
from local authorities. There is poor coordination in training activity, practices are poor in parts of
the sector and there are high rates of non-completion of training. Social care providers cannot
access publicly funded e learning programmes which would be valuable for the sector.
Brexit impact and response
Employers report increasing difficulty recruiting and retaining staff, particularly European care
workers. This was thought to be a consequence in the fall in the value of sterling and value of wages.
Employers report putting more resources into local recruitment than in the past. Some see potential
to recruit more older workers and have had some success with targeting this group. Some also see
scope to recruit disabled people to parts of the sector and people who have been carers within the
family. It was emphasised that the sector needs to recruit people with the right values for care work.
Employers are concerned that immigration policies post-Brexit will be more complex, bureaucratic
and costly. All had made Tier 2 applications and did not want to have to increase their use of visas.
They are not in favour of a Resident Labour Market test requiring a post to be advertised for 28 days,
since posts have to be filled more quickly. The idea that a job offer might have to be made in
advance of arrival in the UK was not seen as problematic.
117 | Brexit and the Health & Social Care Workforce in the UK National Institute of Economic and Social Research
Appendix E. Regression analysis of trends in NHS in England hospital waiting
times
Waiting times as a measure of quality
In an early study of the NHS, Culis and Jones (1986, p.250) comment that “Waiting time matters
because the value of the good or service decays the longer it is delivered after order day”. Similarly,
in a more recent international review of policy options to reduce waiting times, Kreindler (2010, p.7)
states that “Long waits for medical care are a source of dissatisfaction for patients, the public and
policymakers”. Consequently, we use waiting times here as an indicator for the performance of NHS
hospitals, which is consistent with past targets set by the NHS itself. However, after continuously
failing to meet them they have been largely abolished in June 2015, despite evidence on their
effectiveness (Harrison & Appleby, 2009; Propper et al., 2010; Siciliani et al., 2014).49 The target is
still in place for the time that patients spend waiting to start treatment (incomplete pathways),
though recently there have been discussions to drop that too. In the present study we do not engage
in the debate on optimal waiting times and the association with health outcomes, as this is done
elsewhere.50 For our purpose it suffices to state that patients generally prefer shorter over longer
waits, and this preference can be distinguished by the type of treatment that is sought after
(Harrison & Appleby, 2009).
In the public health and health economics literature hospital waiting times have been used to study
the demand and supply of health services in the NHS (Gravelle et al., 2003; Martin et and Smith,
1999) and general findings suggest that longer waiting times lead to a decrease in demand of
services and increase in supply. Waiting times are also the key hospital quality measure in studies on
patient choice (Dawson et al., 2007) and hospital competition (Gaynor et al., 2003), in addition to
mortality rates. In a comprehensive review of waiting times as a performance measure in the NHS,
Godden and Pollock (2009) conclude that while they are the main indicator there are some
drawbacks as they cannot capture the access to health care associated with individual need. This is
supported by a study by Laudicella et al. (2012) as they can show that socio-economic status is an
important factor in access to health care where patients that are worse off in terms of levels of
education and income wait longer on average. We need to keep these in mind in the subsequent
analysis of waiting for the NHS in the UK.
Data on waiting times
NHS Digital provides a number of different waiting times and it is important to be aware of the
differences as only together they can provide a full picture (Table 30). Completed pathways, or
49
However, while official waiting time decreased initially as the targets were set, the overall waiting time did not as patients waited longer before being included in the waiting list (Marques et al., 2014). 50
There seems to be some theoretical consensus that waiting times should be reduced to the point where costs exceed benefits (Hurst & Sicialiani, 2003; Schaafsma, 2006) though in practice this point can be difficult to (Harrison & Appleby, 2010). A related question is whether longer waiting times are actually associated with worse health outcomes. There is some evidence that contradict this claim, though re-admission rates can be slightly higher (Moscelli et al., 2016). Others do find some negative effects, though small in magnitude (Nikolova et al., 2016).
118 | Brexit and the Health & Social Care Workforce in the UK National Institute of Economic and Social Research
inpatient waiting times, show the full waiting times from referral to the start of the treatment.
Incomplete pathways show the waiting time of patients before starting treatment, i.e. the ‘waiting
list’. The difference between both is highlighted by Siciliani et al. (2014) who compare waiting times
across OECD countries. They conclude that waiting list times should be preferred to monitor the
performance of hospitals as it is a more ‘up-to-date’ indicator. For patients on the other hand the
completed pathways matter more as they are interested in the time it takes until their treatment
commences.51 Other dimensions to consider when looking at waiting times are the considerable
differences, not only across specialties and operative procedures, but also hospitals themselves as
they matter more than patient characteristics such as age, sex and ethnicity (Dimakou et al., 2009).
Waiting time statistics differ across countries in the UK and hence policies informed by these need to
be tailored to the specific country (Godden & Pollock, 2009). Here we focus on data from the NHS in
England as this covers the majority of hospitals in the UK and for reasons of data collection
mentioned above. The data are available for trusts and CCGs on a monthly basis for the years 2011-
2017.52 Aggregates for England as a whole date back to 2007. Due to the reporting of the data by the
NHS in England the data before April 2016 cannot be easily compiled and hence we decided to focus
on the period from April 2016 to November 2017. In Table 24 we provide some key definitions of
patient pathways that are available in the data. We focus on the mean, median and 95th percentile
as they all hold different pieces of information. While the mean and proportion of very long waiters
will be more easily understood by the general public, median times should be used for overall
representability of the data (Siciliani et al., 2014).
Table 30. Description of different patient pathways in the NHS
Pathway type Description
Incomplete pathways Waiting times for patients still waiting to start treatment at the end of the month. Published since August 2007. The NHS standard target is 92% but there are discussions to drop it.
Admitted pathways Waiting times (total time waited) for patients whose treatment started during the month and involved admission to hospital (until September 2015 adjustments were made to admitted pathways for clock pauses, where a patient had declined reasonable offers of admission and chose to wait longer). The NHS standard target was 90% but this standard was dropped on the 4. June 2015.
Non-admitted pathways Waiting times (time waited) for patients whose treatment started during the month and did not involve admission to hospital. Published since August 2007. The NHS standard target was 95% but this standard was dropped on the 4. June 2015.
51
In practice one can also be used to approximate the other (Dixon & Siciliani, 2009). 52
https://www.england.nhs.uk/statistics/statistical-work-areas/rtt-waiting-times/

119 | Brexit and the Health & Social Care Workforce in the UK National Institute of Economic and Social Research
Waiting times in the NHS
This section will explore the hospital waiting times based on patient pathways in different UK
countries. After looking at general hospital waiting times for patients that are admitted for
treatment and those still on the waiting list we will examine AE waiting times. Finally, we conduct a
statistical analysis of hospital staff turnover and nationality and hospital waiting times in England.
Waiting times in England
NHS England publishes several patient Referral to Treatment (RTT) pathways. Admitted pathways
(inpatient waiting times), show the full waiting times from referral to the start of the treatment. The
NHS standard target of 90% of patients waiting less than 18 weeks was dropped in June 2015. On the
other hand, incomplete pathways show the waiting time of patients before starting treatment, i.e.
the ‘waiting list’ or ‘inpatient’ waiting times. The official target is to have 92% of patients on the
waiting list for less than 18 weeks, though there are discussions to drop it. The difference between
both pathways is highlighted by Siciliani et al. (2014) who compare waiting times across OECD
countries. They conclude that waiting list times (incomplete pathways) should be preferred to
monitor the performance of hospitals as it is a more ‘up-to-date’ indicator. For patients on the other
hand the admitted pathways matter more as they are interested in the time it takes until their
treatment commences.53 Finally there are also non-admitted pathways, referring to the waiting time
for patients whose treatment started during the month and did not involve admission to hospital.
These are also referred to as outpatients and the official target of 95% of patients seen within 18
weeks has been dropped in June 2015.
In Figure 53 and Figure 54 we plot the incomplete and admitted RTT pathways by different waiting
time bands. For incomplete pathways, i.e. the time patients are spending from referral to treatment
but before starting treatment, it is clear that the “waiting list” is getting longer in recent years. By
January 2018 around 88% of patients started treatment in less than 18 weeks, well below the official
target of 92%. In 2013 the share was still above 94%, though it has been steadily declining since
then. Regarding admitted pathways, i.e. waiting times of patients that started treatment after all,
the picture is similar. In January 2018 the share of patients waiting less than 18 weeks was close to
76% and hence also well below the previous target of 90% which was last met in December 2012.
Since then the share was declining continuously and more rapidly since 2015.
53
In practice one can also be used to approximate the other (Dixon & Siciliani, 2009).
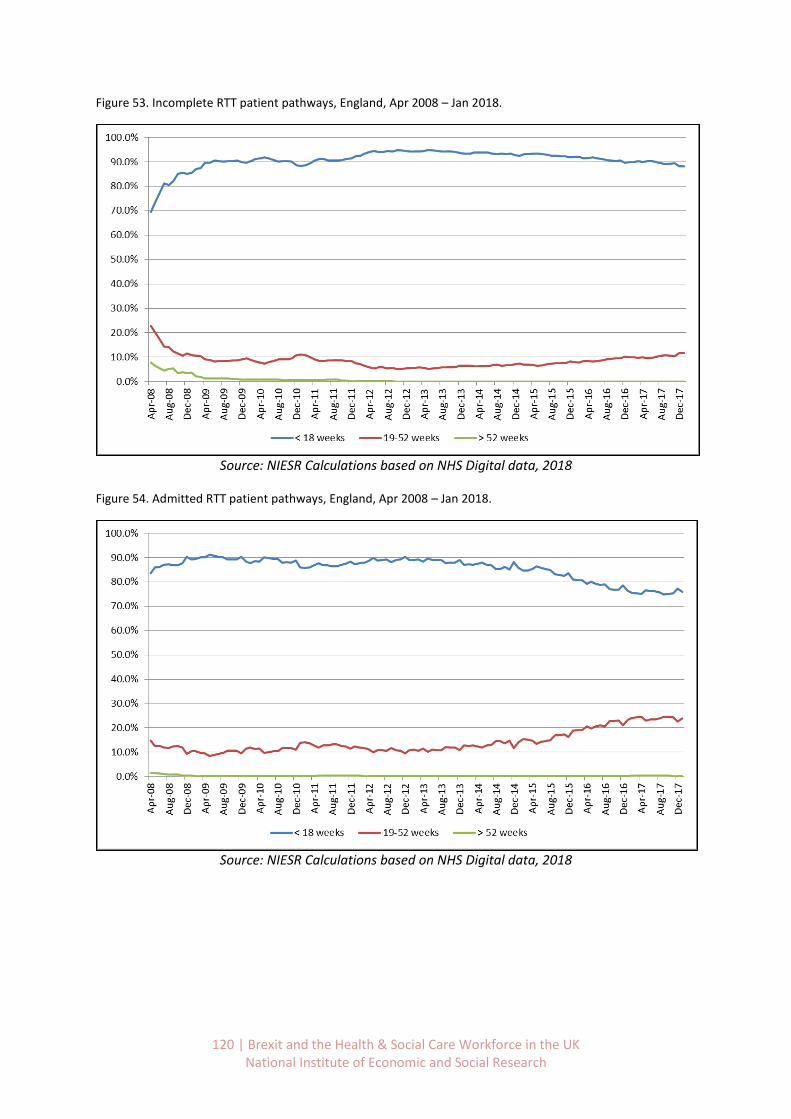
120 | Brexit and the Health & Social Care Workforce in the UK National Institute of Economic and Social Research
Figure 53. Incomplete RTT patient pathways, England, Apr 2008 – Jan 2018.
Source: NIESR Calculations based on NHS Digital data, 2018
Figure 54. Admitted RTT patient pathways, England, Apr 2008 – Jan 2018.
Source: NIESR Calculations based on NHS Digital data, 2018
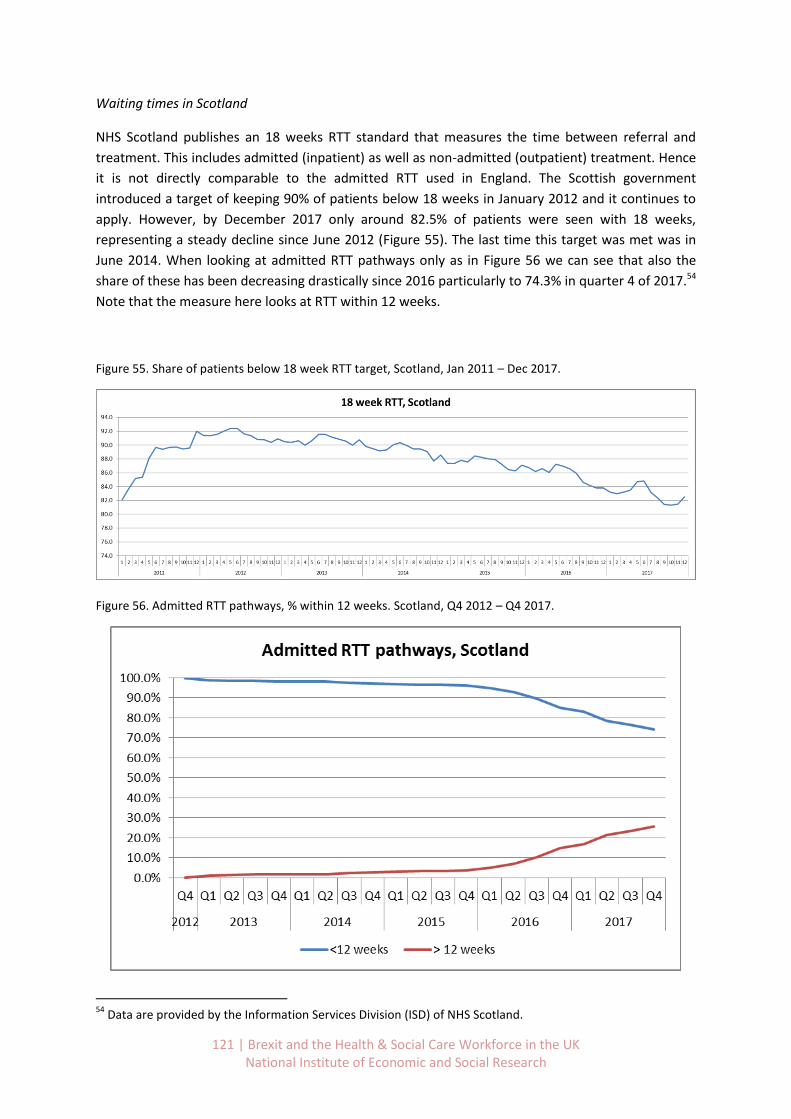
121 | Brexit and the Health & Social Care Workforce in the UK National Institute of Economic and Social Research
Waiting times in Scotland
NHS Scotland publishes an 18 weeks RTT standard that measures the time between referral and
treatment. This includes admitted (inpatient) as well as non-admitted (outpatient) treatment. Hence
it is not directly comparable to the admitted RTT used in England. The Scottish government
introduced a target of keeping 90% of patients below 18 weeks in January 2012 and it continues to
apply. However, by December 2017 only around 82.5% of patients were seen with 18 weeks,
representing a steady decline since June 2012 (Figure 55). The last time this target was met was in
June 2014. When looking at admitted RTT pathways only as in Figure 56 we can see that also the
share of these has been decreasing drastically since 2016 particularly to 74.3% in quarter 4 of 2017.54
Note that the measure here looks at RTT within 12 weeks.
Figure 55. Share of patients below 18 week RTT target, Scotland, Jan 2011 – Dec 2017.
Figure 56. Admitted RTT pathways, % within 12 weeks. Scotland, Q4 2012 – Q4 2017.
54
Data are provided by the Information Services Division (ISD) of NHS Scotland.

122 | Brexit and the Health & Social Care Workforce in the UK National Institute of Economic and Social Research
Waiting times in Wales
NHS Wales publishes monthly figures on the number of patients that are waiting to start treatment
(pathways open) and the number of patient pathways closed. The latter includes patient pathways
treated, patient pathways who no longer wanted to be seen and deceased patient pathways, but
excludes closed patient pathways with unknown treatment start date. Data are available between
September 2012 and December 2017.
In 2017, 86% of patients waited up to 26 weeks (i.e. 6 months) to start treatment, as shown in Table
31a. Almost 10% waited between 26 and 36 weeks and the remaining 4% even more than that.
Figure 57 shows that the share of patients that are starting treatment within 26 weeks has been
declining steadily since 2012. Conversely, the number that wait longer has increased. In 2012 on
average 92.4% of patients waited less than 26 weeks, so 6.5 percentage points more than in
December 2017. Similarly, while in 2012 only 0.9% of patients had to wait more than 36 weeks, this
figure has since increased to 4.4%.
When we examine the percentage of closed patient pathways in Figure 58 and Table 31b a similar
pattern of longer waiting times arises. Overall in 2017 76.5% of pathways were closed in 6 months,
down from 82.3% in 2012.
Figure 57. Percentage of patient pathways waiting to start treatment by month and grouped weeks, Wales.
Source: NHS Wales Informatics Services (NWIS)
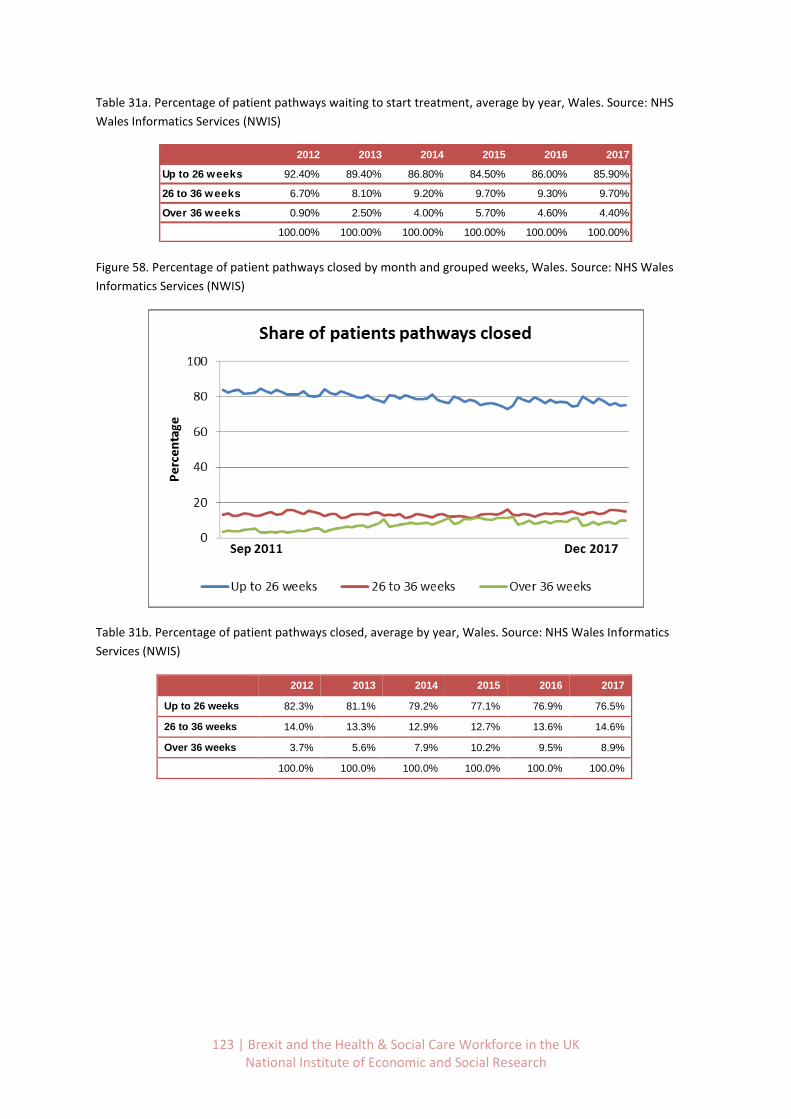
123 | Brexit and the Health & Social Care Workforce in the UK National Institute of Economic and Social Research
Table 31a. Percentage of patient pathways waiting to start treatment, average by year, Wales. Source: NHS
Wales Informatics Services (NWIS)
Figure 58. Percentage of patient pathways closed by month and grouped weeks, Wales. Source: NHS Wales
Informatics Services (NWIS)
Table 31b. Percentage of patient pathways closed, average by year, Wales. Source: NHS Wales Informatics
Services (NWIS)
2012 2013 2014 2015 2016 2017
Up to 26 weeks 92.40% 89.40% 86.80% 84.50% 86.00% 85.90%
26 to 36 weeks 6.70% 8.10% 9.20% 9.70% 9.30% 9.70%
Over 36 weeks 0.90% 2.50% 4.00% 5.70% 4.60% 4.40%
100.00% 100.00% 100.00% 100.00% 100.00% 100.00%
2012 2013 2014 2015 2016 2017
Up to 26 weeks 82.3% 81.1% 79.2% 77.1% 76.9% 76.5%
26 to 36 weeks 14.0% 13.3% 12.9% 12.7% 13.6% 14.6%
Over 36 weeks 3.7% 5.6% 7.9% 10.2% 9.5% 8.9%
100.0% 100.0% 100.0% 100.0% 100.0% 100.0%

124 | Brexit and the Health & Social Care Workforce in the UK National Institute of Economic and Social Research
Waiting times in Northern Ireland
Northern Ireland collects and reports data on inpatient and outpatient waiting times.55 For
outpatients the states target is that 50% of patients should not have to wait longer than 9 weeks for
their first appointment. For inpatients the country has set the target that 55% of patients should not
wait more than 13 weeks for inpatient or day case treatment. At no point should a patient wait more
than 52 weeks (12 months) and these targets are to be achieved by March 2018.
Based on data from the Department of Health we can compute the inpatient waiting times by time
bands. Based on Figure 59 we can see that the share of patients that is waiting more than 26 weeks
(6 months) is increasing for the first time in 2010 from close to 0% of patients to almost 20% in 2011.
After a decrease to 10% until mid-2014 the share is rising again consistently until the last quarter in
2017. Most recently it exceeded 40% of patients waiting more than half a year from the date of
decision to be admitted to hospital. At the same time the share of patients waiting less than 13
weeks (the official target) is declining from 2010 onwards (Figure 60). While the figure was close to
100% in the beginning 2009 it has declined to 39% by the last quarter of 2017. The current official
target (red line in Figure 60) would have been last met in quarter 4 of 2014.56
Figure 59. Inpatient waiting times by share of total patients and time bands, Northern Ireland. Source:
Calculations based on data from Northern Ireland Department of Health.
55
Inpatients are patients that are admitted to hospital and require at least 1 overnight stay. It can include day case admissions if the patient needs to stay overnight. Inpatient waiting times start from the day the clinician decided to admit the patient. An outpatient appointment enables a patient to see a consultant or member of their team. Outpatient waiters are still waiting for this first appointment at the end of the quarter. Source: Northern Ireland Department of Health, February 2018. 56
All underlying data have been computed based on the most recent release of the Northern Ireland Department of Health Inpatient Waiting Times Dataset on the 22
nd February 2018 (see Table 32).
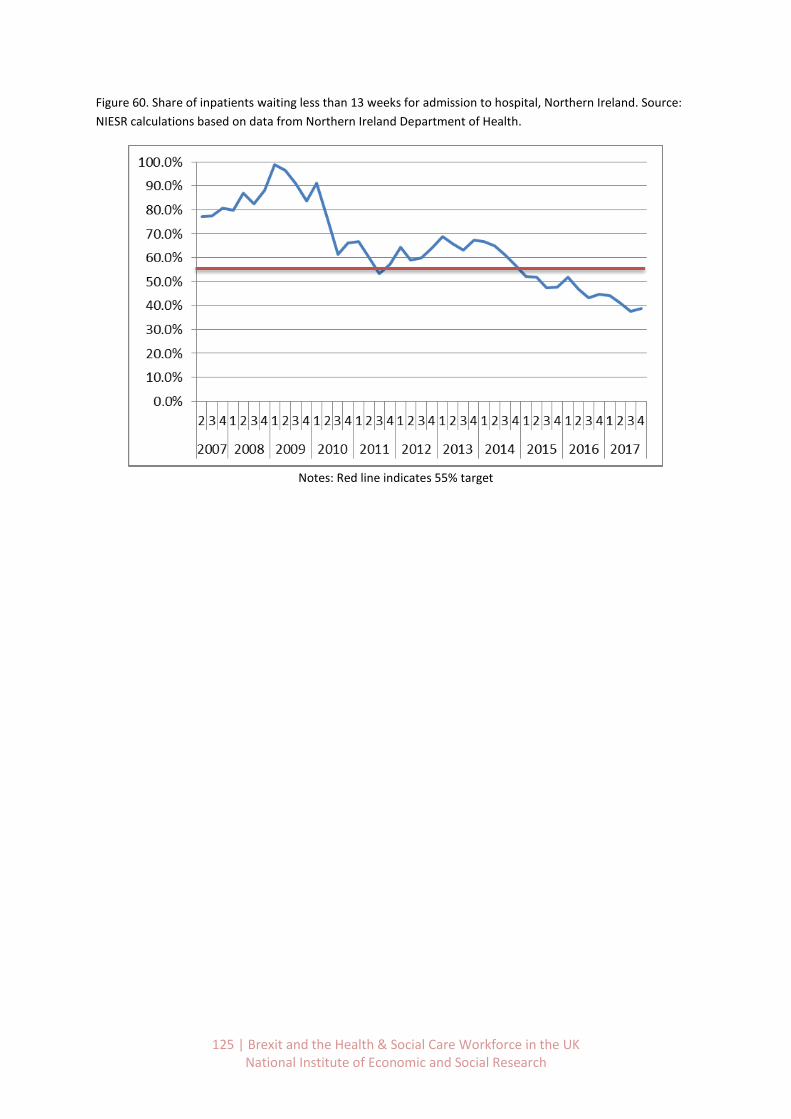
125 | Brexit and the Health & Social Care Workforce in the UK National Institute of Economic and Social Research
Figure 60. Share of inpatients waiting less than 13 weeks for admission to hospital, Northern Ireland. Source:
NIESR calculations based on data from Northern Ireland Department of Health.
Notes: Red line indicates 55% target
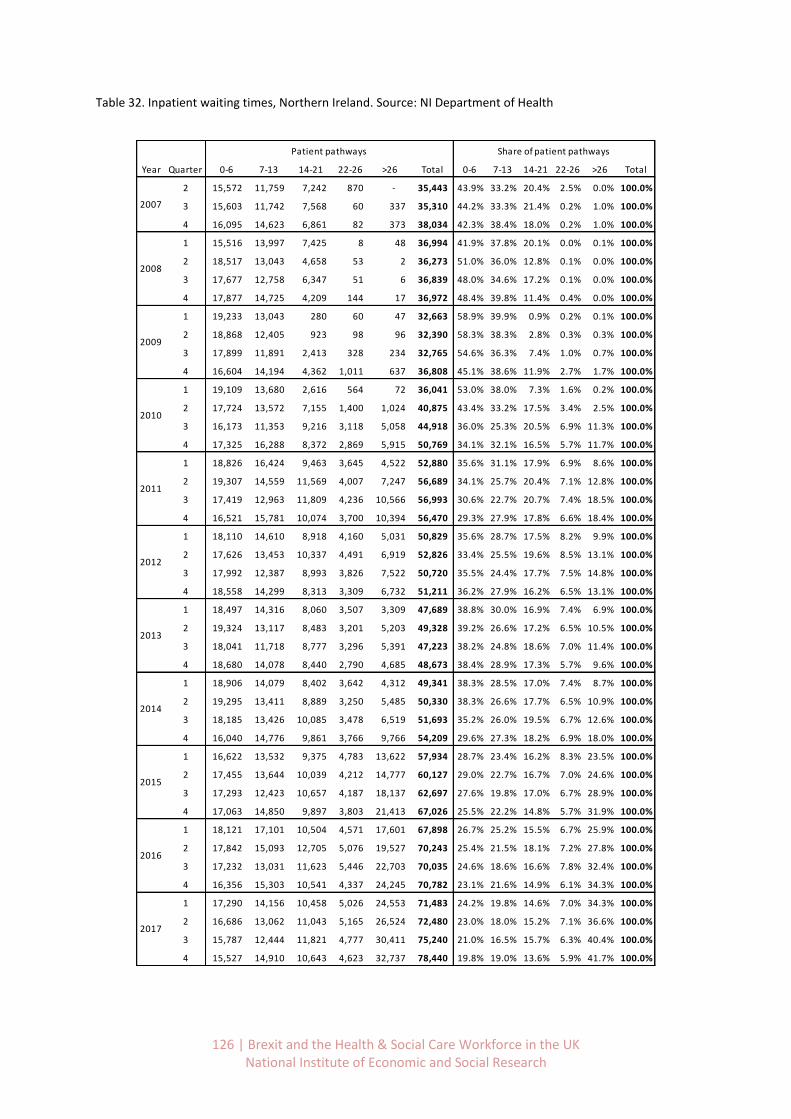
126 | Brexit and the Health & Social Care Workforce in the UK National Institute of Economic and Social Research
Table 32. Inpatient waiting times, Northern Ireland. Source: NI Department of Health
0-6 7-13 14-21 22-26 >26 Total 0-6 7-13 14-21 22-26 >26 Total
2 15,572 11,759 7,242 870 - 35,443 43.9% 33.2% 20.4% 2.5% 0.0% 100.0%
3 15,603 11,742 7,568 60 337 35,310 44.2% 33.3% 21.4% 0.2% 1.0% 100.0%
4 16,095 14,623 6,861 82 373 38,034 42.3% 38.4% 18.0% 0.2% 1.0% 100.0%
1 15,516 13,997 7,425 8 48 36,994 41.9% 37.8% 20.1% 0.0% 0.1% 100.0%
2 18,517 13,043 4,658 53 2 36,273 51.0% 36.0% 12.8% 0.1% 0.0% 100.0%
3 17,677 12,758 6,347 51 6 36,839 48.0% 34.6% 17.2% 0.1% 0.0% 100.0%
4 17,877 14,725 4,209 144 17 36,972 48.4% 39.8% 11.4% 0.4% 0.0% 100.0%
1 19,233 13,043 280 60 47 32,663 58.9% 39.9% 0.9% 0.2% 0.1% 100.0%
2 18,868 12,405 923 98 96 32,390 58.3% 38.3% 2.8% 0.3% 0.3% 100.0%
3 17,899 11,891 2,413 328 234 32,765 54.6% 36.3% 7.4% 1.0% 0.7% 100.0%
4 16,604 14,194 4,362 1,011 637 36,808 45.1% 38.6% 11.9% 2.7% 1.7% 100.0%
1 19,109 13,680 2,616 564 72 36,041 53.0% 38.0% 7.3% 1.6% 0.2% 100.0%
2 17,724 13,572 7,155 1,400 1,024 40,875 43.4% 33.2% 17.5% 3.4% 2.5% 100.0%
3 16,173 11,353 9,216 3,118 5,058 44,918 36.0% 25.3% 20.5% 6.9% 11.3% 100.0%
4 17,325 16,288 8,372 2,869 5,915 50,769 34.1% 32.1% 16.5% 5.7% 11.7% 100.0%
1 18,826 16,424 9,463 3,645 4,522 52,880 35.6% 31.1% 17.9% 6.9% 8.6% 100.0%
2 19,307 14,559 11,569 4,007 7,247 56,689 34.1% 25.7% 20.4% 7.1% 12.8% 100.0%
3 17,419 12,963 11,809 4,236 10,566 56,993 30.6% 22.7% 20.7% 7.4% 18.5% 100.0%
4 16,521 15,781 10,074 3,700 10,394 56,470 29.3% 27.9% 17.8% 6.6% 18.4% 100.0%
1 18,110 14,610 8,918 4,160 5,031 50,829 35.6% 28.7% 17.5% 8.2% 9.9% 100.0%
2 17,626 13,453 10,337 4,491 6,919 52,826 33.4% 25.5% 19.6% 8.5% 13.1% 100.0%
3 17,992 12,387 8,993 3,826 7,522 50,720 35.5% 24.4% 17.7% 7.5% 14.8% 100.0%
4 18,558 14,299 8,313 3,309 6,732 51,211 36.2% 27.9% 16.2% 6.5% 13.1% 100.0%
1 18,497 14,316 8,060 3,507 3,309 47,689 38.8% 30.0% 16.9% 7.4% 6.9% 100.0%
2 19,324 13,117 8,483 3,201 5,203 49,328 39.2% 26.6% 17.2% 6.5% 10.5% 100.0%
3 18,041 11,718 8,777 3,296 5,391 47,223 38.2% 24.8% 18.6% 7.0% 11.4% 100.0%
4 18,680 14,078 8,440 2,790 4,685 48,673 38.4% 28.9% 17.3% 5.7% 9.6% 100.0%
1 18,906 14,079 8,402 3,642 4,312 49,341 38.3% 28.5% 17.0% 7.4% 8.7% 100.0%
2 19,295 13,411 8,889 3,250 5,485 50,330 38.3% 26.6% 17.7% 6.5% 10.9% 100.0%
3 18,185 13,426 10,085 3,478 6,519 51,693 35.2% 26.0% 19.5% 6.7% 12.6% 100.0%
4 16,040 14,776 9,861 3,766 9,766 54,209 29.6% 27.3% 18.2% 6.9% 18.0% 100.0%
1 16,622 13,532 9,375 4,783 13,622 57,934 28.7% 23.4% 16.2% 8.3% 23.5% 100.0%
2 17,455 13,644 10,039 4,212 14,777 60,127 29.0% 22.7% 16.7% 7.0% 24.6% 100.0%
3 17,293 12,423 10,657 4,187 18,137 62,697 27.6% 19.8% 17.0% 6.7% 28.9% 100.0%
4 17,063 14,850 9,897 3,803 21,413 67,026 25.5% 22.2% 14.8% 5.7% 31.9% 100.0%
1 18,121 17,101 10,504 4,571 17,601 67,898 26.7% 25.2% 15.5% 6.7% 25.9% 100.0%
2 17,842 15,093 12,705 5,076 19,527 70,243 25.4% 21.5% 18.1% 7.2% 27.8% 100.0%
3 17,232 13,031 11,623 5,446 22,703 70,035 24.6% 18.6% 16.6% 7.8% 32.4% 100.0%
4 16,356 15,303 10,541 4,337 24,245 70,782 23.1% 21.6% 14.9% 6.1% 34.3% 100.0%
1 17,290 14,156 10,458 5,026 24,553 71,483 24.2% 19.8% 14.6% 7.0% 34.3% 100.0%
2 16,686 13,062 11,043 5,165 26,524 72,480 23.0% 18.0% 15.2% 7.1% 36.6% 100.0%
3 15,787 12,444 11,821 4,777 30,411 75,240 21.0% 16.5% 15.7% 6.3% 40.4% 100.0%
4 15,527 14,910 10,643 4,623 32,737 78,440 19.8% 19.0% 13.6% 5.9% 41.7% 100.0%
2013
2014
2015
2016
2017
Share of patient pathwaysPatient pathways
Year Quarter
2007
2008
2009
2010
2011
2012

127 | Brexit and the Health & Social Care Workforce in the UK National Institute of Economic and Social Research
Statistical analysis of waiting times and nationality of hospital staff
Summary of results
Our analysis of the underlying aggregate workforce data suggests that there have been systematic
increases in EEA staff turnover, especially among nurses in the last 6 quarters. It would also seem as
if there is considerable geographical variation in this turnover.
We have also found that the data available to us on patient outcomes suggests that there has been a
deterioration of service to patients at least with respect to patient waiting times. It is natural to pose
the question whether there may be any link between these two facts. The econometric identification
of a ‘causal’ link between workforce turnover and patient outcomes is somewhat problematic as
many factors could be inducing the simultaneous co-movement of the two trends. Nonetheless,
exploiting the geographical variation of around 200 health trusts over 9 quarters we can investigate
this statistical association further.
Crucial to this identification strategy is the assumption that there is no unobserved variation in trust
turnover or performance due to systematic trust variability which is correlated with the random
error in our model. To this end we control for trust size and overall staff turnover. This arguably
enables us to identify the relationship between the share of EU leavers and waiting times over and
above that due to regular staff turnover.
It is natural to suggest that if hospital staff are turning over more quickly, then we would expect that
patient outcomes would deteriorate. This can be due to logistic, management, and delivery issues
associated with the differences in care. This is similar to old staff leaving and new staff arriving, as
well as the time taken for the new staff to become familiar with their roles. This effect is captures in
the coefficient on turnover. Over and above this effect we are finding an effect from the changing
share of EEA workers has an additional negative effect on patient outcomes.
In more detail, our analysis examines the relation between the share of leaving staff that comes
from an EU country and the average number of patients that starts treatment within 18 weeks. It is
conducted at the level of trusts in the English NHS between Q2-2015 to Q2-2017. The dataset and
sources are summarised in Table 33 and the list of variables used is provided in Table 34.
Our analysis suggests that there is a negative and statistically significant association between the
share of leaving hospital staff that comes from the EU and the share of patients that commence
treatment within 18 weeks. More specifically the findings suggest that a 1 percentage point increase
in the share of leaving staff that is from the EU, is associated with a 0.03 to 0.09 percentage point
decrease in the number of patients treated within 18 weeks
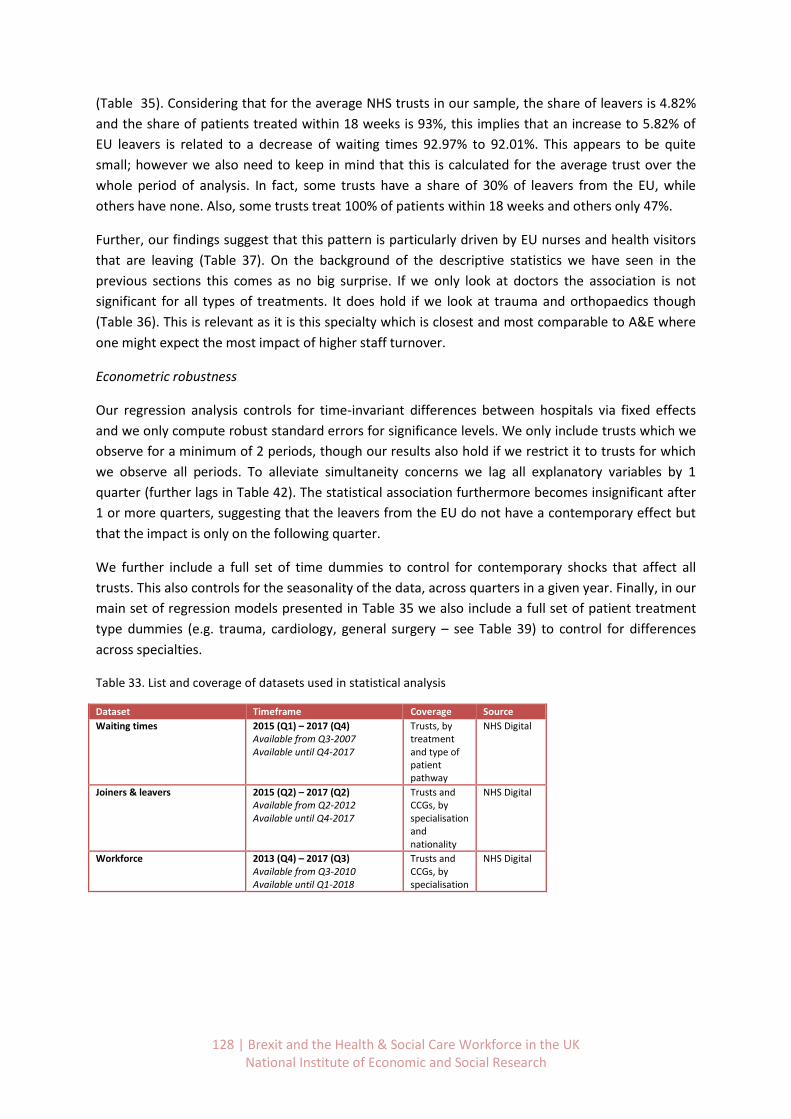
128 | Brexit and the Health & Social Care Workforce in the UK National Institute of Economic and Social Research
(Table 35). Considering that for the average NHS trusts in our sample, the share of leavers is 4.82%
and the share of patients treated within 18 weeks is 93%, this implies that an increase to 5.82% of
EU leavers is related to a decrease of waiting times 92.97% to 92.01%. This appears to be quite
small; however we also need to keep in mind that this is calculated for the average trust over the
whole period of analysis. In fact, some trusts have a share of 30% of leavers from the EU, while
others have none. Also, some trusts treat 100% of patients within 18 weeks and others only 47%.
Further, our findings suggest that this pattern is particularly driven by EU nurses and health visitors
that are leaving (Table 37). On the background of the descriptive statistics we have seen in the
previous sections this comes as no big surprise. If we only look at doctors the association is not
significant for all types of treatments. It does hold if we look at trauma and orthopaedics though
(Table 36). This is relevant as it is this specialty which is closest and most comparable to A&E where
one might expect the most impact of higher staff turnover.
Econometric robustness
Our regression analysis controls for time-invariant differences between hospitals via fixed effects
and we only compute robust standard errors for significance levels. We only include trusts which we
observe for a minimum of 2 periods, though our results also hold if we restrict it to trusts for which
we observe all periods. To alleviate simultaneity concerns we lag all explanatory variables by 1
quarter (further lags in Table 42). The statistical association furthermore becomes insignificant after
1 or more quarters, suggesting that the leavers from the EU do not have a contemporary effect but
that the impact is only on the following quarter.
We further include a full set of time dummies to control for contemporary shocks that affect all
trusts. This also controls for the seasonality of the data, across quarters in a given year. Finally, in our
main set of regression models presented in Table 35 we also include a full set of patient treatment
type dummies (e.g. trauma, cardiology, general surgery – see Table 39) to control for differences
across specialties.
Table 33. List and coverage of datasets used in statistical analysis
Dataset Timeframe Coverage Source
Waiting times 2015 (Q1) – 2017 (Q4) Available from Q3-2007 Available until Q4-2017
Trusts, by treatment and type of patient pathway
NHS Digital
Joiners & leavers 2015 (Q2) – 2017 (Q2) Available from Q2-2012 Available until Q4-2017
Trusts and CCGs, by specialisation and nationality
NHS Digital
Workforce 2013 (Q4) – 2017 (Q3) Available from Q3-2010 Available until Q1-2018
Trusts and CCGs, by specialisation
NHS Digital

129 | Brexit and the Health & Social Care Workforce in the UK National Institute of Economic and Social Research
Table 34. List of variables used in regression analysis
Variable Dimension Description
Fraction of patients waiting less than 18 weeks
3 patient pathways 13 treatment types
Fraction of patients that are waiting less than 18 weeks within their pathway and treatment.
Share of leaving staff by nationality 4 nationalities
Share of leaving staff with a specific nationality
Staff turnover 7 staff categories
Share of staff that has left in a quarter over total staff in the same quarter.
Hospital size 13 staff categories
Total staff headcount in different staff categories.
Table 35. Regression results (preferred models). Q3-2015 – Q2-2017
Complete pathways Incomplete pathways
(1) (2) (3) (4) (5) (6)
Share of leavers from EU -0.0877** -0.0891** -0.0898** -0.0300** -0.0308** -0.0326**
(0.0381) (0.0381) (0.0381) (0.0136) (0.0135) (0.0135)
Staff turnover
-0.253*** -0.264***
-0.103** -0.129***
(0.0968) (0.0975)
(0.0401) (0.0407)
Total employment
-0.00461
-0.0133***
(0.00513)
(0.00261)
Constant 0.799*** 0.808*** 0.848*** 0.907*** 0.910*** 1.024***
(0.0101) (0.0108) (0.0450) (0.00558) (0.00567) (0.0228)
Observations 15,168 15,168 15,168 18,596 18,596 18,596
# of panelvar 2,135 2,135 2,135 2,493 2,493 2,493
Hospital fixed effects YES YES YES YES YES YES
Time fixed effects YES YES YES YES YES YES
Specialty fixed effects YES YES YES YES YES YES
Time lag of regressors 1 quarter 1 quarter 1 quarter 1 quarter 1 quarter 1 quarter
Robust standard errors in parentheses; *** p<0.01, ** p<0.05, * p<0.1
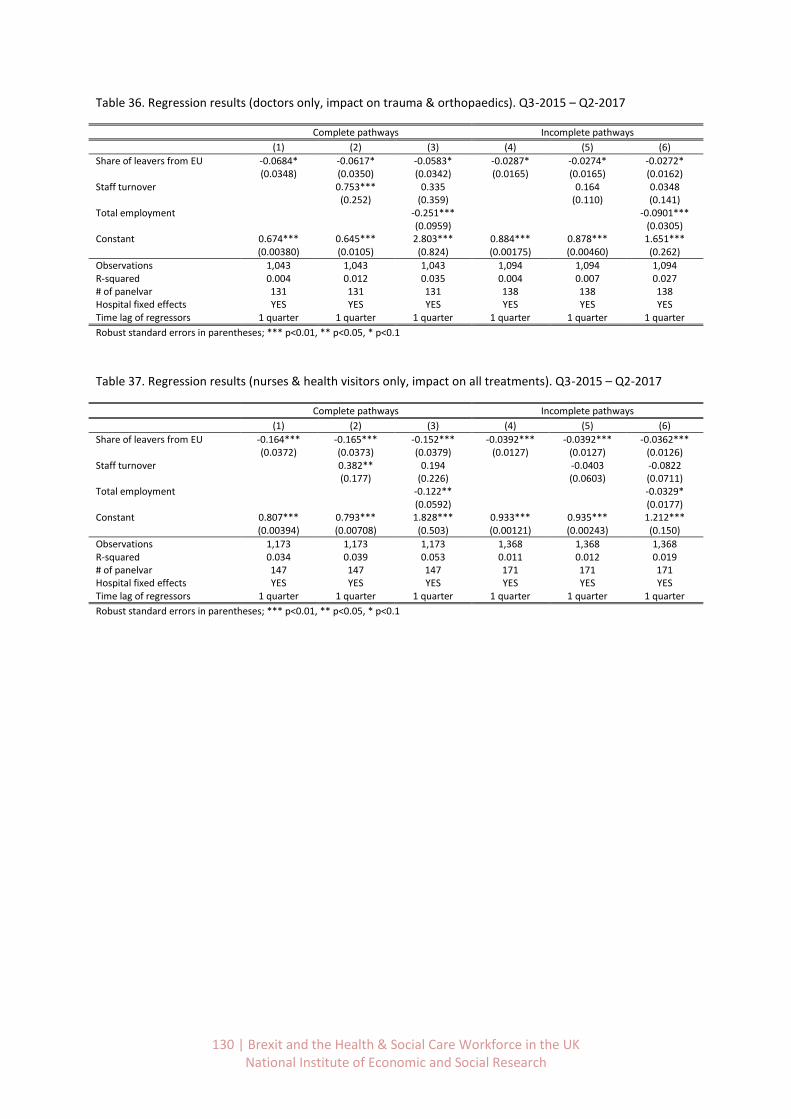
130 | Brexit and the Health & Social Care Workforce in the UK National Institute of Economic and Social Research
Table 36. Regression results (doctors only, impact on trauma & orthopaedics). Q3-2015 – Q2-2017
Complete pathways Incomplete pathways
(1) (2) (3) (4) (5) (6)
Share of leavers from EU -0.0684* -0.0617* -0.0583* -0.0287* -0.0274* -0.0272*
(0.0348) (0.0350) (0.0342) (0.0165) (0.0165) (0.0162)
Staff turnover
0.753*** 0.335
0.164 0.0348
(0.252) (0.359)
(0.110) (0.141) Total employment
-0.251***
-0.0901***
(0.0959)
(0.0305) Constant 0.674*** 0.645*** 2.803*** 0.884*** 0.878*** 1.651*** (0.00380) (0.0105) (0.824) (0.00175) (0.00460) (0.262)
Observations 1,043 1,043 1,043 1,094 1,094 1,094 R-squared 0.004 0.012 0.035 0.004 0.007 0.027 # of panelvar 131 131 131 138 138 138 Hospital fixed effects YES YES YES YES YES YES Time lag of regressors 1 quarter 1 quarter 1 quarter 1 quarter 1 quarter 1 quarter
Robust standard errors in parentheses; *** p<0.01, ** p<0.05, * p<0.1
Table 37. Regression results (nurses & health visitors only, impact on all treatments). Q3-2015 – Q2-2017
Complete pathways Incomplete pathways
(1) (2) (3) (4) (5) (6)
Share of leavers from EU -0.164*** -0.165*** -0.152*** -0.0392*** -0.0392*** -0.0362***
(0.0372) (0.0373) (0.0379) (0.0127) (0.0127) (0.0126)
Staff turnover
0.382** 0.194
-0.0403 -0.0822
(0.177) (0.226)
(0.0603) (0.0711) Total employment
-0.122**
-0.0329*
(0.0592)
(0.0177) Constant 0.807*** 0.793*** 1.828*** 0.933*** 0.935*** 1.212*** (0.00394) (0.00708) (0.503) (0.00121) (0.00243) (0.150)
Observations 1,173 1,173 1,173 1,368 1,368 1,368 R-squared 0.034 0.039 0.053 0.011 0.012 0.019 # of panelvar 147 147 147 171 171 171 Hospital fixed effects YES YES YES YES YES YES Time lag of regressors 1 quarter 1 quarter 1 quarter 1 quarter 1 quarter 1 quarter
Robust standard errors in parentheses; *** p<0.01, ** p<0.05, * p<0.1
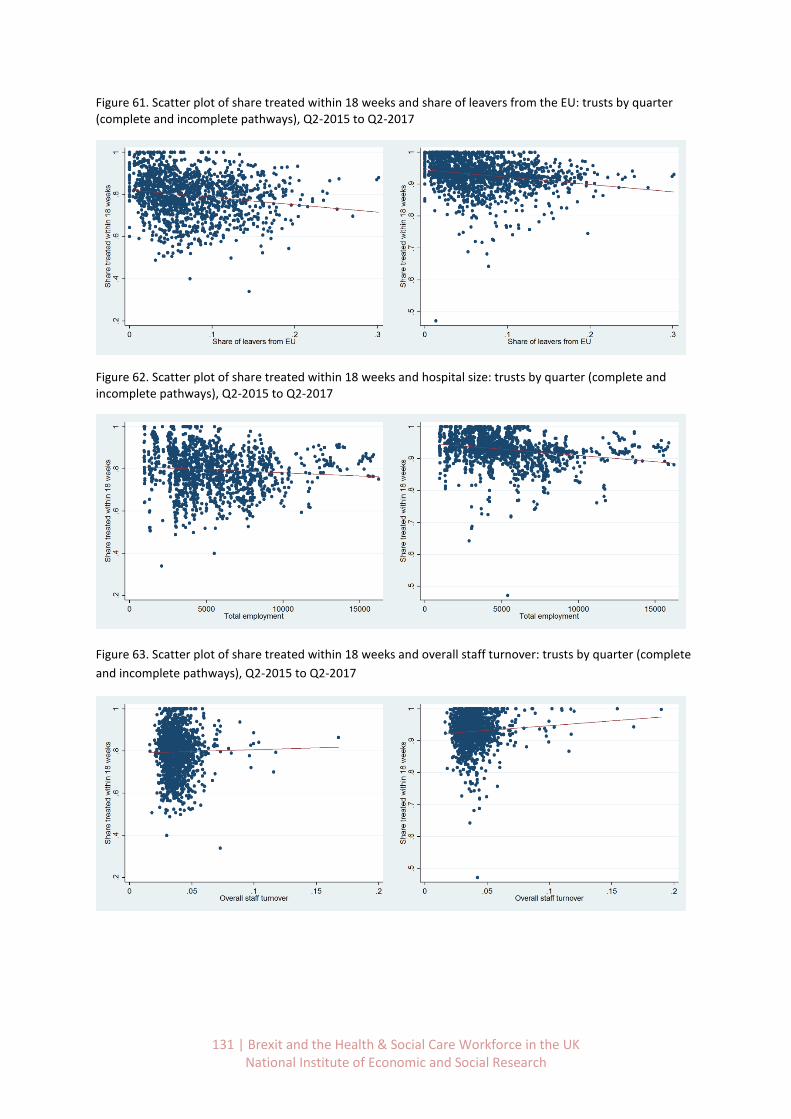
131 | Brexit and the Health & Social Care Workforce in the UK National Institute of Economic and Social Research
Figure 61. Scatter plot of share treated within 18 weeks and share of leavers from the EU: trusts by quarter (complete and incomplete pathways), Q2-2015 to Q2-2017
Figure 62. Scatter plot of share treated within 18 weeks and hospital size: trusts by quarter (complete and incomplete pathways), Q2-2015 to Q2-2017
Figure 63. Scatter plot of share treated within 18 weeks and overall staff turnover: trusts by quarter (complete
and incomplete pathways), Q2-2015 to Q2-2017
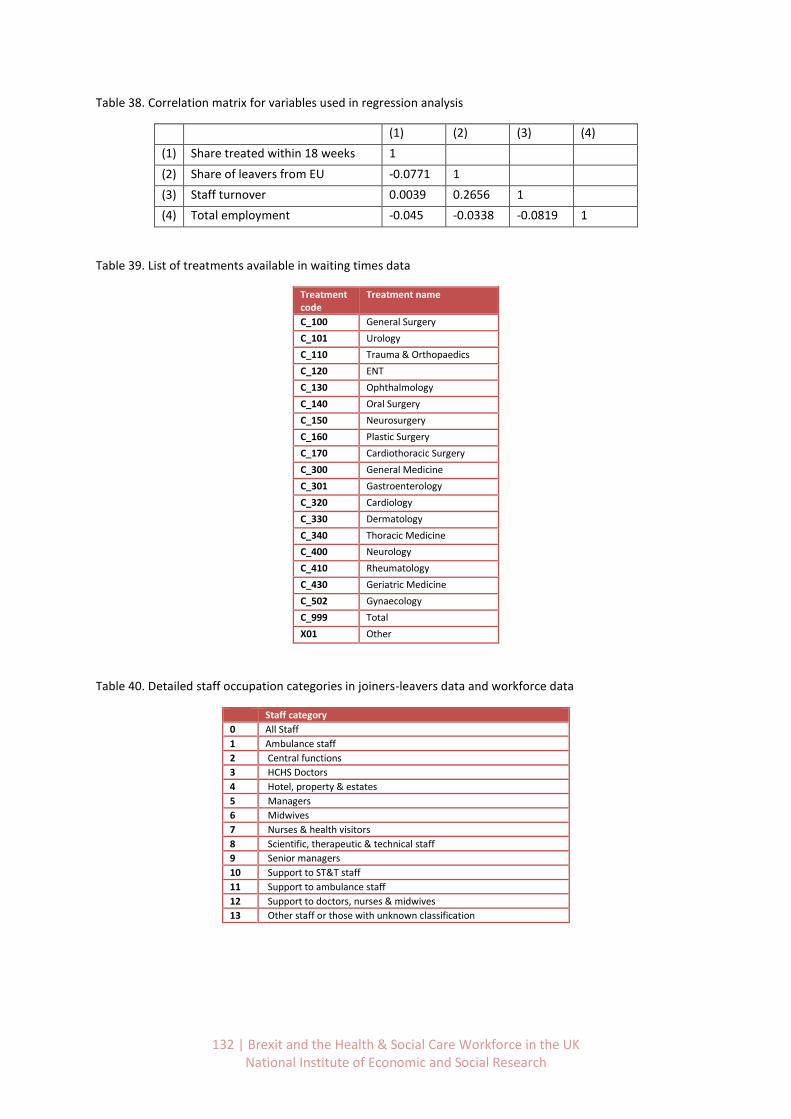
132 | Brexit and the Health & Social Care Workforce in the UK National Institute of Economic and Social Research
Table 38. Correlation matrix for variables used in regression analysis
(1) (2) (3) (4)
(1) Share treated within 18 weeks 1
(2) Share of leavers from EU -0.0771 1
(3) Staff turnover 0.0039 0.2656 1
(4) Total employment -0.045 -0.0338 -0.0819 1
Table 39. List of treatments available in waiting times data
Treatment code
Treatment name
C_100 General Surgery
C_101 Urology
C_110 Trauma & Orthopaedics
C_120 ENT
C_130 Ophthalmology
C_140 Oral Surgery
C_150 Neurosurgery
C_160 Plastic Surgery
C_170 Cardiothoracic Surgery
C_300 General Medicine
C_301 Gastroenterology
C_320 Cardiology
C_330 Dermatology
C_340 Thoracic Medicine
C_400 Neurology
C_410 Rheumatology
C_430 Geriatric Medicine
C_502 Gynaecology
C_999 Total
X01 Other
Table 40. Detailed staff occupation categories in joiners-leavers data and workforce data
Staff category
0 All Staff
1 Ambulance staff
2 Central functions
3 HCHS Doctors
4 Hotel, property & estates
5 Managers
6 Midwives
7 Nurses & health visitors
8 Scientific, therapeutic & technical staff
9 Senior managers
10 Support to ST&T staff
11 Support to ambulance staff
12 Support to doctors, nurses & midwives
13 Other staff or those with unknown classification
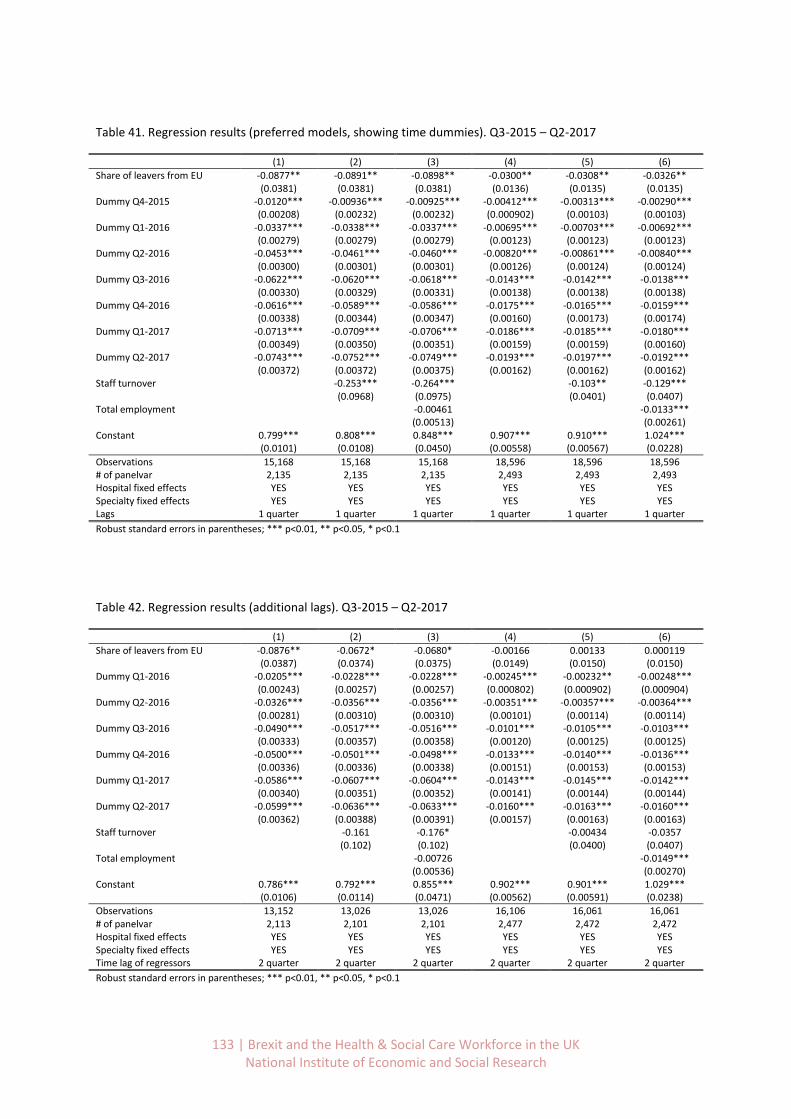
133 | Brexit and the Health & Social Care Workforce in the UK National Institute of Economic and Social Research
Table 41. Regression results (preferred models, showing time dummies). Q3-2015 – Q2-2017
(1) (2) (3) (4) (5) (6)
Share of leavers from EU -0.0877** -0.0891** -0.0898** -0.0300** -0.0308** -0.0326**
(0.0381) (0.0381) (0.0381) (0.0136) (0.0135) (0.0135)
Dummy Q4-2015 -0.0120*** -0.00936*** -0.00925*** -0.00412*** -0.00313*** -0.00290***
(0.00208) (0.00232) (0.00232) (0.000902) (0.00103) (0.00103)
Dummy Q1-2016 -0.0337*** -0.0338*** -0.0337*** -0.00695*** -0.00703*** -0.00692***
(0.00279) (0.00279) (0.00279) (0.00123) (0.00123) (0.00123)
Dummy Q2-2016 -0.0453*** -0.0461*** -0.0460*** -0.00820*** -0.00861*** -0.00840***
(0.00300) (0.00301) (0.00301) (0.00126) (0.00124) (0.00124)
Dummy Q3-2016 -0.0622*** -0.0620*** -0.0618*** -0.0143*** -0.0142*** -0.0138***
(0.00330) (0.00329) (0.00331) (0.00138) (0.00138) (0.00138)
Dummy Q4-2016 -0.0616*** -0.0589*** -0.0586*** -0.0175*** -0.0165*** -0.0159***
(0.00338) (0.00344) (0.00347) (0.00160) (0.00173) (0.00174)
Dummy Q1-2017 -0.0713*** -0.0709*** -0.0706*** -0.0186*** -0.0185*** -0.0180***
(0.00349) (0.00350) (0.00351) (0.00159) (0.00159) (0.00160)
Dummy Q2-2017 -0.0743*** -0.0752*** -0.0749*** -0.0193*** -0.0197*** -0.0192***
(0.00372) (0.00372) (0.00375) (0.00162) (0.00162) (0.00162)
Staff turnover -0.253*** -0.264*** -0.103** -0.129*** (0.0968) (0.0975) (0.0401) (0.0407) Total employment
-0.00461
-0.0133***
(0.00513)
(0.00261) Constant 0.799*** 0.808*** 0.848*** 0.907*** 0.910*** 1.024*** (0.0101) (0.0108) (0.0450) (0.00558) (0.00567) (0.0228)
Observations 15,168 15,168 15,168 18,596 18,596 18,596 # of panelvar 2,135 2,135 2,135 2,493 2,493 2,493 Hospital fixed effects YES YES YES YES YES YES Specialty fixed effects YES YES YES YES YES YES Lags 1 quarter 1 quarter 1 quarter 1 quarter 1 quarter 1 quarter
Robust standard errors in parentheses; *** p<0.01, ** p<0.05, * p<0.1
Table 42. Regression results (additional lags). Q3-2015 – Q2-2017
(1) (2) (3) (4) (5) (6)
Share of leavers from EU -0.0876** -0.0672* -0.0680* -0.00166 0.00133 0.000119
(0.0387) (0.0374) (0.0375) (0.0149) (0.0150) (0.0150)
Dummy Q1-2016 -0.0205*** -0.0228*** -0.0228*** -0.00245*** -0.00232** -0.00248***
(0.00243) (0.00257) (0.00257) (0.000802) (0.000902) (0.000904)
Dummy Q2-2016 -0.0326*** -0.0356*** -0.0356*** -0.00351*** -0.00357*** -0.00364***
(0.00281) (0.00310) (0.00310) (0.00101) (0.00114) (0.00114)
Dummy Q3-2016 -0.0490*** -0.0517*** -0.0516*** -0.0101*** -0.0105*** -0.0103***
(0.00333) (0.00357) (0.00358) (0.00120) (0.00125) (0.00125)
Dummy Q4-2016 -0.0500*** -0.0501*** -0.0498*** -0.0133*** -0.0140*** -0.0136***
(0.00336) (0.00336) (0.00338) (0.00151) (0.00153) (0.00153)
Dummy Q1-2017 -0.0586*** -0.0607*** -0.0604*** -0.0143*** -0.0145*** -0.0142***
(0.00340) (0.00351) (0.00352) (0.00141) (0.00144) (0.00144)
Dummy Q2-2017 -0.0599*** -0.0636*** -0.0633*** -0.0160*** -0.0163*** -0.0160***
(0.00362) (0.00388) (0.00391) (0.00157) (0.00163) (0.00163)
Staff turnover
-0.161 -0.176*
-0.00434 -0.0357
(0.102) (0.102)
(0.0400) (0.0407) Total employment
-0.00726
-0.0149***
(0.00536)
(0.00270) Constant 0.786*** 0.792*** 0.855*** 0.902*** 0.901*** 1.029*** (0.0106) (0.0114) (0.0471) (0.00562) (0.00591) (0.0238)
Observations 13,152 13,026 13,026 16,106 16,061 16,061 # of panelvar 2,113 2,101 2,101 2,477 2,472 2,472 Hospital fixed effects YES YES YES YES YES YES Specialty fixed effects YES YES YES YES YES YES Time lag of regressors 2 quarter 2 quarter 2 quarter 2 quarter 2 quarter 2 quarter
Robust standard errors in parentheses; *** p<0.01, ** p<0.05, * p<0.1
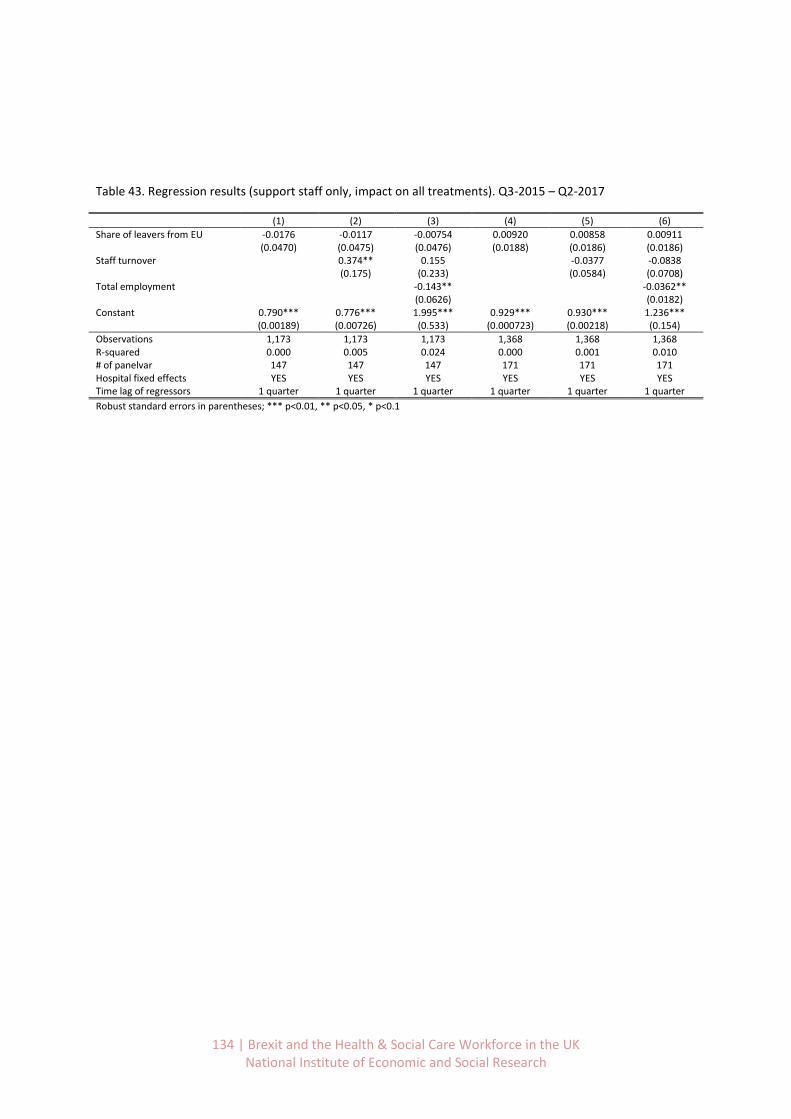
134 | Brexit and the Health & Social Care Workforce in the UK National Institute of Economic and Social Research
Table 43. Regression results (support staff only, impact on all treatments). Q3-2015 – Q2-2017
(1) (2) (3) (4) (5) (6)
Share of leavers from EU -0.0176 -0.0117 -0.00754 0.00920 0.00858 0.00911
(0.0470) (0.0475) (0.0476) (0.0188) (0.0186) (0.0186)
Staff turnover
0.374** 0.155
-0.0377 -0.0838
(0.175) (0.233)
(0.0584) (0.0708) Total employment
-0.143**
-0.0362**
(0.0626)
(0.0182) Constant 0.790*** 0.776*** 1.995*** 0.929*** 0.930*** 1.236*** (0.00189) (0.00726) (0.533) (0.000723) (0.00218) (0.154)
Observations 1,173 1,173 1,173 1,368 1,368 1,368 R-squared 0.000 0.005 0.024 0.000 0.001 0.010 # of panelvar 147 147 147 171 171 171 Hospital fixed effects YES YES YES YES YES YES Time lag of regressors 1 quarter 1 quarter 1 quarter 1 quarter 1 quarter 1 quarter
Robust standard errors in parentheses; *** p<0.01, ** p<0.05, * p<0.1