bridge instrumentation and nondestructive load … for long term structural health monitoring . ......
TRANSCRIPT
Masoud Sanayei, Tufts University
Erin Santini Bell, University of New Hampshire
Brian Brenner, Fay, Spofford and Thorndike, INC.
RICC 2010, Research to Reality
Northeastern University
October 19, 2010
Bridge Instrumentation and Nondestructive Load Testing for Long Term Structural Health Monitoring
NSF-PFI Grant: Whatever Happen to Long-Term Bridge Design?A case study: Vernon Avenue Bridge
Presentation Outline
• Background
• Instrumentation
• Load Test (Static, Imaging, and Dynamic)
• Modeling (ERM & EDM)
• Model Calibrations
• New Bridge Design Paradigm
• Conclusions
2

National Science FoundationPartnership for Innovations
• Stimulate the transformation of knowledge created by the research and education enterprise into innovations that create new wealth; build strong local, regional and national economies, and improve the national well-being.
• Broaden the participation of all types of academic institutions and all citizens in activities to meet the diverse workforce needs of the national innovation enterprise.
• Catalyze or enhance enabling infrastructure that is necessary to foster and sustain innovation in the long-term.
• This material is based upon work supported by the National Science Foundation under Grant No. 0650258. Any opinions, findings, and conclusions or recommendations expressed in this material are those of the authors and do not necessarily reflect the views of the National Science Foundation.
3
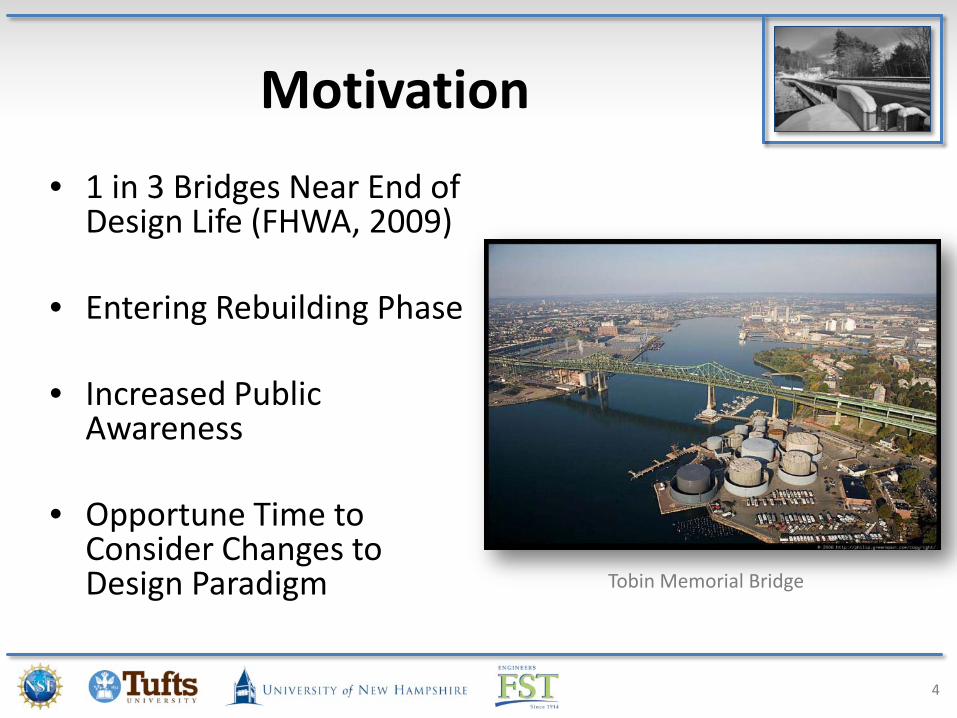
Motivation
• 1 in 3 Bridges Near End of Design Life (FHWA, 2009)
• Entering Rebuilding Phase
• Increased Public Awareness
• Opportune Time to Consider Changes to Design Paradigm Tobin Memorial Bridge
4
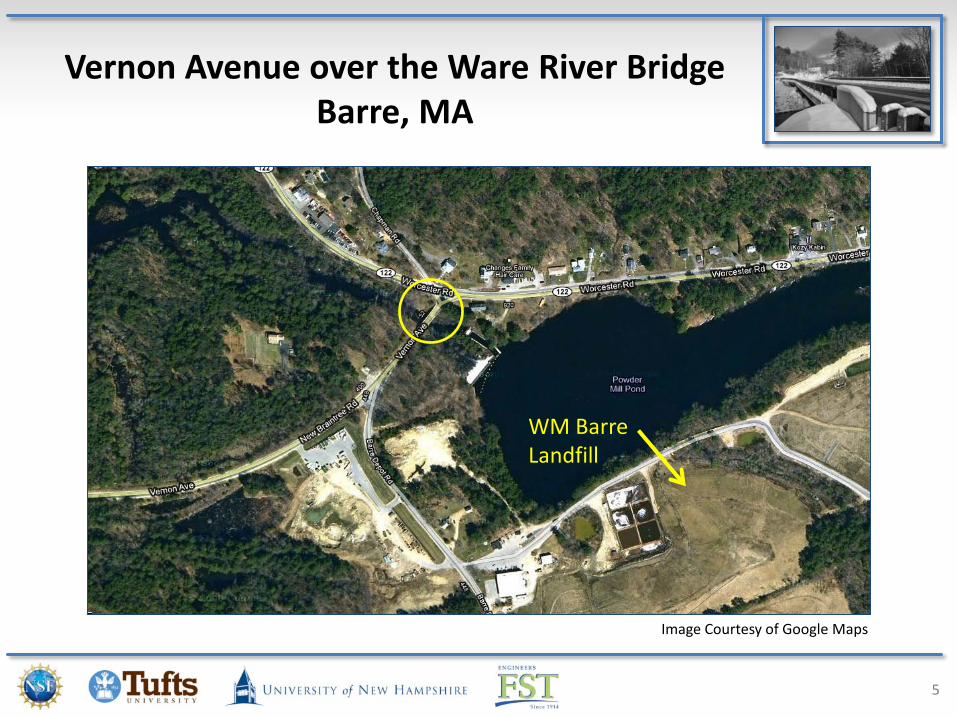
Vernon Avenue over the Ware River Bridge Barre, MA
5
Image Courtesy of Google Maps
WM Barre Landfill
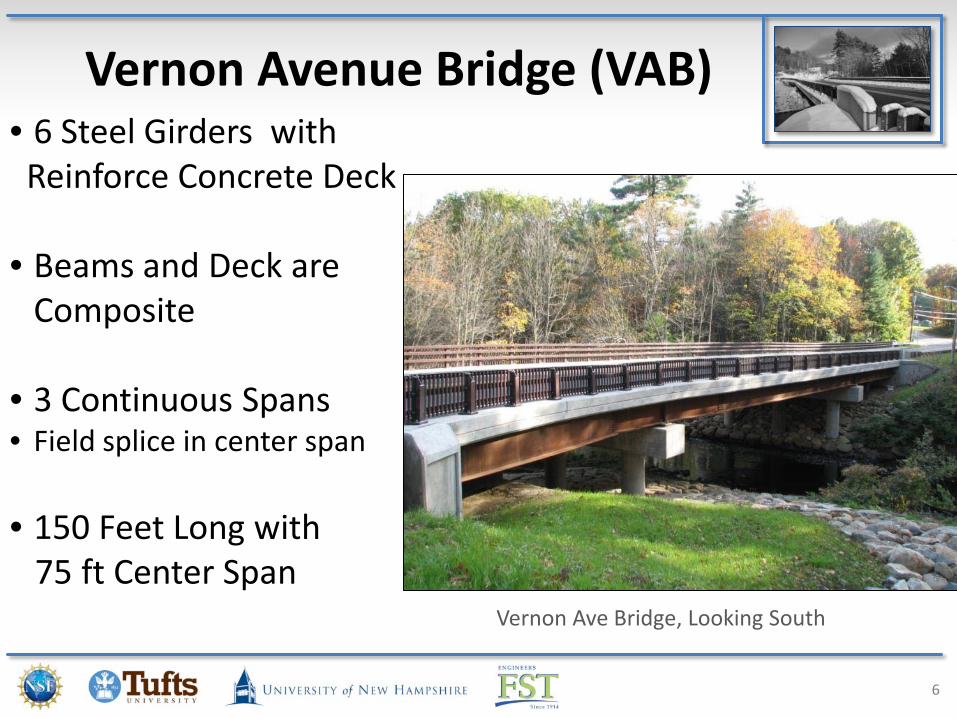
Vernon Avenue Bridge (VAB)• 6 Steel Girders with Reinforce Concrete Deck
• Beams and Deck are Composite
• 3 Continuous Spans• Field splice in center span
• 150 Feet Long with75 ft Center Span
Vernon Ave Bridge, Looking South
6
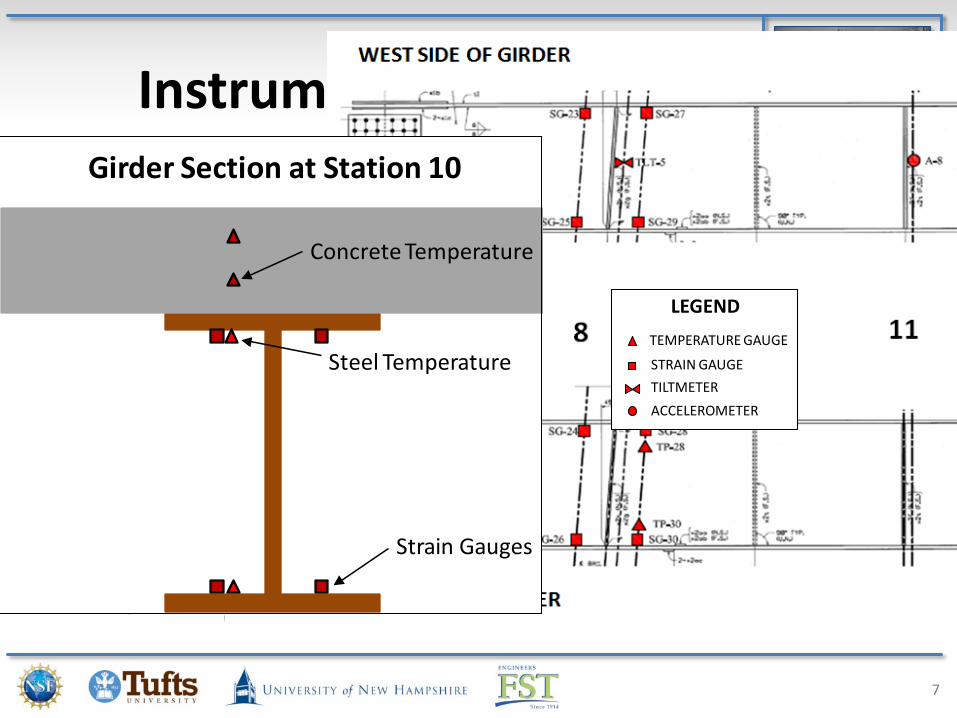
Instrumentation Plan
7
0 10 1112
987654321
NORTH SECTION GIRDER 2
TEMPERATURE GAUGE
ACCELEROMETER
TILTMETER
STRAIN GAUGE
LEGEND
PRESSURE CELLS
Strain Gauges
Steel Temperature
Concrete Temperature
Girder Section at Station 10
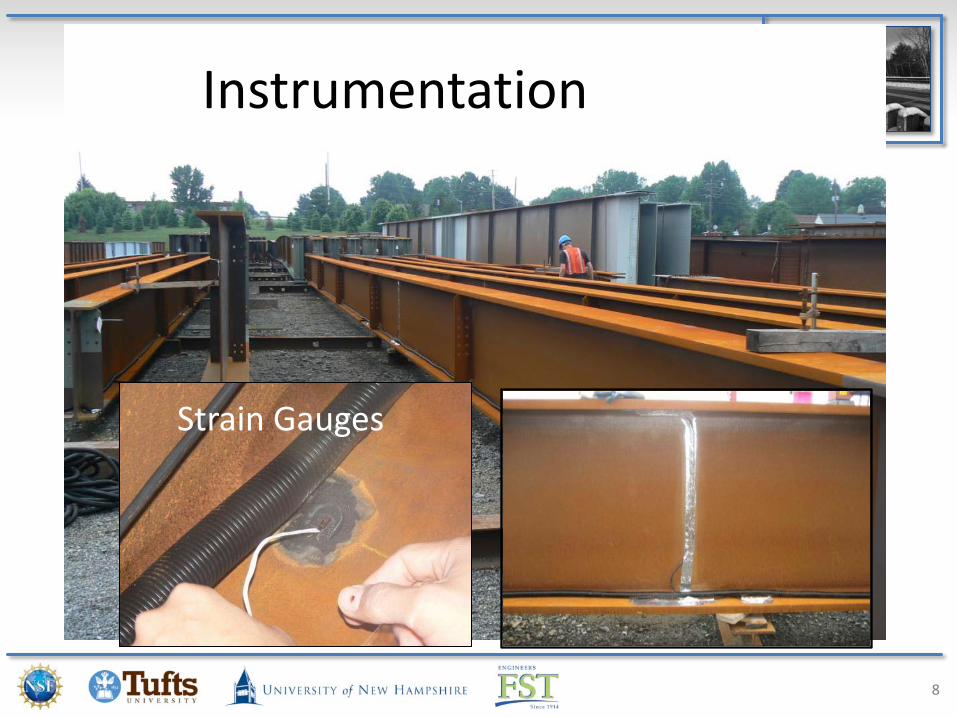
Instrumentation
Strain Gauges
8
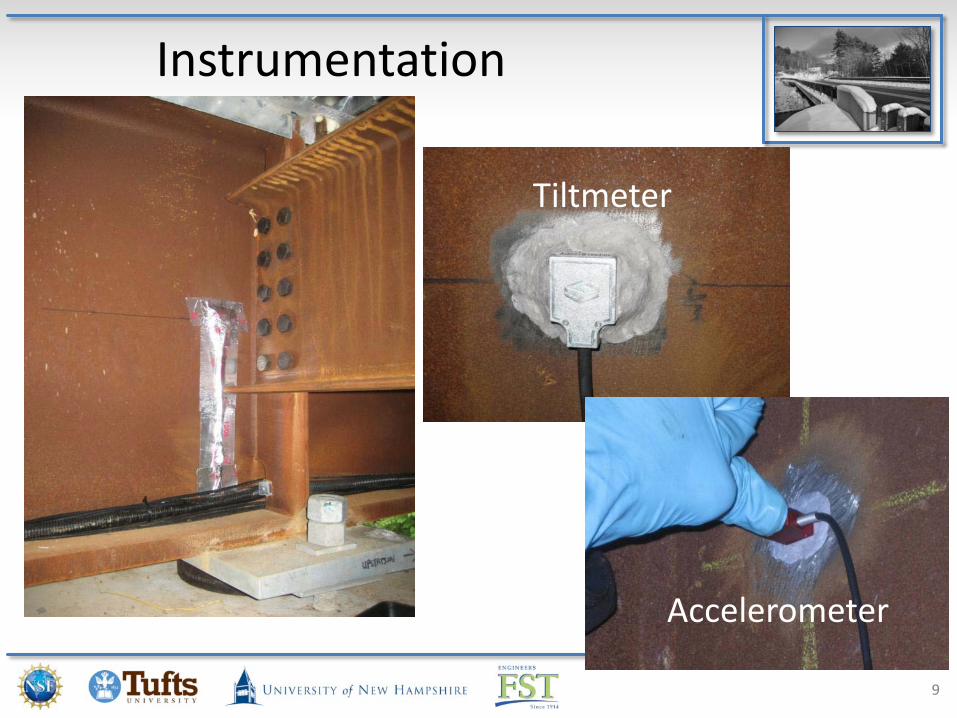
Instrumentation
Tiltmeter
Accelerometer
9
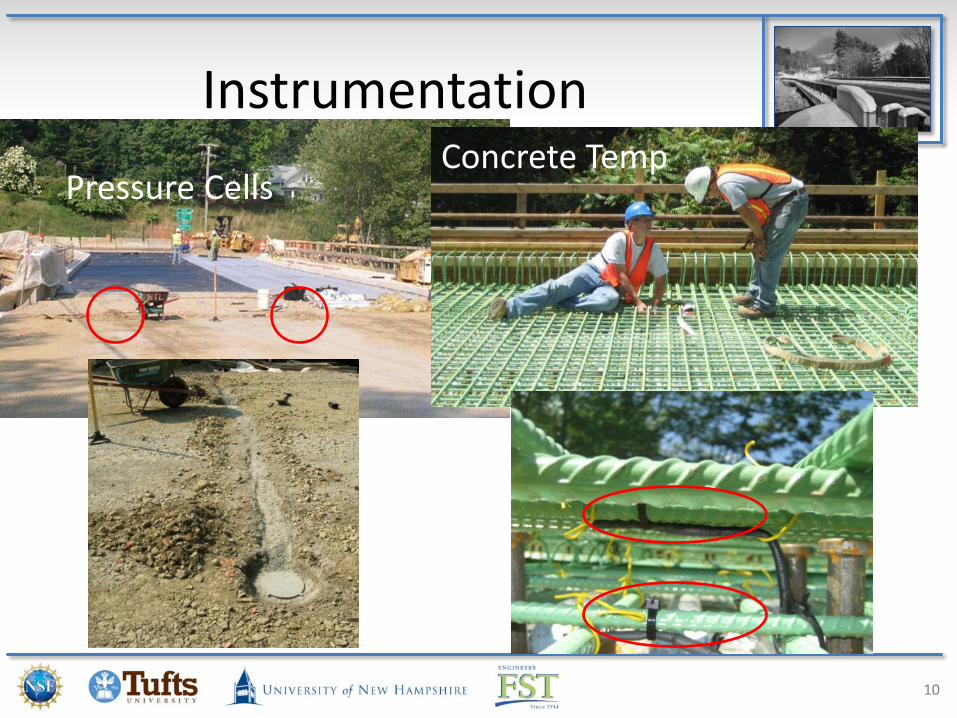
InstrumentationConcrete Temp
Pressure Cells
10
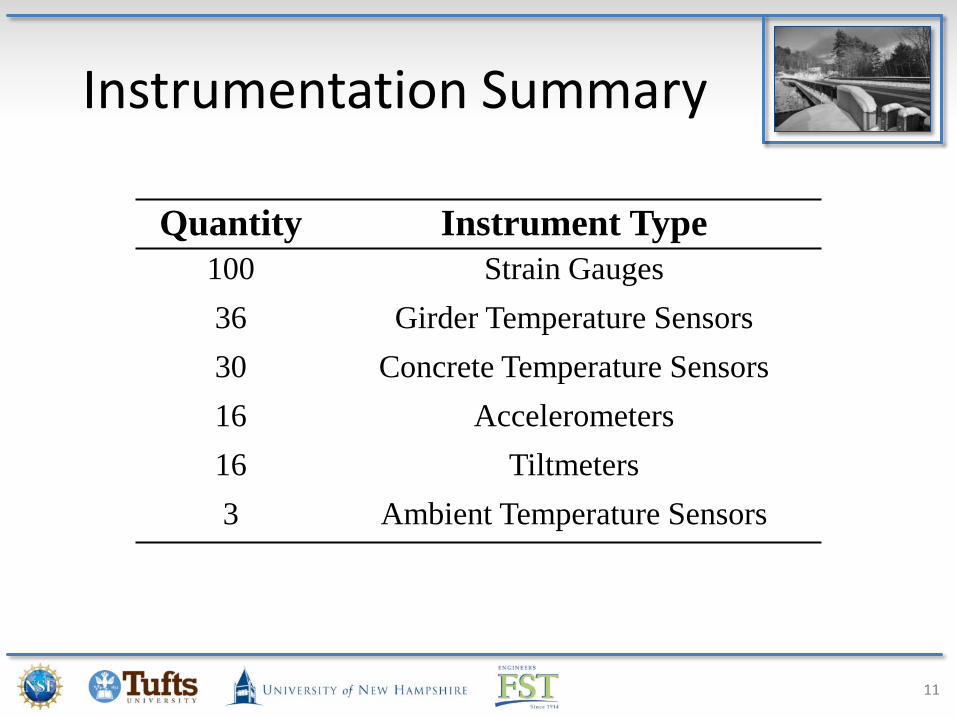
Instrumentation Summary
11
Quantity Instrument Type100 Strain Gauges36 Girder Temperature Sensors30 Concrete Temperature Sensors16 Accelerometers16 Tiltmeters3 Ambient Temperature Sensors
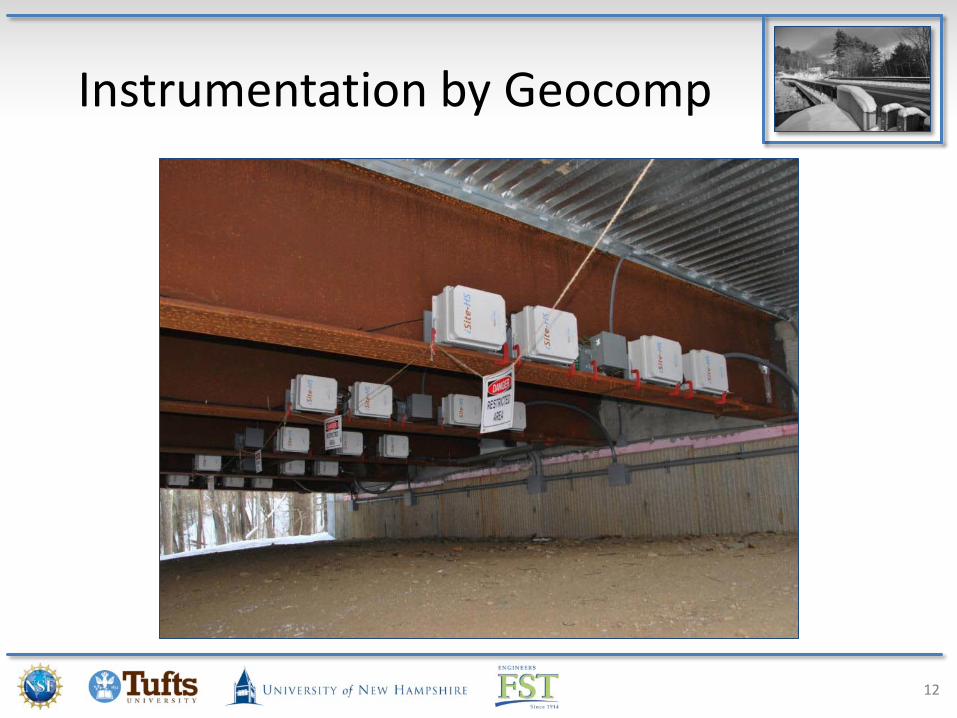
Instrumentation by Geocomp
12
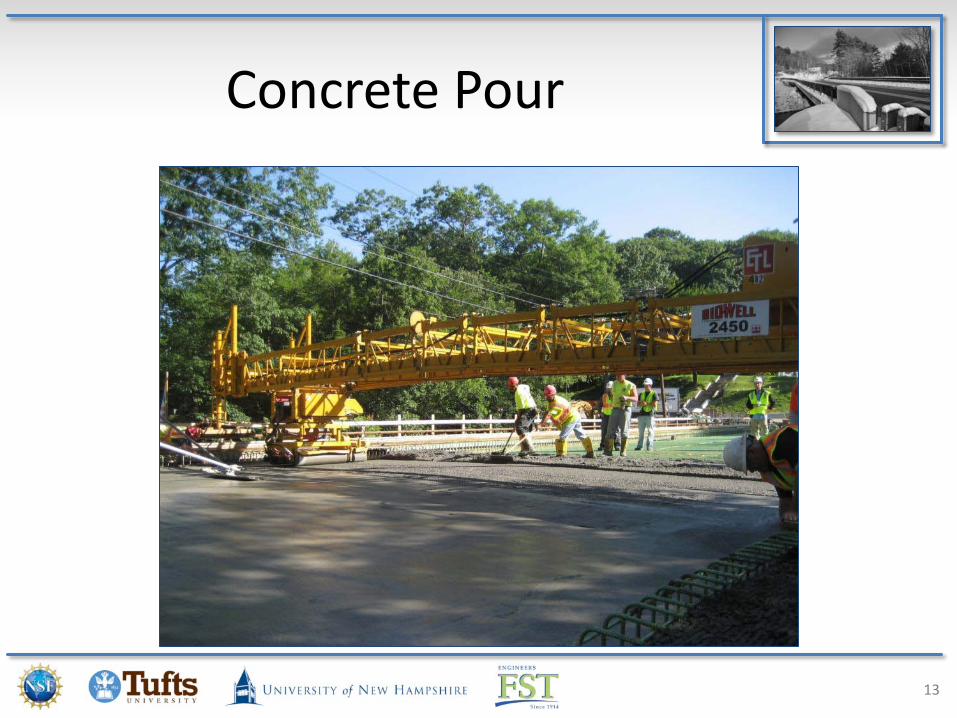
Concrete Pour
13
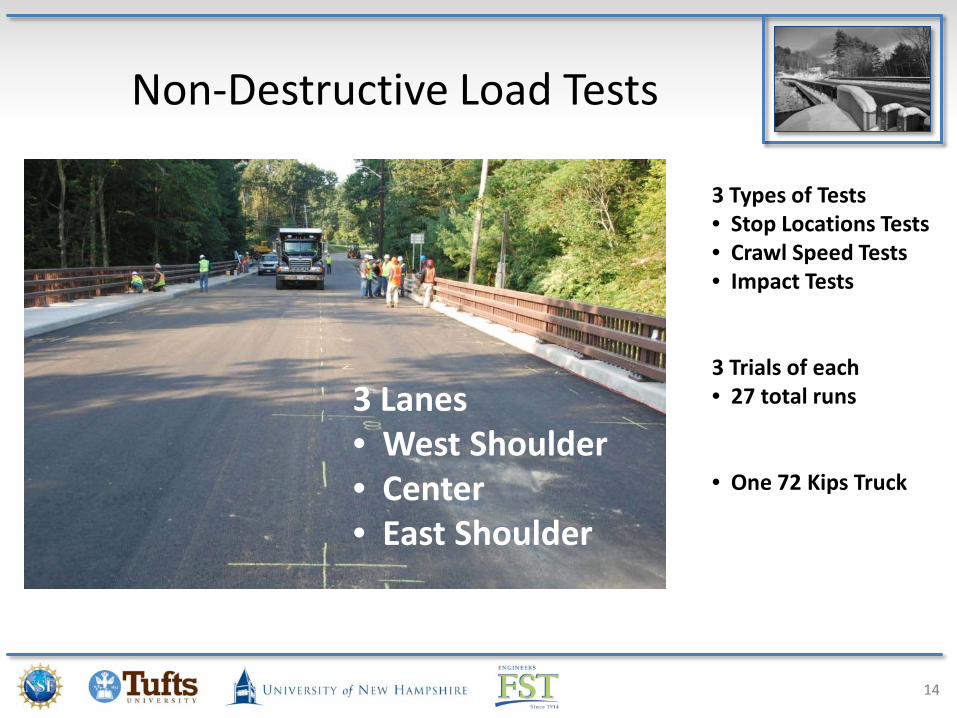
Non-Destructive Load Tests
14
3 Types of Tests• Stop Locations Tests• Crawl Speed Tests• Impact Tests
3 Trials of each• 27 total runs
• One 72 Kips Truck
3 Lanes• West Shoulder• Center• East Shoulder
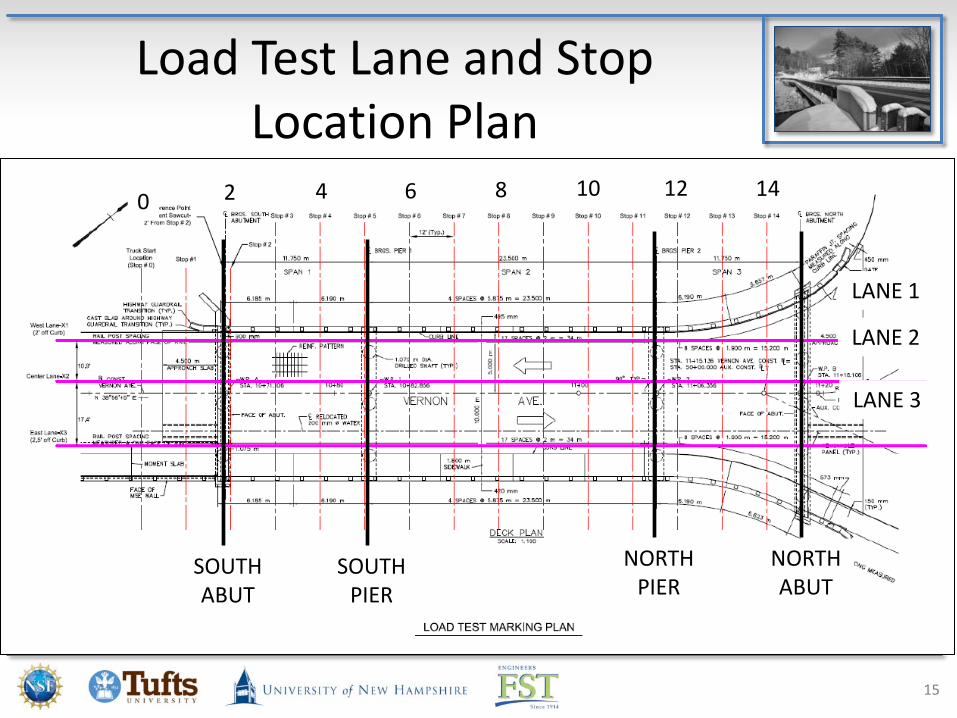
Load Test Lane and Stop Location Plan
NORTH ABUT
SOUTH ABUT
SOUTH PIER
NORTHPIER
0 4 6 8 10 12 142
LANE 1
LANE 2
LANE 3
15
16
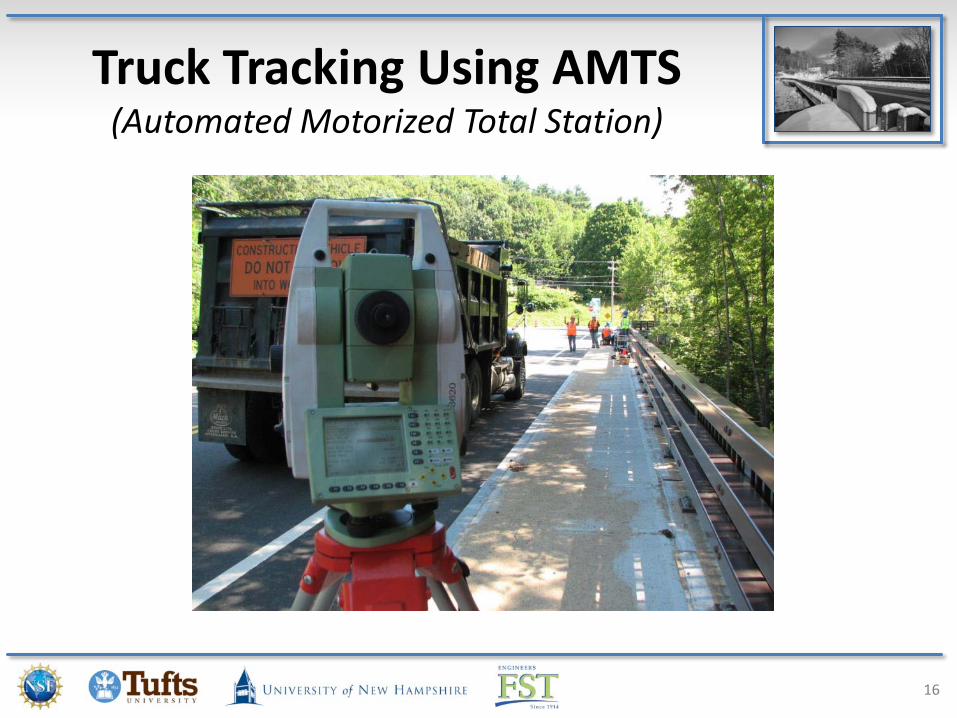
Truck Tracking Using AMTS(Automated Motorized Total Station)
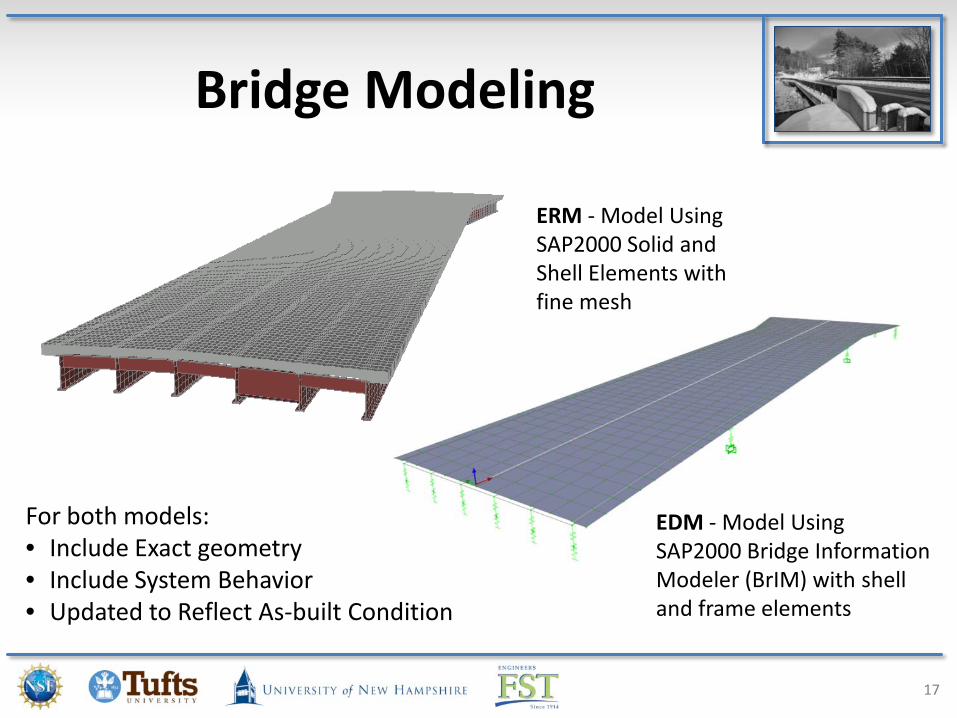
Bridge Modeling
17
EDM - Model Using SAP2000 Bridge Information Modeler (BrIM) with shell and frame elements
ERM - Model Using SAP2000 Solid and Shell Elements with fine mesh
For both models:• Include Exact geometry• Include System Behavior• Updated to Reflect As-built Condition
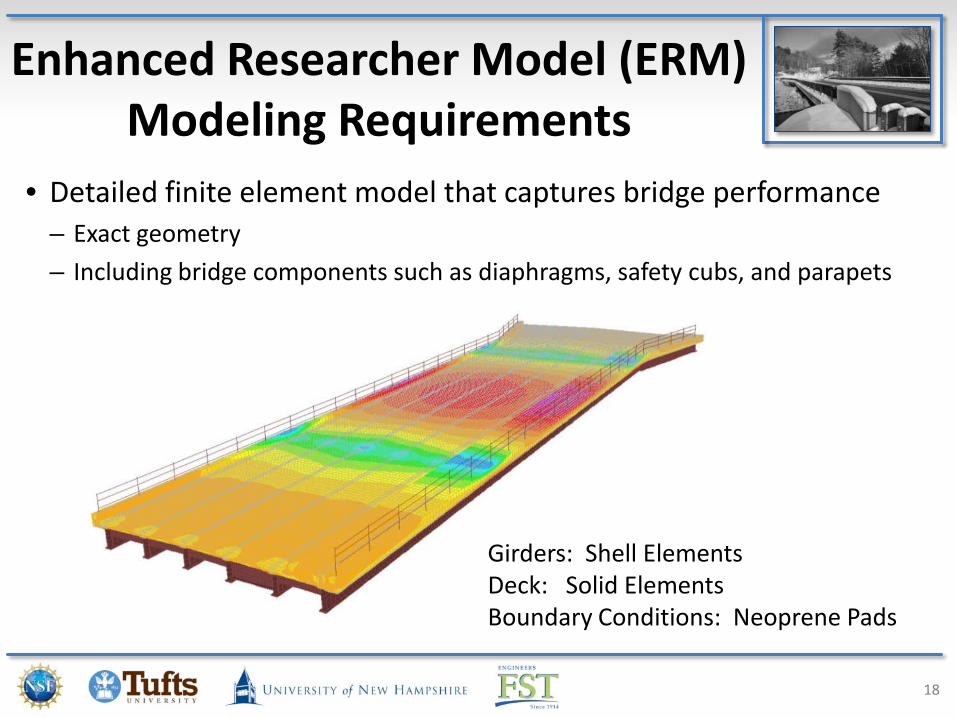
Enhanced Researcher Model (ERM) Modeling Requirements
• Detailed finite element model that captures bridge performance– Exact geometry
– Including bridge components such as diaphragms, safety cubs, and parapets
18
Girders: Shell ElementsDeck: Solid ElementsBoundary Conditions: Neoprene Pads
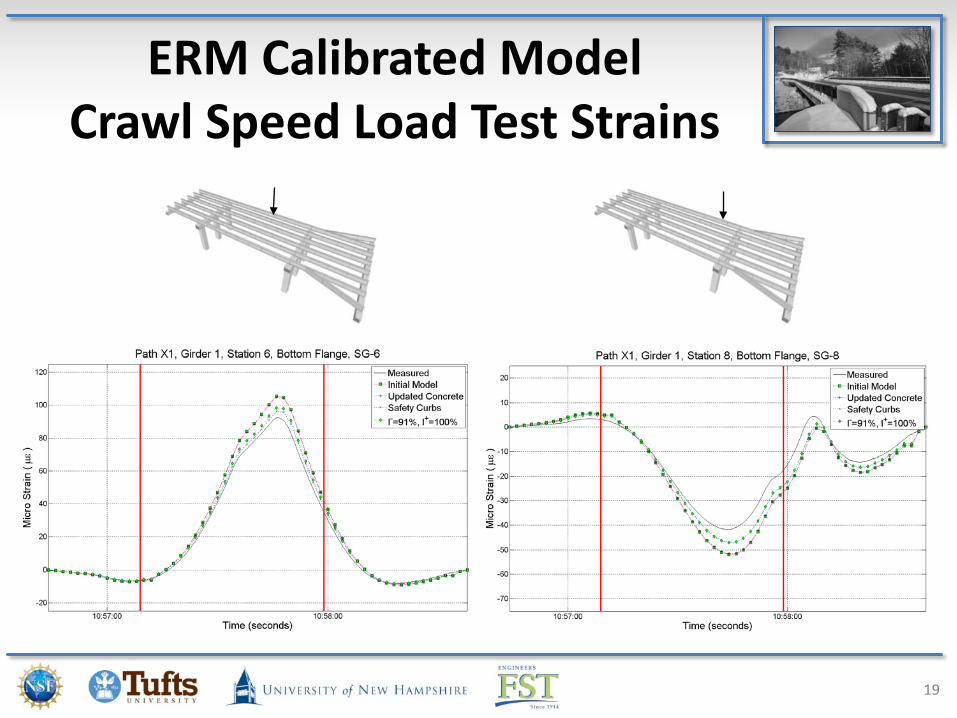
ERM Calibrated ModelCrawl Speed Load Test Strains
19
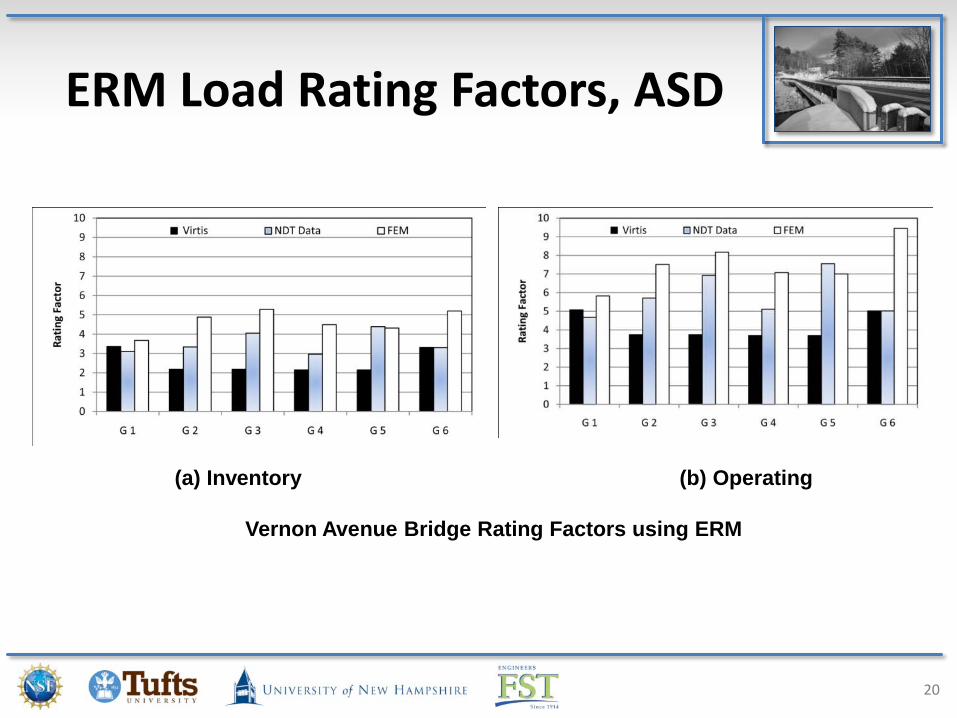
ERM Load Rating Factors, ASD
20
(a) Inventory (b) Operating
Vernon Avenue Bridge Rating Factors using ERM
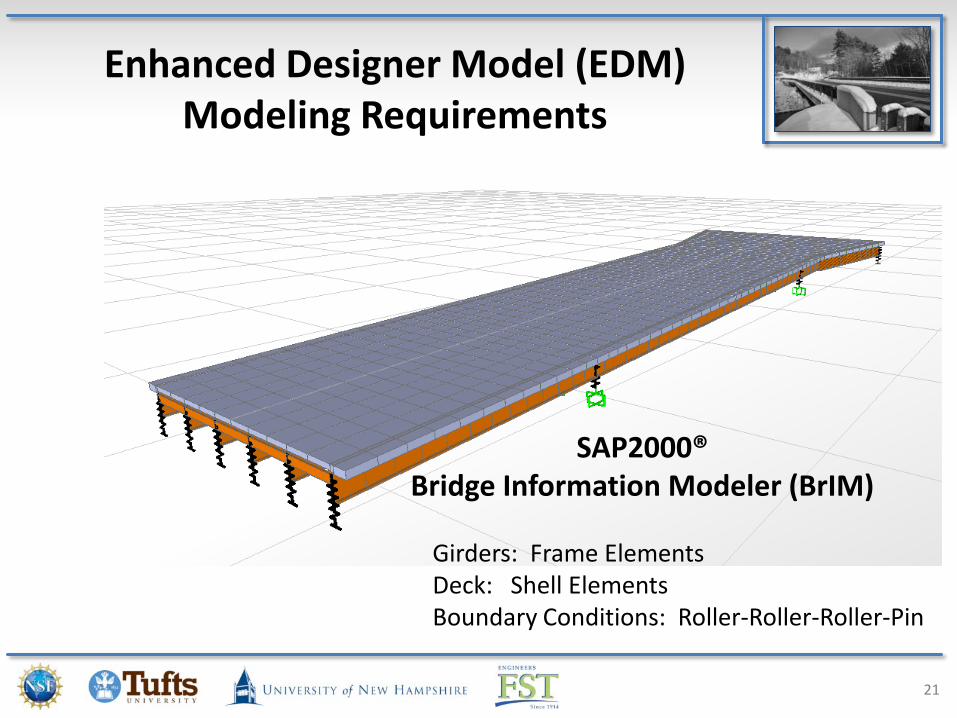
Enhanced Designer Model (EDM) Modeling Requirements
21
Girders: Frame ElementsDeck: Shell ElementsBoundary Conditions: Roller-Roller-Roller-Pin
SAP2000® Bridge Information Modeler (BrIM)
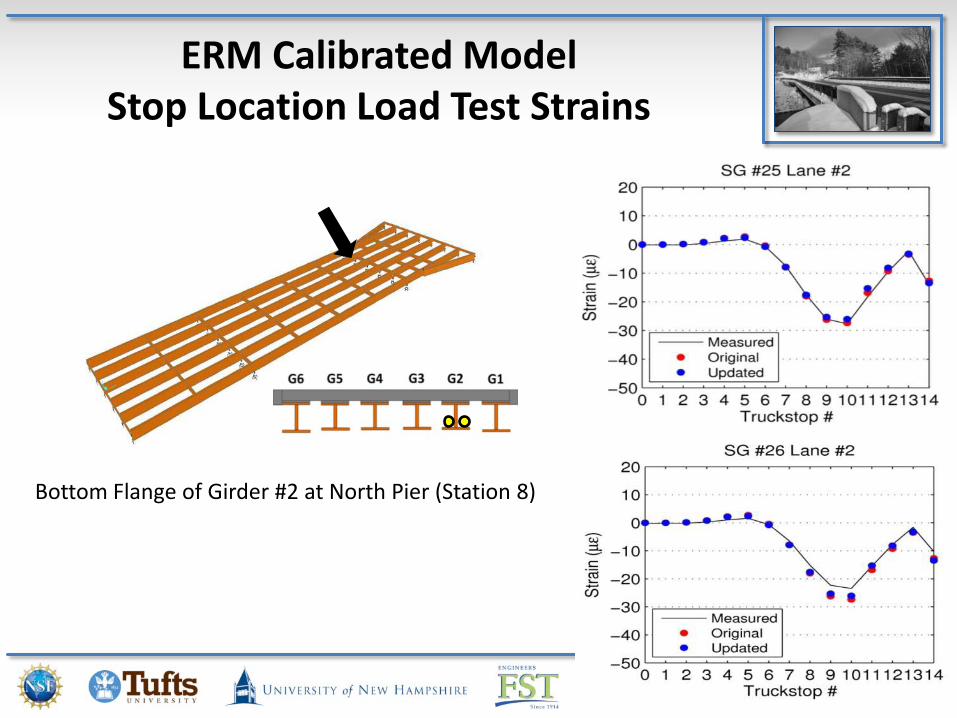
ERM Calibrated ModelStop Location Load Test Strains
22
Bottom Flange of Girder #2 at North Pier (Station 8)
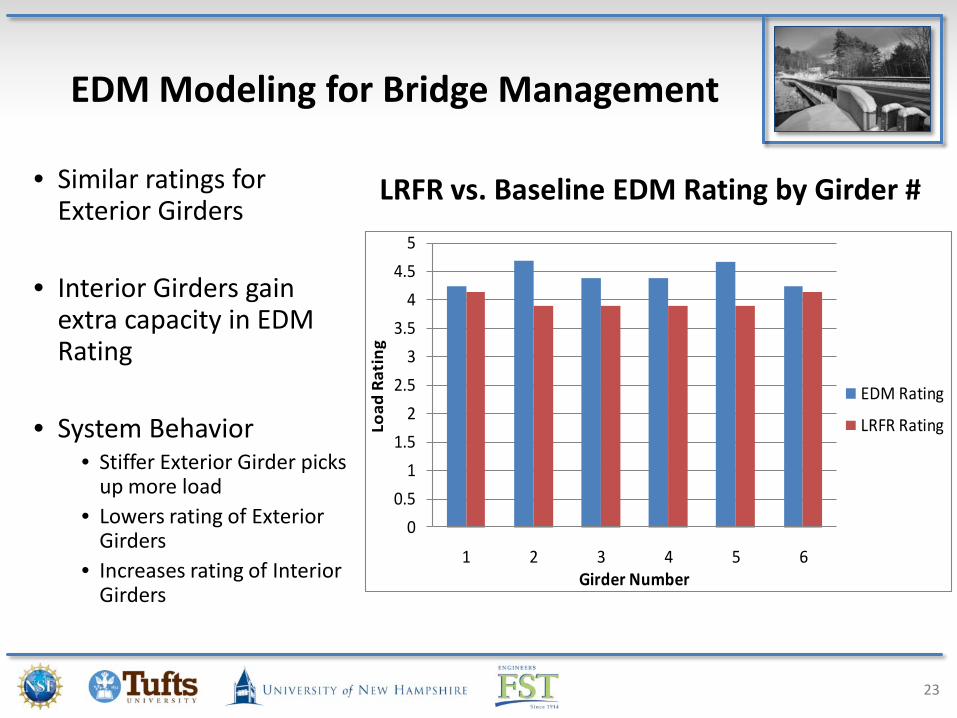
EDM Modeling for Bridge Management
• Similar ratings for Exterior Girders
• Interior Girders gain extra capacity in EDM Rating
• System Behavior• Stiffer Exterior Girder picks
up more load• Lowers rating of Exterior
Girders• Increases rating of Interior
Girders
23
LRFR vs. Baseline EDM Rating by Girder #
0
0.5
1
1.5
2
2.5
3
3.5
4
4.5
5
1 2 3 4 5 6
Load
Rat
ing
Girder Number
EDM Rating
LRFR Rating
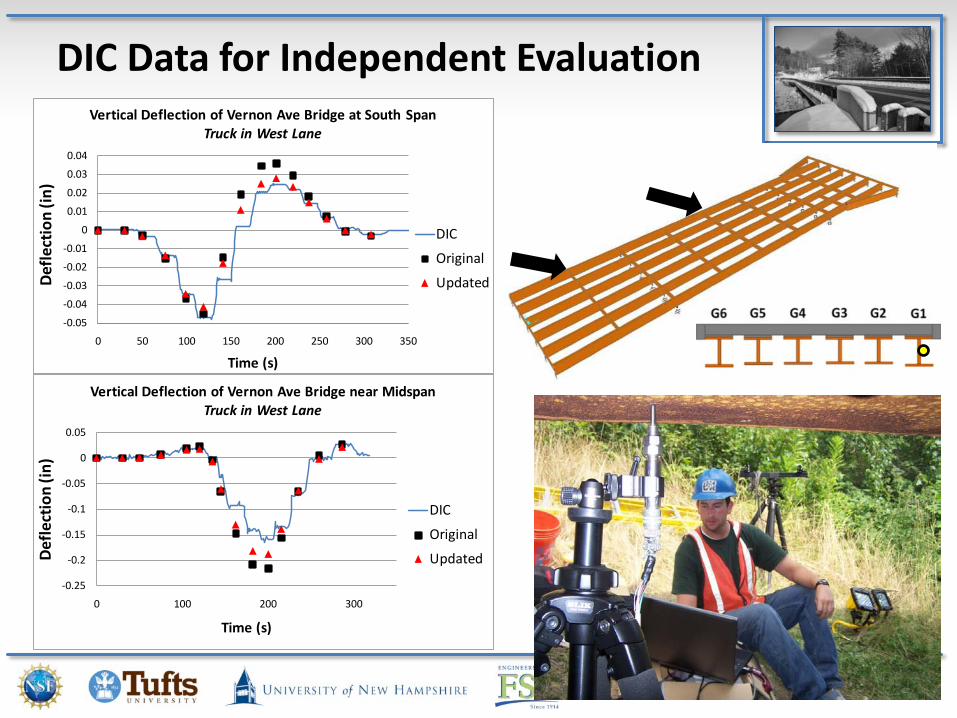
DIC Data for Independent Evaluation
24
-0.25
-0.2
-0.15
-0.1
-0.05
0
0.05
0 100 200 300
Def
lect
ion
(in)
Time (s)
Vertical Deflection of Vernon Ave Bridge near MidspanTruck in West Lane
DIC
Original
Updated
-0.05
-0.04
-0.03
-0.02
-0.01
0
0.01
0.02
0.03
0.04
0 50 100 150 200 250 300 350
Def
lect
ion
(in)
Time (s)
Vertical Deflection of Vernon Ave Bridge at South SpanTruck in West Lane
DIC
Original
Updated
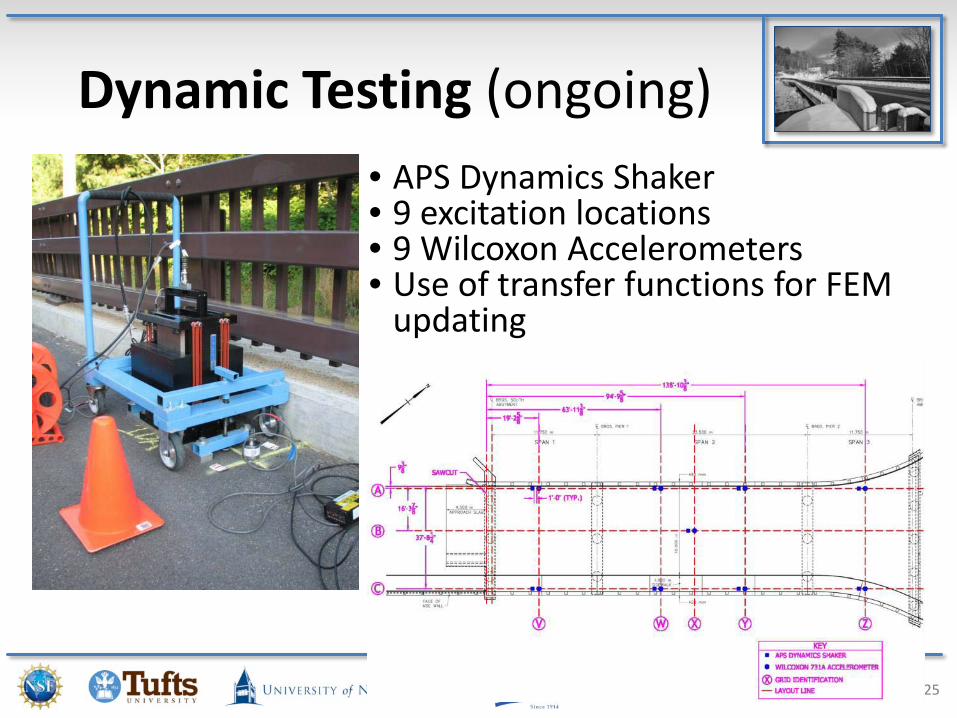
Dynamic Testing (ongoing)
25
• APS Dynamics Shaker• 9 excitation locations• 9 Wilcoxon Accelerometers• Use of transfer functions for FEM
updating
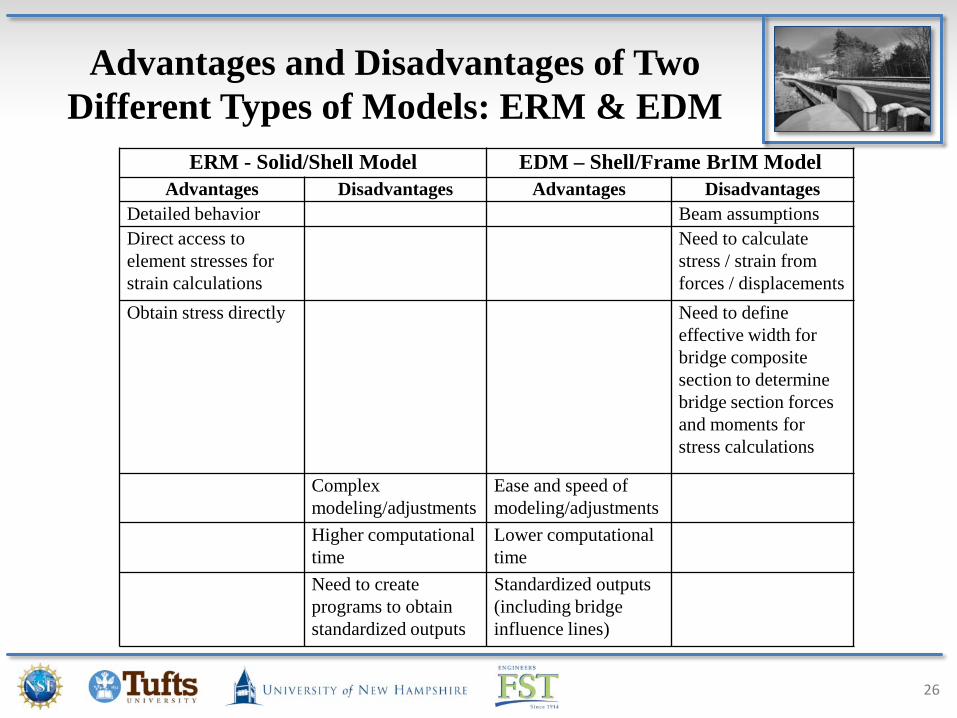
Advantages and Disadvantages of Two Different Types of Models: ERM & EDM
26
ERM - Solid/Shell Model EDM – Shell/Frame BrIM ModelAdvantages Disadvantages Advantages Disadvantages
Detailed behavior Beam assumptionsDirect access to element stresses for strain calculations
Need to calculate stress / strain from forces / displacements
Obtain stress directly Need to define effective width for bridge composite section to determine bridge section forces and moments for stress calculations
Complex modeling/adjustments
Ease and speed of modeling/adjustments
Higher computational time
Lower computational time
Need to create programs to obtain standardized outputs
Standardized outputs (including bridge influence lines)
Conclusions
• Detailed 3D FEM of typical highway bridges is feasible to a high degree of accuracy
• Truck load testing performed on a newly constructed bridge can provide highly reliable strain data for calibrating baseline FEM’s.
• DIC data verified the FEM independently
• Calibrated FEM and load test strain data matched closely
• There are pros and cons for using ERM and EDM.
• A calibrated FEM can be used as an effective tool for bridge management
27
The article, “Whatever Happened to Long-Term Bridge Design?”
From the abstract:• "The Chairman of the Board of one of the leading engineering
firms in the nation ponders the future of American bridges. In today’s designing of bridges, Thomas R. Kuesel points out that light, thin, elastic and graceful are the adjectives come to mind. He worries that old fashioned concepts of stiff, rugged and durable construction are not actively pursued by present day designers. He states the case for a long useful life for bridges and stresses the need for endurability.“
Ref: http://cedb.asce.org/cgi/WWWdisplay.cgi?9001040
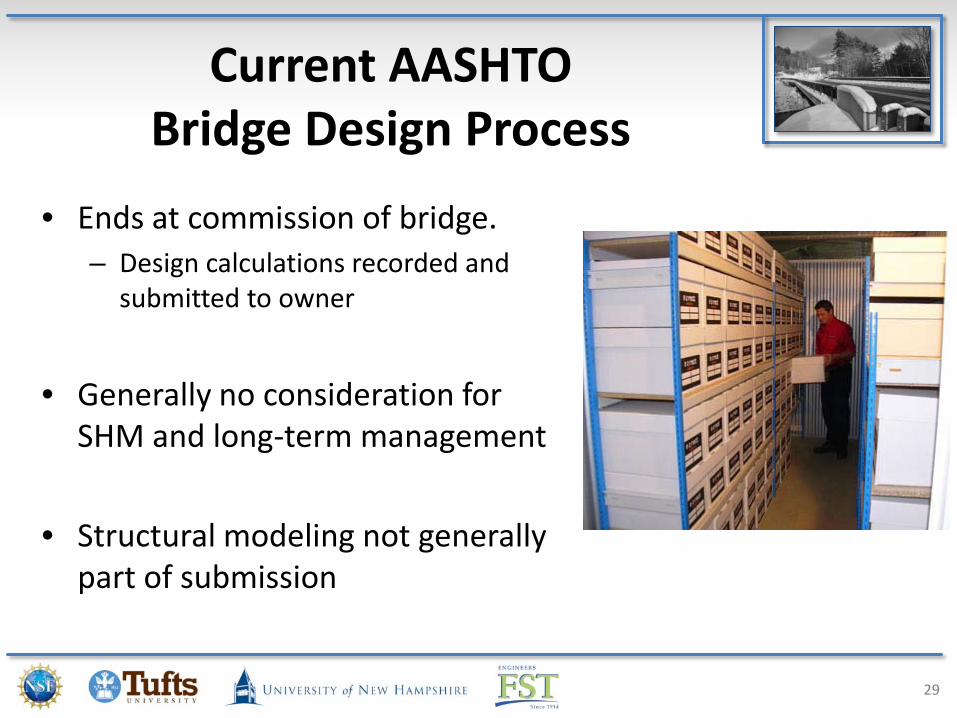
Current AASHTO Bridge Design Process
• Ends at commission of bridge. – Design calculations recorded and
submitted to owner
• Generally no consideration for SHM and long-term management
• Structural modeling not generally part of submission
29
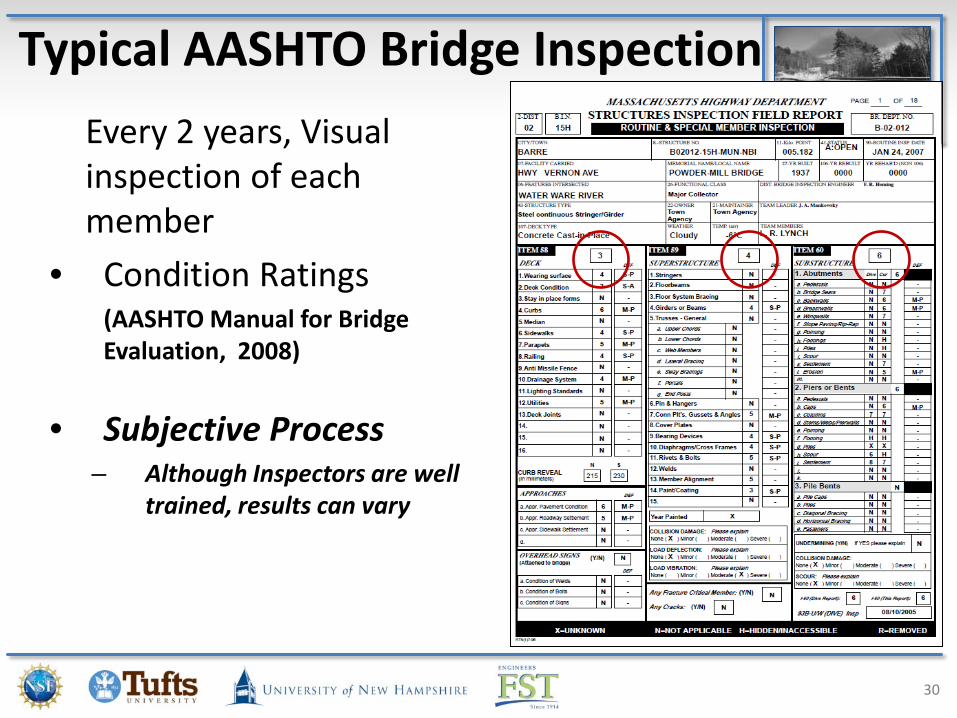
Every 2 years, Visual inspection of each member
• Condition Ratings(AASHTO Manual for Bridge Evaluation, 2008)
• Subjective Process– Although Inspectors are well
trained, results can vary
MHD Bridge Inspection Report, Vernon Ave Bridge, Jan 2007
Typical AASHTO Bridge Inspection
30
Central Thesis
• How is long term design is addressed in the design process?
• Leverage advancing technology (instrumentation, analysis, data management, remote sensing) to improve the bridge design process that currently focuses on opening day, but not the 75 years that follows opening day.
New Bridge Design Paradigm
• Go beyond opening day design– Creation of baseline model– Integrate baseline modeling and model updating
through bridge service life
• Modify reactive mode of bridge management– Develop useful and cost-effective bridge
instrumentation plan– Deploy practical nondestructive tests– Have continuous feedback from bridge about current
structural health
32
Baseline Model
Propose the development of a "baseline" model of the bridge during design and construction
–Verify initial design assumptions
–Live and Evolve with the bridge as a data management tool.
Research Motivation
• Leverage current technologies
• Bridge design today is elemental
• Bridge design is complete on opening day
• “Design intelligence” is not readily available during life of bridge
• Address long term behavior of bridges during initial design
Our Focus
We are focusing on:
• measuring objective, verifiable, and useful data for bridge SHM
• providing practical data useful to bridge owners
• providing data that will be easy to use by state agencies for bridge management
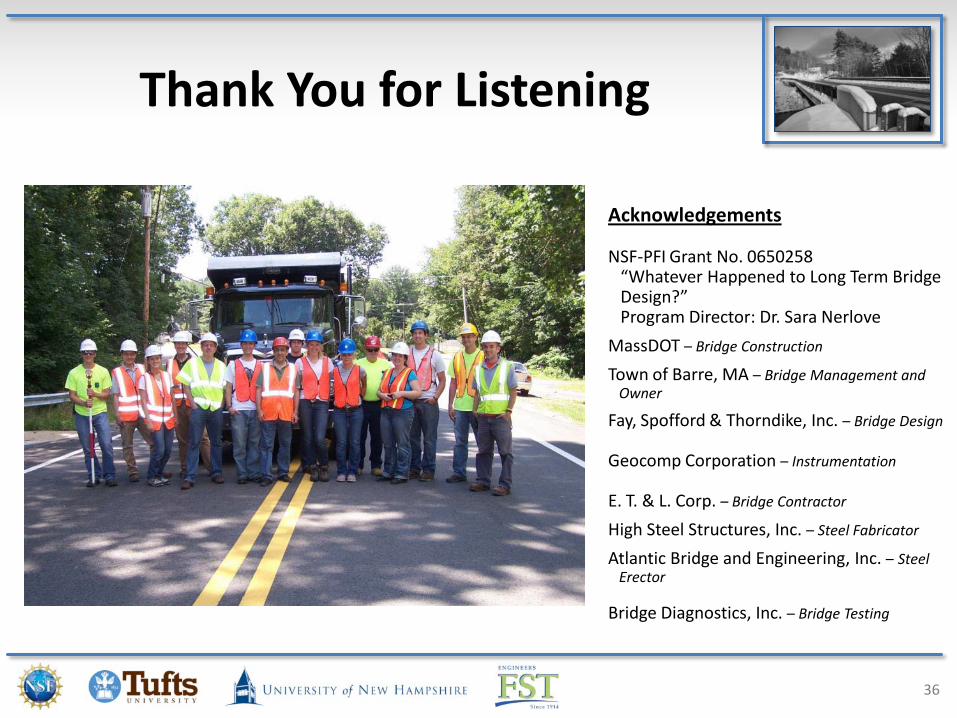
Thank You for Listening
36
Acknowledgements
NSF-PFI Grant No. 0650258“Whatever Happened to Long Term BridgeDesign?”Program Director: Dr. Sara Nerlove
MassDOT – Bridge Construction
Town of Barre, MA – Bridge Management andOwner
Fay, Spofford & Thorndike, Inc. – Bridge Design
Geocomp Corporation – Instrumentation
E. T. & L. Corp. – Bridge Contractor
High Steel Structures, Inc. – Steel Fabricator
Atlantic Bridge and Engineering, Inc. – SteelErector
Bridge Diagnostics, Inc. – Bridge Testing
Backup Slides
37
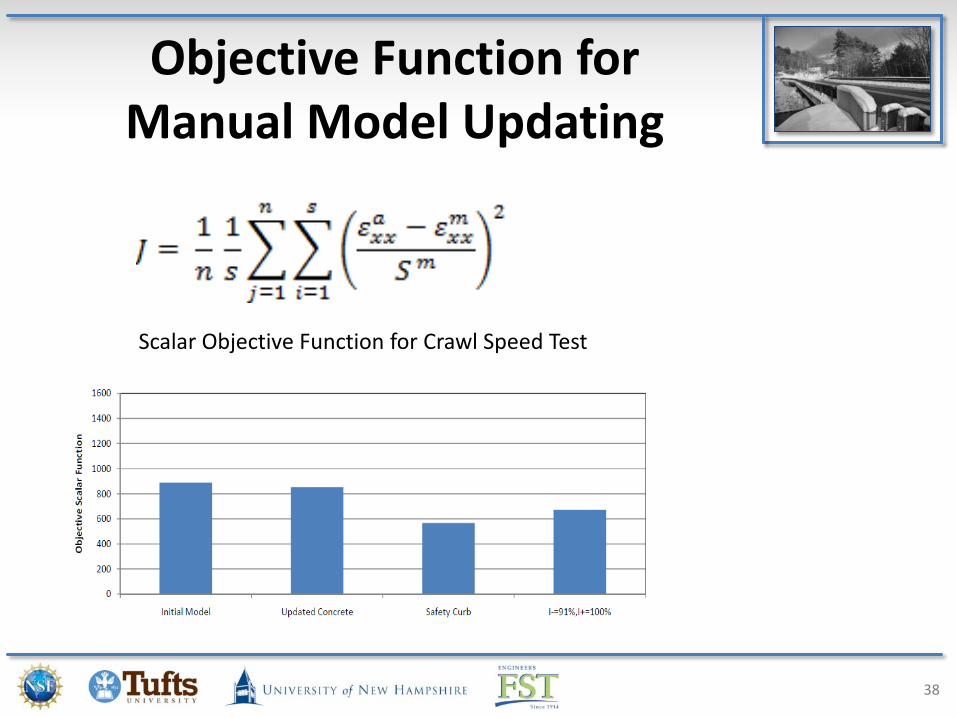
Objective Function forManual Model Updating
38
Scalar Objective Function for Crawl Speed Test
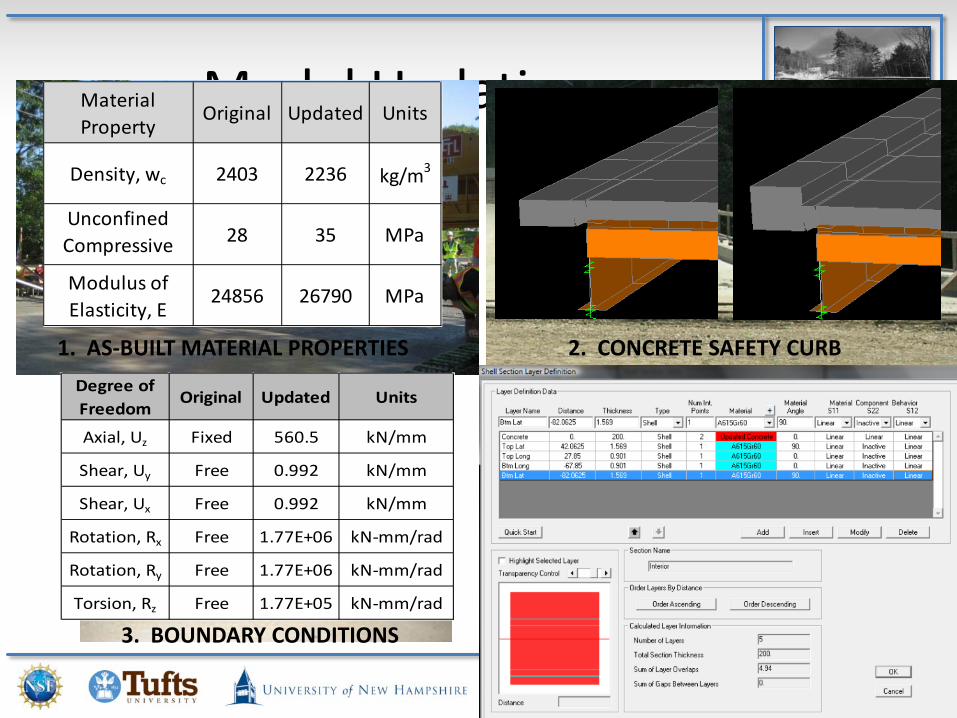
Model Updating
1. AS-BUILT MATERIAL PROPERTIES
3. BOUNDARY CONDITIONS
2. CONCRETE SAFETY CURB
4. DECK REINFORCEMENT
39
Material Property
Original Updated Units
Density, wc 2403 2236 kg/m3
Unconfined Compressive
28 35 MPa
Modulus of Elasticity, E
24856 26790 MPa
Degree of Freedom
Original Updated Units
Axial, Uz Fixed 560.5 kN/mm
Shear, Uy Free 0.992 kN/mm
Shear, Ux Free 0.992 kN/mm
Rotation, Rx Free 1.77E+06 kN-mm/rad
Rotation, Ry Free 1.77E+06 kN-mm/rad
Torsion, Rz Free 1.77E+05 kN-mm/rad
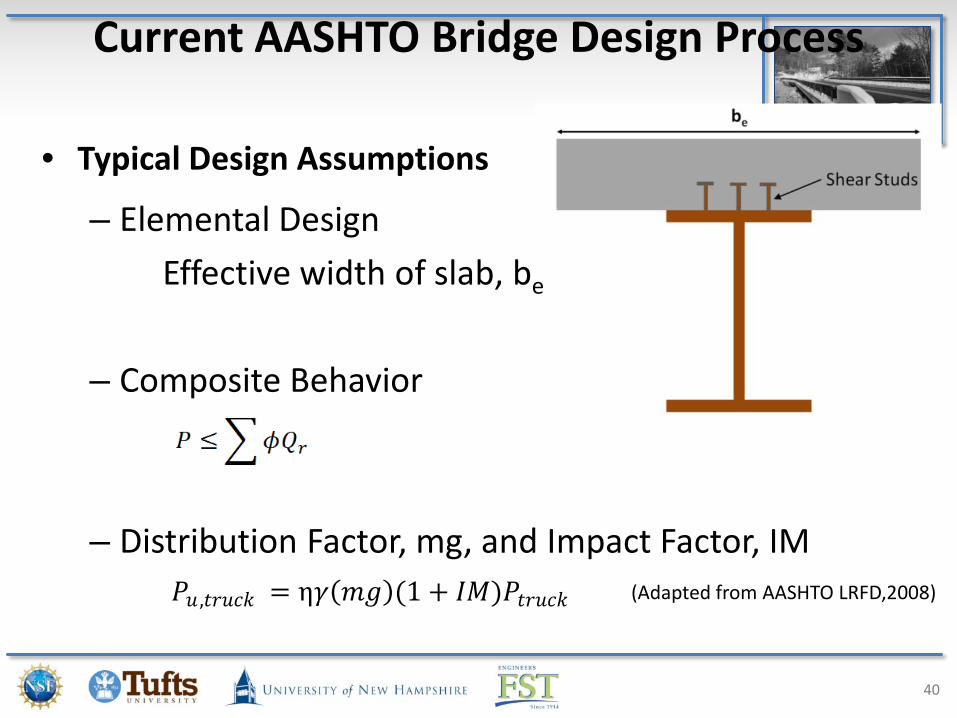
– Elemental Design
Effective width of slab, be
– Composite Behavior
– Distribution Factor, mg, and Impact Factor, IM
Current AASHTO Bridge Design Process
• Typical Design Assumptions
40
(Adapted from AASHTO LRFD,2008)𝑃𝑃𝑢𝑢 ,𝑡𝑡𝑡𝑡𝑢𝑢𝑡𝑡𝑡𝑡 = η𝛾𝛾(𝑚𝑚𝑚𝑚)(1 + 𝐼𝐼𝐼𝐼)𝑃𝑃𝑡𝑡𝑡𝑡𝑢𝑢𝑡𝑡𝑡𝑡
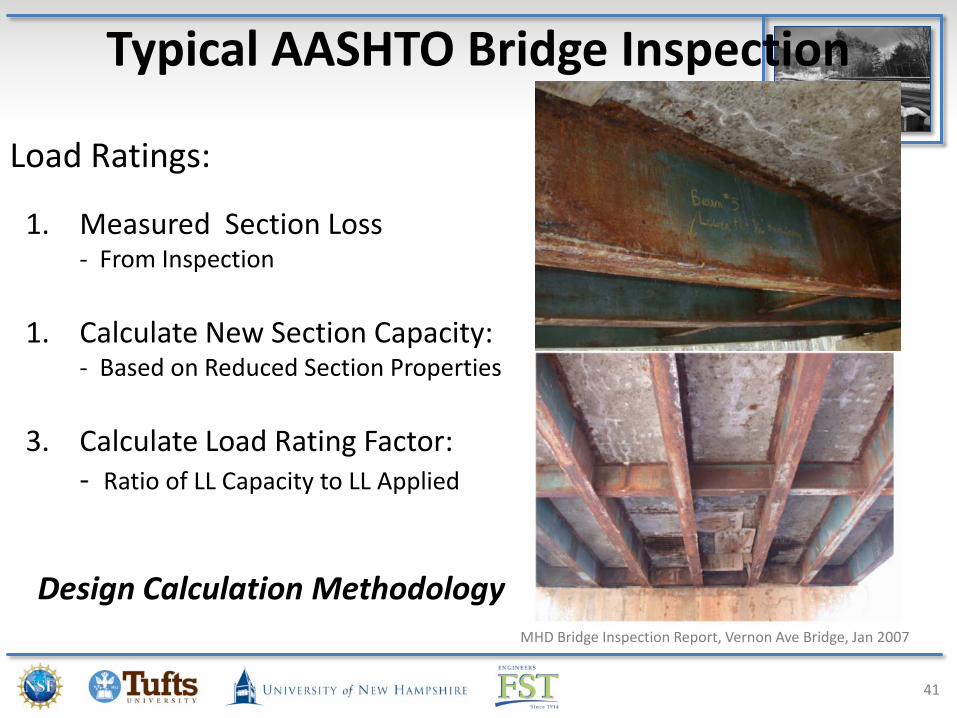
MHD Bridge Inspection Report, Vernon Ave Bridge, Jan 2007
Typical AASHTO Bridge Inspection
1. Measured Section Loss- From Inspection
1. Calculate New Section Capacity:- Based on Reduced Section Properties
3. Calculate Load Rating Factor:- Ratio of LL Capacity to LL Applied
Design Calculation Methodology
41
Load Ratings:
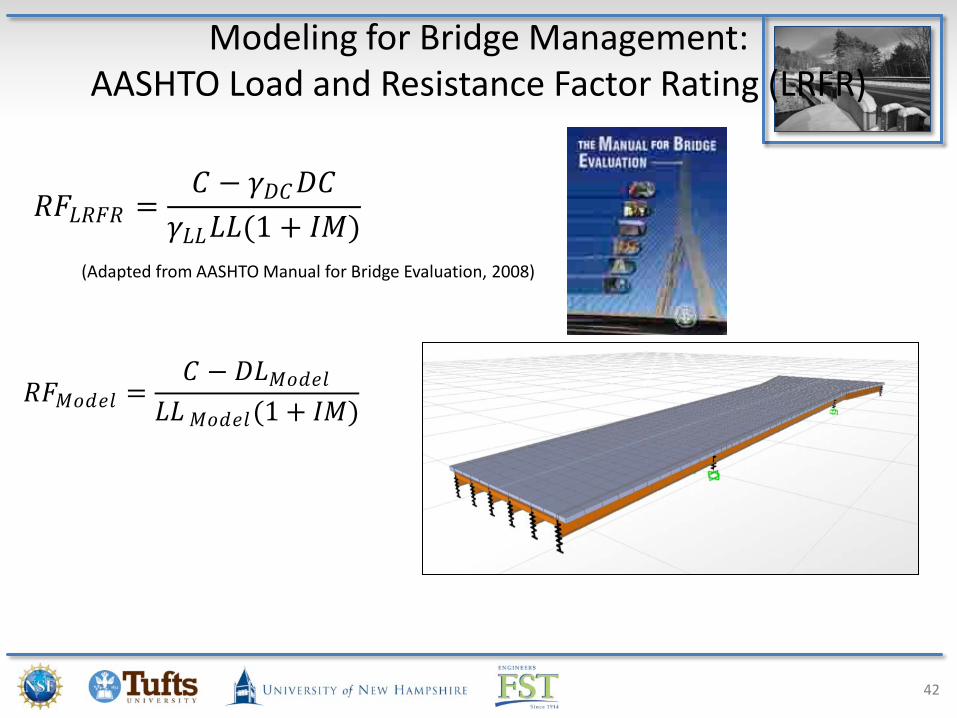
Modeling for Bridge Management: AASHTO Load and Resistance Factor Rating (LRFR)
42
(Adapted from AASHTO Manual for Bridge Evaluation, 2008)
𝑅𝑅𝐹𝐹𝐼𝐼𝑜𝑜𝑑𝑑𝑒𝑒𝑙𝑙 =𝐶𝐶 − 𝐷𝐷𝐿𝐿𝐼𝐼𝑜𝑜𝑑𝑑𝑒𝑒𝑙𝑙
𝐿𝐿𝐿𝐿 𝐼𝐼𝑜𝑜𝑑𝑑𝑒𝑒𝑙𝑙(1 + 𝐼𝐼𝐼𝐼)
𝑅𝑅𝐹𝐹𝐿𝐿𝑅𝑅𝐹𝐹𝑅𝑅 =𝐶𝐶 − 𝛾𝛾𝐷𝐷𝐶𝐶𝐷𝐷𝐶𝐶
𝛾𝛾𝐿𝐿𝐿𝐿𝐿𝐿𝐿𝐿(1 + 𝐼𝐼𝐼𝐼)
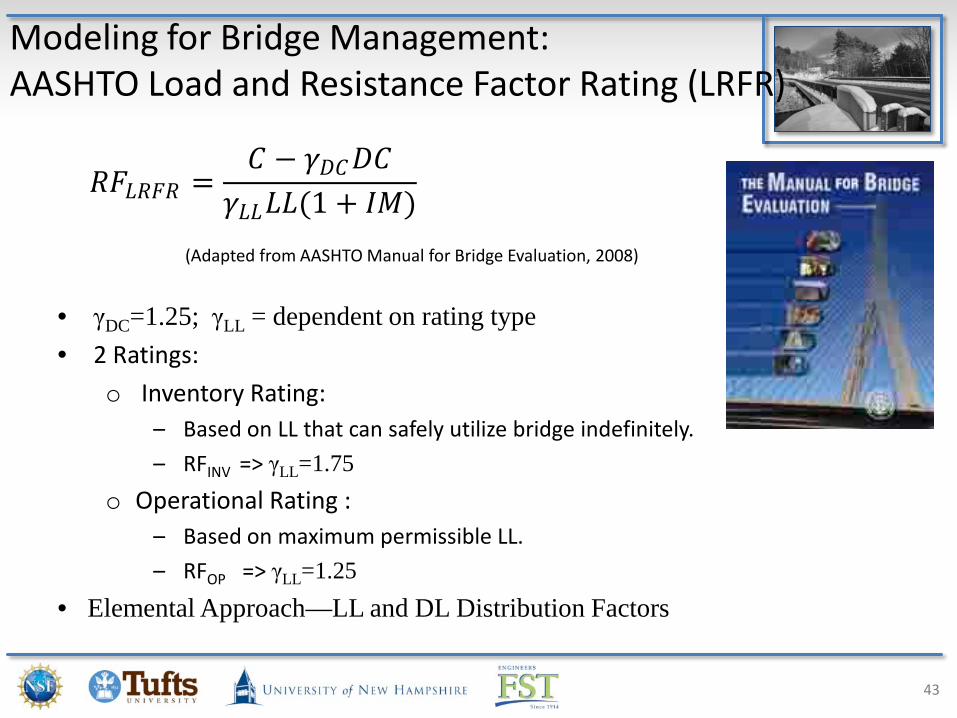
Modeling for Bridge Management: AASHTO Load and Resistance Factor Rating (LRFR)
• γDC=1.25; γLL = dependent on rating type• 2 Ratings:
o Inventory Rating: – Based on LL that can safely utilize bridge indefinitely.
– RFINV => γLL=1.75o Operational Rating :
– Based on maximum permissible LL.
– RFOP => γLL=1.25• Elemental Approach—LL and DL Distribution Factors
43
(Adapted from AASHTO Manual for Bridge Evaluation, 2008)
𝑅𝑅𝐹𝐹𝐿𝐿𝑅𝑅𝐹𝐹𝑅𝑅 =𝐶𝐶 − 𝛾𝛾𝐷𝐷𝐶𝐶𝐷𝐷𝐶𝐶
𝛾𝛾𝐿𝐿𝐿𝐿𝐿𝐿𝐿𝐿(1 + 𝐼𝐼𝐼𝐼)
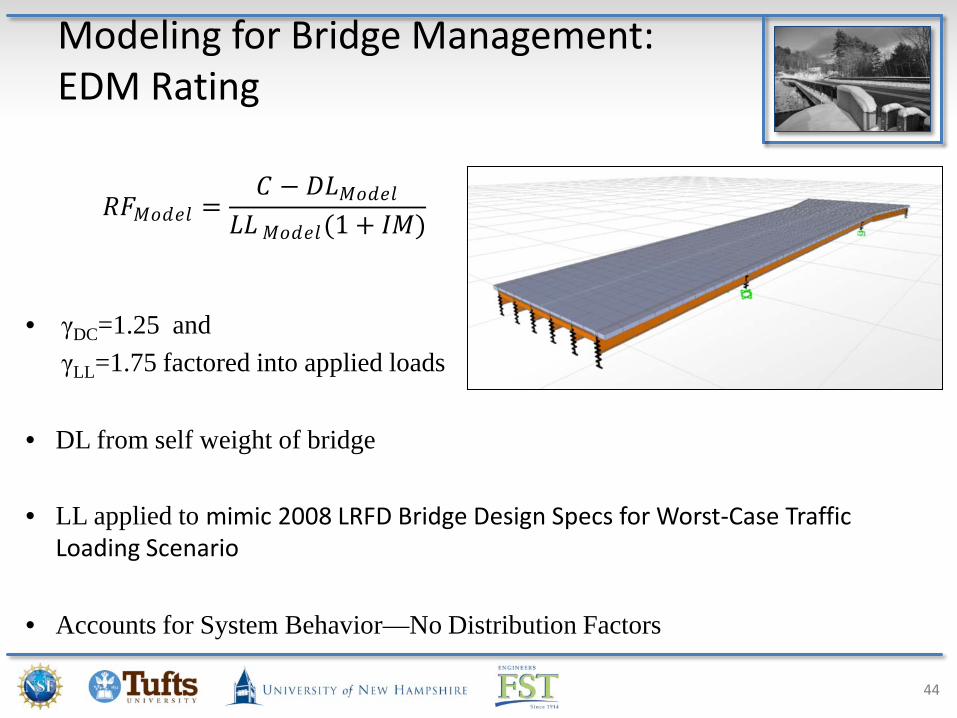
Modeling for Bridge Management: EDM Rating
• γDC=1.25 and γLL=1.75 factored into applied loads
• DL from self weight of bridge
• LL applied to mimic 2008 LRFD Bridge Design Specs for Worst-Case Traffic Loading Scenario
• Accounts for System Behavior—No Distribution Factors
44
𝑅𝑅𝐹𝐹𝐼𝐼𝑜𝑜𝑑𝑑𝑒𝑒𝑙𝑙 =𝐶𝐶 − 𝐷𝐷𝐿𝐿𝐼𝐼𝑜𝑜𝑑𝑑𝑒𝑒𝑙𝑙
𝐿𝐿𝐿𝐿 𝐼𝐼𝑜𝑜𝑑𝑑𝑒𝑒𝑙𝑙(1 + 𝐼𝐼𝐼𝐼)