bridge structures - school of...
TRANSCRIPT
This article was downloaded by:[Santini-Bell, Erin]On: 22 July 2008Access Details: [subscription number 794993252]Publisher: Taylor & FrancisInforma Ltd Registered in England and Wales Registered Number: 1072954Registered office: Mortimer House, 37-41 Mortimer Street, London W1T 3JH, UK
Bridge StructuresAssessment, Design and ConstructionPublication details, including instructions for authors and subscription information:http://www.informaworld.com/smpp/title~content=t713683501
Nondestructive testing for design verification of Boston'sCentral Artery underpinning frames and connectionsErin Santini-Bell a; Masoud Sanayei b; Brian Brenner c; Jesse Sipple a; AdamBlanchard da Department of Civil Engineering, University of New Hampshire, Durham, NH, USAb Department of Civil and Environmental Engineering, Tufts University, Medford, MA,USAc Fay, Spofford & Thorndike, Burlington, MA, USAd LeMessurier Consultants, Cambridge, MA, USA
Online Publication Date: 01 June 2008
To cite this Article: Santini-Bell, Erin, Sanayei, Masoud, Brenner, Brian, Sipple, Jesse and Blanchard, Adam (2008)'Nondestructive testing for design verification of Boston's Central Artery underpinning frames and connections', BridgeStructures, 4:2, 87 — 98
To link to this article: DOI: 10.1080/15732480802246337URL: http://dx.doi.org/10.1080/15732480802246337
PLEASE SCROLL DOWN FOR ARTICLE
Full terms and conditions of use: http://www.informaworld.com/terms-and-conditions-of-access.pdf
This article maybe used for research, teaching and private study purposes. Any substantial or systematic reproduction,re-distribution, re-selling, loan or sub-licensing, systematic supply or distribution in any form to anyone is expresslyforbidden.
The publisher does not give any warranty express or implied or make any representation that the contents will becomplete or accurate or up to date. The accuracy of any instructions, formulae and drug doses should beindependently verified with primary sources. The publisher shall not be liable for any loss, actions, claims, proceedings,demand or costs or damages whatsoever or howsoever caused arising directly or indirectly in connection with orarising out of the use of this material.

Dow
nloa
ded
By:
[San
tini-B
ell,
Erin
] At:
18:0
3 22
Jul
y 20
08
Nondestructive testing for design verification of Boston’s Central Artery underpinning
frames and connections
Erin Santini-Bella*, Masoud Sanayeib, Brian Brennerc, Jesse Sipplea and Adam Blanchardd
aDepartment of Civil Engineering, University of New Hampshire, Durham, NH 03824, USA; bDepartment of Civil andEnvironmental Engineering, Tufts University, Medford, MA 02155, USA; cFay, Spofford & Thorndike, Burlington, MA 01803,
USA; dLeMessurier Consultants, Cambridge, MA 02139, USA
Prior to the demolition of the Boston Central Artery viaduct in March 2004, a research team implemented aprogramme of nondestructive testing for design verification of two structural steel highway bents. The tested supportbents were used to underpin the original Interstate-93 Central Artery viaduct during construction of the new cut-and-cover tunnel below it. Upon opening of the tunnels, traffic was rerouted from the elevated viaduct to the newtunnel, and the demolition process of the viaduct structure began. Two of the remaining support bents of theunderpinning structure were fitted with sensors (strain gages, tiltmeters, slide wire potentiometers, and a 50 kip(222.4 kN) load cell) and loaded by a 50-ton (444.8 kN) crane. The measured structural response was compared tothe expected response from finite element structural models, and the structural models were updated using parameterestimation techniques for design verification. Using as-built information, considering original design assumptions,and parameter estimation simulation results, the researchers selected a set of sensor types and locations for thenondestructive field test. Key design parameters of the underpinning finite element model such as connectionstiffness values were successfully estimated using structural parameter estimation. As a result, the updated structuralresponse correlated well with the collected nondestructive test data.
Keywords: nondestructive testing; model updating; structural parameter estimation; design verification
Introduction
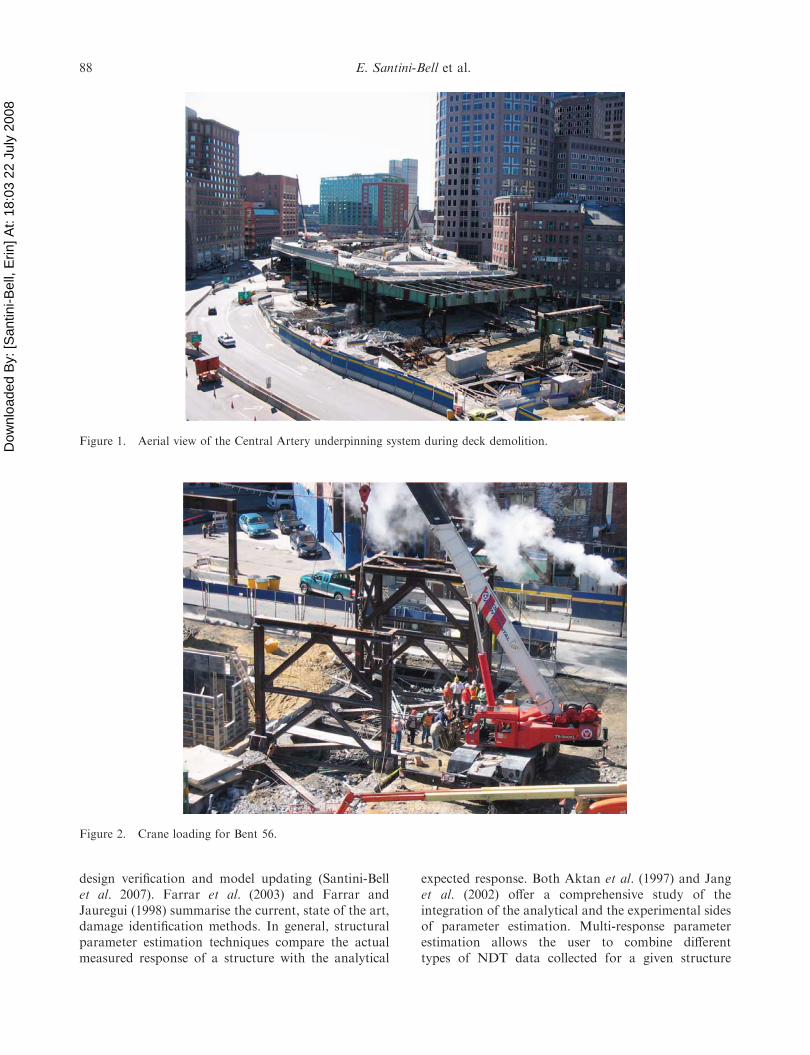
As part of the Central Artery/Tunnel project inBoston, the existing six lane steel framed CentralArtery viaduct was replaced by an 8–10 lane cut-and-cover tunnel. The viaduct remained in service duringtunnel construction. To allow for excavation below theviaduct, the existing foundations were underpinned bya series of steel frame bents (Harrington 1998). Thenew highway tunnel was opened in stages: northboundlanes in March 2003 and southbound lanes inDecember 2003. With traffic rerouted to the newtunnels, demolition proceeded on the existing viaductstructure. The procedure for demolition was to removethe existing highway superstructure, temporarily ex-posing the steel underpinning frames before these werealso demolished, as shown in Figure 1. Prior to thefinal demolition, two underpinning frames were thesubjects of a series of nondestructive tests (NDTs) tocollect measurements for structural design verificationand finite element model (FEM) updating. Loadingand measuring the performance of the steel bents, Bent56 (shown in Figure 2) and Bent 57 (shown in Figure 3)
provided a unique opportunity for structural in situtesting and response measurements.
The goals of the NDTs were to perform designverification and to perform structural parameter esti-mation. The process of design verification involvedrevisiting the original design assumptions and compar-ing the in situ performance of the structure to thepredicted response. Structural parameter estimationinvolved adjustment of stiffness parameters of theanalytical model at the element level to match measuredperformance. Structural parameter estimation can beused to determine the stiffness-related parameters of astructural member, such as axial rigidity, bendingrigidity, and torsional rigidity using applied loads andmeasured responses. The estimated parameter valuesare then compared to the design values of theparameters for design verification and model updating.
Structural parameter estimation is the process ofreconciling an a priori FEM of the structure with NDTdata from the structure. It has great potential for thepurpose of damage identification and structural con-dition assessment of in-service structures, as well as
*Corresponding author. Email: [email protected]
Bridge Structures
Vol. 4, No. 2, June 2008, 87–98
ISSN 1573-2487 print/ISSN 1744-8999 online
� 2008 Taylor & Francis
DOI: 10.1080/15732480802246337
http://www.informaworld.com
Dow
nloa
ded
By:
[San
tini-B
ell,
Erin
] At:
18:0
3 22
Jul
y 20
08
design verification and model updating (Santini-Bellet al. 2007). Farrar et al. (2003) and Farrar andJauregui (1998) summarise the current, state of the art,damage identification methods. In general, structuralparameter estimation techniques compare the actualmeasured response of a structure with the analytical
expected response. Both Aktan et al. (1997) and Janget al. (2002) offer a comprehensive study of theintegration of the analytical and the experimental sidesof parameter estimation. Multi-response parameterestimation allows the user to combine differenttypes of NDT data collected for a given structure
Figure 1. Aerial view of the Central Artery underpinning system during deck demolition.
Figure 2. Crane loading for Bent 56.
88 E. Santini-Bell et al.

Dow
nloa
ded
By:
[San
tini-B
ell,
Erin
] At:
18:0
3 22
Jul
y 20
08
(Santini-Bell 2003). During this NDT of the under-pinning frame, static displacement using a slide wirepotentiometer, rotations using Geomechanic Model900 high gain tiltmeters and strains using ¼-inch straingages from Vishay measurements were collected(see Figure 4). Multi-response structural parameterestimation combines algorithms for strains (Sanayeiet al. 1997) and displacements and rotations (Sanayeiand Nelson 1986).
Design verification involves using nondestructivetesting methods on an existing structure to verifyassumptions made during the original design phase.Several researchers have investigated issues relating tomonitoring and design verification. Xu and Zhu (2000)collected field measurements from the Tsing Masuspension bridge during Typhoon Victor. The objec-tive of the research was to measure wind behaviour butdesign verification was not specifically included in thepresented research. McElwain and Laman (2000)investigated in-service bridge behaviour in comparisonto AASHTO code estimates without performing designverification. Myrvoll et al. (2000) performed a full-scale test for design verification of bridge structures.Tang et al. (2005) used finite element analysis for
damage analysis for reinforced concrete arch struc-tures. In Nowak et al. (2000), several bridges wereproof-loaded with tanks in order to calculate actualstress response levels. Feng et al. (2004) introduced theidea of a baseline model for structural healthmonitoring of in-service bridges but does not carrythe concept into the initial design of the structure. Shiuet al. (1990) discussed the idea of design verification fora cable-stayed bridge but did not address applicationto medium-span service bridges.
The research presented is part of a comprehensiveresearch effort, funded by the National ScienceFoundation, to shift the bridge design paradigm toinclude instrumentation, testing, design verificationand structural modelling (Santini-Bell et al. 2007). Anydifferences between the assumed design parametersand the estimated parameters can help to reveal thecurrent condition of the structure. Using a discretemathematical model, such as a FEM, the stiffnessparameter estimates reveal not only damage locationbut also damage severity. Parameter estimation canalso determine the current load rating of an in-servicebridge accounting for any loss in stiffness during thelife of the bridge. It can also be used to predict theremaining life of in-service structures given currentloading conditions.
Nondestructive testing
Two steel underpinning frames were selected fornondestructive testing, Figure 2 shows the east highpick up frame at Central Artery Bent 56 and Figure 3shows the west frame at Bent 57 (numbering refers tothe original bent designation from the 1950s highwayconstruction, where Bent 1 was the support frame
Figure 4. Detail of strain gauge and tiltmeter connections.
Figure 3. Bent 57 with PVC pipe protection for the slidewire potentiometer to measure displacements.
Bridge Structures 89
Dow
nloa
ded
By:
[San
tini-B
ell,
Erin
] At:
18:0
3 22
Jul
y 20
08 furthest to the north at the Charles River). At the time
of testing, the I-93 viaduct had been demolished,temporarily leaving the steel support frames in place.This paper will focus on instrumentation, testing andanalysis of Bent 57, a moment frame with no cross-bracing. These frames were located at the end of BroadStreet in downtown Boston. They were tested after thebridge deck and connecting girders were removed aspart of the demolition of the entire elevated viaduct(Figure 1).
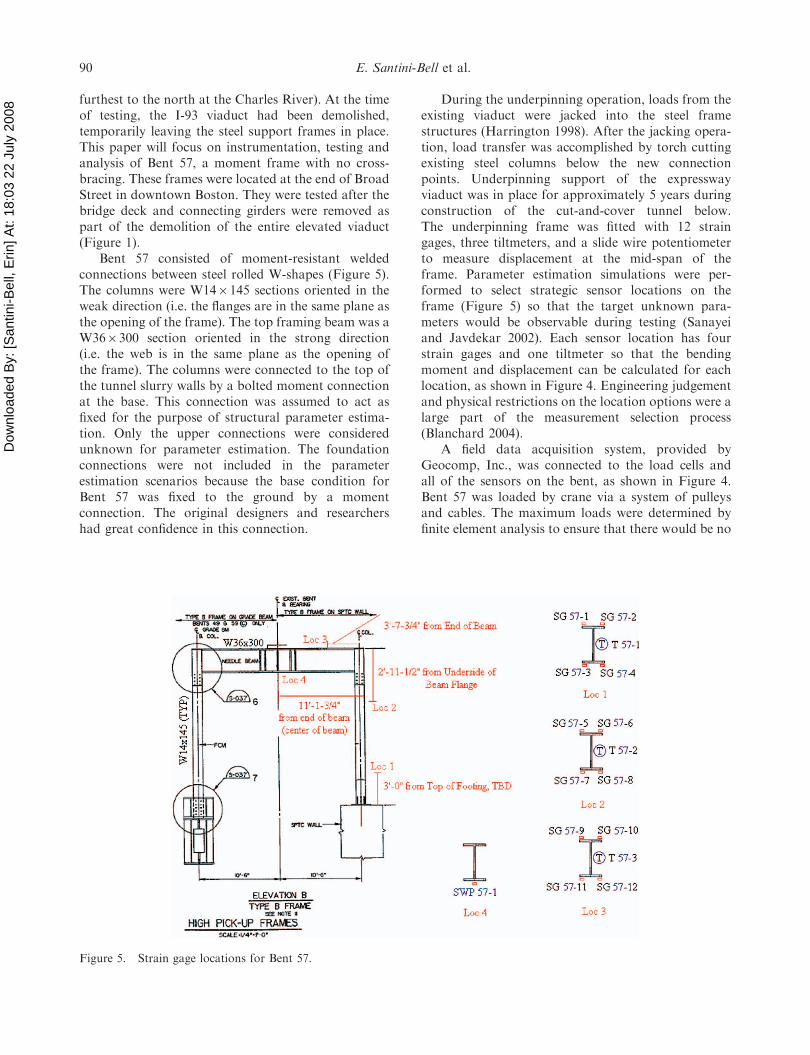
Bent 57 consisted of moment-resistant weldedconnections between steel rolled W-shapes (Figure 5).The columns were W146145 sections oriented in theweak direction (i.e. the flanges are in the same plane asthe opening of the frame). The top framing beam was aW366300 section oriented in the strong direction(i.e. the web is in the same plane as the opening ofthe frame). The columns were connected to the top ofthe tunnel slurry walls by a bolted moment connectionat the base. This connection was assumed to act asfixed for the purpose of structural parameter estima-tion. Only the upper connections were consideredunknown for parameter estimation. The foundationconnections were not included in the parameterestimation scenarios because the base condition forBent 57 was fixed to the ground by a momentconnection. The original designers and researchershad great confidence in this connection.
During the underpinning operation, loads from theexisting viaduct were jacked into the steel framestructures (Harrington 1998). After the jacking opera-tion, load transfer was accomplished by torch cuttingexisting steel columns below the new connectionpoints. Underpinning support of the expresswayviaduct was in place for approximately 5 years duringconstruction of the cut-and-cover tunnel below.The underpinning frame was fitted with 12 straingages, three tiltmeters, and a slide wire potentiometerto measure displacement at the mid-span of theframe. Parameter estimation simulations were per-formed to select strategic sensor locations on theframe (Figure 5) so that the target unknown para-meters would be observable during testing (Sanayeiand Javdekar 2002). Each sensor location has fourstrain gages and one tiltmeter so that the bendingmoment and displacement can be calculated for eachlocation, as shown in Figure 4. Engineering judgementand physical restrictions on the location options were alarge part of the measurement selection process(Blanchard 2004).
A field data acquisition system, provided byGeocomp, Inc., was connected to the load cells andall of the sensors on the bent, as shown in Figure 4.Bent 57 was loaded by crane via a system of pulleysand cables. The maximum loads were determined byfinite element analysis to ensure that there would be no
Figure 5. Strain gage locations for Bent 57.
90 E. Santini-Bell et al.

Dow
nloa
ded
By:
[San
tini-B
ell,
Erin
] At:
18:0
3 22
Jul
y 20
08 out-of-plane displacement. A maximum vertical load
of up to 50 kips (222.4 kN) was measured at thecontact point on the structure through a load cell(Figure 6a). Physical restrictions of the crane requiredthat a grounded pulley be used to apply lateral loads(Figure 6b). For lateral loading of Bent 57, bracketswere welded to the Bent 58 across Broad Streetimmediately to the south. A maximum horizontalload of up to 25 kips (111.2 kN) was measured at thecontact point on the structure through a load cell(Figure 6b). The load was measured using a load cellattached directly to the loading frame. During theNDT of the frame, applied loads, strains, tilts, anddisplacements were measured at predetermined loadingand unloading intervals of 10 kip each (44 kN). Eachloading and unloading cycle was repeated three times.Figure 7 shows the load–displacement curve for thetop beam of Bent 57 for load case 1. Note that onlyone displacement measurement was collected duringthe load test using the slide wire potentiometer.
Both measurements for strain and rotation werereference-independent, so there was no need tomeasure against a datum. The slide wire potentio-meter (SWP) for displacement was not a reference-independent instrument, so it needed to be connected toa datum point. The SWP was secured to the ground anda steel wire was extended and connected to the centre ofthe W366300 needle beam. A PVC conduit was used toshield the wire from wind-induced vibrations (Figure 3).The strain gages were spot welded onto the frame at
specified locations shown in Figure 4. The tiltmeterswere clamped onto the structure so that they could bereused. The temperature was not considered in the post-processing of the data given that the actual test for eachframe occurred within a 1 h window and the tempera-ture differential was negligible.
Structural model
Figure 8 shows the deformed shape of the structuralmodel for Bent 57 with pinned connections. Themodel was prepared using GT Strudl1, 29.1 (GTStrudl 2006). Member properties were calculatedusing as-built shop drawings, noting that the structurewas in place for less than 10 years and visualinspection indicated no signs of corrosion or structur-al damage. Two FEMs were created assuming bothpinned and full fixity at column base supports. Table1 shows the results from both connections types.Initially, the shear deformation of the beam wasignored, assuming that it was negligible. However,given the depth-to-length ratio of the beam, sheardeformation was considered as part of the designverification process. The only unknown parametersconsidered in the structure were the rotationalstiffness values of the two connections between thecolumns and the beam at the top of the frame.
The structural model of Bent 57 was analysedto produce baseline responses for correlation withthe field measurement. The strains, rotations, and
Figure 6. (a) Load cell on Bent 57 measuring load transferred directly to the steel frame. (b) Lateral load applied to Bent 57using a bracket, load cell, and cable connected to adjacent bent (modified for clarity).
Bridge Structures 91

Dow
nloa
ded
By:
[San
tini-B
ell,
Erin
] At:
18:0
3 22
Jul
y 20
08
displacements measured from the NDT werecharted along with the strains, rotations, and dis-placements from the FEM for comparison.
Data quality analysis was performed (Blanchard2004) on the raw data to select the measurementset for parameter estimation and design verification.The data quality analysis was based on the comparisonof the measured response with the expected responseas well as repeatability patterns within the measureddata sets.
Parameter estimation
The Matlab1-based parameter estimation program,PARIS� (PARameter Identification System, Sanayei1997), developed at Tufts University, estimates theparameters of the elements and connections of astructure’s FEM (Figure 9). The structure canbe excited either statically with applied loads, F,
Table 1. Summary of simulated results for varying upperconnection stiffness values for Bent 57.
Connectionstiffness
Connectionstiffnessvalue
in.-kip/radian(m-kN/radian)
Connectionmoment
Mid-spandeflection,in. (cm)
‘Pinned’ 104 (11.36103) no moment 0.03822(0.0976)
‘Fixed’ 107 (11.36106) large moment 0.03692(0.09194)
Figure 7. Deflected shape of Bent 57 top beam due to load case 1.
Figure 8. Deformed shape of the finite element model of Bent 57. (a) Vertical loading and (b) horizontal loading.
92 E. Santini-Bell et al.

Dow
nloa
ded
By:
[San
tini-B
ell,
Erin
] At:
18:0
3 22
Jul
y 20
08
measuring displacements and rotations, U, and staticstrains or dynamically measuring frequency responsefunction and extracting natural resonance frequencies,o, and associated mode shapes, F, for stiffness andmass parameter estimation. A selected number ofmeasurements gathered sparsely at certain strategicallyselected degrees of freedom (DOF) were used forparameter estimation.
For this research, only the static stiffness displace-ment and rotation-based and strain error functionwas used for parameter estimation. A full explanationof other error functions that are used for multi-response parameter estimation available in PARIS�is given in Santini-Bell et al. (2007). Although thismulti-response parameter estimation protocol providesthe user with an additional opportunity for data use,the user must also use engineering judgement to ensure
that only compatible measurement sets are combined,for example all selected measurement sets must capturethe linear-elastic response of the structure. A briefoverview of both error functions is presented here.
Static stiffness-based error function
The static stiffness based error function, [Ess(p)](Sanayei and Nelson 1986, Sanayei et al. 1992) isdeveloped using the finite element equilibrium, equa-tion (1), for linear elastic structures. Using partitioningand static condensation, the unmeasured data pointsare removed resulting in an algebraically non-linearerror function
½F� ¼ ½K�½U� ð1Þ
Figure 9. Flowchart for parameter estimation in PARIS�.
Bridge Structures 93

Dow
nloa
ded
By:
[San
tini-B
ell,
Erin
] At:
18:0
3 22
Jul
y 20
08 [Ua], [Fa] and [Fb] are considered as known measured
data. Essentially [Ess(p)] is residual forces at themeasured DOF (2). [Fpredicted] is based on themeasurements, [Ua], and submatrices of the analytical[K]. [Fmeasured] is the applied set of forces
½EssðpÞ� ¼ ½Fpredicted� � ½Fmeasured� ð2Þ
The resulting matrix, [Ess(p)] is NMDOF6NSF, whereNMDOF is the number of DOF measured per loadcase (LC) and NSF is the number of applied force setsor load cases.
Static strain error function
Displacements and rotations are not the only type ofmeasurements that can be collected during a NDT. ANDT can be designed to collect strain data. Strains aretypically much smaller in magnitude than displace-ments and easier to collect in the field. Manyresearchers believe that strain gauges record morerobust measurements and are reference independent.Due to this fact, the static strain error function,[Esstr(p)], was developed using strain data inthe parameter estimation procedure (Sanayei andSaletnik 1996a,b). In equation (3), [B] is a mappingor compatibility matrix that is created using theuser-input data regarding the location of the strainmeasurements along the element in the x- and y-direction for a two-dimensional frame element and inthe x-, y- and z-direction for a three-dimensional frameelement
½e� ¼ B½ � U½ � ð3Þ
The analytical strains, [e] are predicted using appliedforces and analytical stiffness matrix, [K]. The mea-sured strains, [emeasured], are measured during an NDT.[Esstr(p)] is based on residual strain measurements
½EsstrðpÞ� ¼ ½epredicted� � ½emeasured� ð4Þ
Parameter estimation trials using NDT data
The assumption of a fixed base connection wasconfirmed using simulated parameter estimation runsin an attempt to find more appropriate connectionstiffness values. For each parameter estimation simula-tion, a different base condition was used included full,partial, and no fixity. The final base connectionstiffness estimated was approximately 1010 in.-kip/radian (11.36109 m-kN/radian), which closely ap-proximates a fixed connection, as assumed by theoriginal design. The rotational stiffness of the two
upper connections, designed as ‘fixed’ or infinitely stiff,were the main focus of the parameter estimation. Bydefinition, all of the beam-to-column connections ofBent 57, a moment frame, are full penetration weldedmoment connections. Several iterations of structuralanalysis were conducted using the FEM of Bent 57with differing connection stiffness values. Resultingresponses with respect to connection stiffnesses areshown in Table 1.
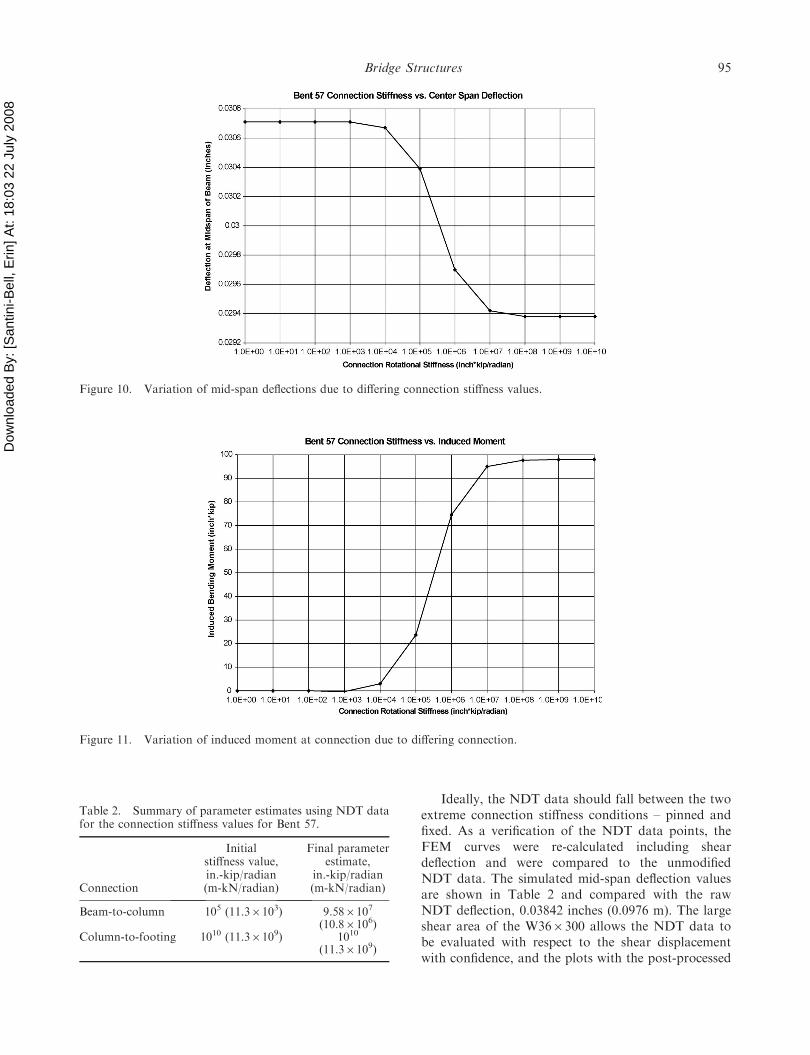
Figures 10 and 11 present the effect of estimatedconnections stiffness values on the resulting mid-spandeflection and connection moments, respectively.These figures indicate that there is a significant changein both deflection and moment when a stiffness ofapproximately 104 in.-kip/radian (11.36106 m-kN/radian SI units) is used and then the rate of changeslows down again at 108 in.-kip/radian (11.36107 m-kN/radian). Bent 57 was designed as a ‘moment frame’with the assumption of a stiff connection. Theparameter estimates values for Bent 57 using theNDT data are shown in Table 2.
The converged parameter estimates for the con-nection stiffness values were then used to update theFEM. The structural responses of the three differentconnection conditions were then compared: pinned,fixed, and the converged condition (Pcon). Pcon wascalculated by PARIS� using the collected measuredresponse. As expected, the deflected shape shownin Figure 12 demonstrates that the converged condi-tion (2) is a very close approximation of the fixedcondition (3).
Beam deflection
In order to more completely evaluate the NDT data,the effects of shear deflection must be considered in theFEM. Unlike most beams where shear deformation isnegligible (Timoshenko and Young 1935), the needlebeam for Bent 57 had a depth to length ratio of 3/21,requiring shear deflection consideration. For thedeflection of the centre span of the beam due to thevertical centre load, the shear deflection accounts for22.2% of the total deflection. For the deflection of thecentre span of the beam due to the induced shear ofhorizontal load case 2, the shear deflection is 6.7% ofthe total deflection.
The FEM did not account for the shear deflectionin the frame. Therefore, the NDT data for thesedeflections was reduced by 22.2% and 6.7%, respec-tively, for accurate comparison between the NDT dataand the FEM. The FEM results were generated byplotting the displacements of points along the beamunder different connection stiffness values, resulting infour curves representing the four stiffness conditions(pinned, initial guess, converged, and fixed).
94 E. Santini-Bell et al.
Dow
nloa
ded
By:
[San
tini-B
ell,
Erin
] At:
18:0
3 22
Jul
y 20
08
Ideally, the NDT data should fall between the twoextreme connection stiffness conditions – pinned andfixed. As a verification of the NDT data points, theFEM curves were re-calculated including sheardeflection and were compared to the unmodifiedNDT data. The simulated mid-span deflection valuesare shown in Table 2 and compared with the rawNDT deflection, 0.03842 inches (0.0976 m). The largeshear area of the W366300 allows the NDT data tobe evaluated with respect to the shear displacementwith confidence, and the plots with the post-processed
Table 2. Summary of parameter estimates using NDT datafor the connection stiffness values for Bent 57.
Connection
Initialstiffness value,in.-kip/radian(m-kN/radian)
Final parameterestimate,
in.-kip/radian(m-kN/radian)
Beam-to-column 105 (11.36103) 9.586107
(10.86106)Column-to-footing 1010 (11.36109) 1010
(11.36109)
Figure 10. Variation of mid-span deflections due to differing connection stiffness values.
Figure 11. Variation of induced moment at connection due to differing connection.
Bridge Structures 95

Dow
nloa
ded
By:
[San
tini-B
ell,
Erin
] At:
18:0
3 22
Jul
y 20
08 NDT data and FEM-generated curves can be used
with confidence as well.
Connection moments
Strain data from the NDT was transformed intomoment values at the locations where the strains weremeasured. The calculations for this transformationexcludes the strain due to member elongation (fromaxial force) to determine the induced moment at thatpoint. The calculated moments were compared withthe FEM moment curves to determine how close theFEM approximated the NDT data. FEM moment
diagrams were generated by determining the momentat several points along the member for the fourconnection stiffness cases: pinned, initial, convergedand fixed. Figure 13 shows the moment diagram of thebeam due to load case 1; the envelope between theextreme conditions (pinned and fixed) is very small.Thus, any measurement error in the NDT strain datawould have a significant effect on the moment valuecalculated for the NDT data. This NDT data point is arelatively good match for the model that had beenupdated with the converged stiffness case.
Parameter estimation results
Overall, the updated model indicates a general trendthat the converged connection stiffness was a very closeapproximation to the fixed condition in all load casesand members. Also, the initial condition was a veryclose approximation to the pinned condition, illustrat-ing that the initial guess at the stiffness of the beam-column connections was not close to the value it finallyconverged upon, and that the value the parameterestimation runs returned was a very close approxima-tion of the design assumptions made by the engineersthat designed the bent.
The FEM stiffness–curvature curves were gener-ated by calculating deflection (or moment) at severallocations along a structural member with four beam-column connection stiffness values (pinned, initial,converged, and fixed). The NDT data was plotted onthe same axes as the FEM curves for a direct visualcomparison to the FEM curves. In the beam portion ofthe frame due to load case 1, the envelope between the
Figure 12. Deformed shapes of (1) pinned condition,(2) converged condition and (3) fixed condition due to loadcase 1.
Figure 13. Moment diagram for Bent 57 top beam due to load case 1.
96 E. Santini-Bell et al.
Dow
nloa
ded
By:
[San
tini-B
ell,
Erin
] At:
18:0
3 22
Jul
y 20
08 extreme connection stiffness conditions (pinned and
fixed conditions) was very small, but the NDT datastill fit very closely to the FEM stiffness–curvaturecurves.
In general, the trends shown in Figures 12 and 13are consistent with the design assumptions. The NDTdata typically reflects the fixed condition curves. TheFEM updated with the parameter estimation resultswas a vast improvement over the initial guess at theunknown parameter values, which was the goal of thisanalysis. The parameter estimation value returned forthe stiffness of the upper connections closely mimicsthe behaviour of the structure as if these connectionshad infinite stiffness (fixity). The real stiffness of theupper connections is likely very close to the convergedvalue of 9.586107 in.-kips/radian (10.86106 m-kN/radian) because when the FEM model was updatedwith the converged parameter values, the FEM curvemoved away from the pinned condition curve and veryclose to the fixed condition curve. An improvement ofthis magnitude between initial and converged FEMcurves shows the parameter estimates reflect the fieldconditions.
Conclusions
NDT data obtained from the Central Artery was usedfor parameter estimation and model updating. UsingPARameter Identification System (PARIS�), thestatic stiffness-based error function with the NDTdata from the underpinning bents of Boston’s CentralArtery proved successful. The rotational stiffnessvalues of the connections between columns and beamwere successfully estimated. The success of the para-meter estimation is verified in that a similar value wasconverged upon from several different initial para-meter values (showing that starting at any point, theminimum residual between NDT data response andsimulated response could be found). Also, the esti-mated parameter values verified the connection stiff-ness simple design assumptions made by structuralengineers.
Bent 57 was considered to be a fixed connection(high rotational stiffness), so the initial parameter‘best-guess’ was a low rotational stiffness (to prove thehigh value could still be converged upon). The valuethat was converged upon was input into a FEM thatshowed a structural response close to that of a fixedconnection. The FEMs of Bent 57 were then comparedto the NDT strain data that was considered to beaccurate data. Generally, the NDT data agreed withthe updated FEM model. There were a few cases thatthe inherent measurement error in the NDT dataexceeded the difference between the predicted FEMresults and the collected NDT data.
This research illustrates that, via parameter estima-tion and model updating, the final parameter estimateswere able to more closely approximate the designassumptions made by design engineers, as reflectionthrough NDT data. This paper presents a small-scaleproof-of-concept example of structural parameterestimation for design verification. The authors planto take the lessons learned through this example,including sensors placement, data quality, and realisticexpectations from parameter estimation to designverification for a full bridge structures using NDTdata and structural parameter estimation.
The lessons learned from this research, NDT, andparameter estimation and model updating will be usedfor future projects such as a load test that took place inApril 2008 at the Rollins Road Bridge in Rollinsford,NH. This test was conducted by the University of NewHampshire in conjunction with the New HampshireDepartment of Transportation (NHDOT). The RollinsRoad Bridge Project will be used as a benchmark forthe structural health monitoring and asset manage-ment programme at the NHDOT.
Acknowledgements
For the NDTs, Modern Continental Corporation provided a50-ton crane, two man-lifts, one excavator, a surveying crew,steel connections, welding, field support, and other assis-tance. The research team expresses gratitude to VicePresident, Paul Pedini, and his talented, energetic group fortheir exceptional contributions. Instrumentation was pro-vided by Geocomp Corporation, headed by Dr Allen Marr.His talented field staff was led by Dr Robert Nyren. Thegroup installed all strain gages and tiltmeters, and the wholeassembly including the load cell and slide wire potentiometerwas hooked up to the firm’s data acquisition system in thefield. Assistance was also provided by the MassachusettsHighway Department, the Federal Highway Administration,the management consultant Bechtel/Parsons Brinckerhoff,and the section designer Fay Spofford & Thorndike/HNTB.
References
Aktan, A.E., et al., 1997. Structural identification forcondition assessment: experimental arts. Journal ofStructural Engineering, ASCE, 123 (12), 1674–1684.
Blanchard, A.P., 2004. Objective function investigation andload case selection for parameter estimation with non-destructive test data from Boston’s central artery. MSThesis No. 6532, Tufts University, Medford, MA.
Farrar, C.R. and Jauregui, D.A., 1998. Comparative study ofdamage identification algorithms applied to a bridge: I.Experiment. Smart Materials and Structures, 7 (5), 704–719.
Farrar, C.R., et al., 2003. Damage prognosis: current statusand future needs. Los Alamos National LaboratoryReport LA-14051-MS.
Feng, M.Q., Kim, D.K., Yi, J.H., and Chen, Y.B., 2004.Baseline models for bridge performance monitoring.Journal of Engineering Mechanics, 130 (5), 562–569.
GT Strudl1, 2006. GT Strudl1 (29.1). Georgia Institute ofTechnology, CASE Center. Atlanta, GA.
Bridge Structures 97
Dow
nloa
ded
By:
[San
tini-B
ell,
Erin
] At:
18:0
3 22
Jul
y 20
08 Harrington, P.F., 1998. The challenges of underpinning the
central artery. Civil Engineering Practice, Fall/Winter,65–76.
Jang, J.H., et al., 2002. Experimental investigation of system-identification-based damage assessment on structures.Journal of Structural Engineering, ASCE, 128 (5), 673–682.
McElwain, B.A., and Laman, J.A., 2000. Experimentalverification of horizontally curved I-girder bridge beha-vior. Journal of Bridge Engineering, 5 (4), 284–292.
Myrvoll, F., et al., 2000. Full scale measurements for designverification of bridges. In: Proceedings of SPIE – TheInternational Society for Optical Engineering, 4062, I,827–835.
Nowak, A.S., Kim, S., and Stankiewicz, P.R., 2000. Analysisand diagnostic testing of a bridge. Computers andStructures, 77 (1), 91–100.
Sanayei, M., 1997. PARIS – PARameter IdentificationSystem�. Medford, MA: Tufts University.
Sanayei, M., et al., 1997. Structural model updating usingexperimental static measurements. Journal of StructuralEngineering, ASCE, 123 (6), 792–798.
Sanayei, M. and Javdekar, C.N., 2002. Sensor placement forparameter estimation of structures using Fisher informa-tion matrix. In: Proceedings of 7th InternationalConference on Applications of Advanced Technology inTransportation (AATT 2002). Wang, K.C.P., editor. 5–7August 2002, Cambridge, MA, 386–393.
Sanayei, M. and Nelson, R.B., 1986. Identification ofstructural element stiffnesses from incomplete static testdata. In: Proceedings of SAE Aerospace TechnologyConference and Exposition, SAE, Long Beach, CA,1 October, Paper no. 861793.
Sanayei, M., Onipede, O., and Babu, S.R., 1992. Selection ofnoisy measurement locations for error reduction in staticparameter identification. AIAA Journal, 30 (9), 2299–2309.
Sanayei, M. and Saletnik, M.J., 1996a. Parameter estimationof structures from static strain measurements; I:Formulation. Journal of Structural Engineering, ASCE,122 (5), 555–562.
Sanayei, M. and Saletnik, M.J., 1996b. Parameter estimationof structures from static strain measurements; II: Errorsensitivity analysis. Journal of Structural Engineering,ASCE, 122 (5), 563–572.
Santini-Bell, E., 2003. Using multiple non-destructive test datatypes and data sets for condition assessment of bridgedecks. Doctoral Dissertation, Tufts University, Medford,Massachusetts.
Santini-Bell, E., Sanayei, M., Javdekar, C.N., and Slavsky,E., 2007. Multi-response parameter estimation for finiteelement model updating using non-destructive test data.Journal of Structural Engineering, ASCE, 133 (4), 1068–1079.
Shiu, K.N., et al., 1990. Verification of cable-stayed bridgedesign with field measurements. 7th Annual InternationalBridge Conference, The Engineer’s Society of WesternPennsylvania, Pittsburgh, PA, June 18–20, p. 113.
Tang, X.S., Zhang, J.R., Li, C.X., Xu, F.H., and Pan, J.,2005. Damage analysis and numerical simulation forfailure process of a reinforced concrete arch structure.Computers and Structures, 83 (31–32), 2609–2631.
Timoshenko, S. and Young, D.H., 1935. Elements of strengthof materials, 4th edn. New York: D. Van Nostrand.
Xu, Y.L., Zhu, L.D., Wong, K.Y., and Chan, K.W.Y.,2000. Field measurement results of Tsing Ma suspensionbridge during typhoon Victor. Structural Engineeringand Mechanics, 10 (6), 545–559.
98 E. Santini-Bell et al.