bridgestone corporation · price, mix, volume etc. +100.5 depreciation ... (year-on-year/unit...
TRANSCRIPT

February 16, 2018
Bridgestone Corporation
Financial Results for Fiscal 2017

2 /19
1. Business and Financial Performancefor Fiscal 2017
2. Consolidated Projections for Fiscal 2018
P.3
P.10

3 /19
1. Business and Financial Performance
for Fiscal 2017

4 /19
Business Environment Surrounding Bridgestone Group
CurrencyExchange
Raw MaterialPrices
Tire Demand(PSR/TBR)
●Weaker Japanese Yen than PY
●1USD=112yen 1EUR=127yen(Ref.)16FY 1USD=109yen 1EUR=120yen
●Higher than PY
●Despite a reduction in vehicle production in
North America, PSR/TBR tire demand
continues to grow steadily
Market trend of natural rubber and crude oil (Average)
PSR TBR
OE REP OE REP
Japan 105% 102% 102% 104%
N.America 91% 100% 110% 105%
Europe 101% 99% 107% 100%
Asia*1 101% 103% 129% 100%
Tire Demand (Year-on-Year/unit base%)
*1 Total of Thailand, Indonesia, India, and China
2016 2017
FY FY
Natural Rubber
〈TSR20〉*(¢/kg)138 164
Natural Rubber
〈RSS#3〉*(¢/kg)164 199
Crude Oil
〈WTI〉($/bbl)43 50
※ Source: Singapore Commodity Exchange Limited
Note: The numbers of demand are estimated by Bridgestone Corporation

5 /19
Tire Sales Growth for FY of Fiscal 2017
OE
PSR ORR
Japan 112%
N. America 98%
Europe 110%
China/
Asia Pacific 106%
REP
Japan 100%
N. America 96%
Europe 100%
China/
Asia Pacific 101%
TBR
OE
Japan 103%
N. America 119%
Europe 107%
China/
Asia Pacific 154%
REP
Japan 104%
N. America 101%
Europe 103%
China/
Asia Pacific 108%
Ultra-Large 115%
Large 135%
Increased substantially
※ Note: Based on rubber weight for Ultra-Large and Large ORR
Global 101%
OE & REP
Global 107%
OE & REP
PSRHRD (≧ 18”)
Global 120%
※
(Year-on-Year, unit base)

6 /19
Consolidated Results for Fiscal 2017
2016Results
2017Results
vs PY(%)(Ref. Nov 9, 2017
announcement)
2017 Projections
Net Sales 3,337.0 3,643.4 +9 3,650.0
Tires 2,765.7 3,031.1 +10 3,040.0
Diversified Products
585.7 627.8 +7 620.0
Operating Income
449.5(Ratio) 13.5%
419.0(Ratio) 11.5%
(7)(Ratio) (2.0pt)
430.0(Ratio) 11.8%
Tires 414.7 387.1 (7) 397.0
Diversified Products
34.8 31.8 (8) 32.0
Ordinary Income
432.5 400.5 (7) 400.0
Profit Attributable to Owners of Parent 265.5 288.2 +9 290.0
Dividends per Share 140 yen 150 yen +10 yen 140 yen
Yen/US Dollar rate: 109 yen 112 yen +3 yen 111 yen
Yen/Euro rate: 120 yen 127 yen +7 yen 126 yen
(Yen in billions)
Note: Figures within parentheses mean minus

7 /19
Analysis of Consolidated Operating Income for Fiscal 2017
449.5
419.0
300
350
400
450
500
(30.5)2016Operating Income
(Yen in billions)
Price, Mix,Volume etc.
+100.5
Depreciation
(7.0)
SGA
(19.0)Foreign
Exch. Gain
+15.0
Raw Materials
(120.0)
2017Operating Income
Note: Figures within parentheses mean minus

8 /19
Financial Results for Fiscal 2017: Geographic Segments
(Yen in billions)
2016Results
2017Results
vs PY(%)
ConsolidatedNet Sales
3,337.0 3,643.4 +9
Japan 1,080.6 1,147.8 +6
The Americas 1,645.3 1,776.5 +8
EMEA* 477.1 559.8 N/A*
China, Asia-Pacific* 621.7 648.8 N/A*
ConsolidatedOperating Income
449.5 419.0 (7)
Japan 150.6 160.2 +6
The Americas 203.1 187.5 (8)
EMEA* 27.7 13.6 N/A*
China, Asia-Pacific* 62.5 62.9 N/A*
* At the beginning of fiscal year 2017, “Russia” formerly included in the “Other regions” segment was transferred to the “EMEA” segment as the result of the restructuring of the tire business SBUs.
(Ref. Nov 9, 2017 announcement)
2017 Projections
3,650.0
1,140.0
1,760.0
560.0
660.0
430.0
157.0
200.0
10.0
71.0
Note: Figures within parentheses mean minus

9 /19
FY 2016
(As of Dec. 31, 2016)
FY 2017
(As of Dec. 31, 2017) vs Dec. 31, 2016※
Total Assets 3,716.0 3,959.0 +243.0
Total Equity 2,345.8 2,402.7 +56.9
Ratio of total equity to total assets (%) 61.5 59.2 (2.3pt)
Interest-Bearing Debt 〈Net〉 (128.9) (42.7) +86.2
FY2016 FY2017 vs PY
Cash Flow by Operating Activities 444.5 418.1 (26.4)
Cash Flow by Investing Activities (178.2) (200.7) (22.5)
Free Cash Flow 266.2 217.3 (48.9)
Capital Expenditure 194.1 234.8 +40.7
Depreciation 188.0 200.3 +12.2
ROA(%) 7.1 7.5 +0.4pt
ROE(%) 11.8 12.5 +0.6pt
B/S and C/F Highlights for Fiscal 2017 (Yen in billions)
*The actual closing balance of Balance Sheet in 2016 has been revised, due to the change in accounting standard of a group company.
Note: Figures within parentheses mean minus

10 /19
2. Consolidated Projections for Fiscal 2018

11 /19
Forecast of Business Environment Surrounding Bridgestone Group
●USD: Stronger, Euro: Weaker
Japanese yen than PY
●FY assumption is same level as PY
●Trend of steady growth continues globally
Currency Exchange Assumption
2017 2018
US Dollar 112 108
Euro 127 132
CurrencyExchange
Raw MaterialPrices
Tire Demand(PSR/TBR)
(Yen) PSR TBR
OE REP OE REP
Japan 99% 97% 99% 100%
N.America 101% 102% 98% 100%
Europe 103% 100% 98% 101%
Asia*1 100% 104% 77% 102%
Tire Demand (Year-on-Year/unit base%)
*1 Total of Thailand, Indonesia, India, and China
Note: The numbers of demand are estimated by Bridgestone Corporation

12 /19
Tire Sales Growth Projections for Fiscal 2018
OE
PSR ORR
Japan around ±0%
N. America +6%~+10%
Europe around ±0%
China/
Asia Pacific ~+5%
REP
Japan ~+5%
N. America ~+5%
Europe +6%~+10%
China/
Asia Pacific +11%~+15%
TBR
OE
Japan ~+5%
N. America ~+5%
Europe ~+5%
China/
Asia Pacific ~+5%
REP
Japan ~+5%
N. America +11%~+15%
Europe ~+5%
China/
Asia Pacific +11%~+15%
Ultra-Large 120%
Large 105%
Global +6%~+10%
OE & REP
Global +6%~+10%
OE & REP
PSRHRD (≧ 18”)
Global 110%
※
※ Note: Based on rubber weight for Ultra-Large and Large ORR
(Year-on-Year, unit base)
Grow throughout the
year

13 /19
Consolidated Projections for Fiscal 2018
2017Results
2018Projections
vs PY(%)
Net Sales 3,643.4 3,800.0 +4
Tires 3,031.1 3,170.0 +5
Diversified Products 627.8 640.0 +2
Operating Income 419.0(Ratio) 11.5%
463.0(Ratio) 12.2%
+10(Ratio) +0.7%
Tires 387.1 429.0 +11
Diversified Products 31.8 34.0 +7
Ordinary Income 400.5 439.0 +10
Profit Attributable to Owners of Parent 288.2 308.0 +7
Dividends per Share 150 yen 160 yen +10 yen
Yen/US Dollar rate: 112 yen 108 yen (4) Yen
Yen/Euro rate: 127 yen 132 yen +5 yen
(Yen in billions)
Note: Figures within parentheses mean minus

14 /19
Analysis of Consolidated Operating Income for Fiscal 2018
419.0
463.0
300
350
400
450
500
+43.9
Price, Mix,Volume etc.
+112.9
ForeignExch. Loss
(11.0)
Depreciation
(16.0) RawMaterials
+2.0
SGA
(44.0)
2018Operating Income
2017Operating Income
Exchange rate
Sensitivity(full year)
USD: 3.5bil yenEUR: 0.5bil yen
(Yen in billions)
Note: Figures within parentheses mean minus

15 /19
Financial Projections for Fiscal 2018 :Geographic Segments
(Yen in billions)
2017Results
2018Projections
vs PY(%)
ConsolidatedNet Sales
3,643.4 3,800.0 +4
Japan 1,147.8 1,200.0 +5
The Americas 1,776.5 1,800.0 +1
EMEA 559.8 610.0 +9
China, Asia-Pacific 648.8 690.0 +6
ConsolidatedOperating Income
419.0 463.0 +10
Japan 160.2 164.0 +2
The Americas 187.5 220.0 +17
EMEA 13.6 23.0 +69
China, Asia-Pacific 62.9 72.0 +14
Note: Figures within parentheses mean minus

16 /19
Trend of Net Sales, Operating Income, ROA, ROE
OP% 9.4% 12.3% 13.0% 13.6% 13.5% 11.5% 12.2%
ROA 6.0% 6.1% 8.0% 7.3% 7.1% 7.5%
ROE 13.7% 12.7% 15.5% 13.3% 11.8% 12.5%
営業利益
売上高
Operating Income
(billion yen)
Net Sales(trillion yen)
Projections

17 /19
32 yen
57 yen
100 yen
130 yen 140 yen
150 yen
160 yen
14.6%
22.1%26.1%
35.8%
41.3%
39.9% 39.1%
0%
5%
10%
15%
20%
25%
30%
35%
40%
45%
50%
0
20
40
60
80
100
120
140
160
180
Y12 Y13 Y14 Y15 Y16 Y17 Y18
(yen per share)Trend of Dividend, Pay Out Ratio
Pay OutRatio
DividendPer Share
Projections
18 /19
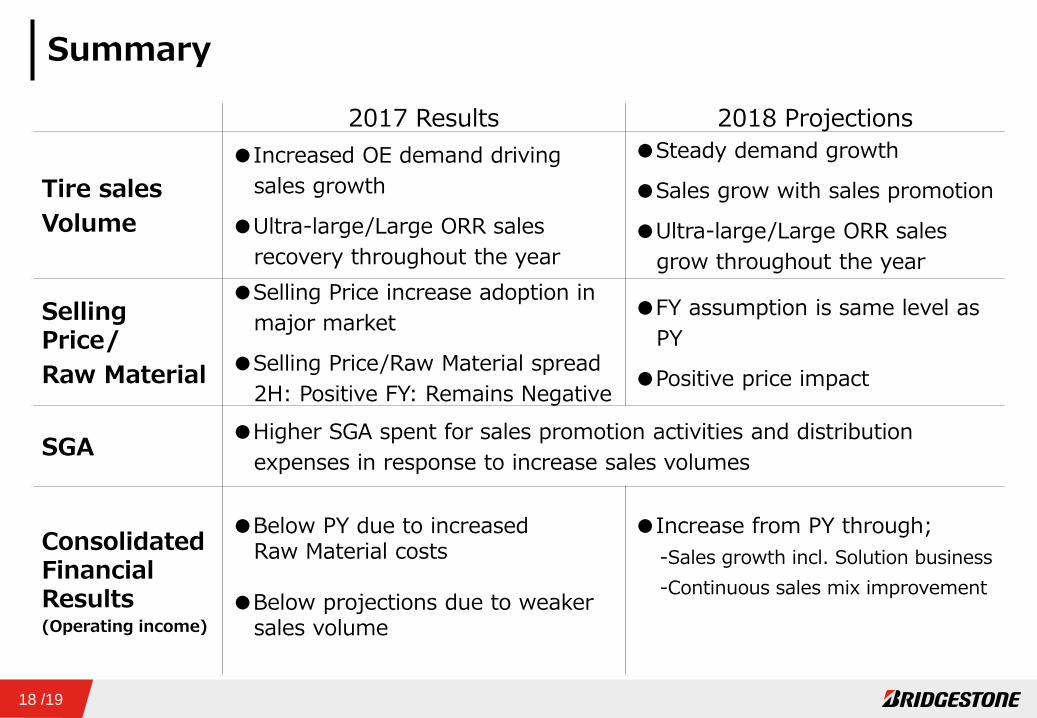
Summary
2017 Results 2018 Projections
Tire sales
Volume
●Increased OE demand driving
sales growth
●Ultra-large/Large ORR sales
recovery throughout the year
●Steady demand growth
●Sales grow with sales promotion
●Ultra-large/Large ORR sales
grow throughout the year
Selling Price/
Raw Material
●Selling Price increase adoption in
major market
●Selling Price/Raw Material spread
2H: Positive FY: Remains Negative
●FY assumption is same level as
PY
●Positive price impact
SGA●Higher SGA spent for sales promotion activities and distribution
expenses in response to increase sales volumes
Consolidated Financial Results(Operating income)
●Below PY due to increased Raw Material costs
●Below projections due to weaker sales volume
●Increase from PY through;
-Sales growth incl. Solution business
-Continuous sales mix improvement

19 /19
Copyright © Bridgestone Corporation
Statements made in this presentation with respect to Bridgestone's current plans, estimates, strategies and beliefs and other statements that are not historical facts are forward-looking statements about the future performance of Bridgestone. Forward-looking statements include, but are not limited to, those statements using words such as "believe," "expect," "plans," "strategy," "prospects," "forecast," "estimate," "project," "anticipate," "may" or "might" and words of similar meaning in connection with a discussion of future operations, financial performance, events or conditions. From time to time, oral or written forward-looking statements may also be included in other materials released to the public. These statements are based on management's assumptions and beliefs in light of the information currently available to it. Bridgestone cautions you that a number of important risks and uncertainties could cause actual results to differ materially from those discussed in the forward-looking statements, and therefore you should not place undue reliance on them. You also should not rely on any obligation of Bridgestone to update or revise any forward-looking statements, whether as a result of new information, future events or otherwise. Bridgestone disclaims any such obligation.