bridging finance and operations through performance ... socal educational program 3.pdfbridging...
TRANSCRIPT

Bridging Finance and Operations through Performance Improvement Project Portfolios
Maria Lee, PhD, MBA, Director, Healthcare Performance Improvement February 21, 2013
2
Objectives
Understand how to build a balanced project portfolio that addresses improving quality and reducing cost
Discern the nature of the partnership between finance and improvement teams to build and refine project financial impact
Explore the use management systems that include monitoring of financial metrics and operational metrics that affect financial outcomes

A hospital bed is a parked taxi with the meter running
Groucho Marx
3

4
KP Numbers
8 regions serving 9 states and the
District of Columbia 8.9 million members
(as of 2/11)
15,000 physicians 164,000 employees (including 45,000
nurses)
37 medical centers (with hospitals)
454 medical offices (ambulatory care
buildings)
Revenue $47.9 billion (2011)
Net Income $1.6 billion (2011)

KP Regional Entities Kaiser Foundation
Health Plans (KFHP)
Pre-paid health plans and insurance
Not-for-profit
Infrastructure for Kaiser Foundation Hospitals
Tax-exempt shelter for the for-profit medical groups
Permanente Medical Groups
(PMG) Physician-owned organizations, provide medical care for Kaiser
Foundation Health Plan members
For-profit partnerships
Funded by Kaiser Foundation Health Plans
Kaiser Foundation Hospitals (KFH)
Operate medical centers
Not-for-profit
Funded by Kaiser Foundation Health Plans
Provide infrastructure and facilities that benefit the for-
profit medical groups
5

The Vindication of Soft Gains Cash is King, but…
6
Strategy: End-to-End Process redesign and management
avoid problem shifting, de facto focus on patient
Improvement that enhances capacity is Queen
Speed, Standardized and Simplified Processes
HCR puts additional burden in health systems
higher demand with limited additional revenue
KP is well positioned to perform end-to-end process redesign and management
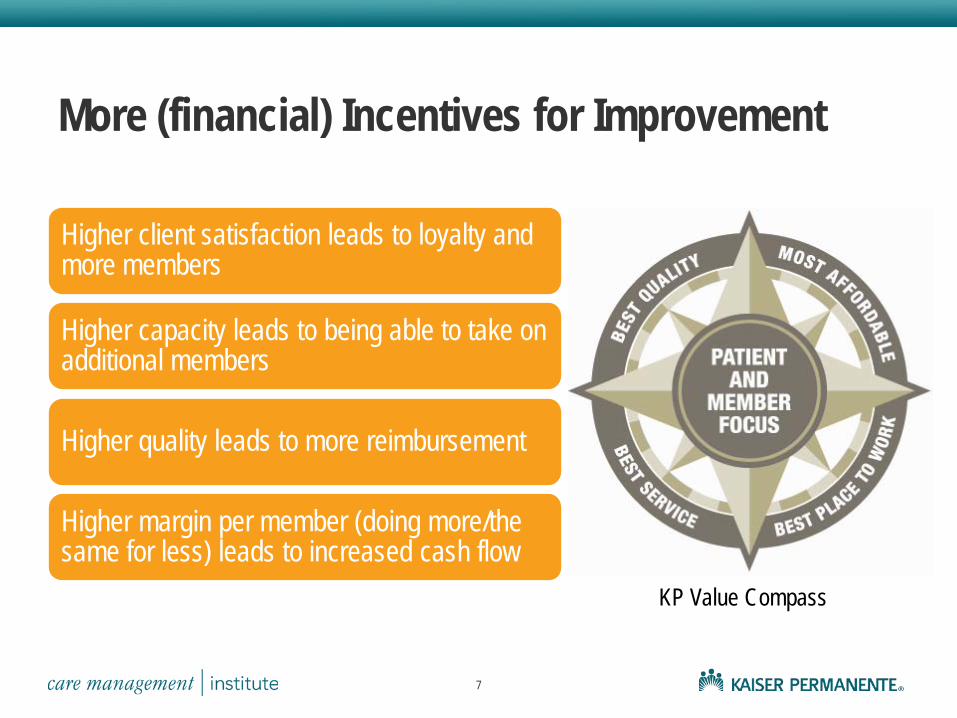
More (financial) Incentives for Improvement
Higher client satisfaction leads to loyalty and more members
Higher capacity leads to being able to take on additional members
Higher quality leads to more reimbursement
Higher margin per member (doing more/the same for less) leads to increased cash flow
7
KP Value Compass
Cash is King
8
Engaging Finance to Build Supply Chain Portfolios

Process A The Executive Leadership sets expectations for Finance to identify biggest opportunities for cost reduction and/or increased revenue
Finance seeks support from Performance Improvement to develop a prioritized financial portfolio
The Executive Leadership sponsors prioritized portfolio and enables participation of departments in portfolio execution
Finance, Departments and Performance Improvement execute financial portfolio
Finance validates financial portfolio results and assesses budget impact
9

CASE STUDY 1 Medical Office Supply Chain Waste Reduction
Rapid Improvement Event
10
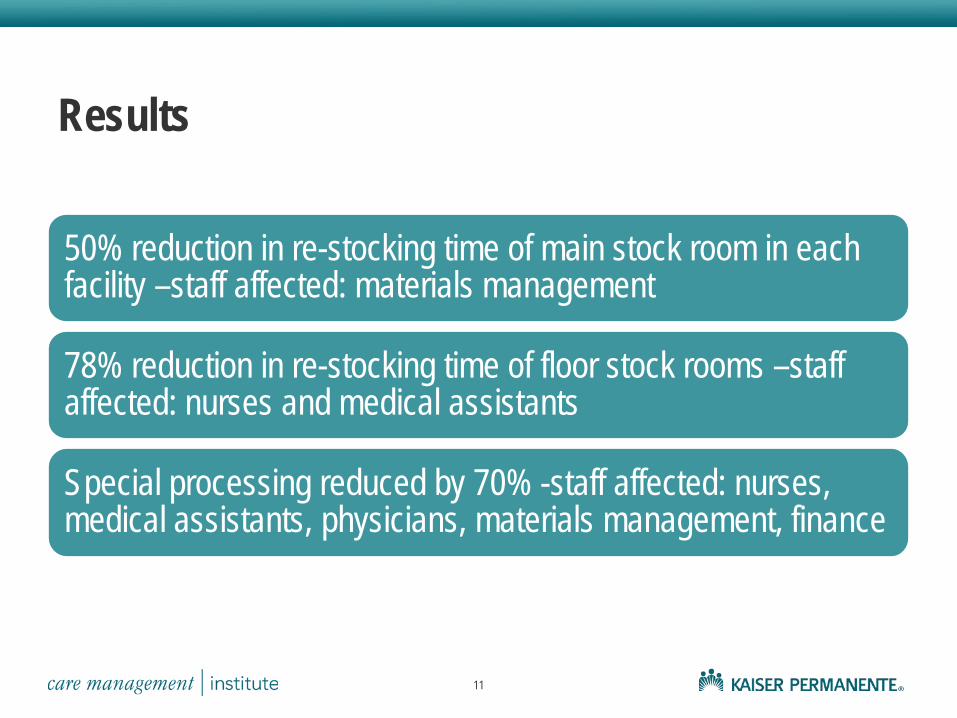
Results
50% reduction in re-stocking time of main stock room in each facility –staff affected: materials management
78% reduction in re-stocking time of floor stock rooms –staff affected: nurses and medical assistants
Special processing reduced by 70% -staff affected: nurses, medical assistants, physicians, materials management, finance
11

How did we do
it?

Rapid Improvement Event (RIE) Characteristics
Focused, intense, targeted process– remove steps/waste, standardize process, improve handoffs
3-5 days in duration (typically)
Changes are identified and implemented during the RIE week
Standard work is identified and action plan agreements for next steps are finalized and agreed to by all parties
Representative group of staff dedicated to the event
Sponsors attend daily report outs on progress, issues and results
Empowerment with accountability
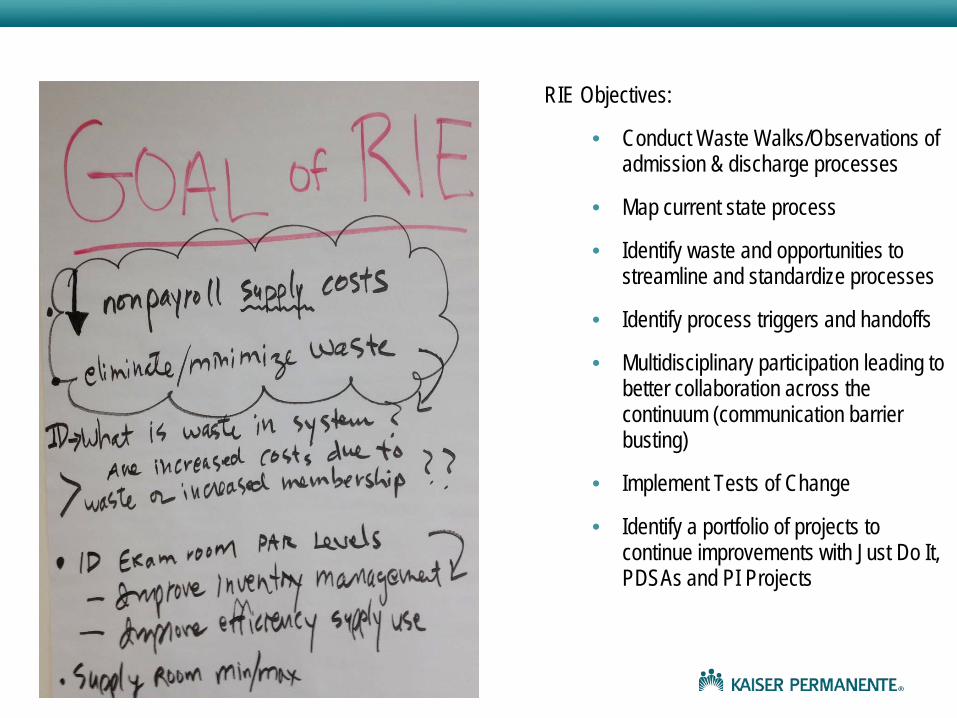
RIE Objectives:
• Conduct Waste Walks/Observations of admission & discharge processes
• Map current state process
• Identify waste and opportunities to streamline and standardize processes
• Identify process triggers and handoffs
• Multidisciplinary participation leading to better collaboration across the continuum (communication barrier busting)
• Implement Tests of Change
• Identify a portfolio of projects to continue improvements with Just Do It, PDSAs and PI Projects

RIE Course Overview - timeline
Assessment Phase
Planning Phase
Rapid Improvement
Event (3-5 days)
Follow Up
Modules/ Education as
needed
Go/No Go Decision for
RIE
Alternatives or Discontinue improvement
No
YesGo/No Go
Decision for RIE
Alternatives or Discontinue improvement
Yes
No
8 Weeks Out
6 Weeks Out
4 Weeks out 2 Weeks out
Event Week
Post Event
30 days, 60 days
and
90 days
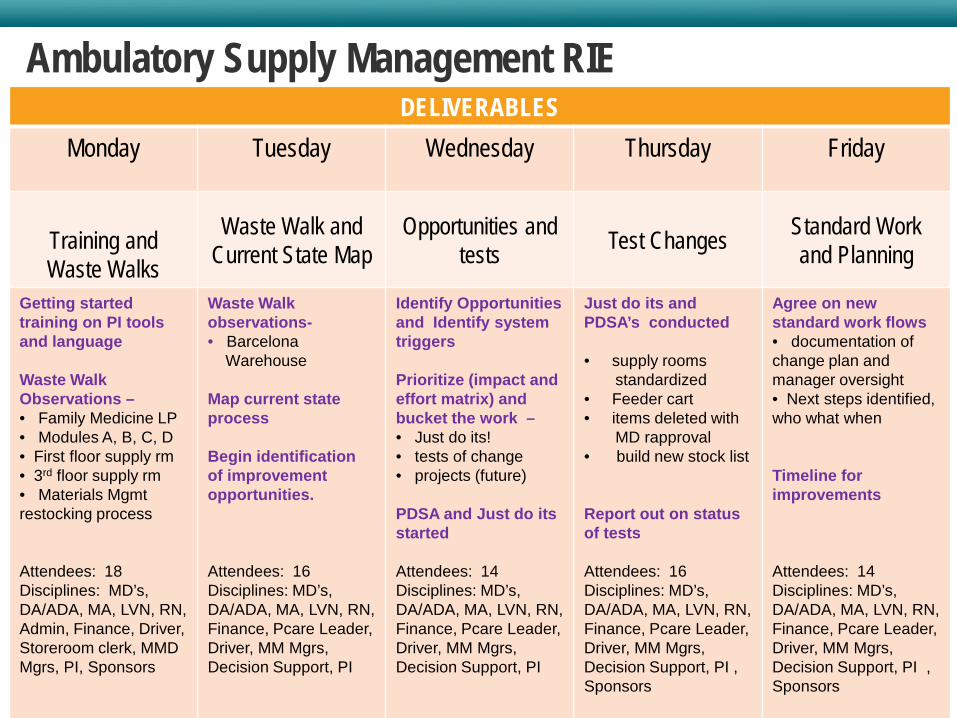
Ambulatory Supply Management RIE DELIVERABLES
Monday Tuesday Wednesday Thursday Friday
Training and Waste Walks
Waste Walk and Current State Map
Opportunities and tests Test Changes Standard Work
and Planning
Getting started training on PI tools and language Waste Walk Observations – • Family Medicine LP • Modules A, B, C, D • First floor supply rm • 3rd floor supply rm • Materials Mgmt restocking process Attendees: 18 Disciplines: MD’s, DA/ADA, MA, LVN, RN, Admin, Finance, Driver, Storeroom clerk, MMD Mgrs, PI, Sponsors
Waste Walk observations- • Barcelona Warehouse Map current state process
Begin identification of improvement opportunities. Attendees: 16 Disciplines: MD’s, DA/ADA, MA, LVN, RN, Finance, Pcare Leader, Driver, MM Mgrs, Decision Support, PI
Identify Opportunities and Identify system triggers Prioritize (impact and effort matrix) and bucket the work – • Just do its! • tests of change • projects (future)
PDSA and Just do its started Attendees: 14 Disciplines: MD’s, DA/ADA, MA, LVN, RN, Finance, Pcare Leader, Driver, MM Mgrs, Decision Support, PI
Just do its and PDSA’s conducted • supply rooms standardized • Feeder cart • items deleted with MD rapproval • build new stock list
Report out on status of tests
Attendees: 16 Disciplines: MD’s, DA/ADA, MA, LVN, RN, Finance, Pcare Leader, Driver, MM Mgrs, Decision Support, PI , Sponsors
Agree on new standard work flows • documentation of change plan and manager oversight • Next steps identified, who what when
Timeline for improvements Attendees: 14 Disciplines: MD’s, DA/ADA, MA, LVN, RN, Finance, Pcare Leader, Driver, MM Mgrs, Decision Support, PI , Sponsors
17
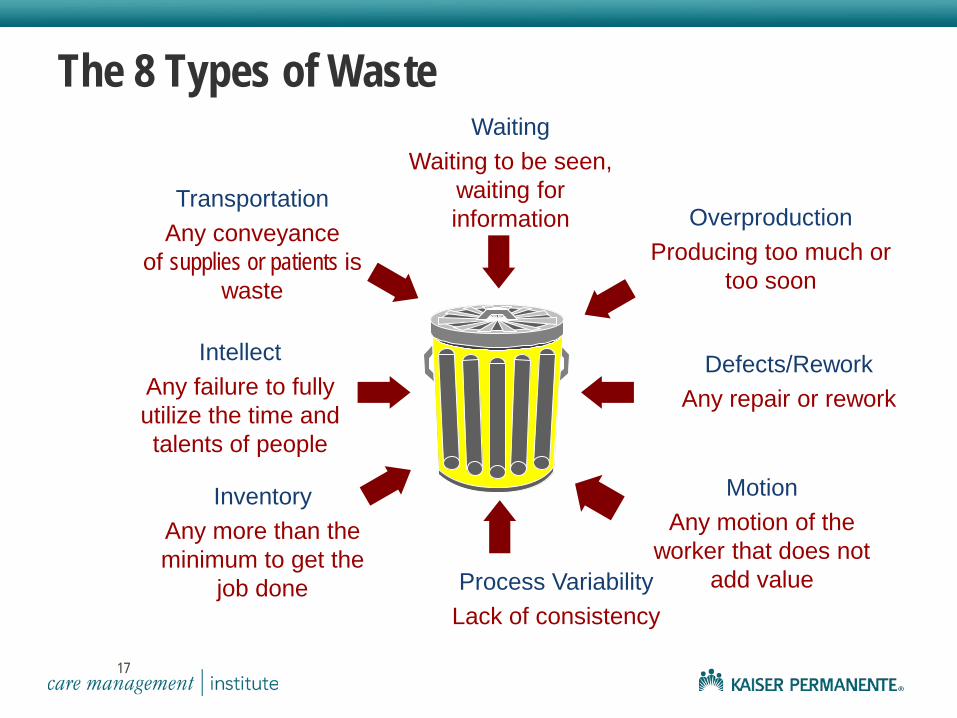
Overproduction Producing too much or
too soon
Transportation Any conveyance
of supplies or patients is waste
Inventory Any more than the minimum to get the
job done
Waiting Waiting to be seen,
waiting for information
Process Variability Lack of consistency
Defects/Rework Any repair or rework
Motion Any motion of the
worker that does not add value
Intellect Any failure to fully utilize the time and talents of people
The 8 Types of Waste
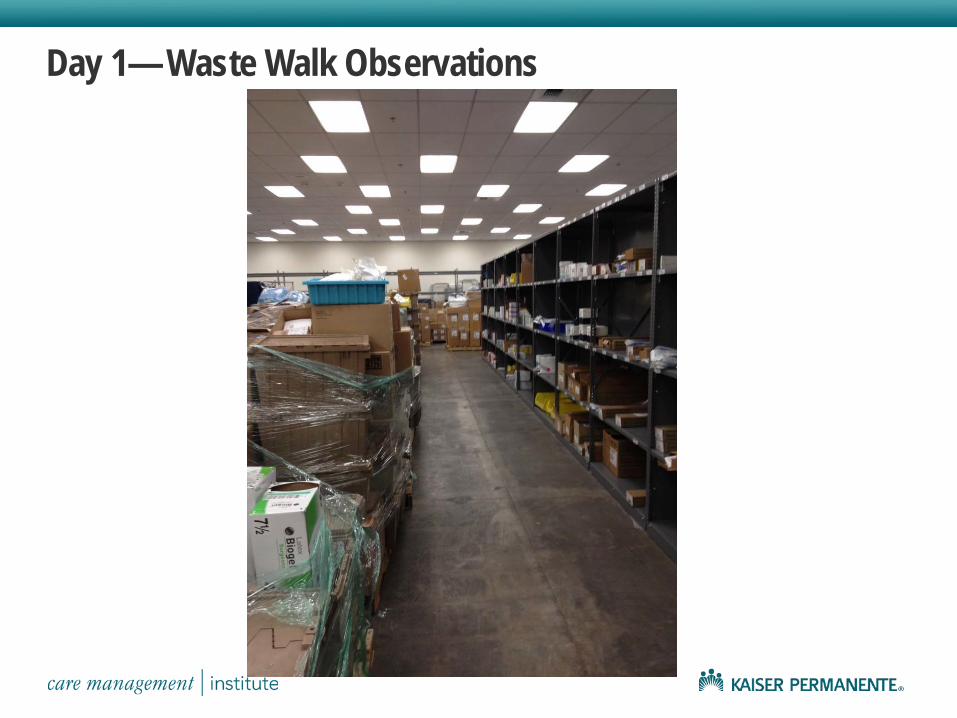
Day 1— Waste Walk Observations

Day 2—Process Mapping & Identifying Waste

Day 2 —Prioritizing Opportunities by Impact/Effort Matrix and bucketing the work –Just do its, PDSAs, projects

Days 3, 4 —Conducting PDSAs
GROUP A Team 1— Line Item Reduction of items
from Cart List and MSR list moved to stock list
Team 2 –Inventory lists posted in all locations and build feeder cart by eliminating 1st floor supply rm
GROUP B Team 3 – Exam Room Standardization;
declutter, approval from MD’s
Team 4— Exam room restock trigger- min max inventory implementation
TEAM GOALS:
Streamline lists = reduce costs Identify what is truly needed in exam rooms Improve workflow, expired items and
preventing hoarding Improve customer satisfaction
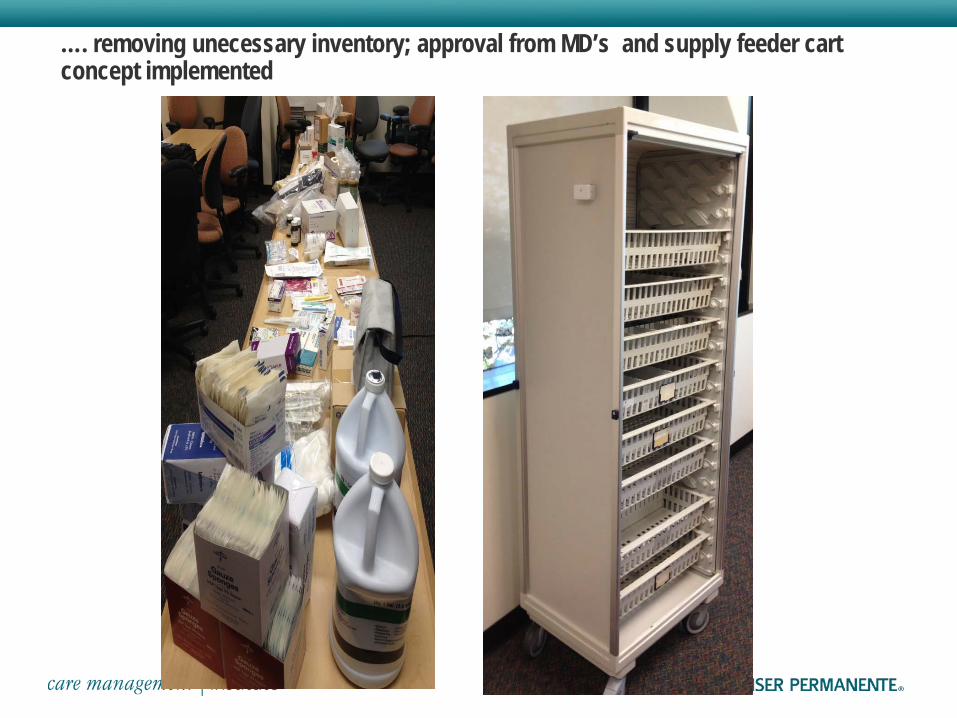
…. removing unecessary inventory; approval from MD’s and supply feeder cart concept implemented

Exam room – min max inventory mgmt tested and exam rooms standardized

Day 5 – standard work and planning next steps

Day 5—Draft Standard Work Protocol
Step #
Major Steps Details and Safety Considerations
Work Flow, Picture, Time Grid
1 Once a week, assigned staff member obtains feeder cart from assigned location
2 Staff member takes cart around 3rd floor. In each exam room, staff member opens double cabinet, looking right to left and up and down, identifying items that are at or below the minimum level.
3 Staff member gathers items currently at minimum level from cart and replenishes items to the maximum level from feeder cart. Staff member rotates stock from back to front.
5 If there is not enough material on the feeder cart, bring the feeder cart to the stock room, replenish the feeder cart and then complete replenishment of exam rooms
6 Staff member repeats above steps with drawers below cabinet and under bed.
7 Staff member de-clutters room and removes items stocked above maximum level
8 Staff fills out Incident Report (available from feeder cart) if he/she notices under-stocked, over-stocked or non-moving items, mismatches with standard configuration, expired items
Standard Work Process: Exam Room Replenishment with Feeder Cart Owner: Department Administrator or designee Performed By: Staff by Assignment Process Duration: 1 h Standard Work Purpose: Replenish exam room inventory supply Triggers: Supply in exam room hits minimum level Process Measures:
•Number of expired items •Number of times exam rooms are overstocked •Number of times exam rooms are out of stock •Number of items with no turns after one month •Number of mismatches between what is pictured as stadard configuration and what is in room
Weekly Standard Work:

Process B The Executive Leadership sets expectations for all departments to improve their cost structure and/or increase revenue
The Executive Leadership sets expectations for all departments to partner with Finance to generate financial estimates to aid in prioritization of efforts
The Executive Leadership sets expectations for Finance to support departments
Departments contact Performance Improvement for support in project execution
Departments execute projects
26

Capacity is Queen
27
Engaging Finance to build End-to-End Cycle of Care Portfolios

End-to-End Patient Journey
Taking a System’s approach means that a large complex system is optimized by taking into account interactions among parts rather than optimizing individual parts
28
ED Observation Unit
Medical/Surgical Inpatient
Home or SNF
OR Ambulatory OR
Primary Care
Urgent Care
ICU
Acute or Surgical Ambulatory
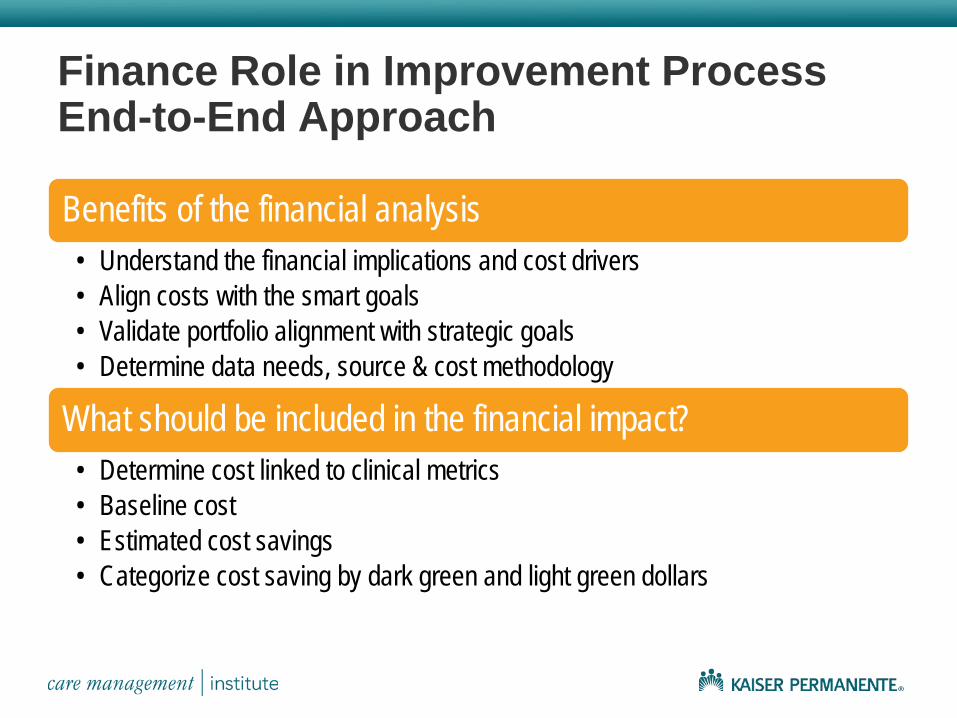
Finance Role in Improvement Process End-to-End Approach
Benefits of the financial analysis • Understand the financial implications and cost drivers • Align costs with the smart goals • Validate portfolio alignment with strategic goals • Determine data needs, source & cost methodology
What should be included in the financial impact? • Determine cost linked to clinical metrics • Baseline cost • Estimated cost savings • Categorize cost saving by dark green and light green dollars

Different Costing Methods
Actual Cost
Costing Approaches
Methodology Advantage Disadvantage
Average Costing (Direct Cost)
• Simple average • Department cost divided by volume
• Calculation is simple and quick • No specialized system or knowledge
• Excluded overhead • Understates true costs
Standard Costing
• Costs are developed for each product or service • Based on historical expenses.
• Cost are assigned to each product • Spreads indirect costs
• Does not reflect the actual cost but the expected cost
Activity Based Costing (ABC)
• Costs based on the resources patient consumes
• Patient/Disease focus • Identifies non value adding steps
• Time consuming • Costly
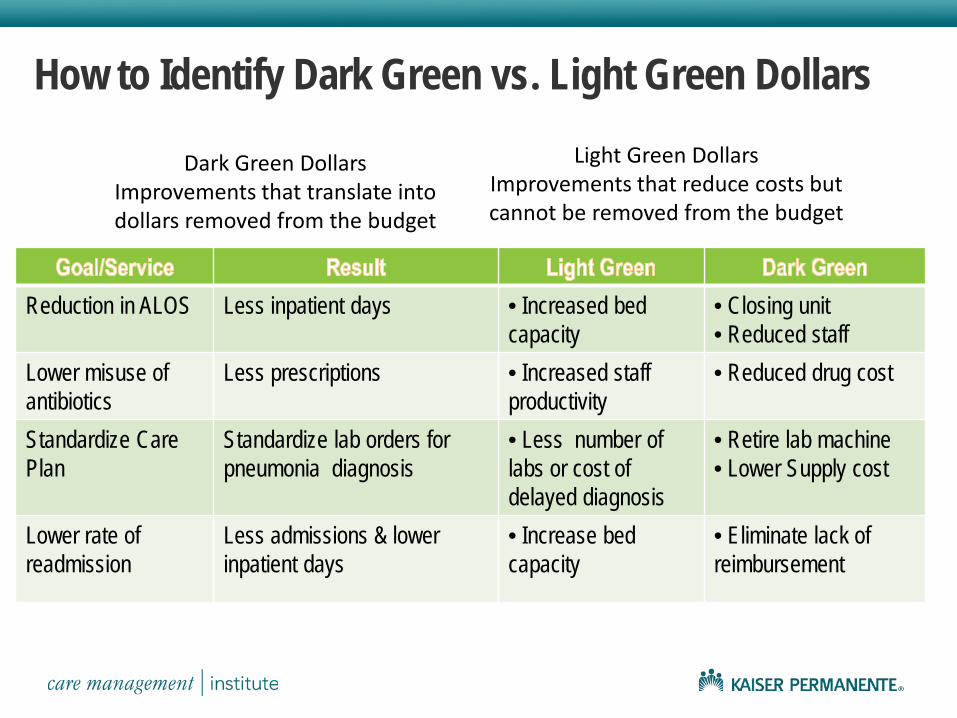
How to Identify Dark Green vs. Light Green Dollars
Reduction in ALOS Less inpatient days • Increased bed capacity
• Closing unit • Reduced staff
Lower misuse of antibiotics
Less prescriptions • Increased staff productivity
• Reduced drug cost
Standardize Care Plan
Standardize lab orders for pneumonia diagnosis
• Less number of labs or cost of delayed diagnosis
• Retire lab machine • Lower Supply cost
Lower rate of readmission
Less admissions & lower inpatient days
• Increase bed capacity
• Eliminate lack of reimbursement
Light Green Dollars Improvements that reduce costs but cannot be removed from the budget
Dark Green Dollars Improvements that translate into dollars removed from the budget

CASE STUDY 2 End-to-End Pneumonia Improvement
32
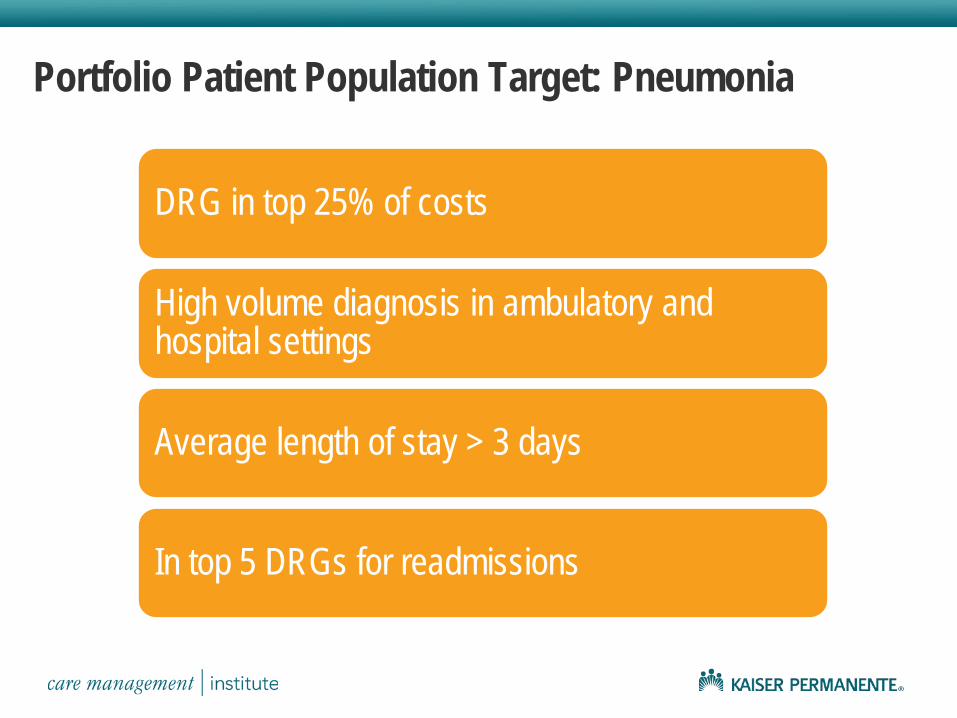
Portfolio Patient Population Target: Pneumonia
DRG in top 25% of costs
High volume diagnosis in ambulatory and hospital settings
Average length of stay > 3 days
In top 5 DRGs for readmissions
KP
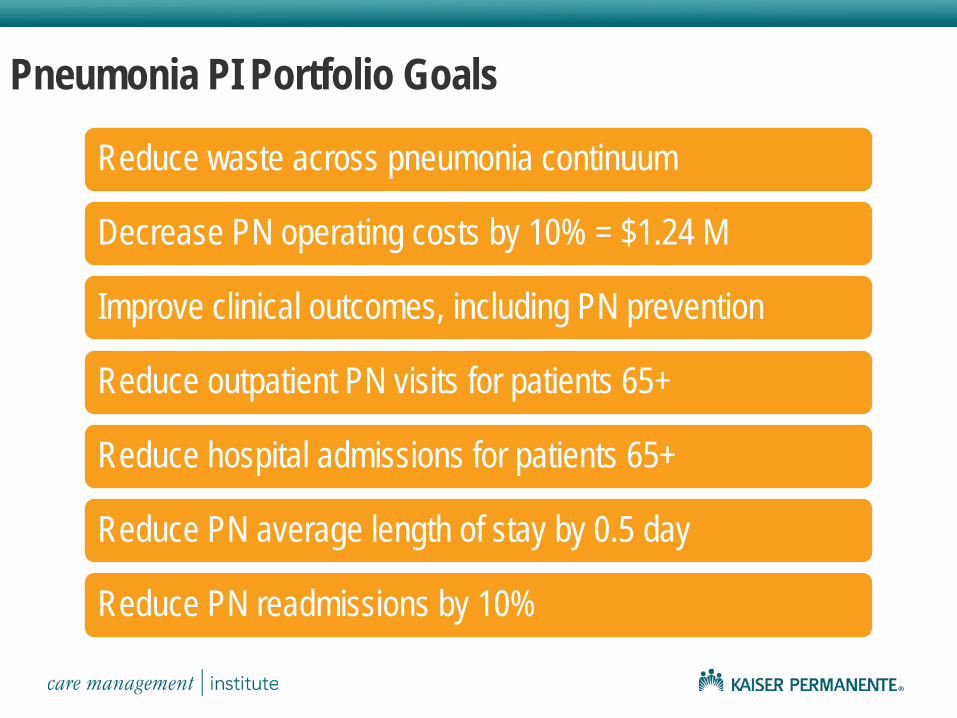
Pneumonia PI Portfolio Goals
Reduce waste across pneumonia continuum
Decrease PN operating costs by 10% = $1.24 M
Improve clinical outcomes, including PN prevention
Reduce outpatient PN visits for patients 65+
Reduce hospital admissions for patients 65+
Reduce PN average length of stay by 0.5 day
Reduce PN readmissions by 10%
KP

35
Building a Portfolio: Pneumonia
35
Pt is OK Pt gets worse
multiple
Pt calls KP
Pt goes to Urgent Care
Pt goes to ED
Pt goes to MOB
Pt gets admitted Pt gets transferred Pt gets dischargedPt gets better Pt goes Home-self care
Pt goes home-HH
Pt goes to SNF
Lab Dx Imaging
MD NursePharmacy
Nurse
Lab Dx Imaging
MD NursePharmacyResp
Therapy
Outpatient Teams Focus Inpatient Teams Focus
Phase I : Input Related Waste
(High Risk Patients Not Vaccinated)
Phase I : Discharge Process
Waste
Phase II
Phase II
Phase II
Phase II
KP
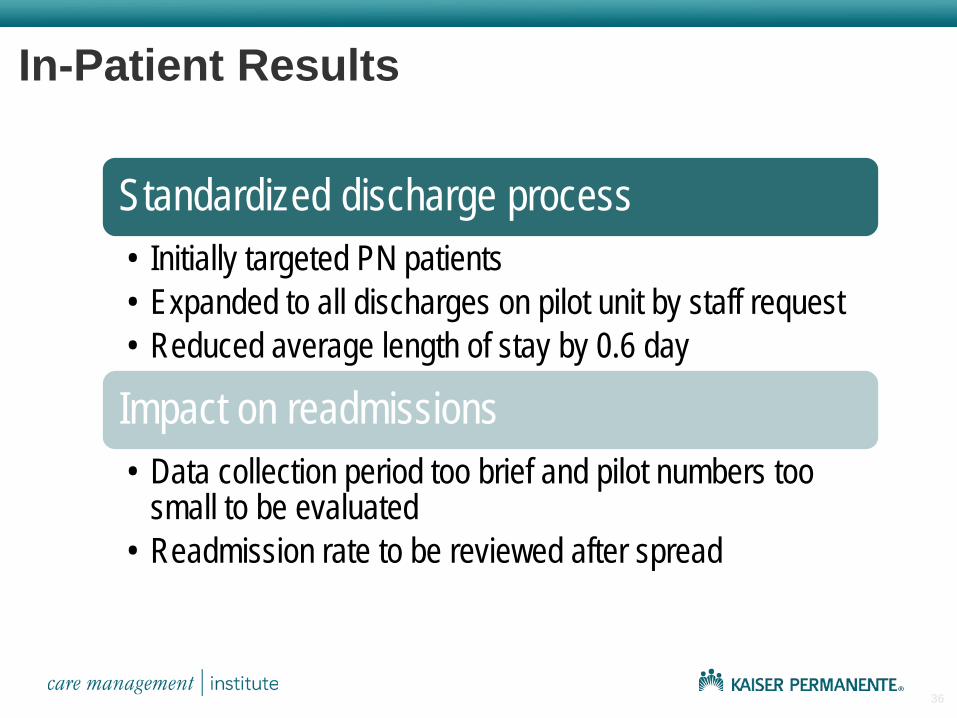
In-Patient Results
Standardized discharge process • Initially targeted PN patients • Expanded to all discharges on pilot unit by staff request • Reduced average length of stay by 0.6 day
Impact on readmissions • Data collection period too brief and pilot numbers too
small to be evaluated • Readmission rate to be reviewed after spread
36

Out-Patient Results
Standardized Pneumovax process with in-reach and out-reach to 65+ members
67% improvement in immunization rate
Reduced 65+ visit rate by 21.5%
Avoided 6 PN admissions
KP

Oversight and Monitoring Dashboard Example
2011 Cases & Costs
Primary Care 800 30% $208,800
Performance Improvement
UrgiCare 250 9% $65,250
Emergency 350 13% $157,500
Sample Pneumonia Dashboard Inpatient 5.2 alos 1,300 48% $6,895,200
Total Patients 2,700 100% $7,326,750
PHASE I * 2011 Savings
Goal 2011 YTD
2012 GOAL 2012 YTD JAN FEB MAR APR MAY
Outpt PN Visits Per 1,000 (65+) $7,700
3.5 10% 3.2 3.6 3.8 3.5 3.3 3.3 Pneumovax Rate 65% 70% 73% 70% 71% 71% 72% 72% Avoided Costs Due to Lower Visit Rate $9,020 # PN ED visits (65+)
$77,112
120 10% 86 12 18 14 10 8 % PN Admits from ED 80% 10% 63% 77% 70% 72% 68% 66%
Avoided Costs Due to Lower Admit Rate $227,934
Inpt Admissions - Pneumonia
$43,344 600 10% 510 63 75 69 54 47
Inpt PN readmits (count) 82 28 2 4 6 3 2 Inpt PN readmit Rate(%) 7.0% 10% 5.5% 3.4% 6.1% 8.0% 4.7% 4.3% ALOS PN pts
$510,000 5.3 0.5 Day 5.8 5.4 6.0 5.5 5.7 5.6
ALOS PN 6.3 0.5 Day 6.6 6.0 6.3 5.2 6.6 9.0 AV Med Surg PN Cost/Discharge $612,000
* Costs are hypothetical and do not reflect actual performance.

Pneumonia Phase I Spread
Outpatient Spread
Inpatient Spread
39
Create Outpatient/ Urgent Care
Standard Work –Q2 2012
Create OP/UC Spread Guide –Q2
2012 Spread to initial 2 MOBs –Q3 2012
Spread to all 15 MOBs –Q4 12 – Q2
13
Create Inpatient Standard Work –Q2
2012
Create Inpatient Spread Guide –Q2
2012 Spread to all Units–
Q3 – Q4 2012
Spread to additional medical center Units–Q4 12
– Q1 13
KP

40
Sequencing Portfolio: Phase II Teams
40
Pt is OK Pt gets worse
multiple
Pt calls KP
Pt goes to Urgent Care
Pt goes to ED
Pt goes to MOB
Pt gets admitted Pt gets transferred Pt gets dischargedPt gets better Pt goes Home-self care
Pt goes home-HH
Pt goes to SNF
Lab Dx Imaging
MD NursePharmacy
Nurse
Lab Dx Imaging
MD NursePharmacyResp
Therapy
Outpatient Team Focus Inpatient Team Focus
PN HH Care Management
Inpt PN Care Management
Standardize ED to Inpt
Admit Criteria
Standardize PN Ambulatory
Care Management
KP
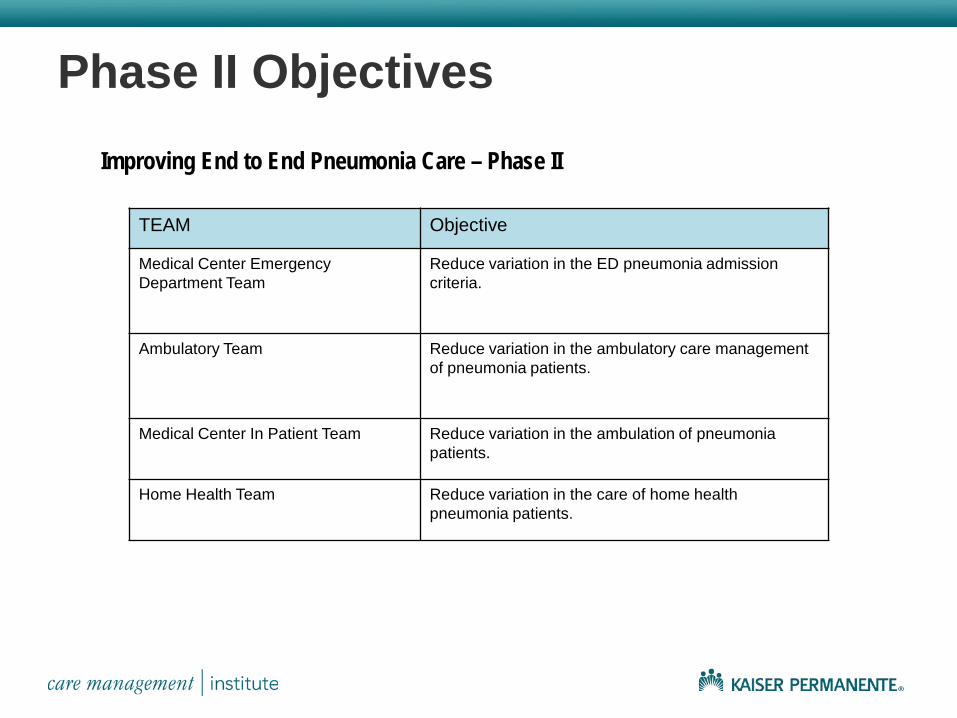
Phase II Objectives Improving End to End Pneumonia Care – Phase II
TEAM Objective
Medical Center Emergency Department Team
Reduce variation in the ED pneumonia admission criteria.
Ambulatory Team Reduce variation in the ambulatory care management of pneumonia patients.
Medical Center In Patient Team Reduce variation in the ambulation of pneumonia patients.
Home Health Team Reduce variation in the care of home health pneumonia patients.
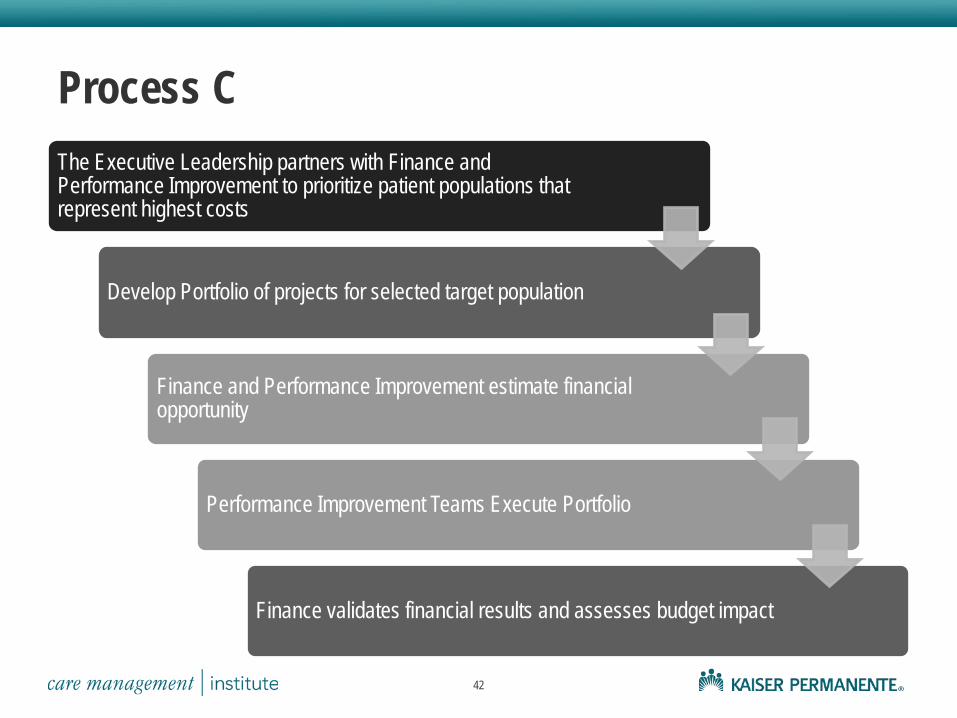
Process C The Executive Leadership partners with Finance and Performance Improvement to prioritize patient populations that represent highest costs
Develop Portfolio of projects for selected target population
Finance and Performance Improvement estimate financial opportunity
Performance Improvement Teams Execute Portfolio
Finance validates financial results and assesses budget impact
42

Conclusions
Engagement of Finance in Performance Improvement enables alignment of work with strategic goals of the organization
Invariably at KP, behind every successful partnership between Finance and operational and clinical improvement, there is a very strong commitment from the Executive Leadership to prioritize portfolios with projected financial impact as an input and to enable Finance as a key member of improvement teams
43

THANK YOU!!
44