bridging to finance
TRANSCRIPT
Bridging to Finance
Pavel V. ShevchenkoQuantitative Risk Management
CSIRO Mathematical & Information Sciences
Conference “ Quantitative Methods in Investment and Risk Management: sourcing new approaches from mathematical theory and the real world”Melbourne Centre For Financial Studies, 20 th September 2007.
CSIRO Mathematical & Information Sciences www.cmis.csiro.au
• Commonwealth Scientific and Industrial Research Organization of Australia (CSIRO)
• National research agency formed in 1926. • Approx 6500 staff (Divisions: Industrial Physics, Minerals,
Mathematical & Information Sciences, Marine and Atmospheric Research, etc.) www.csiro.au
• Division of Mathematical and Information Sciences ( CMIS)• (over 100 researchers): Decision Technology, Biotechnology and Health
Informatics, Environmental Informaticswww.cmis.csiro.au
• Quantitative Risk Management (QRM) group• (approx. 20 staff): financial risk, infrastructure, environment risk,
security, air-transport. Activities/modes of engagement: research, consulting, model development/validation, software development,… . www.cmis.csiro.au/QRM
CSIRO Mathematical & Information Sciences

CSIRO Mathematical & Information Sciences www.cmis.csiro.au
CSIRO Quantitative Risk Management
Risk assessment
Real-time monitoringInfrastructure, security, health
OATM
Energy/commodity modelling
Optimisation Air Traffic Management
Expert elicitation
Extremes, sparse dataFinancial Risk
Strategic researchApplication areas
CSIRO Mathematical & Information Sciences www.cmis.csiro.au
CSIRO Mathematical & Information Sciences
Solutions• Development of mathematical models and customised software
according to the client methodology and specific needs.• Assisting with development of new models and their implementation
into software.• Independent review and advice on risk models, methodology and
software solutions.• Independent validation of derivatives and risk measurement models. • Time-series analysis of data.Modes of engagement
There are many ways CSIRO can work with you to understand andquantify financial risks:
• Consultancy engagement.• Contract research engagement.• Collaborative projects.• Software development.
CSIRO Mathematical & Information Sciences www.cmis.csiro.au
Track Records in Financial Risk
• Derivative pricing: work on CSIRO option pricing software Reditus since 1999, consulting projects in 2005, 2006, 2007.
• FX option pricing: plug-ins for Fenics launched in 2005 – 100 users in overseas banks.
• Operational Risk: validation projects in 2000, model development projects in 2001, 2003, R&D/software projects 2004-2007.
• Market Risk: validation projects in 2004, 2005, model development consultingproject in 2007.
• Credit Risk: validation projects in 1999, 2002; validation and model development projects 2004-ongoing.
• Underwriting risk: consulting projects in 1999, current proposals.• Forecasting electricity/commodities: consulting projects in 2002, 2005,
2005-06, current proposals. • Portfolio Management: model development projects in 2007, current
proposals.• Water/Carbon Trading: current proposals.• Collaborators: Monash Uni, Cambridge Uni, ETH Zurich, UNSW, UTS,
Macquarie Uni, Statistical Research Associates NZ• Industry clients : CBA, ANZ, NAB, St George, Integral Energy, IAG, Fenics
FX, Edgecap, Moore Capital, Ester Bank, Credit Swiss,… .
CSIRO Mathematical & Information Sciences www.cmis.csiro.au
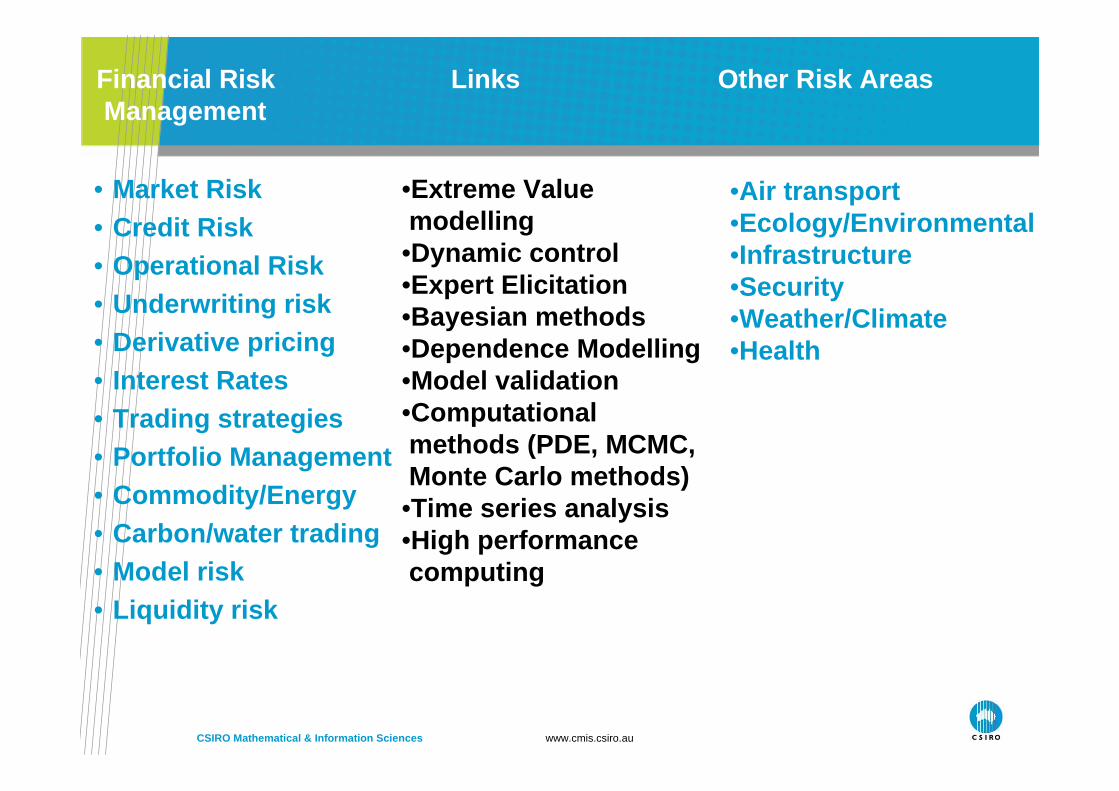
Financial Risk Links Other Risk AreasManagement
• Market Risk • Credit Risk • Operational Risk• Underwriting risk • Derivative pricing• Interest Rates• Trading strategies• Portfolio Management• Commodity/Energy• Carbon/water trading• Model risk• Liquidity risk
•Extreme Value modelling
•Dynamic control•Expert Elicitation•Bayesian methods•Dependence Modelling•Model validation•Computational methods (PDE, MCMC, Monte Carlo methods)
•Time series analysis•High performance computing
•Air transport•Ecology/Environmental•Infrastructure •Security•Weather/Climate•Health
CSIRO Mathematical & Information Sciences www.cmis.csiro.au
Extreme Value Analysis/Dependence
• Air-transport (deviations from taxi centerline)• Weather (rainfall, wind speed)• Market Risk (tail of portfolio return distribution,
derivatives)• Credit/Operational Risk (tail of annual loss
distribution)• Electricity pricing (price spikes)
CSIRO Mathematical & Information Sciences www.cmis.csiro.au
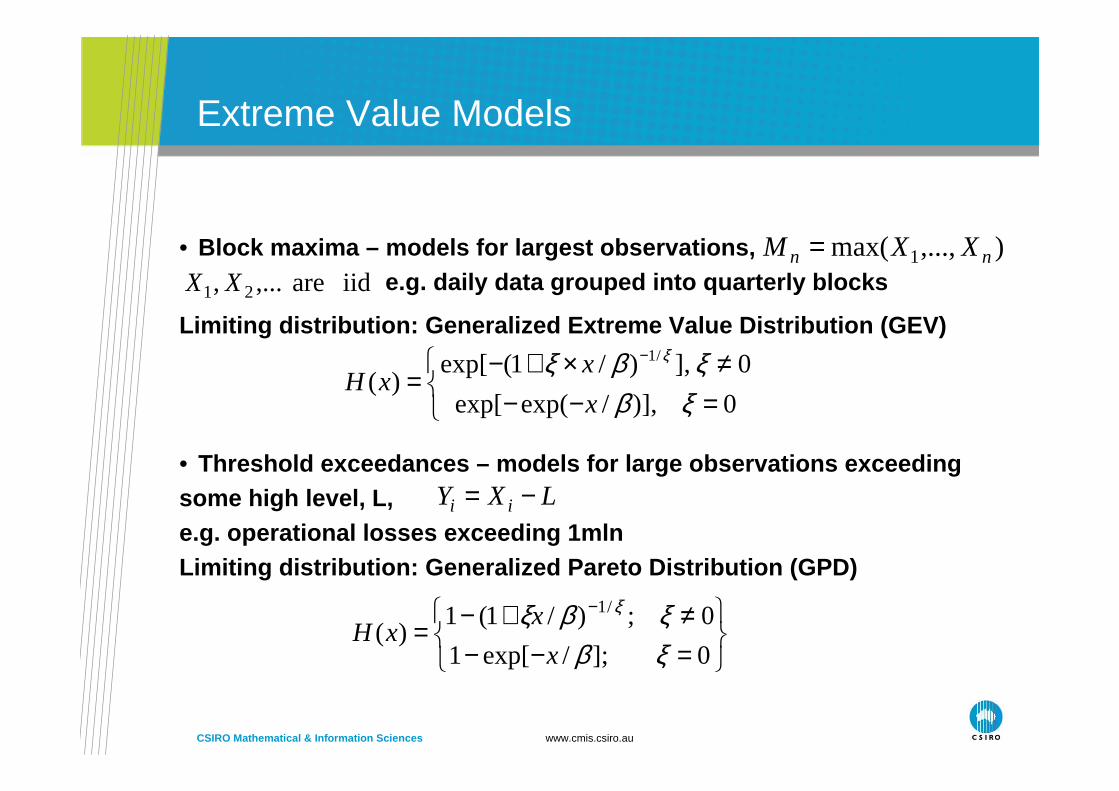
Extreme Value Models
• Block maxima – models for largest observations, e.g. daily data grouped into quarterly blocks
Limiting distribution: Generalized Extreme Value Di stribution (GEV)
• Threshold exceedances – models for large observations exceeding some high level, L,e.g. operational losses exceeding 1mln Limiting distribution: Generalized Pareto Distribut ion (GPD)
),...,max( 1 nn XXM =iid are ,..., 21 XX
=−−≠×+−
=−
0)],/exp(exp[
0],)/1(exp[)(
/1
ξβξβξ ξ
x
xxH
=−−≠+−=
−
0];/exp[1
0;)/1(1)(
/1
ξβξβξ ξ
x
xxH
LXY ii −=
CSIRO Mathematical & Information Sciences www.cmis.csiro.au
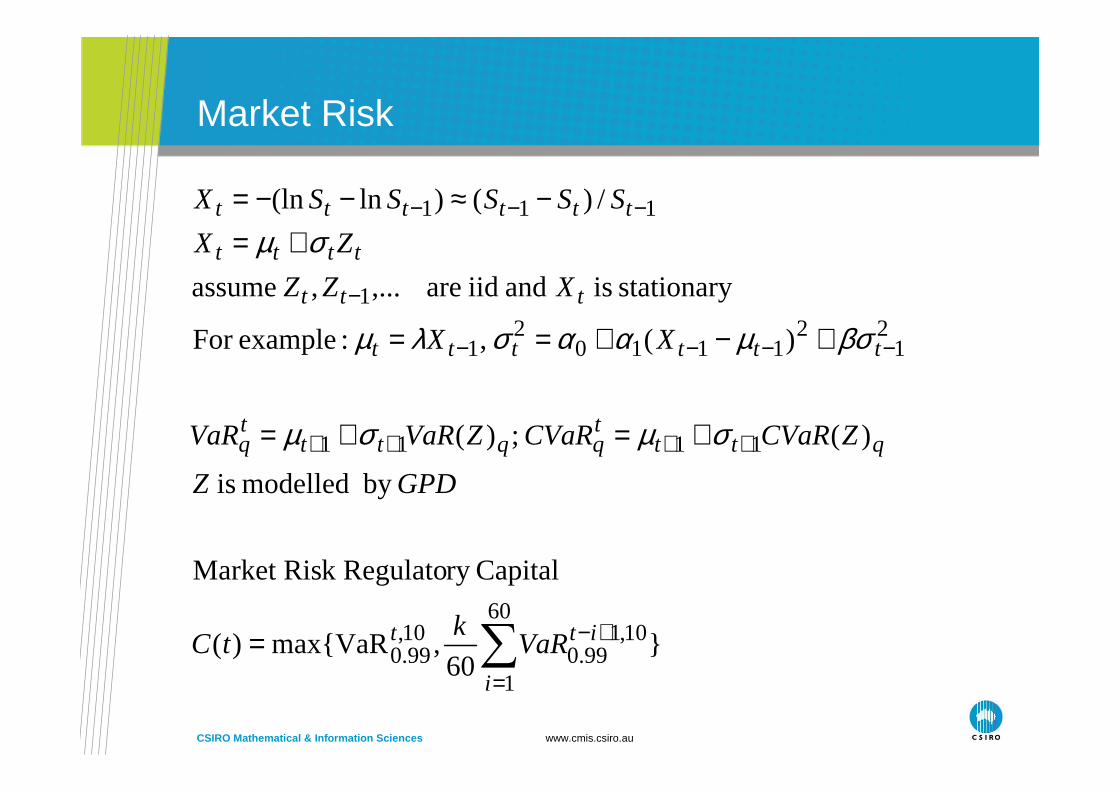
Market Risk
}60
,max{VaR)(
Capitalry k RegulatoMarket Ris
by modelled is
)(;)(
)(,:exampleFor
stationaryisandiidare,...,assume
/)()ln(ln
60
1
10,199.0
10,0.99
1111
21
21110
21
1
111
∑=
+−
++++
−−−−
−
−−−
=
+=+=
+−+==
+=−≈−−=
i
itt
qtttqqtt
tq
tttttt
ttt
tttt
tttttt
VaRk
tC
GPDZ
ZCVaRCVaRZVaRVaR
XX
XZZ
ZX
SSSSSX
σµσµ
βσµαασλµ
σµ

CSIRO Mathematical & Information Sciences www.cmis.csiro.au
Example: API returnsGARCH-Normal GARCH-Student t
GARCH-Generalized Pareto GARCH-volatility
Asset residual Q-Q plot
-5-4-3-2-1012345
-5 -4 -3 -2 -1 0 1 2 3 4 5
theoretical quantile
empi
rical
qua
ntile
Asset residual Q-Q plot
-5-4-3-2-1012345
-5 -4 -3 -2 -1 0 1 2 3 4 5
theoretical quantile
empi
rical
qua
ntile
Asset residual Q-Q plot
-5-4-3-2-1012345
-5 -4 -3 -2 -1 0 1 2 3 4 5
theoretical quantile
empi
rical
qua
ntile
volatility
0.010
0.030
0.050
0.070
0.090
0.110
28/07/01 10/12/02 23/04/04 05/09/05 18/01/07

CSIRO Mathematical & Information Sciences www.cmis.csiro.au
Derivative Pricing
methods. Carlo Monte ,Difference Finite Element, Finite :Methods Numericaldiffusion jump models,y volatilitstochastic
,),()(/ - modelsy volatilitlocal e.g.:skewy volatilitModelling
]|)([ pricingOption :
tdWttSdttqtrtStdS
tSTSPayoffEtQ
σ+−=
=

CSIRO Mathematical & Information Sciences www.cmis.csiro.au
)(Prob)(with,...,1rvsConsider ixiXixiFdXX ≤=
)1,0(~)(),1,0(~),(1~)(1 UiUiXiFUiUiUiFiXiFiUiF =−=⇒−
cdfjointis]≤,...,2≤2,11[Prob),...,2,1( dxdXxXxXdxxxF ≤=
iF,behaviormarginal ),.,1(copula duuC
),...,2,1( dxxxF
),...,2,1())(),...,2(2),1(1( dxxxFdxdFxFxFC =
))(1),...,2(12),1(1
1(),...,2,1( dud
FuFuFFduuuC −−−=
Dependence modelling via Copula method
Copula is multivariate joint distribution of unifor m random variables
Dependence modelling

CSIRO Mathematical & Information Sciences www.cmis.csiro.au
Dependence modelling via copula
-4
-3
-2
-1
0
1
2
3
4
-4 -3 -2 -1 0 1 2 3 4
X
Y
-4
-3
-2
-1
0
1
2
3
4
-4 -3 -2 -1 0 1 2 3 4
X
Y
-4
-3
-2
-1
0
1
2
3
4
-4 -3 -2 -1 0 1 2 3 4
X
Y
7.0),(
)1,0(~);1,0(~
=YXcorr
NormalYNormalX
t2 Copula
Gumble Copula
Gaussian Copula
CSIRO Mathematical & Information Sciences www.cmis.csiro.au
Expert Elicitation/Bayesian methods(combining internal & external data with expert opinion)
• Ecology (estimation of fish density from gillnet ca tches)• Operational Risk (estimation of loss frequency and severity)• Air-transport (individual&collective risk of air-col lisions)• Insurance (pricing of policy premium)• Markov Chain Monte Carlo methods (signal processing )
• Recent Publications:• D. D. Lambrigger (ETH), P.V. Shevchenko (CSIRO) and M. V. Wüthrich (ETH), 2007. The
Quantification of Operational Risk using Internal Data, Relevant External Data and Expert Opinions. The Journal of Operational Risk.
• Hans Bühlmann (ETH), P.V. Shevchenko (CSIRO) and M. Wüthrich (ETH), 2006. A “Toy”Model for Operational Risk Quantification using Credibility Theory. The Journal of Operational Risk 2(1).
• P.V. Shevchenko (CSIRO) and M. Wüthrich (ETH), 2006. Structural Modelling of Operational Risk using Bayesian Inference: combining loss data with expert opinions. The Journal of Operational Risk 1(3), pp.3-26.
CSIRO Mathematical & Information Sciences www.cmis.csiro.au
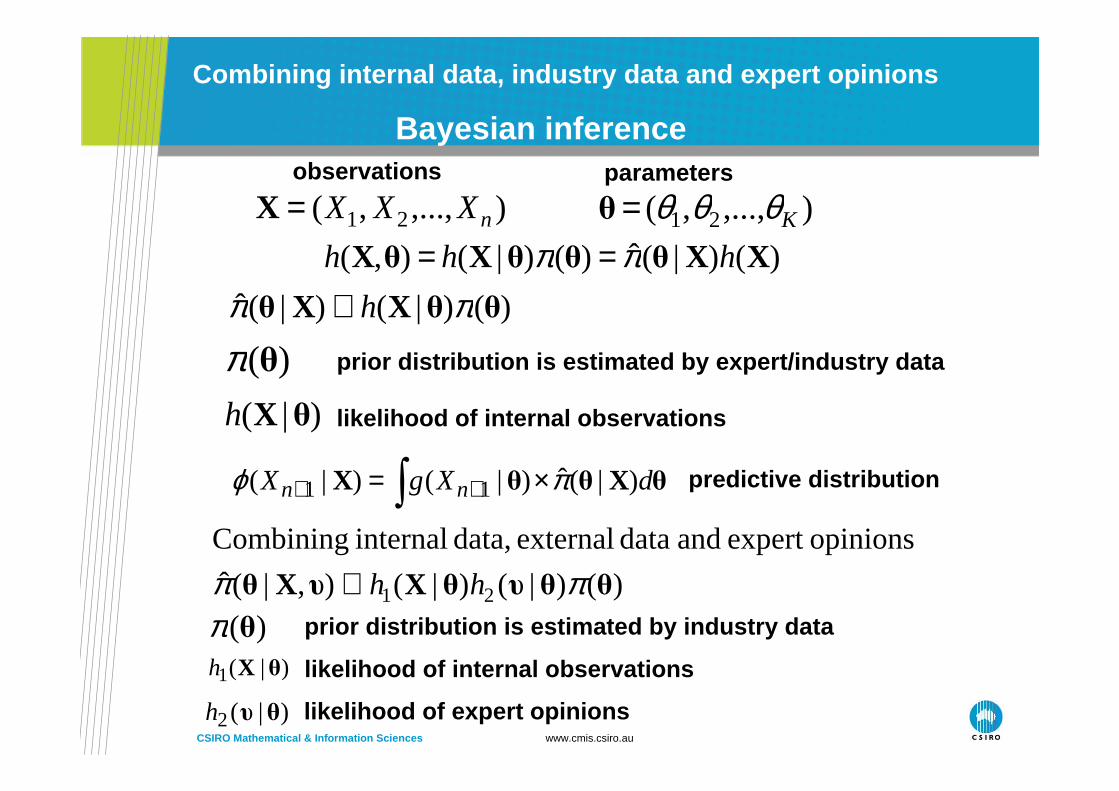
Combining internal data, industry data and expert o pinions
Bayesian inference
)()|(ˆ)()|(),( XXθθθXθX hhh ππ ==),...,,( 21 nXXX=X
)()|()|(ˆ θθXXθ ππ h∝
),...,,( 21 Kθθθ=θobservations parameters
)(θπ prior distribution is estimated by expert/industry data
)|( θXh likelihood of internal observations
∫ ×= ++ θXθθX dXgX nn )|(ˆ)|()|( 11 πϕ predictive distribution
)()|()|(),|(ˆ
opinionsexpert and data external data, internal Combining
21 θθυθXυXθ ππ hh∝)(θπ
)|(1 θXh
)|(2 θυh
prior distribution is estimated by industry data
likelihood of internal observations
likelihood of expert opinions
CSIRO Mathematical & Information Sciences www.cmis.csiro.au
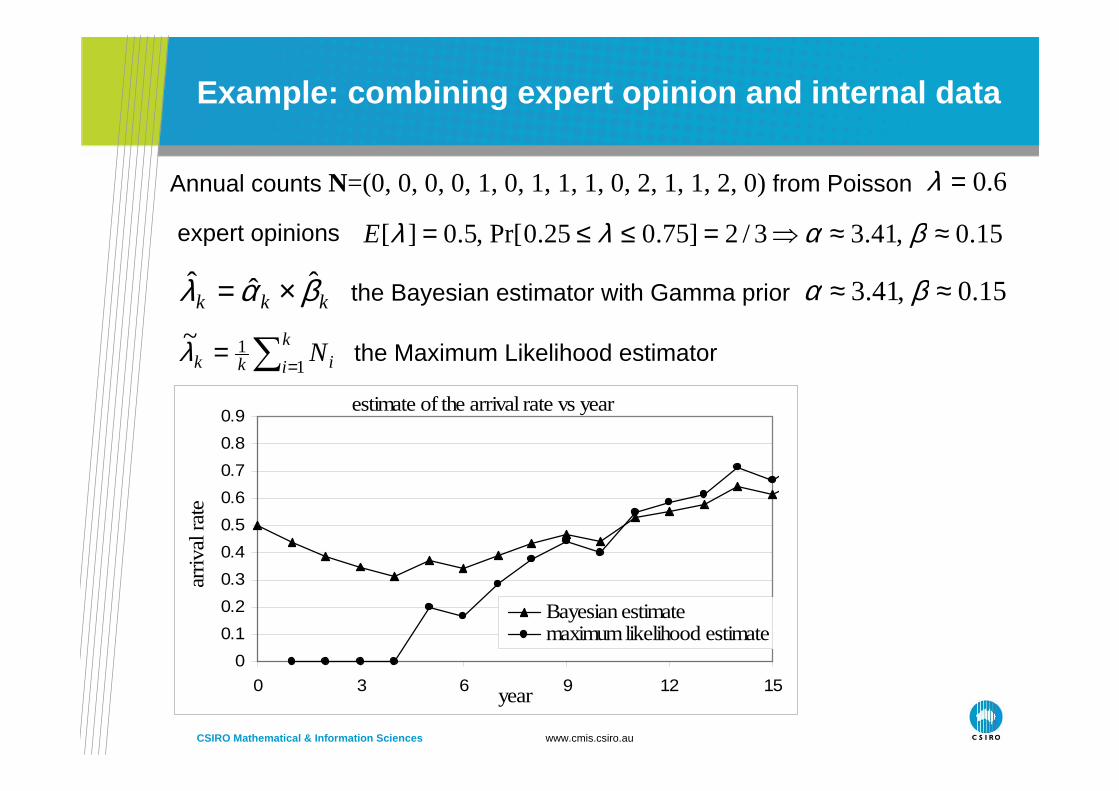
Example: combining expert opinion and internal data
estimate of the arrival rate vs year
0
0.1
0.2
0.3
0.4
0.5
0.6
0.7
0.8
0.9
0 3 6 9 12 15year
arriv
al r
ate
j
Bayesian estimatemaximum likelihood estimate
15.0,41.3 ≈≈ βα
6.0=λ
the Bayesian estimator with Gamma prior
Annual counts N=(0, 0, 0, 0, 1, 0, 1, 1, 1, 0, 2, 1, 1, 2, 0) from Poisson
kkk βαλ ˆˆˆ ×=
∑ == k
i ikk N1
1~λ the Maximum Likelihood estimator
expert opinions 15.0,41.33/2]75.025.0Pr[,5.0][ ≈≈⇒=≤≤= βαλλE
CSIRO Mathematical & Information Sciences www.cmis.csiro.au
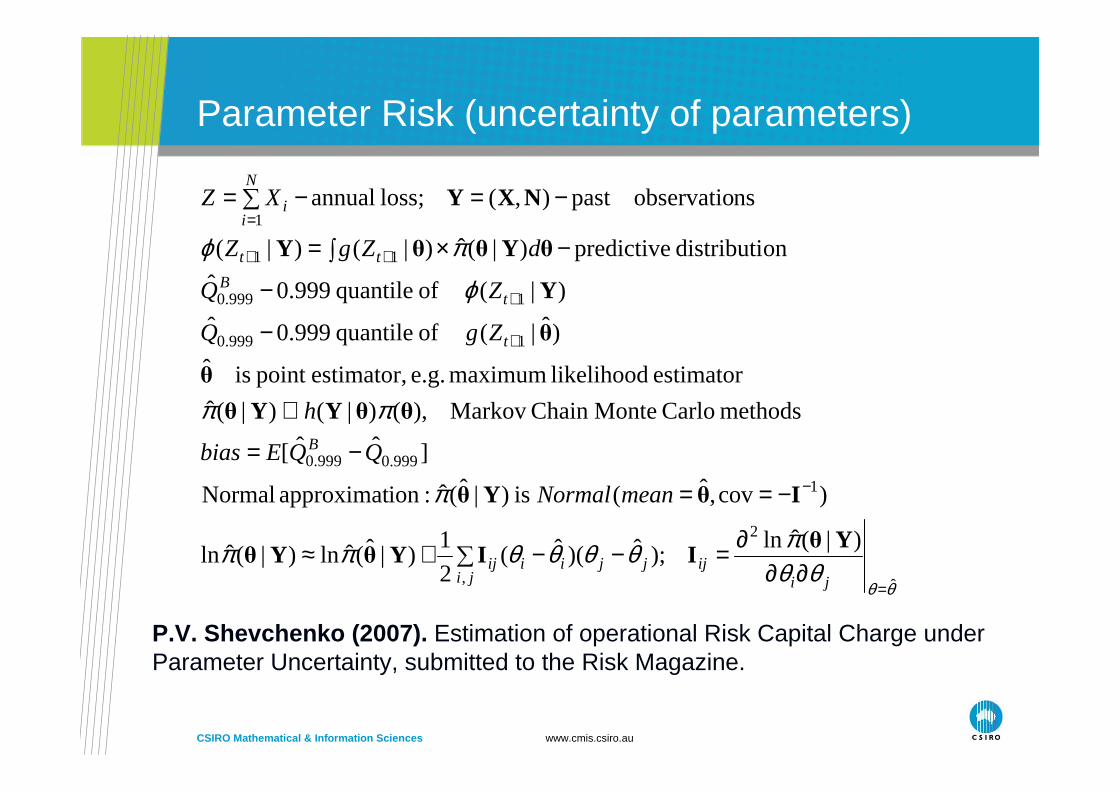
Parameter Risk (uncertainty of parameters)
θθθθ
πθθθθππ
π
ππ
ϕ
πϕ
ˆ
2
,
1
999.0999.0
1999.0
1999.0
11
1
)|(ˆln);ˆ)(ˆ(
2
1)|ˆ(ˆln)|(ˆln
)cov,ˆ(is)|ˆ(ˆ :ionapproximat Normal
]ˆˆ[
methods Carlo MonteChain Markov),()|()|(ˆ
estimator likelihood maximum e.g. estimator,point isˆ
)ˆ|(ofquantile999.0ˆ
)|(ofquantile999.0ˆ
ondistributipredictive)|(ˆ)|()|(
nsobservatiopast),(loss;annual
=
−
+
+
++
=
∂∂∂=−−∑+≈
−==
−=
∝
−
−
−∫ ×=
−=−∑=
jiijjjii
jiij
B
t
tB
tt
N
ii
meanNormal
QQEbias
h
ZgQ
ZQ
dZgZ
XZ
YθIIYθYθ
IθYθ
θθYYθ
θ
θ
Y
θYθθY
NXY
P.V. Shevchenko (2007). Estimation of operational Risk Capital Charge under Parameter Uncertainty, submitted to the Risk Magazine.
CSIRO Mathematical & Information Sciences www.cmis.csiro.au
Parameter Risk (uncertainty of parameters)
0
1000
2000
3000
4000
5000
6000
2 4 6 8 10 12 14 16 18 20year
0.99
9 qu
antil
e
MLE
Bayesian
TRUE
0%
50%
100%
150%
200%
250%
5 10 15 20 25 30 35 40Year
% b
ias
Lognormal
Pareto
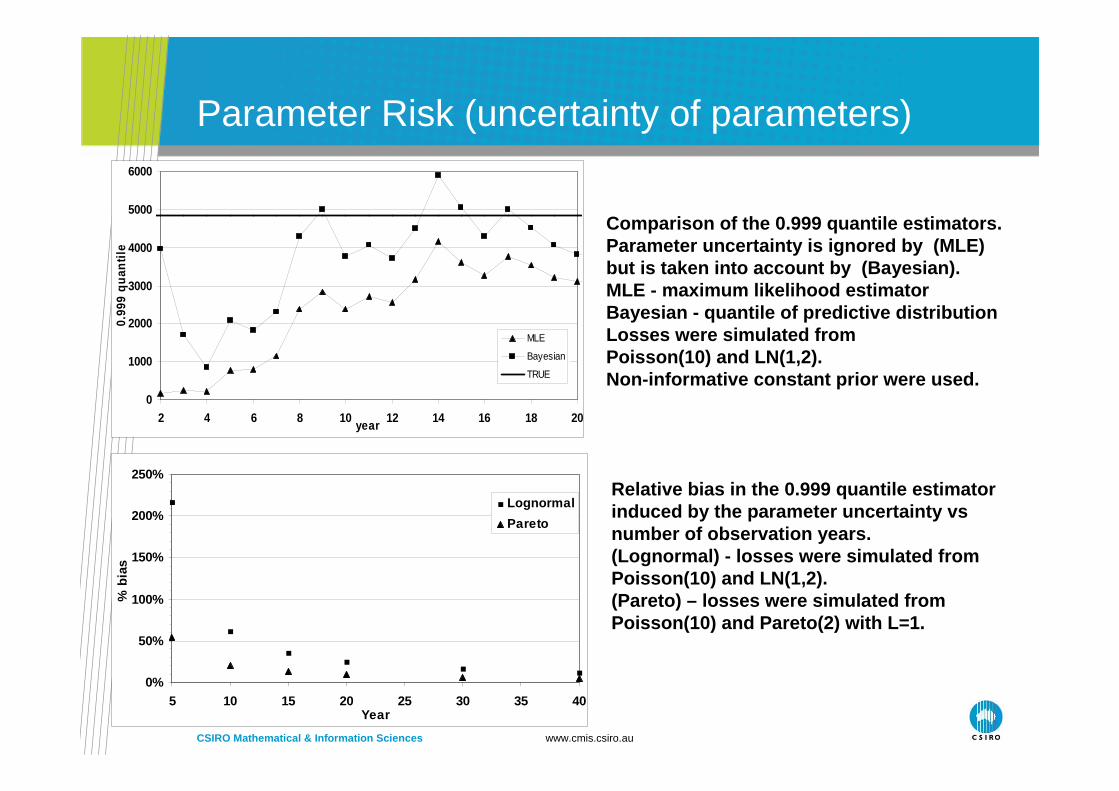
Relative bias in the 0.999 quantile estimator induced by the parameter uncertainty vsnumber of observation years. (Lognormal) - losses were simulated from Poisson(10) and LN(1,2). (Pareto) – losses were simulated from Poisson(10) and Pareto(2) with L=1.
Comparison of the 0.999 quantile estimators. Parameter uncertainty is ignored by (MLE) but is taken into account by (Bayesian). MLE - maximum likelihood estimatorBayesian - quantile of predictive distributionLosses were simulated from Poisson(10) and LN(1,2). Non-informative constant prior were used.
CSIRO Mathematical & Information Sciences www.cmis.csiro.au
Kalman/Particle filter techniques(state-space models)
• On-line monitoring of water quality• Health surveillance• Modelling commodities/interest rates

CSIRO Mathematical & Information Sciences www.cmis.csiro.au
State-space models: Kalman Filter
• Measurement Equation• Transition Equation
ttTtttTTt
tttttt
ttt
Tttt
tTCStTBtTAFSSEF
dtdWdWEdWdtXd
dWdtSd
FS
δδρσκδκαδ
σσδµ
δ
)(ln)()(ln],|[
][;][
][ln
prices futures yield, econveniencprice;spot
,,
)2()1()2(221
)1(1
212
1
,
−+−+−=⇒==+−−=
+−−=
−−−Commodity spot models:e.g. 2-factor convenience yie ld
Interest rate spot models:e.g. Vasicek model
tTttTt
ttt
Ttt
rtTBtTAPrTtBTtAP
dWdtrdr
Pr
)()(lnln]),(exp[),(
][
price bondrate; term-short
,,
,
−−−=⇒−=+−=
−−
σγα
eXBAF ttrrrr
+×+= ˆ
εrrrr
+×+=+ tt XTMX ˆ1
CSIRO Mathematical & Information Sciences www.cmis.csiro.au
Emerging over-arching research topics
• Mixing internal & external data with expert opinion s (credibility theory, Bayesian techniques)
• Dependence between risks: copula methods, structura l models
• Compound point processes • Modelling distribution tail: EVT, mixed distributio ns, splices• Efficient Markov Chain Monte Carlo, Monte Carlo, fi nite
element/finite difference methods • State-space models (sequential Monte Carlo, Kalman f ilter) • Time series analysis via chaos theory methods• Modelling truncated/censored data • Nonlinear optimization with constraints
Thank you
CSIRO Mathematical & Information SciencesPavel Shevchenko
Phone: 02 9325 3218Email: [email protected]/Pavel.Shevchenko