brief definitive report nckap1l
TRANSCRIPT

BRIEF DEFINITIVE REPORT
NCKAP1L defects lead to a novel syndrome combiningimmunodeficiency, lymphoproliferation, andhyperinflammationCarla Noemi Castro1*, Michelle Rosenzwajg2,3*, Raphael Carapito4,5*, Mohammad Shahrooei6,7*, Martina Konantz8, Amjad Khan9,10,11,Zhichao Miao12,13, Miriam Groß1, Thibaud Tranchant4, Mirjana Radosavljevic4,5, Nicodème Paul4, Tristan Stemmelen4, Fabien Pitoiset2,3,Aurelie Hirschler14, Benoit Nespola5, Anne Molitor4, Veronique Rolli4,5, Angelique Pichot4, Laura Eva Faletti1,15, Bruno Rinaldi16,Sylvie Friant16, Mark Mednikov17, Hatice Karauzum17, M. Javad Aman17, Christine Carapito14, Claudia Lengerke8, Vahid Ziaee18,19,Wafaa Eyaid9,10,11, Stephan Ehl1,15**, Fayhan Alroqi9,10,11**, Nima Parvaneh20,21**, and Seiamak Bahram4,5**
The Nck-associated protein 1–like (NCKAP1L) gene, alternatively called hematopoietic protein 1 (HEM-1), encodes ahematopoietic lineage–specific regulator of the actin cytoskeleton. Nckap1l-deficient mice have anomalies in lymphocytedevelopment, phagocytosis, and neutrophil migration. Here we report, for the first time, NCKAP1L deficiency cases in humans.In two unrelated patients of Middle Eastern origin, recessive mutations in NCKAP1L abolishing protein expression led toimmunodeficiency, lymphoproliferation, and hyperinflammation with features of hemophagocytic lymphohistiocytosis.Immunophenotyping showed an inverted CD4/CD8 ratio with a major shift of both CD4+ and CD8+ cells toward memorycompartments, in line with combined RNA-seq/proteomics analyses revealing a T cell exhaustion signature. Consistent withthe core function of NCKAP1L in the reorganization of the actin cytoskeleton, patients’ T cells displayed impaired earlyactivation, immune synapse morphology, and leading edge formation. Moreover, knockdown of nckap1l in zebrafish led todefects in neutrophil migration. Hence, NCKAP1L mutations lead to broad immune dysregulation in humans, which could beclassified within actinopathies.
IntroductionCircumscription of the innate or adaptive immune response isequally important to its initiation, as an otherwise unhingedimmune response would result in overt pathology, includinglymphoproliferation, autoimmunity, hyperinflammation, and/or immunodeficiency (Delmonte et al., 2019). Most of thesemanifestations are part of hemophagocytic lymphohistiocytosis
(HLH), a life-threatening disease associated with uncontrolledT cells, natural killer (NK) cells, and/or macrophage activationand excessive inflammatory cytokine secretion (Al-Samkari andBerliner, 2018). Clinically, HLH is characterized by a combina-tion of mainly unspecific symptoms due to lymphoproliferation(e.g., splenomegaly), inflammation (e.g., fever), various system/
.............................................................................................................................................................................1Institute for Immunodeficiency, Center for Chronic Immunodeficiency, Medical Center-University of Freiburg, Faculty of Medicine, University of Freiburg, Freiburg,Germany; 2Assistance Publique-Hopitaux de Paris, Pitie-Salpetrière Hospital, Biotherapy (Centre d’Investigation Clinique integre en Biotherapies & immunologie; CIC-BTi)and Inflammation-Immunopathology-Biotherapy Department (i2B), Paris, France; 3Sorbonne Universite, Institut National de la Sante et de la Recherche Medicale UMR_S959, Immunology-Immunopathology-Immunotherapy (i3), Paris, France; 4Laboratoire d’ImmunoRhumatologie Moleculaire, Plateforme GENOMAX, Institut National de laSante et de la Recherche Medicale UMR_S 1109, Faculte de Medecine, Federation Hospitalo-Universitaire OMICARE, Federation de Medecine Translationnelle de Strasbourg,Laboratory of Excellence TRANSPLANTEX, Universite de Strasbourg, Strasbourg, France; 5Service d’Immunologie Biologique, Plateau Technique de Biologie, Pole deBiologie, Nouvel Hopital Civil, Hopitaux Universitaires de Strasbourg, Strasbourg, France; 6Specialized Immunology Laboratory of Dr. Shahrooei, Sina Medical Complex,Ahvaz, Iran; 7Department of Microbiology and Immunology, University of Leuven, Leuven, Belgium; 8University of Basel and University Hospital Basel, Department ofBiomedicine, Basel, Switzerland; 9Department of Pediatrics, King Abdulaziz Medical City, King Abdullah Specialized Children’s Hospital, Riyadh, Saudi Arabia; 10King Saudbin Abdulaziz University for Health Sciences, Riyadh, Saudi Arabia; 11King Abdullah International Medical Research Center, Riyadh, Saudi Arabia; 12European MolecularBiology Laboratory, European Bioinformatics Institute, Wellcome Genome Campus, Hinxton, Cambridge, UK; 13Shanghai Fourth People’s Hospital Affiliated to TongjiUniversity School of Medicine, Shanghai, Hongkou, China; 14Laboratoire de Spectrometrie de Masse Bio-Organique, Institut Pluridisciplinaire Hubert Curien, UMR 7178,Universite de Strasbourg, Centre National de la Recherche Scientifique, Strasbourg, France; 15Department of Pediatrics and Adolescent Medicine, Medical Center-Universityof Freiburg, Faculty of Medicine, University of Freiburg, Freiburg, Germany; 16Laboratoire de Genetique Moleculaire, Genomique, Microbiologie, UMR7156/Universite deStrasbourg, Centre National de la Recherche Scientifique, Strasbourg, France; 17Integrated BioTherapeutics, Inc., Rockville, MD; 18Pediatric Rheumatology ResearchGroup, Rheumatology Research Center, Tehran University of Medical Sciences, Tehran, Iran; 19Department of Pediatrics, Tehran University of Medical Sciences, Tehran,Iran; 20Division of Allergy and Clinical Immunology, Department of Pediatrics, Tehran University of Medical Sciences, Tehran, Iran; 21Research Center forImmunodeficiencies, Tehran University of Medical Sciences, Tehran, Iran.
*C.N. Castro, M. Rosenzwajg, R. Carapito, and M. Shahrooei contributed equally to this paper; **S. Ehl, F. Alroqi, N. Parvaneh, and S. Bahram contributed equally tothis paper; Correspondence to Seiamak Bahram: [email protected].
© 2020 Castro et al. This article is available under a Creative Commons License (Attribution 4.0 International, as described at https://creativecommons.org/licenses/by/4.0/).
Rockefeller University Press https://doi.org/10.1084/jem.20192275 1 of 18
J. Exp. Med. 2020 Vol. 217 No. 12 e20192275
Dow
nloaded from http://rupress.org/jem
/article-pdf/217/12/e20192275/1048329/jem_20192275.pdf by guest on 27 January 2022
organ dysfunctions (liver injury, central nervous system in-flammation), and a number of nonpathognomonic biologicalabnormalities (including pancytopenia, coagulopathy, hyper-lipidemia, hyperferritinemia, and sCD25 elevation). HLH istraditionally divided into two categories: primary (or familial),associated with genetic defects in lymphocyte cytotoxicity, andsecondary, in which patients do not carry a mutation in genesknown to predispose to HLH (Janka, 2012; Tesi and Bryceson,2018). Secondary HLH can be triggered by a viral infection or anautoimmune or malignant disease (Al-Samkari and Berliner,2018; Tangye et al., 2017). However, this distinction is becomingblurred, since an increasing number of inborn errors of im-munity have been shown to predispose to HLH in the absence ofcytotoxicity defects (Bode et al., 2015; Canna et al., 2014; Gaydenet al., 2018; Lam et al., 2019).
Here we report two unrelated patients presenting withsymptoms of immunodeficiency, lymphoproliferation, andinflammation, collectively defining a novel nosological entity—i.e., familial hyperinflammatory immunodeficiency with fea-tures of HLH. Unlike familial HLH, where mutations lead todefects in transport, exocytosis, or the content of cytotoxicgranules in T and NK cells, the disease described here is dueto homozygous mutations in Nck-associated protein 1–like(NCKAP1L), a key component of the actin cytoskeleton ma-chinery. NCKAP1L, alternatively called hematopoietic protein-1(HEM-1), is a hematopoietic lineage–restricted member of theNap1l subunit of the WAVE (WASP-family verprolin-homologousprotein) complex. It signals downstream of activated Rac tostimulate F-actin polymerization in response to engagement ofvarious immune receptors (B cell receptor, TCR, TLR, or cyto-kine receptors). Nckap1l-deficient mice further established thatthe molecule is critical for activation, migration, and cellularcontact formation of lymphoid and myeloid cells, includingimmunological synapse formation in effector cells (Park et al.,2008), which could explain the combination of impaired con-trol of infection and continuous immune cell stimulation withinflammatory consequences.
Results and discussionClinical phenotypePatient 1 is a 15-mo-old girl, the only child of healthy consan-guineous parents of Iranian origin (Fig. 1 A). She received astandard set of vaccinations (tetanus, oral polio, BacillusCalmette–Guerin [BCG] and hepatitis B) at birth. At 1.5 mo ofage, she presented with fever and massive splenomegaly. Bloodcounts revealed a hyperleukocytosis (56,000–85,500 cells/µl)with relative lymphocytosis (3,000–51,000 cells/µl) and mono-cytosis (5,600–7,700 cells/µl; Table 1). She had mild anemia(hemoglobin, 9.5–10.2 g/dl) with discrete evidence for aniso-poikilocytosis. A bone marrow aspirate showed normal cellu-larity with no visible sign of hemophagocytosis. Furtherimmunological workup showed relative CD4 lymphocytopenia,increased serum levels of IgG (2,581 mg/dl), IgA (130 mg/dl),IgM (>1,000 mg/dl), and IgE (60 IU/ml), and high antinuclearantibody titer (1/1,280) with a nuclear homogenous fluorescencepattern upon indirect immunofluorescence on HEp-2 cells
(Table 1). The patient was seropositive for EBV (IgG) and sero-negative for CMV; both viruses were negative by PCR, as wasmicroscopy for Leishman bodies and acid-fast bacilli (Ziehl–Neelsen stain) in the bone marrow. Based on fever, spleno-megaly, markedly increased ferritin (1,190 ng/ml), triglycerides(1,140 mg/dl), and soluble IL-2 receptor (sIL-2R; 3,202 U/ml)levels (Table 1), a formal diagnosis of HLH was established, al-though the patient lacked cytopenia, a characteristic of primaryHLH (Henter et al., 2007). Methylprednisolone pulse therapy(30 mg/kg for 3 d consecutively), followed by oral dexametha-sone (10 mg/m2/d and tapered over several weeks) and cyclo-sporine (3 mg/kg/d) were successful in controlling clinicalsymptoms and led to near-normalization of most laboratoryparameters. She continued to do well on dexamethasone(1.25 mg/m2/d three times per week) and cyclosporine (targetblood level of 100–200 ng/ml) up to the age of 9 mo, when shedeveloped axillary BCG lymphadenitis (the aspirates were positivefor acid-fast bacilli; Fig. 1 B). Accordingly, she was put on rifam-picin, isoniazid, and ethambutol, which was switched after 2.5 moto ethambutol, cotrimoxazole, and levofloxacin due to drug-induced hepatotoxicity. The infection is presently under control.
Patient 2 is an 11-yr-old son of healthy first-cousin parentsfrom Saudi Arabia (Fig. 1 A), whose siblings were also all equallyhealthy and who, like the previous patient, received a standardset of vaccinations at birth/early childhood (including BCG atbirth). At the age of 5 yr, the patient started to have recurrentotitis media, fever, and sinopulmonary infections that re-sponded only partially to antimicrobial therapies. A chestcomputed tomographic scan showed right-side basal bronchi-ectasis and focal area of oligemia (Fig. 1 C). He underwent ad-enotonsillectomy and bilateral insertion of tympanostomytubes at the age of 7 yr. At the age of 9 yr, he presented withrecurrent viral illnesses, including upper respiratory in-fections, gastroenteritis, and infectious mononucleosis. Clinicalexamination showed hepatosplenomegaly (Fig. 1 D). The labo-ratory workup showed pancytopenia (white blood cells 3,460cells/µl, hemoglobin 6.60 g/dl, platelets 71,000 cells/µl, neu-trophils 1,660 cells/µl, lymphocytes 1,380 cells/µl), mild tomoderate anisopoikilocytosis, and moderate transaminitis (as-partate transaminase and alanine transaminase at 301 and 313U/liter, respectively; Table 1). His bone marrow biopsy showedhistiocytes with phagocytosis of erythrocytes, lymphocytes,and platelets (Fig. 1 E). The patient displayed low-titer EBVviremia (<500 copies/ml with no treatment) and was sero-positive (IgG) for the virus, while CMV serology and PCR wereboth negative. Other biological findings included massive IgG,IgA, and IgM hyperimmunoglobulinemia (15,900, 1,820, and1,340 mg/dl, respectively), normal IgE, and negative autoanti-bodies. Hematoxylin and eosin and CD68 staining of liver tissuerevealed sinusoidal dilatation with hemophagocytic histiocy-tosis (Fig. 1, F and G). The presence of hypertriglyceridemia(612 mg/dl), hyperferritinemia (14,280 ng/ml), and a mildlyincreased sIL-2R at 1,701 U/ml (Table 1) completed the picturefor a formal diagnosis of HLH (Henter et al., 2007), for which hewas started on the HLH-2004 protocol (Bergsten et al., 2017).Despite completing the treatment course, he continued to havehigh liver enzymes with no clear etiology. He was given
Castro et al. Journal of Experimental Medicine 2 of 18
NCKAP1L deficiency https://doi.org/10.1084/jem.20192275
Dow
nloaded from http://rupress.org/jem
/article-pdf/217/12/e20192275/1048329/jem_20192275.pdf by guest on 27 January 2022
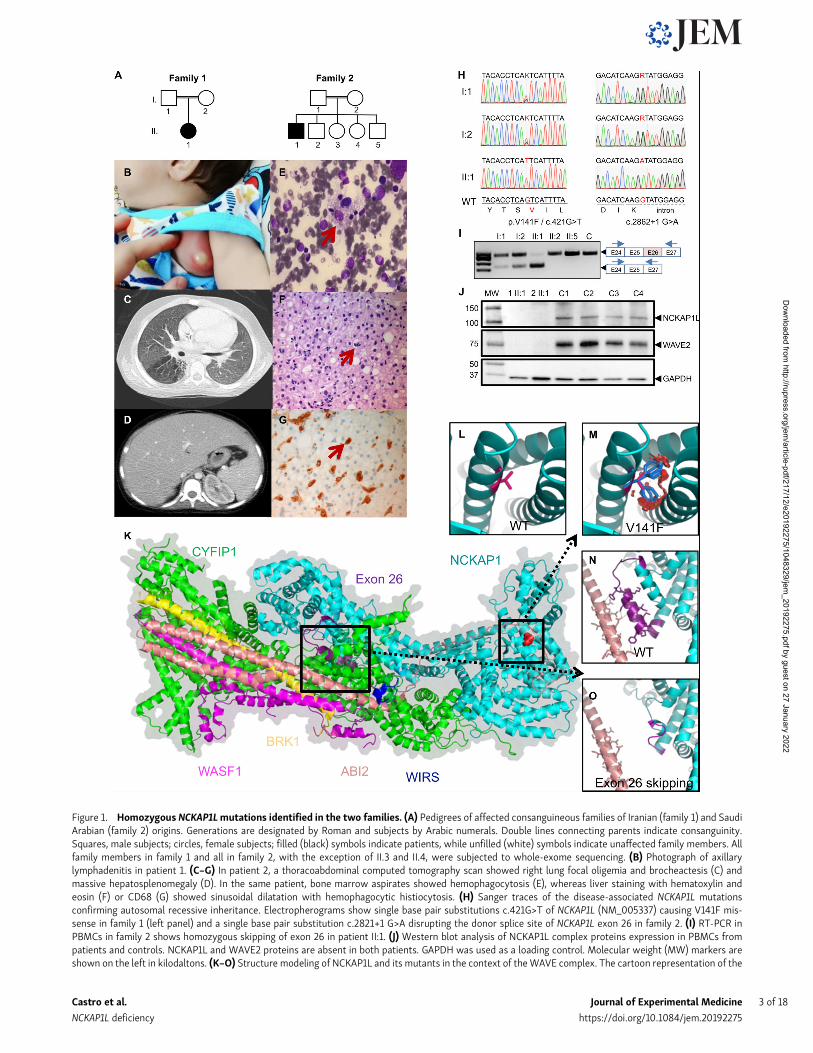
Figure 1. Homozygous NCKAP1Lmutations identified in the two families. (A) Pedigrees of affected consanguineous families of Iranian (family 1) and SaudiArabian (family 2) origins. Generations are designated by Roman and subjects by Arabic numerals. Double lines connecting parents indicate consanguinity.Squares, male subjects; circles, female subjects; filled (black) symbols indicate patients, while unfilled (white) symbols indicate unaffected family members. Allfamily members in family 1 and all in family 2, with the exception of II.3 and II.4, were subjected to whole-exome sequencing. (B) Photograph of axillarylymphadenitis in patient 1. (C–G) In patient 2, a thoracoabdominal computed tomography scan showed right lung focal oligemia and brocheactesis (C) andmassive hepatosplenomegaly (D). In the same patient, bone marrow aspirates showed hemophagocytosis (E), whereas liver staining with hematoxylin andeosin (F) or CD68 (G) showed sinusoidal dilatation with hemophagocytic histiocytosis. (H) Sanger traces of the disease-associated NCKAP1L mutationsconfirming autosomal recessive inheritance. Electropherograms show single base pair substitutions c.421G>T of NCKAP1L (NM_005337) causing V141F mis-sense in family 1 (left panel) and a single base pair substitution c.2821+1 G>A disrupting the donor splice site of NCKAP1L exon 26 in family 2. (I) RT-PCR inPBMCs in family 2 shows homozygous skipping of exon 26 in patient II:1. (J) Western blot analysis of NCKAP1L complex proteins expression in PBMCs frompatients and controls. NCKAP1L and WAVE2 proteins are absent in both patients. GAPDH was used as a loading control. Molecular weight (MW) markers areshown on the left in kilodaltons. (K–O) Structure modeling of NCKAP1L and its mutants in the context of theWAVE complex. The cartoon representation of the
Castro et al. Journal of Experimental Medicine 3 of 18
NCKAP1L deficiency https://doi.org/10.1084/jem.20192275
Dow
nloaded from http://rupress.org/jem
/article-pdf/217/12/e20192275/1048329/jem_20192275.pdf by guest on 27 January 2022

another course of etoposide and dexamethasone with no sig-nificant improvement. Currently, he is off therapy with mildtransaminitis.
Identification of a candidate geneGiven the unusual symptomatology of the patients somewhatdeviating from typical familial HLH, we aimed directly at whole-exome sequencing for the identification of the culprit gene. Allfamily members (patients, both their parents, and several sib-lings in family 2) were whole-exome sequenced. Both familiesdisplayed a variant in NCKAP1L segregating with the diseasewith an autosomal recessive inheritance model—i.e., homozy-gous in the patient while WT or heterozygous in all other familymembers. Both variants were confirmed by targeted Sangersequencing (Fig. 1 H). No other deleterious variants werefound in genes associated with primary HLH or primaryimmunodeficiencies (Picard et al., 2018). Neither identifiedvariant was present in the Exome Variant Server, ExomeAggregation Consortium, Genome Aggregation Database, ourin-house database, and various other databases. (Table S1 re-ports other variants found in patient 1; no additional variantswere found in patient 2.) In patient 1, a c.421G>T (p.V141F;NM_005337; chr12:54902230G>T) missense variant was iden-tified (Fig. 1 H), while the variant c.2862+1G>A (NM_005337;chr12:54926035G>A) in patient 2 abolished the donor splice sitein intron 26 (Fig. 1 H), leading to the skipping of the 26th exon,as confirmed by RT-PCR (Fig. 1 I) and RNA sequencing (RNA-seq; data not shown) experiments. In silico analyses predictedthe variants to be damagingwith scores of 0.008 (scale-invariantfeature transform), 0 (likelihood ratio test), 4.09 (GenomicEvolutionary Rate Profiling [GERP]++), 0.954 (polymorphismphenotyping v2), and 26.2 (Combined Annotation-DependentDepletion) for p.V141F, and 4.17 (GERP++), 4.564 (PhyloP), and25.8 (Combined Annotation-Dependent Depletion) for c.2862+1G>A(Adzhubei et al., 2010; McKenna et al., 2010; Yang and Wang,2015). The Mutation Taster tool predicted both variants to bedisease causing and, according to the American College ofMedical Genetics and Genomics guidelines, c.421G>T andc.2862+1G>A can be classified as PM2 (moderate pathogenic) andPVS1 (pathogenic very strong), respectively (Richards et al.,2015; Schwarz et al., 2014). Moreover, the NCKAP1L proteinwas undetectable by Western blot (and proteomics analysis; seebelow) in both patients, as was WAVE2, which requires inter-action with NCKAP1L for stabilization (Fig. 1 J). Therefore, bothpatients harbor recessive loss-of-function mutations inNCKAP1L.
Effect of NCKAP1L mutations on protein structureStructural modeling confirmed the deleterious effects of bothmutations on protein structure. The model structure of NCKAP1L
was built in the context of the WAVE complex (Chen et al.,2014) using NCKAP1 as a template (Fig. 1 K). NCKAP1L bindsto CYFIP1 to form the support for the large complex, while theAbl interactor 2 protein (ABI2, shown in salmon color) hasproximal contacts with both the helices around the V141F mu-tation (shown in red) and the exon 26 helix region (shown inpurple). The V141F mutation is located in the N terminus ofNCKAP1L. Given that phenylalanine has a larger side-chaingroup than valine, the mutation would result in severeatomic clashes (Fig. 1 L vs. Fig. 1 M) leading to the reorgani-zation of the domain, thus preventing the interaction withother components of the WAVE complex. With regard to thec.2862+1G>Amutation in patient 2, once exon 26 is missing, theresulting protein is unable to make several interactions withABI2, thereby producing a dysfunctional protein complex(Fig. 1 N vs. Fig. 1 O). Hence, structural modeling does supportthe observed absence of detectable NCKAP1L and WAVE2proteins in patient cells (Fig. 1 J).
Immunological phenotype of NCKAP1L-deficient patientsCompared with age-matched controls, we observed an increasednumber of CD8+ T cells with an inversion of the CD4/CD8 ratioand an activation phenotype characterized by increased per-centages of all memory subsets in CD8+ T cells: central memory(CM; CD45RA−CCR7+), effector memory (EM; CD45RA−CCR7−),and terminally differentiated EM cells (TEMRA; CD45RA+CCR7−;Fig. 2 A and Table 1). This increase was associated with increasedexpression of activation and senescence markers (CD57, CD69,CD95, HLA-DR, and PD1; Ammann et al., 2017; Fig. 2 A). Similarresults were observed in CD4+ T cells, although to a lesser extent(Fig. S1 A). Compared with patient 1, the T cell phenotype wasless pronounced in patient 2 (Fig. 2 A and Fig. S1 A). In bothpatients’ B cell compartments, we observed a slight increasedpercentage of naive cells associated with a decreased percentageof memory subsets (switched and unswitched; Table 1). How-ever, and only in patient 1, we observed an abnormal proportionof CD19+CD21− B cells, a population that has been associated withautoimmune diseases such as systemic lupus erythematosus(Wehr et al., 2004), in line with high titers of antinuclear anti-bodies found in this patient (Table 1 and Fig. S1 B).
Among NK cells, CD56hiCD16−/lo NK cells were increased, andnatural cytotoxicity receptor expression was altered with alower expression of NKp30 in both patients, which could cor-respond to abnormal differentiation and function of these NKcells (Fig. S1 C). Moreover, in patient 1, CD16+NK cells werecharacterized by a continuum in CD56 expression withoutpossible distinction between CD56+dim and CD56+bright cells, andin patient 2, a higher expression of CD57 was observed (Fig. S1 Cand Table 1). Finally, the percentage of classical (CD14+CD16−)
structure model of the NCKAP1L protein was established using NCKAP’s structure (PDB 4n78 chain B) as a template. The N- to -C is shown as a rainbow colorfrom blue to red. NCKAP1L is shown in cyan, and the product of exon 26 (purple), V141F mutation (red), and WIRS (blue) are in close contact with ABI2 (lightsalmon; K). Zooming to the V141F mutation shows the WT valine as hot pink (L). The residue has close contacts with the other two helices. When mutated tophenylalanine (patient 1), the large side-chain groups result in severe atomic clash, which indicates a reorganization of the helical structure and may have aneffect on ABI2 binding (M). Exon 26’s product (purple) forms close contacts (shown as yellow dashed lines) with ABI2 (N). When exon skipping occurs (patient 2),the helix in the C terminus of the exon 26 product changes to a loop region (shown in magenta; O). The contacts with ABI2 disappear in this situation.
Castro et al. Journal of Experimental Medicine 4 of 18
NCKAP1L deficiency https://doi.org/10.1084/jem.20192275
Dow
nloaded from http://rupress.org/jem
/article-pdf/217/12/e20192275/1048329/jem_20192275.pdf by guest on 27 January 2022

Table 1. Blood and immunological parameters of NCKAP1L patients
Patient 1 (3 mo) Patient 1 (8 mo) Normal range Patient 2 (9 yr) Patient (11 yr) Normal range
Peripheral blood
White blood cells (×103/µl) 85.5 7.4 6–17.5 3.46 10.6 5.4–9.7
Hemoglobin (g/dl) 9.5 11 9.5–13.5 6.60 12.4 11.3–13.4
RBC (x106/µl) 3.16 4.84 3.5–5.5 3.02 5.65 4.00–5.20
MCV (fl) 95.9 82 80–100 66.4 62.5 77–90
MCH (pg) 30.1 27.5 27–31 22 18.9 25–30
Reticulocyte count (%) 2.4 0.5–1.5 0.3 0.5–1.5
Direct Coombs test Negative Negative Negative Negative
Platelets (×103/µl) 234 236 150–450 71 188 150–450
Neutrophils (×103/µl) 21.4 2.1 1–8.5 1.66 2.84 2.5–5.95
Lymphocytes (×103/µl) 51 3.3 4.0–10.5 1.38 5.07 1.23–2.76
Monocytes (×103/µl) 7.7 1.8 0.2–1.2 0.42 0.87 0.10–1.11
Eosinophils (×103/µl) 1.5 <0.81 0 0.12 0.04–0.19
Lymphocyte subsetsa
CD3 (×103 cells/ml) 40.8 4.67 1.85–5.96 0.43 3.78 1–2.6
CD3/CD4 (×103 cells/ml) 10.2 1.28 1.14–3.8 0.25 1.69 0.53–1.5
CD3/CD8 (×103 cells/ml) 30.6 3.24 0.54–1.97 0.16 2.38 0.33–1.1
CD4/CD8 ratio 0.3 0.39 1.6–3.8 1.05 0.58 1.1–1.6
CD3/CD25 (×103 cells/ml) - - 56 328 100–400
CD19 (×103 cells/ml) 5.6 0.69 0.64–1.96 0.57 1.55 0.27–8.6
CD16/CD56 (×103 cells/ml) 4.5 0.40 0.15–1.33 0.57 0.21 0.07–0.48
% in CD4+ T cells
T reg (CD25+CD127−Foxp3+) - 5.6 6.3–8.5* - 7.4 7.6–9.9*
Naive (CD45RA+CCR7+) - 33 74–90* - 34 67–83*
CM (CD45RA−CCR7+) - 20 8–18* - 50 12–23*
EM (CD45RA−CCR7−) - 34 2–5* - 15 4–9*
TEMRA (CD45RA+CCR7−) - 3 0–5* - 1 1–2*
CD57+ - 6.5 1–2* - 3.8 0–2*
CD69+ - 21 5–9* - 5.0 5–7*
CD95+ - 69 12–24* - 66.9 18–36*
HLA-DR+ - 7 2–4* - 5.3 2–9*
PD1+ - 36 16–26* - 34.3 17–22*
% in CD8+ T cells
Naive (CD45RA+CCR7+) - 6 60–85* - 12 56–74*
CM (CD45RA−CCR7+) - 1 0–6* - 10 2–4*
EM (CD45RA−CCR7−) - 5 2–10* - 21 6–14*
TEMRA (CD45RA+CCR7−) - 88 6–28* - 57 13–30*
CD57+ - 49 0–16* - 58 4–20*
CD69+ - 22 6–21* - 17 12–24*
CD95+ - 61 0–18* - 36 14–34*
HLA-DR+ - 30 5–17* - 21 5–15*
PD1+ - 35 19–25* - 25 16–31*
% in CD19+ B cells
Naive (IgD+CD27−) - 90 69–86* - 93 64–86*
Castro et al. Journal of Experimental Medicine 5 of 18
NCKAP1L deficiency https://doi.org/10.1084/jem.20192275
Dow
nloaded from http://rupress.org/jem
/article-pdf/217/12/e20192275/1048329/jem_20192275.pdf by guest on 27 January 2022

Table 1. Blood and immunological parameters of NCKAP1L patients (Continued)
Patient 1 (3 mo) Patient 1 (8 mo) Normal range Patient 2 (9 yr) Patient (11 yr) Normal range
Switched memory (IgD+CD27−) - 1 3–10* - 3 5–17*
Unswitched memory (IgD+CD27+) - 1 7–10* - 3 5–15*
Transitional (CD24+CD38+) - 10 8–19* - 9 7–15*
CD21− - 77 4–14* - 2 2–5*
% in monocytes
Classical (CD14+CD16−) - 9 59–80* - 72 80–85*
Transient (CD14+CD16+) - 10 6–14* - 17 3–5*
Resident (CD14loCD16+) - 75 5–12* - 2 2–6*
% in CD3−CD56+ NK cells
CD16−CD56++ - 18 2–8* - 18 5–10*
NKp30+ - 26 69–86** - 51 64–81*
NKp44+ - 8 0–11* - 7 1–4*
NKp46+ - 96 96–98* - 95 94–97*
NKG2C+ - 11 0–69** - 10 7–19**
NKG2D+ - 98 97–98* - 93 84–100*
CD57+ - 10 0–49* - 28 10–23**
Igs
IgA (mg/dl) 130 169 4–69 1,820 680 70–400
IgG (mg/dl) 2,581 1,680 196–560 15,900 22,500 700–1,600
IgM (mg/dl) >1,000 9,550 25–93 1,340 1,160 40–230
IgE (IU/ml) 60 22.9 <15 358 197 0–500
Serology
Antinuclear antibodies titer - Positive at1/1,280 dilution
<1/80 Negative - <1/80
Anti-dsDNA (IU/ml) - Negative <50 Negative - <200
Tetanus titer (IU/ml) Protective Protective >0.15 Protective Protective >0.15
Others
Ferritin (ng/ml) 1,190 241 36–100 14,280 76.9 21–274
Fibrinogen (mg/liter) 0.64 0.83 1.5–3.5 1.07 3.83 1.50–4.10
Triglycerides (mg/dl) 1,140 1,940 20–150 612 174 20–150
AST (U/liter) 141 84 6–50 301 102 5–34
ALT (U/liter) 21 35 20–60 313 121 5–55
Total bilirubin (µmol/liter) 6.84 3.42 3.4–17.1 15.1 5.1 3.4–17.1
Conjugated 3.42 - <5.9 14.2 - <5.9
Unconjugated 3.42 - <17.1 0.9 - <17.1
Alk Phos (IU/liter) 709 680 110–320 174 221 141–460
Haptoglobin (g/liter) - - - 0.47 - <2.7
LDH (IU/liter) - 2,835 500–920 948 432–700
ESR (mm/h) 1 20 0–10 28 25 0–15
CRP (mg/liter) 1 1 <6 208 5 < 8
sIL-2R (U/ml) - 3,202 223–710 - 1,701 223–710
IFN-γ (pg/ml) - 5.3 1.7–66.5b - 339 0.3–11.0c
IL-10 (pg/ml) - 48.3 0–2.5b - 12.6 0–10.3c
IL-18 (pg/ml) - 3,698 17–145b - 2,130 266–1,300c
Castro et al. Journal of Experimental Medicine 6 of 18
NCKAP1L deficiency https://doi.org/10.1084/jem.20192275
Dow
nloaded from http://rupress.org/jem
/article-pdf/217/12/e20192275/1048329/jem_20192275.pdf by guest on 27 January 2022

monocytes was reduced in favor of inflammatory monocytes(CD14+CD16+ transient and/or CD14loCD16+ resident monocytes)in both patients (Fig. S1 D and Table 1).
Human NCKAP1L deficiency is associated with impaired earlyT cell activation but normal NK and cytotoxic T lymphocyte(CTL) cytotoxicityCD4+ T cells from NCKAP1L-deficient patients consistentlyshowed reduced up-regulation of CD69 and CD25 after stimu-lation with PHA, while they reacted normally to anti-CD3/CD28-coated beads (Fig. 2 B). This was also observed independently ofthe differences in memory and naive T cell frequencies of pa-tients and controls and the stimulation strength (data notshown). Nevertheless, T cells from both patients generallyproliferated normally after stimulation with PHA, or differentdoses of plate-bound or low doses of plate-bound anti-CD3 incombination with soluble anti-CD28 (Fig. 2 C). Thus, while earlyT cell activation events were impaired, this did not impair theoverall in vitro proliferation response. Moreover, the cytokineprofile of memory T cells measured in both patients showed anelevated frequency of IFN-γ–producing cells in patient 1(Fig. 2 D), consistent with his elevated serum IL-18 and IP-10levels (Table 1 and Fig. 2 E). Although patient 2 also showed el-evated plasma IFN-γ–dependent cytokines/chemokines (Table 1),ex vivo IFN-γ production by memory T cells was within thenormal range (Fig. 2 D). This discrepancy could stem fromdifferent ongoing inflammatory processes at the time of sam-pling. Of note, elevated serum levels of IP-10, IL-18, and IL-10 inpatient 1 in contrast to controls were still not as pronounced asin patients with an active primary HLH (Fig. 2 E).
Considering the HLH-like clinical phenotype of the patients,we carefully evaluated degranulation and cytotoxic responses ofNK cells and activated CD8+ T cells (CTL). NK cells from patient 1could be normally activated, expressing levels ofMIP-1β and IFN-γupon stimulation with K562 target cells and a combination of IL-15and IL-18 comparable to controls (Fig. 2 F). The degranulation ofpatient 1 NK cells had a higher basal level that did not furtherincrease when stimulated with K562 target cells. NK cells frompatient 2 did not show abnormalities compared with the travelcontrol; therefore, a general NK degranulation problem was notobserved (data not shown). Moreover, the ability of patient 1 NKcells to lyse K562 target cells as measured in a 4-h 51Cr releaseassay was comparable to controls (Fig. 2 G).
The degranulation capacity measured in CTL of patient 1 andpatient 2 upon strong stimulation with anti-CD3/28 beads re-sulted in normal or even increased levels of surface CD107aexpression. Additionally, patient 1 CTL degranulation was notdecreased compared with controls when tested under limitingconditions with titrated concentrations of plate-bound anti-CD3(Fig. 2 H). Likewise, T cell lines from both patients showed anormal killing capacity (Fig. 2 I).
Overall, NCKAP1L deficiency impaired early T cell activationbut did not affect T and NK cell cytotoxicity under the givenexperimental conditions.
Impaired actin polymerization in NCKAP1L-deficient T cells isassociated with impaired synapse and leading edge formationSince the WAVE complex is one of the nucleation promotingfactors activating the Arp2/3 complex and allowing the polym-erization of F-actin, we sought to study the effect of the loss ofNCKAP1L on this tightly regulated machinery. The basal F-actincontent in resting CD4+ and CD8+ T cells from patient 1 did notdiffer from controls (data not shown). However, abnormal actinpolymerization became evident when long-term CD8 T cell linesfrom the patient were allowed to spread on an anti-CD3–coatedsurface before fixation and F-actin staining. While control cellswere able to assemble a dense ring of F-actin around the dockingcentrosome (marked by pericentrin), patient T cells exhibited adysmorphic structure, lacking the characteristic synapse mor-phology (Fig. 3 A). Nevertheless, we detected perforin clusteringaround the centrosome in both patient and control T cells(Fig. 3 A), consistent with their intact degranulation capacity(Fig. 2 I).
Actin remodeling is also required for T cell movement. WhenT cells are placed on top of an ICAM-1–coated surface, theirdisplacement is associated with actin-rich protrusions at theleading edge.While this could readily be observed in control CD8T cell blasts, these protrusions were not detected in patient 1 andonly poorly detected in patient 2 T cells (Fig. 3 B), despite theirability to adhere and elongate.
These results indicate that the deficiency of NCKAP1L in pa-tient T cells has an impact on the dynamics by which the actincytoskeleton rearranges, either to form a proper immune syn-apse (IS) or to adopt the morphological structures that allowthem to migrate. This cellular phenotype was more pronouncedthan expected by the functional degranulation and cytotoxicity
Table 1. Blood and immunological parameters of NCKAP1L patients (Continued)
Patient 1 (3 mo) Patient 1 (8 mo) Normal range Patient 2 (9 yr) Patient (11 yr) Normal range
IP-10 (pg/ml) - 228 25–68b - 518 37–245c
IL12p40 (pg/ml) - 676 0.0–74b - 152 0.0–65c
“-” indicates test not done. Normal-range values are either those of the local diagnostic laboratory and/or reported from Gregory and Andropoulos (2012).* and ** correspond to 5th and 95th percentile of values obtained from eight age-matched controls and, in some rare cases, from three age-matched controls,respectively. Alk Phos., alkaline phosphatase; ALT, alanine transaminase; AST, aspartate transaminase; CRP, C-reactive protein; dsDNA, double-strandedDNA; ESR, erythrocyte sedimentation rate; LDH, lactate dehydrogenase; MCH, mean corpuscular hemoglobin; MCV, mean corpuscular volume; T reg cells,regulatory T cells.aNormal range for absolute numbers of lymphocyte subsets were from age-matched routine clinical lab values.bNormal range shows 5th and 95th percentile of serum cytokine levels calculated among 22 healthy subjects.cNormal range shows 5th and 95th percentile of plasma cytokine levels calculated among 10 healthy subjects.
Castro et al. Journal of Experimental Medicine 7 of 18
NCKAP1L deficiency https://doi.org/10.1084/jem.20192275
Dow
nloaded from http://rupress.org/jem
/article-pdf/217/12/e20192275/1048329/jem_20192275.pdf by guest on 27 January 2022
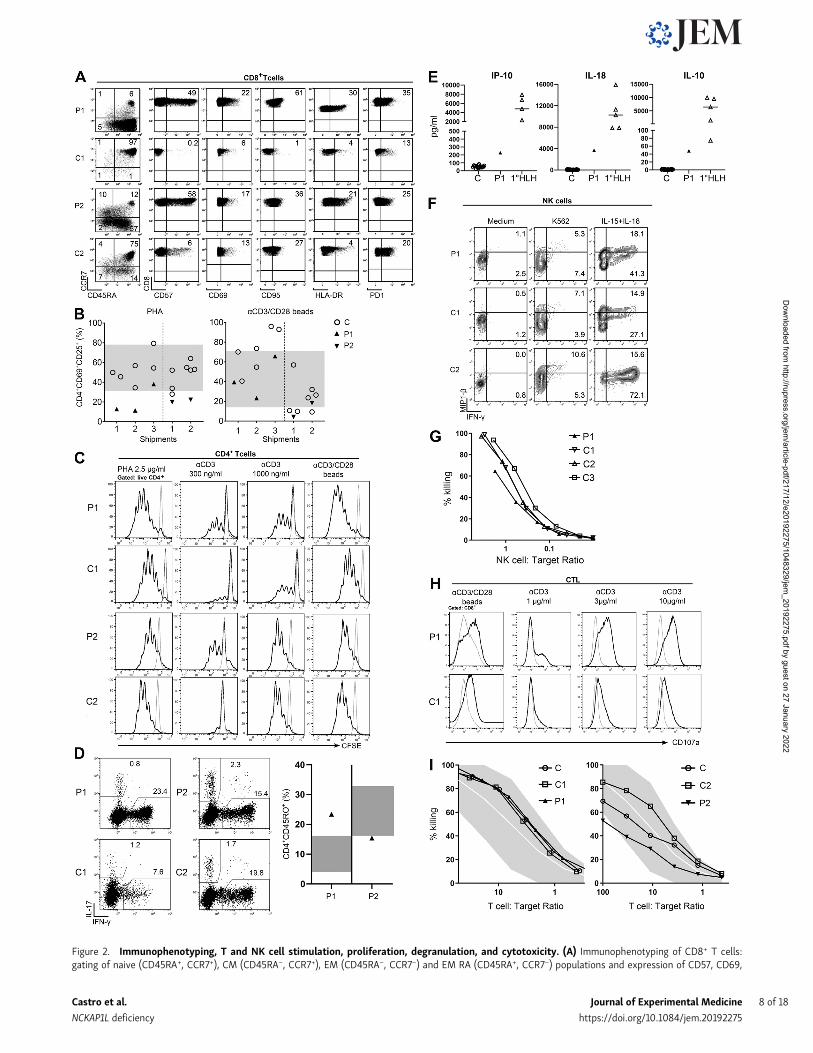
Figure 2. Immunophenotyping, T and NK cell stimulation, proliferation, degranulation, and cytotoxicity. (A) Immunophenotyping of CD8+ T cells:gating of naive (CD45RA+, CCR7+), CM (CD45RA−, CCR7+), EM (CD45RA−, CCR7−) and EM RA (CD45RA+, CCR7−) populations and expression of CD57, CD69,
Castro et al. Journal of Experimental Medicine 8 of 18
NCKAP1L deficiency https://doi.org/10.1084/jem.20192275
Dow
nloaded from http://rupress.org/jem
/article-pdf/217/12/e20192275/1048329/jem_20192275.pdf by guest on 27 January 2022

assays. This may be explained by the fact that the need for aproper IS that enables docking to the target cell and efficientdegranulation and killing might not be reflected in vitro, whereshear forces are minimal since the cells are cultured togetherwith their target cells in a confined space.
Of note, other known actinopathies that affect proper im-mune/lytic synapse formation impact CTL and NK degranulationand cytotoxicity to different extents. ARPC1B and Wiskott–Aldrich syndrome protein (WASP)–interacting protein (WIP)deficiencies lead to decreased degranulation due to abnormal ISformation. NK cells from DOCK8- and DOCK2-deficient patientsstill form normal conjugates with their targets, but the compro-mised RAC activation leads to a defect in the lytic synapse and thusa reduced killing capacity (Kearney et al., 2017; Sakai et al., 2013).In Coronin 1A (CORO1A) deficiency, NK cytotoxicity ranged fromnormal to reduced (Mace and Orange, 2014; Yee et al., 2016), whileCTL degranulation or killing was normal (Yee et al., 2016). InWASpatients, degranulation is mostly normal and CTL cytotoxicityranges from mildly defective to preserved (De Meester et al.,2010). Overall, cytotoxicity defects in actinopathies cover a widespectrum, with many of them being subtle, and there is no clearevidence that such mild defects can cause the pathophysiologicalsequence of events observed in primary HLH or HLH-likesyndromes.
All in all, the observed cellular defects are largely consistent withthe immune function of NCKAP1L identified in murine studies (seebelow). They likely explain the combined susceptibility to infectionand immune dysregulation phenotype in the patients, which arealso characteristic for other immunodeficiencies affecting actincytoskeleton remodeling (Dobbs et al., 2015; Janssen et al., 2016;Moulding et al., 2013; Schober et al., 2017).
Combined transcriptomics and proteomics analyses reveal anHLH-like immune activation signatureGene expression analyses by transcriptome and proteomecharacterization in peripheral blood mononuclear cells (PBMCs)
of patients and healthy controls revealed deregulation of severalcanonical immune-related cellular pathways. Among these, IFNand T cell exhaustion signaling pathways were shown to beactivated in both patients (Fig. 4, A and B; and Fig. S2). Indeed,IFN-γ–regulated cytokines such as IL-18 and IP-10 were foundincreased in both patients (Table 1). Patient 1 showed deregu-lation of additional immune pathways involving T cells, mac-rophages, neutrophils, and pro-inflammatory cytokines, as wellas phagocytosis, all hallmarks of active HLH. In accordance withthe defect in actin polymerization (see above), gene set enrich-ment analysis (GSEA) revealed that the regulation of the actincytoskeleton gene signature was down-regulated in both pa-tients (Fig. 4 C, left panels). Moreover, in line with the NCKAP1Ldeficiency, the signaling pathway of WAVE complex activationby Rho guanosine triphosphatase (GTPase) was confirmed to bedown-regulated as well (Fig. 4 C, right panels). Together, thesedata suggest a strong immune activation associating inflamma-tory and T cell responses to decreased actin cytoskeleton regu-lation, which is presumably linked to a reduced activation of theWAVE complex pathway. It is interesting to note that in certaingenetic forms of HLH, T cell exhaustion has been linked to a lesssevere form of the disease (Kogl et al., 2013). This might explainwhy, although serious, the disease severity in our two patientshas not (yet) required stem cell transplantation. Finally, byequivalent proteomic and transcriptomic profiling of three casesof familial hemophagocytic lymphohistiocytosis type-5, we in-deed identified the same deregulated pathways, except IL-1 sig-naling and N-formyl-methionyl-leucyl-phenylalanine signalingin neutrophils (data not shown), further highlighting a similarpathophysiology of our disease as compared with bona fidegenetic HLH.
In vivo functional impact of mutant NCKAP1LThe zebrafish is an established model for studies on hemato-poiesis, on developmental biology, and in generating experi-mental models of various human diseases (Jagannathan-Bogdan
CD95, HLA-DR, and PD-1 in CD8+ T cells. In each dot plot, the numbers indicate the percentage of the gated populations. The experiments were repeated onthree separate samples from each patient (unless otherwise specified). The shown control sample is one representative example of eight age-matched controlsanalyzed for each patient. (B) T cell activation markers: PBMCs were stimulated with PHA or anti-CD3/anti-CD28–coated beads for 20 h, and up-regulation ofCD69 and CD25 was determined by flow cytometry. Summarized results of determinations done on cells from three different shipments of patient 1 (P1, filled,up facing triangles) or two shipments of patient 2 (P2, filled, down-facing triangles) are compared with reference values obtained from 50 in-house controls(gray area indicates 5th–95th percentile) and travel controls (C, open circles). (C) T cell proliferation. Histograms show CFSE dilution of live CD4+ T cells after5 d of stimulation of PBMC from patient 1 (P1) or her father (C1; upper panels) or patient 2 (P2) or his father (C2; lower panels) with PHA, plate-bound anti-CD3,or plate-bound anti-CD3/anti-CD28. Gray line, medium; black line, stimulated. (D) Ex vivo T cell cytokine expression. Dot plots showing IL-17 and IFN-γexpression of patient 1 (P1) and patient 2 (P2) CD4+CD45RO+ memory T cells together with a representative age-matched control (C1 and C2, respectively; leftpanels). Summary graph shows the percentage of IFN-γ+ memory T cells from patient 1 (filled, up-facing triangle) and patient 2 (filled down-facing triangles)compared with reference values obtained from in-house healthy controls (n = 21, 0–2 yr old; n = 90, >10 yr old; gray area indicates 5th–95th percentile).(E) Serum cytokine levels of IFN-γ–regulated cytokines/chemokines. Summarized results show levels of the indicated cytokine or chemokine of patient 1 (P1,filled up-facing triangles) in comparison with healthy controls (C, open circles) and patients with primary HLH (open up-facing triangles). (F) NK cell cytokineproduction. PBMC from patient 1 (P1), an age-matched shipping control (C1), and an internal in-house control (C2) were cultured with IL-15 and IL-18 for 24 h orin the presence of K562 for 6 h before intracellular IFN-γ and MIP-1β staining. Dot plots show cytokine expression of CD56+CD3− NK cells. (G) NK cytotoxicity.Lytic activity of overnight rested PBMCs on 51Cr-labeled K562 cells. The percentage of NK cells among PBMCs as determined by flow cytometry was used tocalculate the NK:target cell ratio. Representative graph of two experiments performed with two different blood shipments shows patient 1 (P1) compared withher father (C1), mother (C2), and an unrelated control (C3). (H) CTL degranulation. Histograms show CD107a expression of T cell blasts from patient 1 (P1) orher father (C1) kept for 24 h in medium without IL-2 followed by stimulation with anti-CD3/CD28 beads or the indicated concentrations of plate-bound anti-CD3. Gray line: medium, black line: stimulated. (I) CTL cytotoxicity. Lytic activity of long-term T cell blasts overnight rested from IL-2 on 51Cr-labeled K562 cells.The percentage of CD8+ cells determined by flow cytometry was used to calculate the T cell:target ratio. Representative graph of two experiments showspatient 1 (P1) in comparison with her father (C1) and an unrelated control (C) or patient 2 (P2) in comparison with his father (C2) and an unrelated control (C).
Castro et al. Journal of Experimental Medicine 9 of 18
NCKAP1L deficiency https://doi.org/10.1084/jem.20192275
Dow
nloaded from http://rupress.org/jem
/article-pdf/217/12/e20192275/1048329/jem_20192275.pdf by guest on 27 January 2022

Figure 3. Functional consequences of NCKAP1L deficiency in T cells and neutrophils. (A) IS formation. Fluorescence microscopy of long-term T cell blastsfrom patient 1 (P1) and her father (C1), placed on top of a CD3-coated surface for 6 min. Green, F-actin; white, centrosome (PCN); red, perforin. Representativeimages of two experiments (left panels). Bar graphs showing percentage of cells with a distorted, abnormal, or no IS formation in a total of 30–40 cells perindividual per experiment (right panel). Two-way ANOVA with Sidak’s multiple comparison test; ***, P < 0.001; ****, P < 0.0001; scale bar, 15 µm. (B) Leadingedge formation and migration. Fluorescence microscopy of long-term T cell blasts of patient 1 (P1) and her father (C1) or patient 2 (P2) and his father (C2) whilecrawling on an ICAM-1–coated surface (left panels). White, F-actin. Representative images of two or three experiments. Bar graphs showing percentage ofelongated (Elong) cells with normal, no, or abnormal leading edge (LE) or not elongated of a total of 50–80 cells per individual per experiment. Two-wayANOVA with Sidak’s multiple comparison test, **, P < 0.01; ****, P < 0.0001; scale bar, 30 µm. (C)WISH of lyz at 48 hpf in control and MO-injected zebrafishembryos. Shown are (from top to bottom) representative images for each phenotype (top), graphs displaying the percentage of fish with normal vs. decreasedexpression (middle) assessed according to the numbers of neutrophils in each phenotype (bottom). Numbers indicate the amount of fish with normal
Castro et al. Journal of Experimental Medicine 10 of 18
NCKAP1L deficiency https://doi.org/10.1084/jem.20192275
Dow
nloaded from http://rupress.org/jem
/article-pdf/217/12/e20192275/1048329/jem_20192275.pdf by guest on 27 January 2022

and Zon, 2013; Konantz et al., 2019). To investigate the role ofnckap1l in zebrafish embryonic development, we performedin vivo loss-of-function experiments by treating zebrafish em-bryos with two different antisense morpholino oligonucleotides(MOs) to inhibit nckap1l premRNA splicing. We found thattranscripts in morphants were indeed misspliced (Fig. S3 A) andthat nckap1l morphants display reduced nckap1l mRNA expres-sion as assessed by quantitative RT-PCR (Fig. S3 B). To analyzehematopoiesis in developing zebrafish embryos, control andnckap1l MO-injected fish were first examined for whole-mountin situ hybridization (WISH) using probes against differenthematopoietic markers, which revealed a decrease in both cir-culating red blood cells and neutrophils (Fig. S3, C and D; andFig. 3 C). Following tail fin injury, we further observed fewernumbers of neutrophils at the site of injury in nckap1lmorphantsthan in the embryos injected with the control MO (Fig. 3 D).Finally, and importantly, coinjection of capped WT nckap1lmRNA was able to rescue neutropenia in zebrafish nckap1lmorphants (Fig. 3 E).
Although no other human cases with deficiency in NCKAP1Lhave been reported thus far, Park et al. (2008) have studied theconsequences of Nckap1l deficiency (obtained by N-ethyl-N-nitrosourea mutagenesis) in mouse. Indeed, a homozygous pre-mature stop codon cut short the protein at amino acid residue445, with no protein being detectable in vivo. A number of keyanomalies in the Nckap1l−/− mouse are in line with those wedetected in humans and/or zebrafish. These include notablyF-actin polymerization and T cell capping, which are lost, andcomponents of the WAVE complex, which disappear in the ab-sence of Nckap1l, suggesting, again, an essential role in T cellbiology. A detailed comparison of human and mouse phenotypesfurther highlights other interesting findings. Interestingly,unlike typical familial HLH (characteristically linked to bicy-topenia/pancytopenia), Nckap1l−/− mice, similar to our patients,display an inverse phenotype that includes leukocytosis, lym-phocytosis, and monocytosis. In addition, the erythrocyte lin-eage shows similar subtle yet interesting defects, including adecrease in hematocrit and in mean corpuscular volume, alongwith reticulocytosis and anisopoikilocytosis, which collectivelydefine a microcytic hypochromic hemolytic anemia, also re-ported in Rac1- and Rac2-deficient patients and mice (Kalfaet al., 2006). Of note, we observed an unexpectedly low globinexpression in nckap1l knockdown fish (Fig. S3 C).
In line with the phenotype described in mice, NCKAP1L-deficient T cells show a clear impairment in F-actin polymeri-zation consistent with a loss of WAVE complex components.This impact on cytoskeleton dynamics resembles other well-known actinopathies. Hyperinflammatory manifestations, in
part fulfilling clinical HLH criteria, have been observed in anumber of these diseases (Bode et al., 2015; Wegehaupt et al.,2020). HLH in NCKAP1L deficiency could be the consequence ofprolonged immune stimulation due to impaired pathogencontrol resulting from impaired lymphocyte activation. Manyof the well-known actinopathies compromise the normal sig-naling pathway upon activation. Impaired lymphocyte activa-tion in actinopathies reduces the ability to fight viral infections,and HLH observed in these disorders is frequently triggered byviral, particularly EBV, infection. The fact that no viral triggerfor HLHwas detected in our patients does not fully exclude thatalso in NCKAP1L deficiency, HLH is linked to impaired patho-gen control (Bucciol et al., 2020; Shoham et al., 2003). Althoughspeculative, unchecked activation of the inflammasome couldalso underlie HLH in our patients. Actin cytoskeleton dynamicsis crucial in inflammasome regulation (reviewed in Savic et al.,2020). Consistent with what was reported in patients withPSTPIP1, CDC42, WDR-1, and ARPC1B mutations, the high IL-1 and IL-18 levels in our NCKAP1L-deficient patients could be in-terpreted as an autoinflammatory signature linked to in-flammasome activation, rather than the strong IFN-γ–CXCL9signature of primary HLH.
With the near universal use of whole-exome and genomesequencing as an integral part of the diagnostic regimen of pe-diatric/young adult patients showing signs of a dysregulation ofimmunity, the number of genes linked to inborn errors of im-munity (alternatively called primary immunodeficiencies) is inconstant increase, with 430 officially documented as of today(Bousfiha et al., 2020). Here we report a new syndromic entitythat is close, yet distinct, from familial HLH, due to recessivemutations in NCKAP1L. It could be best structured withinso-called actinopathies (Burns et al., 2017; Janssen and Geha,2019; Tangye et al., 2019).
Materials and methodsSubjects and study approvalThe subjects reported in this study were members of two un-related consanguineous families of Iranian and Saudi origins. Inboth families, the parents and other siblings were healthy. Allfamily members in family 1, and all in family 2 with the ex-ception of II.3 and II.4, were whole-exome sequenced. All sub-jects (and their legal guardians) gave written informed consentfor genetic analyses, which was performed under the principlesof the Helsinki Declaration and upon approval by the institu-tional review boards of the participating centers of the TehranUniversity Medical School (Tehran, Iran) and King AbdullahInternational Medical Research Center (Riyadh, Saudi Arabia).
expression/total amount of fish from three biological replicates. (D) Fewer neutrophils are found at the wound site after tail fin wounding. Representativepictures and corresponding quantitation of neutrophils as measured by mpo antibody staining indicate reduced numbers of neutrophils at the wound in nckap1lmorphants (n = 17 for MO1, n = 11 for MO2) compared with control injected embryos. Scale bar, 100 µm. (E) Co-injection of wt mRNA rescues neutropenia innckap1lmorphants. Shown are representative images (left) and graphs displaying the number of lyz+ cells after WISH from control, nckap1lMO, and nckap1lMO+ wt mRNA coinjected transgenic embryos (right). Lateral views are shown, with anterior to the left, dorsal up. Numbers indicate the amount of fish withnormal expression/total amount of fish assessed by the quantified numbers of neutrophils. Summarized data from n = 3 biological replicates with at least n = 4embryos per experiment are shown. An ordinary one-way ANOVA was performed for multiple comparisons. Error bars are shown as ± standard deviation;**, P < 0.01; ****, P < 0.0001.
Castro et al. Journal of Experimental Medicine 11 of 18
NCKAP1L deficiency https://doi.org/10.1084/jem.20192275
Dow
nloaded from http://rupress.org/jem
/article-pdf/217/12/e20192275/1048329/jem_20192275.pdf by guest on 27 January 2022

Exome and targeted sequencingGenomic DNA was isolated from peripheral blood using stan-dard protocols. Exome sequencing libraries were prepared withthe Twist Human Core Exome Kit (Twist Bioscience) followingthe manufacturer’s recommendations. Paired-end (2 × 75 bp)
sequencing was performed on a NextSeq500 sequencer (Illu-mina). Sequences were mapped to the hg19 reference genomeusing Isaac Genome Alignment Software 2.1.0 (Illumina). Foreach sample, median coverage was at least 60-fold, and >93% oftarget sequences were covered at a minimum of 10×. Sequence
Figure 4. Transcriptomic and proteomic analyses. (A) Volcano plots showing up- and down-regulated genes and proteins in patients 1 and 2 using foldchange and P value cutoffs of 1.5 and 0.05, respectively. The labels correspond to genes/proteins of the IFN and T cell exhaustion pathways. Only genes/proteins common to both patients are highlighted. (B) Canonical pathways deregulated in patients at the transcript (white bars) and proteome (black bars)levels. Positive z-scores are highlighted with an asterisk and correspond to predicted activation of the signaling pathway. (C) Gene set enrichment analysisplots showing negative enrichment of actin cytoskeleton regulation andWASPs/WAVEs activation by Rho GTPase pathways. fMLP, N-formyl-methionyl-leucyl-phenylalanine; NES, normalized enrichment score; Cyt., cytotoxic; Th, T helper; FDRq, false discovery rate q-value; KEGG, Kyoto Encyclopedia of Genes andGenomes.
Castro et al. Journal of Experimental Medicine 12 of 18
NCKAP1L deficiency https://doi.org/10.1084/jem.20192275
Dow
nloaded from http://rupress.org/jem
/article-pdf/217/12/e20192275/1048329/jem_20192275.pdf by guest on 27 January 2022

variants were called using the Isaac Variant Caller 2.1.0 (Illu-mina). Annotation was performed with the KGGSeq softwarepackage based on dbSNP build 135 (Li et al., 2012). We focusedonly on protein-altering variants (missense, nonsense, splicesite variants, and coding indels) with alternative allele fre-quencies <0.005 in the 1000 Genomes Project, the GenomeAggregation Database, the Exome Aggregation Consortium, andan internal exome database including ∼700 exomes. To identifypotential causal variants, we further filtered the variants basedon a recessive mode of inheritance. Raw exome data (FASTQfiles) are available at the National Center for Biotechnology In-formation’s Sequence Read Archive under the accession no.PRJNA604669.
Conventional capillary Sanger sequencing was performed tovalidate the genotypes of the identified candidate variants.Mutation-spanning fragments were amplified from genomicDNA using the Expand Long Template PCR System (Roche Di-agnostics) according to the manufacturer’s recommendationsand using the following PCR primers (59-39) for family 1: F1-FCACTCGGAATATATTGAGCACTGTCCAGAG, F1-R CTTTGCATGAGGGACTCTCTACATCATAGC; and family 2: F2-F AGGCATTGGTCATGGTCTTGTG, F2-R ATTCAAACCCTCGCCCTTATCC. Afterpurification with the ExoProStar Kit (GE Healthcare Life Sci-ences), PCR products were bidirectionally sequenced using thesame primers and the Big Dye Terminator Kit v3.1 (ThermoFisher Scientific). All targeted sequencing reactions were run onan ABI PRISM 3730xl (Thermo Fisher Scientific).
Whole transcriptome and proteome analysesEach patient and three age-, sex-, and ethnically matched healthycontrols (for each patient) were used for RNA-seq (n = 8 samplesin total). Total RNA was isolated from PBMCs using the RNeasyMini Kit (Qiagen). RNA integrity was evaluated on an AgilentBioanalyzer 2100 using an Agilent RNA 6000 Pico Kit (AgilentTechnologies). Total RNA-seq libraries were prepared withSMARTer Stranded Total RNA-Seq Kit v2 - Pico Input Mam-malian (TaKaRa) according to the manufacturer’s protocol.Briefly, random primers were used for first strand synthesis,and ribosomal cDNA was cleaved by ZapR v2 in the presence ofmammalian R-probes V2. Libraries were pooled and sequenced(paired-end 2 × 75 bp) on a NextSeq500 using the NextSeq 500/550 High Output Kit v2 according to the manufacturer’s in-structions (Illumina). Raw RNA-seq data have been depositedin the EMBL-EBI ArrayExpress archive (accession no. E-MTAB-8524).
For each sample, quality control was performed and assessedwith the NGS Core Tools FastQC. Sequence reads were mappedusing STAR (Dobin et al., 2013). Unmapped reads were re-mapped with Bowtie2 (Langmead and Salzberg, 2012), using avery sensitive local option to optimize the alignment. The totalmapped reads were finally available in Binary Alignment Mapformat for raw read count extraction. Read counts were deter-mined by the HTseq-count tool of the Python package HTSeq(Anders et al., 2015) with default parameters to generate an a-bundance matrix. Finally, differential analyses were performedusing the limma (Ritchie et al., 2015) package of the Bioconductorframework for RNA-seq data. Up- and down-regulated genes
(patients vs. controls) were selected based on the adjusted Pvalue (<0.05) and the fold change (>1.5).
For proteomic analysis, total proteins were extracted fromPBMCs pellets in Laemmli buffer (10 mM Tris, pH 6.8, 1 mMEDTA, 5% β-mercaptoethanol, 5% SDS, 10% glycerol, and 1/100anti-proteases). Protein concentrations were determined usingthe RC-DC protein assay (Bio-Rad Laboratories) according to themanufacturer’s instructions, and 20 µg of each protein extractwas heated at 95°C for 5min and stacked in an in-house–prepared5% acrylamide SDS-PAGE stacking gel. Gel bands were cut,destained, reduced with 10 mM dithiothreitol, and alkylatedusing 55 mM iodoacetamide before overnight digestion at 37°Cusing modified porcine trypsin (Promega). Extracted trypticpeptides were analyzed by nano–liquid chromatography/tan-dem mass spectrometry (nano–LC-MS/MS) on a nano–ultra-performance liquid chromatography system (nanoAcquityUPLC,Waters Corporation) coupled to a quadrupole-Orbitrap massspectrometer (Q-Exactive Plus, Thermo Fisher Scientific).Chromatographic separation was conducted over a 105-minlinear gradient from 1 to 35% of solvent B (0.1% formic acidin acetonitrile) at a flow rate of 450 nl/min. A top 10 methodwas used with automatic switching between MS and MS/MSmodes to acquire high-resolution MS/MS spectra. Sampleswere injected using a randomized injection sequence, and asolvent blank injection was performed after each sample tominimize carry-over.
Nano–LC-MS/MS data were interpreted to perform label-free extracted ion chromatogram-based differential analysisusing MaxQuant (version 1.6.0.16; Tyanova et al., 2016). Peakswere assigned with the Andromeda search engine against adatabase containing all human entries extracted fromUniProtKB-SwissProt and common contaminants (15–07-2019; 20,409 se-quences, Taxonomy ID 9606). No “match between runs” wasperformed between the samples. The maximum false discoveryrate was 1% at both peptide and protein levels with the use of adecoy strategy. Nonnormalized protein intensity values wereexported and used for further statistical analysis. The completeproteomics dataset has been deposited into the Proteo-meXchange Consortium via the PRIDE partner repository withthe dataset identifier PXD016191 (Deutsch et al., 2017).
The raw protein intensity data for each sample were firstprocessed using the DEP (Zhang et al., 2018) bioconductorpackage to assess the quality of the data. Only proteins that wereobserved in at least two out of the three replicates were con-sidered. Next, the data were background-corrected and nor-malized by variance stabilizing transformation svn (Huber et al.,2002). Missing protein quantification values were imputed bya left-censored imputation based on random draws from aGaussian distribution centered around a minimal value. Fi-nally, differential analyses were performed using the limmabioconductor package (Smyth, 2004). Up- and down-regulatedproteins (patients vs. controls) were selected based on the ad-justed P value (<0.05) and the fold change (>1.5).
Pathway analysis of differentially expressed genes at theRNA and protein levels was completed using the IngenuityPathway Analysis tool (Ingenuity Systems, Qiagen). The Inge-nuity knowledge base (genes only) with direct and indirect
Castro et al. Journal of Experimental Medicine 13 of 18
NCKAP1L deficiency https://doi.org/10.1084/jem.20192275
Dow
nloaded from http://rupress.org/jem
/article-pdf/217/12/e20192275/1048329/jem_20192275.pdf by guest on 27 January 2022

relationships was used, and only molecules and/or relationshipsthat had been experimentally observed in rat, mouse, or humanwere considered. The volcano plots were generated with R usingthe ggplot2 library. GSEA was performed with the GSEA soft-ware from the Broad Institute (http://software.broadinstitute.org/gsea/index.jsp; Mootha et al., 2003; Subramanian et al.,2005). The gene sets from the human KEGG and reactome da-tabases were used to compute the enrichment of differentiallyexpressed proteins. The normalized enrichment score, nominalP value, and false discovery rate q-value were assessed using thegene_set mode with 1,000 permutations.
Exon skipping experimentsRNA was extracted from PBMCs using the RNeasy Mini Kit(Qiagen) and reverse transcription using iScript reverse Tran-scription Supermix for RT-PCR (Bio-Rad Laboratories), accord-ing to the manufacturer’s instructions. For exon skipping analyses,cDNA from family 2 and an unrelated control were PCR-amplifiedusing a forward primer hybridizing to exon 24 (59-AGCTGGTGGTGGAAAACATG-39) and reverse primer hybridizing to exon 27(59-GCCAGCTCAAAGATACTCAAGG-39). Amplicons were visual-ized on a 1.2% agarose gel using phiX174 DNA/BsuRI (HaeIII) DNAMarker 9 (Thermo Fisher Scientific).
Western blottingWestern blot analysis was performed on 106 PBMCs. Frozen cellpellets were thawed on ice before the addition of ice-cold lysisbuffer (50 mM Tris-HCl, pH 8, 150 mM NaCl, 1% NP-40, 0.1%SDS, 0.1% Na deoxycholate, 1 mM dithiothreitol, 1 mM EDTA,and protease inhibitor cocktail; Roche). Cells were lysed for 1 h at4°C while vortexing, and 15 µl of each sample (25 µg) was mixedwith an equal volume of 2× loading buffer. Samples were heatedfor 5 min to 95°C and then centrifuged for 5 min at 16,000 gbefore loading 30 µl on a 4–20% gradient polyacrylamide gel.Electrophoresis was conducted at 200 V for 75 min beforetransfer to a polyvinylidene fluoride membrane using a Trans-Blot Turbo Transfer system (Bio-Rad Laboratories) according tothe manufacturer’s instructions. Membranes were blocked inTris-buffered saline, Tween 20 (0.05%), and nonfat milk (5%)for 1 h before incubation with anti-NCKAP1L polyclonal anti-body (rabbit IgG; PA5-58813; Thermo Fisher Scientific; used at1:500 dilution) and a WAVE2 (used at 1:500 dilution; WAVE-2[D2C8] XP Rabbit mAb 3659; Cell Signaling Technologies)overnight at 4°C. Anti-GAPDH (used at 1:2,500 dilution; Milli-pore) was applied/incubated for 2 h at room temperature.Secondary antibodies (goat anti-rabbit and goat anti-mouse IgG[H+L]-HRP conjugates, Bio-Rad Laboratories) were used for 1 hat room temperature at 1:3,000 and 1:5,000 dilutions, respec-tively. Signals were revealed using the Clarity Western ECL,and detection was performed using the ChemiDoc XRS+ system(Bio-Rad Laboratories).
Structural modelingTo build a workable structural model of NCKAP1L, we used thecrystal structures of NCKAP1 from the Protein Data Bank (PDB;Berman et al., 2000) as templates. The PDB IDs were 4n78 (Chenet al., 2014) and 3p8c (Chen et al., 2010). Both PDB structures
were solved within the context of theWAVE regulatory complexof Homo sapiens, while the NCKAP1 protein chain (chain B) onlyshared a root mean square deviation of 0.264 A. Therefore, ei-ther structure could be used as a modeling template. We indeedused 4n78. The NCKAP1L protein shares a sequence identity of59.44% with NCKAP1. In structure modeling, two proteins areexpected to share the same structure fold when the sequenceidentity is >30%. Thus, the structure modeling of NCKAP1should be reliable. We used SWISS-MODEL (Waterhouse et al.,2018) to build the WT NCKAP1L structure and the NCKAP1Lstructure without the exon26-encoded region, based on the 4n78template, and the resulting model was superimposed to itstemplate in the context of the WAVE complex. Mutagenesisanalysis was performed using the PYMOL program (version 2. 0Schrodinger, LLC).
Immune phenotyping and functional assaysFlow cytometry analysis and cytokine measurementsFlow cytometry analysis was performed on whole blood ac-cording to previously published methods (Rosenzwajg et al.,2019). Blood subset (CD3+, CD4+, CD8+ T lymphocytes, CD19+ Blymphocytes, and CD3−CD56+ NK cells) counts (cells/microliter)were established using CYTO-STAT tetraCHROME kits withFlowCount fluorescent beads and tetra CXP software with acytomics FC500 flow cytometer according to the manufacturer’sinstructions (all from Beckman Coulter). Deep immunophenotyp-ing of immune cell populations, using a 10-color flow cytometrypanel, was performed according to standardized methods pre-viously published using Duraclone tubes (Beckman Coulter;Pitoiset et al., 2018a, b). Cell acquisition and analysis were per-formed using a Gallios cytometer, and data were analyzed withKaluza software (Beckman Coulter; Pitoiset et al., 2018a, b).Eight age-matched controls were used for each patient.
Early T cell activation markers2 × 105 PBMCs were incubated for 16–20 h with PHA (2.5 µg/ml,Remel) or anti-CD3/CD28 beads (two beads per cell; Invitrogen,Thermo Fisher Scientific) in 96-well flat-bottom plates. CD25and CD69 expression was determined on CD4+ T cells by flowcytometry.
NK and CTL degranulationNK degranulation assays were performed as described inBryceson et al. (2012). Briefly, PBMCs were isolated and incu-bated in a 96-well V-bottom plate in medium at 37°C overnight.The next day, cells were either stimulated with K562 cells orincubated in medium alone in the presence of anti-CD107a-PEantibody at 37°C for 2 h. Then cells were harvested, stained withantibodies against CD3, CD56, and CD107a, and acquired on aNavios (Beckman Coulter) flow cytometer. For analysis, CD3−CD56+
NK cells were gated and assessed for surface expression ofCD107a. The term ΔCD107a is the difference between the per-centage of NK cells expressing surface CD107a after K562stimulation and incubation with medium alone. CTL degranu-lation assays were performed with T cell blast lines or PBMCsactivated for 48 h with PHA (1.25 µg/ml) and IL-2 (100 U/ml).Activated PBMCs were either stimulated with beads (three
Castro et al. Journal of Experimental Medicine 14 of 18
NCKAP1L deficiency https://doi.org/10.1084/jem.20192275
Dow
nloaded from http://rupress.org/jem
/article-pdf/217/12/e20192275/1048329/jem_20192275.pdf by guest on 27 January 2022
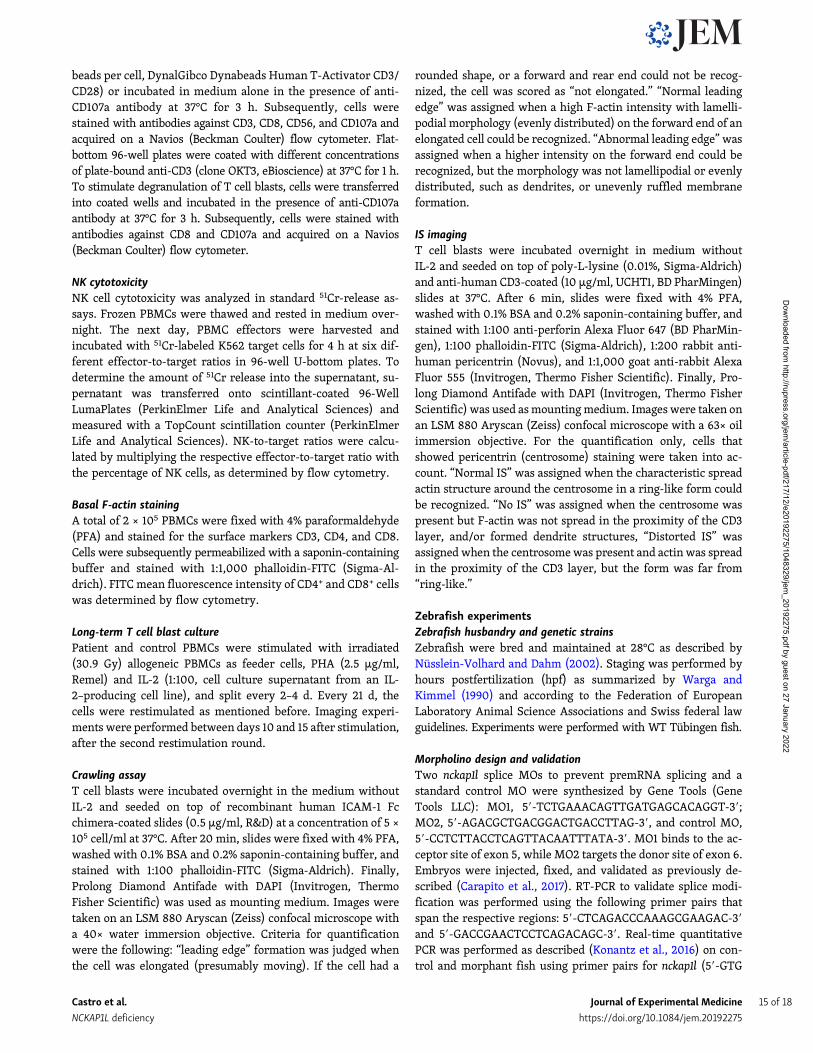
beads per cell, DynalGibco Dynabeads Human T-Activator CD3/CD28) or incubated in medium alone in the presence of anti-CD107a antibody at 37°C for 3 h. Subsequently, cells werestained with antibodies against CD3, CD8, CD56, and CD107a andacquired on a Navios (Beckman Coulter) flow cytometer. Flat-bottom 96-well plates were coated with different concentrationsof plate-bound anti-CD3 (clone OKT3, eBioscience) at 37°C for 1 h.To stimulate degranulation of T cell blasts, cells were transferredinto coated wells and incubated in the presence of anti-CD107aantibody at 37°C for 3 h. Subsequently, cells were stained withantibodies against CD8 and CD107a and acquired on a Navios(Beckman Coulter) flow cytometer.
NK cytotoxicityNK cell cytotoxicity was analyzed in standard 51Cr-release as-says. Frozen PBMCs were thawed and rested in medium over-night. The next day, PBMC effectors were harvested andincubated with 51Cr-labeled K562 target cells for 4 h at six dif-ferent effector-to-target ratios in 96-well U-bottom plates. Todetermine the amount of 51Cr release into the supernatant, su-pernatant was transferred onto scintillant-coated 96-WellLumaPlates (PerkinElmer Life and Analytical Sciences) andmeasured with a TopCount scintillation counter (PerkinElmerLife and Analytical Sciences). NK-to-target ratios were calcu-lated by multiplying the respective effector-to-target ratio withthe percentage of NK cells, as determined by flow cytometry.
Basal F-actin stainingA total of 2 × 10⁵ PBMCs were fixed with 4% paraformaldehyde(PFA) and stained for the surface markers CD3, CD4, and CD8.Cells were subsequently permeabilized with a saponin-containingbuffer and stained with 1:1,000 phalloidin-FITC (Sigma-Al-drich). FITCmean fluorescence intensity of CD4+ and CD8+ cellswas determined by flow cytometry.
Long-term T cell blast culturePatient and control PBMCs were stimulated with irradiated(30.9 Gy) allogeneic PBMCs as feeder cells, PHA (2.5 µg/ml,Remel) and IL-2 (1:100, cell culture supernatant from an IL-2–producing cell line), and split every 2–4 d. Every 21 d, thecells were restimulated as mentioned before. Imaging experi-ments were performed between days 10 and 15 after stimulation,after the second restimulation round.
Crawling assayT cell blasts were incubated overnight in the medium withoutIL-2 and seeded on top of recombinant human ICAM-1 Fcchimera-coated slides (0.5 µg/ml, R&D) at a concentration of 5 ×10⁵ cell/ml at 37°C. After 20 min, slides were fixed with 4% PFA,washed with 0.1% BSA and 0.2% saponin-containing buffer, andstained with 1:100 phalloidin-FITC (Sigma-Aldrich). Finally,Prolong Diamond Antifade with DAPI (Invitrogen, ThermoFisher Scientific) was used as mounting medium. Images weretaken on an LSM 880 Aryscan (Zeiss) confocal microscope witha 40× water immersion objective. Criteria for quantificationwere the following: “leading edge” formation was judged whenthe cell was elongated (presumably moving). If the cell had a
rounded shape, or a forward and rear end could not be recog-nized, the cell was scored as “not elongated.” “Normal leadingedge” was assigned when a high F-actin intensity with lamelli-podial morphology (evenly distributed) on the forward end of anelongated cell could be recognized. “Abnormal leading edge”wasassigned when a higher intensity on the forward end could berecognized, but the morphology was not lamellipodial or evenlydistributed, such as dendrites, or unevenly ruffled membraneformation.
IS imagingT cell blasts were incubated overnight in medium withoutIL-2 and seeded on top of poly-L-lysine (0.01%, Sigma-Aldrich)and anti-human CD3-coated (10 µg/ml, UCHT1, BD PharMingen)slides at 37°C. After 6 min, slides were fixed with 4% PFA,washed with 0.1% BSA and 0.2% saponin-containing buffer, andstained with 1:100 anti-perforin Alexa Fluor 647 (BD PharMin-gen), 1:100 phalloidin-FITC (Sigma-Aldrich), 1:200 rabbit anti-human pericentrin (Novus), and 1:1,000 goat anti-rabbit AlexaFluor 555 (Invitrogen, Thermo Fisher Scientific). Finally, Pro-long Diamond Antifade with DAPI (Invitrogen, Thermo FisherScientific) was used asmountingmedium. Images were taken onan LSM 880 Aryscan (Zeiss) confocal microscope with a 63× oilimmersion objective. For the quantification only, cells thatshowed pericentrin (centrosome) staining were taken into ac-count. “Normal IS” was assigned when the characteristic spreadactin structure around the centrosome in a ring-like form couldbe recognized. “No IS” was assigned when the centrosome waspresent but F-actin was not spread in the proximity of the CD3layer, and/or formed dendrite structures, “Distorted IS” wasassigned when the centrosomewas present and actin was spreadin the proximity of the CD3 layer, but the form was far from“ring-like.”
Zebrafish experimentsZebrafish husbandry and genetic strainsZebrafish were bred and maintained at 28°C as described byNüsslein-Volhard and Dahm (2002). Staging was performed byhours postfertilization (hpf) as summarized by Warga andKimmel (1990) and according to the Federation of EuropeanLaboratory Animal Science Associations and Swiss federal lawguidelines. Experiments were performed with WT Tübingen fish.
Morpholino design and validationTwo nckap1l splice MOs to prevent premRNA splicing and astandard control MO were synthesized by Gene Tools (GeneTools LLC): MO1, 59-TCTGAAACAGTTGATGAGCACAGGT-39;MO2, 59-AGACGCTGACGGACTGACCTTAG-39, and control MO,59-CCTCTTACCTCAGTTACAATTTATA-39. MO1 binds to the ac-ceptor site of exon 5, while MO2 targets the donor site of exon 6.Embryos were injected, fixed, and validated as previously de-scribed (Carapito et al., 2017). RT-PCR to validate splice modi-fication was performed using the following primer pairs thatspan the respective regions: 59-CTCAGACCCAAAGCGAAGAC-39and 59-GACCGAACTCCTCAGACAGC-39. Real-time quantitativePCR was performed as described (Konantz et al., 2016) on con-trol and morphant fish using primer pairs for nckap1l (59-GTG
Castro et al. Journal of Experimental Medicine 15 of 18
NCKAP1L deficiency https://doi.org/10.1084/jem.20192275
Dow
nloaded from http://rupress.org/jem
/article-pdf/217/12/e20192275/1048329/jem_20192275.pdf by guest on 27 January 2022
ACGGAGGCTGTTCTCTC-39 and 59-TCTGAGAGTTTGCGTTGGTG-39) and gapdh. For rescue experiments, zebrafishWT nckap1lcDNA cloned into the pCS2– expression vector (RZPD) was used.Capped mRNA was then synthesized using the AmpliCap SP6High Yield Message Maker Kit (Cellscript). 100 pg of cappedmRNA was injected into the yolk of single-cell-stage embryostogether with the nckap1l MO to rescue the MO phenotype.
WISH and tail fin woundingWISH was performed as described before (Carapito et al., 2017;Konantz et al., 2016). For wound experiments, tail fins were cutat the end of the spinal cord using a sterile scalpel blade, and theembryos were then allowed to recover at 29°C in embryo me-dium for 6–8 h. Embryos were then fixed overnight in 4% PFA/PBS. Immunostaining was performed to detect neutrophils atthe wound site according to standard protocols using a rabbitpolyclonal antibody against mpo (GTX128379; GeneTex Inter-national Corporation). Stained embryos were then mounted in0.8% low melting agarose. Images were obtained using a LeicaSP5-II-Matrix confocal microscope (Leica Microsystems AG).mpo- and lyz-positive cells from bothWISH and immunostainingwere semiautomatically counted using Fiji software (Schindelinet al., 2012). According to these numbers, percentages of fishwith normal vs. decreased expression were defined. Normalnumbers of neutrophils were defined as the mean number ofcells in control MO–injected embryos.
Online supplemental materialFig. S1 shows additional immunophenotyping in patients andcontrols. Fig. S2 shows signaling pathways upon transcriptomeand proteome analyses. Fig. S3 shows additional phenotypes inzebrafish knockdown. Table S1 reports other candidate variantsupon exome sequencing in family 1.
AcknowledgmentsWe thank Drs. Marco Colonna (Washington University School ofMedicine, St. Louis, MO), Taco W. Kuijpers (Amsterdam UMC,University of Amsterdam, Amsterdam, Netherlands), and Phil-ippe Georgel (Strasbourg University, Strasbourg, France) forcritical reading of the manuscript; Ismail Aouadi for tran-scriptomics/proteomics pathway analyses; Alice Bernard, LydieNaegely, Antoine Hanauer, Ouria Tahar, Perrine Spinnhirny,Solène Zuttion, Michèle Barbie, Cornelia Degbe, Natalie Fery,Alexandra Roux, and Marcelle Baer for technical help; andGuislaine Carcelain and coworkers (Robert Debre Hospital,Paris, France) for control samples. We thank the Center forChronic Immunodeficiency’s Biobank (coordination, AlexandraNieters) and Advanced Diagnostic Unit (coordination, IlkaFuchs) for excellent services.
Z. Miao is supported by the Wellcome Trust Single Cell GeneExpression Atlas grant 108437/Z/15/Z. This work was supportedby Agence Nationale de la Recherche grants ANR-11-LABX-0070_TRANSPLANTEX to S. Bahram and ANR-11-IDEX-0004-02, Laboratory of Excellence Transimmunom, toM. Rosenzwajg;Institut National de la Sante et de la Recherche Medicale UMR_S110 9, the Institut Universitaire de France, and MSD-Avenir
grant AUTOGEN, all to S. Bahram; the University of Stras-bourg (including Initiative d’Excellence IDEX UNISTRA) to S.Bahram, R. Carapito, and S. Friant; Centre National de la Re-cherche Scientifique to S. Friant, the European Regional De-velopment Fund (European Union) INTERREG V programs,TRIDIAG and PERSONALIS, to R. Carapito and S. Bahram; SwissNational Science Foundation grant 179239 to C. Lengerke; andGerman Research Foundation grant SFB1160 (TPA01) to S. Ehl.Proteomics experiments were supported by the French Pro-teomic Infrastructure (ProFI; ANR-10-INBS-08-03) through C.Carapito.
Author contributions: C.N. Castro, M. Rosenzwajg, R. Car-apito, M. Shahrooei, M. Konantz, M. Groß, T. Tranchant, M.Radosavljevic, F. Pitoiset, A. Hirschler, B. Nespola, A. Molitor,V. Rolli, A. Pichot, L.E. Faletti, B. Rinaldi, S. Friant, M.Mednikov,H. Karauzum, M.J. Aman, C. Carapito, and C. Lengerke carriedout experiments. Z. Miao performed structural modeling. N.Paul, R. Carapito, A. Molitor, C. Carapito, and T. Stemmelenperformed computational analysis of the data. M. Shahrooei, A.Khan, V. Ziaee, W. Eyaid, F. Alroqi, and N. Parvaneh recruitedthe patients and carried out clinical phenotyping. C.N. Castro, M.Rosenzwajg, R. Carapito, S. Ehl, F. Alroqi, N. Parvaneh, andS. Bahram analyzed and interpreted the data. N. Parvaneh, M.Shahrooei, and S. Bahram conceived and initiated the project.S. Bahram wrote the manuscript, with input from all otherauthors.
Disclosures: The authors declare no competing interests exist.
Submitted: 3 December 2019Revised: 22 June 2020Accepted: 21 July 2020
ReferencesAdzhubei, I.A., S. Schmidt, L. Peshkin, V.E. Ramensky, A. Gerasimova, P.
Bork, A.S. Kondrashov, and S.R. Sunyaev. 2010. A method and serverfor predicting damaging missense mutations. Nat. Methods. 7:248–249.https://doi.org/10.1038/nmeth0410-248
Al-Samkari, H., and N. Berliner. 2018. Hemophagocytic Lymphohistiocytosis.Annu. Rev. Pathol. 13:27–49. https://doi.org/10.1146/annurev-pathol-020117-043625
Ammann, S., K. Lehmberg, U. Zur Stadt, G. Janka, A. Rensing-Ehl, C. Kle-mann, M. Heeg, S. Bode, I. Fuchs, and S. Ehl; HLH study of the GPOH.2017. Primary and secondary hemophagocytic lymphohistiocytosishave different patterns of T-cell activation, differentiation andrepertoire. Eur. J. Immunol. 47:364–373. https://doi.org/10.1002/eji.201646686
Anders, S., P.T. Pyl, and W. Huber. 2015. HTSeq--a Python framework towork with high-throughput sequencing data. Bioinformatics. 31:166–169.https://doi.org/10.1093/bioinformatics/btu638
Bergsten, E., A. Horne, M. Aricó, I. Astigarraga, R.M. Egeler, A.H. Filipovich,E. Ishii, G. Janka, S. Ladisch, K. Lehmberg, et al. 2017. Confirmed effi-cacy of etoposide and dexamethasone in HLH treatment: long-termresults of the cooperative HLH-2004 study. Blood. 130:2728–2738.https://doi.org/10.1182/blood-2017-06-788349
Berman, H.M., J. Westbrook, Z. Feng, G. Gilliland, T.N. Bhat, H. Weissig, I.N.Shindyalov, and P.E. Bourne. 2000. The Protein Data Bank.Nucleic AcidsRes. 28:235–242. https://doi.org/10.1093/nar/28.1.235
Bode, S.F., S. Ammann, W. Al-Herz, M. Bataneant, C.C. Dvorak, S. Gehring, A.Gennery, K.C. Gilmour, L.I. Gonzalez-Granado, U. Groß-Wieltsch, et al;Inborn Errors Working Party of the EBMT. 2015. The syndrome ofhemophagocytic lymphohistiocytosis in primary immunodeficiencies:
Castro et al. Journal of Experimental Medicine 16 of 18
NCKAP1L deficiency https://doi.org/10.1084/jem.20192275
Dow
nloaded from http://rupress.org/jem
/article-pdf/217/12/e20192275/1048329/jem_20192275.pdf by guest on 27 January 2022

implications for differential diagnosis and pathogenesis. Haematologica.100:978–988. https://doi.org/10.3324/haematol.2014.121608
Bousfiha, A., L. Jeddane, C. Picard, W. Al-Herz, F. Ailal, T. Chatila, C. Cun-ningham-Rundles, A. Etzioni, J.L. Franco, S.M. Holland, et al. 2020.Human Inborn Errors of Immunity: 2019 Update of the IUIS Pheno-typical Classification. J. Clin. Immunol. 40:66–81. https://doi.org/10.1007/s10875-020-00758-x
Bryceson, Y.T., D. Pende, A. Maul-Pavicic, K.C. Gilmour, H. Ufheil, T. Vraetz,S.C. Chiang, S. Marcenaro, R. Meazza, I. Bondzio, et al. 2012. A pro-spective evaluation of degranulation assays in the rapid diagnosis offamilial hemophagocytic syndromes. Blood. 119:2754–2763. https://doi.org/10.1182/blood-2011-08-374199
Bucciol, G., B. Pillay, J. Casas-Martin, S. Delafontaine, M. Proesmans, N.Lorent, J. Coolen, T. Tousseyn, X. Bossuyt, C.S. Ma, et al. 2020. SystemicInflammation and Myelofibrosis in a Patient with Takenouchi-KosakiSyndrome due to CDC42 Tyr64Cys Mutation. J. Clin. Immunol. 40:567–570. https://doi.org/10.1007/s10875-020-00742-5
Burns, S.O., A. Zarafov, and A.J. Thrasher. 2017. Primary immunodeficienciesdue to abnormalities of the actin cytoskeleton. Curr. Opin. Hematol. 24:16–22. https://doi.org/10.1097/MOH.0000000000000296
Canna, S.W., A.A. de Jesus, S. Gouni, S.R. Brooks, B. Marrero, Y. Liu, M.A.DiMattia, K.J. Zaal, G.A. Sanchez, H. Kim, et al. 2014. An activatingNLRC4 inflammasome mutation causes autoinflammation with recur-rent macrophage activation syndrome.Nat. Genet. 46:1140–1146. https://doi.org/10.1038/ng.3089
Carapito, R., M. Konantz, C. Paillard, Z. Miao, A. Pichot, M.S. Leduc, Y. Yang,K.L. Bergstrom, D.H. Mahoney, D.L. Shardy, et al. 2017. Mutations insignal recognition particle SRP54 cause syndromic neutropenia withShwachman-Diamond-like features. J. Clin. Invest. 127:4090–4103. https://doi.org/10.1172/JCI92876
Chen, Z., D. Borek, S.B. Padrick, T.S. Gomez, Z. Metlagel, A.M. Ismail, J.Umetani, D.D. Billadeau, Z. Otwinowski, and M.K. Rosen. 2010. Struc-ture and control of the actin regulatory WAVE complex. Nature. 468:533–538. https://doi.org/10.1038/nature09623
Chen, B., K. Brinkmann, Z. Chen, C.W. Pak, Y. Liao, S. Shi, L. Henry, N.V.Grishin, S. Bogdan, and M.K. Rosen. 2014. The WAVE regulatorycomplex links diverse receptors to the actin cytoskeleton. Cell. 156:195–207. https://doi.org/10.1016/j.cell.2013.11.048
DeMeester, J., R. Calvez, S. Valitutti, and L. Dupre. 2010. TheWiskott-Aldrichsyndrome protein regulates CTL cytotoxicity and is required for effi-cient killing of B cell lymphoma targets. J. Leukoc. Biol. 88:1031–1040.https://doi.org/10.1189/jlb.0410197
Delmonte, O.M., R. Castagnoli, E. Calzoni, and L.D. Notarangelo. 2019. InbornErrors of Immunity With Immune Dysregulation: From Bench to Bed-side. Front Pediatr. 7:353. https://doi.org/10.3389/fped.2019.00353
Deutsch, E.W., A. Csordas, Z. Sun, A. Jarnuczak, Y. Perez-Riverol, T. Ternent,D.S. Campbell, M. Bernal-Llinares, S. Okuda, S. Kawano, et al. 2017. TheProteomeXchange consortium in 2017: supporting the cultural changein proteomics public data deposition. Nucleic Acids Res. 45(D1):D1100–D1106. https://doi.org/10.1093/nar/gkw936
Dobbs, K., C. Domınguez Conde, S.Y. Zhang, S. Parolini, M. Audry, J. Chou, E.Haapaniemi, S. Keles, I. Bilic, S. Okada, et al. 2015. Inherited DOCK2Deficiency in Patients with Early-Onset Invasive Infections. N. Engl.J. Med. 372:2409–2422. https://doi.org/10.1056/NEJMoa1413462
Dobin, A., C.A. Davis, F. Schlesinger, J. Drenkow, C. Zaleski, S. Jha, P. Batut,M. Chaisson, and T.R. Gingeras. 2013. STAR: ultrafast universal RNA-seq aligner. Bioinformatics. 29:15–21. https://doi.org/10.1093/bioinformatics/bts635
Gayden, T., F.E. Sepulveda, D.A. Khuong-Quang, J. Pratt, E.T. Valera, A.Garrigue, S. Kelso, F. Sicheri, L.G. Mikael, N. Hamel, et al. 2018.Germline HAVCR2 mutations altering TIM-3 characterize subcutane-ous panniculitis-like T cell lymphomas with hemophagocytic lym-phohistiocytic syndrome. Nat. Genet. 50:1650–1657. https://doi.org/10.1038/s41588-018-0251-4
G.A. Gregory, and D.B. Andropoulos, editors. 2012. Gregory’s Pediatric An-esthesia. Fifth edition. Blackwell Publishing Ltd., Hoboken, NJ. https://doi.org/10.1002/9781444345186
Henter, J.I., A. Horne, M. Aricó, R.M. Egeler, A.H. Filipovich, S. Imashuku, S.Ladisch, K. McClain, D. Webb, J. Winiarski, et al. 2007. HLH-2004: Diag-nostic and therapeutic guidelines for hemophagocytic lymphohistiocyto-sis. Pediatr. Blood Cancer. 48:124–131. https://doi.org/10.1002/pbc.21039
Huber, W., A. von Heydebreck, H. Sültmann, A. Poustka, and M. Vingron.2002. Variance stabilization applied to microarray data calibration andto the quantification of differential expression. Bioinformatics. 18(Suppl1):S96–S104. https://doi.org/10.1093/bioinformatics/18.suppl_1.S96
Jagannathan-Bogdan, M., and L.I. Zon. 2013. Hematopoiesis. Development.140:2463–2467. https://doi.org/10.1242/dev.083147
Janka, G.E.. 2012. Familial and acquired hemophagocytic lymphohistiocytosis.Annu. Rev. Med. 63:233–246. https://doi.org/10.1146/annurev-med-041610-134208
Janssen, E., and R.S. Geha. 2019. Primary immunodeficiencies caused bymutations in actin regulatory proteins. Immunol. Rev. 287:121–134.https://doi.org/10.1111/imr.12716
Janssen, E., M. Tohme, M. Hedayat, M. Leick, S. Kumari, N. Ramesh, M.J.Massaad, S. Ullas, V. Azcutia, C.C. Goodnow, et al. 2016. A DOCK8-WIP-WASp complex links T cell receptors to the actin cytoskeleton. J. Clin.Invest. 126:3837–3851. https://doi.org/10.1172/JCI85774
Kalfa, T.A., S. Pushkaran, N. Mohandas, J.H. Hartwig, V.M. Fowler, J.F.Johnson, C.H. Joiner, D.A. Williams, and Y. Zheng. 2006. Rac GTPasesregulate the morphology and deformability of the erythrocyte cyto-skeleton. Blood. 108:3637–3645. https://doi.org/10.1182/blood-2006-03-005942
Kearney, C.J., S.J. Vervoort, K.M. Ramsbottom, A.J. Freeman, J. Michie, J.Peake, J.L. Casanova, C. Picard, S.G. Tangye, C.S. Ma, et al. 2017. DOCK8Drives Src-Dependent NK Cell Effector Function. J. Immunol. 199:2118–2127. https://doi.org/10.4049/jimmunol.1700751
Kogl, T., J. Müller, B. Jessen, A. Schmitt-Graeff, G. Janka, S. Ehl, U. zur Stadt,and P. Aichele. 2013. Hemophagocytic lymphohistiocytosis in syntaxin-11-deficient mice: T-cell exhaustion limits fatal disease. Blood. 121:604–613. https://doi.org/10.1182/blood-2012-07-441139
Konantz, M., E. Alghisi, J.S. Müller, A. Lenard, V. Esain, K.J. Carroll, L. Kanz,T.E. North, and C. Lengerke. 2016. Evi1 regulates Notch activationto induce zebrafish hematopoietic stem cell emergence. EMBO J. 35:2315–2331. https://doi.org/10.15252/embj.201593454
Konantz, M., C. Schürch, P. Hanns, J.S. Müller, L. Sauteur, and C. Lengerke.2019. Modeling hematopoietic disorders in zebrafish. Dis. Model. Mech.12. dmm040360. https://doi.org/10.1242/dmm.040360
Lam,M.T., S. Coppola, O.H.F. Krumbach, G. Prencipe, A. Insalaco, C. Cifaldi, I.Brigida, E. Zara, S. Scala, S. Di Cesare, et al. 2019. A novel disorderinvolving dyshematopoiesis, inflammation, and HLH due to aberrantCDC42 function. J. Exp. Med. 216:2778–2799. https://doi.org/10.1084/jem.20190147
Langmead, B., and S.L. Salzberg. 2012. Fast gapped-read alignment withBowtie 2. Nat. Methods. 9:357–359. https://doi.org/10.1038/nmeth.1923
Li, M.X., H.S. Gui, J.S. Kwan, S.Y. Bao, and P.C. Sham. 2012. A comprehensiveframework for prioritizing variants in exome sequencing studies ofMendelian diseases. Nucleic Acids Res. 40. e53. https://doi.org/10.1093/nar/gkr1257
Mace, E.M., and J.S. Orange. 2014. Lytic immune synapse function requiresfilamentous actin deconstruction by Coronin 1A. Proc. Natl. Acad. Sci.USA. 111:6708–6713. https://doi.org/10.1073/pnas.1314975111
McKenna, A., M. Hanna, E. Banks, A. Sivachenko, K. Cibulskis, A. Kernytsky,K. Garimella, D. Altshuler, S. Gabriel, M. Daly, et al. 2010. The GenomeAnalysis Toolkit: a MapReduce framework for analyzing next-generationDNA sequencing data. Genome Res. 20:1297–1303. https://doi.org/10.1101/gr.107524.110
Mootha, V.K., C.M. Lindgren, K.F. Eriksson, A. Subramanian, S. Sihag, J.Lehar, P. Puigserver, E. Carlsson,M. Ridderstrale, E. Laurila, et al. 2003.PGC-1alpha-responsive genes involved in oxidative phosphorylation arecoordinately downregulated in human diabetes. Nat. Genet. 34:267–273.https://doi.org/10.1038/ng1180
Moulding, D.A., J. Record, D. Malinova, and A.J. Thrasher. 2013. Actin cyto-skeletal defects in immunodeficiency. Immunol. Rev. 256:282–299.https://doi.org/10.1111/imr.12114
Nüsslein-Volhard, C., and R. Dahm. 2002. Zebrafish: A Practical Approach.Oxford University Press, Oxford, UK.
Park, H., K. Staehling-Hampton, M.W. Appleby, M.E. Brunkow, T. Habib, Y.Zhang, F. Ramsdell, H.D. Liggitt, B. Freie, M. Tsang, et al. 2008. A pointmutation in the murine Hem1 gene reveals an essential role for He-matopoietic protein 1 in lymphopoiesis and innate immunity. J. Exp.Med. 205:2899–2913. https://doi.org/10.1084/jem.20080340
Picard, C., H. Bobby Gaspar, W. Al-Herz, A. Bousfiha, J.L. Casanova, T. Chatila,Y.J. Crow, C. Cunningham-Rundles, A. Etzioni, J.L. Franco, et al. 2018.International Union of Immunological Societies: 2017 Primary Immuno-deficiency Diseases Committee Report on Inborn Errors of Immunity.J. Clin. Immunol. 38:96–128. https://doi.org/10.1007/s10875-017-0464-9
Pitoiset, F., M. Barbie, G. Monneret, C. Braudeau, P. Pochard, I. Pellegrin, J.Trauet, M. Labalette, D. Klatzmann, and M. Rosenzwajg. 2018a. Astandardized flow cytometry procedure for the monitoring of
Castro et al. Journal of Experimental Medicine 17 of 18
NCKAP1L deficiency https://doi.org/10.1084/jem.20192275
Dow
nloaded from http://rupress.org/jem
/article-pdf/217/12/e20192275/1048329/jem_20192275.pdf by guest on 27 January 2022
regulatory T cells in clinical trials. Cytometry B Clin. Cytom. 94:621–626.https://doi.org/10.1002/cyto.b.21622
Pitoiset, F., L. Cassard, K. El Soufi, L. Boselli, J. Grivel, A. Roux, D. Klatzmann,N. Chaput, and M. Rosenzwajg. 2018b. Deep phenotyping of immunecell populations by optimized and standardized flow cytometry analy-ses. Cytometry A. 93:793–802. https://doi.org/10.1002/cyto.a.23570
Richards, S., N. Aziz, S. Bale, D. Bick, S. Das, J. Gastier-Foster, W.W. Grody,M.Hegde, E. Lyon, E. Spector, et al; ACMG Laboratory Quality AssuranceCommittee. 2015. Standards and guidelines for the interpretation ofsequence variants: a joint consensus recommendation of the AmericanCollege of Medical Genetics and Genomics and the Association forMolecular Pathology. Genet. Med. 17:405–424. https://doi.org/10.1038/gim.2015.30
Ritchie, M.E., B. Phipson, D. Wu, Y. Hu, C.W. Law, W. Shi, and G.K. Smyth.2015. limma powers differential expression analyses for RNA-sequencing and microarray studies. Nucleic Acids Res. 43. e47. https://doi.org/10.1093/nar/gkv007
Rosenzwajg, M., R. Lorenzon, P. Cacoub, H.P. Pham, F. Pitoiset, K. El Soufi, C.RIbet, C. Bernard, S. Aractingi, B. Banneville, et al. 2019. Immunologicaland clinical effects of low-dose interleukin-2 across 11 autoimmunediseases in a single, open clinical trial. Ann. Rheum. Dis. 78:209–217.https://doi.org/10.1136/annrheumdis-2018-214229
Sakai, Y., Y. Tanaka, T. Yanagihara, M. Watanabe, X. Duan, M. Terasawa, A.Nishikimi, F. Sanematsu, and Y. Fukui. 2013. The Rac activator DOCK2regulates natural killer cell-mediated cytotoxicity in mice through thelytic synapse formation. Blood. 122:386–393. https://doi.org/10.1182/blood-2012-12-475897
Savic, S., E.A. Caseley, and M.F. McDermott. 2020. Moving towards asystems-based classification of innate immune-mediated diseases.Nat. Rev. Rheumatol. 16:222–237. https://doi.org/10.1038/s41584-020-0377-5
Schindelin, J., I. Arganda-Carreras, E. Frise, V. Kaynig, M. Longair, T.Pietzsch, S. Preibisch, C. Rueden, S. Saalfeld, B. Schmid, et al. 2012. Fiji:an open-source platform for biological-image analysis. Nat. Methods. 9:676–682. https://doi.org/10.1038/nmeth.2019
Schober, T., T. Magg, M. Laschinger, M. Rohlfs, N.D. Linhares, J. Puchalka, T.Weisser, K. Fehlner, J. Mautner, C. Walz, et al. 2017. A human immu-nodeficiency syndrome caused by mutations in CARMIL2. Nat. Com-mun. 8:14209. https://doi.org/10.1038/ncomms14209
Schwarz, J.M., D.N. Cooper, M. Schuelke, and D. Seelow. 2014. Muta-tionTaster2: mutation prediction for the deep-sequencing age. Nat.Methods. 11:361–362. https://doi.org/10.1038/nmeth.2890
Shoham, N.G., M. Centola, E. Mansfield, K.M. Hull, G. Wood, C.A. Wise, andD.L. Kastner. 2003. Pyrin binds the PSTPIP1/CD2BP1 protein, definingfamilial Mediterranean fever and PAPA syndrome as disorders in thesame pathway. Proc. Natl. Acad. Sci. USA. 100:13501–13506. https://doi.org/10.1073/pnas.2135380100
Smyth, G.K.. 2004. Linear models and empirical bayes methods for assessingdifferential expression in microarray experiments. Stat. Appl. Genet.Mol. Biol. 3. e3. https://doi.org/10.2202/1544-6115.1027
Subramanian, A., P. Tamayo, V.K. Mootha, S. Mukherjee, B.L. Ebert, M.A.Gillette, A. Paulovich, S.L. Pomeroy, T.R. Golub, E.S. Lander, et al. 2005.Gene set enrichment analysis: a knowledge-based approach for inter-preting genome-wide expression profiles. Proc. Natl. Acad. Sci. USA. 102:15545–15550. https://doi.org/10.1073/pnas.0506580102
Tangye, S.G., U. Palendira, and E.S. Edwards. 2017. Human immunity againstEBV-lessons from the clinic. J. Exp. Med. 214:269–283. https://doi.org/10.1084/jem.20161846
Tangye, S.G., G. Bucciol, J. Casas-Martin, B. Pillay, C.S. Ma, L. Moens, and I.Meyts. 2019. Human inborn errors of the actin cytoskeleton affectingimmunity: way beyond WAS and WIP. Immunol. Cell Biol. 97:389–402.https://doi.org/10.1111/imcb.12243
Tesi, B., and Y.T. Bryceson. 2018. HLH: genomics illuminates pathophysiologicaldiversity. Blood. 132:5–7. https://doi.org/10.1182/blood-2018-05-845818
Tyanova, S., T. Temu, and J. Cox. 2016. The MaxQuant computational plat-form for mass spectrometry-based shotgun proteomics. Nat. Protoc. 11:2301–2319. https://doi.org/10.1038/nprot.2016.136
Warga, R.M., and C.B. Kimmel. 1990. Cell movements during epiboly andgastrulation in zebrafish. Development. 108:569–580.
Waterhouse, A.,M. Bertoni, S. Bienert, G. Studer, G. Tauriello, R. Gumienny, F.T.Heer, T.A.P. de Beer, C. Rempfer, L. Bordoli, et al. 2018. SWISS-MODEL:homologymodelling of protein structures and complexes.Nucleic Acids Res.46(W1):W296–W303. https://doi.org/10.1093/nar/gky427
Wegehaupt, O., M. Groß, C. Wehr, R. Marks, A. Schmitt-Graeff, M. Uhl, M.Lorenz, K. Schwarz, C. Kratz, C. Niemeyer, et al. 2020. TIM-3 deficiencypresenting with two clonally unrelated episodes of mesenteric andsubcutaneous panniculitis-like T-cell lymphoma and hemophagocyticlymphohistiocytosis. Pediatr. Blood Cancer. 67. e28302. https://doi.org/10.1002/pbc.28302
Wehr, C., H. Eibel, M. Masilamani, H. Illges, M. Schlesier, H.H. Peter, and K.Warnatz. 2004. A new CD21low B cell population in the peripheralblood of patients with SLE. Clin. Immunol. 113:161–171. https://doi.org/10.1016/j.clim.2004.05.010
Yang, H., and K. Wang. 2015. Genomic variant annotation and prioritizationwith ANNOVAR and wANNOVAR.Nat. Protoc. 10:1556–1566. https://doi.org/10.1038/nprot.2015.105
Yee, C.S., M.J. Massaad, W. Bainter, T.K. Ohsumi, N. Foger, A.C. Chan, N.A.Akarsu, C. Aytekin, D.C. Ayvaz, I. Tezcan, et al. 2016. Recurrent viralinfections associated with a homozygous CORO1A mutation that dis-rupts oligomerization and cytoskeletal association. J. Allergy Clin. Im-munol. 137:879–88.e2. https://doi.org/10.1016/j.jaci.2015.08.020
Zhang, X., A.H. Smits, G.B. van Tilburg, H. Ovaa, W. Huber, andM. Vermeulen.2018. Proteome-wide identification of ubiquitin interactions using UbIA-MS. Nat. Protoc. 13:530–550. https://doi.org/10.1038/nprot.2017.147
Castro et al. Journal of Experimental Medicine 18 of 18
NCKAP1L deficiency https://doi.org/10.1084/jem.20192275
Dow
nloaded from http://rupress.org/jem
/article-pdf/217/12/e20192275/1048329/jem_20192275.pdf by guest on 27 January 2022
Supplemental material
Castro et al. Journal of Experimental Medicine S1
NCKAP1L deficiency https://doi.org/10.1084/jem.20192275
Dow
nloaded from http://rupress.org/jem
/article-pdf/217/12/e20192275/1048329/jem_20192275.pdf by guest on 27 January 2022

Figure S1. Immunophenotyping of CD4+ T cells, NK cells, B cells, and monocytes by flow cytometry. (A) CD4+ T cells: gating of naive (CD45RA+, CCR7+),CM (CD45RA−, CCR7+), EM (CD45RA−, CCR7−) and EM RA (CD45RA+, CCR7−) populations and expression of CD57, CD69, CD95, HLA-DR, and PD-1 in CD4+
T cells. (B) CD19+ B cell phenotype; naive (IgD+CD27−), switched (IgD−CD27+), and unswitched (IgD+CD27+) memory subsets (left) and CD21 expression inCD19+ B cells (right). (C) NK cells (CD3−CD56+cells) phenotype; CD56brightCD16−/lo and CD56+CD16+ NK cells (left) and NKp30 expression in total NK cells(right). (D) Monocyte subsets identified as classical monocytes (CD14+CD16−), transient (CD14+CD16+), and resident (CD14lo/−CD16+). In each dot plot, thenumbers indicate the percentage of the gated populations. Only one representative control is shown in the figure, with the exception of NK cell subsets, whichwere compared with three age-matched controls; the other lymphocyte subsets were measured against at least eight age-matched controls (for each patient).
Castro et al. Journal of Experimental Medicine S2
NCKAP1L deficiency https://doi.org/10.1084/jem.20192275
Dow
nloaded from http://rupress.org/jem
/article-pdf/217/12/e20192275/1048329/jem_20192275.pdf by guest on 27 January 2022
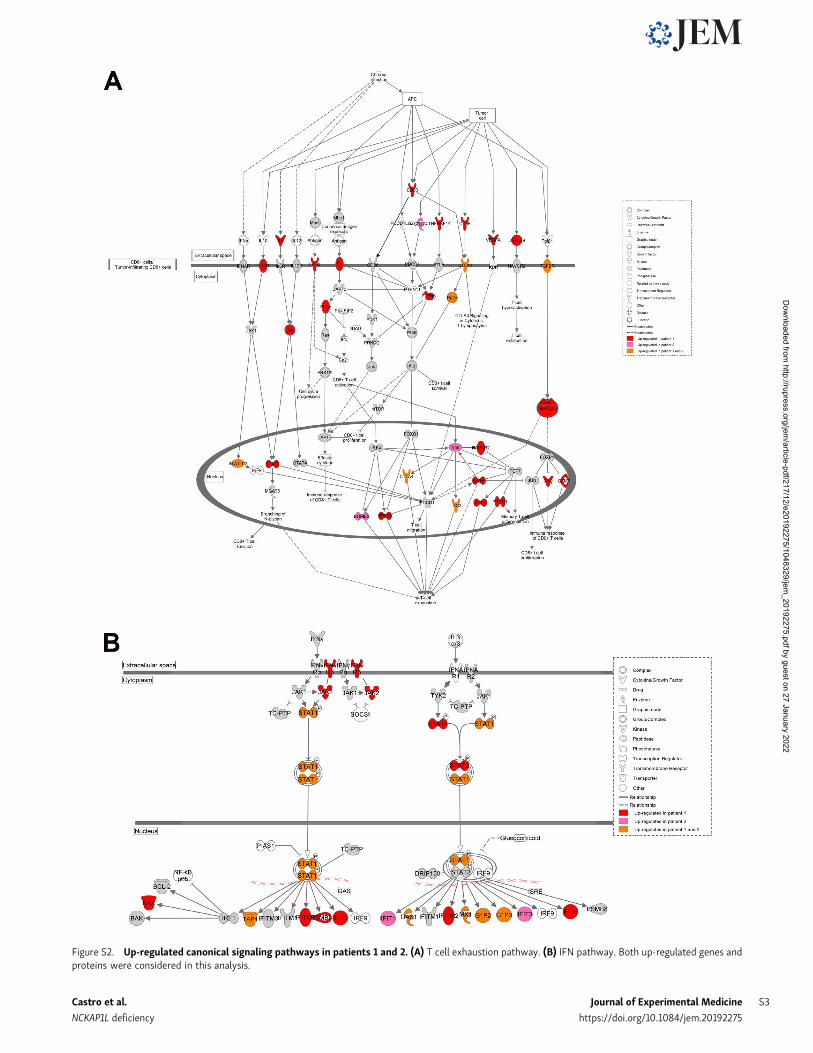
Figure S2. Up-regulated canonical signaling pathways in patients 1 and 2. (A) T cell exhaustion pathway. (B) IFN pathway. Both up-regulated genes andproteins were considered in this analysis.
Castro et al. Journal of Experimental Medicine S3
NCKAP1L deficiency https://doi.org/10.1084/jem.20192275
Dow
nloaded from http://rupress.org/jem
/article-pdf/217/12/e20192275/1048329/jem_20192275.pdf by guest on 27 January 2022

Table S1 is provided online and reports other candidate variants upon exome sequencing in family 1.
Figure S3. Knockdown of zebrafish nckap1l leads to anemia and neutrophil reduction. (A) Splice modification upon MO knockdown as shown by gelelectrophoresis after RT-PCR using primers around the respective splice sites in control injected embryos (control MO1 and control MO2) and MO-injectedembryos (MO1 and MO2). (B) Quantitative RT-PCR indicates knockdown of nckap1l upon MO injection. Gapdh was used as an internal control. Y axis isrepresented as antilog. (C and D)WISH of globin (C) andmpo (D) at 48 hpf in control and MO-injected zebrafish embryos. Shown are representative images foreach phenotype (left, C and D), graphs displaying the percentage of fish with normal vs. decreased expression (middle), which in D (right) are assessed ac-cording to the numbers of neutrophils. Numbers indicate the amount of fish with normal expression/total amount of fish from three (C) or two (D) biologicalreplicates. An ordinary one-way ANOVA was performed for multiple comparisons. Error bars are shown as ± SD; **, P < 0.01; ***, P < 0.001.
Castro et al. Journal of Experimental Medicine S4
NCKAP1L deficiency https://doi.org/10.1084/jem.20192275
Dow
nloaded from http://rupress.org/jem
/article-pdf/217/12/e20192275/1048329/jem_20192275.pdf by guest on 27 January 2022