briefing - european parliament · briefing statistical spotlight april 2015 ... members’ research...
TRANSCRIPT

Further information on page 7
BriefingStatistical Spotlight April 2015
EPRS | European Parliamentary Research Service Author: Eulalia Claros Members’ Research Service PE 554.171
Energy consumption in the EU1. Energy consumption by energy source in 2013, and energy intensity
SOLID FUELS
RENEWABLE
NUCLEARGAS
OIL
EECZBGSKPLSEROFIHUFRLVEUDEUKSIATITDKLTESNLBEHRELPTIELUCYMT
Y2013
Y2008
Y2003
200
400
600
800
1 000
0%
25%
50%
75%
100%
NuclearOil Gas Renewables Solid fuels
Energy intensity, shown in the lower graph, is the ratio between energy consumption and GDP, and is used as an indication of the energy efficiency of a country. EU28 energy intensity fell from 169 kg to 142 kg oil equiva-lent per €1 000 from 2003 to 2013. Consumption fell from 1 797 to 1 666 million tonnes oil
equivalent.
kg of oil equivalent in thousand euros 2003 2008 2013
The EU Energy Efficiency Directive sets targets to cut primary and final energy consumption, with countries required to submit action plans to achieve na-tional targets. Whilst progress has been made, the overall picture of fuel sources and user consumption in the EU remains fragmented along national lines.Energy consumption statistics measure both the use of primary fuels directly extracted or captured from natural resources, and of secondary energy sources which result either from en-ergy transformation or from direct use of primary fuels, e.g. gas. Gross inland energy consumption (or total energy inputs to an economy) represents the quantity of energy necessary to satisfy the inland consumption of a country, whilst primary energy refers to energy consumed to produce energy. Final en-ergy consumption includes all energy delivered to the final consumer (indus-try, transport, households and other sectors including services, fishing and agriculture).

Further information on page 7
EPRS Energy consumption in the EU
Members’ Research Service Page 2 of 8
AT
BE
BG CY
CZ
DE
-8%
4%
-3%
DK
EE
EL
ES
FI
FR
HR
HU
IE
IT
LT
LU
LV
MT
NL
-20%
39%
-1%
-3%
PL
PT
RO
SE
SI
SK
UK
Industry
Transport
Residential
Others
-9%
12%
8%
4%
-17%
3%
1%
5%
12%
-7%
0%
4%
4%
-19%
5%
21%
0%
21%
9%
-17%
4%
-4%
15%
-11%
2%
-12%
8%
-8%
11%
-20%
-4%
20%
43%
-9%
4%
-1%
13%
-32%
33%
10%
61%
-17%
16%
-24%
-4%
-4%
10%
2%
-9%
-22%
35%
-9%
-6%
-9%
17%
-22%
48%
-27%
5%
-14%
30%
13%
-1%
-4%
-18%
-12%
4%
-1%
26%
-14%
1%
4%
8%
16%
14%
-14%
-6%
-2%
1%
11%
-15%
-29%
29%
10%
23%
-53%
1%
63%
44%
-15%
21%
3%
1%
6%
2%
-8%
-20%
17%
-6%
8%
-27%
-4%
29%
25%
1%UK
IE
FR
ES
PT
IT
NLDK
SE
LT
LV
EE
PL
LU
MT
CZ
SI
SK
HU
HR
RO
EL
AT
BE
BG
CY
DE
FI
2. Final energy consumption by economic activity in 2013, and change since 2003
Energy distribution to the main EU economic sectors remained relatively stable from 2003 to 2013. Energy consumption by transport rose from 30% to 32%, and the industry share fell (from 28 to 25%). Finland consistently has the highest share of industry consumption of final energy (48% falling to 44%). Use of energy in transport activity is highest in Luxembourg (in-
crease from 58% to 62%). The energy consumption picture in several countries is changing: services sector consump-tion (under ‘Others’) in Belgium, Bulgaria, Cyprus, Spain, Italy, Luxembourg, and Slovakia has
increased over 25% relative to 2003, and over 60% in Romania.
AT
BE
BG CY
CZ
DE
-8%
4%
-3%
DK
EE
EL
ES
FI
FR
HR
HU
IE
IT
LT
LU
LV
MT
NL
-20%
39%
-1%
-3%
PL
PT
RO
SE
SI
SK
UK
Industry
Transport
Residential
Others
-9%
12%
8%
4%
-17%
3%
1%
5%
12%
-7%
0%
4%
4%
-19%
5%
21%
0%
21%
9%
-17%
4%
-4%
15%
-11%
2%
-12%
8%
-8%
11%
-20%
-4%
20%
43%
-9%
4%
-1%
13%
-32%
33%
10%
61%
-17%
16%
-24%
-4%
-4%
10%
2%
-9%
-22%
35%
-9%
-6%
-9%
17%
-22%
48%
-27%
5%
-14%
30%
13%
-1%
-4%
-18%
-12%
4%
-1%
26%
-14%
1%
4%
8%
16%
14%
-14%
-6%
-2%
1%
11%
-15%
-29%
29%
10%
23%
-53%
1%
63%
44%
-15%
21%
3%
1%
6%
2%
-8%
-20%
17%
-6%
8%
-27%
-4%
29%
25%
1%UK
IE
FR
ES
PT
IT
NLDK
SE
LT
LV
EE
PL
LU
MT
CZ
SI
SK
HU
HR
RO
EL
AT
BE
BG
CY
DE
FI
AT
BE
BG CY
CZ
DE
-8%
4%
-3%
DK
EE
EL
ES
FI
FR
HR
HU
IE
IT
LT
LU
LV
MT
NL
-20%
39%
-1%
-3%
PL
PT
RO
SE
SI
SK
UK
Industry
Transport
Residential
Others
-9%
12%
8%
4%
-17%
3%
1%
5%
12%
-7%
0%
4%
4%
-19%
5%
21%
0%
21%
9%
-17%
4%
-4%
15%
-11%
2%
-12%
8%
-8%
11%
-20%
-4%
20%
43%
-9%
4%
-1%
13%
-32%
33%
10%
61%
-17%
16%
-24%
-4%
-4%
10%
2%
-9%
-22%
35%
-9%
-6%
-9%
17%
-22%
48%
-27%
5%
-14%
30%
13%
-1%
-4%
-18%
-12%
4%
-1%
26%
-14%
1%
4%
8%
16%
14%
-14%
-6%
-2%
1%
11%
-15%
-29%
29%
10%
23%
-53%
1%
63%
44%
-15%
21%
3%
1%
6%
2%
-8%
-20%
17%
-6%
8%
-27%
-4%
29%
25%
1%UK
IE
FR
ES
PT
IT
NLDK
SE
LT
LV
EE
PL
LU
MT
CZ
SI
SK
HU
HR
RO
EL
AT
BE
BG
CY
DE
FI
Further information on page 7
Energy consumption in the EUEPRS
Members’ Research Service Page 3 of 8
Less than 50% increase
More than 50% decrease
More than 50% increase
Less than 50% decrease
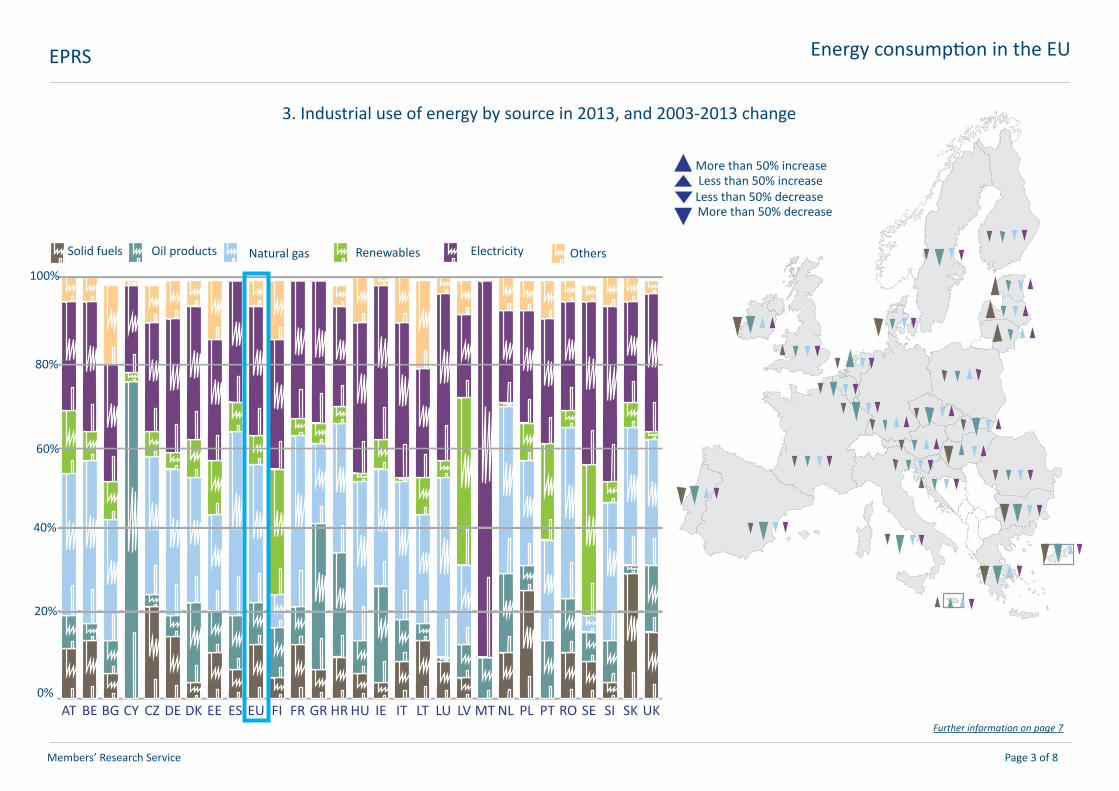
3. Industrial use of energy by source in 2013, and 2003-2013 change
UKSKSISEROPTPLNLMTLVLULTITIEHUHRGRFRFIEUESEEDKDECZCYBGBEAT
Derived heat
Electrical energy
Renewable energies
Gas
Oil
Solid fuels
UKSKSISEROPTPLNLMTLVLULTITIEHUHRGRFRFIEUESEEDKDECZCYBGBEAT
Derived heat
Electrical energy
Renewable energies
Gas
Oil
Solid fuels
ElectricitySolid fuels Renewables OthersNatural gasOil products
20%
40%
60%
80%
100%
0%
Further information on page 7
EPRS Energy consumption in the EU
Members’ Research Service Page 4 of 8
Solid fuelsOthersGasOil
Electrical energy
Renewable energies
UKSKSISEROPTPLNLMTLVLULTITIE
HUHRGRFRFIEUESEEDKDECZCYBGBEAT
Others
Electrical energy
Renewable energies
Gas
Oil
Solid fuels
Less than 50% increase
More than 50% decrease
More than 50% increase
Less than 50% decrease
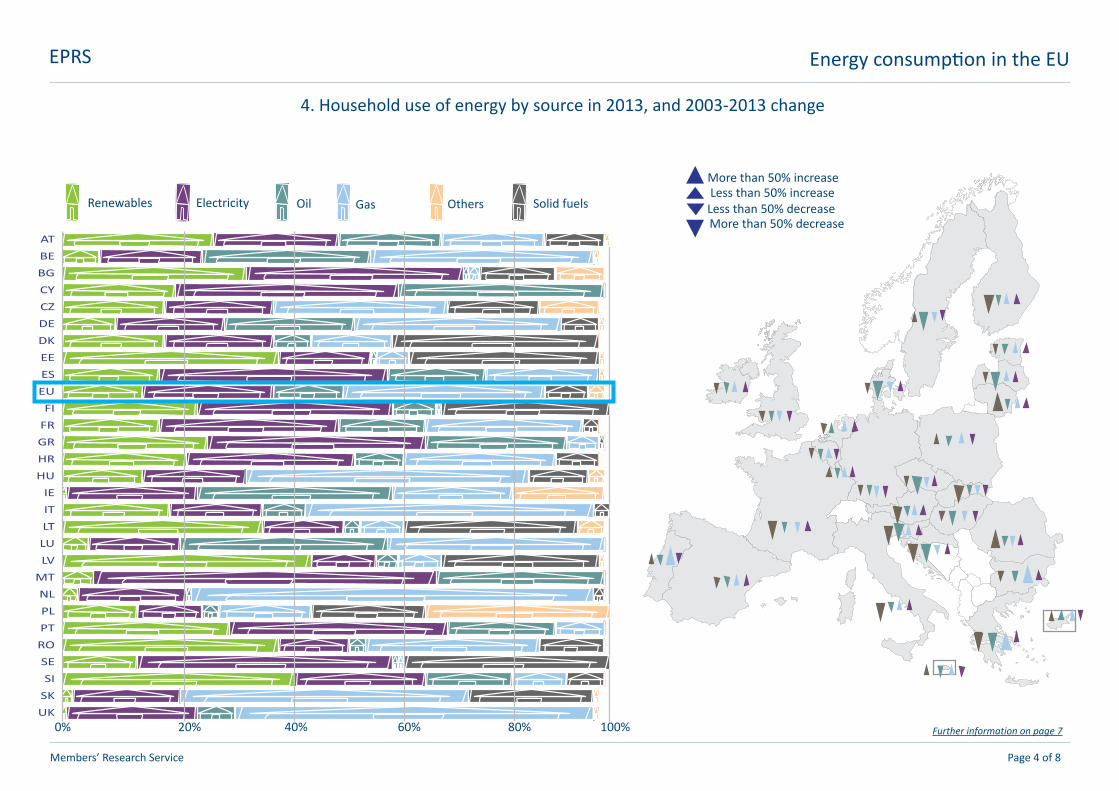
34. Household use of energy by source in 2013, and 2003-2013 changeSolid fuelsOthersGasOil
Electrical energy
Renewable energies
UKSKSISEROPTPLNLMTLVLULTITIE
HUHRGRFRFIEUESEEDKDECZCYBGBEAT
Others
Electrical energy
Renewable energies
Gas
Oil
Solid fuels
Gas OthersElectricity Oil Solid fuelsRenewables
20% 40% 60% 80% 100%0%

Further information on page 8
Energy consumption in the EUEPRS
Members’ Research Service Page 5 of 8
5. Use of oil products for transport in 2013
More than 90%
From 85% to 90%
From 80% to 85%
From 75% to 80%
From 70% to 75%
Less than 70%
Oil used by transport as % of oil products consumed in each country
has increased
has decreased
Use of oil in 2013 compared to 2003
Overall Road Avia�on
In 2013, the transport sec-tor consumed over 326 million tonnes of oil derived fuels, equiv-alent to 77% of EU consumption of all petrol products (a drop of 6% against 2003). Despite this decrease, 2013 aviation oil con-sumption (50 million tonnes oil equivalent) rose by 10% against
2003.In the Czech Republic, Lithuania, Luxembourg and Slovakia, trans-port sector consumption of oil fuels exceeded 90%, whilst, at less than 70%, it was lowest in
Belgium, Ireland and Finland.

Further information on page 8
Energy consumption in the EUEPRS
Members’ Research Service Page 6 of 8
7. Renewables: Progress towards 2020 consumption targets
2020 target2013 share
0,0 0,1 0,2 0,3 0,4 0,5 0,6
����������
����
������������
��2�������
����
����
����������������SELVFI
ATDKPTEE
ROLTSI
BGHR
ITESEL
EU28FRCZDEPLSK
HUCYBEIE
UKNLMTLU
6. Energy from renewable sources in 2013
Countries are grouped by the share renewables represent in their total energy use
more than 5% and up to 10%
2011-2012 average
more than 20%
PTDKFIATSELV
100
80
60
40
20
0
UK
CY
BE
IE
SK
HU
CZ
PL
FR
0 20 40 60 80 100
more than 15% and up to 20%
less than 5%
HR
IT
SI
RO
LT
MTLUNL
0 20 40 60 80 100
0
100
0 10 3020 40 50 60
more than 10% and up to 15%
DE
GR
BG
EU
EE
ES
0 20 40 60 80 100
Solid fuels
Biogas
Liquid biofuels
Hydropower
Solar
Thermal
Waste
Wind
EL

Energy consumption in the EUEPRS
Members’ Research Service Page 7 of 8
Further information
Gross inland energy consumption is calculated by adding energy imports to total domestic energy production, minus energy exports and withdrawals from existing stocks (definition: European Environment Agency). This Sus-tainable Development Indicator was chosen to assess progress on EU Sus-tainable Development Strategy targets.Energy intensity is measured as the ratio between gross inland energy con-sumption and GDP, and is often used as an energy efficiency indicator for a country. With unchanged GDP, a more energy-efficient economy will show a lower energy intensity ratio. The Climate and Energy Package set a non-bind-ing 2020 target (1086 million tonnes oil equivalent final energy consump-tion) to achieve 20% energy savings against a 2008 baseline scenario, and the Energy Efficiciency Directive established binding measures to help EU countries to maximise energy efficiency at all stages of the energy chain.Member States have adopted different baseline years for energy efficiency comparison.
2. Final energy consumption by sector in 2013, and 2003 change
1. Energy consumption by energy source and energy intensity in 2013
5. Use of oil products in transport in 2013
The map presents the volume of oil and petrol used by transport as a share of all petrol products used in each country. Icons represent the changes in
Household final energy consumption covers quantities consumed by private households. Eurostat’s data accuracy is affected by emerging liberalisation processes in some countries. Waste from non-renewable sources, transmis-sion losses and inaccuracies account for the differences in the totals.
Consumption of final energy covers energy supplied to the final consumer for all energy uses. Final energy usage patterns across the EU are presented as rectangles, the breakdown on the right shows energy use change in major economic sectors 2003-2013 for each country. ‘Others’ includes agriculture, fishing and services.
4. Household use of energy by source in 2013, and 2003-2013 change
and refer both to energy (as heat or power) and to fuels. Primary fuels are either extracted or captured directly from natural resources, whilst second-ary energy sources may result either from the transformation of energy or be produced from primary fuels. Electricity generation may result from en-ergy transformation either from a primary or a secondary source. (Manual of Energy Statistics). Final energy consumption includes energy consumed by end users, exclud-ing the energy sector. This chart shows final energy consumption by industry sector, and transfor-mation of fuels by the energy transformation sector, rather than industrial consumption, which is excluded. The direction of the triangles on the map shows change in consumption of the four main types of fuel 2013-2003. Triangle size indicates change magni-tude (more or less than 50%). Overall EU industry consumption fell In the map from 333 to 277 million tonnes of oil equivalent (Mtoe). Cyprus and Romania saw the largest reduc-tions, and only Austria (19%), Lithuania (8.3%), Malta (2.9%) and Germany (2.6%) reported increases.
3. Industrial use of energy by source in 2013, and 2003-2013 change
Although the term energy refers strictly to heat and power, it is often used to include fuels, defined as substances burned as a source of energy. Energy commodities, like energy vectors or energy carriers, are used as synonyms

Energy consumption in the EUEPRS
Members’Research Service Page 8 of 8
Disclaimer and CopyrightThe content of this document is the sole responsibility of the author and any opinions expressed therein do not necessarily represent the official position of the European Parliament. It is addressed to the Members and staff of the EP for their parliamentary work. Reproduction and translation for non-commercial purposes are authorised, provided the source is acknowledged and the European Parliament is given prior notice and sent a copy.© European Union, 2015.
[email protected] http://www.eprs.ep.parl.union.eu (intranet)http://www.europarl.europa.eu/thinktank (internet)http://epthinktank.eu (blog)
In 2013, the EU28 share of renewable final energy consumption reached 15%, up from 10.5% in 2008, and from an average of 13.5% in the two previ-ous years, which is in line with achieving the 2020 20% renewables target. According to the National Renewable Energy Action Plans adopted by EU countries in 2010, a 20.6% renewables share should be achieved, which im-plies a growth rate of absolute renewables consumption of 5.4% per year.
NotesCountry codes: Austria (AT), Belgium (BE), Bulgaria (BG), Croatia (HR), Cyprus (CY), Czech Republic (CZ), Denmark (DK), Estonia (EE), Finland (FI), France (FR), Germany (DE), Greece (EL), Hungary (HU), Ireland (IE), Italy (IT), Latvia (LV), Lithuania (LT), Luxembourg (LU), Malta (MT), Netherlands (NL), Po-land (PL), Portugal (PT), Romania (RO), Slovakia (SK), Slovenia (SI), Spain (ES), Sweden (SE), United Kingdom (UK), European Union (EU28).Data source: Eurostat
Extraction date: data extracted in March 2015 .
6. Energy from renewable sources in 2013Energy from renewable sources means energy from renewable non-fossil sources, namely solid biofuels, solar photovoltaic, thermal, hydropower, liq-uid biofuels, renewable municipal waste and wind. These charts are grouped by the share of renewables in the gross inland con-sumption of each country. Whilst they represent over 20% in Latvia, Sweden, Austria, Finland, Denmark and Portugal, in nine countries they are between 5-10%, and in the Netherlands, Luxembourg and Malta less than 5%.Wood and other solid biomass are the largest contributors to the renewables mix, representing 46% of EU renewables, and more than 50% in 14 Member States. EU renewables mix diversity corresponds to national characteristics: biogas constitutes over 20% of the mix in Germany alone, liquid biofuels in Luxembourg and Malta (respectively 35% and 27%). Hydropower represents over 50% of Croatian renewables, while counting for over 20% in eight other countries. Solar’s share is above 20% in Malta, where this is also the case for thermal origin renewable energy, which counts for 50% of the mix in Cyprus. Wind accounts for 46% in Ireland, 27% in Spain, 24% in the United Kingdom and 21 and 22% respectively in Cyprus and Denmark.
7. Renewables: progress towards 2020 consumption targetstransport sector consumption of oil products: From 2003-2013 oil product use in Poland, Malta, Slovenia and Slovakia grew over 25%, whilst consump-tion fell by over 15% in Portugal, Spain, Italy and Greece.
t