briefing on mig expenditure for select committee on appropriations 12 may 2015
TRANSCRIPT

BRIEFING ON MIG EXPENDITURE FOR
SELECT COMMITTEE ON APPROPRIATIONS
For an Equitable Sharing of National Revenue
12th May 2015
CHALLENGES FOR MIG AND SOLUTIONS

3
STRUCTURE OF PRESENTATION
• MIG Performance
– Spending on MIG (National and KZN)
– MIG and Backlogs (National and KZN)
• Distribution of MIG Projects
• MIG and Consolidation
• Asset rehabilitation
• FFC Recommendations
• Insights from LG Infrastructure Grant Review
Presentation on Municipal Infrastructure Grants Expenditure

4
SPENDING ON MIG
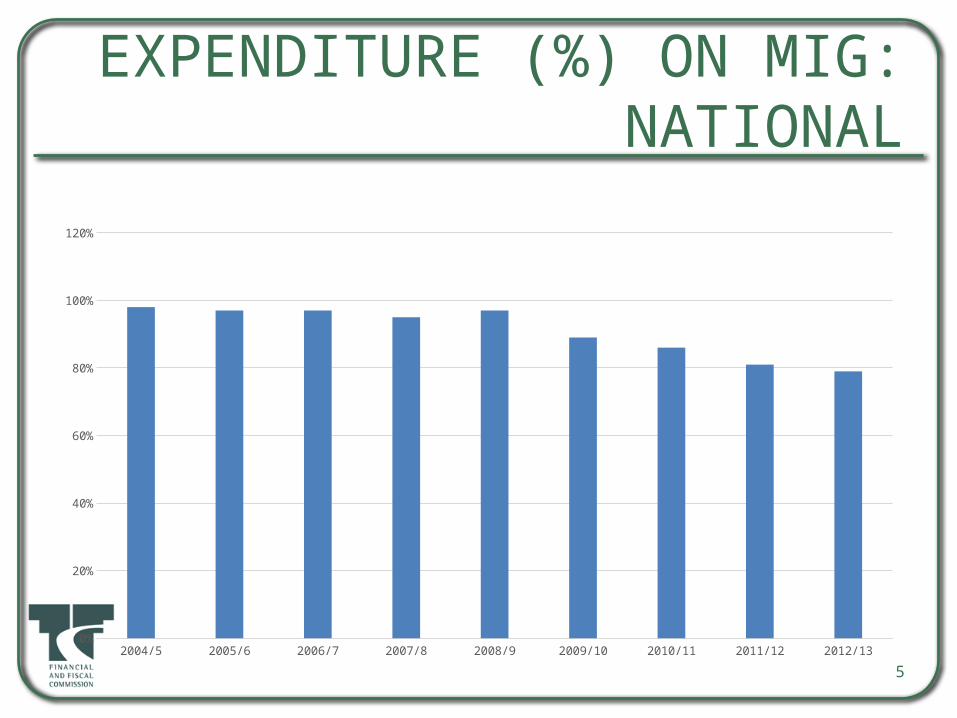
• Spending on MIG is on the decline• At National level: 2004/5 spending was 98%
and in 2012/14 , it was 79%• Between 2004/5 and 2012/13 a total of R 8,6
billion of MIG was not spent• KZN has done general better than national
average• In KZN: 2009/10 it was 92% and increased to
95 %.
5
EXPENDITURE (%) ON MIG: NATIONAL
2004/5 2005/6 2006/7 2007/8 2008/9 2009/10 2010/11 2011/12 2012/130%
20%
40%
60%
80%
100%
120%

6
EXPENDITURE (%) ON MIG: NATIONAL
2004/5 2005/6 2006/7 2007/8 2008/9 2009/10 2010/11 2011/12 2012/130%
20%
40%
60%
80%
100%
120%

NATIONAL VS KZN PERCENTAGE MIG SPENDING
7
2009/10 2010/11 2011/12 2012/130%
20%
40%
60%
80%
100%
120%
81%86%
81% 79%
92%
69%
102%95%
National: Exp as % of revised allocation KZN: Exp as % of revised allocation
8
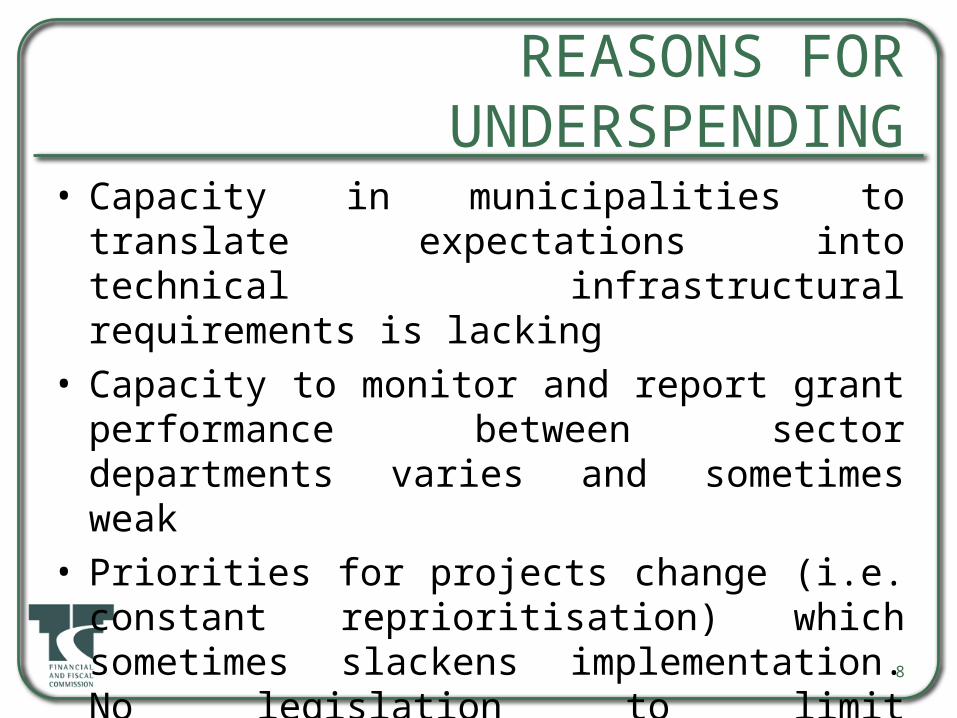
REASONS FOR UNDERSPENDING
• Capacity in municipalities to translate expectations into technical infrastructural requirements is lacking
• Capacity to monitor and report grant performance between sector departments varies and sometimes weak
• Priorities for projects change (i.e. constant reprioritisation) which sometimes slackens implementation. No legislation to limit municipalities to change commitments especially in the year of implementation
• Poor capacity to plan.

9
MIG AND BACKLOGS
• MIG introduced to improve service delivery by involving all government spheres
• 75% of MIG allocation is for residential infrastructure; MIG is supposed to assist in eradication of backlogs
• What has happened to backlogs?• Generally there has been a decline in service
backlogs both at national level and KZN
10
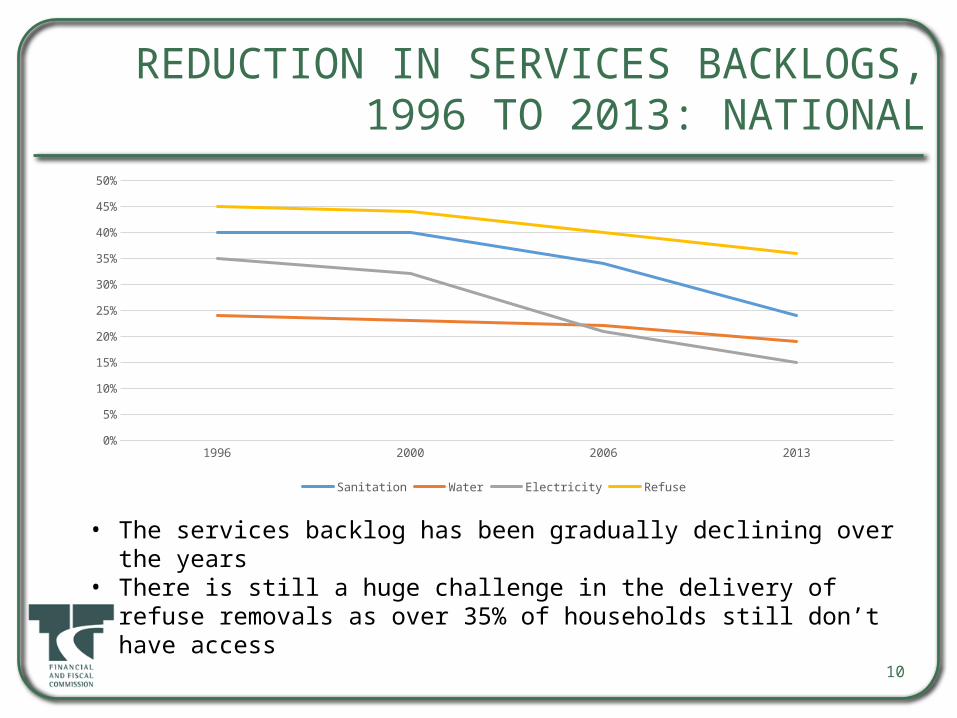
REDUCTION IN SERVICES BACKLOGS, 1996 TO 2013: NATIONAL
• The services backlog has been gradually declining over the years• There is still a huge challenge in the delivery of refuse removals as over 35% of
households still don’t have access
1996 2000 2006 20130%
5%
10%
15%
20%
25%
30%
35%
40%
45%
50%
Sanitation Water Electricity Refuse

11
IMPROVED ACCESS TO SERVICES,1996 TO 2013: NATIONAL
0%
10%
20%
30%
40%
50%
60%
70%
80%
90%
1996 2000 2006 2013
Sanitation Water Electricity Refuse
• Generally there has been an increase in access to services by household over the years
• It can be seen that electricity connectivity increased seriously over the years to number one most accessed municipal service followed by water
• Refuse removal is seen to be lagging behind in terms of the improving of access to this service but overall has improved
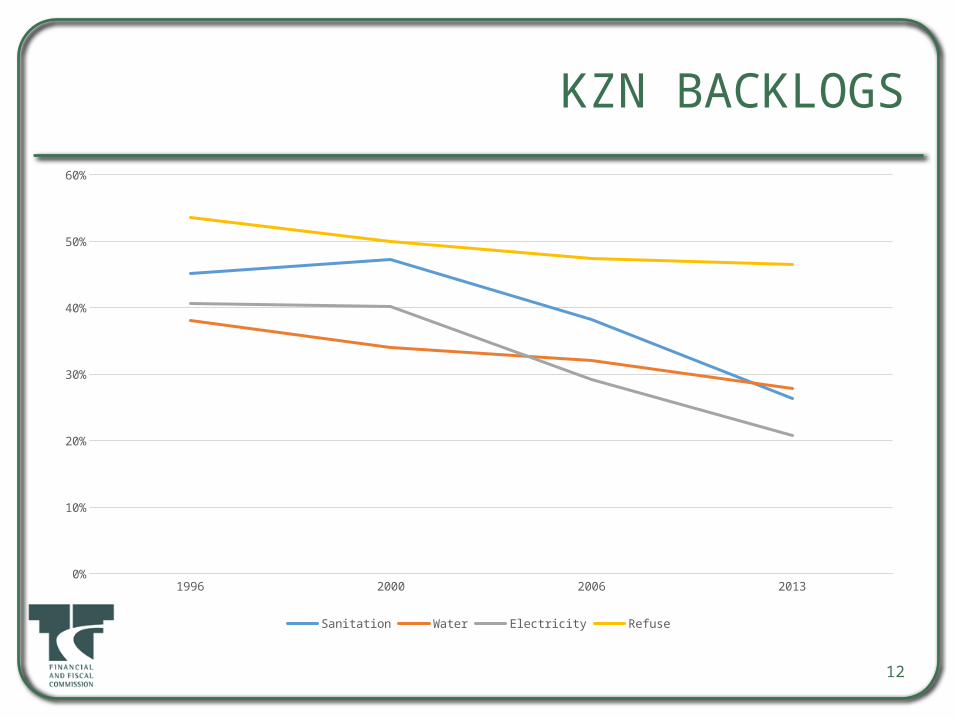
KZN BACKLOGS
12
1996 2000 2006 20130%
10%
20%
30%
40%
50%
60%
Sanitation Water Electricity Refuse
13
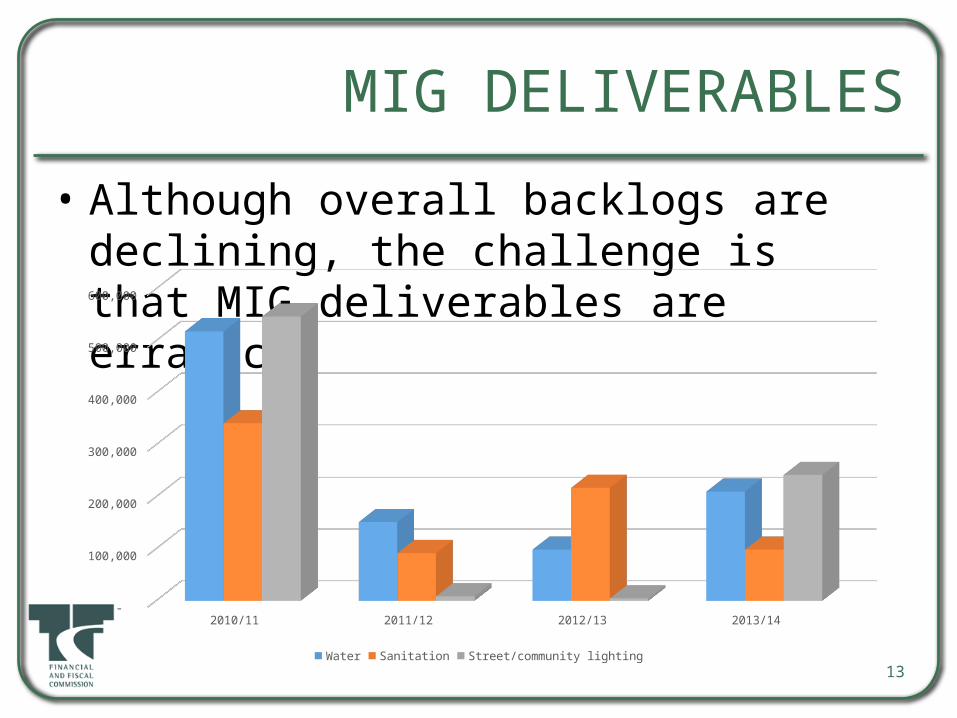
MIG DELIVERABLES
• Although overall backlogs are declining, the challenge is that MIG deliverables are erratic.
2010/11 2011/12 2012/13 2013/14 -
100,000
200,000
300,000
400,000
500,000
600,000
Water Sanitation Street/community lighting

14
REHABILITATION OF INFRASTRUCTURE
• Evidence on the ground shows mismatch between the repairs and maintenance requirements within municipalities and the resources for infrastructure rehabilitation
• Both asset maintenance and renewal activities are underfunded, and the de facto situation is one of asset stripping.
• On average, 5% of total opex on rehabilitation, far below the NT guidelines of 8–10% (FFC, 2011)
• FFC research shows that Municipalities on average spend 79% of maintenance budgets
• Research indicates that the majority of municipalities have neither formal costed maintenance strategies in place nor asset lifecycle strategies. Furthermore, they are uncertain about the nature, extent, location and physical attributes of their assets.

15
REHABILITATION OF INFRASTRUCTURE
• The lack of formal asset management plans, detailing lifecycle strategies and plans is the likely cause for under-spending on asset care. In the absence of these plans municipalities can neither properly budget for nor schedule specific asset care tasks and interventions.
• There is a dire need to develop asset management guidelines in the short term and legislation in the medium term, to ensure improved planning and care of assets, supported by incentives offered via the fiscal system

16
MIG AND GRANT CONSOLIDATION
• MIG started in 2004/5 through consolidation of: Consolidated municipal Infrastructure Programme, Local economic Development Fund, Water Services Grant, Community Based Public Works Programme, Building for Sports and recreation Programme, Urban Transport grant
• Consolidation seemed to work till 2010: Thereafter consolidation has stalled (See Chart)
• Mushrooming of indirect grants which pose other challenges such as who is accountable for their performance, underspending on such grants,
• MIG introduced to improve service delivery in a more coordinated manner- but now with proliferating grants the challenge is coordination

17
MIG AND CONSOLIDATION
18
SOME SOLUTIONS
• Challenges to MIG highlighted above include (Summary):– Underspending on MIG– Erratic MIG deliverables– Underfunding and underspending on asset
maintenance which MIG is designed to build– Departure from MIG as a consolidated grant

19
SOLUTIONS
Improving Spending on MIG Commission recommends fusing incentives into infrastructure grants. This would
encourage performance and improve spending. What to incentivise? Incentives must have one clear goal:
– Own contributions to capital budget (match funding)
– Growth outcomes
– Backlog eradication
– Asset sustainability
Improving rehabilitation and maintenance on infrastructure• In 2014 DCoG ran a policy review of this grant and introduced a condition
that allows this grant to be used for refurbishment of projects and upgrading of informal settlements. The introduction will help address the plight of persons without housing.
20
SOLUTIONS• National Treasury, in collaboration with relevant stakeholders such as
COGTA and the South African Local Government Association (SALGA) develop local government specific infrastructure asset management legislation, similar to the Government immovable Asset Management Act at national and provincial level (2014/15)
• National Treasury devises local government infrastructure asset management guidelines. These guidelines should be positioned within the broader system of capacity development and performance oversight. Technical assistance should be provided to municipalities to prepare and implement credible infrastructure asset management plans (2014/15)
• Provincial and national authorities must increase scrutiny of the operating implications of capital funding so as to ensure that municipalities are able to adequately maintain and renew infrastructure (2014/15)

21
SOLUTIONS
Improving MIG deliverables• The DCoG should restructure the Special Municipal Infrastructure Grant component
of the MIG in order to allow municipalities to acquire or rehabilitate ecological infrastructure (such as coastal dunes or mangroves that provide natural protection from excessive storm surge and other weather events), provided that the return on investment is greater than a comparable engineering solution;
• The Department of Cooperative Governance (DCoG) should review the funding conditions of the Municipal Infrastructure Grant (MIG) to ensure that local-level municipal waste management assets are eligible for financing.
• The DCoG should review the MIG guidelines to ensure that (i) adequate funding for solid waste assets is available to municipalities with weaker fiscal capacity; and (ii) expenditures on specialised vehicles and equipment required for solid waste management services are eligible for financing

ANNEXURE AND NEW INSIGHTS
23
LG INFRASTRUCTURE REVIEW: SOME NEW INSIGHTSConsolidation
1. Limit numbers of indirect grants and consolidate grants; Process has started– Two public transport grants to cities would be merged from 2015/16
– Possible merger of water grants announced in 2014 MTBPS was delayed to 2016/17
– In the 2015 Budget it was announced that two public transport grants to cities would be merged from 2015/16
2. The conditions for the Municipal Infrastructure Grant were amended to include provision for refurbishment projects to be approved
– Initiates the process of pivoting towards more resources being invested in refurbishment to sustain services, not just backlog eradication

24
LG INFRASTRUCTURE REVIEW: SOME NEW INSIGHTS3. Grant Structure
• Greater asymmetry and differentiation in the grant system; proposals address service delivery and locational challenges applicable to the different types of municipalities
• Rationalisation in the number of grants each municipality receives
4. Asset Management and Planning• Incentivising/enforcing improved pre-planning and asset management
over the life-cycle of grant-funded infrastructure
• Grant funding for not just ‘new’ assets but renewal too
25
MIG POLICY REVIEW INSIGHTS
• Review is in response to:
– Back to basics approach
– Awareness that municipalities are different
– Challenges of infrastructure delivery related to repair and maintenance.
– Proposed changes
• MIG to make explicit allowance of R&M
• Allow MIG for economic infrastructure
• Introduce MIG 1 and MIG 2. MIG 1 is current and MIG 2 has less conditions for 19 most urban municipalities
• Have string incentives for performance
• Have strong M&E

THANK YOU