briefing on results for fiscal 2015(pdf) - 株式会社ゼンリン · 2018. 1. 6. · briefing on...
TRANSCRIPT

Briefing on Results for Fiscal 2015
(Year Ended March 31, 2015)May 14, 2015
President and CEO Zenshi TakayamaExecutive Vice President Junya AmitaExecutive Officer, and Head of Corporate Management Division Masami Matsuo
Securities Code: 9474
Briefing on Results for FY2015
ZENRIN Co., Ltd.

ZENRIN CO., LTD. All Rights Reserved.©
Briefing on Results for FY2015
Overview of Results for Fiscal 2015
Fiscal 2016 to Fiscal 2020
Medium- to Long-Term Business Plan
“ZENRIN GROWTH PLAN 2020” (ZGP2020)
~Make all maps in Japan based on ZENRIN~Appendix
Table of Contents
Note: This document contains forward-looking statements based on assumptions, forecasts and plans in light of information available to ZENRIN Co., Ltd. as ofthe preparation date of this document. Actual performance may vary significantly from the forecast figures due to various risks and uncertainties owing toglobal economic trends, market demand, status of competition, exchange fluctuations and other factors.The information that appears in this document rounds down fractions to the nearest specified unit and rounds off decimals in the percentage of change tothe first decimal place.In addition, cases where the percentage of change exceeds 1000% and cases where one or both of the items of comparison is negative are shown as “–.”
1

ZENRIN CO., LTD. All Rights Reserved.©
Briefing on Results for FY2015
Overview of Results for Fiscal 2015
(1) Overview of Results(2) Causes for Change in Operating Income(3) Segment Information(4) Net Sales by Business Segment under Medium-Term
Business Plan ZGP2015(5) Changes in Cash Flows(6) Dividends
2
ZENRIN CO., LTD. All Rights Reserved.©
Briefing on Results for FY2015
3
1-1) Overview of Results
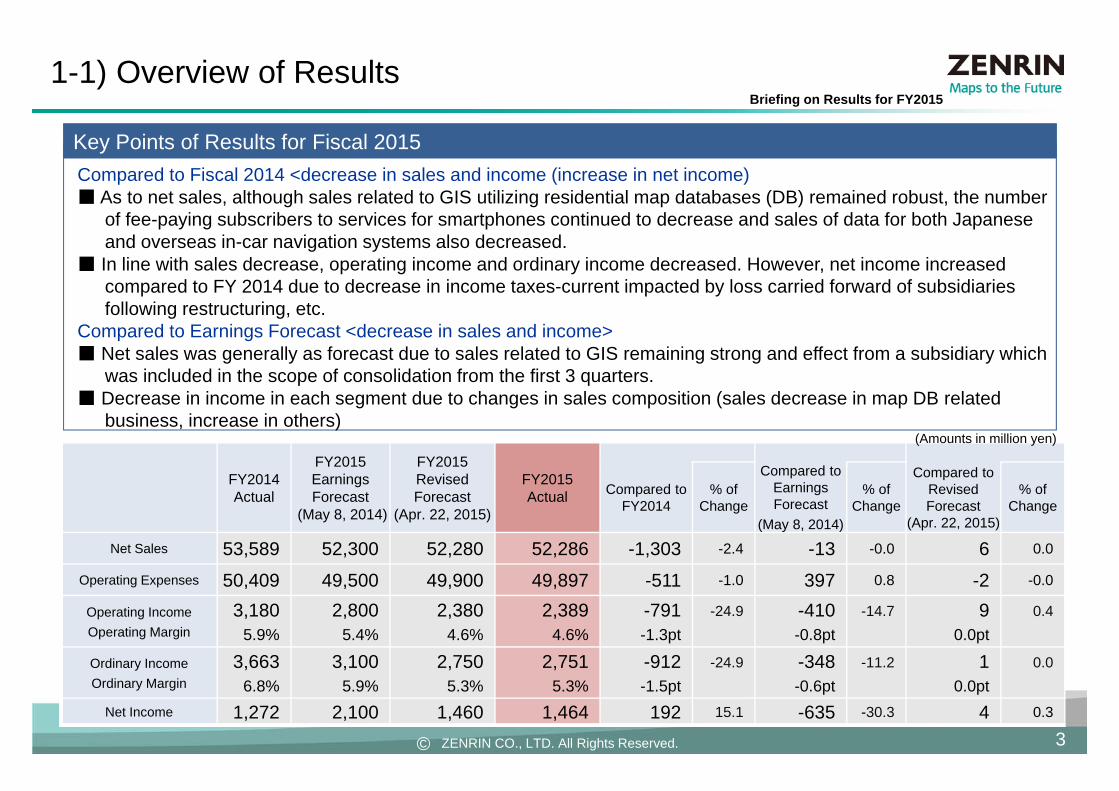
Key Points of Results for Fiscal 2015Compared to Fiscal 2014 <decrease in sales and income (increase in net income)■ As to net sales, although sales related to GIS utilizing residential map databases (DB) remained robust, the number
of fee-paying subscribers to services for smartphones continued to decrease and sales of data for both Japanese and overseas in-car navigation systems also decreased.
■ In line with sales decrease, operating income and ordinary income decreased. However, net income increased compared to FY 2014 due to decrease in income taxes-current impacted by loss carried forward of subsidiaries following restructuring, etc.
Compared to Earnings Forecast <decrease in sales and income> ■ Net sales was generally as forecast due to sales related to GIS remaining strong and effect from a subsidiary which
was included in the scope of consolidation from the first 3 quarters.■ Decrease in income in each segment due to changes in sales composition (sales decrease in map DB related
business, increase in others). ■ 売上構成の変化(地図データベース関連事業の減収、その他の増加)により各利益において減益
FY2014Actual
FY2015 Earnings Forecast
(May 8, 2014)
FY2015 Revised Forecast
(Apr. 22, 2015)
FY2015Actual Compared to
FY2014% of
Change
Compared to Earnings Forecast
(May 8, 2014)
% of Change
Compared to Revised Forecast
(Apr. 22, 2015)
% of Change
Net Sales 53,589 52,300 52,280 52,286 -1,303 -2.4 -13 -0.0 6 0.0
Operating Expenses 50,409 49,500 49,900 49,897 -511 -1.0 397 0.8 -2 -0.0
Operating IncomeOperating Margin
3,1805.9%
2,8005.4%
2,3804.6%
2,3894.6%
-791-1.3pt
-24.9 -410-0.8pt
-14.7 90.0pt
0.4
Ordinary IncomeOrdinary Margin
3,6636.8%
3,1005.9%
2,7505.3%
2,7515.3%
-912-1.5pt
-24.9 -348-0.6pt
-11.2 10.0pt
0.0
Net Income 1,272 2,100 1,460 1,464 192 15.1 -635 -30.3 4 0.3
(Amounts in million yen)

ZENRIN CO., LTD. All Rights Reserved.©
Briefing on Results for FY2015
4
1-2) Causes for Change in Operating Income
0
20
40
60
80
10010
8
6
4
2
0
+1.1
- 0.3 - 0.5- 0.0
+0.1
+0.1
Net SalesCompared to FY2014: -1.3 bn yen (-2.4%)Net SalesCompared to FY2014: -1.3 bn yen (-2.4%)
3.12.3
Compared to FY2014: -0.7 bn yen (-24.9%)
Decrease in the number of fee-paying subscribers to services for smartphones
Stock-type models were robust as well as existing businesses
Improvement in productivity of map DB
Cost reduction through improving operational
efficiency
- 0.6- 1.7
14/3
Actual
14/3
Actual
Advertising
Business
Advertising
Business
Publishing
Business
Publishing
Business
GIS
Business
GIS
Business
ICT
Business
ICT
Business
Other
Business
Other
Business
ITS
Business
ITS
Business
Global
Business
Global
Business
Operating
Expenses
Operating
Expenses
15/3
Actual
15/3
Actual
(Amounts in billion yen)

ZENRIN CO., LTD. All Rights Reserved.©
Briefing on Results for FY2015
5
1-3) Segment Information
SalesComposition
1. Map Database SegmentMain Items: Printed residential maps,
residential map databases, data for Japanese and overseas in-car navigation systems,services for smartphones, map data provision, etc. for various media/devices
2. General Printing SegmentMain Items: Commercial printing
3. OtherMain Items: Purchased products, digital signage,
direct mail delivery services, in-ship advertising
85.5%
7.2%
7.3%

ZENRIN CO., LTD. All Rights Reserved.©
Briefing on Results for FY2015
Net Sales Operating IncomeCompared to
FY2014
6
1-3) Map Database Segment
Down 1,557 (-3.4%) Down 759 (-27.6%)
46,27644,718
35,000
40,000
45,000
50,000
14/3 Actual 15/3 Actual
2,756
1,996
0
1,000
2,000
3,000
4,000
5,000
14/3 Actual 15/3 Actual
(Amounts in million yen)
ZENRIN CO., LTD. All Rights Reserved.©
Briefing on Results for FY2015
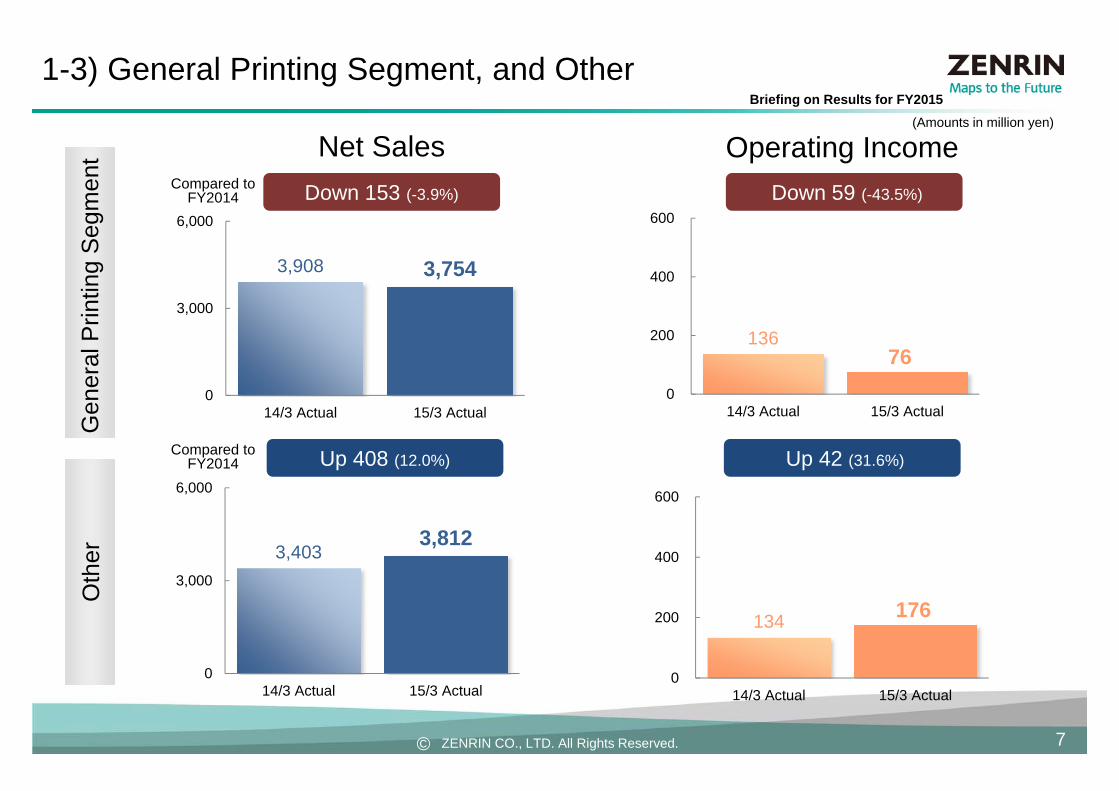
136 76
0
200
400
600
14/3 Actual 15/3 Actual
Net Sales Operating IncomeCompared to
FY2014
Compared toFY2014
7
Gen
eral
Prin
ting
Seg
men
tO
ther
1-3) General Printing Segment, and Other(Amounts in million yen)
Up 408 (12.0%) Up 42 (31.6%)
Down 153 (-3.9%) Down 59 (-43.5%)
3,908 3,754
0
3,000
6,000
14/3 Actual 15/3 Actual
3,4033,812
0
3,000
6,000
14/3 Actual 15/3 Actual
134 176
0
200
400
600
14/3 Actual 15/3 Actual

ZENRIN CO., LTD. All Rights Reserved.©
Briefing on Results for FY2015
8
1.31.00.9 1.11.1
8.78.78.4 8.57.8
9.19.610.2
11.311.410.6
14.114.113.112.4 12.312.0
11.310.710.9
2.8 3.02.3
2.72.2
7.26.46.0
4.6
6.1
0
50
100
150
20020
15
1
5
10
20
15
10
20
15
10
20
15
10
AdvertisingAdvertising PublishingPublishing GISGIS ICTICT ITSITS GlobalGlobal OtherOther-1.7
(-12.1%)-0.6
(-7.6%)+1.1
(11.6%)+0.1
(18.4%)-0.3
(-3.4%)-0.0
(-4.2%)+0.1(3.0%)
Com
pare
d to
FY20
14FY
2012
FY20
13
FY20
14
FY20
15 (A
ctua
l)
FY20
15 (M
ay 8
, Ear
ning
s fo
reca
st)
1-4) Net Sales by Business Segment under Medium-Term Business Plan ZGP2015
(Amounts in billion yen)

ZENRIN CO., LTD. All Rights Reserved.©
Briefing on Results for FY2015
Operating Cash Flows Financing Cash FlowsFree Cash FlowsInvesting Cash Flows
9
1-5) Changes in Cash Flows
Inflows up 2,986 Outflows down 2,941 Inflows up 5,927 1,997支出増加Outflows up 4,544
6,51
2
5,91
5
8,24
2
4,13
6
7,12
2
-6,000
-4,000
-2,000
0
2,000
4,000
6,000
8,000
10,000
11/3 12/3 13/3 14/3 15/3
-3,3
22
-5,5
74
-4,9
77
-7,7
03
-4,7
61
11/3 12/3 13/3 14/3 15/3
3,19
0
340
3,26
5
-3,5
66
2,36
0
11/3 12/3 13/3 14/3 15/3
Remodeling and expansion of ZENRIN-owned property
-1,8
19
-1,9
08
-2,1
53
1,61
2
-2,9
31
11/3 12/3 13/3 14/3 15/3
(Amounts in million yen)
Decrease in income taxes paid

ZENRIN CO., LTD. All Rights Reserved.©
Briefing on Results for FY2015
10
1-6) Dividends
Cash Dividend per Share
15.5015.0014.00 14.00 14.00 15.00
1.00
15.00 15.5014.00 14.00
15.00 15.00
1.001.00
0
15
30
11/3 12/3 13/3 14/3 15/3 16/3
yen
29.00
3.0% 3.0% 3.0% 3.0%
(Plan)3.0%
or higher3.0%
1%
2%
3%
4%
11/3 12/3 13/3 14/3 15/3 16/3
Dividend on Equity (DOE) onConsolidated Basis
Maintain dividend on equity (DOE) on a consolidated basis
of 3% or higher
Year-end dividend: 16 yenAnnual dividend: 31 yen
31.00
28.00
Basic Policy: Return income to shareholders in accordance with the level of income on a consolidated basis while taking into account the maintaining of an adequate amount of internal reserves
30.00
Increase in dividend
30.00
Interim dividend
Year-end dividend
(1 yen increase from the initial forecast)
Increase in dividend
(Forecast)
31.00
(Forecast)
(Forecast)

Fiscal 2016 to Fiscal 2020Medium- to Long-Term Business Plan
ZENRIN GROWTH PLAN 2020~Make all maps in Japan based on ZENRIN~
ZENRIN CO., LTD. All Rights Reserved.©
Table of Contents
I. Review of “ZENRIN GROWTH PLAN 2015” (ZGP2015)
II. “ZENRIN GROWTH PLAN 2020” (ZGP2020)
III. Earnings Forecast for Fiscal 2016
12
ZENRIN CO., LTD. All Rights Reserved.© 13
I. Review of ZGP2015

ZENRIN CO., LTD. All Rights Reserved.© 14
ZGP2015 Basic Structure
III. Productivity improvement and structural reform for lowering the fixed cost ratio
I. Earnings expansion through development of applications of existing and new map DB
Realize “better suited value” based on the thinking of curation
II. Building of spatio-temporal DB for optimization of the “Cycle of Knowledge”
ZENRIN GROWTH PLAN 2015

ZENRIN CO., LTD. All Rights Reserved.©
5.5 3.1 2.3
8.0
0
3
6
9
13/3 14/3 15/3 16/3
54.9 53.5 52.265.0
40
50
60
70
13/3 14/3 15/3 16/3
Status of Progress of ZGP2015 Targets
15
ZGP2015 Final FiscalYear
Target
ZGP2015 Final Fiscal Year
Target
Consolidated Net Sales
Consolidated Operating Income
Development of applications being limited
Environmental changes in the smartphone services and in-car
navigation system markets
Prior expenses associated with
4D Geospatial Information DB maintenance
Impact on progress of ZGP2015
(Amounts in billion yen)
ZENRIN CO., LTD. All Rights Reserved.©
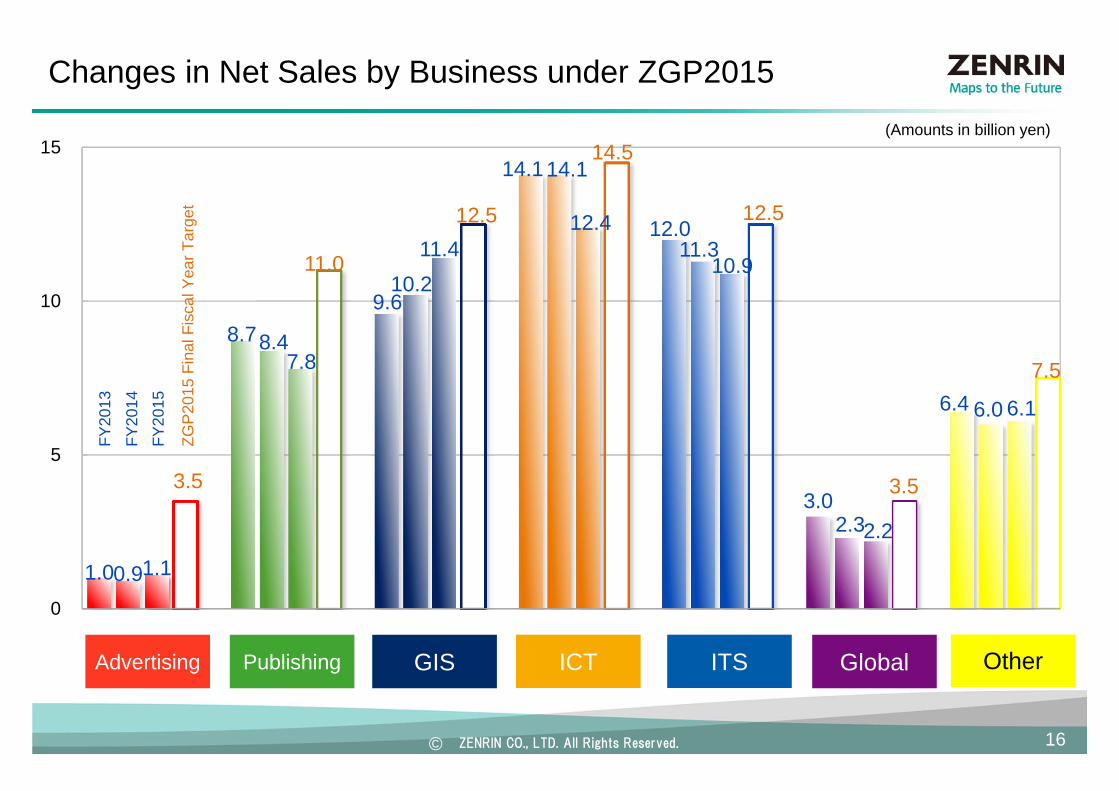
Changes in Net Sales by Business under ZGP2015
16
Advertising Publishing GIS ICT ITS Global Other
1.00.91.1
3.5
8.78.47.8
11.0
9.610.2
11.412.5
14.114.1
12.4
14.5
12.011.3
10.9
12.5
3.02.32.2
3.5
6.4 6.0 6.1
7.5
0
5
10
15
FY20
13
FY20
14FY
2015
ZGP
2015
Fin
al F
isca
l Yea
r Tar
get
(Amounts in billion yen)
ZENRIN CO., LTD. All Rights Reserved.© 17
II. ZGP2020

ZENRIN CO., LTD. All Rights Reserved.© 18
ZGP2020 Theme
Year 2020
©ZENRIN
Corporate Vision
World’s leading company in the mapping of information
“Field-oriented corporate management”~Make all maps in Japan based on ZENRIN~

ZENRIN CO., LTD. All Rights Reserved.©
Environment Surrounding ZENRIN
19
・ Changes in social structure due to IT technological evolution・ Growing disaster prevention awareness and disaster countermeasures・ Tokyo winning the bid to host the 2020 Olympic Games・ Safe, secure and comfortable automobile society・ Increase in foreign travelers visiting Japan
・ Enhancement of SMEs’ GIS system usage environment・ Sophistication of ITS, such as driving safety support・ Growth of needs for maps for disaster prevention and disaster mitigation of national
and local governments・ Expansion of needs for use of location information services by
foreigners visiting Japan・ Growth of needs for regional information in
local economic vitalization and regional development
Expansion of opportunities for use of map information
Cost leadership
©ZENRIN
Differentiation

ZENRIN CO., LTD. All Rights Reserved.©
ZGP2020 Basic Structure
20
ZENRIN GROWTH PLAN 2020
III. Reduction of the fixed cost ratio by realizing “productivity reform”
I. Earnings expansion through development of applications by creating “scenes for using”
II. Stable operation of 4D Geospatial Information System pursuing “QCDDS”

ZENRIN CO., LTD. All Rights Reserved.©
Target Net Sales by Business under ZGP2020
21
8.99.1 9.3
11.011.4
12.113.5
15.5
12.412.4
14.0
17.5
10.9
11.312.0
13.5
2.2
2.9 3.54.5 6.1
7.47.7 8.0
0
5
10
15
20
FY20
15 A
ctua
l
FY20
16 F
orec
ast
FY20
18 T
arge
t
(Amounts in billion yen)
FY20
20 T
arge
t
Publishing GIS ICT ITS Global Other
+2.0(22.8%)
+2.0(22.8%)
+4.0(35.7%)
+4.0(35.7%)
+5.0(40.3%)
+5.0(40.3%)
+2.5(23.0%)
+2.5(23.0%)
+2.2(99.6%)
+2.2(99.6%)
+1.8(29.1%)
+1.8(29.1%)
Com
pare
d to
FY
2015
(Compared to Fiscal 2015)
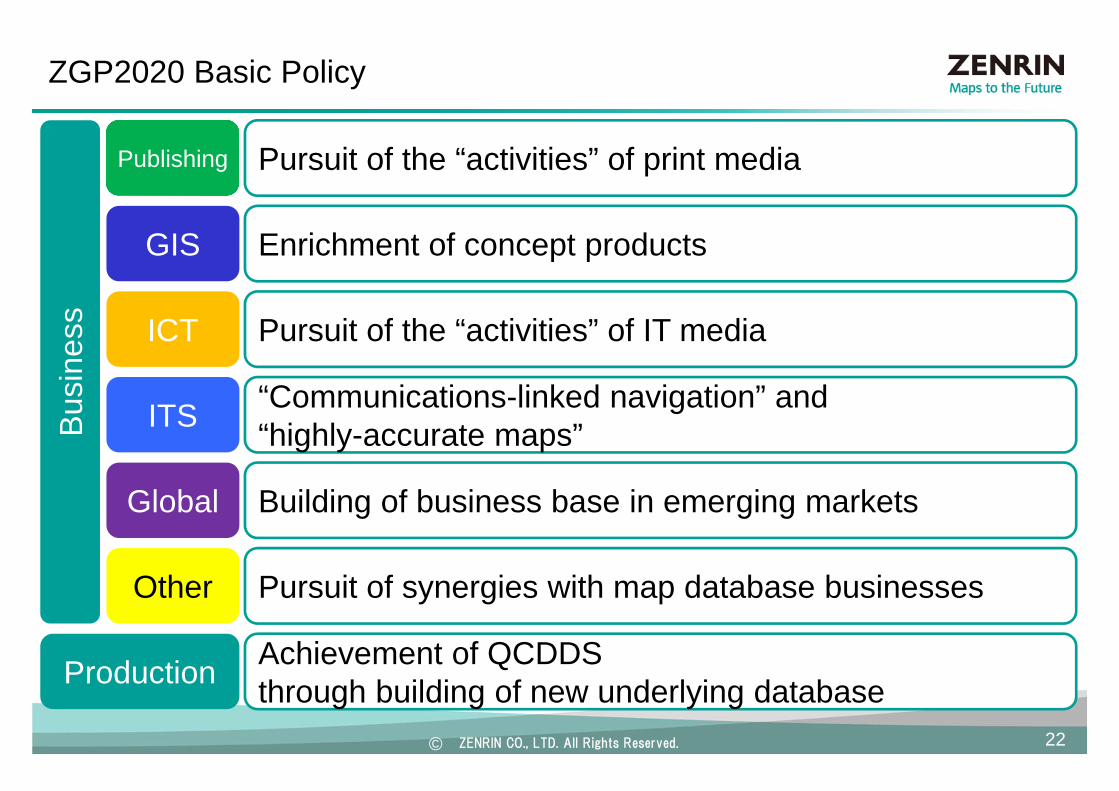
ZENRIN CO., LTD. All Rights Reserved.© 22
Achievement of QCDDS through building of new underlying database
Pursuit of the “activities” of print media
Enrichment of concept products
Pursuit of the “activities” of IT media
“Communications-linked navigation” and “highly-accurate maps”
Building of business base in emerging markets
Production
Publishing
GIS
ICT
ITS
Global
Pursuit of synergies with map database businessesOther
Bus
ines
sZGP2020 Basic Policy

ZENRIN CO., LTD. All Rights Reserved.© 23
Pursuit of the “activities” of print media
Shift from flow-type models to stock-type models
Enrichment of easily-accessible on-demand services
Shift from OEM products to ODM products
Creation of markets by looking at maps in a new concept
Publishing Business 1/2ZGP2020 Business Strategy

ZENRIN CO., LTD. All Rights Reserved.© 24
ZGP2020 Business Strategy Publishing Business 2/2
Enrichment of easily-accessible on-demand services
Convenience store chain Launch of service Number of stores
Seven-Eleven September 2005 17,569
LAWSON April 2014 11,606
FamilyMart May 2014 11,532
CircleKSunkus October 2014 6,326
Total 47,033
(As of March 2015, surveyed by ZENRIN)
“Easy and reasonable print-out service when needed and for area needed”
[Number of convenience stores offering ZENRIN residential map print-out service
Currently available at around 90% of convenience stores nationwide
◆ Enhancement of convenience through enrichment of contents and usage environment
◆ Encourage use through reinforced promotional activities
Flow of service
Printing out at the convenience store.
Printing out after making arrangements online
Touch!
Click!
Choose an area you need on the multi-copier at the store and print it out on the spot.
Pre-order the necessary area in your spare time and have it printed out right away using the multi-copier at the store.

ZENRIN CO., LTD. All Rights Reserved.©
Building of the ZENRIN GIS brand through release of products resulting from development of applications and through introduction of new pricing
25
Enrichment of concept products
Release of package products featuring a clear map-themed concept
Release of entry models for expanding the horizons of GIS use
Establishment of local government platform
Establishment of data-ring-type business model
ZGP2020 Business Strategy GIS Business 1/4

ZENRIN CO., LTD. All Rights Reserved.© 26
ZGP2020 Business Strategy GIS Business 2/4
Building of the ZENRIN GIS brand through release of products resulting from development of applications and through introduction of new pricing
“Act on special measures concerning promotion of countermeasures for vacant houses, etc.”
(Effective February 2015)
Work for grasping the present situation(about 40 local governments *Results for fiscal 2015)
By releasing products with ideas of “scenes for using” in the market, build GIS brand that is easy to choose and use (solution, selection, package)
Extractingtargets
Conductingresearch DB maintenance
Formulation ofplans for continuous
measures
Countermeasures for vacant houses, etc. by local governments
Responseactivities
“The rise in vacant houses (approximately 8.2 million houses nationwide)”(as of October 2013)
Maintenance and management work(solution)
Social issue

ZENRIN CO., LTD. All Rights Reserved.© 27
ZGP2020 Business Strategy GIS Business 3/4
Release of package products featuring a clear map-themed concept
“Business category series” Series (1)Product name: ZENRIN GIS Package Real EstateDate of release: April 2013
“Business category series” Series (2) Product name: ZENRIN GIS Package ConstructionDate of release: April 2014
Acceleration of development of applications for GIS package products specializing in a business category or business content
Plan to increase product lineup from
2 to 10 titles by 2020
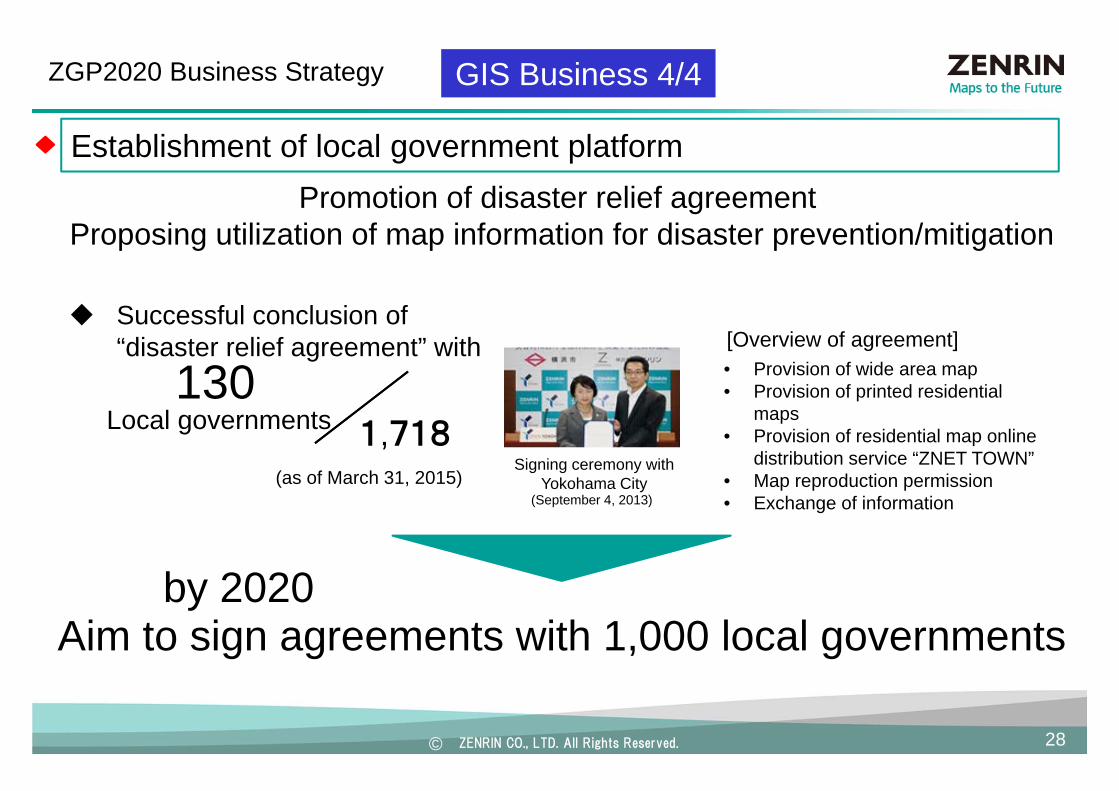
ZENRIN CO., LTD. All Rights Reserved.© 28
ZGP2020 Business Strategy GIS Business 4/4
Establishment of local government platformPromotion of disaster relief agreement
Proposing utilization of map information for disaster prevention/mitigation
130Local governments
Successful conclusion of “disaster relief agreement” with
(as of March 31, 2015)
[Overview of agreement]• Provision of wide area map• Provision of printed residential
maps• Provision of residential map online
distribution service “ZNET TOWN”• Map reproduction permission • Exchange of information (September 4, 2013)
Signing ceremony with Yokohama City
1,718
Aim to sign agreements with 1,000 local governmentsby 2020

ZENRIN CO., LTD. All Rights Reserved.© 29
Enhancement of map DB utility value through provision of 4D Geospatial Information contents
Launch of advertising revenue sharing model in web business
Digital signage market penetration through provision of 4D Geospatial Information map DBExpansion of location information business in “tourism” backed by the sector’s growth potential
Launch of 3D solutions through expansion of scope of utilization of 3D data
Pursuit of the “activities” of IT media
ZGP2020 Business Strategy ICT Business 1/2

ZENRIN CO., LTD. All Rights Reserved.© 30
ZGP2020 Business Strategy
Digital signage market penetration through provision of 4D Geospatial Information map DBExpansion of location information business in “tourism” backed by the sector’s growth potential
ICT Business 2/2
Provision of multilingual location information solution with an eye to “increase in the number of foreign visitors to Japan”
[Introduction cases of signage]• Tokyo International
Airport• Kansai Airport Station• Roadside stations
The number of foreign visitors to Japan in 2014 broke 13 million mark!To reach 20 million in 2020!
Foreign visitors to Japan
The 2020 Tokyo
Olympic Games
Community
vitalization
× ×Devices
(smartphone, PC, signage,
etc.)
Multilingual map
Location information(Tourist information,
navigation guide, etc.)

ZENRIN CO., LTD. All Rights Reserved.© 31
“Communications-linked navigation” and “highly-accurate maps”
Enhancement of map DB utility value through provision of 4D Geospatial Information contents
Proposal of comprehensive services that combine map DB and apps
Gaining of overseas manufacturers through 3D map licensing and authoring contracts
ZGP2020 Business Strategy ITS Business 1/2
Establishment of technologies and promotion of product planning for highly-accurate maps

ZENRIN CO., LTD. All Rights Reserved.© 32
ZGP2020 Business Strategy ITS Business 2/2
Establishment of technologies and promotion of product planning for highly-accurate maps
2014 2015 2016 2017 2018 2019 2020~ 2030~
Advanced driving support on open road
Advanced driving support on freeway
Promotion of product planning to have
companies sign for OEM
Full-automated driving systems [Level 4]
All of the acceleration, steering, and control
operations are done by the automobile
(other than drivers).
Common use
Semi-automated driving systems [Level 3]
All of the acceleration, steering, and braking operations are done by the automobile.
(Drivers respond to emergencies.)
Semi-automated driving systems [Level 2]More than one of the acceleration, steering, and
braking operations is done by the automobile at the same time
Driving support systems (ITS + Automatic brake)
Demonstration experiment
Gov
ernm
ent
ZEN
RIN
◎
○△
○△
○
*Excerpt from “Roadmap related to automated driving systems” of Cross-ministerial Strategic Innovation Promotion Program (SIP) of the Cabinet Office
Preparation of highly-accurate maps
Product development
Discussion on specifications of highly-accurate maps
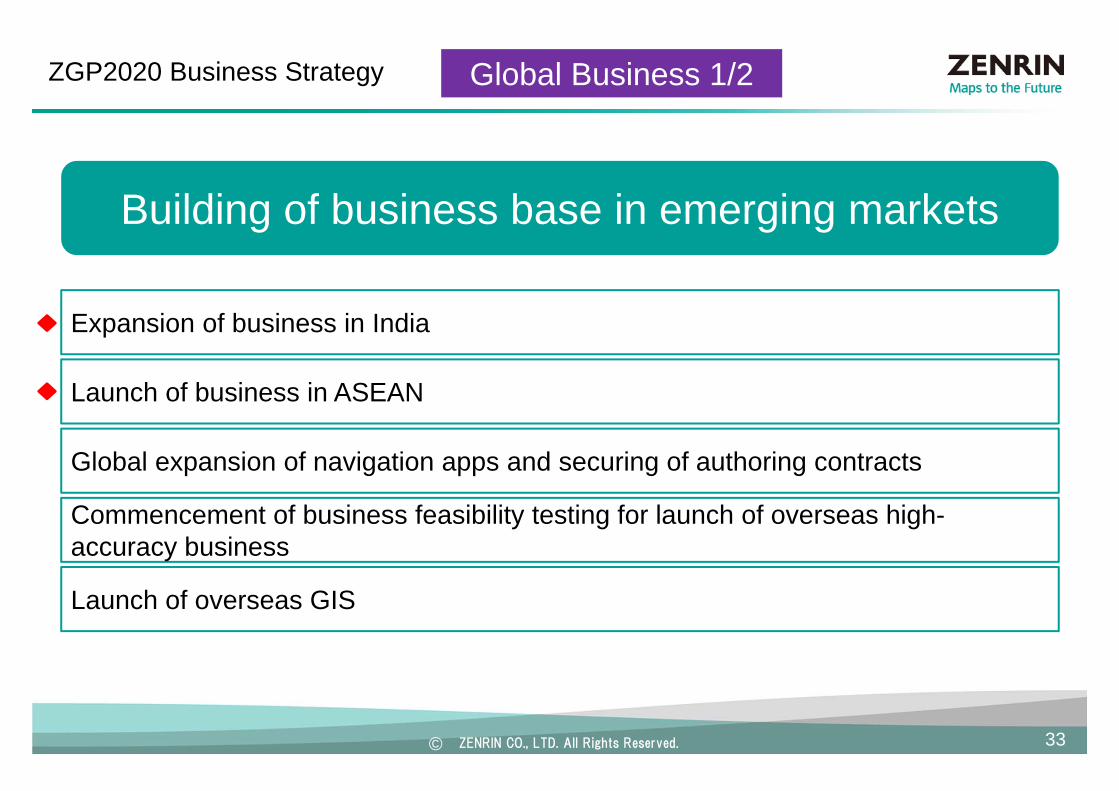
ZENRIN CO., LTD. All Rights Reserved.© 33
Building of business base in emerging markets
Expansion of business in India
Launch of business in ASEAN
Global expansion of navigation apps and securing of authoring contracts
Commencement of business feasibility testing for launch of overseas high-accuracy business
Launch of overseas GIS
ZGP2020 Business Strategy Global Business 1/2

ZENRIN CO., LTD. All Rights Reserved.© 34
ZGP2020 Business Strategy Global Business 2/2
India
ASEAN
Expansion of business in India
Launch of business in ASEANStrengthening ties with local partner (GlobeTech)
Sales and strengthening ties with affiliation company C.E. Info Systems

ZENRIN CO., LTD. All Rights Reserved.© 35
Pursuit of synergies with map database businesses
Stability of general printing business
Expansion of in-ship advertising business
ZGP2020 Business Strategy Other Business
Sales expansion through synergies with location information business

ZENRIN Co., Ltd. All Rights Reserved.© 36
Achievement of QCDDS through building of new underlying database
ZGP2020 Production Strategy
: Quality
: Cost
: Delivery
: Diversity
: Scalability
QCDDS
Production Strategy 1/2
Business Model
Residential map
Viewmap Navigation map
Product DB
MAP DB(mapping from map feature DB)
Map feature DB(map features created from information
collected in the survey layer)
Survey(information collection network)

ZENRIN CO., LTD. All Rights Reserved.© 37
ZGP2020 Production Strategy Production Strategy 2/2
Collection by purpose of use
Map DB by purpose of use
Collection of map features in the real world
Generation of map DB from map feature DB
4D Geospatial Information DB
Provision
Management
Collection
UserUser
Collection by purpose of use
Collection by purpose of use
Map DB by purpose of use
Map DB by purpose of use
Maintenance of map DB by purpose of use
Product DB・・・
・・・
Achievement of QCDDS through building of new underlying database

ZENRIN CO., LTD. All Rights Reserved.©
ZGP2020 Numerical Targets
38
FY2015Actual
FY2016Forecast
FY2018Target
FY2020Target
Consolidated Net Sales 52.2 bn yen 55.5 bn yen 60.0 bn yen 70.0 bn yen
Consolidated Operating Income(Margin)
2.3 bn yen(4.6%)
2.5 bn yen(4.5%)
5.0 bn yen(8.3%)
10.0 bn yen(14.2%)
ROE(Return on equity) 3.9% 4% 8% 12% or higher
DOE(Dividend on equity on a consolidated basis)
3.0% 3% or higher 3% or higher 3% or higher

ZENRIN CO., LTD. All Rights Reserved.© 39
III. Earnings Forecast for Fiscal 2016

ZENRIN CO., LTD. All Rights Reserved.©
Earnings Forecast for Fiscal 2016
40
FY2015Actual
FY2016Earnings Forecast Compared to
FY2015 % of Change
Net Sales 52,286 55,500 3,213 6.1
Operating Expenses 49,897 53,000 3,102 6.2
Operating IncomeOperating Margin
2,3894.6%
2,5004.5%
110-0.1pt
4.6-
Ordinary Income 2,751 2,800 48 1.8Profit Attributable to Owners of Parent 1,464 1,500 35 2.4
(Amounts in million yen)
Earnings Forecast for Fiscal 2016ZGP2020 Initial Fiscal Year <increase in sales and increase in income>Securing of earnings from existing businesses and promotion of 4D Geospatial Information DB maintenance
Increase in sales due to securing of earnings from “GIS Business” and the “Other Business” of a consolidated subsidiary (became a subsidiary in the second half of fiscal 2015)Promotion of 4D Geospatial Information DB maintenance, while lowering existing map DB maintenance costs through productivity enhancement

ZENRIN CO., LTD. All Rights Reserved.© 41
Net Sales by Business under ZGP2020
10.19.89.48.9
9.1 9.1 9.610.2
11.412.1
10.6
14.1 14.1
12.412.4 12.312.011.310.911.3
2.8 3.02.32.22.9
7.2 6.46.06.1
7.4
0
5
10
15
20
PublishingPublishing GISGIS ICTICT ITSITS GlobalGlobal OtherOther+0.0(0.0%)
+0.1(2.0%)
+0.7(6.7%)
+0.3(3.4%)
+0.6 (29.3%)
+1.2(19.9%)C
ompa
red
to
FY20
15
FY20
12
FY20
13
FY20
14
FY20
15
FY20
16 (F
orec
ast)
(Amounts in billion yen)
Pas
t co
mpo
sitio
n (*
)
9.0 (+0.0)9.0 (+0.0) 12.6 (+1.2)12.6 (+1.2) 13.5 (+1.0)13.5 (+1.0) 10.2 (-0.7)10.2 (-0.7) 2.1 (-0.0)2.1 (-0.0) 7.8 (+1.6)7.8 (+1.6)
Integration with Advertising
Topi
cs GIS package2 new titles releasedGIS package2 new titles released
In-ship advertising by consolidated subsidiaryIn-ship advertising by consolidated subsidiary
Map data employed more and more (multilingual maps, etc.)
Map data employed more and more (multilingual maps, etc.)
Transfer of signage (from Other), access information (from GIS), etc. to ICT
Transfer of in-car navigation apps (from ICT) to ITS and Global
(*) Past composition: Net sales compiled based on the business composition used until fiscal 2015 (compared to fiscal 2015)

ZENRIN CO., LTD. All Rights Reserved.©
Briefing on Results for FY2015
Appendix
FY2016 Earnings Forecast
1) Changes in Net Sales and Income2) Segment Information3) Amount of Capital Investment, Depreciation and R&D Costs 4) Changes in Composition of Net Sales by Quarter
42

ZENRIN CO., LTD. All Rights Reserved.©
Briefing on Results for FY2015
43
Appendix 1) Changes in Net Sales and Income
52,3
22
54,9
91
53,5
89
52,2
86
55,5
00
0
10,000
20,000
30,000
40,000
50,000
60,000
70,000
80,000
12/3 13/3 14/3 15/3 16/3
Increase in sales for first time in 3 periods
Increase in income for first time in 3 periods
Net Sales Operating Income Ordinary Income Profit Attributable to Owners of Parent
Increase in income for 2 consecutive periods
Fore
cast
Act
ual
Increase in income for first time in 3 periods
4,40
8
5,58
5
3,18
0
2,38
9
2,50
0
0
1,000
2,000
3,000
4,000
5,000
6,000
7,000
12/3 13/3 14/3 15/3 16/34,
777
5,07
6
3,66
3
2,75
1
2,80
0
12/3 13/3 14/3 15/3 16/3
1,95
2
1,83
5
1,27
2
1,46
4
1,50
0
12/3 13/3 14/3 15/3 16/3
(Amounts in million yen)

ZENRIN CO., LTD. All Rights Reserved.©
Briefing on Results for FY2015
44
2) Segment Information
Sales Composition
1. Map Database Segment
Main Items: Printed residential maps, residential map databases, data for Japanese and overseas in-car navigation systems, services for smartphones, map data provision, etc. for various media/devices
2. General Printing SegmenMain Items: Commercial printing
3. OtherMain Items: Purchased products, digital signage, direct
mail delivery services, in-ship advertising
83.8%
6.4%
9.8%
Appendix
ZENRIN CO., LTD. All Rights Reserved.©
Briefing on Results for FY2015
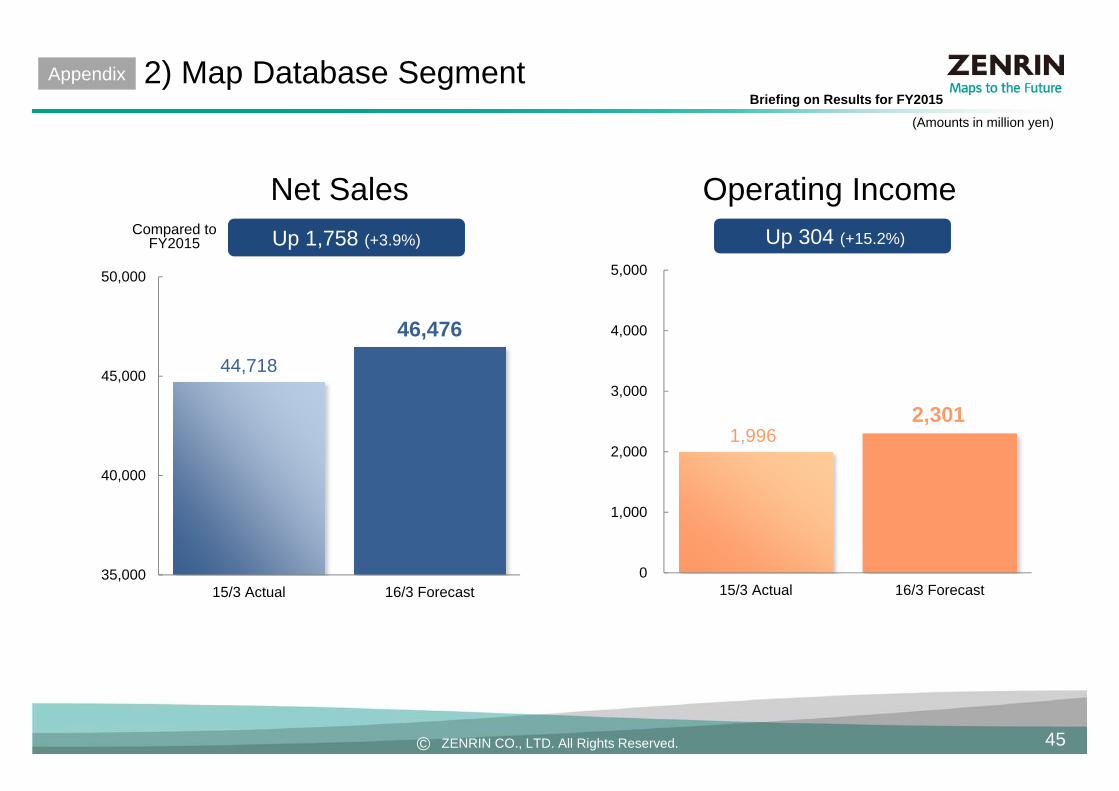
45
2) Map Database Segment
Net Sales Operating IncomeCompared to
FY2015 Up 1,758 (+3.9%) Up 304 (+15.2%)
44,718
46,476
35,000
40,000
45,000
50,000
15/3 Actual 16/3 Forecast
1,996 2,301
0
1,000
2,000
3,000
4,000
5,000
15/3 Actual 16/3 Forecast
(Amounts in million yen)
Appendix

ZENRIN CO., LTD. All Rights Reserved.©
Briefing on Results for FY2015
46
2) General Printing Segment, and Other
76 65 0
200
400
600
15/3 Actual 16/3 Forecast
Net Sales Operating IncomeCompared to
FY2015
Compared toFY2015
Gen
eral
Prin
ting
Seg
men
Oth
er(Amounts in million yen)
Up 1,649 (+43.3%) Up 105 (+59.9%)
Down193 (-5.2%) Down 11 (-14.4%)
3,754 3,561
0
3,000
6,000
15/3 Actual 16/3 Forecast
3,812
5,461
0
3,000
6,000
15/3 Actual 16/3 Forecast
176 282
0
200
400
600
15/3 Actual 16/3 Forecast
Appendix
Contribution from a subsidiary included in the scope of consolidationIn-ship (enclosing mail/packages) advertising, etc.

ZENRIN CO., LTD. All Rights Reserved.©
Briefing on Results for FY2015
47
Appendix 3) Amount of Capital Investment, Depreciation and R&D Costs
238 1,050 2,735
733 364
3,756
4,502
5,093
4,860 4,280
745
1,078
468
925 1,101
17
0
2,000
4,000
6,000
8,000
10,000
12,000
12/3 13/3 14/3 15/3 16/3 Forecast
Intangible lease assetsTangible lease assetsIntangible assetsProperty, plant and equipment
376 511
606 647 615
0
200
400
600
800
1,000
12/3 13/3 14/3 15/3 16/3 Forecast
425 456 750 946 711
2,393 2,600 3,002 3,279 3,896
615 680 784
774 774
16 9 6
4 3
0
2,000
4,000
6,000
8,000
12/3 13/3 14/3 15/3 16/3 Forecast
Depreciation of intangiblelease assetsDepreciation of tangiblelease assetsDepreciation of intangibleassetsDepreciation of property,plant and equipment
4,740
3,451 3,746
8,314
4,544
Remodeling and expansion with aging of ZENRIN-owned building
R & D CostR & D CostAmount of Capital InvestmentAmount of Capital Investment
DepreciationDepreciation
Introduction of printing machines
Product development
, etc. 6,631 6,519
5,746
5,005 5,385
(Amounts in million yen)

ZENRIN CO., LTD. All Rights Reserved.©
Briefing on Results for FY2015
48
Appendix 4) Changes in Composition of Net Sales by Quarter
20.0%
21.9%
21.1%
19.8%
23.5%
25.1%
23.7%
23.3%
44.5%
25.2%
23.3%
24.2%
24.5%
31.3%
29.7%
31.0%
32.4%
55.5%
0% 25% 50% 75% 100%
12/3
13/3
14/3
15/3
16/3(Forecast)
Q1 Q2 Q3 Q4
ZENRIN Co., Ltd. http://www.zenrin.co.jpCorporate Management Division, Management Control & IR Department
IR contact email: [email protected]