briefing paper characterising the smoke produced from ... papers/bre-trust... · this research...
TRANSCRIPT

www.bre.co.uk
Raman Chagger
Characterising the smoke produced from modern materials and evaluating smoke detectors
Briefing Paper

Contents
Abstract 02
Introduction 02
Background 03
The current test fires 04
Methodology 05
Results 06
Analysis 09
Summary of results 11
Conclusions and recommendations for further research 12
References 12
Acknowledgements 13
Characterising the smoke produced from modern materials and evaluating smoke detectors01
Introduction
The object of this research project was to investigate the smoke profiles generated in fire tests specified in the EN 54-7 (commercial) and EN 14604 (domestic) smoke detector standards, and compare them with smoke produced from burning or smouldering materials commonly found in today‘s service environment. The intention was to establish whether the current test fires are adequate for assessing smoke detector performance in a broad range of fires involving modern materials, and – if not – to make recommendations.
The research work was conducted in two phases. The first comprised of a review to identify the materials and burning conditions that would be used in Phase 2, during which fire tests were conducted.
Abstract
The test fires that are used to assess ionisation and optical smoke detectors were developed in the 1980s, but the materials now found in modern service environments have changed since then. There is now a greater use of plastics and flame retardant foams in modern buildings, but little information exists on the response of detectors to smoke generated by the burning or smouldering of such materials.
Twelve approved smoke detectors (commercial and domestic) were installed in a fire test room on the ceiling and the walls. Twenty-nine fire tests were performed using a variety of materials in flaming and smouldering conditions. In tests that produced sufficient smoke, 97.8% of devices responded with an appropriate alarm.
It was confirmed that ionisation and optical smoke detectors are attuned to detecting different types of fires. However, sufficient evidence was found to demonstrate that these detectors nevertheless respond appropriately to a broad range of fires, both within and beyond the limits of the test fires currently used to assess them.
02

Background
Both ionisation and optical smoke detectors are used in commercial and domestic environments. They use different techniques to detect smoke, making them more attuned to detecting different types of fire.
Ionisation detectors use a small radioactive source (americium-241) inside an ionisation chamber that contains charged electrodes. The chamber is arranged to allow a flow of air from outside. As the air enters it becomes ionized, generating an electric current between the charged electrodes. When smoke particles pass into the chamber the ions become attached to them and are carried away, leading to a reduction in the current. More ions are stripped away when there are many small particles, such as those generated during flaming fires. When a material is smouldering it tends to produce fewer but larger particles than it does when in flames. As these cause less current reduction, ionisation detectors are inherently less responsive to the large smoke particles generated during smouldering fires.
Optical smoke detectors typically use a smoke scatter chamber, which contains an LED source with a collimated lens that produces a beam. A photodiode is located at an angle to the beam. As smoke particles enter the chamber they interrupt the beam and the light is scattered and detected by the photodiode. This results in a voltage that can be used to determine an alarm condition. Optical detectors respond to smouldering fires very quickly, as the larger particles generated cause more scattering. Optical scatter chambers are less sensitive to small particles – and become progressively less sensitive as the smoke particle size approaches the LED wavelength used. Therefore optical smoke detectors are slower at detecting the small smoke particles generated from flaming fires. These detectors are less likely to produce false alarms from cooking fumes and steam than ionisation detectors.
As both technologies contain inherent strengths and weaknesses, this research project aimed to determine whether ionisation detectors perform poorly in certain types of smouldering fires, and if optical detectors are less responsive to certain types of flaming fires.
Characterising the smoke produced from modern materials and evaluating smoke detectors03
The current test fires
Both EN 54-7 and EN 14604 use the same methodology to identify the most challenging conditions under which to test smoke detectors. Physical tests conducted in a smoke tunnel are used to establish the orientations at which the detector is least sensitive, and to select the four least sensitive detectors from a batch of twenty.
During the fire tests the four worst performing samples are installed in the fire test room (as specified in the relevant standard) at the least sensitive orientation on the ceiling or wall. Four fire tests are then performed as follows: TF2: smouldering wood, TF3: glowing smouldering cotton, TF4: flaming plastics (polyurethane) and TF5: flaming liquid (n-heptane) fire.
The conditions in the fire test room are tightly controlled and the intention is to produce reproducible test fires.
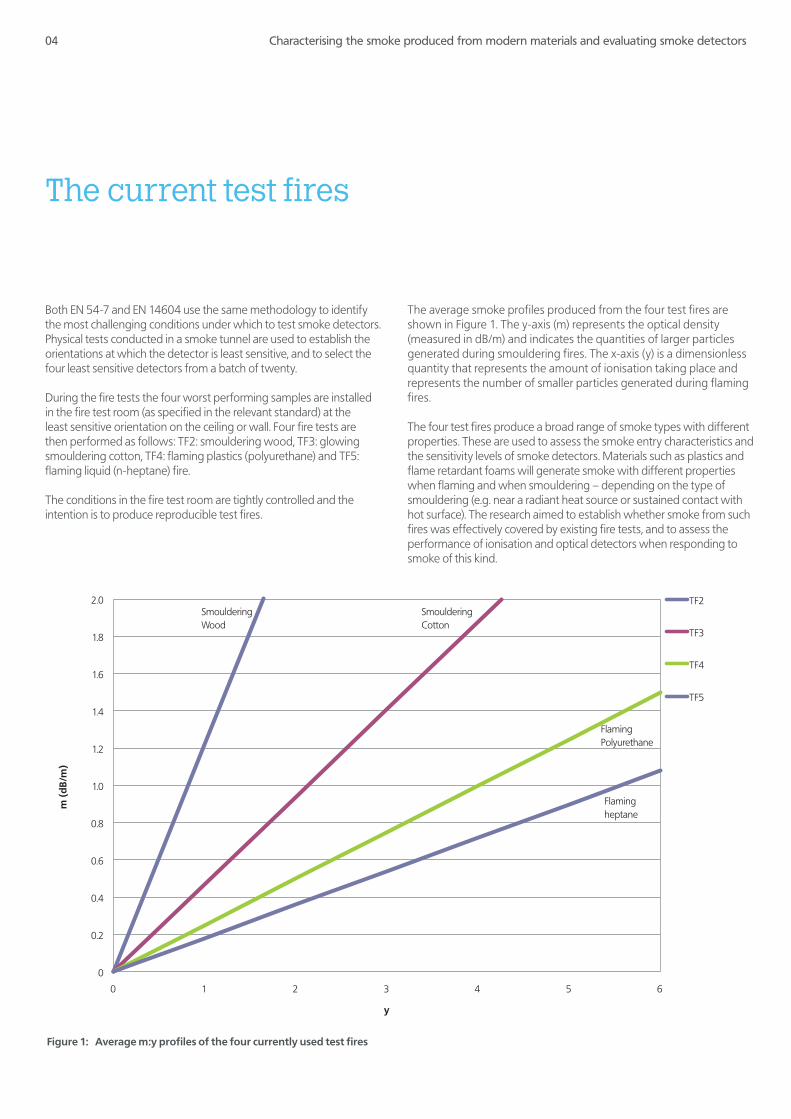
The average smoke profiles produced from the four test fires are shown in Figure 1. The y-axis (m) represents the optical density (measured in dB/m) and indicates the quantities of larger particles generated during smouldering fires. The x-axis (y) is a dimensionless quantity that represents the amount of ionisation taking place and represents the number of smaller particles generated during flaming fires.
The four test fires produce a broad range of smoke types with different properties. These are used to assess the smoke entry characteristics and the sensitivity levels of smoke detectors. Materials such as plastics and flame retardant foams will generate smoke with different properties when flaming and when smouldering – depending on the type of smouldering (e.g. near a radiant heat source or sustained contact with hot surface). The research aimed to establish whether smoke from such fires was effectively covered by existing fire tests, and to assess the performance of ionisation and optical detectors when responding to smoke of this kind.
0
0.2
0.4
0.6
0.8
1.0
1.2
1.4
1.6
1.8
2.0
0 1 2 3 4 5 6
m (
dB/m
)
y
TF2
TF3
TF4
TF5
SmoulderingCotton
SmoulderingWood
FlamingPolyurethane
Flamingheptane
Figure 1: Average m:y profiles of the four currently used test fires
Characterising the smoke produced from modern materials and evaluating smoke detectors04
Methodology
During phase 1 papers were reviewed and many experts were contacted to determine whether there were any known cases of detectors not responding to certain types of smoke. The data gathered during this exercise helped to establish the test fires to be performed and the supplementary measuring equipment to be used.
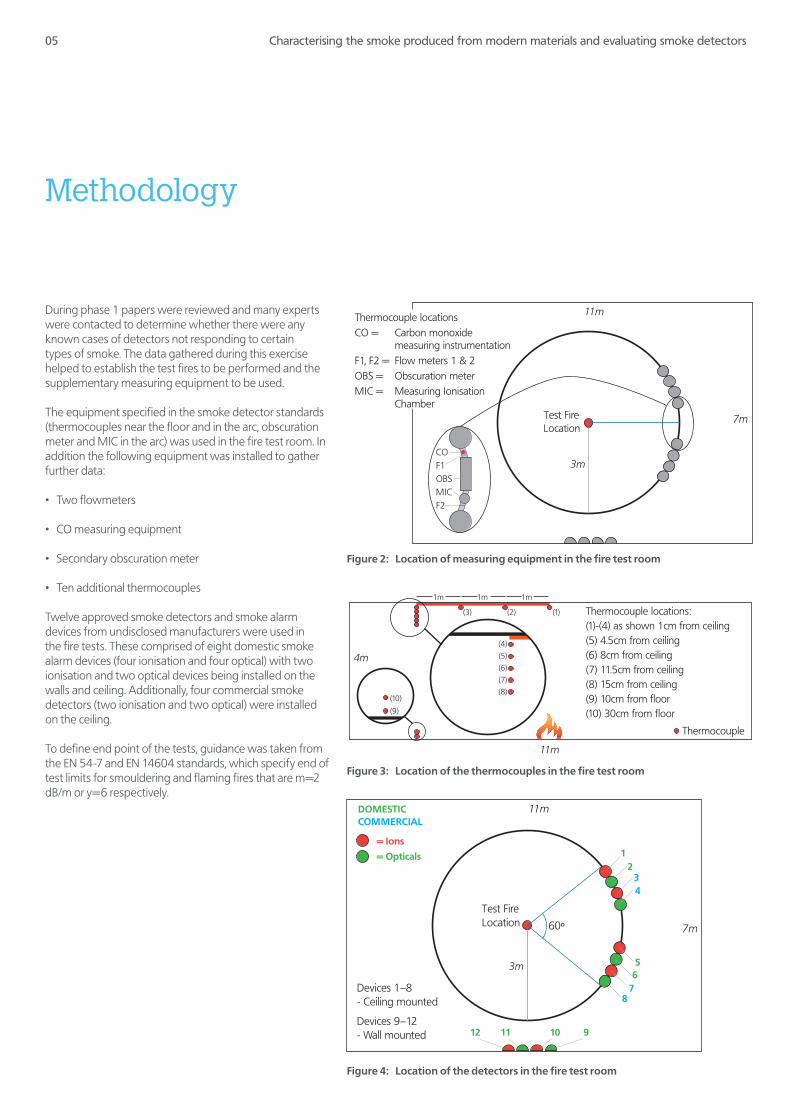
The equipment specified in the smoke detector standards (thermocouples near the floor and in the arc, obscuration meter and MIC in the arc) was used in the fire test room. In addition the following equipment was installed to gather further data:
• Two flowmeters
• CO measuring equipment
• Secondary obscuration meter
• Ten additional thermocouples
Twelve approved smoke detectors and smoke alarm devices from undisclosed manufacturers were used in the fire tests. These comprised of eight domestic smoke alarm devices (four ionisation and four optical) with two ionisation and two optical devices being installed on the walls and ceiling. Additionally, four commercial smoke detectors (two ionisation and two optical) were installed on the ceiling.
To define end point of the tests, guidance was taken from the EN 54-7 and EN 14604 standards, which specify end of test limits for smouldering and flaming fires that are m=2 dB/m or y=6 respectively.
Figure 2: Location of measuring equipment in the fire test room
Figure 3: Location of the thermocouples in the fire test room
Figure 4: Location of the detectors in the fire test room
7m
3m
11m
Test FireLocation
COF1OBSMICF2
Thermocouple locationsCO = Carbon monoxide measuring instrumentationF1, F2 = Flow meters 1 & 2OBS = Obscuration meterMIC = Measuring Ionisation Chamber
4m
11m
Thermocouple locations:(1)-(4) as shown 1cm from ceiling(5) 4.5cm from ceiling(6) 8cm from ceiling(7) 11.5cm from ceiling(8) 15cm from ceiling(9) 10cm from floor(10) 30cm from floor
(10)
(9)
(3)
1m 1m 1m
(2) (1)
(4)
(5)
(6)
(7)
(8)
Thermocouple
7m
3m
11m
Devices 1–8 - Ceiling mounted
Devices 9–12 - Wall mounted
Test FireLocation
12
34
56
78
12 11 10 9
60º
DOMESTICCOMMERCIAL
= Ions
= Opticals
Characterising the smoke produced from modern materials and evaluating smoke detectors05

Results
Twenty-nine test fires were conducted including the four test fires specified in EN 54-7 and EN 14604. Of these 11 were smouldering fires, 16 were flaming fires and two started off smouldering and went on to become flaming fires (shown as S-F in the table right). The table right summarises the tests that were conducted, the fuels that were used and the mode of smoke production.
All devices were periodically replaced, as exposure to the smoke from a number of tests could cause contamination in the smoke chambers that could potentially affect their response. The second column indicates when all 12 were replaced with brand new devices of the same model, i.e. at tests 1, 10 and 22.
Table 1: The 29 tests conducted in the EN fire test room
Test no. Device set Fuel Mode of smoke production
1 1 of 3 TF2- Beech wood sticks Smouldering
2 1 of 3 TF4- Non flame retardant PU Flaming
3 1 of 3 TF5- N-heptane + Toluene Flaming
4 1 of 3 TF8- Decalin (from ISO 7240-9) Flaming
5 1 of 3 TF3- Cotton wicks Smouldering
6 1 of 3 TF1- Wooden sticks (from ISO 7240-9) Flaming
7 1 of 3 Regular unleaded petrol Flaming
8 1 of 3 Premium unleaded petrol Flaming
9 1 of 3 MDF Flaming
10 2 of 3 TF2- Beech wood sticks Smouldering
11 2 of 3 PVC cable Smouldering
12 2 of 3 Flame retardant PU foam Flaming
13 2 of 3 Flame retardant PU foam Smouldering
14 2 of 3 Flame retardant PU foam Smouldering (radiant)
15 2 of 3 Sunflower oil S-F
16 2 of 3 Newspaper Smouldering
17 2 of 3 Bedding Polyester Smouldering
18 2 of 3 Bedding Polyester Flaming
19 2 of 3 Nylon (small) Flaming
20 2 of 3 Nylon (medium) Flaming
21 2 of 3 Nylon Smouldering
22 3 of 3 Bedding Polyester Smouldering
23 3 of 3 ABS Flaming
24 3 of 3 Polystyrene S-F
25 3 of 3 Polycarbonate Flaming
26 3 of 3 Polycarbonate Flaming
27 3 of 3 Polyethylene Flaming
28 3 of 3 Polyethylene Flaming
29 3 of 3 ABS Smouldering
Unless otherwise specified all smouldering fires were conducted in the sustained mode with the fuel in contact with a hot surface that was increasing in temperature throughout the test.
Characterising the smoke produced from modern materials and evaluating smoke detectors06

The results from two of these tests are shown in Figures 5 and 6 (right).
Test 9 demonstrates the rapid response of the ionisation detectors (both commercial and domestic) to the small particles generated during the flaming fire. The response from the opticals is slightly delayed until the fire increases in size and the radiant heat leads to more smouldering particles being produced from the MDF. All detectors respond before the defined end of test for a flaming fire (y=6) is reached.
Test 24 demonstrates the difference in response between ionisation and optical detectors to a smouldering then flaming fire. At first the polystyrene fuel is smouldering due to the increasing temperature of the steel plate on which it rests. This leads to all 6 photoelectric detectors responding before the defined end of test for a smouldering fire (m=2 dB/m) is reached. When the temperature of the polystyrene reaches ignition point (shown as S-F on the chart) the fuel combusts. Within a few seconds the first ionisation detector responds and all ionisation detectors are in alarm before the defined end of test for a flaming fire (y=6) is reached.
-7.5
-2.5
2.5
7.5
12.5
17.5
22.5
27.5
32.5
37.5
-2
0
2
4
6
8
10
150 200 250 300 350 400 450 500 550 600 650
CO (
ppm
)
m (
dB/m
) an
d y
Time (sec)
Commercial Ceiling Domestic Ceiling Domestic Wall# Device number
Photo
Ion
Figure 5: Test 9- MDF in flaming mode
Figure 6: Test 24- Polystyrene first smouldering then flaming
-10
0
10
20
30
40
50
60
70
-1
0
1
2
3
4
5
6
7
8
900 950 1000 1050 1100 1150 1200 1250
CO (
ppm
)
m (
dB/m
) an
d y
Time (sec)
Commercial Ceiling Domestic Ceiling Domestic Wall# Device number
Photo
Ion
Characterising the smoke produced from modern materials and evaluating smoke detectors07

Figure 7: Tests 1 & 10- Smouldering beech wood sticks (TF2) in the fire test room
Figure 8: Test 3- Flaming n-heptane fire (TF5) in the fire test room
Characterising the smoke produced from modern materials and evaluating smoke detectors08
Analysis
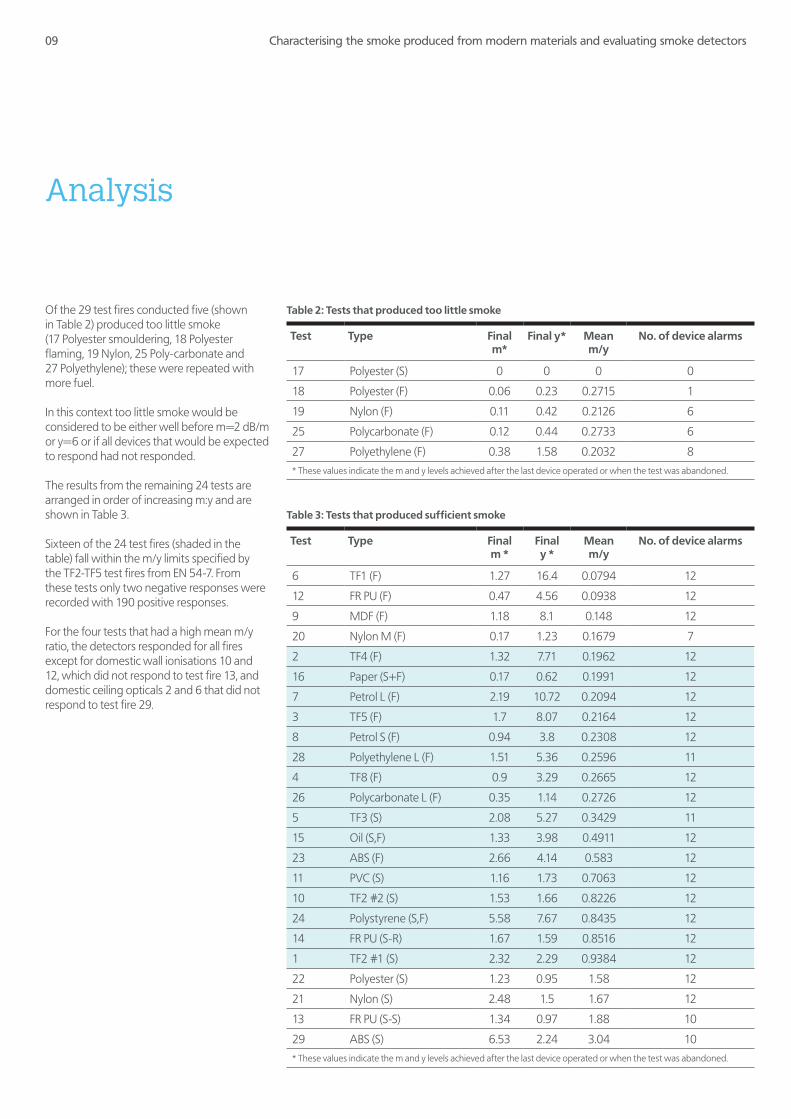
Of the 29 test fires conducted five (shown in Table 2) produced too little smoke (17 Polyester smouldering, 18 Polyester flaming, 19 Nylon, 25 Poly-carbonate and 27 Polyethylene); these were repeated with more fuel.
In this context too little smoke would be considered to be either well before m=2 dB/m or y=6 or if all devices that would be expected to respond had not responded.
The results from the remaining 24 tests are arranged in order of increasing m:y and are shown in Table 3.
Sixteen of the 24 test fires (shaded in the table) fall within the m/y limits specified by the TF2-TF5 test fires from EN 54-7. From these tests only two negative responses were recorded with 190 positive responses.
For the four tests that had a high mean m/y ratio, the detectors responded for all fires except for domestic wall ionisations 10 and 12, which did not respond to test fire 13, and domestic ceiling opticals 2 and 6 that did not respond to test fire 29.
Table 2: Tests that produced too little smoke
Test Type Final m*
Final y* Mean m/y
No. of device alarms
17 Polyester (S) 0 0 0 0
18 Polyester (F) 0.06 0.23 0.2715 1
19 Nylon (F) 0.11 0.42 0.2126 6
25 Polycarbonate (F) 0.12 0.44 0.2733 6
27 Polyethylene (F) 0.38 1.58 0.2032 8
* These values indicate the m and y levels achieved after the last device operated or when the test was abandoned.
Table 3: Tests that produced sufficient smoke
Test Type Final m *
Final y *
Mean m/y
No. of device alarms
6 TF1 (F) 1.27 16.4 0.0794 12
12 FR PU (F) 0.47 4.56 0.0938 12
9 MDF (F) 1.18 8.1 0.148 12
20 Nylon M (F) 0.17 1.23 0.1679 7
2 TF4 (F) 1.32 7.71 0.1962 12
16 Paper (S+F) 0.17 0.62 0.1991 12
7 Petrol L (F) 2.19 10.72 0.2094 12
3 TF5 (F) 1.7 8.07 0.2164 12
8 Petrol S (F) 0.94 3.8 0.2308 12
28 Polyethylene L (F) 1.51 5.36 0.2596 11
4 TF8 (F) 0.9 3.29 0.2665 12
26 Polycarbonate L (F) 0.35 1.14 0.2726 12
5 TF3 (S) 2.08 5.27 0.3429 11
15 Oil (S,F) 1.33 3.98 0.4911 12
23 ABS (F) 2.66 4.14 0.583 12
11 PVC (S) 1.16 1.73 0.7063 12
10 TF2 #2 (S) 1.53 1.66 0.8226 12
24 Polystyrene (S,F) 5.58 7.67 0.8435 12
14 FR PU (S-R) 1.67 1.59 0.8516 12
1 TF2 #1 (S) 2.32 2.29 0.9384 12
22 Polyester (S) 1.23 0.95 1.58 12
21 Nylon (S) 2.48 1.5 1.67 12
13 FR PU (S-S) 1.34 0.97 1.88 10
29 ABS (S) 6.53 2.24 3.04 10
* These values indicate the m and y levels achieved after the last device operated or when the test was abandoned.
Characterising the smoke produced from modern materials and evaluating smoke detectors09

For the four tests that had a low mean m/y ratio the detectors responded for all fires except for five optical devices that did not respond to test 20. This is most likely due to the relatively small size of the fire, as the peak m and y values generated during this fire were significantly lower than the other three fires.
It is suspected that if enough smoke had been generated during test fire 20 then all 12 devices would have responded. However this result has not been qualified, so from the results of the remaining 23 fires we effectively have six no responses and 270 responses. This represents positive responses 97.8% of the time. The six no responses are attributed to the inconsistent response of one particular type of detector and suspected contamination for the remaining ones.
Even though no statistical data was gathered by repeating the same tests, the results do provide evidence of the response characteristics for the types of detectors (optical or ion) to a variety of smoke types produced in smouldering and flaming modes.
Data gathered from the additional equipment installed in the fire test room suggests that the limits specified in EN 54-7 in terms of the working volume and temperature distribution are adequate and do not need to be refined. However, the following recommendations are made: – Assess whether the number of directional
dependence measurements should be increased for domestic smoke detectors due to the asymmetrical design.
– To improve reproducibility between test laboratories, the location at which the temperature near the floor is measured should be more clearly specified in EN 54-7.
0
0.2
0.4
0.6
0.8
1.0
1.2
0 1 2 3 4 5 6
m (
dB/m
)
y
TF5 (average)
Nylon
MDF
FR Polyurethane
TF1
m:y (dB/m)TF5 = 0.18Nylon = 0.168MDF = 0.148FR PU = 0.094TF1 = 0.0794
0
0.2
0.4
0.6
0.8
1.0
1.2
1.4
1.6
1.8
2.0
0 0.5 1 1.5
m (
dB/m
)
y
TF2 (average)
Polyester
Nylon
FR Polyurethane
ABS m:y (dB/m)
TF2 = 1.22
Polyester = 1.58
Nylon = 1.67
FR PU = 1.88
ABS = 3.04
Figure 10: The 4 flaming fires with m/y values outside the TF5 range
Figure 9: The four smouldering fires with m/y values outside the TF2 range
Characterising the smoke produced from modern materials and evaluating smoke detectors10

Summary of results
Of the 29 test fires, five were considered to be too small and had to be repeated with more fuel. Of the completed 24 test fires:
– 16 were found to be within the m/y range of smoke types bounded by TF2 and TF5;
– four smouldering fires were found to be beyond the (m/y) limits for a TF2;
– four flaming fires were found to be beyond the (m/y) limits for a TF5.
The m/y ratio for the TF1 flaming fire was found to be the worst case of all the flaming fires. This indicates that a defined fire exists for the flaming test fire limit assuming m/y is the appropriate measurement.
For the smouldering tests carried out beyond the TF2 limit, no defined test exists. The m/y ratio for the smouldering ABS fire (29) was significantly higher than the others.
The test fires TF2-TF5 do cover most general purpose applications as a real fire is unlikely to involve only a single type of material. As more materials with different smoke characteristics are involved in the fire the likelihood of detection increases.
However, it should be noted that smouldering fires can continue for a long time with only one material being involved, potentially leading to the production of toxic gases in fatal concentrations. An example of this would be bedding in contact with a heat source such as a lit cigarette. In this case an ionisation detector may not respond and therefore should not be sited in locations where such a scenario is possible. In contrast a flaming fire will eventually produce sufficient heat that will radiate onto other materials and lead to the production of smouldering smoke to which the optical detectors would be expected to respond.
Twelve smoke detectors, eight of which were installed on the ceiling and four on the wall, were exposed to the smoke from a variety of test fires and responded with a 97.8% pass rate.
Characterising the smoke produced from modern materials and evaluating smoke detectors11

Conclusions and recommendations for further research
The aim of this research was to measure the smoke characteristics of a number of test fires using modern materials, and assess them against the test fires specified in EN 54-7 and EN 14604.
The research has demonstrated that commercial and domestic approved ionisation and optical smoke detectors respond to a broad range of fires with m/y ratios within and beyond the fire test limits of EN 54-7 and EN 14604.
The fire tests specified in EN 54-7 and EN 14604 are considered to be appropriate and are sufficiently wide in terms of distribution of smoke characteristics.
Both ionisation and optical smoke detectors are attuned to detecting certain types of fire. In order to ensure that the most appropriate type of device is installed, guidance on the appropriate use of ionisation and optical smoke detectors should be sought from relevant codes of practice.
Recommendations for further work
– Assessment of the performance of a variety of optical heat multi-sensor detectors to some of the fires conducted during this research programme.
– Research into a repeatable smouldering fire with an m/y ratio > 3.0 dB/m with a better m/y profile.
– Research into an alternate realistic flaming fire with an m/y ratio < 0.1 dB/m such as flaming flame retardant poly-urethane.
References
(1) EN 54-7: 2000 + A1 June 2002 + A2 July 2006. Fire detection & fire alarm systems Part 7: Smoke detectors – point detectors using scattered light, transmitted light or ionization. European Committee for Standardisation. Central Secretariat, Rue de Stassart 36, B-1050 Brussels.
(2) EN 14604: 2005. Smoke alarm devices. European Committee for Standardisation. Central Secretariat, Rue de Stassart 36, B-1050 Brussels.
(3) ISO/TS 7240-9:2012(en) Fire detection and alarm systems — Part 9: Test fires for fire detectors.
Characterising the smoke produced from modern materials and evaluating smoke detectors12

Acknowledgements
The author would like to thank the following for their voluntary contributions to this research project:
– Gent by Honeywell
– Hochiki Europe (UK) Ltd
– Protec Fire Detection PLC
– Sprue Safety Products Ltd
– System Sensor Europe
– Tyco Fire Protection Products
– Xtralis
The author would also like to thank the BRE Trust for the funding it provided for this research project
Characterising the smoke produced from modern materials and evaluating smoke detectors13

BRE Trust
Watford, Herts WD25 9XX
T +44 (0)333 321 8811 E [email protected] W www.bre.co.uk
BRE Trust The BRE Trust uses profits made by BRE Group to fund new research and education programmes, that will help it meet its goal of ‘building a better world together’.
The BRE Trust is a registered charity in England & Wales:
No. 1092193, and Scotland: No. SC039320.
7921
6 Te
st Fi
res B
riefin
g Pa
per ©
BRE
201
4