brighter together - esb group
TRANSCRIPT

BRIGHTERTOGETHER

CO
RP
OR
ATE G
OV
ER
NA
NC
E
02
FINA
NC
IAL S
TATEM
EN
TS
03
01
STR
ATEGY
AN
D P
ER
FOR
MA
NC
E
ABOUT ESB ESB was established in 1927 as a statutory body under the Electricity (Supply) Act 1927. With a holding of 96.1%, ESB is majority owned by the Irish Government. The remaining 3.9% is held by the trustees of an Employee Share Ownership Plan. As a strong, diversified, vertically integrated utility, ESB operates across the electricity market, from generation through transmission and distribution, to supply of customers, with an expanding presence in Great Britain’s generation and supply markets. In addition, we extract further value at certain points along this chain by supplying gas and using our networks to carry fibre for telecommunications. ESB is a leading Irish utility with a regulated asset base (RAB) of approximately €10.2 billion (comprising ESB Networks €8.4 billion and NIE Networks €1.8 billion), a 29% share of generation in the all-island market and a significant supply business supplying electricity and gas to over 1.5 million customers throughout the island of Ireland and Great Britain. ESB will continue to grow the scale of its generation, trading and supply businesses so that it can continue to compete within the all-island's competitive environment. ESB is focused on providing excellent customer service and maintaining its financial strength. As at 31 December 2020, ESB Group employed over 7,900 people.
BRIGHTER TOGETHERESB is making a stand for Ireland’s future, a future powered by clean, sustainable electricity. We are committed to leading the transition to a reliable, affordable, low-carbon energy future, a future that protects our customers and the economy by maintaining the security and affordability of energy.
We are investing and innovating across our business to make this a reality. We are developing new renewable sources of generation and flexible, low-carbon backup generation. We are also reinforcing and enhancing our network to accommodate unprecedented volumes of distributed energy resources and developing customer-led solutions that will empower everyone in society to live cleaner, more sustainable lives, powered by electricity.
2 ESB Annual Report 2020 - Brighter Together ESB Annual Report 2020 3

CHAPTER 1 STRATEGY & PERFORMANCE
BUSINESS OVERVIEW 9Chairman’s Statement 10Chief Executive’s Review 12ESB at a Glance 14Highlights 15
STRATEGY, BUSINESS MODEL, RISK REPORT, AND KEY PERFORMANCE INDICATORS (KPIs) 16Strategy 17Business Model 22Risk Report 24Key Performance Indicators (KPIs) 40
OPERATING AND FINANCIAL REVIEW 43 Executive Team 44Market Structure and Operating Environment 2020 46Financial Review 52Generation and Trading (GT) 58ESB Networks 60Northern Ireland Electricity Networks (NIE Networks) 62Customer Solutions 64Engineering and Major Projects 66Enterprise Services 67
RESPONSIBLE BUSINESS REPORT 69Overview 70People 70 Safety 72Corporate Social Responsibility (CSR) 74Environment and Sustainability 76Using our Profits in a Sustainable Way 80
CHAPTER 2 CORPORATE GOVERNANCE 82
The Board in 2020 84Chairman’s Corporate Governance Statement 88The Board’s Governance Report 90Audit and Risk Committee Report 101Board Committees in 2020 106Board Members’ Report 108
CHAPTER 3 FINANCIAL STATEMENTS 110
Statement of Board Members’ Responsibilities 113Independent Auditor’s Report to the Stockholders of Electricity Supply Board (ESB) 114Financial Statements 128Prompt Payments Act 212Glossary 213
*Before exceptional items. See Financial Review page 52.
*2019 re-stated
CO
RP
OR
ATE G
OV
ER
NA
NC
E
02
FINA
NC
IAL S
TATEM
EN
TS
03
01
STR
ATEGY
AN
D P
ER
FOR
MA
NC
E4 ESB Annual Report 2020 - Brighter Together ESB Annual Report 2020 5
TOTAL ASSETS €’M NET DEBT €’M
GENERATION ALL-ISLAND MARKET SHARESUPPLY ALL-ISLAND MARKET SHARE
**After exceptional items (non-impairment). See Financial Review page52.
OPERATING PROFIT* €’M EBITDA** €’M

CO
RP
OR
ATE G
OV
ER
NA
NC
E
02
FINA
NC
IAL S
TATEM
EN
TS
03
01
STR
ATEGY
AN
D P
ER
FOR
MA
NC
E
STRATEGY AND PERFORMANCE
9 Business Overview
16 Strategy, Business Model, Risk Report
and Key Performance Indicators (KPIs)
43 Operating and Financial Review
69 Responsible Business Report
6 ESB Annual Report 2020 - Brighter Together ESB Annual Report 2020 7

remove this PAGES column please
8 ESB Annual Report 2020 - Brighter Together ESB Annual Report 2020 9
10 Chairman’s Statement
12 Chief Executive’s Review
14 ESB at a Glance
15 Highlights
NON-FINANCIAL INFORMATIONAs a statutory body, ESB is not subject to the disclosure requirements prescribed in the European Union (Disclosure of non-financial and
diversity information by certain large undertakings and Groups) Regulations 2017. ESB seeks to follow best practice and discloses a wide
range of non-financial information under the GRI (Global Reporting Initiative) standard in its Sustainability Report. The guide below illustrates
where to find the required non-financial information and non-financial KPIs in addition to the ESB Group policies which underpin these areas.
REQUIREMENT RELEVANT POLICIES SECTION IN ANNUAL REPORT
Environmental Environmental Management and Sustainability Policy Environment and Sustainability
Employee and Social Cultural Diversity Policy
Group Procurement Policy
ESB Equal Opportunities and Diversity Code of Practice
Health & Safety Policy
Whistleblowing and Protected Disclosures Policy
ESB Code of Ethics and WayWeWork
Responsible Business Report
Human Rights Modern Slavery Policy
ESB Code of Ethics
Board Members' Report
Anti-Corruption and Bribery
Anti-Bribery, Corruption and Fraud Policy
ESB Code of Ethics and WayWeWork
Audit and Risk Committee Report
Business Model Business Model
Principal Risks Risk Management Policy
Risk Management and Governance Framework Policy
Risk Report
Non-Financial KPIs Key Performance Indicators (KPIs)
The Group also publishes a comprehensive 'ESB Sustainability Report' which details ESB's sustainability strategy, corporate social
responsibilities and commitments to social matters. The 2020 Sustainability Report will be published on the ESB website in April 2021.
CO
RP
OR
ATE G
OV
ER
NA
NC
E
02
FINA
NC
IAL S
TATEM
EN
TS
03
01
STR
ATEGY
AN
D P
ER
FOR
MA
NC
E

CO
RP
OR
ATE G
OV
ER
NA
NC
E
02
FINA
NC
IAL S
TATEM
EN
TS
03
01
STR
ATEGY
AN
D P
ER
FOR
MA
NC
E10 ESB Annual Report 2020 - Brighter Together ESB Annual Report 2020 11
Diversity & Inclusion strategy this year and we look forward to engaging on the positive changes the strategy will bring about.
In terms of gender balance and diversity on the Board, the Board noted the publication of the new Annex to the Code of Practice for the Governance of State Bodies 2016 (the Code) which urges State bodies like ESB to lead the way in seeking to achieve gender balanced and diverse boards. The Board’s Code of Conduct, approved in May 2020, specifically addresses diversity and inclusion by calling out the value of diversity of thought and experience in the board room.
As Chairman, my role is to ensure that the Board is aware of gender balance and that we have a plan to address any imbalance. I will be assisting ESB’s Government shareholders in drawing up specifications for board appointments and ensuring the benefits of diversity, as required under the Code are taken into consideration.
OUR HERITAGE In January 2020, ESB’s new purpose-built archive was formally opened. ESB’s history goes back almost as far as the founding of the State and is inextricably linked with the development of modern Ireland. Our story reflects changing economic, social and cultural changes over nearly a century, and contains lessons and insights that remain relevant to the world we live in today and the decisions that are facing us. The story of how ESB overcame the challenges of bringing electricity to the nation is fascinating, not least because it mirrors so many of the issues that we still face today, whether that is in making investment decisions and technology choices, or engaging with the public around new concepts and ideas.
Another significant milestone in the history of ESB generation came with the closure in mid December of the Midlands Peat Stations after 70 years of operation. For seven decades, the generation of electricity from peat has contributed enormously to the country’s security of electricity supply, and to the economic and social fabric of rural Ireland, and the communities where they were located. The Board recognises the contribution, deep pride and commitment of our colleagues past and present in the Midlands who, through the decades, have made peat such a key part of ESB’s heritage. The next chapter is already being written.
on delivering value for our customers and our commitment to the safety and wellbeing of our employees.
The Board welcomes the publication of the final determination of the ESB Networks five-year Price Review (2021 – 2025) by the Commission for Regulation of Utilities in December. The review determines the work programme, allowances and revenues for ESB Networks for the next five years and secures the funding required for a safe, secure and reliable electricity network.
We are pleased that the outcome will also enable the targets for electrification and decarbonisation set out in the Government's Climate Action Plan to be delivered.
The Board has set an ambitious target for renewables by 2030. Renewables and pumped hydro now represents over 20% of ESB’s installed generation capacity and is growing. In 2020, ESB acquired 50% of the Inch Cape Offshore Wind Farm Project off the coast of Scotland, commissioned the Grousemount (Co. Kerry) wind farm in Ireland and continued to work with our partners on the development of offshore and onshore renewables projects. 2021 will be another pivotal year for transformation of the generation portfolio.
Energy retail remains a very competitive marketplace. In the all island electricity market, Electric Ireland has a market share of 34%. Growing our retail presence in Great Britain continues to be a priority as we drive for scale and deliver the digital solutions and energy solutions all of our customers require. The business is actively supporting our customers during COVID-19, with an emphasis on our vulnerable customers and the Small and Medium Enterprise sector who have been hardest hit. Our Values of being trusted and caring continue to inform our customer activities and propositions.
DIVERSITY & INCLUSIONESB strives to foster an effective and inclusive culture where people engage, challenge and feel connected to the purpose of the company, their colleagues, customers and community. Diversity and inclusion are business imperatives impacting the way we work and future success.
Employee surveys indicate a strong sense of pride in what ESB has done to promote a diverse and inclusive organisation, but there is more to do before we can say that we are a truly inclusive organisation. The Board was briefed on the new
FINANCIAL PERFORMANCE HIGHLIGHTSIn the context of a challenging operating environment, brought about by the impact of the COVID-19 pandemic, ESB delivered an operating profit of €616 million and a profit after tax of €357 million in 2020 (both before exceptional items). We maintained our Credit Ratings at A-/A3 (BBB+ standalone) which is critical for our investment programme as we look to lead the transition to a low-carbon energy future.
In line with ESB’s dividend policy, the Board is recommending a dividend of €81 million for 2020, bringing total dividends paid to €1.2 billion over the last decade.
COVID-192020 dawned as a new decade full of hope and promise. Yet within a few short months, COVID-19 turned our lives upside down. As we reflect on the hardships of this current crisis, the Board’s conviction in 'Our Purpose' – to lead the transition to a low-carbon energy future – is stronger than ever. COVID-19 brought us together to tackle the invisible threat that is the COVID-19 virus, and that solidarity has sustained us through tough times in 2020. We must now harness that solidarity to
make the urgent changes needed to tackle the more visible threat that is climate change.
Throughout the pandemic, ESB has focussed on our essential role ensuring the provision of safe, secure and reliable electricity supplies to all electricity customers and the continued functioning of the wider economy throughout this unprecedented crisis. The Board continued to monitor business continuity and pandemic response arrangements throughout 2020 ensuring plans were adapted as the crisis evolved.
COVID-19 accelerated the transformation of the business and the way we work in ESB in 2020. The Board's strategic focus on digital investment as an enabler for culture change is bearing fruit. As we look forward to returning to our new head office we will blend the best of the old and new in our
workplace for the future.
CLIMATE CHANGE AND STAKEHOLDERSClimate action is at the core of the Brighter Future Strategy. The business is already on a journey to a net zero carbon future with an ambitious carbon target and full reporting of our direct and indirect carbon emissions.
ESB has a key role to play in supporting the delivery of the targets contained in the Government’s Climate Action Plan, especially the ambitious targets for 70% renewable electricity and for electrification in transport and domestic heating. The Climate Action Plan sets out how Ireland will deliver on these 2030 targets, while preparing for deep decarbonisation by 2050 and becoming a leader in responding to climate change. ESB’s strategy is to lead on climate action and is closely aligned with the national climate ambition and the Board will be guiding management in the delivery of our strategic priorities.
This year the Board spent valuable time enhancing its understanding of the measurement of climate impact and listening to our customers, investors and other key stakeholders tell us about the issues that are most important to them from an environment, societal and governance perspective. The Board will continue to focus on these topics in the year ahead. We believe that the energy transition needs to involve everyone and that building on trust will be essential to success.
INVESTING IN THE FUTUREThe Board is immensely proud of the investments being made to support the transition to a low-carbon energy future, the continued focus
SAFETYAs our many stakeholders will be aware, the safety of the public, our employees and contractors is a priority. In 2020, the Board was sadly notified of two fatalities, one involving a colleague in NIE Networks and another involving a contractor working on behalf of ESB Networks. The Board will thoroughly review the outcome of the investigations into these fatalities and all safety incidents to ensure that any lessons learned are fully actioned. Safety will continue to be a priority for 2021.
BOARD CHANGESEllvena Graham OBE stepped down as Chairman of the Board in July. I would like to thank Ellvena for her excellent contribution over 10 years both as a board member and more recently as Chairman. Ellvena played a significant part in the success ESB has enjoyed over this period and her excellent stewardship of the Board was acknowledged by the Minister at this year’s AGM. On behalf of the Board I would like to wish her well in the future. I am also happy to report that the Minister re-appointed Andrew Hastings for his second term as Board member.
As I commence my own term as Chairman of the Board, I would like to thank my fellow Board members for their hard work and valuable contributions during 2020 and look forward to working with them on the many challenges that lie ahead.
CONCLUSION2020 has been a challenging year for ESB, and throughout our history we have embraced challenges and change and will continue to do so in the years ahead as we deliver our ambitious Brighter Future Strategy. On behalf of the Board, I would like to thank the Chief Executive Pat O'Doherty, the Executive Director Team, and all the staff in ESB for their high levels of commitment and professionalism during 2020.
In accordance with the ESB Acts 1927-2014, the Board presents the Annual Report and Financial Statements for the year ended 31 December 2020.
Terence O’Rourke, Chairman 26 February 2021
CHAIRMAN'S STATEMENT
I am delighted as Chairman to present the 2020 Annual Report and Financial Statements for ESB.
Terence O’RourkeCHAIRMAN

ESB Annual Report 2020 13
strength is key to delivering our strategic objectives. In 2020, we delivered EBITDA of €1,358 million and operating profit of €616 million (both before exceptional items).
During the year we invested €1,115 million, including circa €57 million in renewables as we continue to lead the transition to a low-carbon future. The dividend for 2020 amounted to €81million, bringing total dividends paid over the last decade to €1.2 billion.
What are the main chal-lenges facing performance in the business units?
ESB Networks regulatory determination, PR5, issued by the Commission for Regulation of Utilities in December, sets out a clear framework for capital investment in the network for the period 2021 - 2025. Delivering this efficiently and on time, while also maintaining network resilience and security are priorities for ESB Networks. NIE Networks has a similarly ambitious capital expenditure programme to deliver on their price review. Our retail businesses in the Republic of Ireland, Northern Ireland and GB are all facing intense competition and we must work to demonstrate value to customers and support their efforts to live low-carbon lives. In our generation and trading business, the focus is on managing the transition to low-carbon and renewable energy and moving away from high carbon assets in a way that is fair and upholds our values.
What risks and opportu-nities do you see for ESB over the coming years?
We are living in very turbulent times and it is difficult to predict what the world will look like next year, never mind over the period of some of our investments. However, climate change is a reality that will not be addressed without immediate action, and our purpose to lead the transition to a low-carbon future is a north star for ESB which keeps us focused on the steps we need to take and presents new opportunities.
Any final comments?
I want to acknowledge the hard work of all ESB Group employees in maintaining services for customers and progressing our ambitious plans during a very challenging and difficult time. I’d also like to welcome our new chairman Terence O’Rourke, who was appointed during the year and express my thanks to Ellvena Graham OBE who provided excellent guidance and direction to ESB over the past 5 years as Chairman.
Pat O’Doherty, Chief Executive 26 February 2021
What were the highlights of 2020 for ESB?
2020 has been an extraordinary year. It kicked off with the launch of the Electric Ireland Brighter Together Campaign by Commander Chris Hadfield. Little did we know then the challenges we would face in staying together throughout the rest of the year! I am really proud of our response to the COVID-19 crisis, particularly how well our employees and our systems stood up to the challenge of maintaining secure energy supplies and supporting our customers and the communities we serve at a time of great anxiety and stress.
How did ESB adapt to meet the challenges associated with the COVID-19 pandemic?
With the onset of the pandemic, we immediately focused our attention on the three “c’s” that matter most to our business – colleagues, customers and communities. That meant taking steps to keep our employees and our contractors safe and well; maintaining secure, reliable and affordable electricity supplies for customers; and supporting our Corporate Social Responsibility partners so that they could continue to provide vital services to communities.
In what way did ESB support communities during COVID-19?
We reached out to our community and charity partners to identify areas of need and prioritise resources. Electric Ireland worked with long-term partner Pieta to develop the Sunrise Appeal following the cancellation of the Darkness into Light walk, raising over €4 million for suicide prevention. ESB also supported the Tech2Students campaign
Networks and NIE Networks have a key role to play in reinforcing and enhancing the electricity network to accommodate vastly increased amounts of distributed energy assets, including heat pumps, electric vehicles and micro generation and storage. ESB Networks concluded a regulatory price review for the period 2021 to 2025 (PR5) in December, paving the way for a very ambitious programme of network capital investment to facilitate increased levels of renewables and electrification which are vital in meeting Ireland’s climate targets.
The closure of ESB’s peat stations in the Irish Midlands in December was both a milestone in the delivery of our strategy and the end of an era for generations of employees and communities who contributed to Ireland’s energy security over seven decades. Our strategic focus is now firmly fixed on low carbon and renewable generation and we are well positioned to support the green agenda. Consumers will play a critical role in the energy transition, so we are working to develop products and services that will both enable and encourage all of us as consumers to make the necessary changes in how we live our lives in the pursuit of a low-carbon future.
How has ESB delivered value to customers in 2020?
Throughout 2020, ESB continued to provide secure supplies of electricity at a very critical and challenging time for our employees, our customers and broader society. Alongside this, we continued to develop and enhance our product offering, with upgrades to the EV infrastructure and new propositions for both domestic and industrial and commercial customers to help them save energy and costs. Recognising the challenges facing customers, Electric Ireland announced a moratorium on disconnections that will extend into Spring 2021 and a €1 million credit for
to help bridge the digital divide, and provided additional funding to a range of other organisations through the Energy for Generations Fund, and the Wind Farm Community Fund.
What progress did ESB make in delivering the Brighter Future Strategy in 2020?
Our purpose to create a brighter future by leading the transition to secure, affordable, low-carbon energy provided a very strong anchor for ESB during the pandemic. Despite restrictions that curtailed capital expenditure, we made clear progress in delivering strategic initiatives, from growing our position in offshore wind through investments in Inch Cape (UK) and commissioning the 114 MW Grousemount (ROI) wind farm to undertaking major network upgrades and installing over 224, 000 smart meters. We continued to support our customers’ low carbon ambitions, in the domestic, industrial and commercial markets through the introduction of new product and service offerings. NIE Networks, who marked their 10th anniversary as part of ESB Group in December also made progress in upgrading the network to facilitate more renewable generation.
Is ESB’s strategy compatible with the Government’s Climate action and low carbon Bill which was published in 2020?
Climate action is at the heart of our strategy, and our approach is fully aligned with the Government’s Climate Action Plan (CAP) which recognises that clean electricity, combined with widespread electrification of the transport and heating sectors, is a key pathway to a low-carbon future. While all parts of ESB will contribute to the CAP, ESB
we can to keep people safe. As well as ensuring that we have robust safety systems and structures in place, we are also working to further embed a strong safety culture and mindset through our Safe and Sound programme. During the year, new safety measures and controls were implemented and total safety incidents fell by circa 12% following an overall downward trend in lagging performing indicators. Proactive measures were adopted throughout ESB to control the spread of COVID-19 and we continue to monitor this situation to protect the health and wellbeing of our colleagues, customers and the public.
What steps has ESB taken to address environmental issues?
ESB is committed to operating in a way that addresses the dual challenges of climate change and the biodiversity crisis. During 2020, we were named an ‘A list’ company by CDP, an environmental not-for-profit, in recognition of our leadership in environmental transparency and action. During 2020, ESB continued to take a systematic and strategic approach to managing and enhancing our environmental performance. Key developments included the closure of the peat stations, the achievement of ISO14001 recertification in ESB Networks and the redevelopment of our head office complex as an exemplar in energy efficiency. As well as taking steps to significantly reduce our carbon emissions, we are working to contain and minimise the use of Sulphur Hexaflouride (SF6), and to eliminate the environmental impact from legacy infrastructure, including fluid filled cables. Information on progress has been published on www.esbnetworks.ie.
How did ESB support its workforce and maintain performance in
2020? Our ability to respond to COVID-19 and maintain services for customers was underpinned by a rapid transition to remote working for almost 4,000 employees, with others continuing to work on site in power stations and networks locations. The transition was made possible by effective IT and management systems which enabled us to continue to serve our customers to a high standard. A new publication "Our Code" setting out clear guidance on ESB’s principles and standards was published to ensure all employees behave in line with our values. We also finalised our new diversity and inclusion strategy which will support our commitment to building a high-performance culture underpinned by a flexible and engaged workforce.
How was ESB’s financial performance in 2020?
Despite challenging circumstances arising from COVID-19 including a rapid loss of demand early in the year and restrictions on the delivery of our capital expenditure programme, ESB delivered a resilient set of financial results. Maintaining financial
vulnerable customers in the lead up to Christmas.
ESB Networks made huge progress in rolling out smart meters during the year, and all suppliers will be in a position to offer smart services to customers with smart meters in early 2021. SIRO, ESB’s joint venture with Vodafone, has brought gigabit broadband within reach of 360,000 premises, and now serves over 30% of Fibre To The Home (FTTH) customers in Ireland.
What impact do you expect Brexit will have on ESB’s operations and growth ambitions?
The immediate impact of Brexit on the electricity markets in which ESB operates is likely to be limited. The Single Electricity Market is underpinned by legislation in the Republic of Ireland and Northern Ireland, and both regulatory authorities and governments are committed to the current arrangements. In addition, and more broadly, the trade and co-operation agreements between the EEA and the UK contain an extensive range of measures to ensure continued trade and co-operation on electricity and energy policy. In financial terms, our UK assets are funded in Sterling and earnings are also in Sterling, which mitigates immediate currency risk. In the longer term, Brexit may have negative implications on economic growth and electricity demand in both the UK and Ireland and so we will continue to monitor the risks and issues as they arise, while also considering their implications, if any, for future investment decisions. However, it should also be noted that the UK, alongside Ireland and the European Union, continues to have a strong commitment to decarbonisation and electrification - a trend which is likely to continue to create business opportunities for ESB.
To what extent was ESB able to continue innovat-ing during the pandemic?
ESB’s structured approach to innovation continued throughout 2020. Collaboration with start-ups is supported through the Free Electrons programme; in-house ideas are nurtured through our X_Site innovation hub; and we partner with universities to develop ideas emerging from academia. A virtual awards ceremony took place during the year to celebrate innovation across ESB which was attended by over 3,000 employees.
How has ESB performed with regard to safety in 2020?
I am deeply saddened that two people working on behalf of ESB Group lost their lives in 2020. Richard Scott, a plant maintenance electrician with NIE Networks and Andrew Fleming, a road surfacing sub-contractor died in separate incidents in August. Safety is a priority for ESB and these accidents remind us of the hazards of our industry and reinforce our commitment to doing everything
Pat O’Doherty discusses progress against the Brighter Future Strategy in 2020 and looks forward to the year ahead.
Pat O’Doherty CHIEF EXECUTIVE
CHIEF EXECUTIVE'S REVIEW
12 ESB Annual Report 2020 - Brighter TogetherC
OR
PO
RATE
GO
VE
RN
AN
CE
02
FINA
NC
IAL S
TATEM
EN
TS
03
01
STR
ATEGY
AN
D P
ER
FOR
MA
NC
E

14 ESB Annual Report 2020 - Brighter Together ESB Annual Report 2020 15
BUSINESS SEGMENT
GENERATION & TRADING (GT)
ESB NETWORKS
NORTHERN IRELAND ELECTRICITY NETWORKS (NIE NETWORKS)
CUSTOMER SOLUTIONS
OTHER SEGMENTS
Revenue€1,346m €1,232m €337m €2,172m €329m
Operating profit* /(loss) €108m €368m €85m €58m (€3m)
Capital expenditure€121m €749m €140m €27m €78m
Average employee numbers 796 3,436 1,209 614 1,883
Link to other sections in the report
See page 58 GT Operational Review
See page 60 ESB Networks Operational Review
See page 62 NIE Networks Operational Review
See page 64 Customer Solutions Operational Review
See pages 66 and 67 Engineering & Major projects and Enterprise Services
See note 2 (Segment Reporting) in the financial statements for further detail. * Before exceptional items (see note 5 in the financial statements for further detail).
ESB AT A GLANCE HIGHLIGHTS
SHAREHOLDERS
Return on Capital Employed
of 5.4%
Dividend of
€81 millionfor 2020
Re-Affirmed
Credit Rating A-/A3
CUSTOMERS
Over 224,000 smart meters installed
Over 28,000 New Customer
Connections
Additional supports provided to customers during the COVID-19
pandemic
Launch of 100% green tariffs
Customer satisfaction of
83%
IRISH ECONOMY
Over
€1 billioninvestment in infrastructure
Over
7,900 employees
Over
€2 million disbursed across a range of
community initiatives
Just under
€2.0 bncontribution to Irish economy
CO
RP
OR
ATE G
OV
ER
NA
NC
E
02
FINA
NC
IAL S
TATEM
EN
TS
03
01
STR
ATEGY
AN
D P
ER
FOR
MA
NC
E
ESB designated as an
A-listed company by the CDP for first time
Carbon intensity of 378g CO2/kWh
reduction of 44%(on baseline year 2005)
ENVIRONMENT &
SUSTAINABILITY
ESB Networks agreed
Price Review 5 aligned with the
Climate Action Plan

ESB Annual Report 2020 17
STRATEGIC OBJECTIVES Strategy 2030 sets out the following five Strategic Objectives that are described in further detail on page 21:
1. Put customers’ current and future needs at the centre of all of ESB's activities
2. Produce, connect and deliver clean, secure and affordable energy
3. Develop energy services to meet evolvingmarket needs
4. Grow the business while maintaining ESB’sfinancial strength
5. Deliver a high-performance culture thatsupports innovation and collaboration
ESB’S BUSINESS ENVIRONMENT To be successful, ESB Group Strategy is continuously shaped to respond to developments in the external environment. These developments include economic, political, energy policy and regulation, commodity and power markets, financial, competitive, customer and technology trends. Major recent trends can be incorporated across three themes:
STRATEGY STATEMENT Through our diverse businesses across the Republic of Ireland, Northern Ireland and Great Britain, we aim to meet customer energy needs by bringing the best of our capabilities together to deliver innovative and value-driven solutions for a low-carbon world.
During 2017, the Board undertook a review of ESB’s strategy to test and validate the underlying assumptions, reaffirm the overall strategic direction of the Group and extend the planning horizon out to 2030. Based on this analysis, a new multi-year Strategic Framework was approved by the Board in November 2017. Since then, the Board has kept the key external drivers informing this strategy under continuous review and the ESB Executive Director Team (EDT) continue to monitor developments in ESB’s business environment impacting strategy. A Board Strategy Review day was held in November 2020 and a series of updates on strategy were discussed throughout the year on key emerging issues.
STRATEGY 2030 ESB’s Strategy to 2030 (Strategy 2030) is anchored in ESB’s ambition to create a brighter future by leading the transition to reliable, affordable, low-carbon energy and grounded in its purpose to create a brighter future for the customers and communities ESB serve. It aims to achieve this by decarbonising electricity, connecting the renewable generation needed, making its networks smarter to enable the electrification of heat and transport and providing the solutions to support its customers in making their own transition. This will be done in a way that will ensure that ESB continues to grow as a successful business while maintaining the financial strength to invest in a low-carbon future at the necessary pace and scale. It also recognises the potential for new business growth arising from the transition.
The Strategy highlights the importance of being
adaptable, responsive and opportunistic in an era of unprecedented uncertainty and having a presence of scale across the utility value chain, with a mix of regulated and unregulated businesses, while maintaining a strong investment grade credit rating.
Since its establishment in 1927, ESB has been characterised by a commitment to enabling society and creating opportunities for the communities it serves. The challenge for ESB today is to be a leader in the transition to reliable, affordable, low-carbon energy and to serve its customers better and achieve sustainable growth.
ESB’S VALUESESB’s values of being courageous, caring, trusted and driven are deeply rooted in the organisation and encapsulate the integrity and ambition that ESB stands for. They are integral to the development and delivery of Strategy 2030; they inform decisions and they underpin ESB’s commitment to earning the trust that customers and communities place in ESB.
STRATEGIC FRAMEWORK The Strategic Framework for Strategy 2030 (see page 20) will ensure that ESB’s strategic objectives, which are outlined further below, are commercially driven and are consistent with ESB’s overarching purpose and values, as described above.
17 Strategy
22 Business Model
24 Risk Report
40 Key Performance Indicators (KPIs)
Economic/Political Challenges and UncertaintiesThe COVID-19 pandemic and its resultant societal impact along with other major economic and political uncertainties (e.g. Brexit) which have impacted the business during 2020 and may feed into long-term trends.
Competition and RegulationThere has been continued competitive and regulatory pressures on generation and retail businesses as well as on the returns allowed to ESB’s regulated networks businesses.
Decarbonisation of the Energy SectorThere have been shifts on climate and energy policy and sentiment at global, European and national level including the European Green Deal, Programme for Government which includes ambition targets for offshore wind and a net zero commitment for Ireland, and the Offshore Transmission Policy Consultation. The prospect of a hydrogen economy to help deliver net zero has also gained traction. This accelerated trend creates both threats, challenges and opportunities for ESB.
1. 2.
STRATEGY
3.
16 ESB Annual Report 2020 - Brighter TogetherC
OR
PO
RATE
GO
VE
RN
AN
CE
02
FINA
NC
IAL S
TATEM
EN
TS
03
01
STR
ATEGY
AN
D P
ER
FOR
MA
NC
E

18 ESB Annual Report 2020 - Brighter Together
1. ECONOMIC/POLITICAL CHALLENGES AND UNCERTAINTIESThe advent of the COVID-19 global pandemic during the first quarter of 2020 represented the greatest economic shock since World War II – in addition to creating a significant humanitarian and mortality/morbidity burden. During 2020, the Board’s Committees were briefed regularly in detail on the epidemiological and economic uncertainties using analysis of potential scenario outcomes.
In epidemiological terms, the current evolution of the disease in Ireland, the UK and Europe most closely resembles a “W” Scenario – with a pattern of intermittent accelerations and deceleration in cases as Non-Pharmacological Interventions (NPIs) are instituted and withdrawn. It is likely that an end to the epidemic will be achieved with the implementation of a COVID-19 vaccination programme in 2021-2022 and the achievement of herd immunity.
An assessment of the impact of the pandemic (and other factors) on global and major European economies is provided in the January 2021 International Monetary Fund (IMF) World Economic Outlook. Although recent vaccine approvals have raised hopes of a turnaround in the pandemic later in 2021, renewed waves and new variants of the virus pose concerns for the outlook. Amid exceptional uncertainty, the global economy is projected to grow 5.5% in 2021 and 4.2% in 2022 reflecting expectations of a vaccine-powered strengthening of activity later in 2021 and additional policy support in a few large economies.
The projected 2021 growth recovery follows a severe collapse in 2020. The global growth contraction for 2020 is estimated at -3.5%, 0.9% higher than projected in the previous forecast (reflecting stronger-than-expected momentum in the second half of 2020). Annual electricity demand significantly decreased all across Europe as a consequence of the COVID-19 pandemic in 2020, relative to 2019, due to the subsequent preventative measures and economic recession. High decreases were observed in Italy, Spain, and the United Kingdom, with drops in demand of around 6% - above the average 4% to 5% drop for the region as a whole.
Internationally, the economic impact of COVID-19 has been mitigated by a combination of fiscal
stimulus/government spending and a near unprecedented easing in monetary policy by global central banks (including the European Central Bank). The latter policy has driven interest rates to historic lows, allowed governments to borrow with ease and offset any potential pressures in funding markets.
In an Irish context, a comprehensive analysis was provided by the Central Bank of Ireland in its Quarterly Bulletin Q4 2020. This analysis projected a -7% reduction in domestic economic activity during 2020 followed by a recovery with 1.6% growth in 2021 and 4.8% in 2022. Analysis of underlying sectoral data suggests a K-shaped pattern to economic activity in Ireland due to differential impacts (e.g. Ireland had one of the steepest drops in consumption in the EU during 2020 but one of the lowest decreases in GDP (gross domestic product) due to strong export performance. Looking at the entirety of 2020 electricity demand, there was approximately a 1% reduction in electricity demand (-0.7%) in 2020 demand versus 2019. Ireland's electricity demand
for 2020 appears to be an outlier to other countries, being supported by the highly resilient transmission connected demand from large energy users which continued to grow over 2020.
A Brexit deal was secured in late December 2020, avoiding a No Deal exit from the transition period. However, some uncertainty remains surrounding the Brexit post-transition trading and economic arrangements between the United Kingdom and the European Union and remains a major economic and political concern for the markets in which ESB operates.
Estimates of the macro-economic impact of post-Brexit outcomes vary widely and are contingent on the exact nature of the final settlement (e.g how extensive any free trade agreement might be) – with uncertainties amplified by COVID-19-related developments and potential logistical issues with implementing new arrangements.
However, the longer term impacts of Brexit may prove to be more substantive in nature. These ‘second order’ political implications may be
significant and unpredictable over the longer term (for example deterioration of East/West and North/South relations threatening SEM, growing political instability in a UK unconstrained by EU restrictions on energy and climate policy or on State Aid).
While unpredictable, the factors discussed above will have important strategic implications for ESB including (but not limited to) financial performance, long-term interest rates, role of the State, as well as geopolitical and political sentiment. ESB ensures that its strategy reflects and is adapted to these developments.
2. DECARBONISATION OF THEENERGY SECTOR Policy efforts to address climate change are transforming the electricity and energy sector. During the past year, this direction of travel accelerated. Several salient recent developments are worth considering:
Globally, there has been a dramatic increase in the number of national governments making commitments to the achievement of 100% carbon neutrality. From 2017 to early 2020, the proportion of the world’s GDP covered by such targets increased from 0% to 44%, and with the recent commitments by China, Japan and South Korea, this total now exceeds 60%.
The European Union has now made a commitment to achieve 100% Carbon Neutrality by 2050. During the year, the EU Commissions President’s State of the Union speech laid out a goal to accelerate the pace of reduction by 2030 from 44% to at least 55%.
The announced European Union Green Deal also lays out and commits funding to specific large-scale targets in key areas (e.g. increase in green hydrogen, retrofits, continued regulatory and physical integration of EU energy markets).
In domestic terms, Ireland has proposed legislation for a Net Zero target for 2050 which would include binding carbon budgets and sectoral targets being set to meet the 2050 target.
The UK has already legislated for net zero by 2050. The Committee on Climate Change will soon make recommendations for the key carbon budgets to achieve this target. In Northern Ireland, the Department of the Economy is developing a
strategic energy framework to be finalised at the end of 2021. The Minister there has indicated that they will likely pursue a renewable electricity target of at least 70% by 2030.
There is a strong climate focus in stimulus measures identified in the new Programme for Government (e.g. upgrading 500,000 homes to B2 energy rating by 2030).
Offshore wind generation is seen as increasingly pivotal in enabling Ireland to achieve its carbon and renewable energy targets. A target of 3.5 GW in offshore wind generation was set by the 2019 Climate Action Plan. The newly published Programme for Government increases this ambition to 5 GW by 2030 – and during 2020, there have been significant developments on the specific policy measures required to deliver this quantum.These long-term trends are set to transform the energy sector, and not just the electricity industry.
While there are a number of analyses for how this transformation might unfold, one of the most insightful and relevant set of scenarios was published by the UK’s National Grid in July 2020 as the Future Energy Scenarios. This analysis provides a detailed and research-informed picture of how the transformation to carbon neutrality might play out in a society and energy sector with strong similarities to Ireland. Change through 2050 includes the role of hydrogen, electricity demand growth, renewable generation, interconnection, energy efficiency, electrification of transport, flexibility and energy services.
In strategic terms, these trends create significant opportunities and challenges for ESB and its businesses over the short, medium and long term. Among these implications are growth and investment opportunities, hydrogen and other long-term, net-zero dispatchable generation, challenges posed to ESB by growing capital intensity, continuing pressure on carbon intense/thermal business lines and activities, role in electrification and other decarbonised energy businesses. These opportunities and challenges are managed by ESB and reflected in our strategy.
3. COMPETITION ANDREGULATION The long-term competitive and regulatory pressure on key segments, identified and considered in 2017 and confirmed in subsequent strategy
reviews, continues to play out. These trends have been the broad direction of travel since moves to deregulate the Electricity Industry began in the 1990s – and remain a major feature. An assessment can be made by considering their impact on three specific business areas relevant to ESB’s strategy.
Firstly, the liberalisation of the retail electricity supply sector began in Great Britain in 1999. Until the early 2010s, this market was dominated by the ‘Big 6’ and since then there has been a rapid deterioration in their competitive position. Competition by new entrants, and the introduction of a Retail Price Cap in Summer 2018, has reduced the market share of these legacy businesses while cutting EBIT margins in Great Britain over the period 2016–2019. Consequently, within the last 2 years, the owners of two of these six businesses have announced their exit from this market, while a third incumbent has combined their customers in a joint venture in order to drive a large-scale digital and cost transformation.
Secondly, ESB Group's regulated networks businesses deliver a significant proportion of ESB Group EBITDA and so ESB is significantly exposed to pressures on allowed returns.
Finally, ESB’s efforts to develop and grow its renewable generation, and its offshore wind pipeline, is being conducted in the face of intense competitive pressure. Internationally governments have made increasing use of auctions to drive competition for, and between, such renewable projects and this has reduced returns and costs. In addition, the growth of this sector is attracting new participants from other industries with relevant capabilities (e.g. oil and gas exploration companies) and participants with access to a reduced cost of capital. With a policy target of 5 GW (increased from 3.5 GW in 2019), the Irish offshore wind sector is likely to be the major focal point for growth and new investment in the Irish electricity sector over the next decade – and potentially beyond.
Taken together, these factors have a number of strategic implications for ESB, including transformation of existing businesses, joint ventures and partnerships, regulatory risks and strategy and business mix/portfolio. ESB's Strategy is shaped to respond to these.
MAJOR 2020 CLIMATE POLICY DEVELOPMENTSBy February 2020, economies covering 44% of Global GDP had set Net Zero Carbon Commitments (up from 0% in 2017)Since then China, Japan and South Korea have committed to Carbon Neutrality by 2050 (covering approx. 15% of Global Economy)
European Union has set target for Net Zero Carbon by 2050- Carbon Reduction Target goal increased from 40 to 55% by 2030During 2020, European Commission outlined major transformation of individual components of energy (e.g. 40GW of renewable hydrogen electrolyser by 2030, Energy Efficiency, Retrofit, Integration of EU energy systems)
New Program for Government and Climate Bill accelerates CO2 ambition including:- Legally binding Carbon Neutrality targets (zero by 2050) and Sectoral Budgets - 51% reduction in carbon emissions by 2030 with 7% pa saving achieved - Increased Offshore Wind target from 3.5 to 5GW - Climate focus for stimulus (e.g. upgrade 500,000 homes to B2 by 2030Major developments in Offshore Generation and Transmission Policy
ESB Annual Report 2020 19C
OR
PO
RATE
GO
VE
RN
AN
CE
02
FINA
NC
IAL S
TATEM
EN
TS
03
01
STR
ATEGY
AN
D P
ER
FOR
MA
NC
E

CO
RP
OR
ATE G
OV
ER
NA
NC
E
02
FINA
NC
IAL S
TATEM
EN
TS
03
01
STR
ATEGY
AN
D P
ER
FOR
MA
NC
E20 ESB Annual Report 2020 - Brighter Together ESB Annual Report 2020 21
*Earnings before interest, taxation, depreciation, impairments, amortisation (including amortisation of supply contributions) and non-trading net impairment losses on financial assets. See pages 58 to 67 for short- to medium-term priorities in the business units.
Strategic Performance Indicators (SPIs)
INDICATOR METRIC 2020 2030 TARGET
Scale Across the Value Chain EBITDA* €Bn's €1.3 billion >€1.9 billion
Market Shares % 29% of SEM Generation
34% of SEM Supply
43% of SEM System Service
>30% SEM Generation
c. 40% SEM Supply
≥40% SEM System Services
Carbon Intensity of the Electricity ESB Produce
g CO2/kWh 378gCO2/kWh ≤200g CO2/kWh
Scale of Low-Carbon Energy Connected to our Networks
GW of Renewables Connected 4.7 GW in ROI
1.7 GW in NI
5 GW in ROI
2 GW in NI
Strong Investment Grade Credit Rating
Rating Equivalents Credit ratings of A- or equivalent and BBB+ on a stand-alone basis.
BBB+
on a stand-alone basis
Return on Capital ROCE (%) 5.4% ROCE >WACC
Employee Engagement̂ Employees Survey Response Rate 7.1 7.3
Safety Culture Lost Time Incidents (LTIs) 57 LTIs 0 LTIs
Put customers’ current and future
needs at the centre of all our
activities
Produce, connect and deliver
clean, secure and affordable energy
Develop energy services to meet evolving market
needs
Grow the business while maintaining
ESB’s financial strength
Deliver a high-performance culture that
supports innovation and collaboration
ESB will adopt acustomer centric cultureacross all of its businessactivities which willnot only build on ourreputation for customerservice and trust, butproactively look beyondtraditional servicesto develop new andinnovative insight-drivensolutions to meet diversecustomer needs
ESB’s unique position asa player of scale in bothnetworks and generationmarkets enables it totake a leading role inthe decarbonisation ofsociety
We will strengthen andadapt our traditionalbusiness models, andactively encourage andadopt new businessmodels which leverageexisting and newgeneration and networksassets to develop otherproducts and services
The transition awayfrom fossil fuels andthe development ofnew technologies iscreating a demand fornew services to bothbalance the grid and givecustomers more controlover their energy use
This presents anopportunity for ESBto capture value in thisrapidly growing market –both in terms of systemservices for the gridand energy services forsupply customers
Maintaining a strongfinancial performanceis key to ESB’s strategyas it will determine ourability to raise capital toinvest in the transition toa low-carbon future
ESB will continue to ensure activities are aligned to upholding its strong investment grade credit rating target (BBB+ on a stand-alonebasis)
ESB will seek tomaximise the value of itsexisting assets in orderto maintain acceptablelevels of financialheadroom
ESB’s ambition tolead the transition to alow-carbon future willdepend on its abilityto harness the talents,creativity and intrinsicmotivation of its peopleto deliver on its strategy
ESB will cultivate a high-performing, innovativeand customer-focusedculture that encouragescollaboration toshare knowledge andinsights on industrydevelopments
STRATEGY IN ACTION – SEE PAGES 58 TO 67 FOR DETAILS OF PROGRESS ON STRATEGIC OBJECTIVES BY BUSINESS UNIT
2020 BUSINESS ENVIRONMENT• Economic/Political Challenges and Uncertainties • Decarbonisation of the Energy Sector
• Competition and Regulation
OUR PURPOSE ESB’s purpose is to create a brighter future for the customers and communities we serve
and we will do this by leading the transition to reliable, affordable, low-carbon energy
STRATEGIC OBJECTIVES
Put customers’ current and future needs at the centre
of all our activities
Produce, connect
and deliver clean,
secure and affordable
energy
Develop energy
services to meet evolving market needs
Grow the business
while maintaining
ESB’s financial strength
Deliver a high-performance culture that
supports innovation and collaboration
STRATEGY STATEMENT Through our diverse businesses across the Republic of Ireland, Northern Ireland and Great
Britain we aim to meet customer energy needs by bringing the best of our capabilities together to deliver innovative and value-driven solutions for a low-carbon world
STRATEGIC OBJECTIVESSTRATEGIC FRAMEWORK

22 ESB Annual Report 2020 - Brighter Together
Our Purpose is to 'Create a Brighter Future for the customers and communities we serve, by leading the transition to reliable, affordable, low-carbon energy.'
CAPITAL INPUTS
Manufactured Capital• 5,530 MW of generation capacity• Over 229,000 km of Network across
ROI and NI
Financial Capital• A-credit rating• Total net assets €3.9 billion• Liquidity of €1.8 billion
Intellectual Capital• Carbon management• Environmental management and expertise • Promotion of innovation - founding member of
'free electrons' • Corporate governance structure
Human Capital• Over 7,900 employees• 'Our Code'• Employee development programmes• Diversity and inclusion strategy• Safety leadership strategy and transformation
programme
Social and Responsible Capital• Over 1.5 million customers
Natural Capital• 1,003 MW of renewable generation
GENERATE
ESB develops, operates and trades the output of ESB’s electricity generation assets. The portfolio consists of 5,530 MW of thermal and renewable generation assets across ROI, NI and GB and a further 224 MW under construction.
See page 58 for further details.
TRANSMIT
ESB builds, manages and maintains the transmission and distribution network in ROI and NI. Over 229,000KM of Network.
See page 60 and 62 for further details.
WE'RE COURAGEOUS
WE'RE TRUSTED
WE'RE CARING
WE'RE DRIVEN Put customers’ current
and future needs at the centre of all our
activities
Produce, connect and deliver
clean, secure and affordable energy
Develop energy services to meet evolving market
needs
Grow the business while maintaining
ESB’s financial strength
Deliver a high-performance culture that supports innovation and
collaboration
BUSINESS MODEL
SUPPLY
Supplying electricity, gas and energy services to customers in ROI, NI and GB.
See page 64 for further detail
FINANCIAL STRENGTH
ESB has a strong balance sheet and liquidity position, the maintenance of financial strength is key to support the investment required to deliver the low-carbon energy future.
OUTPUT
Customers• 83% customer satisfaction• 34% market share• 29% generation market share
Shareholders• Dividend of €1.2 billion over the last decade• Return on capital employed 5.4%• €1.3 billion EBITDA
Irish Economy• Invested €1 billion• Contributes €1.8 billion to economy• Over €2 million disbursed over a range of
community-based initiatives
Environment• Carbon intensity reduced by 44% since 2005• COP 'A' score
CO2 EMISSIONS

24 ESB Annual Report 2020 - Brighter Together ESB Annual Report 2020 25
is consistent with the Risk Appetite Statement signed off by the Board in 2017 in terms of focus of investment, geographies, technology and customer focus. The principal risks continued to be monitored by reference to the approved Risk Appetite Statement throughout 2020.
A full review of the Risk Appetite will be undertaken by the Board in 2021.
GROUP PRINCIPAL RISKS 2020The 2020 Group Risk Plan takes as its starting point the Board’s approved strategy “A Strategy for a Brighter Future – ESB 2030” (Strategy 2030). Additional external considerations included the National Risk Assessment 2019 1 and 2020 Global Risks Report2, external market developments and other legal and regulatory considerations that can impact the business model. Emerging Risks are included, insofar as this is possible, for the period 2021 to 2024, to help identify exposures as early as possible.
The Principal Risks for 2020 are set out on page 28. These risks are considered material to understanding how ESB creates value. A number of Principal Risks remained constant over 2020, such as system outage and cyber attack risk, infrastructure, project and programme delivery risk, resourcing and capability risk. Other risks, as detailed below increased during the year.
There was also the introduction of an additional Principal Risk in relation to COVID-19 pandemic, see below.
The outbreak of the COVID-19 global pandemic during the first quarter of 2020 resulted in the identification of an additional Principal Risk (page 38) “Challenges and Risks associated with COVID-19 pandemic and its impacts” as part of the Mid-Year Risk Review process.
As with ESB’s well-established process for the assessment of Principal Risks, this was an inclusive and robust exercise that delivered a range of considered and objective outputs. Risks were identified and measured, appropriate controls and risk mitigations to reduce the probability of risks emerging and recovery mechanisms to reduce
the impact of an event are in place. Reviews were conducted by the relevant oversight committees. In addition to creating a significant humanitarian and mortality/morbidity burden it has presented ESB with additional challenges and risks which need to be managed effectively.
The Group Risk Plan for 2020 was designed to provide adequate assurance that:• specific consideration has been given to the risks
of achieving ESB’s strategic objectives• risks have been properly identified and assessed
on a bottom-up basis by the businesses and key functions and also adequately challenged and reviewed on a top-down basis by Group Risk, the Risk Management Committee and the ExecutiveDirector Team Risk Forum
• risks and risk appetite have been aligned• appropriate controls and risk mitigations to
reduce the probability of risks emerging and recovery mechanisms to reduce the impact of anevent are in place
• emerging risk developments over time arebeing tracked
• management preparedness to manage risk isunderstood
• responsibility for risk is allocated to ensureaccountability
• a communications plan is in place to apprise theBoard and the relevant sub-committees on key risk topics throughout the year
FINANCIAL RISKSThe main financial risks faced by the Group relate to liquidity, foreign exchange, interest rate, capital intensity (capital expenditure relative to EBITDA) and commodity (electricity and fuel) price movements. Policies to protect the Group from these risks and other risk areas, such as credit risk, are regularly reviewed, revised and approved by the Board (and the details are outlined in note 28 of the financial statements).
CLIMATE RISKSESB has identified the main transition and physical climate risks and opportunities across the Group. This list of Group Climate Risks will be monitored and reassessed each year. The overall
level of climate risk will be a key indicator of the risk level of a new climate change Principal Risk in 2021. Three climate risk scenarios have been developed for use in the regular reviews of ESB’s corporate strategy: one physical scenario, based on the IPCC (Inter Governmental Panel on Climate Change) representative carbon pathway 4.5 and two transition scenarios, one based on the Irish Government’s current Climate Action Plan and the second on the more ambitious climate commitments for 2030 in the 2020 Programme for Government, respectively. For more detail, please see the Environment and Sustainability section (page 76).
EMERGING RISKSThe risk management framework enables the Group to identify, analyse and manage emerging risks to help identify exposures as soon as possible. This is managed as part of the same process that identifies the Principal Risks. These are monitored and reviewed in conjunction with Principal Risks. While a core element of ESB’s strategy seeks to address climate change challenges, an emerging risk recognises that the pace of change is accelerating, particularly in the context of an increasing number and range of obligations.
BUSINESS CONTINUITY ESB is responsible for the provision of critical infrastructure and disruptions to certain services and operations are potentially damaging to the economy, to society and to ESB’s business. ESB has in place a robust set of business continuity plans and processes to ensure that its responses are well managed and executed. In 2020, as a consequence of COVID-19, a number of these plans were activated in real-life scenarios rather than in test scenarios, with the key lessons learned being the subject of the 2020 Business Continuity Report to the Audit & Risk Committee. In addition, an additional Board meeting was held in 2020 to brief the Board on crisis management and business continuity response to COVID-19. The exercising and testing of these plans is key to ensuring ESB’s preparedness.
CURRENT RISK APPETITE
APPROACH TO RISK MANAGEMENT The effective management of risks and the pursuit of opportunities supports the development of ESB’s strategy while protecting the interests of its stakeholders and shareholders.
ESB is exposed to a number of risks and opportunities which could have a material impact on its performance and long-term development. The effective identification, management and mitigation of these risks and opportunities is a core focus of the ESB Group.
HOW ESB MANAGES RISK The Board has overall responsibility for risk management and internal control. The current UK Corporate Governance Code 2018 (the UK Code) (Clauses 28, 29 and 31) and related guidance sets out the Board’s responsibility for determining the nature and extent of the principal risks it is willing to take in achieving its strategic objectives. The Code of Practice for the Governance of State Bodies (Section 7.2) also refers to the Board’s oversight of risk management including the requirement to “approve the risk management plan and risk register at least annually”.
The Board ensures that the Group’s risk exposure is proportional to the pursuit of its strategic objectives and longer term shareholder value. It has adopted a Risk Management Policy and Governance Framework to support its oversight of risk throughout the Group.
The Board delegates responsibility for oversight of its principal and emerging risks to Board Committees in accordance with the Committees’ Terms of Reference and their respective areas of expertise. The Committee Chairs report to the full Board on key developments and matters requiring further discussion and consideration. The Audit and Risk Committee has overall responsibility for ensuring that enterprise risks and opportunities are properly identified, assessed, reported and controlled on behalf of the Board and advises the Board on its consideration of the overall risk appetite, risk tolerance and risk strategy of the Group.
The details of the activities undertaken by the Board and the Audit and Risk Committee during 2020 in respect of their risk responsibilities are outlined on page 98.
ESB’s approach combines a top-down strategic assessment of risk and risk appetite, which takes account of the external business environment and any changes to the business model, along with a bottom-up operational identification and reporting process arising from a review and assessment of the business unit risk registers.
RISK OVERSIGHT ACTIVITIES DURING 2020In early 2020, the Audit and Risk Committee reviewed and recommended to the Board the Group Risk Plan for 2020 which set out the Principal and Emerging Risks facing the Group, including the controls and mitigating actions proposed to manage the risks over 2020. The Committee was provided
with quarterly reports which considered the status and impact of implementing the identified controls and mitigating actions which provided assurance to the committee of a robust risk management process.
The Group Risk Plan also included a comprehensive work plan for the Committee detailing its risk oversight activities for the year. The Committee identified Environment and Social Governance (ESG) and Sustainability Development Goals (SDG) as an area they wished to focus on during the year in order to engage with developments in this area as a whole as well as gain an understanding of its impact, and ESB’s approach to managing these impacts. This included:• Linking Environment and Social Governance
(ESG) to the Enterprise Risk Management process in ESB and specifically to its relevance toESB Group Principal and Emerging Risks as well as the company’s High Impact Low Probability (HILP) Risk Register
• Understanding of their impacts, and ESB’s approach to managing their impacts, in three specific areas (financing and capital markets, sustainability reporting and climate risk and reputation management)
The Committee held a virtual workshop, to which all members of the Board were invited, to examine these topics and others that became more material over 2020 in more detail. External speakers provided additional insights for the Board members.
In addition, to facilitate the Committee in remaining current with movements in the risk landscape that are relevant to ESB, a range of additional papers on key risk topics were provided to the Committee over the year. These considered topics such as the National Risk Assessment 20191 report and World Economic Forum Global Risk Review 2020, in addition to reviews of material external incidents relevant to ESB, such as the COVID-19 pandemic.
During 2020, ESB sought to identify and report on a range of key performance indicators for the Committee to aid them in monitoring the efficiency and effectiveness of their risk oversight activities.
ESB also identifies and seeks to mitigate a range of High Impact Low Probability (HILP) risks relevant to the Group. HILPs are a class of risks with the potential to cause long-term, catastrophic damage to the business. A full review of HILPs is completed on a bi-annual cycle.
A review was undertaken in 2020 in order to identify any changes to the universe of such risks. A number of previously identified HILPs remain on the register. A number have also been removed as a result of this review process where they were no longer considered low probability and are now reflected in a Principal Risk. Three additional HILPs have been included on the risk register.
Group Risk, Group Internal Audit and Group Finance functions continued to meet throughout the year in relation to internal control and risk management matters. This ensures alignment between the functions, better information-sharing and opportunities to identify areas for improvement in the overall internal control framework.
An internal audit of the Enterprise Risk Management Function was completed in 2020. The objective was
to assess the processes for identifying, challenging and reporting on business unit principal risks as part of the ESB Enterprise Risk Management process. The findings re-affirmed the process.
RISK CULTUREESB’s risk culture determines the way in which employees identify, understand, discuss and act on the risks they take and are faced with on a daily basis. (See Our Values on page 20).
To enhance risk awareness, ESB’s values continue to be a focus for discussions with all employees to ensure we create a clear and consistent understanding of how we will work. To support the embedding of risk culture, ESB has adopted policies which facilitate and encourages an environment where people can feel comfortable in raising issues and where management treat concerns seriously, professionally and in accordance with legal obligations that apply under the Protected Disclosures Act 2014.
Decision making is supported by having clear authority levels, the conduct of rigorous risk analysis as part of business/project planning and consideration of the alignment between investments and ESB's risk appetite detailed for all Board approved submissions. Specific training is provided for high-risk activities including cyber risk awareness, network operations, data privacy and energy trading activities. This approach has ensured that risks and uncertainties are highlighted at an early stage so that prompt action can be taken to minimise any impact they might have on employees and other stakeholders.
The Board is ultimately responsible for setting the tone at the top of the organisation. The approaches outlined have provided the Board with assurance that the risk culture supports the effective management of enterprise risk. A Culture Dashboard provides updates to the Board, through the Safety, Environment and Culture Committee on the effectiveness with which the desired culture, aligned to ESB’s values has been embedded throughout the organisation.
RISK APPETITE ESB’s Risk Appetite Framework is focussed on setting the risk appetite at the Group level across different risk dimensions and provides the basis for communicating risk appetite down through the organisation. Consideration is given to its presence across all aspects of the industry value chain, its commitment to prudent financial management and the strong ethical approach to how ESB does business.
Risk appetite guides the annual business planning process by defining the desired forward-looking risk profile of the group in achieving strategic objectives. It is embedded in day-to-day risk management decisions through the use of risk tolerances and limits for material risk types (e.g. energy trading and treasury operations). This ensures the risk profile remains aligned with risk appetite, balancing risk and returns.
The Group Risk Appetite Statement is approved by the Board on the advice of the Audit and Risk Committee. The Brighter Future Strategy
RISK LEVEL UNWILLING TO TAKE RISK HIGHER WILLINGNESS TO TAKE RISK
Prudent Financial Management
Presence of Scale Across Value Chain
GTS of Scale (Republic of Ireland, Northern Ireland, Great Britain)
Engaged and Agile Organisation
Sustainable Innovation
Value, Ethics and Compliance
Reputation
Information Security
Smart Reliable Networks
Risk Appetite Range
Actual Net Risk Assessment Further Planned Improvements
1 Published by Department of the Taoiseach2 Published by World Economic Forum
RISK REPORT
CO
RP
OR
ATE G
OV
ER
NA
NC
E
02
FINA
NC
IAL S
TATEM
EN
TS
03
01
STR
ATEGY
AN
D P
ER
FOR
MA
NC
E

26 ESB Annual Report 2020 - Brighter Together ESB Annual Report 2020 27
CO
NTR
OLS
Approves ESB Group Strategy
Approves Risk Policy, overall Risk Management Framework, Risk Appetite, Risk Plans and
Performance TargetsFINANCE AND INVESTMENT COMMITTEE
Advises on risk appetite, risk
governance and other high-level risk
related matters
Formulate and implement strategy within risk appetite
Responsible for risk governance and controls
Describes risks the Group is prepared to accept based on long-term strategy, core risk principles, values and risk management competencies
PRINCIPAL AND EMERGING
RISKS
BUSINESS CONTINUITY
TESTING
RISK AND CONTROL HEAT
MAP
Risks arising from business activities that are measured, monitored and managed
UNDERPINNED BY ESB VALUES
Advises on energy trading, treasury and investment / project
related risk
Advises on policies and procedures to ensure ESB meets its health,
safety and environmental obligations
Ensures alignment between approved risk appetite,
compensation, selection and related decision-making
processes
Ensures marketing and customer initiatives and programmes
are aligned to ESB's strategic objectives
AUDIT AND RISK COMMITTEE
SAFETY, ENVIRONMENT, AND CULTURE COMMITTEE
REMUNERATION AND MANAGEMENT DEVELOPMENT
COMMITTEE
CUSTOMER MARKETING AND INNOVATION COMMITTEE
ROLE OF SENIOR MANAGEMENT
RISK APPETITE
RISK MANAGEMENT PROCESSES AND PROCEDURES
TOP DOWN
BOTTOM UP
RISK MANAGEMENT POLICIES AND GOVERNANCE FRAMEWORK
Ensures appropriate oversight of accountability for management
of risk
THREE LINES MODEL
Defines roles and responsibilities for risk management
RISK CULTURE
Empowers people to do the right thing for stakeholders, customers
and employees
INDEPENDENT RISK FUNCTION
Ensures the necessary review and monitoring of risk
PROCESSES TO IDENTIFY, MONITOR AND MITIGATE RISKS THAT EXCEED THE RISK
APPETITEPR
OC
ES
SE
S
ROLE OF BOARD
PRINCIPAL BUSINESS UNIT RISKS
RIS
K E
XP
OS
UR
EIm
pact
* L
ikel
ihoo
d
25
20
15
10
5
0
20 3 4 5
LOW HIGHMANAGEMENT PREPAREDNESS
HIG
HLO
W
B
G
E
DIMPROVE MONITORCONTROLS
MONITORRISKS
ACCEPT OPTIMISE
RISK AND CONTROL HEAT MAP RISK MANAGEMENT FRAMEWORK
C
A IH
F
J
HEALTH AND SAFETY OPERATIONAL
FINANCIAL STRENGTH FINANCIAL
STRATEGY DELIVERY, INCREASED PACE OF TRANSFORMATION STRATEGIC
REGULATORY, POLICY INTERVENTIONS/DECISIONS OR POLITICAL/ECONOMIC UNCERTAINTY REGULATORY
INFRASTRUCTURE, PROJECT AND PROGRAMME DELIVERY CHALLENGES OPERATIONAL
SYSTEM OUTAGE AND CYBER ATTACK OPERATIONAL
RESOURCING AND CAPABILITY OPERATIONAL
ENVIRONMENT INCIDENT/ LEGISLATION BREACH OPERATIONAL
BRAND OR REPUTATION REGULATORY
CHALLENGES AND RISKS ASSOCIATED WITH COVID-19 PANDEMIC AND ITS IMPACTS OPERATIONAL
BG
E
D
C
A
I
H
F
J
CO
RP
OR
ATE G
OV
ER
NA
NC
E
02
FINA
NC
IAL S
TATEM
EN
TS
03
01
STR
ATEGY
AN
D P
ER
FOR
MA
NC
E
▲ INCREASE UNCHANGED – DECREASE▼
Risk Climate

28 ESB Annual Report 2020 - Brighter Together ESB Annual Report 2020 29
The principal risks and opportunities that have the potential to have a significant impact upon the Group’s strategic objectives are set out below, together with an indication of the strategic objective to which they relate, any change in the risk climate during the year, who is responsible for monitoring the risk, the principal mitigations, developments in relation to the risk during 2020 and areas of focus for 2021.
PRINCIPAL RISKS
OPERATIONAL
A. HEALTH AND SAFETY Risk ClimateOversight: Safety, Environment & Culture Committee
What is the risk? Risk Drivers Mitigations Developments in 2020 2021 Area of Focus
Risk of serious injury or death to staff, contractors or the public
• Inadequate policies and procedures• Inadequate competence (training, knowledge and
experience)• Lack of compliance with standards and procedures• Failure to maintain assets• Involvement in new unfamiliar activities e.g. offshore
wind• Defective/unsafe third-party infrastructure• Security risks at home and abroad• Lack of awareness, knowledge or due care and
attention by a member of the public
To prevent the risk materialising:
• Setting of Group Standards• Detailed training, development and approvals processes• Safety Culture Transformation programme• Engagement programmes for employees, contractors and the public• Confidential disclosures facilitated via confidential helpline (managed by
Group Internal Audit)• Maintenance management systems, equipment inspection and
certification and statutory inspections• Assurance and audit processes (external and internal)• External certification e.g. ISO• Completion of risk assessments pre-staff business travel or mobilisation
overseas• Consolidation of group wide security responsibilities in a central
Enterprise Security Manager role• Public safety programmes
If the risk materialises:
• Critical incident management andresponse procedures
• Scenario testing• Crisis management/business
continuity processes, pandemic response
• Deployment of occupational health& wellbeing services to support employees
• Incident investigation standardprocedures
• Monitoring, tracking and reporting of serious incident action completions
• Feedback and resolution to support continuous improvement and learning
• Pandemic response processes initiated and maintainedthroughout the year
• Face to face contacts reduced to essentialcircumstances only
• Many training programmes being delivered remotely• New challenge is how to keep people 'Safe & Sound'
during COVID-19. Local leadership teams, business unitleadership teams, and coaches worked remotely on this challenge
• Safety Statements updated to include COVID-19 risk• Implementation of Safe Systems of Work progressing• ESB Central Safety Management System (SMS)
Certification audit to ISO 45001 by NSAI completed remotely. External auditor recommended Registrationand Certification to ISO 45001
• Processes revised for remote working • Critical incident management procedure invoked. Two
fatalities occurred in 2020, and investigations have been completed
• Lost Time Injuries (LTIs) total down compared to 2019
• Health and safety will continue to be a central focus for ESB in 2021 and ESB will further strive to embed a high-performance culture as part of the Brighter FutureStrategy
• Pandemic Response processes will be maintained for the duration of the pandemic. This will include safety and health while on site, while homeworking and whilein the office, in compliance with national guidelines
• Extend Safe & Sound programme to the rest of ESB• Tackle human factors as a causation of high potential
severity (P1) incidents• Continue focus on safe driving and launch new Road
Safety Strategy• Promote the new Health, Safety and Environment
Framework• Health & Wellbeing programme to include new psycho-
social standard, Stress Management Programme and Mental Health First Aid
• Complete the migration to ISO 45001 for all locations• Manage the potential increase in safety risk when
people return to work as the pandemic diminishes and maximise the opportunities associated with SmartWorking
• Focus in 2021 in ESB Networks on Electrical Safety• In GT the Safe Systems of Work project will be ad-
vanced in 2021
STRATEGIC OBJECTIVES
Put customers’ current and future needs at the centre of all our activities
Produce, connect and deliver clean, secure and affordable energy
Develop energy services to meet evolving market needs
Grow the business while maintaining ESB’s financial strength
Deliver a high-performance culture that supports innovation and collaboration
FINANCIAL
B. FINANCIAL STRENGTH Risk ClimateOversight: Finance and Investment Committee
What is the risk? Risk Drivers Mitigations Developments in 2020 2021 Area of Focus
Failure to maintain the financial strength required to underpin the long-term viability of ESB in the context of pressures on performance and greater capital intensity
• Risk of exceeding regulatory allowances• Fail to negotiate financeable new price control
contract• Failure to deliver Performance Improvement Initiatives• Changes in competitive environment in supply
businesses• The risk of failure to transform the Generation
portfolio at the required pace to meet the strategytargets
• Sustained reductions in market revenues in Republicof Ireland and GB
• The risk of a material breach of trading limits, either inadvertent or deliberate and/or unforeseen movement in trading collateral
• Change in credit rating methodology and/or thresholds
• Ongoing uncertainty relating to COVID-19, the pace and timing of the economic recovery, Brexit uncertainty
To prevent the risk materialising:
• Implement business planning and budgeting processes focused ondelivery of ESB's Brighter Future Strategy and protecting financial strength
• Price control contract project and supporting governance framework• Setting of appropriate hurdle rates for investment decisions• Accelerated delivery of the Performance Improvement Strategic Initiative• Continued focus on identifying new businesses/technologies to drive
future growth opportunities• Keep capital allocation under review across the ESB Group• Continued focus on delivery of regulatory contracts• Continue to investigate and assess all opportunities to develop a pipeline
of options to ensure generation asset growth targets are achievable• Optimise GT strategy to capture all market opportunities• Proactively monitor competitor behaviour and adjust customer strategies
appropriately• Exit non-profitable business lines• Robust trading and risk management framework
If the risk materialises:
• Revise ESB Group strategy in order torebuild financial strength
• Address regulatory challenges through direct engagement withregulatory authorities
• Consider approach to futureinvestment plans
• Consider range of financial flexibilityoptions
• Implement aggressive cost reductionprogrammes
• Final determination on ESB Networks Price Review 5(PR5)
• In February 2020, ESB negotiated a new €1.4 billionSustainability-linked revolving credit facility
• Ongoing uncertainty relating to COVID-19 and the paceand timing of the economic recovery
• ESB invested to take a 50% stake in the circa 1GWInch Cape offshore wind project
• Proactive management of performance improvementtargets set by the Board for all businesses
• Ongoing Regulatory and stakeholder engagement inrespect of delivery of ESB Networks' PR5
• Delivery of business plans and exploring financialflexibility options
• Delivering a high performance culture that supportsinnovation and collaboration
• Continued focus on identifying new businesses/ technologies and developing a pipeline of generationassets options to drive future growth opportunities
CO
RP
OR
ATE G
OV
ER
NA
NC
E
02
FINA
NC
IAL S
TATEM
EN
TS
03
01
STR
ATEGY
AN
D P
ER
FOR
MA
NC
E

30 ESB Annual Report 2020 - Brighter Together ESB Annual Report 2020 31
STRATEGIC
C. STRATEGY DELIVERY, INCREASED PACE OF TRANSFORMATION
Risk Climate Oversight: Board
What is the risk? Risk Drivers Mitigations Developments in 2020 2021 Area of Focus
Delivery of the Brighter Future Strategy, given the increased pace of transformation in the market
• Failure to deliver ESB's purpose and strategy of leading the transition to a low-carbon society and supporting Ireland's delivery of the National ClimateAction Plan
• Failure to match the customer/market/Governmentexpectation on the pace of decarbonisation
• Failure to adopt ways of working to deliver the performance improvement as set out in the businessplans
• Failure to adopt technology to support new growthand operations
• Failure to deliver the products and services to supportthe electrification of heat and transport efficiencies
• Increase in competitive intensity in all areas fromtraditional and new types of competition
To prevent the risk materialising:
• Alignment of purpose, strategy and business performance through thebusiness planning process
• Identification of the performance improvement required and clear plans toachieve
• Development of strategic plans to deliver the strategy• Embedding Organisation Effectiveness (OE) to deliver standardisation,
industrialisation and new ways of working to support the pace of change• Innovation framework in place to support the ideation and adoption of new
products and services• Group Strategy Forum embedded to ensure market changes are assessed
regularly• Board and Executive Director Team (EDT) led Group strategy process with
regular reviews of strategic environment and performance at Group level• Tracking of strategic performance indicators• PR Submission focussed on enabling ESB to support the delivery of the
National Climate Action Plan and a significant number of projects underwayto ensure ESB are ready to deliver its commitments
If the risk materialises:
• Integrated business planning embedding into the organisation linking strategy, business and capability requirements to drive responseas and when required
• Increased performance initiatives clearly identified in the integrated business planningprocess and clear ownership within ESB
• Enhanced focus on customer centricity to enhance customer engagement and ensure that products and services meet their expectations
• Enhanced focus on process improvementand digitalisation through the Digital Accelerator and Digital Factory
• X_Potential and the Innovation Council supporting the development of new servicesand products
• Potential to trigger a fundamental strategy review if and when performance/developments require this
• Detailed Performance Improvement plans were drawn up insupport of strategy delivery
• 2020 Business Unit (BU) Strategic plans were developedwhich reflect recent changes to the ESB strategic environment
• OE structures were put in place during 2018 and theprocesses continued to be embedded through 2020
• Customer centricity is continuing as a Strategic Initiative,and a number of BU transformation initiatives are also customer related. Customer centricity was a key part of ESB's COVID-19 response
• Key external drivers informing this strategy have been kept under continuous review throughout 2020. For example, the ESB EDT continued to monitor developments in ESB's business environment impacting strategy. A Board strategyreview day was held during November 2020 as well as a series of updates throughout the year on key emerging issues
• Continue to monitor and review key externalstrategy drivers
• Ensure 2021 BU strategic plans are developed which reflect recent changes to theESB strategic environment
• Board strategy review days to be held during 2021 as well as a series of updates throughout the year on key emerging issues
ECONOMIC UNCERTAINTY – REGULATORY
D. REGULATORY, POLICY, INTERVENTIONS/DECISIONS OR POLITICAL/ECONOMIC UNCERTAINTY
Risk ClimateOversight: Audit and Risk Committee
What is the risk? Risk Drivers Mitigations Developments in 2020 2021 Area of Focus
Adverse regulatory interventions, policy decisions or political/economic uncertainty
• Unfavourable PR 5 outcome• Offshore wind: Delay or risk in achieving appropriate
regulatory or policy regime change/clarity• Potential of failure to achieve expected policy benefits
from Climate Action Plan (e.g. due to counter-lobbying)• Adverse external decisions (regulatory, economic,
financial and environmental) that negatively impactI-SEM market rules
• Potentially unfavourable elements of Clean EnergyPackage passed into Irish Law
• Regulator applies a price cap in GB that impacts on ESB Energy (GB) or uncommercial conditions appliedto ROI supplier handbook for Electric Ireland
• Brexit: Failure to achieve the Transitional Agreementand implement the Withdrawal Agreement results in difficulties for the All Ireland Market
• Growing populist sentiment/increasing public concernon Climate Change leads to regulation that damages ESB business
• Slowing global macroeconomy due to geo-political tensions resulting in reduced growth in Ireland andthe UK
To prevent the risk materialising:
• Programme management structure (including stakeholder management) inplace for PR5
• ESB Offshore Wind contribute positively and effectively to policy andregulation development
• Stakeholder engagement plan with policy makers and regulatory authorities• Clean Energy Package Assurance Programme in place and Climate Action
Plan closely monitored in ESB• Regulation teams monitoring developments closely• ESB Brexit Task Force in place to address Brexit related risks, plan for worst
case and monitor preparedness
If the risk materialises:
• Reduction in planned capital expenditure andto enhance financial performance
• React swiftly to decisions negative to ESB• Revise Integrated Business Planning Process• Decide on viability of businesses and take
strategic decisions in light of any changes including considering the sale/closure of anybusiness considered unviable
• Implement regular strategic reviews takingmacro-economic climate into account and respond strategically and operationally as required
• PR5 has concluded in Q4• The economic situation remained uncertain at the end of
2020, with some positive outlook in terms of the imminentroll out of the COVID-19 vaccine and EU Green Deal Recovery Programme
• Key focus areas will be:- The risk of increased activism by Regulatory Authori-
ties and regulatory decisions remains. The uncertainty over the regulatory and legal situation to facilitate ESB's offshore wind ambition remains
- EU climate mitigation ambition via carbon reduction has formally increased to 55% by 2030 which is in line with the direction of ESB strategy
• ESB will continue to proactively monitor and engage with regulatory, political and economicdevelopments over 2021 in order to ensure that ESB is positioned to mitigate any risk that materialises and leverage any related opportunities
• Key focus areas will be:- Economic risks (COVID-19/Brexit)- Green Deal/Climate Action Plan (CAP) Implementation risks- Offshore wind policy- Clean Energy Package related risks
STRATEGIC OBJECTIVES
Put customers’ current and future needs at the centre of all our activities
Produce, connect and deliver clean, secure and affordable energy
Develop energy services to meet evolving market needs
Grow the business while maintaining ESB’s financial strength
Deliver a high-performance culture that supports innovation and collaboration
CO
RP
OR
ATE G
OV
ER
NA
NC
E
02
FINA
NC
IAL S
TATEM
EN
TS
03
01
STR
ATEGY
AN
D P
ER
FOR
MA
NC
E

32 ESB Annual Report 2020 - Brighter Together ESB Annual Report 2020 33
OPERATIONAL
E. INFASTRUCTURE, PROJECT AND PROGRAMME DELIVERY
Risk ClimateOversight: Audit and Risk Committee
What is the risk? Risk Drivers Mitigations Developments in 2020 2021 Area of Focus
Infrastructure, project and programme delivery challenges
• PR4: Reduction in PR5 revenues for PR4underdelivery and/or price variance
• PR5: unfavourable outcome resulting in increased work programme at significantly lower allowed cost
• Ability to meet significant increase in infrastructure demand due to difficulties securing land access andanti-protestor activity
• Availability of contracted resources to deliver certainspecialised work
• Requirement for accelerated delivery of grid connections as result of the Renewable EnergySupport Scheme (RESS) auction(s)
• Increasing sentiment against CO2, increasingplanning/consenting risk for new thermal assets
• Potential to fail to secure a viable Marine Planningregime aligned with GT
• More onerous requirements for consenting ofonshore wind farms
• Risk of not having the right delivery people/capabilityin place to deliver major projects - especially in emerging areas and in areas with high levels of demand (e.g. offshore, commercial & procurement)
• Embedding the role and transition of projects to EMP• SIRO network/FTTB roll-out is slower than business
plan
To prevent the risk materialising:
• Robust PR5 submission from ESB Networks and EMP supported bybenchmarking
• Mitigate against lack of contractor resources by growing contractornumbers and types of contracting
• Collaborative development of a 10-year plan to determine Dublin's infrastructure and reinforcement requirements between ESB Networksand Eirgrid
• Stakeholder engagement at senior level (and monitoring) to ensure thatdevelopments in planning and consenting reflect GT delivery objectives for offshore and onshore
• Continued engagement with Group Finance and internal stakeholders inrelation to market developments for offshore/onshore solar acquisition opportunities
• Integrated business planning, which informs the strategic resourceplanning and succession planning
• People and Organisation Development to ensure that required capabilitiesare identified and put in place to support delivery
• Stakeholder management plans prepared and early local and nationalinteraction with key stakeholders
• Implementation of ESB Project Management Methodology to efficientlydeliver all major projects
If the risk materialises:
• Consider alternative innovative approaches to connections
• Further review optimal resource modelto deliver work programmes
• Efficiency initiatives including new contracting models and time to connect
• Short-term redeployment of resourcesto critical roles
• Review strategy
• Measures successfully implemented to ensure that engineeringdesign and project delivery for both ESB Networks and GT businesses continued during the COVID-19 pandemic
• Significant projects and infrastructure work delivered including Grousemount 114 MW wind farm, GT Overhaul Programme, ProjectFitzwilliam construction and networks infrastructure
• PR5 concluded at the end of Q4, with approximately 50% increase incapital expenditure investment versus PR4
• Significant progress made in GT to grow the future generationpipeline
• ESB secured 50% of the 1GW Inch Cape Offshore Windfarm (UK)project
• Progressed onshore and offshore pipeline through existingpartnerships
• From the first RESS auction, ESB secured contracts for onshore windproject, Oweninny 2 and two ground mounted Solar PV
• ESB Networks has been informed of 82 generator connections required in 2021 and 2022 to meet RESS subsidy requirements
• SIRO passed an additional 61,000 premises in 2020 bringing thetotal network size to over 360,000
• RESS2 Auction - 2021 expected to take place in Quarter 2 2021 and ESB'sportfolio should be well positioned to partake in the auction
• Deliver RESS1 projects• Further developing the delivery
capabilities to meet ESB Networks and GT significant projected increase in investment pipeline over the period2021 - 2025
• Network Technician resource productivityand contractor growth project teams are working to grow capability in a co-ordinated way between private sector and ESB Networks teams to meet PR5 requirements
OPERATIONAL
F. SYSTEM OUTAGE AND CYBER ATTACK Risk ClimateOversight: Audit and Risk Committee
What is the risk? Risk Drivers Mitigations Developments in 2020 2021 Area of Focus
Extended outage of critical information technology (IT)/Operational Technology (OT) systems arising from non-malicious infrastructure failures or successful cyber attacks and/or significant data leakage
• Successful cyber attack, including ransomware or phishing attack, on ESB/outsource partners systems
• Significant hardware issue, software error, networkingfailure resulting in failure of IT or OT infrastructure/ systems
• Availability of expertise• Increasing reliance on technology/systems for
business processes• Increasing frequency and sophistication of attacks• Third-party mobile network/telecommunication failure• Human error• Sub-optimal data management processes• Inadequate controls for third party 'shadow' IT
solutions• Significant number of large-scale projects going live
towards the end of 2020 -for example, SAP upgrade, and Smart metering
To prevent the risk materialising:
• Continuous monitoring of ESB's cyber environment• Regular review of IT systems & their resilience• Suite of IT policies/procedures, in line with best industry standards• IT security awareness across the organisation• Timely upgrade of key IT systems and applications• Disaster recovery and failover arrangements• Cyber policies, strategy and governance model in place and continued
development of cyber IT/OT operating model as threat landscape and ESB'stechnology footprint grow
• Cyber operating model in place to manage first line, second line of defencefor IT and OT
• Data Protection Policies and Operating Model in place• Cyber security and GDPR Awareness and training across the organisation• Governance and approach to Network and Infrastructure systems (NIS)
compliance agreed between National Cyber Security Centre, Chief Information Officer, IT Delivery, Generation and Networks
• IT operating model aligned to ITIL model in place, including adherence to timelyupgrades of key IT systems in order to remain in core support with vendor
• Testing and simulation exercises for critical response plans
If the risk materialises:
• Activate crisis management plans• Implement lockdown of firewall, if
appropriate• Implement Cyber Incident Response
Plan and Recovery plans• Continue to strengthen IT Security's
response and recovery capability• Provide accurate and timely
communications to regulators, stakeholders, employees and customersin accordance with ESB’s values
• Activate breach management process, including trend and root cause analysisfor data protection incidents
• Activate IT Incident Management Process including incident review andlessons learned
• ESB Cyber Security Programme was completed in 2020• Significant ongoing investment in prevention and detection
capabilities• Preparations underway for NIS directive implementation• Cyber security maturity assessment completed and cyber security
strategy 2021-2024 development in progress• Cyber security phishing and awareness programme rolled out to all
staff and partner staff throughout 2020• COVID-19: Regular communication updates issued to ESB Group via
the Hub/Yammer on cyber awareness relating to COVID-19 related phishing, use of unapproved software and security working from home
• Dedicated integration planning role put in place in project delivery toensure strong planning around the multiple project go-lives dates
• There is a plan in place for ongoing management of mitigationactions for the following critical areas in ESB:- Security Patch Deferrals,- Remote Working,- Malicious Activity,- Unapproved Solutions,- Ransomware and Control Systems
• As a key national infrastructure provider,cyber risk is a priority for the Board. The aim is to maintain top quartile maturity
• Successful delivery of SAP S/4 Hana upgrade project (Project LEAP) and the IT and data aspects of the Smart Metering programme, SMART working (supporting remote working)
• Implementation of a new cyber security programme based on the refreshed Cyber Security strategy 2021 - 2024
STRATEGIC OBJECTIVES
Put customers’ current and future needs at the centre of all our activities
Produce, connect and deliver clean, secure and affordable energy
Develop energy services to meet evolving market needs
Grow the business while maintaining ESB’s financial strength
Deliver a high-performance culture that supports innovation and collaboration
CO
RP
OR
ATE G
OV
ER
NA
NC
E
02
FINA
NC
IAL S
TATEM
EN
TS
03
01
STR
ATEGY
AN
D P
ER
FOR
MA
NC
E

34 ESB Annual Report 2020 - Brighter Together ESB Annual Report 2020 35
OPERATIONAL
G. RESOURCING AND CAPABILITY Risk ClimateOversight: Safety, Environment & Culture Committee
What is the risk? Risk Drivers Mitigations Developments in 2020 2021 Area of Focus
Challenge to align current and future resourcing levels and capabilities with changing needs of the business and customers
• Failure to develop and deliver the optimumcapability models in order to deliver the strategy ina cost effective manner
• Failure to attract and retain capability in a highlycompetitive labour market
• Failure to continuously develop ESB's capability tokeep abreast of the changing business needs
• Failure to manage the Industrial Relations (IR)environment during this time of change in theorganisation
• Failure to engage employees and embed the neworganisation to deliver the Brighter Future Strategy
To prevent the risk materialising:
• People Capabilities Transformational Programme 2020 focused ondelivering the future capability requirements to deliver the strategy
• Succession management• Engagement programmes in place and aligned to the Brighter Future
Strategy• Surveys to monitor engagement levels• Increased collaboration leading to a 'One ESB' approach• Ongoing union engagement• Enhanced performance management process• Ongoing monitoring of OE implementation
If the risk materialises:
• Embedding key people processes suchas strategic workforce planning and succession management
• New ways of working programme and"Our Voice" staff survey in place toengage employees, adopt technology, enhance collaboration and innovative thinking
• Operational plans in place to manageindustrial relations issues
• Ongoing review of key scarce capability• Contractor / partnering models in place
to manage scarce capability• Performance process and 'my
development' process in place• Strong leadership and development
programmes as well as opportunities to join collaborative groups and participatein X_potential to enhance capability development
• A comprehensive cross company analysis of current and futurecapabilities completed
• Talent Forum established to encourage rotation possibilities intoleadership roles. Senior Management Teams now involved in 360feedback process aligned to leadership profile/ traits
• Technical capability review complete• Strong leadership and development programmes developed and
rolled out for virtual delivery• 3 surveys conducted in 2020 to monitor staff engagement
• Develop strategic workforce plan and process that enables a workforce thatwill deliver company strategy
• Continue work on development plansdriving technical and behaviouralcapability
• NT resource productivity and contractor growth project teams are working to grow capability in a co-ordinated way to meet PR5 requirements.
STRATEGIC OBJECTIVES
Put customers’ current and future needs at the centre of all our activities
Produce, connect and deliver clean, secure and affordable energy
Develop energy services to meet evolving market needs
Grow the business while maintaining ESB’s financial strength
Deliver a high-performance culture that supports innovation and collaboration
OPERATIONAL
H. ENVIRONMENT INCIDENT / LEGISLATION BREACH Risk ClimateOversight: Safety, Environment and Culture Committee
What is the risk? Risk Drivers Mitigations Developments in 2020 2021 Area of Focus
Significant environmental incident/issue or inadvertent breach ofenvironmental legislation
• Lack of compliance with legislation (planning andenvironmental legislation e.g. EPA Act, WasteManagement Act, Air Pollution Act etc.), licencesor permits and/or poor compliance monitoring dueto inadequate systems of work or behaviours
• Erosion of technical competence in-house staffor contractors working to a standard below ESB'sexpectations
• Systems of work and staff competence areinadequate for new sectors, technologies andincreased project pace
• Potential failure of ageing assets (workplace tools,plant & equipment)
• Inadequate system of interaction and reportingbetween ESB and statutory environmentalagencies (System of Work)
• Changes in external expectations
To prevent the risk materialising:
• Group-wide standards• Developing a competency and training framework process• Engagement programmes: briefings, Good Catch, Contractor
Environmental Awareness programmes• Group environmental legislative compliance process• Assurance & audit process (external and internal)• External benchmarking and improvement plans• Engagement with statutory environmental agencies on proposed
legislation and licensing regimes• Continuing ISO 14001 certification of ESB’s environment management
systems to independently verify strategy is embedded• Group assurance processes to reassess and seek enhancement of
processes in the light of changing requirements• Ensure high awareness of licence/permit requirements, compliance and
monitoring• Optimisation and maintenance of plant to meet environmental standards• Address identified risks to network infrastructure through CRU
regulatory price submissions and associated stakeholder managementplan
• ISO 55001 certification
If the risk materialises:
• Activate Environmental IncidentManagement and Responseprocedure
• Implement business continuityprocesses
• Incident investigation standard andprocedures
• Monitoring, tracking and reporting ofserious incident action completions
• Address any environmentalmanagement system major non-conformances in an adequate andtimely manner
• Work is ongoing in all business units (and by the COVID-19 Crisis Management Teams) to mitigate environmental risks as well as anyspecific new additional risks stemming from COVID-19
• A separate Safety, Health and Environment (SHE) risk register isbeing maintained during the COVID-19 pandemic
• A Group legislation register has been developed in conjunction withEngineering and Major Projects
• A monthly environmental legal review process is now in place• A list of top environmental risks was maintained• Good progress has been made in the ESB Networks business in
addressing the key risks• The Environmental standards audit programme was curtailed
due to the COVID-19 pandemic. A climate risk process has been piloted across the Group. This work plus other measures taken on governance and carbon footprint have earned ESB a CDP (CarbonDisclosure Project) 'A' rating in 2020
• Recertification was achieved for ISO 5001 (Energy Management)with associated improvements across buildings and fleet energy
• Application submitted to the science-based targets initiative• All AIE (Access to the Information on Environment) Regulation
requests responded to on time• Continued focus on environmental reporting on SHIELD (Safety,
Health and Environment IT System)
• It is proposed to apply the FailureModes and Effects Analysis (FMEA)risk assessment methodology to thetop risks in 2021
• Addressing the key risks in ESBNetworks as part of an environmentalimprovement plan
• Standards audits will resume in allbusiness units.
• The first climate risk disclosure willbe made in the 2020 SustainabilityReport and climate risk process will bebedded in across the business
CO
RP
OR
ATE G
OV
ER
NA
NC
E
02
FINA
NC
IAL S
TATEM
EN
TS
03
01
STR
ATEGY
AN
D P
ER
FOR
MA
NC
E

36 ESB Annual Report 2020 - Brighter Together ESB Annual Report 2020 37
REGULATORY
I. BRAND OR REPUTATION Risk ClimateOversight: Customer, Marketing and Innovation Committee
What is the risk? Risk Drivers Mitigations Developments in 2020 2021 Area of Focus
Risk of damage to brand or reputation
• Gap between expectations of ESB andstakeholder experience
• Failure to manage communications andstakeholders effectively in a crisis situation
• Environmental damage/safety issues caused bylegacy infrastructure or faulty equipment
• Increased national and local resistance to publicinfrastructure projects resulting in poor communityrelations
• Failure to contribute appropriately to the deliveryof the Clean Energy Package and the NationalClimate Action Plan
• Failing to proactively/appropriately engagewith politicians, policy makers and other keystakeholders
• Failure to innovate and adapt to customer needs• Inadequate response following damage to the
network arising from adverse weather conditions• Breach of license/legal obligations or inadequate
attention given to quality/planning permissionconditions
• Major privacy breach results in loss of personaldata leading to investigation and levying ofpenalties/fines by DPC
• Misuse of social media channels by ESB staff• Failure to manage communications relating to a
cyber security attack
To prevent the risk materialising:
• Brighter Future Steering Committee in place to coordinate messagingand oversee brand governance.
• Stakeholder forum to coordinate and drive stakeholder engagement• Brand and sponsorship programs to drive and engage community
support• Media relations strategy, Press office and agency support to pro-actively
manage media relations• Crisis communications plan for major events• Certified maintenance procedures in line with industry best practise• Monitoring of compliance by Group Risk and Compliance• Culture/value project to drive behaviour and values• Customer centricity strategic initiative to drive customer centricity across
the company• Due diligence undertaken to ensure association with 3rd parties aligns
with ESB's values• GDPR governance framework established and policies in place for data
protection• Digital Content Manager and external communications policy and social
media policies• Regular brand and reputation tracking/analysis to identify emerging
issues• Communications plan and internal alerting system for cyber attack
If the risk materialises:
• Activate relevant emergencyplans, storm action plans, crisisand stakeholder management/communications plans, as appropriate
• Corporate communications activateexternal PR support arrangements, asappropriate
• Supplement resources of thecorporate communications team in acrisis situation
• Timely and accurate response toissues with the fullest informationpossible provided
• Ensure response to any crisis isconsistent with ESB's purpose andvalues
• Ongoing support for customers and communities impacted byCOVID-19
• Brand and sponsorship programmes in place to drive communitysupport and communicate values
• Priority COVID-19 stakeholder list created and interactionstracked on a weekly basis
• Customer centricity strategy completed and new measures beingimplemented to action customer centricity across ESB
• Continue to engage with relevant stakeholders in relation to allprincipal and emerging risks
• Undertook in-depth reputation research among key stakeholdersto understand perceptions of ESB issues of material concern toits stakeholders
• See risk F - 'System Outage and Cyber Attack'
• ESB will strive to further enhance itsreputation in 2021 through continuedinvestment in brand and sponsorshipinitiatives, leading the conversationabout the transition to a low-carbonenergy future and further developingexcellence in stakeholder engagement
• Tracking, reporting and aligningcommunications around theenvironmental, social and governmentissues that matter most tostakeholders
• Increasing the support for the arts inthe wake of COVID-19 and enhancingcommunications of CSR activities.
• Integrating findings from 2020stakeholders research into reputationplanning for 2021
• See risk F - 'System outage and CyberAttack'
STRATEGIC OBJECTIVES
Put customers’ current and future needs at the centre of all our activities
Produce, connect and deliver clean, secure and affordable energy
Develop energy services to meet evolving market needs
Grow the business while maintaining ESB’s financial strength
Deliver a high-performance culture that supports innovation and collaboration
CO
RP
OR
ATE G
OV
ER
NA
NC
E
02
FINA
NC
IAL S
TATEM
EN
TS
03
01
STR
ATEGY
AN
D P
ER
FOR
MA
NC
E

38 ESB Annual Report 2020 - Brighter Together ESB Annual Report 2020 39
OPERATIONAL
J. CHALLENGES AND RISKS ASSOCIATED WITH THE COVID-19 PANDEMIC AND ITS IMPACTS
Risk Climate Oversight: Board
What is the risk? Risk Drivers Mitigations Developments in 2020 2021 Area of Focus
Challenges and risks associated with the COVID-19 pandemic and its impacts
• Failure to establish controls and arrangements toensure that staff, contractors and customers areprotected to the maximum extent possible
• Inadequate pandemic response and businesscontinuity arrangements established, orarrangements not invoked appropriately
• Failure to secure essential service status• Loss of key leadership roles• Failure to establish and maintain an efficient &
effective remote working capability• Failure to identify and mitigate all pandemic
related exposures for business units and establishappropriate responses
• Failure to manage supply chain challenges, inparticular in relation to PPE and hygiene products
• Failure to establish a process to identify thelonger term impacts for business plans or strategy,or business plans/strategy are not adjustedappropriately
• Failure to manage costs effectively• Failure to engage with our stakeholders or
customers to ensure concerns are appropriatelyaddressed and managed
• Pressures on highly energy-dependent industriesand consumers
• Strain on SHE organisation overwhelms othersafety responsibilities
• Failure to communicate clearly with employeesabout plans for managing health and safety andfuture ways of working
• Extended delay in finding cure/vaccine• Multiple/coordinated crystallisation of risks (e.g.
HILP/principal risk – cyber event and pandemicsimultaneously)
• Failure to plan appropriately for management ofstorm response activities in the face of resourcechallenges potentially arising from COVID-19
• Failure to conduct periodic reviews and lessonslearned
To prevent the risk materialising:
• Invoke the arrangements envisaged under ESB's PandemicPreparedness Plan, Crisis Management plans and Business Continuityplans, with particular focus on arrangements for ensuring responseefforts are aligned
• Establish the controls and supports required to minimise any risk to thesafety, health and wellbeing of all ESB employees and contractors, theirfamilies, customers and the public at large
• Immediately identify critical employees and alternates for all keyprocesses, and ensure stringent arrangements are established for theprotection of these employees where appropriate
• Engage with key stakeholders regarding essential service status• Instigate a review to identify ESB’s critical contracts to ensure that risks
of supply shortages are minimised and to identify risks and additionalmitigations that may be required arising from the pandemic
• Identify exposures and establish any additional mitigations required inrelation to ESB's financial position, to ensure financial commitments areserviced
• Establish appropriate arrangements to provide all necessary information,and to address the queries or concerns of staff, stakeholders, customersand the public at large
• Complete a scenario planning exercise in the context of the COVID-19pandemic, identifying potential scenarios for the various phases of thepandemic. Determine the issues, opportunities and risks associated witheach of the scenarios, ultimately incorporating these into integratedbusiness planning and strategy review processes
• Establish any additional controls and arrangements required to managestorm response efforts in the context of the pandemic
• Review Business Continuity Plans to ensure they are fit for purposein the context of any learnings identified and in the event of multiple/coordinated crystallisation of risks
• Continue to monitor the robustness of response efforts and key metricson an ongoing basis, and adjust response efforts as required
If the risk materialises:
• Seek to establish and implementarrangements for the acceleration oftesting for critical employees
• Activate plan for alternates (withconsultation with the Chair if itinvolves the Chief Executive orExecutive team)
• Discontinue non-essential activitiesand focus on essential services only
• Immediately identify the specificsin relation to any failures arising,investigate at speed, establish andimplement any additional responseefforts required and communicate/record any learnings arising
• Proactively engage with staff,stakeholders, customers and thepublic at large in an open andtransparent manner
• Identify and address implications forESB's business plan and strategy
• The Pandemic Preparedness Plan was invoked in Feb 2020, withother relevant plans invoked thereafter e.g. Business ContinuityPlans and essential activity classification
• The Crisis Co-ordination Group was established which seeks toalign the response efforts under the various plans, and continuesto meet weekly
• A Major Contracts Review Group was established to ascertainand monitor the impact of the pandemic on ESB’s contracts andwider supply chain
• A scenario planning subgroup was established• An interim lessons learned review has been completed
• For 2021, ESB remains fullycommitted to ensuring the continuedsafe and secure supply of electricityand other services to all customers,in addition to ensuring the safetyand wellbeing of employees andcontractors
• Having addressed the immediatechallenges that COVID-19 presentedto our employees, customers, partnersand assets, and considered the neartime challenges, ESB is now focusedon the next phases of the pandemic
• Leveraging the scenario planningreview to consider impacts for ESB'sstrategy and working to align remoteworking and future return to officeresponse efforts with our SmartWorking strategy
STRATEGIC OBJECTIVES
Put customers’ current and future needs at the centre of all our activities
Produce, connect and deliver clean, secure and affordable energy
Develop energy services to meet evolving market needs
Grow the business while maintaining ESB’s financial strength
Deliver a high-performance culture that supports innovation and collaboration
CO
RP
OR
ATE G
OV
ER
NA
NC
E
02
FINA
NC
IAL S
TATEM
EN
TS
03
01
STR
ATEGY
AN
D P
ER
FOR
MA
NC
E

40 ESB Annual Report 2020 - Brighter Together ESB Annual Report 2020 41
ESB employs financial and non-financial key performance indicators (KPIs), which signify progress towards the achievement of ESB's Strategy to 2030 (Strategy 2030). Each business unit has their own KPIs, which are in direct alignment with those of the Group.
FINANCIAL
KPI DEFINITION STRATEGIC RELEVANCE PERFORMANCE STRATEGIC PRIORITY
EBITDA Operating profit before interest, taxation, depreciation, impairments (including non-trading net impairment losses on financial assets), amortisation and revenue from supply contributions.
EBITDA is a key measure of the cash generated in the Group during the year which is then available for strategic investments, repayment of debt and dividend payments.
The decrease in EBITDA is driven by factors impacting on operating profit and the in-crease in ARO provision in ESB Networks. For further detail, see financial review on page 52.
Net Debt Borrowings and other cash and cash equiv-alents. 2019 includes the impact of IFRS 16 'leases' which became effective 1 January 2019.
Net debt is a measure of how lev-eraged the Group is and is included in assessing its key covenants. Net debt will continue to grow as ESB partly funds its capital investment programmes with borrowings.
Net debt has decreased reflect-ing positive EBITDA and the impact of weakening of GBP on sterling denominated debt offset by continued capital investment, finance costs, dividends and tax payments. For further detail see financial review on page 52.
Capital Expenditure
Additions for property, plant and equip-ment, intangible assets and financial asset investments. 2015 to 2017 figures are net of capital contributions, from 2018 onwards Capital expenditure is shown gross of capital contributions in line with IFRS 15 'Revenue from Contracts with Customers'.
ESB is in a period of significant capital investment for both its net-works businesses and Generation and Trading (GT). This is so that ESB can develop the electricity network and compete within the all-islands environment.
The decrease in capital expend-iture primarily reflects significant capital investments in GT in 2019. For further detail see financial review on page 52.
EBITDA €’m Net Debt €’m Capital Expenditure €’m
CUSTOMER AND MARKETRetail Market Share % Residential Customer Satisfaction % Brand Awareness %
KPI DEFINITION STRATEGIC RELEVANCE PERFORMANCE STRATEGIC PRIORITY
Retail Market Share
Total Single Electricity Market (SEM) all-island market share.
Retention and growth of market share is key to ESB so that it can compete within the all-island competitive environment.
Overall market share was consistent with 2019 levels. Growth within the industrial and commercial market sectors was offset by a reduction within residential. For further detail, see Customer Solutions business unit on page 64.
Residential Customer Satisfaction
Provides a measure of residential customer satis-faction (Source: Research Perspective Monthly Survey Results). The methodology for calculating this KPI was updated in 2018.
ESB strive to provide excellent customer service and introduce new initiatives to improve the customer experience in order to retain market share.
Residential Customer satisfaction continued to perform strongly in 2020 despite competitive pressures. The moratorium on disconnections, COVID-19 messages to re-assure customers around billing and service and also the credit for vulnerable customers helped maintain customer satisfaction levels in 2020.
Brand Awareness
Awareness of Electric Ireland as an Energy Supplier (Source: Ama-rach Research Monthly Brand and Advertising Tracker).
Maintain the Electric Ireland brand as the leading energy supply brand in Ireland.
Brand awareness fell slightly in 2020, but remains strong delivering high levels of recognition and engagement despite a challenging environment given COVID-19, competitor activity and the myriad of brands in the energy sector looking for customer recognition and engagement. The strong level of brand awareness was maintained by the high profile Brighter Together campaign which ran con-tinuously during 2020 with clever media placement to mit-igate against the negative effects of other brand building programmes such as sponsorships which were cancelled or reconfigured due to the impact of the pandemic.
KEY PERFORMANCE INDICATORS (KPIs)
KPI DEFINITION STRATEGIC RELEVANCE PERFORMANCE STRATEGIC PRIORITY
Plant Availability
Percentage of the time in the year that generation plant was available to pro-duce electricity, whether they generated or not.
Delivering strong operational per-formance across ESB's generation plant through best practice opera-tions and maintenance and timely completion of overhauls is critical to ESBs commercial performance.
Plant availability increased in 2020 reflecting a lower number of scheduled outages. For further detail see GT business unit section page 58.
MW Renewable Operational
Total MW’s of renewable generation where the assets have reached their commer-cial operation date includes wind, hydro and solar.
Renewable generation is key to ESB's objective to reduce the car-bon intensity of its generation fleet.
The increase primarily relates to the 114 MW Grousemount wind farm in Kerry which was com-missioned in 2020.
Customer Minutes Lost (CMLs) ESB Networks
The average duration of unplanned interruptions for all customers during the year.
The reliability of the grid and mini-mising interruptions to customers is of key importance to ESB.
The increase in CMLs in 2020 is due an increase in the number of storms during the winter and summer periods relative to 2019. For further detail see ESB Networks business unit section on page 60.
OPERATIONALPlant Availability % MW Renewable Operational* Customer Minutes Lost (CMLs)*
Put customers’ current and future needs at the centre of all our activities
Produce, connect and deliver clean, secure and affordable energy
Develop energy services to meet evolving market needs
Grow the business while maintaining ESB’s financial strength
Deliver a high-performance culture that supports innovation and collaboration
PEOPLE
KPI DEFINITION STRATEGIC RELEVANCE PERFORMANCE STRATEGIC PRIORITY
Headcount Average number of employees in the year including temporary employees employed by ESB.
The delivery of the strategy will require an organisation that is of a certain scale and is flexible, highly moti-vated and adaptable.
Headcount has decreased in 2020 due to staff exits in GT being offset by recruitment in Cus-tomer Solutions as the business grew. For further detail, see note 9 of the financial statements.
Employee LTIs
Employee LTIs are work-related injuries that involve an absence of at least one day (not in-cluding the day the injury occurred).
Safety is at the centre of what we do. ESB continues to focus on reducing risks in the business that gives rise to injurious incidents. For further detail, see safety on page 72.
Employee LTIs reduced in 2020 with less people commuting to work and not attending ESB locations due to the COVID-19 pandemic meaning there was a reduced risk for LTIs this year. Also at certain times of the year field staff in ESB Networks were working on rotations meaning there was less crews and people on site reducing the potential for injuries to occur.
Average Headcount %Employee Lost Time Injuries (LTIs) No.
CO
RP
OR
ATE G
OV
ER
NA
NC
E
02
FINA
NC
IAL S
TATEM
EN
TS
03
01
STR
ATEGY
AN
D P
ER
FOR
MA
NC
E

42 ESB Annual Report 2020 - Brighter Together ESB Annual Report 2020 43
44 Executive Team
46 Market Structure and Operating Environment 2020
52 Financial Review
56 Generation and Trading (GT)
58 ESB Networks
60 Northern Ireland Electricity Networks (NIE Networks)
62 Customer Solutions
64 Engineering and Major Projects
65 Enterprise Services
CO
RP
OR
ATE G
OV
ER
NA
NC
E
02
FINA
NC
IAL S
TATEM
EN
TS
03
01
STR
ATEGY
AN
D P
ER
FOR
MA
NC
E

44 ESB Annual Report 2020 - Brighter Together ESB Annual Report 2020 45
The Executive Team focuses on the execution of the ESB Strategy to 2030 (Strategy 2030), technological and commercial developments, programme execution, financial and competitive performance, people development, governance, organisational development and Group-wide policies.
EXECUTIVE TEAM
Pat O’Doherty CHIEF EXECUTIVE
Appointed: December 2011, term extended by a further 3 years, effective 1 December 2018.
Career Experience: Pat joined ESB in 1981. Prior to his current role, Pat headed up ESB’s largest businesses as Executive Director of ESB International, Managing Director of ESB Networks DAC and Executive Director of ESB Power Generation. Pat holds both primary and master’s degrees in engineering from University College Dublin (UCD). He completed the Advanced Management Programme at Harvard Business School. He is President of Eurelectric, Director of Energy UK, Chair of the Apprenticeship Council of Ireland and a former trustee of The Conference Board of the United States.
Paul Mulvaney EXECUTIVE DIRECTOR ESB NETWORKS CUSTOMER DELIVERY
Appointed: October 2014
Career Experience: Paul Mulvaney was appointed Executive Director, Customer Delivery ESB Networks in May 2018. Prior to this he held the position of Executive Director, Innovation. Paul joined ESB in 1985 and has held a number of senior management positions in Power Generation and was Programme Manager, Corporate Change. He was appointed Managing Director of eCars in 2009 and Head of Distribution and Customer Service, ESB Networks Ltd. in 2012. Paul holds a degree in mechanical engineering, a diploma in accounting and finance, a diploma in company direction and completed the Advanced Management Programme at the IESE Business School in the University of Navarra. Paul is a Fellow of the Institute of Directors (UK) and was named Chartered Director of the Year 2020.
Pat Fenlon EXECUTIVE DIRECTOR GROUP FINANCE AND COMMERCIAL
Appointed: July 2016
Career Experience: Prior to his current role, Pat held a number of senior financial and general management positions across ESB including General Manager of Electric Ireland, Corporate Change Manager and Group Finance & Commercial Manager. He is a fellow of Chartered Accountants Ireland and worked with PwC in Dublin before joining ESB in 1993.
Nicholas Tarrant EXECUTIVE DIRECTOR ENGINEERING AND MAJOR PROJECTS
Appointed: June 2018
Career Experience: Nicholas Tarrant was appointed Executive Director, Engineering and Major Projects in June 2018. Prior to this he held the position of Managing Director, Northern Ireland Electricity Networks. Nicholas joined ESB in 1993 where he held a number of senior management positions including Generation Manager with responsibility for ESB’s generation portfolio. He is a chartered engineer at the Institute of Engineers of Ireland, he holds an MSc (management) from Trinity College Dublin (TCD) and completed the Stanford Executive Programme in 2014.
Marguerite Sayers EXECUTIVE DIRECTOR CUSTOMER SOLUTIONS
Appointed: November 2014
Career Experience: Prior to her current role, Marguerite was Managing Director ESB Networks DAC. Marguerite has worked in various technical and managerial positions in ESB since 1991, including Generation Manager and Head of Asset Management for ESB Networks. She has a degree in electrical engineering from UCC, a diploma in accounting and finance from University of Limerick and a diploma in project management from UCC. She is a chartered engineer and a Fellow and past President of Engineers Ireland.
Marie Sinnott COMPANY SECRETARY
Appointed: August 2019
Career Experience: Marie Sinnott was appointed Company Secretary in August 2019. Prior to this, she held the position of Group Head of Compliance and Enterprise Risk Management. Marie joined ESB in 1989 as part of the Business Graduate Development Programme and has held a number of senior management roles in the ESB. Marie is a UCD commerce graduate, holds a master’s degree in economic policy studies from TCD and a postgraduate diploma in corporate governance from UCD. She also has a certificate in data protection practice from the Law Society. Marie is an external member of DCU’s Governing Authority Risk Management Committee.
Jerry O’Sullivan DEPUTY CHIEF EXECUTIVE
Appointed: October 2014
Career Experience: Prior to his current role, Jerry was Managing Director of ESB Networks DAC. Jerry was appointed Chairman of ESB Networks DAC in 2010. He joined ESB in 1981 and held a number of positions in Power Station
Construction, Distribution and Transmission, Retail, Contracting, Marketing and Customer Service. He was appointed Head of Network Services in 2002 and Head of Sustainability and Network Systems in 2008. He holds a degree in civil
engineering from University College Cork (UCC), is a Fellow of Engineers Ireland and a member of the UCD Energy Institute Advisory Board.
Geraldine Heavey EXECUTIVE DIRECTOR ENTERPRISE SERVICES
Appointed: June 2018
Career Experience: Geraldine Heavey was appointed to the position of Executive Director, Enterprise Services in June 2018. Prior to this she held the role of Group Finance & Commercial Manager. She has worked in various finance and managerial positions
in ESB since 1993, including Finance Controller, Business Service Centre (BSC) and Electric Ireland, Manager, ESB Trading and Financial Controller, ESB Power Generation. She is an accountant and holds a master’s degree in business administration (MBA) from Dublin City University (DCU). Geraldine is an external member of DCU’s Commercial Board and chairs its Audit Committee.
Paddy Hayes MANAGING DIRECTOR ESB NETWORKS DAC
Appointed: June 2012
Career Experience: Prior to his current role, Paddy was Executive Director of Generation and Wholesale Markets. A chartered engineer, Paddy worked with British Steel before joining ESB in 1999. He holds a master’s degree in engineering
from University College Dublin and an MBA from the University of Warwick, Paddy is currently co-chair of the European Distribution Transmission Cooperation Platform.
Pat Naughton EXECUTIVE DIRECTOR PEOPLE AND ORGANISATIONAL DEVELOPMENT
Appointed: June 2012
Career Experience: A mechanical engineer, Pat has worked in a variety of roles since joining the Group in 1978. He previously held senior positions as HR Manager in ESB Energy International, Manager Strategy and Portfolio Development,
ESB Energy International and Manager of Hydro Stations, ESB Power Generation. He completed the Advanced Human Resources Program at Michigan University in 2012. Pat is a member of the Board of Institute of Public Administration (IPA)
and chairs its Audit and Risk Committee.
Jim Dollard EXECUTIVE DIRECTOR GENERATION AND TRADING
Appointed: July 2013
Career Experience: Jim was appointed Executive Director, Generation & Trading in May 2018. Prior to this he held the position of Executive Director for Business Service Centre and Electric Ireland. A chartered management accountant, Jim
began his career at ESB in 1992 and has held a number of senior management positions throughout the Group. Jim holds a bachelor’s degree in commerce and a master’s degree in business studies from University College Dublin. He completed the
Advanced Management Programme at Harvard Business School in 2017.
CO
RP
OR
ATE G
OV
ER
NA
NC
E
02
FINA
NC
IAL S
TATEM
EN
TS
03
01
STR
ATEGY
AN
D P
ER
FOR
MA
NC
E

46 ESB Annual Report 2020 - Brighter Together ESB Annual Report 2020 47
1.(a) OVERVIEW OF THE ELECTRICITY MARKETS STRUCTURE IN THE REPUBLIC OF IRELAND (ROI) and NORTHERN IRELAND (NI) The structure of the electricity market in ROI and NI can be divided into four segments: generation, transmission, distribution and supply. Electricity generation and supply are open to full competition throughout ROI and NI. Electricity transmission and distribution are regulated monopolies in ROI and NI, with the respective regulator determining the allowed revenue for the price review period.
ENERGY POLICY AND REGULATION Energy policies are set by the Minister for Environment, Climate and Communications in ROI and the Department for the Economy in NI. Energy policy and regulation are heavily influenced by European Union (EU) law.
The Commission for Regulation of Utilities (CRU) is the independent regulator of the energy market in ROI. The Utility Regulator (UR) is the independent regulator of the energy market in NI.
SINGLE ELECTRICITY MARKET (SEM/I-SEM)The Single Electricity Market (SEM), which began operation in 2007, migrated to a new set of trading arrangements known as the Integrated Single Electricity Market (I-SEM) on 1 October 2018.
The I-SEM market arrangements incorporate Day-Ahead, Intraday and Balancing Markets as well as a competitive capacity remuneration mechanism and comply with EU harmonised arrangements for cross-border trading of wholesale energy across Europe and with EU State aid guidelines for capacity remuneration. The process for remunerating capacity in I-SEM involves an auction where generators compete for capacity contracts and also imposes reliability penalties on the holders of those contracts (if called upon to deliver capacity and are unable to do so). Generators primarily compete for Reliability Options on a four (T-4) year ahead basis with additional adjustment auctions occurring on a one (T-1) and two (T-2) year ahead basis as necessary.
T-4 auction results for delivery in October 2023 were announced in May 2020. The clearing price was €46.15/kW (just below the price cap) with 7,322 MW of existing capacity receiving one year contracts and 761 MW of new capacity awarded contracts for ten years. All existing ESB units that entered the
MARKET STRUCTURE AND OPERATING ENVIRONMENT 2020
auction were successful, with the exception of Moneypoint Unit 2. Aghada peaking unit (81 MW) did not take part in this auction as it is due to close before the end of 2023, nor did Lough Ree (91 MW) and West Offaly (137 MW) peat stations as generation at these sites ceased in December 2020.
RENEWABLE ENERGY SUPPORT SCHEME (RESS)Following EU State aid approval, a new, technology neutral, renewable support mechanism (RESS) was introduced under the programme for Government in ROI, with the aim of achieving 70% renewable electricity by 2030 (similar targets have also been announced for NI). It is expected that at least four RESS auctions will take place between now and the end of 2027 with 15,000 GWh auctioned, mainly for onshore and offshore wind, and solar. Successful participants in the auction will secure 15-year contracts.
The first of these auctions (RESS-1) took place at the end of July 2020 for delivery at the end of December 2022. In a highly competitive auction 2,236 GWh of electricity, in the form of 479 MW of onshore wind and 796 MW of solar for an average bidding price of €74/MWh, was procured. Out of 108 projects submitting bids into the auction, 82 received offers. ESB was successful in securing offers of contract for one onshore wind joint venture project of 82 MW and two ground-mounted solar PV projects with a combined installed capacity of 36 MW.
ELECTRICITY NETWORKS The electricity transmission system is a high-voltage network for the transmission of bulk electricity supplies at 110kV or higher voltages. The distribution system delivers electricity to individual customers at 110kV or lower. In ROI, ESB owns the transmission and distribution system network and operates the electricity distribution system network, while EirGrid operates the transmission system network. In NI, (NIE Networks, owned by ESB) owns the electricity transmission and distribution system network and operates the electricity distribution system network. The System Operator for Northern Ireland (SONI) operates the transmission system network.
INTERCONNECTION For geographical reasons, the electricity transmission systems on the island of Ireland are isolated compared to systems in mainland Europe and GB. The Moyle Interconnector links the electricity grids of NI and Scotland through submarine cables running between converter stations in NI and Scotland; this
link has a capacity of 500 MW. There are however restrictions exporting (NI to GB) on this interconnector due to transmission constraints in Scotland, with a lower limit of 80 MW and an upper limit of 400 MW in 2020. Since April, this limit can vary by the hour, and is generally dependent on wind levels in the region. The East-West Interconnector (EWIC) links the electricity transmission system in ROI to the electricity transmission system in Wales, enabling two-way transmission of electricity. The East-West Interconnector runs between Deeside in north Wales and Woodland, County Meath in ROI. Approximately 260 kilometres in length, the underground and undersea links can transport 530 MW. The total interconnection capacity with GB is about 1,000 MW.
In 2020, there was a net export from SEM to GB. High wind periods continue to be the main driver for exports.
ELECTRICITY GENERATION The I-SEM generation sector comprises approximately 16 GW of capacity connected to the system on an all-island basis. The capacity connected to the system includes a mix of older generation plants alongside modern gas fired CCGT plants and renewable energy sources such as wind power. These stations generate electricity from fuels such as gas, coal and oil as well as indigenous resources including hydro, wind, peat and biomass.
I-SEM has 5,531 MW of wind installed, which is key to the Government’s target of 40% of electricity to be generated from renewable sources by 2020, as well as the 40% renewable generation target for Northern Ireland which was announced as met by the Department for the Economy in September 2019. Wind contributed 35% of generation1 in 2020, (2019: 29%), with a maximum wind output of 4,238 MW being recorded on 21 February 2020. ESB had a 29% generation market share1 in I-SEM in 2020, slightly up on the 2019 generation market share.
2020 saw 79% availability of baseload thermal generation in I-SEM, with gas being the dominant fuel in the market, as coal remained largely out of merit from January onwards driven by the combination of low gas prices and high carbon prices.
ENERGY TRADING The electricity and gas markets in GB, ROI and NI are linked in two ways, through gas being used for electricity generation and through the physical interconnection of electricity and gas networks. In common with a number of other companies in the Irish market, ESB is active in both Irish and GB markets in gas and electricity.
In addition to ESB’s generation interests, ESB is active in all sectors of the gas market, from residential to large commercial and is one of the biggest gas shippers on the island.
1.(b) OVERVIEW OF THE ELECTRICITY MARKETS STRUCTURE IN GREAT BRITAIN (GB)The structure of the electricity market in GB can be divided into four segments: generation, transmission, distribution and supply. Electricity generation and supply are open to full competition throughout GB. Electricity transmission and distribution are regulated monopolies in GB, with the Office of Gas and Electricity Markets (OFGEM), the regulator of the energy market in GB, determining the allowed revenue for the price review period.
ENERGY POLICY AND REGULATION Energy policies are set by the Secretary of State for Business, Energy and Industrial Strategy. OFGEM is the regulator of the energy market in GB.
BRITISH ELECTRICITY TRADING AND TRANSMISSION ARRANGEMENTS (BETTA) BETTA is the wholesale electricity market operating in GB. Unlike I-SEM, trading can take place between generators and suppliers either bilaterally or through exchanges, and both physical and financial contracts can be struck to manage price volatility, for time scales ranging from several years ahead to intra-day trading markets. National Grid, acting as the Electricity System Operator (ESO) is responsible for balancing supply and demand in real time, by utilising the Balancing Mechanism (BM) and other system services. BETTA operates a capacity remuneration scheme, where generators are awarded capacity contracts, based on the outcome of an auction, that enable them to receive payments for the provision of generation capacity while also incurring penalties
for non-delivery during scarcity events.
CONTRACTS FOR DIFFERENCE SCHEMEThe main support mechanism for low carbon technologies is the Contract for Difference (CfD) awarded through a competitive auction process. The first round of CfD auction (called AR1) took place in 2015 which included solar, onshore and offshore wind technologies; AR2 and AR3, took place in 2017 and 2019, respectively and were mainly for offshore wind. To date, offshore wind has dominated the CfD auction, with a total capacity of about 7 GW awarded from AR1 to AR3. In contrast, only about 700 MW onshore wind and 70 MW of solar PV have been awarded. Offshore wind auction clearing prices have also dropped significantly, from around £115/MWh in AR1, to around £40/MWh in AR3. The next auction, AR4, is planned in 2021 which is expected to include both established (including onshore wind and solar) and less-established technologies.
ELECTRICITY NETWORKSIn GB, the transmission network is owned by Scottish Hydro Electricity Transmission Ltd (SHETL), Scottish Power Transmission (SPT) and National Grid Electricity Transmission (NGET). However, the entire transmission network is operated by one National Electricity Transmission System Operator called the Electricity System Operator (ESO). The statutory obligation of the ESO is to economically balance supply and demand near and at real time. At distribution network level, the network is owned and operated by various regional distribution companies.
INTERCONNECTION In addition to interconnection with Ireland, GB is interconnected with France, Belgium and the Netherlands, with a total import/export capacity of 4,000 MW. In 2020, GB was a net importer of power from continental Europe as power prices were generally higher in GB. There were some
periods when GB exported power to Europe, typically during high renewable generation in GB or other events such as low nuclear plants availability in France. Despite Brexit, a significant number of new interconnector projects are being developed, including additional connection with France as well as new interconnections with Norway and Denmark.
2. OPERATING ENVIRONMENT
2.(a) COMMODITIES - THE GLOBAL ENERGY MARKETS There are a number of factors that influence the price of electricity in the wholesale markets, and the profitability of the generating plant. The cost of the underlying fuels used to generate the electricity is critical to both and is driven by international markets which are discussed below.
GAS PRICESGas prices fell significantly from late March 2020 following a collapse in demand on a global level as a result of the COVID-19 pandemic, leading to an oversupplied market with storage capacity in Europe already higher than normal due to the milder winter. Gas price recovered from August with the highest prices all year coming towards the end of year. The annual average gas price was 24.91p/therm, down from 34.77p/therm in 2019. The monthly average gas price in January 2020 was 28.2p/therm, the price then gradually dropped hitting an average low of 11.78p/therm in May before rising steadily from August to an average of 45.71p/therm in December
COAL PRICESCoal prices were c. $50/tonne in January, and dropped off in April, hitting a low of c. $39/tonne in May before increasing and reaching a high of c.$67/tonne in December. The impact of COVID-19 on demand as well as strong supplies from Russia were behind the drop
1 ESB market share in I-SEM is being defined in terms of positive metered generation from ESB Generation plant only (i.e. no reduction in the figures to account for pumping of Turlough Hill), as a percentage of total SEM Demand where total SEM demand is based on demand values from Eirgrid, plus an estimated 2TWhrs of embedded generation.
CO
RP
OR
ATE G
OV
ER
NA
NC
E
02
FINA
NC
IAL S
TATEM
EN
TS
03
01
STR
ATEGY
AN
D P
ER
FOR
MA
NC
E
FIGURE 1: GAS, COAL AND CARBON PRICES
10
20
30
40
50
60
70
80
Com
mod
ity P
rice

48 ESB Annual Report 2020 - Brighter Together ESB Annual Report 2020 49
off in coal prices. Continuing concerns over the environmental impact of coal have led to decreased demand in the US and Europe. Consistently high carbon prices and low gas prices have resulted in significantly cheaper gas fired power generation in comparison to coal, leading to less running hours for coal fired generation and the subsequent closure of several plants. A pick-up in Asian economies from June saw rising coal prices in the latter half of the year, however coal prices averaged only $50.37/tonne in 2020, significantly down from $60.69/tonne in 2019.
CARBON PRICES Within the EU ETS, generators are required to buy carbon allowances for the carbon that they emit while generating electricity. Carbon prices averaged just over €24/tonne in the early part of 2020, until the effects of COVID-19 saw it fall as low as €16/tonne in March, before recovering to a high of €31.08/tonne in December. The annual average carbon price for 2020 was €24.79/tonne, down slightly from €24.93/tonne in 2019. This carbon price was another significant factor contributing to the continued suppression of coal generation.
2.(b) OPERATING ENVIRONMENT - SEM
DEMAND COVID-19 had a major effect on power demand in 2020 but overall power demand showed resilience to the impact of the economy wide lockdowns. Until mid-March, demand had surpassed that of 2019 by an average of 3%. In late March 2020 following tighter restrictions imposed earlier in the month, Ireland went into full lockdown, with demand falling to more than 10% lower than equivalent weeks in April and May 2019. As the restrictions eased, demand recovered closer to 2019 levels and surpassed them in late June. Demand remained above its 2019 equivalent until tighter restrictions were re-introduced in October when it again dropped below 2019 levels. It rose again in December, with the ROI demand record broken twice in the month. It now stands at 5,357MW. The previous record was set back in 2010. Overall, 2020 was within 1% of 2019 demand levels. See Figure 2.
I-SEM WHOLESALE ELECTRICITY MARKETI-SEM consists of Day Ahead, Intraday and Balancing Markets. The most liquid of these markets has been the Day-Ahead Market (DAM) where around 93% of market transactions took place as supply companies seeking to purchase their power requirements transact with generators selling the vast majority of their generation.
In 2020, 61% of metered generation (Figure 3) in I-SEM was met by fossil fuels, almostexclusively gas while coal fired generation has been out of merit for most of the year due to lower gas prices coupled with high carbon
prices. Additionally, the end of the PSO support for West Offaly & Lough Ree peat-fired plants at the end of 2019 has resulted in a large drop in peat plant generation. With large gas fired units being the most efficient units on the system, the electricity price has historically been closely linked to the wholesale gas price. Under I-SEM, the Day Ahead Market (DAM) price on average has not shown any notable change in this behaviour and is still fundamentally driven by the gas price as can be seen from Figure 4, which shows how the monthly average DAM price has tracked gas prices across the year. Although, on a day-by-day basis much greater variability between DAM price and gas price is observed where for example zero or negative DAM price periods sustained over several hours coincide with periods of high wind/low demand (i.e. night-time).
Year on year, the 2020 DAM price has decreased by 25% to an annual average value of €37.63 /MWh, from €50.26/MWh, primarily driven by lower gas prices (due to COVID-19).
The average DAM price was €42.07/MWh in
January, and generally followed the profile of the gas price, with an average monthly low of €23.57/MWh in May before rising to €58.83/MWh in December. Higher installed wind capacity & lower demand for some of the year (due to COVID-19) resulted in 4 days where the daily average DAM price was below €0, which is a new occurrence in SEM.
I-SEM BALANCING MARKETThe balancing market provides the Transmission System Operator (TSO) with the flexibility it needs to secure the system. Under the balancing market the TSO takes control (after generators and suppliers have transacted) to ensure that supply meets demand when there is a deviation from the demand forecast or a change in generator output. Participation in the balancing mechanism is mandatory for all generators who must submit bids and offers that allow the TSO move them from contracted positions if required to maintain system integrity.
Volatility continues to be a feature of the balancing market in 2020, as can be seen in daily average BM prices in comparison to DAM
prices, Figure 5. During individual half-hourly periods prices reached lows of minus €300/MWh and highs of almost €700/MWh. Trading periods in which the price exceeds €500/MWh are deemed scarcity events and trigger pay outs from all generators holding Reliability Option contracts. After several occurrences of such events in 2019, a rule change and change in bidding behaviour of some participants had prevented a re-occurrence for most of 2020, until November, where TSO to TSO trades over the Moyle Interconnector sent the price over €500/MWh.
2.(c) GB ELECTRICITY MARKET AND PRICES DEMANDDemand for electricity in GB dropped significantly in 2020 as a result of COVID-19 lockdown and social distancing measures. Compared to the same time in 2019, grid electricity demand dropped by 19% in April and May 2020. Demand recovered quickly when lockdown started to ease past June/July 2020. Overall, 2020 GB demand as a whole was about 7% lower compared to 2019. See figure 6.
CO
RP
OR
ATE G
OV
ER
NA
NC
E
02
FINA
NC
IAL S
TATEM
EN
TS
03
01
STR
ATEGY
AN
D P
ER
FOR
MA
NC
E
FIGURE 2: % CHANGE IN DEMAND (2020 V 2019)
FIGURE 3: ELECTRICITY GENERATION IN I-SEM BY FUEL TYPE
FIGURE 4: DAM VERSUS GAS PRICE 2020
FIGURE 5: DAY AHEAD V BALANCING MARKET PRICE

50 ESB Annual Report 2020 - Brighter Together ESB Annual Report 2020 51
GENERATION MIXLower electricity demand in 2020 resulted in a much higher proportion of renewables penetration, accelerating the increasing trend in the role of renewables in the overall electricity system mix. During COVID-19 lockdown, the combination of very low demand and high penetration of renewables saw GB record the highest number of negative price hours in the summer of 2020. Figure 7 below shows GB Generation Mix, with 32% of generation coming from wind and solar in 2020. To balance supply and demand, the same periods also saw significant level of balancing actions being taken by the National Grid Electricity System Operator (ESO), leading to increased balancing costs which are currently borne by both generators and demand customers, in the form of a charge referred to as Balancing Services Use of System (BSUoS).
POWER MARKETS AND PRICESGB Day Ahead Market (DAM) prices dropped significantly in early 2020, mainly due to the impact of COVID-19 and from the already weak gas prices since late 2019. GB Baseload DAM prices were much lower in the first three quarters of 2020 compared to 2019. Prices recovered in the last quarter due to the lockdown easing, as well as higher gas prices and tighter supply margins in the electricity market heading into winter (see Figure 8). Natural gas is still the primary driver for setting the GB electricity wholesale price. Lower gas prices led to lower power prices, which tend to disadvantage high-efficiency gas generators such as Carrington more than low-efficiency generators.
Renewable generation has continued to grow in GB. New highs have been recorded in 2020, with total wind generation recorded new high of 18.5 GW in December 2020, while solar generation peaked at 9.7 GW in April 2020.
Year on year coal generation volumes in GB continued to drop, with lower coal fleet generation volumes in 2020 compared to 2019 as a whole. The UK government's decision to close all coal generation plants by 2025 coupled with the UK’s Carbon Price Support plays an important role in driving this trend, which results in a substantially higher effective carbon price relative to other European countries. Two more coal power stations closed in 2020, which were SSE’s Fiddlers Ferry (1.5 GW) and RWE’s Aberthaw power plant (1.6 GW). As at the end of 2020, there are only three coal power stations
in GB (Drax, Ratcliffe and West Burton) with a total capacity of about 5 GW.
The GB Capacity Market auctions in recent years were generally oversubscribed, leading to downward pressure on auction clearing prices. This has followed the trend of lower power demand, evidenced by the declining procurement targets in the T-4 auctions. However, the T-4 auction (for delivery in 2023/24) concluded in 2020 achieved a
As in SEM, GB operates a Balancing Mechanism (BM) market. The GB BM market is important to dispatchable and relatively flexible plants such as Carrington CCGT. The BM price, or often referred to as cash-out price, reflects the system marginal cost within the BM market timeframe (near to real time). Generally the BM prices spike when the system is short and the ESO calls on expensive plants to generate. This is a significant opportunity for flexible plants to earn additional revenue, especially when they
clearing price of £15.97/kW, substantially higher than previous auctions. This to an extent reflects the potential tightening of capacity due to expected closure of coal, old gas and nuclear plants. A new gas plant, Keadby II, an 840 MW CCGT owned by SSE, was successful in this auction, marking a change from previous auctions where new entrants were mostly small embedded units.
are not in-the-money to run in the DAM. Average monthly BM prices have been largely trending according to commodities prices (Figure 9). However, system prices became highly volatile and peaked during the COVID-19 lockdown period. The volatility of the BM market has increased in 2020, presenting more short-term opportunities for flexible thermal generators, including Carrington, to generate more revenue from the BM market.
CO
RP
OR
ATE G
OV
ER
NA
NC
E
02
FINA
NC
IAL S
TATEM
EN
TS
03
01
STR
ATEGY
AN
D P
ER
FOR
MA
NC
E
FIGURE 6: GB ELECTRICITY DEMAND (TWH)
FIGURE 9: DAILY AVERAGE PRICE (£/MWH)
FIGURE 8: GB BASELOAD POWER PRICE (£/MWH)
FIGURE 7: GB GENERATION MIX IN 2020

52 ESB Annual Report 2020 - Brighter Together ESB Annual Report 2020 53
How would you describe financial performance in 2020?
In the context of a challenging operating environment brought about by the global COVID-19 pandemic, ESB delivered an operating profit before exceptional items of €616 million, a decrease of €66 million on 2019. Electricity demand remained resilient, with an overall year-on-year reduction of less than 1% in Ireland, as increased residential demand offset falls in the business sector. While the initial “lockdown” period resulted in a peak demand reduction of 15% during April, it recovered with the easing of restrictions and the reduction during the second lockdown later in the year was smaller, peaking at 5%, and for a shorter duration. On an overall basis, COVID-19 had c.€15 million negative impact on our operating profit primarily due to an increased provision for bad debts in Customer Solutions.
Our 2020 performance reflects good progress across our main business units:
• Despite the impact that COVID-19 had on construction activities, our two networks businesses delivered significant progress on their regulated capital and maintenance programmes to ensure a safe and reliable network. In addition, ESB Networks concluded its regulatory Price Review 5 (PR5) contract with the Commission for the Regulation of Utilities (CRU) covering 2021 to 2025. PR5 includes a significantlyincreased capital programme which will
support the continued transition to a low-carbon economy
• Generation and Trading, further developed its renewable portfolio. The 114 MW Grousemount wind farm in Co. Kerry reachedcommercial operation and a 50% stake was acquired in the 1 GW Inch Cape offshore wind farm (UK) project
• In Customer Solutions, we continued to create value for our customers, launching a100% Green tariff and provided supports to our vulnerable customers who were impacted by the COVID-19 pandemic
EXCEPTIONAL ITEMSIn 2020 we recognised €247 million of exceptional charges reflecting:
• An impairment charge of €188 million on our Carrington CCGT asset in Great Britain. Increased renewable generation on the system and reduced demand due to COVID-19 has displaced thermal plant and reduced margins. Carrington’s projected thermal margins into thefuture have also fallen due to reduced demand and lower forecast peak prices;
• An increase in our asset retirement obligation (ARO) of €129 million in respect of the future cost of disposal of creosote covered wooden poles in ESB Networks. €59 million of the increase is charged to the income statement in respect of poles that have been fully depreciated.
CAPITAL INVESTMENTESB invested just over €1.1 billion of capital expenditure in 2020. Almost 80% of this was invested in our two networks businesses in line
with agreed regulated capital programmes,
including €110 million on Smart Metering roll-
out in ROI. As part of the ongoing transition
to low-carbon generation ESB invested c€57
million in renewable generation projects
including the 50% acquisition of Inch Cape off
shore wind farm (UK) project.
OUTLOOKIn summary ESB, Ireland’s leading energy
utility, has a stable business profile with over
two thirds of earnings and assets accounted
for by regulated electricity networks in Ireland
under established and transparent regulatory
frameworks. In 2020, notwithstanding the
negative impact of COVID-19 we delivered:
• Operating profit (before exceptional items) of
€616 million;
• EBITDA (before exceptional items) of €1,358
million.
• Capital investment of €1,115 million.
ESB continues to deliver strong operating
profits (before exceptional items) and maintain
a strong balance sheet (net assets of €3.9
billion). It had a healthy liquidity position of
€1.8 billion and a moderate gearing level of
55% at the end of 2020. ESB is therefore
well positioned to meet the ongoing challenges
of the COVID-19 pandemic and to continue
to deliver our strategic ambition to lead the
transition to reliable, affordable low-carbon
energy for the benefit of our customers.
FIVE – YEAR SUMMARY
1 Before the following exceptional items:2020: Impairment charge €188 million and Increased Asset Retirement Provisions €59 million 2019: Severance and associated costs (€60 million) and Impairment charge (€34 million) 2018: impairment charge (€140 million) 2017: impairment charge (€276 million)
2 Capex in 2016 and 2017 is net of capital contributions.
3 2020 includes Lease liabilities €125 million 2019: €132 million
FINANCIAL REVIEW
OPERATING PROFIT BEFORE EXCEPTIONAL ITEMS1
EBITDA €
CAPITAL EXPENDITURE2 €
NET DEBT3
EBITDAbefore
exceptional items€1,358 million
Profit after Tax before
Exceptional Items: €357 million
Operating Profit before Exceptional
Items:€616 million
Capital Expenditure:
€1,115 million
2020 Dividends:€81 million
Gearing: 55% Net debt divided by the
sum of net assets and gross debt (excluding joint
ventures)
Return on Capital
Employed:5.4%
Pat Fenlon EXECUTIVE DIRECTOR, GROUP FINANCE AND COMMERCIAL
CO
RP
OR
ATE G
OV
ER
NA
NC
E
02
FINA
NC
IAL S
TATEM
EN
TS
03
01
STR
ATEGY
AN
D P
ER
FOR
MA
NC
E

54 ESB Annual Report 2020 - Brighter Together ESB Annual Report 2020 55
FIGURE 7: SUMMARISED CASH FLOW STATEMENT
2020 2019
€’m €’m
EBITDA (excluding exceptional items)Provision utilisation and other movementsInterest and tax
1,299 3
(223)
1,372(91)
(209)
Net cash inflow from operating activities 1,079 1,072
Disposal proceedsCapital expenditure Other (including FX)
27(996)
2
9 (1,157)
2
Net cash (outflow) from investing activitiesNet cash inflow/(outflow) from financing activities
(967)10
(1,146)(34)
Net increase/(decrease) in cash 122 (108)
FIGURE 4: RECONCILIATION OF OPERATING PROFIT 2019 TO 2020
• Fuel and other energy costs have decreased by €17 million reflecting lower volumes in Generation and Trading due to reduced running in Carrington and in the midlands Peat stations offset by an increase in Customer Solutions dueto increased large energy users and GB Energy consumption.
• Depreciation is in line with 2019• Employee costs are up €4 million reflecting
decreased capitalised payroll due to COVID-19 and increased average wage costs offset by lower overtime and expenses due to COVID-19and lower headcount.
• Operating and maintenance costs have increased by €96 million primarily due to a non-cash foreign exchange translation loss on sterling denominated intercompany positions, higher rates, increased ARO costs in Generationand Trading and increased operating costs in ESB Energy (GB) reflecting increased growth.
• The increase in impairments of financial assets relates to the estimated impact of COVID-19 on the provision for bad debts.
A breakdown of the operating costs by business segment is provided in note 2 to the financial statements.
EXCEPTIONAL ITEMSSee Finance review on page 52 and note 5 of the financial statements for further details on exceptional items.
OPERATING PROFITOperating profit before exceptional items has decreased by €66 million.
The movement in operating profit between 2019 and 2020 is set out in Figure 4.
EBITDAEarnings before interest, taxation, depreciation, impairments (including non-trading net impairment losses on financial assets), amortisation and revenue from supply contributions.
ADJUSTED PROFIT BEFORE TAXATIONAdjusted profit before taxation for 2020 is €480 million (2019: €514 million). The variance relates to the lower operating profit partially offset by lower total finance costs and higher share of equity accounted investees profit (see figure 5).
TOTAL FINANCE COSTSTotal finance costs for 2020 are €10 million higher than 2019.
The decrease in net interest reflects lower average cost of debt following debt re-financing, in particular refinancing of a sterling denominated bond with a lower coupon bond at the start of 2020.
Further detail is included in note 8 to the financial statements.
SHARE OF EQUITY ACCOUNTED INVESTEE PROFIT / (LOSS)This reflects ESB's share of the profits/losses from its equity accounted investments. The profit in 2020 primarily relates to ESB’s 50% share of the positive mark to market movements on inflation linked swaps in Neart na Goaithe offshore wind farm project.
TAXATIONThe tax charge of €60 million is in line with 2019. ESB’s effective tax rate on profits before exceptional items has increased on 2019 mainly due to higher deferred tax charges relating to the increase in the UK rate up to 19%. Further detail is included in note 20 to the financial statements.
SEGMENTAL PERFORMANCEThe Group is organised into five main reportable segments or strategic divisions, which are managed separately. Details on the financial performance of the business segments are included in the business unit review sections pages 58 to 67 and in note 2 to the financial statements.
NET DEBT AND GEARINGThe decrease in net debt to €5.1 billion in 2020 from €5.2 billion in 2019 reflects 2020 EBITDA and the impact of weakening of GBP on sterling denominated debt offset by continued capital investment, repayment of pension liabilities, finance costs, tax and dividend payments in 2020.
FIGURE 3: OPERATING COSTS (EXCLUDING EXCEPTIONAL ITEMS)
2020 2019
€’m €’m
Fuel and other energy related costs 1,270 1,287
Depreciation and amortisation 807 806
Employee costs 494 490
Operating and Maintenance costs* 525 429
Net impairment losses on financial assets 25 12
Impairment (excluding exceptional items) 13 12
3,134 3,036
EBITDA 2020 2019
Operating Profit 369 588
Impairments (including non-trading net impairment losses on financial assets) 201 46
Depreciation 807 806
Revenue from Supply Contributions (78) (68)
EBITDA 1,299 1,372
Exceptionals (non-impairment)* 59 60
EBITDA before Exceptionals 1,358 1,432
*Exceptional items (non-impairment) 2020 – Increase in ARO provision €59 million, 2019 Severance costs €55 million and Just Transition costs €5million.
FIGURE 5: RECONCILIATION OF ADJUSTED PROFIT BEFORE TAXATION
2020 2019
€’m €’m
Profit before tax 186 397
Exceptional Items 247 94
Fair Value Movement on RPI linked Interest Rate Swaps 47 23
Adjusted profit before taxation 480 514
FIGURE 6: TOTAL FINANCE COSTS
2020 2019
€’m €’m
Net interest on borrowingsFinancing charges Finance income
125 19 (2)
152 17 (2)
Net finance costsInflation linked interest rate swapsFair value losses/(gains) on financial instruments
14247
3
16723(8)
Total finance costs 192 182
REVENUERevenue and other operating income before exceptional items at €3,750 million has increased by €32 million compared to 2019 (€3,718 million).
The increase is primarily driven by higher revenue in Customer Solutions due to increased volumes in the Irish large energy users sector and ESB Energy (GB) business, as well as higher tariffs in the regulated networks businesses partially offset by lower revenue in Generation and Trading due to the conclusion of the peat
PSO and certain gas contracts during 2019.
OPERATING COSTSOverall operating costs before exceptional items at €3,134 million have increased by €98 million.
2020 2019
€’m €’m
Revenue and other operating income 3,750 3,718
Operating costs* (3,134) (3,036)
Operating profit 616 682
Exceptional items (247) (94)
Operating profit after exceptional items 369 588
Total finance costs (142) (167)
Fair value movements on financial instruments (50) (16)
Share of equity accounted investees profit/(loss) 9 (8)
Profit before tax 186 397
Tax charge (60) (59)
Profit after tax 126 338
*Includes non-exceptional impairments (see note 7)
FIGURE 2: SUMMARISED INCOME STATEMENT
CO
RP
OR
ATE G
OV
ER
NA
NC
E
02
FINA
NC
IAL S
TATEM
EN
TS
03
01
STR
ATEGY
AN
D P
ER
FOR
MA
NC
E

56 ESB Annual Report 2020 - Brighter Together ESB Annual Report 2020 57
The gearing level has decreased from 57% to 55% reflecting the lower net debt.
CAPITAL INVESTMENTESB invested €1,115 million of capital expenditure in 2020, a decrease of €127 million on 2019.
Generation & Trading invested €121 million in 2020 including the acquisition of 50% of the 1 GW Inch Cape (UK) offshore wind farm development project in 2020. Expenditure in 2019 included the acquisition of the Neart na Gaoithe offshore windfarm and the construction of the Grousemount onshore windfarm (which was commissioned in 2020).
Despite the initial restrictions on construction activities due to the COVID-19 pandemic, ESB Networks and NIE Networks continued to invest in the network infrastructure in both ROI and NI in line with their agreed regulatory programmes. Capital Expenditure in ESB Networks includes the increased spend on the SMART metering project and the increase relating to the ARO provision for creosote poles.
Capital investment of €105 million in other segments includes various group projects such as the re-development of the Fitzwilliam Street Head Office and significant upgrade of IT systems.
TREASURY MANAGEMENT FRAMEWORK FOR TREASURY AND TRADING OPERATIONSThe biggest risk facing ESB and the communities it serves is the impact of climate change. ESB’s Brighter Future Strategy is anchored in our determination to lead the transition to a low-carbon energy future based on clean, reliable, affordable electricity. ESB Group Treasury manages treasury and trading risks to enable the Group to deliver on this ambition. These related risks may be further broken down as follows:
• Liquidity availability and maintenance of access
to the debt capital markets• Foreign exchange volatility• Interest cost exposures on the Group’s projected
future debt requirements• Inflation movements, which have the potential to
erode financial performance over time • Commodity price movements• Counterparty credit exposure, and counterparty
risk generally• Operational risk, including risk of
misappropriation of funds, through fraud or error• Compliance with financial regulations
Group Treasury is responsible for the day-to-day treasury activities of the Group, and therefore for the management, in whole or in part, of each of these risks. Some of these risks can be mitigated using derivatives. Where this is the case, such instruments are executed in compliance with the Requirements and Conditions of the Minister for Finance issued under the Financial Transactions of Certain Companies and Other Bodies Act 1992. ESB does not enter into derivative contracts which are speculative in nature, but only to hedge underlying economic risks.
The Finance and Investment Committee of the Board is updated on an ongoing basis on key treasury matters. Group Treasury’s approach to the management of the key financial risks of ESB is set out in more detail within the Financial Risk Management and Fair Value note 28 in the Financial Statements.
LIQUIDITY AND FUNDING ACTIVITIESGroup Treasury’s funding activities are of strategic importance to the Group, supporting ESB’s capital expenditure programme, the refinancing of maturing debt, and the maintenance of an appropriate liquidity buffer to guard against future economic shocks which may have an impact on cash flows and financial markets.
In January 2020, the Group raised a 15.5-year STG £325 million bond under its Euro Medium
Term Note (EMTN) public bond programme. This bond has a coupon of 1.875% and was more than five times oversubscribed.
In February 2020, ESB negotiated a new €1.4 billion Sustainability-linked Revolving Credit Facility with a group of fourteen international banks. This replaced the previous €1.44 billion facility signed in 2015. The cost of this standby liquidity facility is directly linked to the delivery by ESB of specific decarbonisation targets aligned with ESB’s Brighter Future Strategy.
From March 2020 the Group was impacted by the disruption caused by COVID-19 and the associated public health restrictions in Ireland, the UK and around the world. Revenues and net cash flows proved remarkably resilient during the year in the face of these restrictions. However, many of ESB’s customers, particularly in the SME sector, were impacted adversely, and ESB has endeavoured to support these customers where possible. To ensure sufficient cash on hand in the context of this ongoing economic uncertainty, in July 2020, ESB took advantage of favourable market conditions to raise €200 million in additional borrowings under its Green Bond Framework at an all-in yield of 0.55%. This also supported the further growth of ESB’s portfolio of renewable assets. In November 2020 ESB acquired a 50% equity stake in the 1 GW offshore wind project, Inch Cape.
During the year, Standard & Poor’s and Moody’s both reaffirmed ESB credit rating at A- and A3 respectively.
At 31 December 2020 the Group had €1.8 billion in cash and available committed facilities. As illustrated by the graphic below, this is greatly in excess of scheduled debt repayments due over the next 3 years.
By year end, the weighted average interest rate on Group borrowings had fallen to 2.7% (December 2019: 3.0%). In recent years the Group has been able to issue longer dated (10 to 20 year) bonds, reducing medium term refinancing risk. This increase in the average duration of the Group’s debt portfolio is consistent with the long-term nature of Group assets.
FOREIGN EXCHANGE AND INTEREST RATE RISK MANAGEMENTThe Group’s business is primarily located in the Republic of Ireland and the United Kingdom (UK). Accordingly, the majority of operating and investing cash flows are denominated in euro or sterling. The main exceptions to this are coal purchases, which are generally denominated in US dollars, and which are a declining element within ESB’s fuel mix. ESB’s policy is to hedge any material foreign currency exposures as they arise using currency derivatives such as FX forwards, at competitive rates in the market.
The Group’s policy is to finance its euro
denominated business by borrowing directly in euro or to convert any foreign currency borrowing to euro using derivative instruments, such as cross currency swaps. Investments in the UK (including NIE Networks) are generally funded by debt either issued in, or swapped to, pounds sterling. At 31 December 2020 approximately 66% of ESB’s underlying debt is denominated in euro, with the remaining 34% in sterling.
Under the Board approved interest rate policy, ESB has a preference for fixed interest rate debt, and will target to have a significant majority of its debt at fixed (or inflation linked) interest rate to maturity, with a minimum of 60% fixed maintained at all times. At 31 December 2020, approximately 96% of Group borrowings were fixed to maturity, or inflation linked. The Group is however exposed to future interest rate movements which may have an impact on the cost of future borrowing requirements, particularly as existing fixed rate debt matures, and is refinanced. Group Treasury monitors market conditions closely in this regard and may seek to pre-fund or pre-hedge future funding requirements if appropriate, subject to the necessary Board and Shareholder approvals.
COMMODITY PRICE RISKIreland’s 2020 electricity demand was remarkably resilient this past year, despite the challenging environment, with demand on an annual basis down less than 1% versus 2019.
Fuel and carbon prices paid by ESB in connection with its electricity generation activities can exhibit some volatility, depending on market conditions. In 2020, coal use across Europe fell to historic lows. European year-ahead coal prices are deflated, as the penalty (i.e. carbon price) for using the fuel has increased, with the cost of carbon emission permits in Ireland seven times what it was in
2017. Stricter clean-energy policies and an abundance of natural gas also contributed to the reduction in coal usage. ESB’s own coal-fired Moneypoint power station has had a reduced output over the past year, with a lower-running regime likely to persist into the future prior to eventual cessation of coal fired generation by the middle of this decade.
The exposures to fuel price movements on future earnings are managed by ESB on a selective-hedging basis. ESB has entered into forward commodity price contracts in relation to gas, coal and carbon emissions allowances for up to three years ahead in order to reduce the Group’s exposure to movements in wholesale electricity prices arising from such commodity price fluctuations. The Group’s supply businesses in Ireland, Northern Ireland and Great Britain provide a natural hedge in this respect.
COUNTERPARTY RISKThe Group is exposed to credit risk in respect of the counterparties with which it holds its bank accounts and trades with in financial and commodity markets. In 2020 and considering the UK’s intended departure from the European Union, ESB worked with its banking partners to ensure a smooth transition, with minimal disruption. ESB policy is to limit exposure to counterparties based on credit risk assessments. Exposures and credit limits are subject to ongoing review and monitoring in each business unit, and, at Group level, by the Group Trading Committee (GTC). Dealing activities are controlled by establishing dealing mandates with counterparties.
Counterparty credit limits set by the GTC are closely linked to their credit ratings as determined by the leading credit rating agencies, although other factors, including security provided and the legal structure of
the transaction, may also be considered. The limit set for a counterparty is the amount by which the sum of the settlement amount, the mark to market value and the potential future exposure may not be exceeded. These positions are reviewed on a regular (up to daily) basis. During 2020, the majority of the Group’s fuel commodity trades by value were transacted through energy market exchanges, rather than bilaterally. Exchange trading in general reduces, although it does not eliminate, counterparty risk, as well as providing trading liquidity and pricing transparency. Group Treasury hedging (regarding foreign exchange, interest rate, and inflation risk), continues to be carried out bilaterally with rated relationship banks, through bilateral OTC contracts.
FINANCIAL REGULATIONThe regulatory environment for trading in financial and energy markets has become more complex in recent years, and the Group’s capability in this regard has increased accordingly. During 2020, Group Treasury progressed planning with regard to interest rate benchmark reform, focussing in particular on the transition of GBP LIBOR (London Inter Bank Offer Rate) to SONIA (Sterling Overnight Index Average).
*cash flows associated with private placement repayments reflect hedging arrangements in place
FIGURE 9: DEBT MATURITY* PROFILE AT 31 DECEMBER 2020 (EXCLUDING NON-RECOURSE PROJECT FINANCE DEBT HELD IN JOINT VENTURES):FIGURE 8: CAPITAL EXPENDITURE
CO
RP
OR
ATE G
OV
ER
NA
NC
E
02
FINA
NC
IAL S
TATEM
EN
TS
03
01
STR
ATEGY
AN
D P
ER
FOR
MA
NC
E

58 ESB Annual Report 2020 - Brighter Together ESB Annual Report 2020 59
What were the key achievements for Generation & Trading in 2020 and how did the business respond to COVID-19?
There are two key achievements for the year: 1. Major progress in the delivery of GT’s
renewable’s strategy. ESB intends to have 3.5 GW of renewables assets by 2030 and 2020 has been a positive year on the journey to meeting thisobjective.
• Significant growth in ESB’s footprint in offshore wind. In 2020, ESB acquired a 50% shareholding in Inch Cape, a 1,080 MW offshore wind farm development project, located off the east coast of Scotland. This builds on the acquisition of a stake in Neart na Gaoithe in 2019, which is currently under construction, and the Galloper operational offshore windfarm in 2018. Offshore wind in Ireland remains a key focus for ESB through continued partnering with Parkwind, in the development of the Oriel and Clogherhead wind farms, and with Equinor to co-develop a number of offshore wind assets in Ireland.
• Completion of the 114 MW Grousemount project in 2020, ESB’s largest wind farm to date.
• In 2020 ESB significantly enhanced its solar development pipeline via the acquisition of projects from Terrasolar and Harmony Solar. These acquisitions have secured a development portfolio of circa 930 MW. Two projects were successful in the first Renewable Energy Support Scheme
(RESS-1) auction, with the remaining assets targeting the next auction round.
• Development of a significant future pipelineof onshore wind assets with our partnersas follows:- Significant progress has been made in finalising the
joint venture with Coillte, and was approved by the Competition and Consumer Protection Commission (CCPC) in 2021. The joint venture will develop a pipeline of up to 1,000 MW of onshore wind in Ireland.
- The successful achievement by Oweninny 2 windfarm of a Renewable Energy Support Scheme (RESS-1) contract in 2020. The project is an 83 MW project being co-developed in a 50:50 joint venture with Bord Na Mona.
- The ongoing development of a significant pipeline of circa 1 GW of onshore wind assets in Scotland and Wales.
2. Effectively managing a business in transition to a low-carbon environment while dealing with the COVID-19 pandemic
• The Generation and Trading business is going through a period of significant transition, in common with similar businesses across Europe. Overall, the business was effective in managing its operations safely, while delivering our financial targets for the year. In addition to the challenges presented by this transition, COVID-19 presented a very particular set of challenges to the business in 2020.
• With regard to COVID-19, Generation and Trading participated in the coordinated pan ESB response to the COVID-19 epidemic. The initial focus was to ensure the safe and continuous operation of ESB’s generation assets. Initial measures were first adopted in January, with broader measures following in March and throughout 2020. In a very challenging operating environment, ESB operated a comprehensive suite of protocols to protect staff from COVID-19 at generating stations and ensure ESB plants continued to operate in the context of an essential service provider.
• The drop in economic activity in the earliest stages of the pandemic had a significant impact on electricity demand. In April demand fell 15% when compared with the same period in the previous year, before gradually recovering and demand levels for 2020 were marginally lower than 2019.
• The plant maintenance programme for 2020 was disrupted, but the rescheduling of work allowed a number of major overhauls to be completed after additional planning with suppliers and key contractors.
• The operational performance of the portfolio was strong throughout 2020 despite the operational
restrictions and system challenges the business faced. Alongside the strong operational performance of plants, the business adapted to a working from home environment with minimal business interruption.
How did Generation & Trading help ESB fulfil its Brighter Future Strategy?
ESB has a strategic objective to support the decarbonisation of the electricity sector. To meet this goal, as described above, GT is investing in renewable energy assets across a range of technologies to meet its renewables target. GT is also developing assets that will support the grid in transitioning to a low-carbon future, such as battery and storage assets and flexible gas-fired units that respond quickly to system demand, which will be key to facilitating large-scale renewables in the future.
OVERVIEW The GT business develops, operates and trades theoutput of ESB’s electricity generation assets. The portfolio consists of 5,530 MW of generation assets across SEM and Great Britain (GB), including 1,003 MW of renewable assets, with a further 224 MW under construction. With a strong focus on safety, GT delivers value by: • Providing wholesale and traded products to meet
market and customer needs; • Offering capacity and system services to support a
robust electricity grid and facilitate the integration of renewables;
• Optimising the operation of the ESB generation portfolio;
• Delivering new energy assets to support the transitionto low-carbon energy; and
• Engaging constructively in communities close toconstruction projects and operating assets.
FINANCIAL PERFORMANCE GT’s operating profit before exceptional items at €108 million is down €90 million on 2019. This is mainly due to lower energy margin following the conclusion of the peat public service obligation (PSO) and certain gas contracts in 2019 .
GT has incurred an exceptional impairment charge of €188 million in the year on the Carrington gas fired power plant in Great Britain. Thermal GB energy margins have fallen in the year as increased renewable generation on the system and reduced demand has displaced thermal plant and reduced margins. GB projected thermal margins and captured spreads into the future are also projected to fall due to a reduction in expected demand and lower forecast peak prices.
Capital expenditure of €121 million in 2020 primarily relates to ESB’s continued investment in renewable assets, including the acquisition of 50% of the Inch Cape Offshore Wind Farm project and the continued spend on the overhaul programme of existing assets.
OPERATING ENVIRONMENT The generation business is changing rapidly, in particular the thermal plants in the market. Competition, regulation and decarbonisation have significantly changed the landscape, creating a challenging operating environment, particularly for thermal plants. Portfolio running in 2020 was slightly lower than 2019 and GT will continue to evolve and adapt the thermal portfolio so
that its commercial performance is maximised.
In addition to lower SEM running volume, commodity prices have fallen compared to 2019. This has been mitigated largely through hedging and increased generation from other elements of the GT generation portfolio. Wind generation was strong in 2020, with the commencement of commercial operation of Grousemount Wind Farm in July.
ESB’s peat-fired power stations, Lough Ree Power and West Offaly Power, closed at the end of December 2020. Bringing to an end 70 years of peat fired generation in the midlands, and ESB is deeply appreciative of the support of the communities and particularly our staff past and present over that period. ESB and the staff in Lanesboro and Shannonbridge have engaged constructively to ensure appropriate arrangements are in place for staff in terms of retirement, retraining or reassignment elsewhere in ESB and has agreed to make a contribution to the Just Transition Fund of €5 million in light of the closure of these stations.
GT CUSTOMERS GT continues to offer a variety of traded contracts to all supply companies in SEM on a non-discriminatory basis via an over-the-counter trading platform in weekly trading windows. These trading windows provide suppliers with the opportunity to hedge their power exposures to mitigate against market volatility risk for their customers.
PEOPLE Employee numbers in GT of 796 are reduced from 914 in 2019, driven by the impact on operations of the change in running regimes and market requirements in the generation business. GT continues to focus on maintaining the safe and effective performance of its asset base while delivering on its Brighter Future Strategy.
Health, safety and wellbeing is of fundamental importance and GT’s safety improvement programme during 2020 was directed at continuing to embed the process safety programme, deepening the approach to behavioural safety through the Safe and Sound Programme, and the promotion of health and wellbeing.
All locations within GT operate and maintain Safety Management Systems that are certified and externally audited to recognised international standards for which accreditation was maintained in 2020. Additionally, nine GT locations succeeded in moving accreditation from the OHSAS 18001 standard to the replacement ISO 45001 Standard.
Employee engagement continues to be key to successful performance for the GT business, even more so during the COVID-19 pandemic. Using the employee survey results and other feedback, GT has embedded a tailored programme of engagement to support managers, share innovative thinking and keep people connected, healthy and safe.
SUSTAINABILITYGT operates its business with a focus on minimising environmental impact, aiming to significantly increase renewable generation and reduce the overall carbon intensity of electricity generation. ESB is committed to leading a secure and affordable transition away from the use of coal and peat for power generation. CO2 output from GT’s generation plants is lower than 2005 (reference date) by approximately 64%, and the carbon intensity of generation reduced by 44% to 378 g/kWh.
GENERATION AND TRADING (GT)
OPERATING PROFIT*
CAPITAL EXPENDITURE
2020 €108 million*
2019 €198 million*(€90 million)
2020 €121 million
2019 €424 million€303 million
KPI
*before exceptional items of €188 million (2019: €94 million)
Jim Dollard EXECUTIVE DIRECTOR GENERATION AND TRADING
UPDATE ON 2020 PRIORITIES AND PRIORITIES FOR 2021
2020 Priority 2020 Progress 2021 Priority
OPERATIONALContinue to maintain a healthy and injury-free workplace
• A heightened focus on learning from incidents, greater emphasis on wellbeing inCOVID times
• Continue to maintain ahealthy and injury-free workplace
Commence phase 2 of Safe System of Work and continue to improve safety assurance
• Phase 1 of Safe System of Work complete• Preparation for commencement of phase 2
• Commence phase 2 (full roll-out) of Safe System of Work
Improve Process Safety performance in the business
• Further embedding of Process Safety • Strengthen Process Safetypractices in the business
Continue with further implementation groups in the Safe and Sound Programme
• Continued implementation of the Safe andSound programme
• Broaden and deepen enrolment in Safe and SoundProgramme
Safely complete final stages of build out of the Grousemount wind project
• The construction of the Grousemount windfarm 114 MW was substantially completed in 2019, with commercial operation achieved in July 2020
Oversee the initial stages of build out of NNG offshore wind farm
• Continued to oversee the initial stages ofbuild out of NNG offshore wind farm
• Continue to oversee the initialstages of build out of NNG offshore wind farm
• Oversee the commercialisation of InchCape offshore wind farm
Maintain a high level of performance in both gen-eration and trading
• Annual availability of the generation fleetwas slightly higher than 2019 due to a lower number of scheduled outages
• Maintain a high level of performance in both generation and trading
Continue to evolve and adapt the thermal portfolio so that its commercial per-formance is maximised
• Reduced Trading performance in 2020 butmaintained solid performance despite the economic impacts of COVID-19
• Continue to evolve and adaptthe thermal portfolio so that its commercial performance is maximised
STRATEGIC Increase the number of opportunities for investment in low-carbon generation including solar and offshore wind
• Significant progress made in 2020 with the investments in Inch Cape. The joint venture being developed with Coillte and partnership with Equinor will offer further opportunities to explore in the future. Entered in partnership with Parkwind on development of Oriel and Clogherhead offshore wind farms
• Continuing development of potential solarprojects, and by means of joint ventures with Bord na Mona
• Continuing development of up to 850 MW of wind generation in Scotland and 110 MW of wind generation in Wales, in conjunction with Coriolis and with REG Holdings, of which 150 MW is now fully consented
• Development of potential flexible gas plants and batteries in GB and ROI, with 10-year capacity contracts achieved for a number ofdevelopments in ROI
• Increase the number of opportunities for investmentin low-carbon generation including solar and offshore wind
• Manage the efficient and orderly closure of the Peat stations
• With the refusal of planning permission for the Peat stations in 2019, both peatstations closed at the end of 2020
• Manage the efficient and orderly closure and decommissioning of the Peatstations
Offshore Wind in GB MarketInch Cape (IC) is a fully consented 1,080 MW development stage offshore wind project located off the east coast of Scotland, near Dundee (adjacent to the Neart Na Gaoithe project). The project will be progressed jointly by both ESB and Red Rock Power, each owning 50%. It is expected that the project will enter the next competitive Contracts for Difference (CfD) auction round in GB during 2021, with a view to securing a route to market and, ultimately, commercial operation in 2024.
Why did ESB invest in Inch Cape (IC)?Offshore wind is a key part of the ESB Renewables strategy. Building on the recent investment in both the Neart Na Gaoithe offshore wind farm in 2019 and the Galloper offshore wind farm in 2018, this investment strengthens commitment at ESB to developing an offshore wind portfolio in ESB’s core markets of Ireland and Great Britain. IC positions ESB well in delivering on the scale of ambition in ESB’s Brighter Future Strategy to significantly increase the volumes of zero-carbon technologies in GT’s generation portfolio.
BRIGHTER TOGETHER
CO
RP
OR
ATE G
OV
ER
NA
NC
E
02
FINA
NC
IAL S
TATEM
EN
TS
03
01
STR
ATEGY
AN
D P
ER
FOR
MA
NC
E
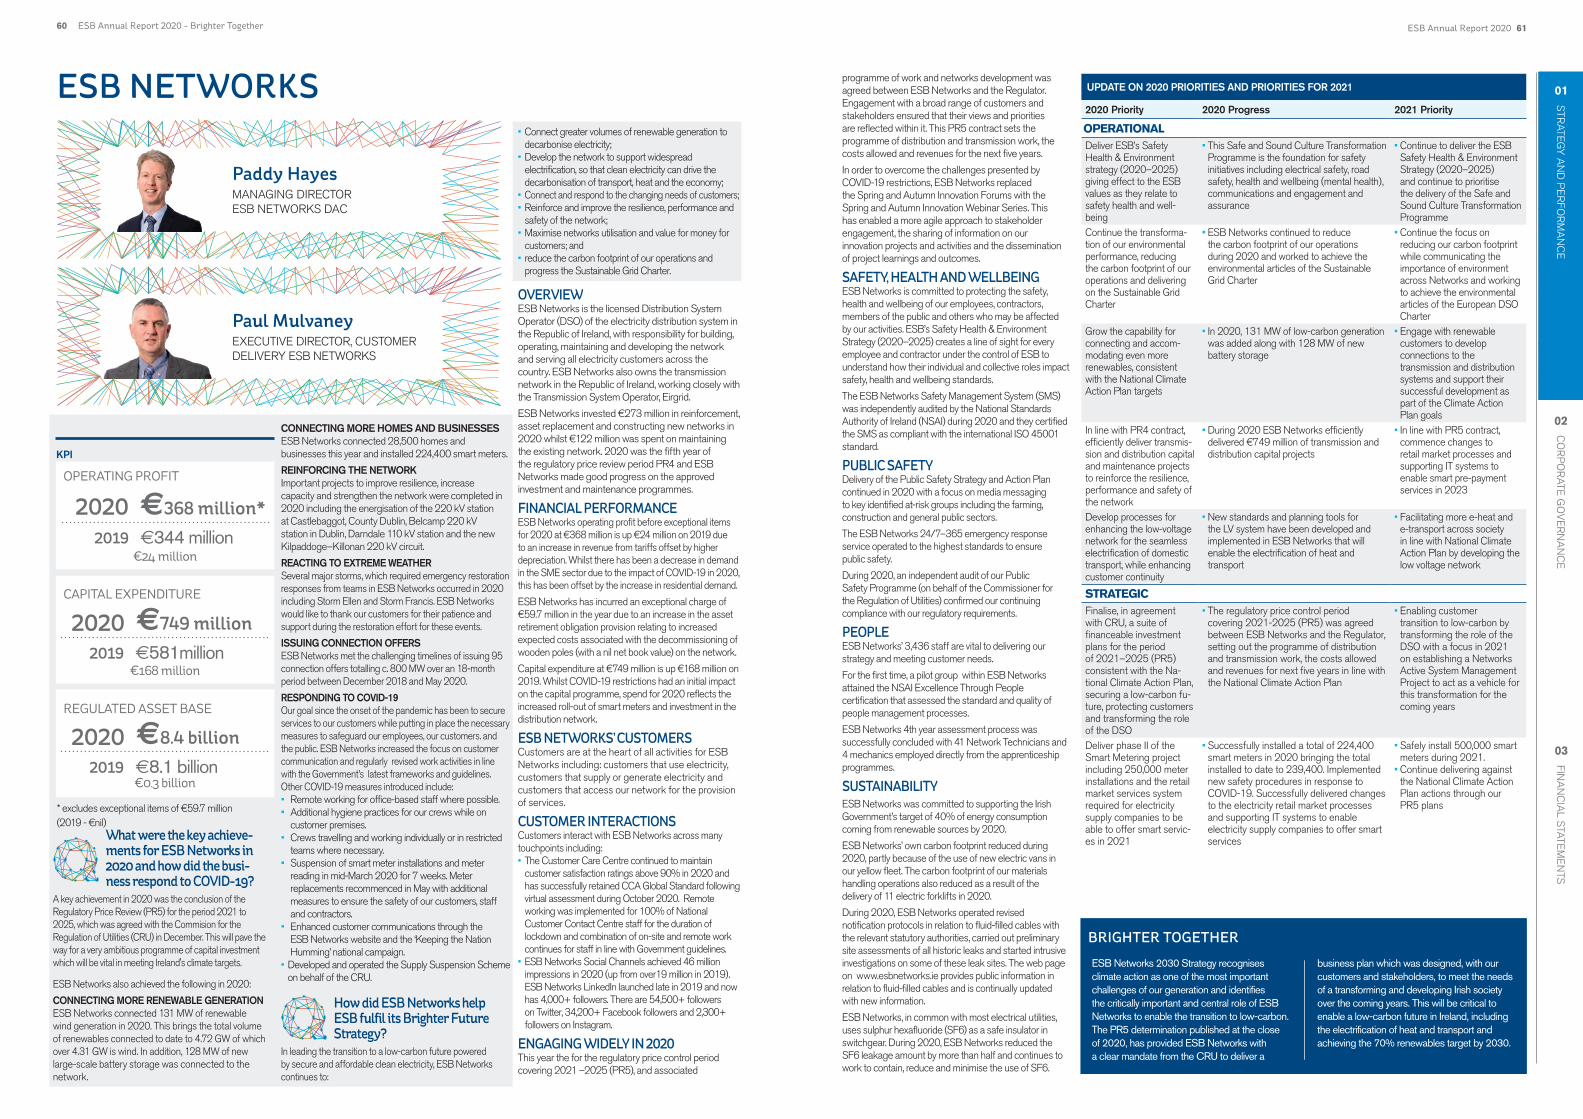
60 ESB Annual Report 2020 - Brighter Together ESB Annual Report 2020 61
CONNECTING MORE HOMES AND BUSINESSESESB Networks connected 28,500 homes and businesses this year and installed 224,400 smart meters.
REINFORCING THE NETWORKImportant projects to improve resilience, increase capacity and strengthen the network were completed in 2020 including the energisation of the 220 kV station at Castlebaggot, County Dublin, Belcamp 220 kV station in Dublin, Darndale 110 kV station and the new Kilpaddoge–Killonan 220 kV circuit.
REACTING TO EXTREME WEATHERSeveral major storms, which required emergency restoration responses from teams in ESB Networks occurred in 2020 including Storm Ellen and Storm Francis. ESB Networks would like to thank our customers for their patience and support during the restoration effort for these events.
ISSUING CONNECTION OFFERSESB Networks met the challenging timelines of issuing 95 connection offers totalling c. 800 MW over an 18-month period between December 2018 and May 2020.
RESPONDING TO COVID-19Our goal since the onset of the pandemic has been to secure services to our customers while putting in place the necessary measures to safeguard our employees, our customers. and the public. ESB Networks increased the focus on customer communication and regularly revised work activities in line with the Government’s latest frameworks and guidelines. Other COVID-19 measures introduced include: • Remote working for office-based staff where possible.• Additional hygiene practices for our crews while on
customer premises.• Crews travelling and working individually or in restricted
teams where necessary.• Suspension of smart meter installations and meter
reading in mid-March 2020 for 7 weeks. Meter replacements recommenced in May with additional measures to ensure the safety of our customers, staffand contractors.
• Enhanced customer communications through the ESB Networks website and the ‘Keeping the Nation Humming’ national campaign.
• Developed and operated the Supply Suspension Schemeon behalf of the CRU.
How did ESB Networks help ESB fulfil its Brighter Future Strategy?
In leading the transition to a low-carbon future powered by secure and affordable clean electricity, ESB Networks continues to:
What were the key achieve-ments for ESB Networks in 2020 and how did the busi-ness respond to COVID-19?
A key achievement in 2020 was the conclusion of the Regulatory Price Review (PR5) for the period 2021 to 2025, which was agreed with the Commision for the Regulation of Utilities (CRU) in December. This will pave the way for a very ambitious programme of capital investment which will be vital in meeting Ireland's climate targets.
ESB Networks also achieved the following in 2020:
CONNECTING MORE RENEWABLE GENERATIONESB Networks connected 131 MW of renewable wind generation in 2020. This brings the total volume of renewables connected to date to 4.72 GW of which over 4.31 GW is wind. In addition, 128 MW of new large-scale battery storage was connected to the network.
• Connect greater volumes of renewable generation todecarbonise electricity;
• Develop the network to support widespread electrification, so that clean electricity can drive the decarbonisation of transport, heat and the economy;
• Connect and respond to the changing needs of customers;• Reinforce and improve the resilience, performance and
safety of the network; • Maximise networks utilisation and value for money for
customers; and• reduce the carbon footprint of our operations and
progress the Sustainable Grid Charter.
OVERVIEW ESB Networks is the licensed Distribution System Operator (DSO) of the electricity distribution system in the Republic of Ireland, with responsibility for building, operating, maintaining and developing the network and serving all electricity customers across the country. ESB Networks also owns the transmission network in the Republic of Ireland, working closely with the Transmission System Operator, Eirgrid.
ESB Networks invested €273 million in reinforcement, asset replacement and constructing new networks in 2020 whilst €122 million was spent on maintaining the existing network. 2020 was the fifth year of the regulatory price review period PR4 and ESB Networks made good progress on the approved investment and maintenance programmes.
FINANCIAL PERFORMANCE ESB Networks operating profit before exceptional items for 2020 at €368 million is up €24 million on 2019 due to an increase in revenue from tariffs offset by higher depreciation. Whilst there has been a decrease in demand in the SME sector due to the impact of COVID-19 in 2020, this has been offset by the increase in residential demand.
ESB Networks has incurred an exceptional charge of €59.7 million in the year due to an increase in the asset retirement obligation provision relating to increased expected costs associated with the decommissioning of wooden poles (with a nil net book value) on the network.
Capital expenditure at €749 million is up €168 million on 2019. Whilst COVID-19 restrictions had an initial impact on the capital programme, spend for 2020 reflects the increased roll-out of smart meters and investment in the distribution network.
ESB NETWORKS’ CUSTOMERS Customers are at the heart of all activities for ESB Networks including: customers that use electricity, customers that supply or generate electricity and customers that access our network for the provision of services.
CUSTOMER INTERACTIONSCustomers interact with ESB Networks across many touchpoints including:• The Customer Care Centre continued to maintain
customer satisfaction ratings above 90% in 2020 and has successfully retained CCA Global Standard followingvirtual assessment during October 2020. Remote working was implemented for 100% of National Customer Contact Centre staff for the duration of lockdown and combination of on-site and remote work continues for staff in line with Government guidelines.
• ESB Networks Social Channels achieved 46 million impressions in 2020 (up from over19 million in 2019). ESB Networks LinkedIn launched late in 2019 and nowhas 4,000+ followers. There are 54,500+ followers on Twitter, 34,200+ Facebook followers and 2,300+ followers on Instagram.
ENGAGING WIDELY IN 2020 This year the for the regulatory price control period covering 2021 –2025 (PR5), and associated
ESB NETWORKS
Paddy Hayes MANAGING DIRECTOR ESB NETWORKS DAC
Paul Mulvaney EXECUTIVE DIRECTOR, CUSTOMER DELIVERY ESB NETWORKS
OPERATING PROFIT
CAPITAL EXPENDITURE
REGULATED ASSET BASE
€24 million
2020 €368 million*
2019 €344 million
€168 million
2020 €749 million
2019 €581million
€0.3 billion
2020 €8.4 billion
2019 €8.1 billion
KPI
* excludes exceptional items of €59.7 million(2019 - €nil)
programme of work and networks development was agreed between ESB Networks and the Regulator. Engagement with a broad range of customers and stakeholders ensured that their views and priorities are reflected within it. This PR5 contract sets the programme of distribution and transmission work, the costs allowed and revenues for the next five years.
In order to overcome the challenges presented by COVID-19 restrictions, ESB Networks replaced the Spring and Autumn Innovation Forums with the Spring and Autumn Innovation Webinar Series. This has enabled a more agile approach to stakeholder engagement, the sharing of information on our innovation projects and activities and the dissemination of project learnings and outcomes.
SAFETY, HEALTH AND WELLBEINGESB Networks is committed to protecting the safety, health and wellbeing of our employees, contractors, members of the public and others who may be affected by our activities. ESB’s Safety Health & Environment Strategy (2020–2025) creates a line of sight for every employee and contractor under the control of ESB to understand how their individual and collective roles impact safety, health and wellbeing standards.
The ESB Networks Safety Management System (SMS) was independently audited by the National Standards Authority of Ireland (NSAI) during 2020 and they certified the SMS as compliant with the international ISO 45001 standard.
PUBLIC SAFETY Delivery of the Public Safety Strategy and Action Plan continued in 2020 with a focus on media messaging to key identified at-risk groups including the farming, construction and general public sectors.
The ESB Networks 24/7–365 emergency response service operated to the highest standards to ensure public safety.
During 2020, an independent audit of our Public Safety Programme (on behalf of the Commissioner for the Regulation of Utilities) confirmed our continuing compliance with our regulatory requirements.
PEOPLE ESB Networks’ 3,436 staff are vital to delivering our strategy and meeting customer needs.
For the first time, a pilot group within ESB Networks attained the NSAI Excellence Through People certification that assessed the standard and quality of people management processes.
ESB Networks 4th year assessment process was successfully concluded with 41 Network Technicians and 4 mechanics employed directly from the apprenticeship programmes.
SUSTAINABILITYESB Networks was committed to supporting the Irish Government’s target of 40% of energy consumption coming from renewable sources by 2020.
ESB Networks’ own carbon footprint reduced during 2020, partly because of the use of new electric vans in our yellow fleet. The carbon footprint of our materials handling operations also reduced as a result of the delivery of 11 electric forklifts in 2020.
During 2020, ESB Networks operated revised notification protocols in relation to fluid-filled cables with the relevant statutory authorities, carried out preliminary site assessments of all historic leaks and started intrusive investigations on some of these leak sites. The web page on www.esbnetworks.ie provides public information in relation to fluid-filled cables and is continually updated with new information.
ESB Networks, in common with most electrical utilities, uses sulphur hexafluoride (SF6) as a safe insulator in switchgear. During 2020, ESB Networks reduced the SF6 leakage amount by more than half and continues to work to contain, reduce and minimise the use of SF6.
UPDATE ON 2020 PRIORITIES AND PRIORITIES FOR 2021
2020 Priority 2020 Progress 2021 Priority
OPERATIONALDeliver ESB’s Safety Health & Environment strategy (2020–2025) giving effect to the ESB values as they relate to safety health and well-being
• This Safe and Sound Culture TransformationProgramme is the foundation for safety initiatives including electrical safety, road safety, health and wellbeing (mental health), communications and engagement and assurance
• Continue to deliver the ESB Safety Health & Environment Strategy (2020–2025) and continue to prioritise the delivery of the Safe and Sound Culture TransformationProgramme
Continue the transforma-tion of our environmental performance, reducing the carbon footprint of our operations and delivering on the Sustainable Grid Charter
• ESB Networks continued to reduce the carbon footprint of our operations during 2020 and worked to achieve the environmental articles of the SustainableGrid Charter
• Continue the focus on reducing our carbon footprint while communicating the importance of environment across Networks and workingto achieve the environmental articles of the European DSO Charter
Grow the capability for connecting and accom-modating even more renewables, consistent with the National Climate Action Plan targets
• In 2020, 131 MW of low-carbon generationwas added along with 128 MW of new battery storage
• Engage with renewable customers to develop connections to the transmission and distribution systems and support their successful development as part of the Climate Action Plan goals
In line with PR4 contract, efficiently deliver transmis-sion and distribution capital and maintenance projects to reinforce the resilience, performance and safety of the network
• During 2020 ESB Networks efficiently delivered €749 million of transmission anddistribution capital projects
• In line with PR5 contract, commence changes to retail market processes andsupporting IT systems to enable smart pre-payment services in 2023
Develop processes for enhancing the low-voltage network for the seamless electrification of domestic transport, while enhancing customer continuity
• New standards and planning tools for the LV system have been developed and implemented in ESB Networks that will enable the electrification of heat and transport
• Facilitating more e-heat and e-transport across society in line with National Climate Action Plan by developing thelow voltage network
STRATEGIC Finalise, in agreement with CRU, a suite of financeable investment plans for the period of 2021–2025 (PR5) consistent with the Na-tional Climate Action Plan, securing a low-carbon fu-ture, protecting customers and transforming the role of the DSO
• The regulatory price control period covering 2021-2025 (PR5) was agreed between ESB Networks and the Regulator, setting out the programme of distribution and transmission work, the costs allowed and revenues for next five years in line with the National Climate Action Plan
• Enabling customer transition to low-carbon by transforming the role of the DSO with a focus in 2021 on establishing a Networks Active System Management Project to act as a vehicle forthis transformation for the coming years
Deliver phase II of the Smart Metering project including 250,000 meter installations and the retail market services system required for electricity supply companies to be able to offer smart servic-es in 2021
• Successfully installed a total of 224,400 smart meters in 2020 bringing the total installed to date to 239,400. Implemented new safety procedures in response to COVID-19. Successfully delivered changesto the electricity retail market processes and supporting IT systems to enable electricity supply companies to offer smart services
• Safely install 500,000 smartmeters during 2021.
• Continue delivering against the National Climate ActionPlan actions through our PR5 plans
ESB Networks 2030 Strategy recognises climate action as one of the most important challenges of our generation and identifies the critically important and central role of ESB Networks to enable the transition to low-carbon. The PR5 determination published at the close of 2020, has provided ESB Networks with a clear mandate from the CRU to deliver a
business plan which was designed, with our customers and stakeholders, to meet the needs of a transforming and developing Irish society over the coming years. This will be critical to enable a low-carbon future in Ireland, including the electrification of heat and transport and achieving the 70% renewables target by 2030.
BRIGHTER TOGETHER
CO
RP
OR
ATE G
OV
ER
NA
NC
E
02
FINA
NC
IAL S
TATEM
EN
TS
03
01
STR
ATEGY
AN
D P
ER
FOR
MA
NC
E

62 ESB Annual Report 2020 - Brighter Together ESB Annual Report 2020 63
NORTHERN IRELAND ELECTRICITY NETWORKS (NIE NETWORKS)
What were the key achievements for NIE Networks in 2020 and how did the business respond to COVID-19?
2020 saw a significant impact on NIE Networks’ operations from the COVID-19 pandemic, with NIE Networks' Crisis Management Team and Executive Committee co-ordinating the response and implementing the business continuity and emergency response plans.
At the onset of the pandemic in Quarter 1 2020, NIE Networks identified three main priorities:
• protect the safety, health and wellbeing of employeesand customers;
• maintain a reliable electricity supply to customersacross Northern Ireland; and
• protect the business to safeguard employment andenable a successful return to normal operations.
In response to Government restrictions in Northern Ireland, NIE Networks ceased all non-essential works
on the network and made arrangements for the majority of office-based staff to work from home. NIE Networks maintained critical operations during the most significant COVID-19 restrictions and updated its standard operating procedures with support from ESB Networks and adapted its work sites to facilitate the safety of all staff whether working at field sites, NIE Networks’ premises or at home. Through 2020 NIE Networks continued to support its customers by providing a reliable electricity service and continues to do so as the impacts of COVID-19 persist.
In addition to maintaining core services, a significant number of staff participated in a range of volunteering activities to support local communities during the pandemic including making visors and scrubs for residential care home workers, delivering prescriptions and pro-actively calling vulnerable customers on NIE Networks’ Critical Care Register.
NIE Networks has continued to improve its network performance and service to customers with another significant reduction in Customer Minutes Lost (CMLs) when compared to 2019. Total CMLs in 2020 represents the lowest on record. This has been achieved alongside the delivery of NIE Networks’ RP6 commitments with an investment of over €88 million in the network in 2020.
How does the business help ESB fulfil its Brighter Future Strategy?
NIE Networks is working collaboratively with the Department for the Economy and other NI stakeholders on the development of a future energy framework for NI as well as implementing an Innovation Strategy which seeks to meet the low-carbon future challenge head on by working with customers to provide faster, cheaper and smarter connection solutions.
NIE Networks has been a significant contributor to ensuring that over 40% of Northern Ireland’s electricity consumption is produced from renewable sources. This milestone was achieved in 2019 but it continues to be advanced in 2020. This has been supported through the connection of approximately 1.7 GW of renewable capacity to the network by NIE Networks, with a further 0.3 GW capacity committed to be connected by 2022.
NIE Networks is trialling a range of network innovation projects which are designed to create additional capacity on the distribution network at a lower cost than traditional reinforcement solutions and can be deployed much faster in response to the forecast changes in demand. This will help facilitate the predicted high growth rate in the connection of low-carbon technologies such as electric vehicles, photovoltaic cells, energy storage and heat pumps.
NIE Networks has made significant progress in 2020 on its journey to evolve into a Distribution System Operator (DSO) meaning NIE Networks will be better placed to manage and optimise the network for the future energy market in NI. NIE Networks completed a public consultation on potential options for the role of the DSO and is now engaging with stakeholders to give effect to the resulting recommendations.
OVERVIEW NIE Networks is the owner of the electricity transmission and distribution networks in NI, transporting electricity to over 895,000 customers including homes, businesses and farms. NIE Networks’ employees maintain and extend the electricity infrastructure across NI, connect customers to the network and ensure that equipment is safe and reliable. NIE Networks also provides electricity meters and metering data to suppliers and market operators. NIE Networks develops and reconfigures the electricity network to facilitate the connection of further renewable generation.
As required under its regulatory licences, NIE Networks is an independent business within ESB with its own Board of Directors, management and employees.
SAFETY NIE Networks is fully committed to protecting the health and safety of all employees, contractors and customers. Safety is the core value of NIE Networks, and the aim is to provide an environment of zero harm.
Regrettably, all of NIE Networks suffered a terrible loss in 2020 with the death of one of its employees, Richard Scott, while working on the network. This tragedy has had a huge impact on Richard’s family and many friends and has also required that NIE Networks, as a business, looks at all of its activities to ensure that NIE Networks is implementing and adhering to the highest safety standards. All NIE Networks employees across the business have contributed to the review of its safety practices and the implementation of the resulting recommendations will be a key focus across the business in 2021.
The circumstances of the incident are being investigated both by the Health and Safety Executive for Northern Ireland and internally. The learnings from these investigations will be incorporated into NIE Networks’ operations as part of their ongoing commitment to providing a zero-harm working environment and the resulting safety enhancement programme will be a key priority for NIE Networks in 2021.
In addition to the fatality highlighted above, NIE Networks had 2 lost time incidents during the year (2019: 3).
FINANCIAL PERFORMANCENIE Networks’ operating profit for 2020 at €85 million is up €24 million on 2019 due to an increase in revenue from regulated tariffs.
Capital expenditure at €140 million is down €14 million, reflecting the impact of COVID-19 on the ability to deliver work across all capital programmes. Despite the restrictions on capital programmes in 2020, investment in the network remained sufficient to deliver a good service to customers as well as enabling NIE Networks to be in a position to meet its commitments over the term of the current price control. 2020 capital expenditure was primarily related to the refurbishment and replacement of worn transmission and distribution assets to maintain reliability of supply and ensure the safety of the network.
OPERATING PROFIT
CAPITAL EXPENDITURE
€24 million
(€14 million)
REGULATED ASSET BASE (RAB)
2020 €85 million
2019 €61 million
2020
2020
€140 million
£1.6 billion
2019
2019
€154 million
£1.6 billion
KPI
OPERATING ENVIRONMENT Notwithstanding the challenges outlined by the COVID-19 pandemic as outlined above, NIE Networks has been focused on implementing its RP6 plan, with 54% of the outputs from the Network Investment Plan delivered to date. In line with targets set in the current price control, NIE Networks reduced the number of customer complaints and overall customer minutes lost year on year.
NIE NETWORKS’ CUSTOMERSNIE Networks has continued to manage outages in order to minimise the length of time that customers are off supply, which is particularly important with a greater number of customers now working from home due to COVID-19 restrictions. The average number of customer minutes lost due to planned interruptions to supply was 33 (2019: 45). The average number of minutes lost due to faults in the distribution network was 41 (2019: 38). There were 2 complaints taken up by the Consumer Council for NI (CCNI) on behalf of customers during the year (2019: 2).
In the event of a power cut or planned interruption to supply, NIE Networks offer a telephone information support service to customers who are dependent on life supporting medical equipment. Over 10,000 people are currently registered on NIE Networks' Medical Customer Care Register.
PEOPLENIE Networks employs a highly skilled work force of 1,209 people ranging from lines persons to meter readers, jointers to electrical engineers, and finance professionals to human resource experts. NIE Networks is an accredited ‘Investors in People Gold’ Company.
NIE Networks is committed to a working environment which enables employees to realise their maximum potential and to be appropriately challenged and fully engaged in the business, with opportunities for skills enhancement and personal development. Human Resources policies are aligned with key business drivers including: performance and productivity improvement; clearly defined values and behaviours; a robust performance management process; and a strong commitment to employee development.
Through increasing awareness of STEM subjects and partnerships with industry bodies including Women in Business and the Institute of Directors, NIE Networks is striving to increase awareness of the careers on offer within the energy industry and attract more female employees. In January 2020, NIE Networks was awarded the Bronze Diversity Charter Mark for its work in promoting gender diversity.
SUSTAINABILITY NIE Networks has adopted the European Distribution System Operators’ (E.DSO) Sustainable Grid Charter as a statement of intention in relation to NIE Networks’ commitment to sustainability in respect of climate change and wider environmental and societal impacts.
NIE Networks has reduced its non-network carbon emissions by 11% during 2020 through a range of measures including improving the energy efficiency of work locations and increasing the use of technology to reduce the need for business travel. This level of reduction was helped in no small way by COVID-19 restrictions but NIE Networks continues to seek to reduce emissions in a meaningful way in future years.
NIE Networks has successfully cumulatively connected over 20,000 customers who provide renewable generation capacity to the network, significantly adding to the available market capacity.
NIE Networks achieved Platinum level accreditation for the NI Environmental Benchmarking Survey for the fourth consecutive year in 2020. The survey recognises and rewards those organisations that are going above and beyond their legal requirements to improve their environmental impacts and better manage their resources.
Jerry O’Sullivan DEPUTY CHIEF EXECUTIVE
UPDATE ON 2020 AND PRIORITIES FOR 2021
2020 Priority 2020 Progress 2021 Priority
OPERATIONALEnsure the health and safety of employees, contractors and the general public and achieve a zero-harm work environment through implementation of injury and accident-free initiatives
• Development and implementation of Safety Improvement Plan in response to the fatalityand lost time incidents on the network
• Retained both ISO accreditations
• Ensure the health and safety of employees, contractors and the general public and achieve a zero-harm work environment through implementation of the Safer Together programme
Implement a reduction in our internal carbon footprint
• 11% reduction in internal carbon footprint • Deliver a sustainable reductionin NIE Networks' internal carbon footprint by embedding low-carbon behaviours and practices
Deliver a Customer Service Action Plan for 2020 that will drive further improvement in customer service and development of a customer centric culture
• Customer feedback and update sessions on how NIE Networks provides its current services and how it should adapt for the future
• Continued management of outages toreduce customer minutes lost
• Commenced development of vulnerablecustomer strategy
• Continue to deliver strategy to achieve RP6 service commitments while delivering modern customer service through the Customer ServiceAction Plan.
Operate successfully in a con-testable connections market
• Retained significant market share while facilitating active competition and customerchoice
• Continue to operate successfullyin a contestable connections market while responding to the changing shape of the market post COVID-19
Review business plans to 2024 and take necessary steps to ensure NIE Networks remain on track for successful delivery of RP6
• Substantial capital investment (€140 million) during 2020 with spend incurred inline with allowances
• Deliver RP6 programme withinallowances while maintaining a safe and secure network and adapting to any practices and restrictions imposed by COVID-19
• Adapt RP6 programme to respond to the delays imposed byCOVID-19 to ensure all outputs delivered over programme term
STRATEGIC Provide effective employee engagement across the business through appropriate leadership and communica-tions Continue investment in employees through effective training and employee devel-opment
• Regular engagement with employees asCOVID-19 pandemic evolved
• Engagement with employees via a number of forums throughout the year
• Creation of new strategic roles to deliverfuture energy strategy
• Completion of 360 degree feedback for management team to support development
• Continue investment in employees through effective employee development and increased employee engagementwith focus on encouraging continuous improvement as well as responding to the changes in work practices arising from COVID-19
Continue effective engage-ment with key stakeholders including Consumer Engage-ment Advisory Panel and other customer representatives
• Significant engagement with Departmentfor the Economy and other stakeholders in 2020
• Implementation of stakeholder engagementstrategy
• Continue effective engagement with key stakeholders to aid development and implementationof NI’s Future Energy Strategy as well as the development of NIE Networks’ RP7 Price Control submission
• Engage on key policy and processes required for RP7 PriceControl
Continue to monitor funding market conditions to assess optimal timing for next fundraising
• Funding requirements reviewed on a regularbasis
• Continue to monitor funding market conditions to assess optimal timing for next fund raising
Contribute to the development of a new energy policy for NI appropriate to achieve net zero carbon by 2050
• Actively involved in shaping NI energy policy• Trialling of six innovation projects designed
to create distribution network capacity at a fraction of traditional costs commenced
• Contribute to the development of a new energy policy for NI appropriate to achieve net zerocarbon by 2050
• Engage with DfE and the NI Executive to pursue investment consistent with Green RecoveryOptions
Understand the impacts and changes required going forward in a decarbonised, decentralised and digitised world evolving from a DNO to a DSO
• Completed public consultation on potentialrole of the DSO
• Engage with stakeholders to begin implementation of DSO activities in line with public consultation
NIE Networks is contributing to the development of NI’s energy future as a member of the Energy Strategy Electricity Stakeholder Group and as an active participant in four of the thematic Working Groups led by the Department for the Economy (‘DfE’).
NIE Networks is working collaboratively with other stakeholders to assess a range of different pathways to 2050 net zero by considering deployment of various technologies such as renewables, electric vehicles, photovoltaic cells, energy storage and demand management.
BRIGHTER TOGETHER
CO
RP
OR
ATE G
OV
ER
NA
NC
E
02
FINA
NC
IAL S
TATEM
EN
TS
03
01
STR
ATEGY
AN
D P
ER
FOR
MA
NC
E

64 ESB Annual Report 2020 - Brighter Together ESB Annual Report 2020 65
CUSTOMER SOLUTIONS
What were the key achievements in 2020 for Customer Solutions and how did the business respond to COVID-19?
During 2020, Customer Solutions through its brands Electric Ireland, ESB Energy, ESB Smart Energy Services, eCars and ESB Telecoms continued to offer exceptional service and excellent value to all its customers.
The COVID-19 health emergency presented huge challenges for Customer Solutions but each business adapted to the situation to ensure customers were supported throughout. Our number one priority was to safely provide a reliable retail energy service to over 1.1 million homes and businesses throughout all our jurisdictions, with the level of care and service that our customers have come to expect from us. I’m proud to say we have delivered on that commitment. Our staff and outsource partners seamlessly and quickly transitioned to remote working in all locations, allowing all customer-facing and back office services to run smoothly and without disruption. In addition, a range of proactive initiatives were designed and offered to support customers experiencing cash flow difficulties including a number of moratoria on disconnection, vulnerable customer incentives and an increased range of flexible payment plans.
Delivering on ESB’s low-carbon strategy was also a significant focus for Customer Solutions during 2020. Initiatives included Electric Ireland’s launch of green tariffs for residential and SME customers, ESB eCars upgrade of the public charge point network which included the replacement of over 150 chargers
and our Smart Energy Service business delivering major energy solution products to large energy customers in ROI and GB.
How does the business help ESB to fulfil its Brighter Future Strategy?
Engaged, connected customers are a key strand in transitioning to a low-carbon future. Customer Solutions plays a critical role in putting the customer at the heart of ESB activities, responding to customers' shifting needs, and embracing rapid technological advances – all to build on our successes and shape a vibrant business that continues to deliver a strong benefit to society. Our smart metering deployment and the new smart metering tariffs will enable and incentivise customers to take a more productive role in managing their electricity consumption.
OVERVIEW Customer Solutions brings together all ESB’s retail and business offerings in Ireland and GB, including Electric Ireland, ESB Energy, ESB Smart Energy Services, ESB eCars and ESB Telecoms.
Electric Ireland is the energy retail arm of ESB in ROI and Northern Ireland (NI), supplying electricity and energy services across the island, as well as gas in ROI. With over 1.4 million customers and an electricity all-island residential market share of 34%, Electric Ireland serves all market segments, from domestic households to large industrial and commercial businesses, in both ROI and NI. It also has 21% of the gas market in ROI.
ESB Energy is ESB’s electricity and gas residential retail business in GB, and serves over 165,000 electricity and gas residential accounts.
ESB eCars builds, owns and operates electric vehicles (EV) charging networks for public use across ROI, NI and GB. This network contains over 1,100 chargers on the island of Ireland, as well as over 140 chargers in GB.
ESB Telecoms operates within the wholesale ROI Telecoms market, maintaining and operating circa 400 telecoms transmission structures and over 2,000km of fibre optic network.
ESB Smart Energy Services (SES) designs, develops and delivers integrated management solutions for large energy users in the UK and Ireland. Working in partnership with customers, SES delivers tailored energy efficiency solutions, on site generation and demand management technologies.
FINANCIAL PERFORMANCERevenue in Customer Solutions in 2020 was €2.2 billion, an increase of 5% compared to 2019. This increase was driven predominantly by increased volumes in the large energy users (LEU) sector, increased revenue in the SES businesses and customer growth in GB Energy. Whilst COVID-19 has had
negative impacts on the SME volumes, this has been offset by the increased volumes in the residential market.
Customer solutions reported an operating profit of €58 million which is in line with 2019. An increased provision for future bad debts driven by the impact of COVID-19 has been offset by lower operating costs in 2020.
OPERATING ENVIRONMENT The COVID-19 pandemic defined the operating environment for all Customer Solutions' businesses, as well as its customers, in 2020. The scale of the challenges faced by all customers across all sectors and jurisdictions was significant and unprecedented. Customers Solutions adapted to deliver for customers despite the impact of restrictions and ensured our service levels and customer experience were maintained and enhanced during 2020.
The energy retail market in ROI is a dynamic and competitive market with a high level of churn or customer switching. Many competitors in the market offer deep initial discounts off their standard rate, which is typically higher than Electric Ireland’s, making the discount seem even more attractive. However, at the end of the contract term, those customers default to paying that much higher standard rate. Electric Ireland has a different approach, focussed on rewarding loyal customers with enduring discounts, one of the cheapest standard rates in the market, excellent customer service and innovative products.
In NI, Electric Ireland competes with 4 suppliers in the residential electricity market. The market in NI is also competitive with all suppliers being proactive with campaigns targeting acquisition and customer retention. Electric Ireland is the third biggest supplier in NI.
The GB market is intensely competitive, with the main trend being large incumbents losing market share to several mid-sized and small newer retail energy companies. It has also seen a consolidation of suppliers in recent years, with acquisitions and supplier failures increasing in volume. ESB Energy is constantly enhancing its digital capability with the aim of being an innovative, responsible and easy-to-deal-with energy supplier in GB.
Climate change concerns, along with increasing expectations around digitisation and technology, has resulted in a significant shift in customer demands over the past number of years:
• For residential customers, green energy plans, smart energy controls, smart security systems, ‘peace of mind’ services and data analysis tools are all becomingkey parts of customer propositions offered by utilities.
• Within e-transport, the Climate Action Plan in Ireland aims to increase the number of EVs in ROIto 950,000 by 2030. In GB, the public electricity charging market is also very active, with circa 35 companies offering EV charging.
• Large energy users (LEU) across all jurisdictions are also seeking to improve their low-carbon credentials and deliver operational efficiencies, leading to an increase in the number of energy advisory companiesoperating in the LEU market.
CUSTOMER SOLUTIONS' CUSTOMERSMaintaining strong customer service was the key concern for Customer Solutions during the COVID-19 health emergency. All service key performance indicators and customer satisfaction levels were maintained throughout 2020, despite a transition to remote service.
REVENUE
OPERATING PROFIT
€0.1 billion
(€1million)
2020 €2.2 billion
2019 €2.1billion
2020 €58 million
2019 €59 million
KPI
Marguerite Sayers EXECUTIVE DIRECTOR FOR CUSTOMER SOLUTIONS
In the independent 'Which’ magazine's annual energy customer satisfaction survey in September 2020, Electric Ireland was again chosen as the best energy supplier in Northern Ireland.
Supporting communities has always been hugely important for ESB and this is more important than ever in 2020. Electric Ireland’s sponsorship campaigns with Pieta House for Darkness into Light and with the GAA minor championship showcased the contributions of communities helping each other and of Electric Ireland’s commitment to those efforts.
Customer Solutions further developed its service offerings during 2020:
• New 100% Green tariffs were launched for residential and SME electricity customers in ROI.
• Delivery by Smart Energy Services of heat pump and Combined Heat Power (CHP) installations for what will be GB’s largest and most sustainable commercialgreenhouses in Norfolk and Suffolk. These projects are expected to deliver an estimated 1.2 million tonnes of carbon savings over the 20-year lifetime of the greenhouses.
• ESB Telecoms' new Tail Extension Service which connects regional businesses to data centres and the cloud; leveraging the unique strength, reliability, reach and quality of ESB Telecoms’ fibre network. This new product will also allow retail telecoms operators to expand into new coverage areas and broaden their reach nationwide, without having to payfor additional costly infrastructure development or separate backhaul solutions.
PEOPLE Customer Solutions could not meet its strategic and operational targets without the capability, knowledge and performance of its staff who are enthusiastic about delivering for customers in line with ESB's Brighter Future objectives. A continued strong focus on employee development and targeted recruitment across a range of disciplines linked to the growth strategy will ensure that Customer Solutions continues to be a very attractive place to work, while providing customers with competitive offerings, excellent customer service and new and innovative products to meet changing needs.
SUSTAINABILITYElectric Ireland is conscious of operating its business in a sustainable and environmentally responsible way and is certified to ISO 14001 standard. Electric Ireland actively works with customers to assist them in improving the sustainability of their homes and businesses through the efficient use of the energy provided to them.
UPDATE ON 2020 PRIORITIES AND PRIORITIES FOR 2021
2020 Priority 2020 Progress 2021 Priority
OPERATIONALDeliver additional improve-ments to the online portals and prepare for smart me-tering activation, improving customer service and further empowering customers
• Smart metering products prepared for earlyMarch 2021 launch
• Ensured all service performance metricswere maintained despite the impact of COVID-19
• Successful implementation of web chat forNI residential customers
• Deliver best in class digital customer journey by improving personalisation, online functionality, capability and personalised insights
Deliver performance improve-ments across the cost base to ensure Customer Solutions can continue to offer compet-itive pricing propositions for all customers
• Excellent cost management delivered, facilitating commitment to reward loyalcustomers with discounts every year
• Strong and robust management of the cost base across Customer Solutions to continue to deliver value for money forall its customers
Continue to deliver a custom-er focused but effective credit management strategy and ensure vulnerable customers are protectedEnsure continued engage-ment with State agencies and charities to support customers
• Disconnection moratoria proactively put in place for customers during COVID-19 lockdowns
• Actively supported customers during the COVID-19 crisis particularly to registeredvulnerable customers and to those experiencing cash flow issues
• Continue to deliver a customer focused but effective credit management strategy and ensure vulnerable customers are protected and excessive debt is not amassed. This will be especially important in thecontext of the continuing COVID-19 pandemic
Deliver for customers a range of innovation products and services Deliver the roll-out of high-power charging hubs and replacement of standard chargers in line with the Climate Action Plan. This will transform the driver experience for EV owners across ROI
• Ethernet Tails Extension Service providing end to end high speed businessconnectivity for Irish telecommunication customers
• Over 150 22 kW and 50 kW chargers in ROI replaced and upgraded, partiallyfunded by the Climate Action Plan
• eCars have also provided an additional 14rapid (50kW)and 4 ultra-rapid (150kW) chargers to provide a faster charging service for our customers
• Over 95% reliability achieved in the publiccharging infrastructure
• Deliver the roll out of high-power charging hubs and replacement of standard chargers. This will transform the driver experience for EV ownersacross ROI
• Deliver a range of solutions for customer’s needs through delivery of new services and products
STRATEGIC Customer Solutions business-es have an ongoing focus on development of the digital service capability across the entire customer experience journey
• Delivery of mobile enabled web switchingfor NI residential customers.
• SME Premium Insights portal for SMEcustomers
• Improving customer experience, across all market segments, is of critical importance for Customer Solutions. As a result, there will be ongoing investment anddevelopment of digital capability
Customer Solutions will lead the way, encourage and reward more energy efficient behavioursSES will provide energy services to our customers by delivering low-carbon heat projects and growing the offering of electric vehicle charging solutions
• Launch of €75 million fund to drive downcarbon footprint of large energy users while making energy cost savings
• Launched the Brighter Energy Programmeto drive awareness to maximise energy efficiency. The programme is supported by the release of new products and services, including a Nissan partnership providing free Electric Vehicle (EV) home chargers to anyone who buys a new Nissan LEAF EV and signs up to Electric Ireland’s new 100% Green Electricity Price Plan
• Customer Solutions will lead the way to a brighter future by focussing on delivering on all energy efficiency targets, as well as offering customers newproducts and services to encourage more energy efficient behaviours
Ensure value and stability for customers by continuing to successfully manage market liquidity and ensure effective hedging of wholesale market risk
• Successfully managed market volatility through trading function to ensure price stability was maintained for customers tothe greatest extent possible
• Ensure value and price stability for customers by continuing to successfullymanage market liquidity and ensure effective hedging of wholesale market risk
Continue to grow brands, offerings and market shares across the NI and GB markets
• Significant growth in customers achieved in GB despite the impact of COVID-19 onacquisition efforts
• Grow our various Customer Solutions brands, service offerings and market shares across the NI and GB markets, by delivering value and excellent customer serviceto customers
Providing customers with excellent services and products has always been integral to the success of ESB. Ensuring all our customers are supported with the challenges life throws up today, while working together to transition society to a more efficient and decarbonised future, is the driving force behind everything that Customer Solutions does.
Adapting to COVID-19 and providing solutions to help customers get through these challenging times is central to this commitment. Customer Solutions also continues to create innovative customer propositions and provide practical solutions to enable society to move to more efficient and more environmentally friendly technologies in the years to come.
BRIGHTER TOGETHER
CO
RP
OR
ATE G
OV
ER
NA
NC
E
02
FINA
NC
IAL S
TATEM
EN
TS
03
01
STR
ATEGY
AN
D P
ER
FOR
MA
NC
E

66 ESB Annual Report 2020 - Brighter Together ESB Annual Report 2020 67
ENGINEERING AND MAJOR PROJECTS
What are the key achievements in 2020 for EMP?
Engineering and Major Projects (EMP) was established in 2018 following an internal re-organisation to effectively support the delivery of ESB’s Brighter Future Strategy. Its purpose is to deliver the major projects and engineering solutions required by ESB and its customers to lead the transition to reliable, affordable and low-carbon energy. EMP aims to ensure consistent best practice major project delivery across ESB and to provide a centre of engineering excellence to drive ESB’s Brighter Future strategic objective to enable the production, connection and delivery of low-carbon electricity.
The ongoing COVID-19 pandemic presents significant challenges for EMP, ESB, other businesses and our customers. ESB has a vital role in the provision of a reliable electricity service which underpins all essential services and is critical to the economy and society. Measures were successfully implemented in EMP to ensure that engineering design and project delivery for both ESB Networks and Generation and Trading businesses continued during the COVID-19 pandemic. This included putting health and safety measures in place on construction sites, operational sites and maximising remote working of employees.
The construction and commercial operation of Grousemount 114 MW wind farm was successfully completed in 2020. EMP worked closely with Generation and Trading to progress the development of new renewable generation opportunities including Inch Cape Offshore Limited, a 50:50 joint venture with Red Rock Power Limited to develop a large circa 1GW wind farm development off the east coast of Scotland. EMP is also working on a range of other renewable development projects offshore and onshore through partnerships with EDF, Equinor, Parkwind and with Bord Na Mona on the development of the Oweninny 2 87 MW project. EMP also successfully managed the generation maintenance outage programme during 2020 in collaboration with Generation and Trading.
Working with ESB Networks, a number of large projects, including construction delivery of major infrastructure for the transmission network and distribution network, together with connections of major industrial customers, are now under the responsibility of EMP. The delivery of major projects by EMP and other work programmes by ESB Networks
Customer Delivery will maximise the delivery of the overall ESB Networks’ work programme. During 2020, significant work was undertaken to plan the delivery of the major ESB Networks projects required during the PR5 period that is due to commence on 1 January 2021. EMP managed the delivery of over €120 million of large ESB Networks projects in 2020.
Under Group Property and Security, the redevel-opment of ESB’s head office, Project Fitzwilliam, progressed well during the year with the construction substantially completed to the highest standards of sustainability. As part of this redevelopment the sales contract for Fitzwilliam 28 was agreed with Amundi Real Estate in 2020. Fitzwilliam 28 has been entirely pre-let to the global tech company Slack Technolo-gies upon completion of the building.
ESB International continued to deliver a range of engineering, operations and maintenance solutions and consultancy services to both national and international clients. During 2020, ESB International provided utility management services to the national utility company in Liberia which was funded by the Millenium Challenge Corporation to help develop the performance of the utility to support the wider economic development in Liberia. ESB International also operated the Delimara 4 power plant in Malta through its major maintenance program and delivered critical transmission projects up to 400 kV and oversaw the commissioning of the new 'H' class 1.8 GW Alba power plant in Bahrain as well as strategic advisory services to clients globally.
How does the business help ESB fulfil its strategic and financial objectives?
Engineering and major project delivery brings the Brighter Future Strategy to life by delivery of major projects and engineering solutions which enable the production, connection and delivery of low-carbon electricity.
Whether it is new wind farms, electricity transmission or distribution projects, or technologies such as biomass, battery storage or flexible power generation, a commercial engineering capability is a core requirement for ESB. This capability also supports the ongoing maintenance of existing infrastructure, ensuring that these generation and network assets perform efficiently throughout their lives to meet customer and market needs.
The aim of a centralised approach to major project These functions are supported by central Finance, Human Resources and Safety, Health and Wellbeing teams, and operate in compliance with licence and other legal requirements.
delivery is to deliver projects safely and efficiently, which supports ESB’s financial objectives. This approach is based on having best practice project and contract management capability that can be applied across the Group, while observing regulatory requirements.
OVERVIEWThe EMP business provides a centre of engineering for ESB, delivers large projects across the ESB Group, is responsible for ESB’S Group Property and Security portfolio, and provides engineering and other services to external clients through ESB International. The business has almost 800 people who work in partnership with other business areas in ESB and deliver engineering services to external clients both at home and internationally.
CENTRE OF ENGINEERING The Centre of Engineering includes civil and environmental, networks and generation engineering, and asset management services. These engineering functions are involved in new development projects from concept through to construction and commissioning. They also support the operation and maintenance of existing assets across the ESB Group, and work with Group Property and Security and ESB International.
MAJOR PROJECT DELIVERY Two separate functional areas within EMP have separate responsibility for the delivery of major projects to Generation and Trading and ESB Networks. These work with the respective businesses and are building an enhanced capability to ensure these projects are delivered and that ESB reaches the goals set out in the Brighter Future Strategy.
GROUP PROPERTY AND SECURITY Group Property and Security (GP&S) manages ESB’s commercial property portfolio. The flagship project for GP&S is the development of ESB’s head office in Fitzwilliam St., Dublin 2.
This new 45,000M2 development will deliver a nearzero energy building, one of the most efficient and sustainable commercial office developments in Dublin city, while sensitively respecting and enhancing the Georgian streetscape.
ESB INTERNATIONAL ESB International, a global provider of engineering consultancy services, is currently working in the Middle East, Africa and Asia. It also continues to work across Europe including Ireland and the UK. During 2020, ESB International continued to deliver for its clients providing a range of services that are based on ESB's core capabilities of engineering, management and project delivery across the electricity sector.
ENTERPRISE SERVICES
What are the key achievements in 2020 of Enterprise Services?
As the centre of excellence of an extensive range of key business processes and services across ESB Group, Enterprise Services’ achievements in 2020 included:
1. Ensuring the successful continuity of all key business processes, services and projects that Enterprise Services delivers for ESB during the COVID-19 pandemic by leveraging technology and embracing new and innovative ways of working.
2. Supporting the other businesses in managing their COVID-19 response, including enabling and supporting wide-scale remote working across ESB.
3. The successful delivery of three major IT transformation projects including the upgrade
of ESB’s Enterprise Resource Planning (ERP) system to SAP’s next generation platform, SAP S/4 Hana.
4. Progressing business transformation within Enterprise Services and across ESB, including the establishment of a new centralised Financial Planning & Analysis Team within Enterprise Services and the mobilisation of a pan-ESB Accelerate Digital Programme.
How does Enterprise Services help ESB fulfil its strategic and financial objectives?
Enterprise Services’ purpose is to enable ESB’s Brighter Future Strategy by leading, advising and delivering in its core areas of expertise, significantly contributing to the delivery of ESB’s strategic and financial objectives by:
• Providing key strategic advice in relation to legal, procurement, pension, insurance andother matters.
• Providing a wide range of key business processes and services, including IT projectdelivery to ESB Group.
• Playing a lead role in the delivery of performance improvement and business transformation, including leading digital transformation and process improvementacross ESB.
• Continuing to build and enable a high-performance team, working in collaboration and partnership with the rest of ESB Group.
OVERVIEW As ESB’s internal service provider, Enterprise Services enables ESB’s Brighter Future Strategy by leading, advising and delivering in its core areas of expertise. Enterprise Services is:
• The strategic advisor to ESB Group in relation to core Enterprise Services, focussed on strategy delivery and value creation.
• Responsible for providing business criticalprocesses and services to ESB Group, focussed on operational efficiency and effectiveness.
• Responsible for leading the digital transformation of ESB Group, leveraging data and technology, as well as leading operationalexcellence across ESB.
Nicholas Tarrant EXECUTIVE DIRECTOR, ENGINEERING AND MAJOR PROJECTS (EMP)
Geraldine Heavey EXECUTIVE DIRECTOR, ENTERPRISE SERVICES
Function Purpose
Legal The role of Legal is to provide legal advice, expertise and transactional services across a wide range of practice areas and to advise on legal risks across ESB Group.
Procurement The role of Procurement is to manage all procurement activity across ESB Group while observing regulatory requirements. This includes development of procurement strategy, policies and procedures, strategic procurement planning and tendering services.
Pensions & Insurance The role of Pensions & Insurance is to manage all pensions and insurance activities across ESB Group. This includes development of strategies, provision of expert advice and risk management. It also manages staff insurance services and the Medical Provident Fund.
Operational Excellence The role of Operational Excellence is to deliver process improvement projects and drive a culture of continuous improvement across ESB Group.
CIO
The role of CIO is to shape world-class technology solutions that enable business growth and efficiencies and to oversee cyber security. This includes leading the transformation of ESB Group from an IT, Digital and Analytics perspective.
IT Delivery The role of IT Delivery is to implement, scale and support IT and Digital pro-jects, products and services and manage cyber security.
Business Operations The role of Business Operations is to provide core business support functions such as people operations, finance operations, treasury operations, financial planning & analysis, requisition to pay, facilities, as well as customer support.
CO
RP
OR
ATE G
OV
ER
NA
NC
E
02
FINA
NC
IAL S
TATEM
EN
TS
03
01
STR
ATEGY
AN
D P
ER
FOR
MA
NC
E
An overview of Enterprise Services’ functions is summarised below:

68 ESB Annual Report 2020 - Brighter Together ESB Annual Report 2020 69
70 Overview
70 People
72 Safety
74 Corporate Social Responsibility
76 Environment & Sustainability
80 Using our Profits in a Sustainable Way
CO
RP
OR
ATE G
OV
ER
NA
NC
E
02
FINA
NC
IAL S
TATEM
EN
TS
03
01
STR
ATEGY
AN
D P
ER
FOR
MA
NC
E

70 ESB Annual Report 2020 - Brighter Together ESB Annual Report 2020 71
OVERVIEW PEOPLE
2020 was not the year we had planned for. It turned out to be a year, through adversity, and the challenge of mobilising our workforce in the face of a pandemic and national crisis, in which we embraced change and the need for a “new normal”.
In March, like many organisations worldwide, we responded to the threat of COVID-19 by reconfiguring work for all our employees in every jurisdiction. For most of our employees, this meant working at home.
Work already done on our culture change programme, The WayWeWork, built on the strong foundations of our purpose and our values, became hugely important in the unchartered context of 2020. A number of the key components of this programme have accelerated through 2020 and enabled our people and our managers to sustain business performance and the employee experience throughout this crisis. The learning from this period and the changes our people have experienced have led us to articulate a vision for our ways of working beyond COVID-19, so that in 2021, as we begin to return to our workplaces, we will go back but not backwards.
Our vision is Smart Working, which will see ESB adopt increasingly digital, flexible and trust-based work practices, improving business performance, efficiency and importantly the experience of our people, by giving them more autonomy over where, when and how they work.
Many of the changes and investments we have made in recent years, in areas such as leadership development, performance management, communications and engagement, employee voice and digital ways of working, have paid dividends through 2020 and became the infrastructure to enable our people’s performance in a remote context.
I am very happy to say, that the HR programme of work planned for 2020 was delivered, despite the need to rethink and redesign our approach. Our Leaders for a Brighter Future leadership development programme was redesigned and delivered online. In addition to this, a suite of webinars to support managers dealing with managing remote teams was designed and delivered through 2020. ESB also conducted a capability assessment project, to understand the changing capability requirements of our business and identify those areas we need to address. In 2020 we celebrated LGBTQ+ diversity with our employees through Digital Pride and
in September, we celebrated and recognised our employees’ innovation, contribution and commitment through the ESB Awards virtual event, attended by almost 3,000 employees.
ESB’s new Inclusion & Diversity Strategy was developed with significant input from people across ESB through online workshops. Over the past number of years, an increasing focus has been brought to Gender Pay Gap as a means of highlighting the need for increased focus on gender diversity in the workplace. Improving gender diversity continues to be central to this strategy and understanding what is driving the gender pay gap allows us to bring a renewed focus to the changes needed to address it. In support of this, we have decided to publish our gender pay gap early in 2021, in advance of the requirement to do so. We have also decided to include additional earnings such as overtime in our reporting, wholly reflecting the differential in access to earnings based on gender. I am confident that this will re-energise our efforts to address gender diversity. As a utility, dependent on craft and engineering capability, the impact of low female participation in these areas is obvious and is an issue we and other technical organisations need to influence.
Digital has played a significant role in every aspect of 2020. Our digital channels for employee communication and engagement, enabled a seamless approach to keep our employees informed and connected. This included a COVID-19 website to host all communications for employees on health, safety and wellbeing. Content supporting managers to lead remote teams was also hosted here. The digital employee surveying and engagement platform, Our Voice, played a critical role in understanding how our people were feeling, their engagement levels and the key themes emerging.
As we look to 2021, we anticipate using our workplaces once again, but in a changed way. Our future will see people work both at home and in the office, and our offices will be places of collaboration, co-creation and social interaction. These changes herald a new era of work, and one that we are looking forward to realising at ESB.
Pat Naughton EXECUTIVE DIRECTOR, PEOPLE AND ORGANISATIONAL DEVELOPMENT
Average number of employees by business unit is included in note 9 of the financial statements.
* ESB continues to exceed the 3% Employment target for people with disabilities as set out in the Disability Act 2005.
LEADERSHIP DEVELOPMENT A key pillar of ESB’s People strategy is to create a high performance culture. Leadership behaviours impact hugely on culture, so we are therefore putting particular focus on the enhancement and development of organisational leadership capability. In 2020, for example, all of our Senior Management Teams have engaged in a 360 programme in support of personal development aligned to ESB's Leadership Profile. Our Leadership profile is our benchmark for leadership in ESB and is used in leadership recruitment, selection, development and talent management. It clearly articulates how leaders at all levels drive and guide the way we work in ESB and is underpinned by the key competencies and traits required to ensure a strong leadership capability across the organisation.
INCLUSION AND DIVERSITY ESB’s Inclusion and Diversity Strategy creation was facilitated in 2020 while the majority of staff continued to work remotely, enabling ESB to have a more innovative and inclusive engagement. Being virtual provided a great opportunity to ensure participation of a broader and more diverse perspective across each business unit and a wider geographic spread – from Bahrain to Ballyshannon, Carrington to Cork.
ESB now has a clearly defined Inclusion and Diversity statement, definition and objectives, supported by a comprehensive implementation plan to build on progress already in place and to sustain an inclusive workplace. The Inclusion and Diversity Strategy speaks to ESB's values – Courageous - Caring – Driven - Trusted andis aligned to the Culture Change programme underway at ESB.
2020 2019 2018
Average Number of Employees 7,938 7,974 7,874
Female 26% 25% 24%
Senior Management - Female 30% 30% 25%
Employees with Disabilities* 3% 3% 3%
ESB embraces increasing cultural diversity and ethnicity of colleagues, customers and communities that ESB serves. ESB's celebrations to mark Diwali have grown year on year. 2020 continued to be a challenging year, with a number of our colleagues feeling isolated from family members and friends. The significance of Diwali resonates now more than ever, highlighting the importance of reaching out and staying connected, virtually, with colleagues.
Diwali - The festival of light signified “Triumph of light over darkness, good over evil and hope over despair.”
LGBT+ INCLUSION:ESB believes that having an inclusive workplace benefits all of ESB's people, customers and the communities that ESB serves.
BeME@ESB – ESB’s LGBT+ Employees and Allies Network were proud winners of 2020 ESB Awards - "Keeping Us Safe and Well" Category.
2020 saw the shift to celebrating Pride differently; ESB were once again Pride Partners of Dublin Digital Pride Parade with a significant online presence featuring members of the BeMe@ESB Ally Network. ESB is immensely proud of the whole team. This is why ESB's involvement in Pride is not just a one-off, it reflects an ongoing commitment to inclusive working environment for all employees.
BeMe@ESB, supported by Jim Dollard, Executive Sponsor, LGBT+ Inclusion, held a very successful Virtual Pride Programme for 2020 which included:
• First online Ally Awareness Programmes• Pride Quiz, Don’t Rush Video Challenge, Take Pride Photo Competition, Pride Run• Creating a Brighter Future for our LGBT+ Youth – BeLongTo Webinar
“For such a massive organisation, which is woven into the fabric of Irish life to be involved in Pride – it’s so important”. Dave Brazil, Generation and Trading and BeMe@ESB Ally
SUPPORTING WORKING PARENTSOne of the strategic programmes that is in place to support an inclusive workplace is ESB’s Managing Successful Parenting Transitions programme. Understanding the experience and challenges faced by working parents and the need to work towards a more gender-balanced leadership led to the introduction of ESB’s Managing Successful Parenting Transitions programme, which is in place since 2015.
Having a programme that supports ESB's people and that is agile in terms of content and adapting to virtual delivery has been critical since March 2020. Working parents and those with caring responsibilities experienced additional challenges in relation to working from home, at the same time as losing access to childcare, schools and normal supports due to the impact of the COVID-19 pandemic.
• ESB pivoted to a condensed module with a reduced delivery time online - with key messages to support individuals where theyare now!
• Being virtual enabled a wider reach and increased participation across business unitsand geographies.
• Modules addressed escalating challenges throughout 2020 for working parents and line managers with content modified to the environment people were trying to work within, at the same time as shifting to remoteworking.
• Increase of 42% participation ratesthroughout 2020.
Uncertainty in relation to return dates for schools and college was an additional stressor for working parents. In quarter 3 over 120 parents of school-age children attended sessions facilitated by The Parent Coach - Adjusting to the Next Norm. Participants had the opportunity to consider a road map as parents/guardians/family members to enable them to prepare – practically, mentally and emotionally for the months ahead.
Pat Naughton EXECUTIVE DIRECTOR, PEOPLE AND ORGANISATIONAL DEVELOPMENT
ESB AWARDSIn September 2020 ESB hosted the virtual ESB Awards. For the first time in ESB's history, every employee was invited to attend the one event and nearly 3,000 joined via the ESB awards website to view the ceremony remotely. The awards were designed to give people in every part of ESB an opportunity to share the great work that they do across the organisation – work that creates great outcomes or is the result of great working. And great work, big or small, happens all the time in ESB, but may often not get the wider recognition it deserves. Nearly 400 entries were shortlisted down to 26 and then down to winners in each of the eight categories. By sharing examples of great work in the awards, ESB shows 'what good looks like' and raises the bar for everybody in ESB. This will help drive performance and create better outcomes to help deliver the Brighter Future Strategy in a rapidly changing world.
GENDER PAY GAPIn 2021, ESB will publish its Gender Pay Gap Report in advance of the legislative requirement to do so in Ireland. The gender pay gap shows the difference in the mean (average) pay between all men and women in the workforce regardless of the nature of their work. It is expressed as a percentage of men’s pay. It is different to ‘equal’ pay which deals with the pay differences between men and women who carry out the same jobs, similar jobs or work of equal value. There are no cases of unequal pay in ESB and it is unlawful to pay people unequally because they are a man or a woman.
Gender Pay Gap captures whether women are represented evenly across all levels of the organization.
In the absence of a confirmed calculation methodology, we have applied the high-level calculation principles in place for UK Gender Pay Gap Reporting and indicatively the mean (average) gender pay gap is 4.5%. The inclusion of overtime earnings increases this mean (average) gap to 11.6%.
Analysis of this shows that the pay gap is largely driven by significantly lower female participation in craft and engineering roles, which typically attract role specific pay and allowances for their associated work schedules, and more men than women in senior leadership roles across all disciplines.
ESB has been actively promoting an inclusive and diverse culture through a number of successful initiatives across a range of diversity areas including gender, disability, neurodiversity, cultural, LGBT+ and family. In 2020, ESB developed a comprehensive Inclusion and Diversity Strategy. Gender diversity across all disciplines and through to leadership positions is a key focus in this strategy.
CO
RP
OR
ATE G
OV
ER
NA
NC
E
02
FINA
NC
IAL S
TATEM
EN
TS
03
01
STR
ATEGY
AN
D P
ER
FOR
MA
NC
E

72 ESB Annual Report 2020 - Brighter Together ESB Annual Report 2020 73
OVERVIEWESB’s Board, management and employees are committed to protecting the health and safety of employees, customers, contractors and the people ESB serves; their safety is always considered first in business actions and activities. ESB believes that all operational processes can be designed and operated in a safe manner. This belief guides the approach to safety across all business activities and is reinforced through strong and visible leadership throughout ESB.
The Chief Executive has overall responsibility for the management of health, safety and wellbeing in ESB. The ESB Group Safety Statement sets out the overall policy and general arrangements in ensuring the health, safety and wellbeing of all employees. Functional responsibility is shared with all senior management and, in turn, with each manager, supervisor, team leader and employee. The Safety, Environment and Culture Committee supports the Board’s monitoring and governance of health, safety and wellbeing. Further details of the Safety, Environment and Culture Committee are outlined on page 106.
2020 was a very challenging year for the whole world. The COVID-19 pandemic tested ESB’s preparedness and resilience towards such events. From a health and safety perspective, controls were implemented that have significantly reduced the opportunity for transmission of the virus in an ESB controlled workplace while maintaining electricity supply to all users.
Sadly there were a number of serious work-place incidents associated with ESB work activities during 2020 including two fatalities. An NIE Networks electrician and a road surfacing sub-contractor were fatally injured in separate incidents in August.
COVID-19 PANDEMIC – ESB RESPONSE ESB's Pandemic Plan was invoked in January and the Pandemic Response Support Team (PRST) was mobilised on the first week in February with 25 representatives from all parts of ESB. The PRST closely followed all emerging guidance from national and international public health bodies including HSE/NHS, Health Protection Surveillance Centre, ECDC, and WHO. The PRST scoped and designed ESB's response to the impending pandemic (before it was declared), ensuring ESB acted early and put in place structures, measures, and controls to protect people and underpin changing work practices.
Individual Crisis Management Plans were invoked in each business unit in early February to identify and manage critical roles and operations, critical supply chain, scenario planning and testing. This included
In 2020, 142 P1 incidents were recorded. This is a similar number to 2019, and the overall trend is decreasing slightly over the five year period of 2016 – 2020.
The most significant safety risks arising from P1 incidents for ESB are: electricity, working at height, behaviour, tools, plant and equipment, and road traffic, which accounted for 71% of all P1 incidents.
PUBLIC SAFETY ESB has invested in Public Safety Programmes as detailed below:• Media messaging to the key at-risk groups:
farming, construction and the general public,given the COVID-19 limitations on physical engagement events with stakeholders. This included radio, digital and social media platforms with targeted messaging for DIY, gardening, and during storms.
• Engaging content was delivered, including webinars during Construction Safety Week, as part of the ESB Networks partnership with theConstruction Industry Federation.
• The ESB Networks partnership with the Irish Farmers Journal continued to deliver relevant content, including new personal testimonies of farm accidents, as well as safety articles acrossthe farming press on electricity safety.
• Public safety work programmes, including hazard identification, inspections and maintenance were completed to ensure publicsafety.
• The ESB Networks emergency response service operated to the highest standards to deal with storm and other emergency events.
• In 2020, an independent public safety audit
HIGH POTENTIAL INCIDENTS (P1)early testing of ESB's remote working capability.
On 13 March, ESB's Crisis Management Plan was activated by Chief Executive, Pat O'Doherty and the pan-ESB Coordination Group was put in place to plan and coordinate actions across ESB.
Each business unit with their Crisis Management Teams (CMT) planned and coordinated local actions through their Crisis Management and Business Continuity Plans.
Control measures included remote working where possible; identification of critical roles; teams working in pods; hygiene and PPE measures; contact tracing; COVID-19 status decision guides; guidance on keeping safe and well; and a dedicated COVID-19 helpline with clinical staff and Employee Assistance Programme (EAP) officers available to answer employees queries and concerns.
SAFETY PERFORMANCE IN 2020 Performance in 2020 has been overshadowed by the tragic fatalities to a member of staff in NIE Networks and to a sub-contractor working on behalf of ESB Networks. Comprehensive investigations into these deaths have been carried out and the recommendations arising from them shall be implemented.
ESB uses the following leading Key Performance Indicators (KPI) to track safety performance:
1. Good catch reporting. A good catch is where an employee or contractor intervenes when they notice an unsafe act or unsafe condition. This helps to prevent a safety incident from occurring. The target for 2020 was 12,200 good catches. Due to the significant number of employees working from home since March the number of good catches was below target at 9,604.
2. P1 Investigation closure. ESB categorises all injurious incidents and near misses with a particular focus on high potential incidents
was completed in accordance with ESB Networks licence conditions. The report from the external auditor confirmed continuing compliance with the licence.
There were no fatalities involving members of the public and the electricity network, as has been the case for the last four years. However, there were three serious incidents where members of the public were injured. These incidents involved entry into a high voltage sub-station, hedge cutting and contact with an electricity pole stay.
SAFE AND SOUND The focus of the Safety Culture Transformation (‘Safe and Sound’) programme during 2020 was to broaden and deepen enrolment. Safe and Sound aims to develop and sustain a culture where safety is central to everything ESB does, where there is a mindset that is intolerant of incidents and injuries, where employees take responsibility and care for their own safety and for those around them, where they speak up when they see something unsafe, where they choose to follow the safety rules, where they are compliant, where they implement sensible safety systems and where they take pride in their achievements.
Safe and Sound proved very effective during COVID-19 with Local Leadership Teams finding successful ways to keep everyone safe and connected. The ESB Networks Safe and Sound coaches were recognised for their outstanding work by receiving the ‘Being Courageous, Caring, Driven and Trusted’ Award at the annual ESB Awards. (See page 71 for further details on ESB Awards).
that could lead to more serious outcomes. All P1 incidents are thoroughly investigated. The P1 Investigation closure KPI reports on the timely completion of investigations. This KPI target was exceeded at the end of 2020.
3. P1 Action closure. When a P1 incident is investigated, the findings often result in corrective actions. This KPI tracks the timelycompletion of all actions associated with P1 Incidents. The P1 Action closure target was exceeded in 2020.
4. Senior Manager Safety Conversations. All Senior Managers in ESB are expected to demonstrate their safety leadership by conducting safety conversations each month. The KPI tracks completion of these conversations. Despite COVID-19 distractions the Senior Manager cohort in ESB consistentlyexceeded its target throughout 2020.
5. Audit non-conformity closure. ESB subscribes to certification of its Safety Management Systems (SMS). Non-conformities associated with external audits of these SMS are tracked for on-time completion. The number of minor and major non-conformities is consistently very low. Allactions have been closed on time.
LOST TIME INJURIES The number of lost time injuries (LTIs) in 2020 was 57 compared to 65 in 2019. The majority of these injuries were of low severity where the injured parties made a full recovery and quickly returned to work. The most common causes of LTIs were slips and trips, twisting and turning of the body, working at height, fall, collapse or breakage of material, and road traffic collisions. Together these accounted for 64% of all LTIs.
Lost Time Injuries (LTIs) are occupational injuries which result in at least one day’s absence from work, not including the day that the injury occurred.
HEALTH AND WELLBEING ESB is committed to proactively supporting its employees in maintaining good health and wellbeing. ESB’s Health and Wellbeing team helps employees to reach their full potential in the workplace by providing proactive, preventative and early intervention health and wellbeing services. It provides information and advice to employees to help them to create and maintain a healthy lifestyle. The programme provides effective support where employees face ill health and other personal life challenges through an occupational health medical service, EAP (Employee Assistance Programme), an independent counselling service and a range of other support measures. The Health and Wellbeing Roadshows had to be curtailed during the COVID-19 pandemic. These were replaced by an online calendar of health and wellbeing events, a monthly health and wellbeing bulletin, regular webinars on mental and physical health and the establishment of Mental Health First Aid volunteers throughout the organisation.
KEY INITIATIVES AND PROGRAMMES IMPLEMENTED OR CONTINUED IN 2020 • All ESB business units have health and
safety management systems in place, many of which are externally verified and certified to the International ISO 45001 standard. The scope of the ESB Central Safety Management System increased to include the Engineering and Major Projects Business.
• ESB continued to make progress in 2020 on improving its safety performance throughdelivery of key improvement projects in ESB Networks and in Generation and Trading.
• Safety assurance audits against our policy and standards were completed in departments within ESB Networks, Generation and Trading, Engineering and Major Projects, and CustomerSolutions.
• Principal risks and their management are reviewed and reported quarterly to the GroupRisk Manager, Board and the Audit and Risk Committee.
• A new Road Safety Strategy was developed in2020 in recognition that interacting with the public road network remains a significant risk for ESB and its employees.
SAFETY
FIGURE 1. LOST TIME INJURIES 2016–2020
FIGURE 2. P1 INCIDENTS 2016–2020
72
63
69
65
57
163
102
138
CO
RP
OR
ATE G
OV
ER
NA
NC
E
02
FINA
NC
IAL S
TATEM
EN
TS
03
01
STR
ATEGY
AN
D P
ER
FOR
MA
NC
E
142
255

74 ESB Annual Report 2020 - Brighter Together ESB Annual Report 2020 75
CORPORATE SOCIAL RESPONSIBILITY
SOCIAL PURPOSESince its foundation in 1927, ESB has supported communities and programmes that enhance the economic and social fabric of Ireland, helping to bring light and energy to the people it serves, allowing individuals and communities to fulfil their potential in every walk of life.
COVID-19COVID-19 has had a profound impact on communities across Ireland throughout 2020. In response, ESB launched “Kindness Matters” a series of initiatives helping ESB to respond in a meaningful way through employee volunteering, financial supports and payroll giving.
Through this volunteering initiative, ESB staff, with local manager approval could take up to 7.5 hours a week to volunteer with a charity, voluntary organisation or club in their community specifically assisting people affected by COVID-19. A number of teams took time to volunteer with Age Action to deliver training to older members of the community to maintain contact with family and friends using online tools such as Skype, Zoom and WhatsApp.
For ESB Staff with specialist medical qualifications required by the HSE or NHS, plans were put in place to release skilled colleagues for up to three months if needed.
ENERGY FOR GENERATIONS FUND ESB’s Energy for Generations Fund sees over €1 million distributed to charities fighting homelessness, preventing suicide and enabling access to Science Technology Engineering Arts and Maths (STEAM) education and included funding partnerships with TU Dublin Foundation for the Access to Apprenticeship programme, Aware for their Life Skills for Schools initiative to promote mental health awareness in secondary schools throughout Ireland and Camara Ireland for the TechSpace initiative, building the capacity of youth organisations to run creative STEAM education programmes. In response to COVID-19, the ESB Energy for Generations Fund received an additional €250,000 to help organisations respond to the impact of COVID-19 on their operations such as the purchase of personal protection equipment (PPE) or by moving training courses online. The ESB Energy for Generations Fund also promotes employee volunteering. All ESB employees who volunteer 20 hours with a charity can request that ESB donates €250 to that organisation. In 2020, €9,750 was donated through the Fund to a range of charities including St. Vincent de Paul, Blood Bikes East and the RNLI. In total, the Fund supported 87 different projects throughout the island of Ireland
in 2020.
EMPLOYEE VOLUNTEERINGPrior to widespread COVID-19 restrictions, ESB employee volunteers participated in Time to Read
• Proud supporter and sponsor to the PietaHouse Darkness into Light annual event.
• Supporting the arts through sponsorships of organisations including Feis Ceoil, the National Gallery of Ireland, Abbey Theatre, and Businessto Arts.
• Supporting the development of skills in STEAM to empower Ireland’s young people to reach their potential and power their collective brighterfuture through partnerships with TechSpace, Science Blast, Cool Planet, Generation Apprentice competition, University of Limerick and Engineers Ireland.
ESB’s Generation Tomorrow STEAM education programme underpins the corporate sponsorship portfolio and is both a key driver for brand reputation and a tangible proof point of the Brighter Future Strategy. Through partnership with organisations such as RDS (ESB Science Blast), Camara Education Ireland (TechSpace and ESB Creative TechFest) and Cool Planet Experience among others, the aim is to support children to develop the skills they need to thrive in 21st century society, helping them not only to become creative and innovative problem solvers, but also active and engaged citizens, capable of making informed choices to tackle climate change and other global challenges.
Programmes such as ESB Science Blast and Generation Tomorrow STEAM workshops, positively impact thousands of primary school students in communities across Ireland, while through the youth work sector, TechSpace provides opportunities for young people to use
and Time to Count in partnerships with Business in the Community (BITC), to help improve literacy and numeracy initiatives in 8 primary schools throughout Ireland. ESB volunteers also introduced transition year pupils in 5 secondary schools to the world of work through BITC’s Skills@Work work experience programme.
Over 140 staff from across ESB Group participated in ESB Science Blast at the RDS in March 2020 supporting the event either as project judges or staff volunteers facilitating the Generation Tomorrow interactive exhibition space, and supporting the RDS team across a variety of roles.
With a nationwide move to online learning following school closures in March, the concept of a digital divide became more apparent, raising concerns for students who did not have access to technology for home studies. ESB, in partnership with Camara Education Ireland and Trinity Access Programme launched the Tech2Student campaign for homes and businesses to donate disused laptops. ESB donated €100,000 to support the scheme and encouraged its staff to volunteer to collect and distribute more than 1,300 donated and purchased laptops.
INTERNATIONAL CSRESB is a corporate partner of ElectricAid, a charity established by the staff of ESB in 1987. ElectricAid funds aid and development projects worldwide with all projects linked directly to one or more of the United Nations Sustainable Development Goals. Today, ElectricAid enjoys the support of 2,500 donors (both serving and retired staff) with donations matched by ESB on a 2:3 ratio to a ceiling of €275,000 annually. In 2020 ElectricAid responded with emergency funding for the East Africa Locust crisis (€15,000) and the devastating explosion in Beirut Harbour (€15,000). While all aspects of daily life here in Ireland have been affected, COVID-19 knows no borders. Handwashing and social distancing are working in Ireland but many people in the developing world are living in totally overcrowded settings, without access to clean water or hygiene materials and many countries do not have the healthcare infrastructure needed to combat COVID-19. Earlier this year, ElectricAid launched an emergency appeal to staff and pensioners who responded with €22,500 in donations, further matched by ESB with €25,000.
digital media and STEAM to be creators and inventors of the future.
ESB SCIENCE BLAST• ESB Science Blast, delivered by the RDS,
empowers primary school children, from 3rd to 6th class, to work together as a class to investigate the science behind a question that interests them, before presenting their findings at one of the three showcase events in Dublin, Limerick or Belfast.
• Over 12,000 children from primary schools acrossthe country participated in the Dublin event in the RDS in March 2020, with project entries increasing from 274 (2019) to 504 (2020). The event also increased from two to four days, including the first ever Gaelscoileanna Day, with 24% of all Gaelscoileanna in Ireland participating in the all Irish event showcase.
• Over 150 staff across ESB Group supported the event as volunteers or judges.
• The Limerick and Belfast events, scheduled forMay and June respectively, were unfortunately cancelled due to COVID-19.
CAMARA IRELAND - TECHSPACE AND ESB CREATIVE TECHFEST• TechSpace is a creative technology education
programme that is managed by social enterprise Camara Ireland and delivered in the informal and formal education sectors. It encourages young people to unlock their passions and potential through the creative use of technology.
• During the inititial COVID-19 lockdown, Camara Ireland quickly adapted the TechSpace
In 2020 ElectricAid has funded overseas projects responding to COVID-19 in Ethiopia, India, Kenya, Malawi, Niger and Tanzania with trusted partners such as Brighter Communities Worldwide, Children in Crossfire, the Edith Wilkins Street Children Foundation, GOAL, Self Help Africa, and The Hope Foundation. All are working to protect some of the world’s most vulnerable communities in meaningful ways through funding hygiene and sanitation supplies, health awareness campaigns and equipment for community health centres to meet the challenges of COVID-19.
WIND FARM COMMUNITY FUNDESB’s subsidiary wind farm companies operate in the Republic of Ireland (ROI), Northern Ireland (NI) and Great Britain (GB) and the Wind Farm Community Fund makes €1 million available to communities in the vicinity of wind farm sites to support community projects that are aligned with local needs and the UN Sustainable Development Goals, bringing a brighter future for the residents of its neighbouring rural communities. In early 2020 a special COVID-19 emergency fund amounting to €238,000 was distributed by ESB across all of ESB’s operating wind farms across the island of Ireland and the UK, aimed at delivering targeted services and support to the most vulnerable in our wind farm communities during the COVID-19 pandemic.
SPONSORSHIPThe Group manages an active sponsorship portfolio including the following:
• Promoting young people in sport through the Electric Ireland GAA All-Ireland minor champion-ship and Higher Education Championship.
programme to meet the rapidly changing needs of youth workers and educators and to provide the tools they needed to stay connected to the young people they supported.
• Monthly ESB TechSpace awards highlighted the achievements of young people across thenetwork, and was also reflected at the ESB Creative TechFest Awards.
• ESB Creative TechFest is the annual bilingual event that celebrates the innovation and creativityof young people who participate in TechSpace programmes across STEAM, digital creativity and computer science projects.
• Over 1,000 young people and 120 educators from youth projects and Gaelscoils across Ireland took part in the first virtual ESB Creative TechFest in October 2020.
GENERATION TOMORROW STEAM PROGRAMME• ESB staff volunteers delivered STEAM
workshops in primary schools across Ireland across the year.
• During the COVID-19 pandemic, this moved to online, with partnerships with Virgin Media and Today FM delivering STEAM content to children and parents from March to July 2020.
• Over 600 children from local schools normally visit Gateway Head Office in Dublin for Science Week workshops. This year, ESB delivered Curiosity Boxes to schools both locally and nationally, and delivered content online to supportteachers and schools with remote opportunities.
2020 €
2019 €
2018 €
Energy for Generations 1,251,309 986,078 1,158,547
Employee Volunteering 9,750 25,000 25,000
Wind Farm Community Fund 1,000,000 1,000,000 1,100,000
Electric Aid 275,000 275,000 250,000
CO
RP
OR
ATE G
OV
ER
NA
NC
E
02
FINA
NC
IAL S
TATEM
EN
TS
03
01
STR
ATEGY
AN
D P
ER
FOR
MA
NC
E
In total, ElectricAid funded 122 projects across 31 different countries with €1,065,240, of which €262,372 funded 35 projects that responded directly to COVID-19. A copy of the ElectricAid Annual Report is available from the ElectricAid website www.electricaid.ie

76 ESB Annual Report 2020 - Brighter Together ESB Annual Report 2020 77
ENVIRONMENT AND SUSTAINABILITY
CLIMATE CHANGEESB recognises that climate change is the greatest priority facing Ireland and the world. In response, ESB’s Brighter Future Strategy targets an accelerated transition to low-carbon electricity. ESB exited peat generation at the end of 2020 and will exit coal generation by the mid-decade. ESB’s target is to halve the carbon intensity of its electricity generation by 2030 and to bring renewable electricity output to 50% of ESB’s total electricity production by the same date. ESB is a signatory of the Vision for the European Electricity Industry, which commits ESB to pursue the goal of carbon neutrality before 2050.
ESB is committed to leadership in caring for the environment in which ESB’s businesses operate and operating sustainably by minimising our impact on the earth’s resources. ESB aims to manage its impact on its surroundings, to provide a high level of protection for the natural environment, and to reduce its greenhouse gas emissions while supporting a sustainable economy.
CLIMATE RISKESB has identified the main transition and physical climate risks and opportunities across the Group. Three climate risk scenarios were used in this assessment: one physical scenario, based on the Inter Governmental Panel on Climate Change (IPCC) representative carbon pathway (RCP) 4.5 and two transition scenarios, one based on the Irish Government’s current Climate Action Plan and the second on the more ambitious climate commitments for 2030
ASSURANCEESB maintains environmental management systems across the Group. These are audited externally to the ISO 14001 standard. ESB has set a carbon target for scope 1 and 2 emissions. All scope 1, 2 and 3 emissions are monitored and are independently assured. Greenhouse gas emissions are disclosed via the CDP online reporting platform. ESB discloses environment and sustainability information annually in the Sustainability Report in accordance with the GRI standards of disclosure. Alignment with the GRI standards is independently confirmed. This disclosure will be augmented in 2020 with the additional reporting requirements under the green bond issued in May. The Safety Health and Environment group function oversee the development of Group Safety Health and Environment Standards and carry out regular site audits of these standards.
A cross-company group of senior managers – the Environment and Sustainability Leadership Team – provides climate governance and provides overall direction to environmental improvement and assurance in the Group. Group environmental performance is also monitored by the Safety, Environment and Culture committee of the Board.
Audits of the Group Environmental Standards continued during the year and no issues were noted.
in the 2020 Programme for Government, respectively. The IPCC RCP 4.5 scenario is based on global carbon emissions peaking in 2040 followed by a moderate decline thereafter. This is seen as a suitably severe possibility but more realistic than the no mitigation pathway. The transition scenarios broadly align with the EU’s Clean Energy Package and the recent EU Green Deal respectively. (For further detail on climate risks see ESB’s 2020 Sustainability Report). In practice, these scenarios are similar in the near term and will increasingly diverge after 2030.
ENVIRONMENT2019 2018 2017
Waste reduction (tonnes)
15,030 12,130 13,526
Recycling rate* 96.6% 94.6% 83.5%
UN SUSTAINABLE DEVELOPMENT GOALS (SDGS)ESB’s Brighter Future Strategy puts sustainability at the heart of its strategic objectives and purpose as an organisation. With the ambition to “Create a Brighter Future for the customers and communities ESB serves" by leading the transition to reliable, affordable, low-carbon energy, the progress during 2020 in putting this into action has begun to deliver on that ambition. Aligning ESB's activities and progress to the broader global efforts to deliver the Sustainable Development Goals, allows ESB to demonstrate its contribution to the global purpose and climate action that underpins the SDGs.
The UN SDGs provide a balanced set of objectives for development. The illustration on the next page shows the alignment between ESB’s strategy and the SDGs. Throughout this section, ESB highlights the SDGs impacted by particular activities.
CO
RP
OR
ATE G
OV
ER
NA
NC
E
02
FINA
NC
IAL S
TATEM
EN
TS
03
01
STR
ATEGY
AN
D P
ER
FOR
MA
NC
E
Each year ESB Group collates annualised waste data from each business unit to build a consolidated waste report in line with the requirements of the Global Reporting Initiative Standard. Waste is reported a year in arrears. Overall recycling rates continue to improve across the business. 2019 waste tonnage increased due to a large volume of overhaul works being undertaken on thermal generation sites.
*excludes construction spoil and ash from peat and coal generation.
OUR PURPOSE ESB’s purpose is to create
a brighter future for the customers and communities we serve and we will do this by leading the transition to
reliable, affordable, low-carbon energy
GROW BUSINESS WHILST
MAINTAINING FINANCIAL STRENGTH
HIGH-PERFORMANCE CULTURE
13.2 Integration of climate change measures into national policies, strategies and planning; The closure of ESB’s peat stations in the Irish midlands in December was both a milestone in the delivery of our strategy and the end of an era for generations of employees who contributed to Ireland’s energy security for over half a century.
9.4 Upgrade infrastructure and retrofit industries to make them sustainable, with increased resource-use efficiency and greater adoption of clean and environmentally sound technologies; Growing our position in offshore wind through investments in 1GW Inch Cape (UK) and commissioning the 114 MW Grousemount (ROI) wind farm.
9.1 Develop quality, reliable, sustainable and resilient infrastructure; ESB Networks and the Commission for Regulation of Utilities successfully completed the regulatory price review for the period 2021 to 2025 (PR5) in December 2020, paving the way for a very ambitious programme of capital investment which is vital in meeting Ireland’s climate targets.
PRODUCE, CONNECT
& DELIVER CLEAN, SECURE AND AFFORDABLE
ENERGY
9.4 Upgrade infrastructure and retrofit industries to make them sustainable, with increased resource-use efficiency and greater adoption of clean and environmentally sound technologies; During the year we invested €1,115 million, including circa €57 million in renewables as we continue to lead the transition to a low-carbon future.
17.1 Strengthening domestic resource mobilization; The dividend for 2020 amounted to €81 million, bringing the total dividends paid over the past decade to €1.2 billion.
Our ability to respond to COVID-19 and maintain services for customers was underpinned by a rapid transition to remote working for almost 4,000 employees, with others continuing to work on site in power stations and networks locations.
ENERGY SERVICES TO
MEET EVOLVING MARKET NEEDS
9.1 infrastructure, to support economic development and human wellbeing; ESB Networks made huge progress in rolling out smart meters during 2020, with 239,000 now installed. All electricity suppliers will be in a position to offer smart services to customers with smart meters in 2021.
17.6 Addressing the digital divide in access to high-speed, high-capacity Internet services infrastructure; SIRO, ESB’s joint venture with Vodafone, has brought gigabit broadband within reach of 360,000 premises, and now serves over 30% of fibre to the home (FTTH) customers in Ireland.
CUSTOMER NEEDS AT
CENTRE OF ACTIVITIES
7.1 Ensure universal access to affordable, reliable and modern energy services; Electric Ireland announced a moratorium on disconnections that will extend into Spring 2021 and a €1 million credit for vulnerable customers in the lead up to Christmas 2020.

78 ESB Annual Report 2020 - Brighter Together ESB Annual Report 2020 79
OPERATIONAL ENERGY CONSUMPTION*
Thermal Generation by Energy Source 2020 (GWh) 2019 (GWh) 2018 (GWh)
Coal 2,186 1,767 5,683
Natural Gas 17,427 18,999 22,925
Oil 468 413 205
Peat 1,720 3,971 4,045
OPERATIONAL ENERGY (PRIMARY ENERGY EQUIVALENT IN KWH)**
Electricity 48,823,028 52,051,152 53,489,805
Thermal 4,321,560 3,790,805 4,986,783
Transport 54,318,204 53,653,578 56,146,927
ENERGY PERFORMANCE INDICATOR (ENPI)
kWh/FTE Employee 18,363 19,749 20,852
ESB GROUP ENERGY MANAGEMENT SYSTEMESB established a group-wide energy management system for its buildings and transport fleet in 2019. This was successfully certified to the ISO 50001 standard in November 2019. ESB and other public bodies are subject to energy reduction targets under the transposition of the EU Energy Efficiency Directive S1426/2014. ESB achieved a 39.6% cumulative energy reduction against the national target of 33% for 2020. The energy management system will be used to achieve further savings against the increased national targets for 2030 of 50% energy efficiency and 30% absolute carbon emissions reductions.
The redevelopment project of ESB headquarters with a new state-of-the-art, energy-efficient premises continued, and has achieved the BREEAM (Building Research Establishment Environmental Assessment Method) Excellent Standard while the construction of a bespoke archives buildings was completed to a BER A1 energy rating.
ESB operates three salmon conservation hatcheries on the Shannon, Erne and Lee catchments to maintain and conserve stocks. Juvenile salmon are released within each hatchery and a portion are released into the catchment above each hydro station. A smaller portion are released at ‘smolt stage’ from each hatchery and these return as adult salmon the following year to begin the cycle again. An annual smolt generation protocol is implemented upon each catchment to minimise loss of smolts as they migrate downstream each spring.
The quality of the fisheries habitat is improved through selective bank clearance, fencing construction of weirs and pools, addition of spawning gravel, and large boulders. Public access to the fisheries is improved through car parks, stiles and signage. These areas are then surveyed by ESB Fisheries staff to ensure that water quality and the progress of the fish population is maintained.
SUSTAINABILITY2020 2019 2018
Reduction in carbon intensity 1 Target 50%
44% 39% 32%
Reduction in energy usage2 Target 33%
39.6% 35.2% 31.5%
1 Improvement as measured against CO2 intensity baseline year 2005. Baseline figure: 670g CO2/KWh.
2 Cumulative reduction in operational energy use against baseline (excluding thermal generation) as reported to SEAI under S1426/2014. The 2020 target is 33% cumulative.
CO2 EMISSIONSESB is committed to progressively reducing direct and indirect CO2 emissions across the Group. ESB has set an ambitious carbon intensity target for generation of 200g CO2/kWh, which represents a 50% reduction on its current carbon intensity level. In 2020, CO2
output from GT’s generation plants remain lower than 2005 (baseline) by approximately 64%, and the carbon intensity of generation reduced by 44% to 378 g/kWh. ESB’s peat stations permanently closed at the end of 2020.
CARBON MANAGEMENTSince 2009, ESB has disclosed its carbon emissions through CDP, a global disclosure not-for-profit charity that runs the carbon disclosure system for investors, companies, cities, states and regions to manage their environmental impacts, representing the most comprehensive collection of self-reported environmental data globally. In addition to capturing carbon emissions, the CDP
assesses the performance of each company against sustainability and climate action best practices. ESB targeted a steady improvement in ESB performance from 2018. In 2020, ESB attained leadership level in its score, becoming a CDP A-listed company for the first time.
ESB is part of the Leaders Group on Sustainability, a Business in The Community Ireland (BITCI) led group of leading businesses who hold the Business Working Responsibly Mark. One of the first actions announced by the Group is the Low Carbon Pledge – the first dedicated public commitment generated by Irish business to lead on the transition to a low-carbon economy and it completed its first full cycle of
reporting during 2019. ESB and other founding members have committed to reduce their carbon intensity by 50% by 2030. The Pledge has been updated to a commitment to reporting on scope 1, 2 and 3 emissions* and achieving science-based carbon targets by 2024. Supporting materials and advice are being put in place to assist smaller companies in reaching the same goal.
*See further detail in ESB's 2020 Sustainability Report.
ESB NETWORKS ENVIRONMENTAL CHANGE PROGRAMME ESB Networks has progressed an Environmental Change Programme through 2020.
Sulphur hexafluoride (SF6) is used widely around the world as an insulator in switchgear because its high electrical insulating properties allows the switchgear to work efficiently and safely.
During 2020, ESB Networks continued to work to contain, reduce and minimise the use of SF6.
ESB Networks also further addressed issues of fluid-filled cable leakage, discussing response and reporting protocols with the relevant statutory authorities and assessing historical cable leaks.
A web page on www.esbnetworks.ie is available to provide public information in relation to fluid-filled cables and this will continue to be updated as further reviews are undertaken.
MIDLAND GENERATION STATIONSDuring the drought conditions of 2018, the thermal plume of exiting cooling water led to a technical breach of conditions set out in the environmental licences relating to the two peat-fired Midland Stations. While these breaches were subject to proceedings by the EPA, these matters were concluded in 2020 without any prosecutions. ESB had previously stated its intention to close both Midland Stations, and these closures occurred as planned in December 2020.
BIODIVERSITY
Fisheries
ESB operates several large-scale hydroelectric generations stations on the Shannon, Erne, Lee, Liffey and Clady Crolly river systems and carries out extensive fisheries development and conservation work as a primary fisheries owner. ESB maintains partnerships with Inland Fisheries Ireland, the Marine Institute and third level colleges (including The National University of Ireland, Galway; University College Cork and Queens University, Belfast). ESB also involves local interest groups, including angling clubs in these programmes of work.
Under the National Eel Management Plan, ESB carry out trap and transport of juvenile and adult eel on the three largest catchments to bypass the hydroelectric generation. Upward migrating juvenile eel (called elvers), are captured each spring and summer and transported upstream. ESB have utilised the expertise of former commercial eel fishermen to catch downward migrating silver eel. These autumn and winter migrating eel are then quantified (by weight) and released downstream of the stations. Each winter season sees approximately 60 tonnes of healthy eel released below the station to continue their migration to the Sargasso Sea.
ESB'S CARBON INTENSITY g/kWh
*Operational energy consumption is reported a year in arrears to align with reporting cycle on public sector efficiency performance to the Sustainable Energy Authority of ireland (SEAI). **Operational Primary Energy Equivalent (non generation) as reported to the SEAI, Annual Report 2019 on public sector energy efficiency performance.
CO
RP
OR
ATE G
OV
ER
NA
NC
E
02
FINA
NC
IAL S
TATEM
EN
TS
03
01
STR
ATEGY
AN
D P
ER
FOR
MA
NC
E

80 ESB Annual Report 2020 - Brighter Together ESB Annual Report 2020 81
USING OUR PROFITS IN A SUSTAINABLE WAY
INVESTMENT Investing over €1 billion per annum to facilitate a more sustainable energy environment as well as supporting economic growth through providing, safe and reliable electricity supply to homes and businesses
€1 BILLION
OVER €470 MILLION
SUPPORTING COMMUNITIESSeek to empower and enrich the lives of individuals and communities through the corporate social responsibility programme
OVER €2 MILLION
EMPLOYMENTMaking a long-term commitment to employees, giving them the time to build their skills and the opportunity to advance their careers. Supporting jobs through contractor and supplier service contracts
41 NETWORK TECHNICIANS
EMPLOYED FROM APPRENTICESHIP
PROGRAMME
RETURN TO THE SHAREHOLDER ESB targets an annual dividend of 40% of adjusted profits after tax
€81 MILLION FOR 2020
DEBT INVESTORS Annual interest and repayments
€647 MILLION
RESIDENTIAL CUSTOMER SATISFACTION Developing new and innovative products and services for customers aimed at improving customer experience and empowerment
83%
TAXES Annual payments across various headings

CORPORATE GOVERNANCE
84 The Board in 2020 88 Chairman’s Corporate Governance Statement 90 The Board’s Governance Report 101 Audit and Risk Committee Report 106 Board Committees in 2020 108 Board Members’ Report
82 ESB Annual Report 2020 - Brighter Together ESB Annual Report 2020 83

CO
RP
OR
ATE G
OV
ER
NA
NC
E
02
FINA
NC
IAL S
TATEM
EN
TS
03
01
STR
ATEGY
AN
D P
ER
FOR
MA
NC
E
DAVE BYRNEWORKER BOARD MEMBER
Appointment to the Board: January 2011 under the Worker Participation (State Enterprises) Act 1977. Re-appointed to the Board in September 2018 for a term of four years commencing 1 January 2019.
Tenure: Ten years.
Career experience: Member of a team that is now part of ESB’s Enterprise Services organisation and previously worked in Customer Supply (now Customer Solutions).
External appointments: President of ESB Officers Association (ESBOA) until April 2010 and then appointed as the Group of Unions’ representative in Central Partnership.
ANNE BUTLER INDEPENDENT BOARD MEMBER
Appointment to the Board: November 2012.
Tenure: Eight years and two months.
Career experience: Chartered engineer. Worked in engineering consultancy, for Dublin local authorities and was a founding Director (Executive) of the Environmental Protection Agency (EPA). Former President of the Institution of Engineers and is a member of the Irish Academy of Engineering.
External appointments: Served on several Boards including the National Roads Authority (NRA), Ordnance Survey Ireland (OSI) and Dublin Institute of Technology (DIT) and currently serves on the Board of REPAK Ltd and the National Paediatric Hospital Development Board.
TERENCE O’ROURKE CHAIRMAN
Appointment to the Board: November 2020 as Board Member and Chairman.
Tenure: 2 months.
Career experience: A Fellow of the Institute of Chartered Accountants in Ireland. Joined KPMG in 1975, became an audit partner in 1988 and was elected Managing Partner in 2006. A member of KPMG’s Global Board, Global Executive Team and EMA Board, from 2007 to 2013. Terence has a wide breadth of business skills with high-level experience in commercial, finance, decision-making and strategy development roles working with clients in Ireland and abroad.
External appointments: Chairman of Enterprise Ireland and Kinsale Capital Management Ltd. Non-executive Director and Audit Committee Chair of Hibernia REIT plc, Non-executive Director of The Irish Times Ltd and Chair of their Audit Committee and Director of Rethink Ireland Ltd. Appointed to the Governing Authority of Dublin City University (DCU) in October 2013 and chairs its Strategic Finance Advisory Committee. Chairman of the Irish Management Institute and a Board member of the Institute of International and European Affairs (IIED). Led the Arts Council 2014 Strategic Review Steering Group and has been involved in a number of charity Boards.
Appointment to the Board: January 2013 as Board member and December 2011 as Chief Executive.
Tenure: Eight years as Board member.
Career experience: Holds primary and master’s degrees in engineering from University College Dublin (UCD). Prior to his current role, Pat headed up ESB’s largest businesses as Executive Director, ESB International, Managing Director, ESB Networks, and Executive Director, ESB Power Generation. He completed the Advanced Management Programme at Harvard Business School.
External appointments: President of Eurelectric, Director of Energy UK, Chair of the Apprenticeship Council of Ireland and former trustee of The Conference Board of the United States.
PAT O’DOHERTY CHIEF EXECUTIVE
Appointment to the Board: July 2015.
Tenure: Five years and six months.
Career experience: Graduated with a B. Admin in 1985 from Dundee University. Independent Non-Executive Director and Mentor following a 30-year career in Banking and Financial Services. A chartered director, chartered banker and certified bank director, and held CEO position of Barclays Bank Ireland plc until March 2015, which included responsibility for NI. Previously CEO of BNP Paribas Ireland from 2007 to 2011.
External appointments: Director of Elavon Financial Services DAC, the Dublin-based subsidiary of US Bancorp, Pepper Finance Corporation (Ireland) DAC, Scottish Building Society and a Consultant to London-based Valuation Consulting LLP.
ANDREW HASTINGS INDEPENDENT BOARD MEMBER
Appointment to the Board: January 2019 under the Worker Participation (State Enterprises) Act 1977.
Tenure: Two years.
Career Experience: Joined ESB as an apprentice electrician in 1985. Holds primary and master’s degrees in engineering from Trinity College Dublin and UCD, respectively. He is Controls and Instrument (C&I) Asset Management Specialist for the Generation Portfolio.
External Appointments: Member of Engineers Ireland and former Chair of Energy Sector Professionals Association (ESPA) from 2014 to 2018.
STEPHEN CARRIGWORKER BOARD MEMBER
THE BOARD IN 2020
84 ESB Annual Report 2020 - Brighter Together ESB Annual Report 2020 85

CO
RP
OR
ATE G
OV
ER
NA
NC
E
02
FINA
NC
IAL S
TATEM
EN
TS
03
01
STR
ATEGY
AN
D P
ER
FOR
MA
NC
E
KEY TO COMMITTEE MEMBERSHIP Page 101 Audit and Risk Committee
Page 106 Safety, Environment and Culture Committee
Page 107 Customer, Marketing and Innovation Committee
Page 106 Remuneration and Management Development Committee
Page 107 Finance and Investment Committee
NOREEN O’KELLY INDEPENDENT BOARD MEMBER
Appointment to the Board: April 2013.
Tenure: Seven years and eight months.
Career experience: A chartered accountant who trained with KPMG. Held several senior positions in Independent News and Media Group including Head of Treasury and Group Secretary and was also Company Secretary of C&C Group plc. She currently works as a consultant on corporate governance.
External appointments: Director, Vice Chairman and Chair of Audit Committee of Rehab Group and external member of the Audit Committee of UCD.
SEÁN KELLY WORKER BOARD MEMBER
Appointment to the Board: January 2011 under the Worker Participation (State Enterprises) Act 1977. Re-appointed to the Board in September 2018 for a term of four years commencing 1 January 2019.
Tenure: Ten years.
Career experience: A 20-year career in ESB Networks, currently in the delivery of large projects. Holds an honours degree in business from UCD and a higher diploma in mediation and conflict resolution from Maynooth University. Holds a diploma in human resources completed through Chartered Institute of Personnel and Development (CIPD), certificates in health and safety from UCD and an in-company directorship from the Institute of Directors in Ireland.
External appointments: Former Chairperson and current member of the ESB Defined Benefit Superannuation Committee and Training Officer for the National Workers Directors Group. He is a member of CIPD and the Institute of Directors (IOD).
TONY MERRIMAN WORKER BOARD MEMBER
Appointment to the Board: January 2007 under the Worker Participation (State Enterprises) Act 1977, re-appointed to the Board in September 2018 for a term of four years commencing 1 January 2019.
Tenure: Fourteen years.
Career experience: Joined ESB as a network technician in 1979. Served as an officer with the ESB Group of Unions.
External appointments: Board member of ESB Employee Share Ownership Plan (ESOP) Trustee Limited, Chairman of the National Workers Directors Group and Trustee of ElectricAid.
Appointment to the Board: June 2011.
Tenure: Nine years and six months.
Career experience: Called to the Bar of Northern Ireland in 1976. Worked in the electricity industry for 25 years and held several senior management posts in both Northern Ireland Electricity plc and Viridian Group plc, including Company Secretary and Head of Legal Services.
External appointments: Lay magistrate, member of both the Industrial and Fair Employment Tribunals of Northern Ireland and the Northern Ireland Valuation Tribunal. Non-Executive Director of Camerata Ireland.
NOREEN WRIGHT SENIOR INDEPENDENT BOARD MEMBER
Appointment to the Board: October 2016.
Tenure: Four years and three months.
Career experience: A chartered accountant, who trained with PwC. Chairman and Managing Director of Beamish & Crawford plc for over 12 years and on the Board of its parent company, Scottish & Newcastle (UK) Ltd. Member of the National Executive Council of Irish Business and Employers Confederation (IBEC), Director of Cork Chamber of Commerce, Chairman of the Cork Local Government Committee and served on the Board of Cork Airport Authority. A Fellow of the Irish Marketing Institute. A commerce graduate from UCC, with a Masters in Executive Leadership from Boston College and the University of Ulster.
External appointments: Independent Non-Executive Director and Director with designated responsibility for workforce engagement at the Dalata Hotel Group plc, Chairman and / or Director of various independent companies including Aperee Ltd and Granite Digital, Rethink Ireland and Oxfam Ireland.
ALF SMIDDY INDEPENDENT BOARD MEMBER
Appointment to the Board: October 2016
Tenure: Four years and three months.
Career experience: He is currently Managing Director of Jungheinrich Lift Truck (Ireland) Ltd, a subsidiary of the German-based Jungheinrich AG, a leading material handling solutions provider. He has over 25 years experience in business in Ireland and internationally. He previously served as Director of Operations of the International Industrial Business with Brand Energy and Infrastructure Services, was CEO of the Whitfield Clinic, CEO of Siemens Limited Ireland and CFO of Siemens Limited Ireland (2008-2010). He spent 14 years in Germany in various management roles with Smurfit Group and Kappa Packaging. Holds a BSc in analytical science from DCU, a postgraduate diploma in business studies from UCD and an MBA from City University Seattle.
External appointments: Director at Jungheinrich Lift Truck Ltd, previously served as Director of Siemens Ireland and Director of Whitfield Clinic associated companies.
PAUL LYNAMINDEPENDENT BOARD MEMBER
86 ESB Annual Report 2020 - Brighter Together ESB Annual Report 2020 87

CO
RP
OR
ATE G
OV
ER
NA
NC
E
02
FINA
NC
IAL S
TATEM
EN
TS
03
01
STR
ATEGY
AN
D P
ER
FOR
MA
NC
E
Good governance provides the foundation for long-term value creation and is a core focus for the ESB Board and for me as Chairman. In this regard, and in line with the UK Corporate Governance Code 2018 (the UK Code) and the Code of Practice for the Governance of State Bodies 2016 (State Code), we see our duties as including responsibility for the long-term success of the ESB Group, providing leadership and direction for the business as a whole, and supporting and challenging management to get the best outcomes for ESB and its stakeholders.
Management has the knowledge and expertise for the operational requirements of the business. It is not the role of the Board to duplicate that. The Board establishes the company’s purpose, values and strategy and we challenge and support management in the light of ESB’s values and strategic direction. In our view, the best decisions are made through the dynamic interaction between Board and management.
GOVERNANCE ESB, in pursuit of its governance objectives, complies with the State Code. ESB also complies on a voluntary basis (insofar as is reasonably applicable, given that ESB is a statutory corporation) with the UK Code and with the Irish Corporate Governance Annex. Exceptions to compliance with the UK Code are outlined on page 97. In this way, ESB adheres insofar as is reasonably applicable to listed company governance standards.
ESB has put in place the appropriate measures to comply with the State Code, which sets out the governance framework established by
the Government in respect of oversight and reporting requirements of State Bodies, based on the principles of accountability, transparency, probity and a focus on the sustainable success of the organisation over the longer term. ESB has a robust process in place to ensure compliance with the State Code and a report on such compliance is made annually to the Audit and Risk Committee. The Board is satisfied that ESB has complied with the requirements of the State Code. A report is also issued annually to the Minister for the Environment, Climate and Communications, which confirms compliance with the requirements of the State Code.
The Board is satisfied that appropriate steps have been undertaken to monitor ESB’s Irish subsidiaries’ compliance with the applicable requirements of the Companies Act 2014.
As a statutory body, ESB is not subject to the disclosure requirements prescribed in the European Union (Disclosure of non-financial and diversity information by certain large undertakings and groups) Regulations, 2017. However, on a voluntary basis ESB, in keeping with best practice, discloses certain non-financial information. See table page 8.
ESB has adopted a Code of Ethics “Our Code”, which sets out its approach to responsible and ethical business behaviour, underpinned by its values. The underlying principle of “Our Code” is that employees can best serve ESB by adhering to the highest standards of integrity, loyalty, fairness and confidentiality and by meeting all legal and regulatory requirements. “Our Code” is published on the ESB website. “Our Code” is grounded in ESB’s values and Group policies
and gives clarity to the question “am I doing the right thing?”. Any reported breaches of the Code are investigated.
A detailed description of our governance compliance framework is set out on pages 90 to 100.
BOARD EFFECTIVENESS The Board continually strives to improve its effectiveness. This is done informally by holding discussion amongst Board members with feedback to the Chairman and Company Secretary. A formal evaluation is carried out annually, and every third year this is done independently by an external evaluator, with the next evaluation to take place in 2021. The 2020 internal evaluation confirmed that the Board is operating effectively and details of how the key findings were addressed is set out on page 95.
BOARD AND COMMITTEE CHANGES Ellvena Graham OBE finished her term as Chairman and Board member in July 2020. Noreen O’Kelly chaired the Board meetings and exercised authorities delegated to the Chairman until 11 November 2020, when Terence O’Rourke was appointed as the Chairman for a five-year term. There were no other changes to the Board this year as the Group continues to benefit from the experience and diversity of current members.
The terms of reference of the Board Committees were revised and updated during the year. The remit of the Health, Safety and Environment Committee was broadened to
include oversight of Culture with the Committee renamed as the Safety, Environment and Culture Committee (see page 110 for further detail). The scope of the Customer and Marketing Committee was changed to encompass innovation activities, and was renamed as the Customer, Marketing and Innovation Committee (see page 111 for further detail). During the year, Paul Lynam replaced Andrew Hastings on the Audit and Risk Committee. There were no other changes in Committee membership during the year. Details of the Committees and their activities during the year are set out on pages 101 to 107.
RISK MANAGEMENT Risk management and reporting continues to be a key area of focus for both the Board and the Audit and Risk Committee, with ESB’s approach to managing risk being defined by the ESB Risk Policy and Governance Framework and a strong internal control framework as set out in the ESB Internal Control Policy. While the Board has overall responsibility for the Group’s approach to risk, responsibility for supporting the Board’s review of the effectiveness of internal controls and risk management has been assigned to the Audit and Risk Committee which played a key role in 2020 in ensuring that appropriate governance and challenge around risk and assurance were embedded across the Group. The approach to risk is set out in the Risk Report on pages 24 to 39.
BOARD DIVERSITY The Board, both for itself and the Group as a whole, is fully committed to diversity as a key
value and an important factor in achieving ESB’s business objectives. It is committed to achieving the optimal balance of skills, experience and diversity among its members. In relation to Board diversity, the Chairman of the Board, in assisting the DECC in drawing up the specification for Board appointments, has regard to the benefits of diversity on the Board, as provided for under the State Code of Practice guidelines including the updated Annex to the State Code “Gender Balance, Diversity and Inclusion” published in 2020 and the related “Guidelines on Appointments to State Bodies”. Board member details are set out on pages 84 to 87.
CULTURE
The Brighter Future Strategy sets a clear strategic direction for the company, accelerating investment in renewable generation, smart networks and the electrification of heat and transport. In tandem with the strategy, the Board set out its clear expectations for the culture change required to deliver business transformation, drawing on the values of the past to establish a renewed and reinvigorated workplace and these principals were embedded in our organisation re-design in 2018.
In 2020, the Board received updates on People strategy and policy developments which are helping to drive the performance and improve employee engagement required to deliver the strategy. The Board inputted to and approved ESB’s new Code of Ethics called “Our Code” and was briefed on the communications plan for the roll-out of the new Code which encourages a “speak up culture”. Diversity and Inclusion was a key theme
for the Board in 2020, in terms of the Board’s own composition and in the broader workplace. This is a topic the Board will return to in 2021.
COVID-19 has accelerated the pace of culture change as new smarter ways of working, which will endure, were embraced right across the organisation. The organisation has used these new ways of working to protect the health and wellbeing of customers and employees while maintaining essential electricity supply, assisting customers experiencing financial difficulties and supporting our CSR partners to deliver services in the community. Pre COVID-19, the Board was able to have a “town hall” meeting with a group of employees at which there was a lively discussion about culture and business transformation. While further site visits were cancelled this year, the Board was nevertheless kept fully appraised of colleagues views and responses through reviews of regular Employee Surveys, Culture Dashboard reporting and updates on investment in systems and talent.
CONCLUSIONIn the following pages, we outline in detail how the Board and its Committees have fulfilled their responsibilities during the year to ensure that robust governance practices are embedded in ESB.
Terence O’RourkeCHAIRMAN
26 February 2021
CHAIRMAN’S CORPORATE GOVERNANCE STATEMENT
Terence O’RourkeCHAIRMAN
88 ESB Annual Report 2020 - Brighter Together ESB Annual Report 2020 89

CO
RP
OR
ATE G
OV
ER
NA
NC
E
02
FINA
NC
IAL S
TATEM
EN
TS
03
01
STR
ATEGY
AN
D P
ER
FOR
MA
NC
E
PRINCIPLES OF GOVERNANCEESB, in pursuit of its governance objectives, complies with the Code of Practice for the Governance of State Bodies 2016 (the State Code) and insofar as is reasonably applicable with the UK Corporate Governance Code 2018 (the UK Code) and the Irish Corporate Governance Annex (the Irish Annex). A copy of the State Code can be obtained from the Department of Public Expenditure and Reform website www.per.gov.ie. A copy of the UK Code can be obtained from the FRC’s website www.frc.org.uk and a copy of the Irish Annex is available at www.ise.ie.
The UK Code sets out an updated five key principles of governance: (1) Board Leadership and Company Purpose, (2) Division of Responsibilities, (3) Composition, Succession and Evaluation, (4) Audit, Risk and Internal Control and (5) Remuneration. The Board’s Governance Report is structured accordingly.
1 BOARD LEADERSHIP AND COMPANY PURPOSE
THE BOARDThe Board provides the leadership of the Group and, either directly or through the operation of Committees, applies independent judgement on matters of values, strategy, performance, resources and governance. During 2020, the Board comprised of the Board members detailed on pages 84 to 87, of whom the Chairman, the Chief Executive and the Independent Board members were appointed by Government and the four Worker Board members were appointed pursuant to the Worker Participation (State Enterprises) Act 1977. The Board size and structure is governed by the Electricity Supply Acts 1927-2004 and by the Worker Participation (State Enterprises) Act 1977. The roles of the Chairman and Chief Executive are not exercised by the same individual, with the responsibilities of each role formally defined in the Board terms of reference
The Board has led the development of ESB’s “Brighter Future” Strategy. The strategy was approved by the Board in 2017 after detailed discussion and assessment. The strategy is a purpose driven strategy that aims to meet the customers’ energy needs by bringing the best of ESB’s capabilities together to deliver innovative and value-driven solutions for a low-carbon world. The strategic objectives are aligned to the Government Climate Action Plan, reflecting the objective of making a significant contribution to the wider society in terms of decarbonisation, underpinned by the requirement for strong financial performance.
DIALOGUE WITH SHAREHOLDERSESB is owned 96.1% by the Irish Government and 3.9% by the Trustee of the Employee Share Ownership Plan (ESOP). ESB engages in active and ongoing consultation with the Government on key policies and strategic issues as required by legislation and the State Code. This includes providing financial planning and performance information, including the annual budget, five year business plan and quarterly financial performance updates. ESB also regularly engages and consults with the Trustee of the ESB ESOP.
CONFLICTS OF INTEREST Board members make annual disclosures of any potential or actual conflicts of interest under the Ethics in Public Office Act 1995. In addition, Board members are responsible for notifying the Company Secretary on an ongoing basis should they become aware of any change in their circumstances regarding conflicts of interest, as detailed in the ESB Board Members’ Code of Conduct.
Biographical details for all the Board members, including details of their external appointments are set out on pages 84 to 87.
2 DIVISION OF RESPONSIBILITIES
THE WAY WE ARE STRUCTURED The organisation is structured to facilitate for
effective and efficient decision making with
clear accountability.
ROLE OF THE BOARDThe Board provides leadership and direction
to the business as a whole and is responsible
for the long-term success of ESB. Decisions
are made only after all appropriate information
has been made available to Board members,
following due consideration of the risks
identified through the risk management process
and in the context of the Group-level risk
appetite statement. The Board constructively
challenges and supports development of
proposals on strategy, which are then reviewed
and approved by the Board.
The Board has reserved the following key
decisions for its own consideration:
• Approval of ESB Group Strategy, annual
budgets and annual and interim financial
statements
• Approval of dividends
• Review of operational and financial
performance
• Approval of major investments, capital
expenditure, borrowings and treasury policies
• Appointment of the Chief Executive
• Appointments to the Executive Team on the
recommendation of the Chief Executive
• Appointment of the Company Secretary
• Major acquisitions, disposals or retirements
of assets
• Appointment of external auditors
• Approval of annual risk plan and risk appetite
• Mass market residential tariffs
• Key regulatory, legal, industrial relations,
accounting and policy matters
Chairman
Terence O'Rourke • Leading the Board• Determining the Board agenda• Ensuring its effectiveness and facilitating full participation by each Board member• Ensuring effective communication with the Group’s owners and stakeholders
Executive Team
Leadership and Control of the Group
Biographical details of the Chairman, Chief Executive and Senior Independent Director can be found on pages 84 to 87.
Biographical details of the Board Members can be found on pages 84 to 87.
Biographical details of the Company Secretary can be found on page 45.
Biographical details of the Executive Team can be found on pages 44 to 45.
Remuneration & Management Development Committee
CHAIRMANTerence O'Rourke• Set the remuneration of
(i) the Chief Executive and (ii) the Executive Team following consultation with the Chief Executive
• To monitor the developmentof current and future leaders of ESB
Finance & Investment Committee
CHAIRMANAndrew Hastings• Review capital raising
and capital expenditure proposals
• Review treasury andenergy trading policies and procedures
• Review investment anddivestment proposals aimed at ensuring the positioning of ESB for future success, consistent with the strategy approved by the Board
Safety, Environment & Culture Committee
CHAIRMANAnne Butler• To advise the Board on health,
safety and environmental, cultural and diversity matters
• Monitor progress againstagreed health, safety and key environmental performance indicators and risk management in these areas
• Ensure appropriate cultureunderpinned by values prevails across ESB
• Review diversity and inclusionstrategy
Audit & Risk Committee
CHAIRMANNoreen O'Kelly• To assist the Board with
its responsibilities in relation to:- Financial reporting- Internal control and
risk management - Compliance, whistle-
blowing and fraud- External and internal
auditors
Customer, Marketing & Innovation Committee
CHAIRMANAlf Smiddy• Alignment of marketing
and customer initiatives and programmes with company strategic objectives
• New products and servicesand associated revenue projections
• Engagement with majorcustomers
• Advertising and sponsorshipprogrammes and assessment of their impact
• Review IT and digital strategy
THE BOARD’S GOVERNANCE REPORT
Company Secretary
Marie Sinnott• Assists the Chairman in ensuring that all
Board members have access to all relevant information and in facilitating Board induction / professional development
• Is responsible for ensuring that correct Boardprocedures are followed and advises the Board on corporate governance matters
• Liaison between Board and Executive Team
Senior Independent Board Member
Noreen Wright • Act as a sounding board for the Chairman• Serving as an intermediary for the other
Board members and the shareholders whennecessary
Chief Executive
Pat O'Doherty • Executive leadership of the Group’s business• Implementation of the Group’s strategies and
policies• Maintaining a close working relationship with
the Chairman• Leading the Executive Team
Board• Chairman, six independent Board members, four worker Board members and the Chief Executive• Responsible for the long-term success of ESB and for its overall judgement on matters of strategy, performance, resources and governance
90 ESB Annual Report 2020 - Brighter Together ESB Annual Report 2020 91

CO
RP
OR
ATE G
OV
ER
NA
NC
E
02
FINA
NC
IAL S
TATEM
EN
TS
03
01
STR
ATEGY
AN
D P
ER
FOR
MA
NC
E
BOARD MEETINGS The Board met on twelve occasions during 2020. The Board is responsible for reviewing the operational and financial performance of the Group and for ensuring effective internal control and risk management. The Board has a formal schedule of matters specifically reserved to it for decision, which are described on page 90.
The Board has delegated authority to management for decisions in the normal course of business, subject to specified limits and thresholds. Oversight of decisions that are delegated by the Board is retained through a robust reporting framework, central to which are effective relationships with the Board Committees, the Chief Executive, the Executive Director Group Finance and Commercial and the Executive Team.
There is ongoing financial and operational reporting to the Board with papers made available electronically to each Board member sufficiently in advance of each meeting to allow adequate time to review and consider
matters for discussion/decision. The Board papers include the minutes of Board Committee meetings.
The aim of the Board meetings is to achieve the right balance of oversight of people, culture, strategy, operations, finance, governance and risk management matters. This is monitored through the annual Board Evaluation Process and informal feedback in order to ensure that adequate time is devoted to each matter. The Board is satisfied that the Chairman and each of the Board members committed sufficient time during the year to enable them to fulfil their duties as Board members of ESB.
The Board’s focus for 2021 will be the continued execution of the Brighter Future Strategy: leading the transition to reliable, affordable, low-carbon energy. This will be achieved by focusing on ESB’s five associated strategic objectives.
To support the continued execution of the Strategy, several key decisions were made during the year:
INDEPENDENCE The Board has determined that those Board members (details on pages 84 to 87) were independent during 2020. The determination of Board members’ independence takes account of the relevant provisions of the UK Code regarding Board members’ independence in character and judgement and the absence of relationships or circumstances that could compromise Board members’ independence. Considering these factors, the Board is satisfied as to the independence of the Board members identified above.
* Independence of Board excluding Chairman
STRATEGIC OBJECTIVE EXAMPLE
Put customers’ current and future needs at the centre of all our activities
Approval of further investment in Smart meter-ing roll out
Produce, connect and deliver clean, secure and affordable energy
Approved investment in Inch Cape (UK) offshore wind farm and investment in Harmony Solar (ROI)
Grow the business while maintaining ESB’s financial strength
Review and approve ESB Networks Regu-latory Price Review 5 (PR5) submission for 2021-2025
Deliver a high-performance culture that sup-ports innovation and collaboration
Review and approval of “Our Code”- code of ethics for staff
Develop energy services to meet evolving market needs.
Review and approval of the Battery Energy Framework agreement and Consideration of low carbon technology trends.
BOARD COMMITTEE PARTICIPATION DIRECTORS EXPERTISE DIRECTOR’S EXPERIENCE
Audit & Risk Finance &Investment
Customer Marketing & Innovation
Safety Environment
& Culture
Remuneration &
Management Development
Core Skills Sector Specific Skills Length of Tenure
Operational Manage-
ment/Business
Experience
GovernanceFinance/
Accounting/Audit/Legal
Science/Technology/Engineering
Customer/Marketing/Innovation
Energy/Regulated Markets
Safety/Social/ En-vironmental
Responsibility
Terence O’Rourke C 2 months
Anne Butler • C 8 years & 2months
Dave Byrne • 10 years
Stephen Carrig • 2 years
Andrew Hastings C • 5 years & 6
months
Sean Kelly • Ten years
Paul Lynam • • • 4 years & 3 months
Tony Merriman • 14 years
Noreen O’Kelly C • 7 years & 8
months
Pat O’Doherty • • • 8 years
Alf Smiddy • C 4 years & 3 months
Noreen Wright • • 9 years & 6
months
ATTENDANCE AT MEETINGS IN 2020There were twelve Board meetings in 2020. The attendance by each Board member during the year is set out below. In addition to the Board members and Company Secretary, several Executive Directors/senior managers attended relevant sections of Board meetings, by invitation.
* Independent Board member** Term commenced November 2020*** Term ended July 2020^ Worker Board member
BOARD MEMBERS 2020 MEETINGS ATTENDED
Terence O’Rourke** 2
Ellvena Graham OBE*** 7
Anne Butler* 12
Dave Byrne^ 12
Stephen Carrig^ 12
Andrew Hastings* 11
Seán Kelly^ 12
Paul Lynam* 12
Tony Merriman^ 10
Noreen O’Kelly* 12
Alf Smiddy* 12
Noreen Wright* 12
Pat O’Doherty 12 Chairperson of committee
Directors' area of expertise
C
•
INDEPENDENCE OF BOARD
Member of committee
92 ESB Annual Report 2020 - Brighter Together ESB Annual Report 2020 93
EXPERIENCE AND BOARD/SKILLS MIX
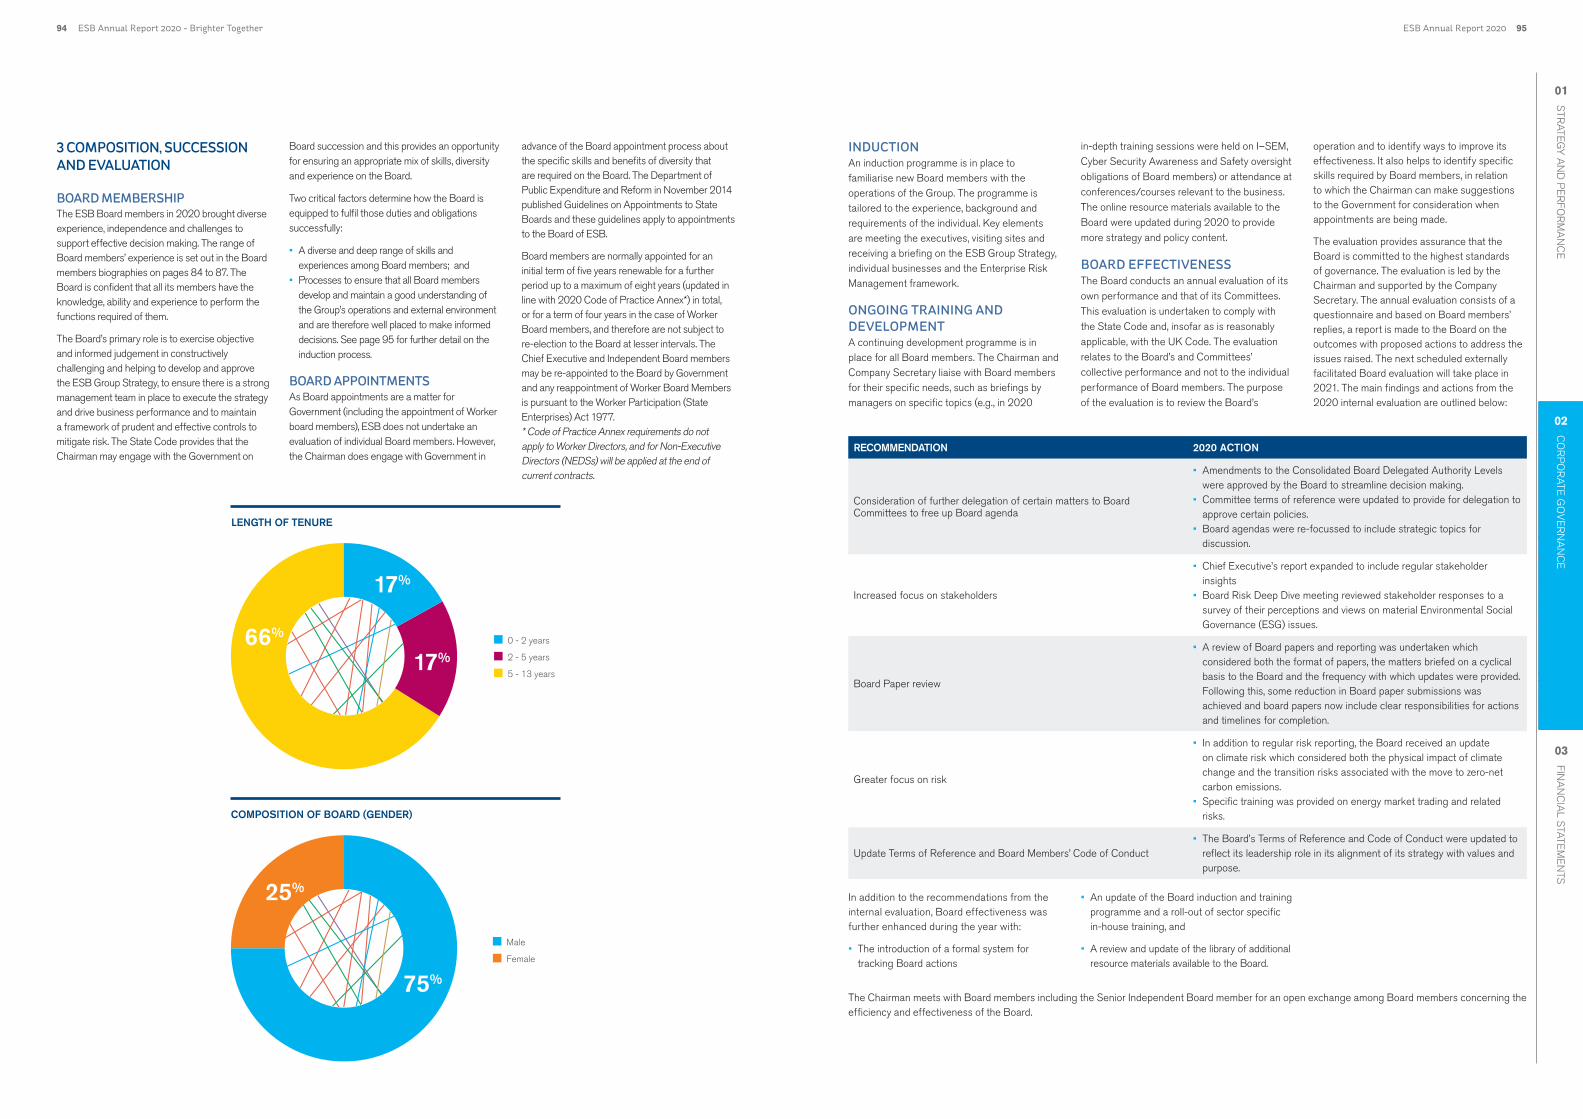
CO
RP
OR
ATE G
OV
ER
NA
NC
E
02
FINA
NC
IAL S
TATEM
EN
TS
03
01
STR
ATEGY
AN
D P
ER
FOR
MA
NC
E
3 COMPOSITION, SUCCESSION AND EVALUATION
BOARD MEMBERSHIP The ESB Board members in 2020 brought diverse experience, independence and challenges to support effective decision making. The range of Board members’ experience is set out in the Board members biographies on pages 84 to 87. The Board is confident that all its members have the knowledge, ability and experience to perform the functions required of them.
The Board’s primary role is to exercise objective and informed judgement in constructively challenging and helping to develop and approve the ESB Group Strategy, to ensure there is a strong management team in place to execute the strategy and drive business performance and to maintain a framework of prudent and effective controls to mitigate risk. The State Code provides that the Chairman may engage with the Government on
INDUCTION An induction programme is in place to familiarise new Board members with the operations of the Group. The programme is tailored to the experience, background and requirements of the individual. Key elements are meeting the executives, visiting sites and receiving a briefing on the ESB Group Strategy, individual businesses and the Enterprise Risk Management framework.
ONGOING TRAINING AND DEVELOPMENTA continuing development programme is in place for all Board members. The Chairman and Company Secretary liaise with Board members for their specific needs, such as briefings by managers on specific topics (e.g., in 2020
In addition to the recommendations from the internal evaluation, Board effectiveness was further enhanced during the year with:
• The introduction of a formal system fortracking Board actions
Board succession and this provides an opportunity for ensuring an appropriate mix of skills, diversity and experience on the Board.
Two critical factors determine how the Board is equipped to fulfil those duties and obligations successfully:
• A diverse and deep range of skills and experiences among Board members; and
• Processes to ensure that all Board members develop and maintain a good understanding of the Group’s operations and external environmentand are therefore well placed to make informed decisions. See page 95 for further detail on the induction process.
BOARD APPOINTMENTS As Board appointments are a matter for Government (including the appointment of Worker board members), ESB does not undertake an evaluation of individual Board members. However, the Chairman does engage with Government in
in-depth training sessions were held on I–SEM, Cyber Security Awareness and Safety oversight obligations of Board members) or attendance at conferences/courses relevant to the business. The online resource materials available to the Board were updated during 2020 to provide more strategy and policy content.
BOARD EFFECTIVENESSThe Board conducts an annual evaluation of its own performance and that of its Committees. This evaluation is undertaken to comply with the State Code and, insofar as is reasonably applicable, with the UK Code. The evaluation relates to the Board’s and Committees’ collective performance and not to the individual performance of Board members. The purpose of the evaluation is to review the Board’s
• An update of the Board induction and trainingprogramme and a roll-out of sector specificin-house training, and
• A review and update of the library of additionalresource materials available to the Board.
advance of the Board appointment process about the specific skills and benefits of diversity that are required on the Board. The Department of Public Expenditure and Reform in November 2014 published Guidelines on Appointments to State Boards and these guidelines apply to appointments to the Board of ESB.
Board members are normally appointed for an initial term of five years renewable for a further period up to a maximum of eight years (updated in line with 2020 Code of Practice Annex*) in total, or for a term of four years in the case of Worker Board members, and therefore are not subject to re-election to the Board at lesser intervals. The Chief Executive and Independent Board members may be re-appointed to the Board by Government and any reappointment of Worker Board Members is pursuant to the Worker Participation (State Enterprises) Act 1977. * Code of Practice Annex requirements do notapply to Worker Directors, and for Non-Executive Directors (NEDSs) will be applied at the end of current contracts.
operation and to identify ways to improve its effectiveness. It also helps to identify specific skills required by Board members, in relation to which the Chairman can make suggestions to the Government for consideration when appointments are being made.
The evaluation provides assurance that the Board is committed to the highest standards of governance. The evaluation is led by the Chairman and supported by the Company Secretary. The annual evaluation consists of a questionnaire and based on Board members’ replies, a report is made to the Board on the outcomes with proposed actions to address the issues raised. The next scheduled externally facilitated Board evaluation will take place in 2021. The main findings and actions from the 2020 internal evaluation are outlined below:
The Chairman meets with Board members including the Senior Independent Board member for an open exchange among Board members concerning the efficiency and effectiveness of the Board.
COMPOSITION OF BOARD (GENDER)
RECOMMENDATION 2020 ACTION
Consideration of further delegation of certain matters to Board Committees to free up Board agenda
• Amendments to the Consolidated Board Delegated Authority Levelswere approved by the Board to streamline decision making.
• Committee terms of reference were updated to provide for delegation toapprove certain policies.
• Board agendas were re-focussed to include strategic topics fordiscussion.
Increased focus on stakeholders
• Chief Executive’s report expanded to include regular stakeholderinsights
• Board Risk Deep Dive meeting reviewed stakeholder responses to asurvey of their perceptions and views on material Environmental SocialGovernance (ESG) issues.
Board Paper review
• A review of Board papers and reporting was undertaken whichconsidered both the format of papers, the matters briefed on a cyclicalbasis to the Board and the frequency with which updates were provided.Following this, some reduction in Board paper submissions wasachieved and board papers now include clear responsibilities for actionsand timelines for completion.
Greater focus on risk
• In addition to regular risk reporting, the Board received an updateon climate risk which considered both the physical impact of climatechange and the transition risks associated with the move to zero-netcarbon emissions.
• Specific training was provided on energy market trading and relatedrisks.
Update Terms of Reference and Board Members’ Code of Conduct• The Board’s Terms of Reference and Code of Conduct were updated to
reflect its leadership role in its alignment of its strategy with values andpurpose.
LENGTH OF TENURE
94 ESB Annual Report 2020 - Brighter Together ESB Annual Report 2020 95

CO
RP
OR
ATE G
OV
ER
NA
NC
E
02
FINA
NC
IAL S
TATEM
EN
TS
03
01
STR
ATEGY
AN
D P
ER
FOR
MA
NC
E
safeguarding of the organisation’s assets against loss
• Reliability of reporting for internal andexternal use
• Compliance with applicable laws and regulations
In order to discharge its responsibilities in a manner which ensures compliance with legislation and regulations, the Board has established an organisational structure with clear operating and reporting procedures, lines of responsibility, authorisation limits, segregation of duties and delegated authority.
The Group uses the integrated internal control framework as developed by the Committee of Sponsoring Organisations of the Treadway Commission (COSO) as guidance for designing, implementing and conducting internal control and assessing its effectiveness. The COSO framework was first released in 1992 and updated in 2013.
ESB has in place a strong internal control framework, which includes the following:
• A code of ethics (“Our Code”) that sets the tone from the top and requiring all employeesto maintain the highest ethical standards in conducting business
• A clearly defined organisational structure, with defined authority limits and reporting mechanisms to higher levels of management and to the Board, which support the maintenance of a strong controlenvironment
• A corporate governance framework that includes risk analysis, financial control review and formal annual governance compliance statements by themanagement of business units and joint ventures (JVs)
• A comprehensive set of policies and proceduresrelating to operational and financial controls as well as compliance obligations
• Large capital projects require the approval of the Board and are closely monitored on an ongoing basis by the Finance and Investment Committee and are also subject to post-completion audits andbusiness case realisation reviews
• Comprehensive budgeting systems with an annual budget and five-year plan approved by theBoard
• A comprehensive system of financial reportingand non-financial reporting
• Cumulative actual results and key performanceindicators are reported against budget and considered by the Board on a regular basis
• A telephone helpline and online webchat servicethat provides employees with a confidential (and if required, anonymous) means of reporting any suspected wrongdoing or ethical concerns
These controls are reviewed systematically by Group Internal Audit. In these reviews, emphasis is placed on areas of greater risk as identified by risk analysis. Where weaknesses in the internal control system have been identified through the
4 AUDIT, RISK AND INTERNAL CONTROL
COMPLIANCE WITH CORPORATE GOVERNANCE CODES ESB complies with the State Code, which sets out the principles of corporate governance that the Boards of State Bodies are required to observe. ESB also complies with the Corporate Governance Guidelines and other obligations imposed by the Ethics in Public Office Act, 1995, the Standards in Public Office Act, 2001 and the Regulation of Lobbying Act, 2015.
ESB complies on a voluntary basis, insofar as is reasonably applicable with the UK Code and the Irish Annex. ESB is a statutory corporation established under the Electricity (Supply) Act 1927 (as amended) and is not obliged to comply with the UK Code or the Irish Annex. The UK Code consists of principles (main and supporting) and provisions. Companies listed on the Irish Stock Exchange are required, as part of the Listing Rules, to describe how they apply the principles and comply with the provisions of the UK Code and the related Irish Annex and to provide an explanation in the event of non-compliance.
ESB voluntarily complies with the principles and provisions of the UK Code and the Irish Annex subject to the following exceptions:
• Appointments to the Board are a matter for the Government and accordingly ESB does not have a Nominations Committee.
• Board members are appointed for terms of five years (or four years in the case of Worker Board members) and therefore are not subject to re-election to the Board at lesser intervals.
• ESB’s policies and disclosures in relation to remuneration of the Chief Executive are in accordance with applicable Government guidelines. Notice periods in the Chief Executive contract are in accordance with Government guidelines. The details of Board members’ remuneration on page 100 do not include amounts paid to the four Worker Board members as employees of ESB (as such pay is neither increased nor decreased because of their membership of the Board) but do include amounts paid to them by way of Board fees. Obligations regarding share awards are not relevant to ESB, nor are post-employment shareholding requirements relevant as beneficial interests in the stock of ESB are held only through participation in ESB’s Employee Share Ownership Plan (ESOP) and ESB is majority owned by the Government.
• The Board evaluation process has not to date evaluated the individual performance of Board members as the Board does not have a formalrole in determining its own composition.
• The Board Chairman is also Chairman of the Remuneration and Management Development
Committee, given the importance of compliance by ESB with Government policy in this area and the role of the Chairman as the primary interface with the Government.
• The Independent Board members do not meet without the Chairman present to appraise the Chairman's performance as the appointment ofthe Chairman is a matter for the Government.
• The Government sets the pay of the Chief Executive and establishes pay policy relevant tosenior management. This limits the discretion of the Remuneration and Management Development Committee in relation to these matters.
• Committee chairs do not engage with MinisterialStockholders as there is a process in place whereby the Chair engages with Ministerial Stockholders and ensures that the Board and management is aware of the views of the Stockholders.
• As ESB is 96.1% State owned, with governance arrangements in place with its Ministerial Stakeholders, requirements in relation to consultation with shareholders in the event of 20% or more of votes being cast against a Board recommendation are considered not to beapplicable.
• Neither UK nor Irish company law is directly applicable to ESB (including Section 172 of theUK Companies Act 2006.)
• Members of the Board of ESB are appointed in accordance with Section 2 of the Electricity (Sup-ply) Act, 1927 and the Worker Participation (State Enterprises) Acts. Therefore, the requirement to take account of demands on directors’ time and the undertaking of additional external appoint-ments is a matter for the Government.
FINANCIAL AND BUSINESS REPORTING The Board recognises its responsibility in preparing the Annual Report and Financial Statements and in presenting a fair, balanced and understandable assessment of the Group’s position and prospects. The Board members’ responsibilities regarding financial statements and going concerns are set out on page 99.
PROCUREMENT ESB carries out its procurement activities in compliance with applicable procurement laws and the State code. A paper detailing obligations and providing assurance of compliance is provided annually to the Audit and Risk Committee.
INTERNAL CONTROL The Board has overall responsibility for the Group’s system of internal control and for monitoring its effectiveness. The system of internal control is designed to provide reasonable but not absolute assurance for the achievement of the following objectives:
• Effectiveness and efficiency of operations and
EXAMPLES OF MATTERS CONSIDERED AND/OR APPROVED BY THE BOARD IN 2020
PEOPLE OPERATIONS
• Senior executive appointments• Staff survey results• Corporate culture update• COVID-19 review• Capability development plans• Diversity and Inclusion Strategy• Safety incidents• Our Code (ESB Code of Ethics)
• Chief Executive operations reports• Health and safety reports• Energy trading updates• Plant investment and overhauls programme• Property disposals• Investment in renewable projects• ESB Networks Regulatory Price Review 5 Submission• Electricity price changes• Head office redevelopment project• Asset Development Electrical Balance of Plant Framework• COVID-19 review• Funding GB Market expansion• UCC v ESB Supreme Court judgement• Environmental Social and Governance (ESG) reporting• Smart metering updates• IT framework agreement
STRATEGY GOVERNANCE AND RISK MANAGEMENT
• Board Strategy day considering economic policy, competitor andtechnology trends in general
• Offshore wind review• Capacity auctions• Smart metering project update• Solar power strategy review• SIRO strategic review• GB energy strategy update• Group strategy and plans for safety, health and the environment• Marketing strategy• Digital strategy• HR Strategy update• Reputation update
• Group risk plan• Update of HiLP (High Impact Low Probability) risk register• Dam safety• Internal audit plan for the year• Committees’ terms of reference• Annual review of effectiveness of internal control and risk management• Group authority levels and Group trading authority levels• UK Modern Slavery Act• Business continuity planning• Board evaluation• Quarterly risk report review• Group safety policy
FINANCE
• Annual and half-yearly published results• COVID-19 financial impact assessment• ESB regulatory accounts• Quarterly financial performance and forecasts• Monthly key performance indicators (KPIs)• Annual budget and five-year business plan• Dividend policy and dividend payments• Hurdle rates for new investments• Funding requirements• Approval of sustainability-linked Revolving Credit Facility• Group valuation
96 ESB Annual Report 2020 - Brighter Together ESB Annual Report 2020 97

CO
RP
OR
ATE G
OV
ER
NA
NC
E
02
FINA
NC
IAL S
TATEM
EN
TS
03
01
STR
ATEGY
AN
D P
ER
FOR
MA
NC
E
could undermine ESB’s strategy or which could
adversely affect the long-term viability or reputation
of the Group. The Board delegates responsibility
for oversight of specific risks to Board Committees
in accordance with Committees’ terms of reference
and respective area of expertise. The Board agrees
how committees will keep one another, and the
Board itself, informed about risks and risk oversight
practices. Efficiency and effectiveness call for clear
boundaries, communication channels, and handoff
points. The Board defines these elements clearly,
adjusting as needed. The Committee Chair’s
report to the full Board on key risks falling within
their remit, developments and matters requiring
further discussion and consideration. The Audit
and Risk Committee retains overall responsibility
for ensuring that enterprise risks are properly
identified, assessed, reported and controlled on
behalf of the Board.
Risk appetite may also vary over time and the
Board has explicitly considered the level of this
appetite and how specific risks are managed within
it. The propensity to take risk is always balanced by
a focus on exercising control.
ESB's assessment has been made over a five-year period, which is consistent with the time frame of ESB's business planning process. The assessment is based on consideration of ESB’s current position and prospects, maintenance of its financial strength (pages 52 to 57), progress against ESB 2030 Strategy (page 17, risk appetite (page 24), principal risks (pages 28 to 39) and how these are managed.
The Board believe that a five-year assessment is most appropriate as it aligns with the business planning process completed annually and is underpinned by regular Board briefings provided by business units along with strategic performance indicators (SPIs) to measure progress. The projections in the business plan consider ESB's cash flows, committed funding and liquidity positions and examine future funding requirements and financial covenants, and other key financial ratios including those relevant to maintaining investment grade credit ratings. The metrics in the business plan are subject to sensitivity analysis, which involves flexing a number of the main assumptions underlying the plan to assess key financial metrics, such as Net Debt and EBITDA (Earnings Before Interest, Tax, Depreciation and Amortisation) where appropriate analysis is carried out to evaluate the potential financial impact of ESB's principal risks actually occurring. As part of the Enterprise Risk Management (ERM) processes, the major and material potential consequences of a principal risk materialising are identified and, where possible and appropriate, the financial impact estimated. In addition, the ERM processes considers the interdependency of principal risks, particularly in terms of impact.
The Board recognises the significance of maintaining a strong balance sheet. ESB's funding operations are of strategic importance and support capital expenditure, the refinancing of maturing debt and the maintenance of adequate liquidity. ESB's debt management strategy targets a debt portfolio profile with a diverse mix of counterparties, funding sources and maturities. In 2020, ESB entered into a new €1.4 billion sustainability linked revolving credit facility up to 2025, which provides ESB with a substantial level of standby liquidity. ESB’s funding position reflects its underlying financial strength and at least BBB+ (or equivalent) credit ratings from two major credit rating agencies. Further details on debt maturity are set out on page 57.
The Board has carried out a robust risk assessment of the principal and emerging risks facing ESB. As a reactive mitigation to minimise impact should any risks with a consequence for ESB’s operations to materialise, Business Continuity, Crisis Management and Disaster
monitoring framework above, plans for addressing them are put in place and action plans are regularly monitored until completed.
RISK MANAGEMENTEffective risk management is critical to the achievement of ESB's strategic objectives and the long-term sustainable growth of its business. The rapid changes taking place in ESB (and the market and in the regulatory and operating environment in which it operates) make it all the more important to continuously reassess risks and have clear strategies and controls to manage them and, as appropriate, leverage any opportunities they present. The Board has overall responsibility for the Group’s approach to risk.
Specifically, the Board is responsible for:
• Assessing the adequacy of the process designedto identify the principal risks and uncertainties
• Overseeing that an appropriate risk culture isembedded throughout the Group
• Establishing a clearly articulated risk appetite position that clarifies the level of risk ESB is willing to accept, which also ensures that management and the Board align their views on risk and that investments and expenditures are considered in light of that appetite.
THE 2020 REVIEW OF THE EFFECTIVENESS OF INTERNAL CONTROL AND RISK MANAGEMENT The Board retains overall responsibility for internal control and risk management. During 2020, the Board has directly and through the delegated authority to the Audit and Risk Committee, reviewed the effectiveness of the Group’s system of internal control covering financial, operational and compliance controls and risk management systems for 2020 and will ensure a similar review is performed in 2021.
The process used by the Board and the Audit and Risk Committee to review the effectiveness of the system of internal control includes:
• A designated risk management functionin ESB
• Review and consideration of the half-yearly risk review process and regular riskmanagement updates
• Independent advice on the adequacy of thecurrent risk management process operating inESB (an external review commencedin 2020 and will be finalised in 2021).
• Review and consideration of certification frommanagement of satisfactory and effectiveoperation of systems of internal control, bothfinancial and operational
• A review of the programme of Group InternalAudit and consideration of its findings andreports. Group Internal Audit also reportregularly on the status of implementation ofrecommendations raised previously from itsown reports
• Independent assessment of the effectivenessof the internal audit function (this is carriedout every five years; the last assessment wascarried out in 2016)
• A review of reports of the external auditorswhich contain details of work carried out onthe key audit risks
Based on this review, the Board confirms the following for 2020:
• There is an ongoing process for identifying,evaluating and managing the principal risksof ESB
• Systems of internal control have been in placefor the year under review and up to the dateof approval of this Annual Report
• The systems comply with the FinancialReporting Council (FRC) Guidance on RiskManagement, Internal Control and RelatedFinancial and Business Reporting
• Several environmental and safety complianceand reporting issues were identified in ESBNetworks. A programme of corrective actionswas put in place with implementation wellprogressed in 2020, and there is an ongoingreview of Compliance procedures to identify
• Assessing the adequacy of the risk managementand crisis management processes
• Assessing the likely effectiveness of manage-ment’s mitigation measures and controls.
The Board has carried out a robust assessment of the principal risks facing the Group, including those that might threaten its business model, future performance, solvency and liquidity. A cyclical review process for identifying, assessing and managing significant risks has been in place for the year under review and up to the date of approval of this Annual Report. The principal risks and uncertainties facing the Group and the mitigating strategies are set out on pages 28 to 39.
The Board is aware that it must lead by example in shaping and supporting the updated Group values that underpin the approach to risk. It also seeks to ensure that sufficient risk management skills and capabilities are available in the business and that the knowledge and experience of all the employees in ESB who understand the risks associated with operations is utilised. Regular reporting has facilitated the Board to stay abreast of changes in identified principal risks in addition to emerging risks and uncertainties.
The Board focuses primarily on those risks that
additional opportunities for improvement. • No other significant failings or weaknesses
were identified in the review and where areasof improvement were identified, processes arein place to ensure that the necessary actionis taken, and progress is monitored untilcompleted
Through its ongoing involvement and overview of internal control and risk management activities, the Board is satisfied that internal control and risk management processes are effective.
GOING CONCERN The COVID-19 pandemic has had a negative economic impact, which saw all-island Irish electricity demand fall by a peak of around 15% in April 2020 relative to 2019 during the first “lockdown” period (to the end of June) and a fall of around 5% during the second “lockdown period” (to the start of December). Demand in the third “lockdown” period (post mid-December 2020) has been in line to date with the equivalent 2020 levels. While the reduced demand and COVID-related operating restrictions had a knock-on impact on ESB’s financial performance, overall electricity demand remained resilient (with annual demand for 2020 down less than 1% on 2019) and ESB adapted its working procedures to safely minimise the impact on its operations and work programmes. ESB delivered an operating profit (before exceptional items) of €616 million. ESB has considerable financial resources (with net assets of €3.9 billion and liquidity of €1.8 billion) and the Board believes that ESB is well placed to manage its risks successfully. After making appropriate enquiries, the Board is satisfied that ESB has adequate resources to continue in operational existence for the foreseeable future. Accordingly, the Board continues to adopt the going concern basis in preparing ESB's financial statements.
ESB's performance, business model, strategy and principal risks and uncertainties and how these are managed are set out in the strategy and performance report on pages 17 to 39.
The financial position of ESB, its cash flows, liquidity position and borrowing facilities are described in the Financial Review on pages 52 to 57. Note 28 of the financial statements includes an overview of financial risk management, details of its financial instruments and hedging activities and its exposure to credit and liquidity risks.
VIABILITY STATEMENT In accordance with the UK Code, the Board members have assessed the prospects of ESB over a longer period than that required in adopting the going concern basis of accounting.
ACTIVITIES UNDERTAKEN BY THE AUDIT AND RISK COMMITTEE DURING 2020 IN RESPECT OF ITS RISK RESPONSIBILITIES INCLUDED:
ACTIVITY DETAIL
Group Risk Plan The Committee reviewed the 2020 Group Risk Plan and recommended it to the Board for approval.
Business Continuity Planning (BCP) and Crisis Management Review The Committee reviewed the effectiveness of business continuity plans, crisis management and resilience testing arrangements across ESB.
Mid-Year Risk Review The Committee considered and reported to the Board any changes to the Group principal risks and emerging risks as approved at the start of the year, including a review of material changes to the risk profile.
Risk ReportsThe Committee reviewed changes to the status of the principal risks, in-cluding the effectiveness of operation of controls and status of mitigating actions.
High Impact Low Probability (HILP) risk The Committee completed a biennial review of HILP risks.
Cyber Security Update The Committee was provided with an update on cyber security.
Data Protection The Committee reviewed the bi-annual data protection dashboard and half year Data Protection report.
COVID-19 Pandemic
The Committee received updates on: • corporate crisis plan activation• reactive and proactive measures in the context of pandemic/business
continuity plans• financial impact assessment of COVID-19.
ESG (Environmental Social Governance)(Annual Off-site Risk Day)
A Committee meeting was dedicated to ESG, and the Committee was given an overview (including external speakers) of ESG as a major risk and opportunity for ESB.
98 ESB Annual Report 2020 - Brighter Together ESB Annual Report 2020 99

CO
RP
OR
ATE G
OV
ER
NA
NC
E
02
FINA
NC
IAL S
TATEM
EN
TS
03
01
STR
ATEGY
AN
D P
ER
FOR
MA
NC
E
Recovery plans have been developed for ESB. These plans are traditionally exercised as part of an annual test plan, based on scenarios that could adversely impact ESB and assess the degree to which these risks can be mitigated. Results and lessons learned arising from the annual review and testing programme are reported to the Audit and Risk Committee. In 2020, as a consequence of the COVID-19 pandemic, a number of these plans were exercised in real life scenarios rather than in test scenarios, with the key lessons learned arising being the subject of the 2020 Business Continuity Report to the Audit and Risk Committee (which was presented in January 2021). In addition, the Board considered in significant detail both ESB's response efforts to minimise the impact of the pandemic and mitigations to address the medium term and longer term consequences to ESB. ESB's principal risks and the way they are being managed and mitigated are outlined on pages 28 to 39.
Based on the results of the above analysis, the Board members have a reasonable expectation that ESB will be able to continue in operation and meet its liabilities as they fall due over the five-year period of their assessment.
5 REMUNERATION
CHIEF EXECUTIVE’S REMUNERATION The Chief Executive’s remuneration is set within a range determined by the Minister for Public Expenditure and Reform and the Minister for the Environment, Climate and Communications. Pat O’Doherty was appointed Chief Executive, effective 1 December 2011 and was appointed a Board member in January 2013. His remuneration consists of an annual salary of €318,083, a company car and employer pension
contribution. He is a member of the ESB Pension Scheme. In line with Government policy that the Chief Executive of State Companies should not receive performance related payments, he did not receive any performance related payments in 2020.
WORKER BOARD MEMBERS’ REMUNERATION Worker Board members appointed under the Worker Participation (State Enterprises) Act 1977 and are employees of ESB. They are members of the ESB Pension Scheme. Worker Board Members’ are entitled to receive a separate fee in respect of their position as Board members.
INDEPENDENT BOARD MEMBERS’ REMUNERATION The remuneration of the Independent Board members (including the Chairman) is determined by the Minister for Public Expenditure and Reform and the Minister for the Environment, Climate and Communications and they do not receive pensions or any other remuneration. The terms and conditions are set out in their letter of appointment and this is available on request from the Company Secretary.
BOARD MEMBERS’ EXPENSESIn compliance with the State Code, disclosure is required of the expenses paid to Board members. During 2020, €8,898 was reimbursed to, or paid on behalf of, Board members for travel expenses, accommodation and other related expenses. The above expenses do not include those of the Chief Executive or the Worker Board members in respect of their Executive or employee duties.
CHAIRMAN
2020 2019
€ €
Ellvena Graham OBE1 16,935 31,500Terence O’Rourke2 4,463 -
CHIEF EXECUTIVE
2020 2019
€ €
Salary 318,083 318,083Taxable benefits 8,360 15,570Pension contributions 52,166 52,166Total 378,609 385,819
INDEPENDENT/WORKER BOARD MEMBERS
2020 2019
€ €
Anne Butler 15,750 15,750Dave Byrne 15,750 15,750Stephen Carrig 15,750 15,750Andrew Hastings 15,750 15,750Seán Kelly 15,750 15,750Paul Lynam 15,750 15,750Tony Merriman 15,750 15,750Noreen O’Kelly 20,800^ 15,750Alf Smiddy 15,750 15,750Noreen Wright 15,750 15,750
162,550 157,500
1 Retired in 20202 Appointed November 2020^Inclusive of additional fees in respect of carrying out delegated authority duties as Chairman during the period before the appointment of the new Chairman.
BOARD MEMBERS’ REMUNERATION
BOARD MEMBERS’ REMUNERATION
On behalf of the Audit and Risk Committee, I am pleased to introduce the Audit and Risk Committee Report for the year ended 31 December 2020. The purpose of the report is to provide an insight into the workings of the Audit and Risk Committee over the last 12 months. I confirm that the Audit and Risk Committee has satisfied its responsibilities as set out in its terms of reference and under both the Code of Practice for the Governance of State Bodies (the State Code) and the UK Corporate Governance Code 2018 (the UK Code) as applied on a voluntary basis insofar as is reasonably applicable.
The responsibilities of the Audit and Risk Committee are summarised on page 106 and are set out in full in its terms of reference. The Audit and Risk Committee currently consists of four Independent Board members whose biographical details are set out on pages 88 to 91. The members bring a broad range of experience and expertise from a wide range of industries, which is vital to supporting effective governance. The Board has confirmed that each member of the Audit and Risk Committee is independent, and that the membership meets the requirements of the State Code and the UK Code in terms of recent and relevant financial experience and competence relevant to the sector in which ESB operates.
COVID-19 PANDEMICThe Audit and Risk Committee is conscious of the impact of the ongoing COVID-19 pandemic on ESB’s employees, supply chain, and base
of vendors, customers and operations. In this context, we have engaged with management throughout the pandemic to seek to ensure that robust internal controls and risk management systems continue to apply, and that ESB Internal Audit function operates effectively, while recognising the additional pressure and stress on the management and employees of ESB as a result of the pandemic. The Committee have also discussed with management the implications of COVID-19 on ESB’s ability to continue as a Going Concern and the impact of the pandemic on the short to medium term prospects of ESB and are satisfied that ESB has considerable resources (see page 103) to continue as a Going Concern. As part of the Committees' mid-year risk review, in consideration of the impact of the COVID-19 pandemic, an additional principal risk, “Pandemic/COVID-19 and its impacts" was added to ESB's risk register. The Committee will continue to monitor the ongoing impact of COVID-19 on ESB’s activities.
FINANCIAL STATEMENTSThe Audit and Risk Committee has reviewed the Annual Report and Financial Statements, in the context that taken as a whole they should be fair, balanced and understandable and provides all the necessary information for shareholders/stakeholders to assess ESB’s performance, business model and strategy. The Committee is satisfied that it meets these criteria and has recommended them to the Board for approval. The Audit and Risk Committee also considered
the significant issues in relation to the financial statements and how these issues were addressed. This work is summarised on pages 107 to 109.
FRAUDIn line with its terms of reference the Audit and Risk Committee also reviewed and assessed reports on incidents of fraud and attempted fraud during the year.
LOOKING AHEADThe key areas of focus in 2021 for the Audit and Risk Committee will include the following:
• Monitor ongoing implications of the COVID-19 pandemic on ESB
• Continue to monitor and assess ESB’s Environmental, Social and Governance (ESG)reporting requirements
• Continue to focus on cyber security risks• Oversee the 2021 external audit tender process
The Audit and Risk Committee will also continue
to keep its activities under review taking into
consideration external developments and Board
priorities.
The Audit and Risk Committee held nine meetings during 2020. The members of the Committee, length of service and the number of meetings attended are set out below:
AUDIT AND RISK COMMITTEE REPORT
1 Fellow of Chartered Accountants Ireland 2. Senior Executive positions held in industry3 Senior banking and financial services experience4 Qualified Barrister and energy sector experience through previous roles in Northern Ireland Electricity Networks plc.
MEMBERS DESIGNATION LENGTH OF SERVICE MEETINGS ATTENDED
Noreen O’Kelly, Chairman1 Independent Board Member 7 years and 6 months 9
Paul Lynam2 Independent Board Member 11 months 8
Andrew Hastings3 Independent Board Member 4 years and 4 months 1
Alf Smiddy1 Independent Board Member 4 years 9
Noreen Wright4 Independent Board Member 5 years and 3 months 9
Chairman’s Introduction
Noreen O’Kelly,CHAIRMAN, AUDIT AND RISK COMMITTEE
100 ESB Annual Report 2020 - Brighter Together ESB Annual Report 2020 101

CO
RP
OR
ATE G
OV
ER
NA
NC
E
02
FINA
NC
IAL S
TATEM
EN
TS
03
01
STR
ATEGY
AN
D P
ER
FOR
MA
NC
E
DUTY ACTIVITIES CARRIED OUT IN 2020
Financial reporting Review the Annual Report and Financial State-ments to ensure that when taken as a whole, they are fair, balanced and understandable and that appropriate accounting standards, esti-mates and judgements have been applied
• Reviewed the clarity and completeness of the disclosures in the Annual Report and FinancialStatements and the material information presented within them
• Reviewed Annual Report and Financial Statements to ensure that they were fair, balanced andunderstandable
• Considered and challenged the methods used to account for significant or unusual transactionsand how these were presented and disclosed in the financial statements
• Reviewed whether the Group had applied appropriate accounting standards and madeappropriate estimates and judgements, taking into account the views of the external auditors
• Reviewed Going Concern assumptions/Viability Statement• Reviewed the interim results which consist of financial statements and explanatory notes• Reviewed and considered the key messages for the financial results publications• Reviewed and recommended to the Board for approval, the ESB Regulatory Financial
Statements• Reviewed and recommended to the Board of ESB Finance DAC for approval, the ESB Finance
DAC financial statements
Internal control and risk managementReview the effectiveness of internal control and risk management
• Reviewed and monitored the effectiveness of the Group’s system of internal control• Reviewed the arrangements for business continuity planning and crisis management• Reviewed the arrangements for Pandemic Planning around COVID-19• Reviewed ESB’s Annual Risk Plan and recommended them to the Board for approval, in addition
to receiving related regular risk reports• Reviewed the 6 monthly Data Protection Report• Considered and approved an additional "COVID-19" risk as part of the Mid-Year risk review• Considered Climate and related risk reporting and the developments in Environment, Social and
Governance (ESG) / Sustainable Development Goals (SDG) reporting and the implications forESB
• Reviewed the Biennial High Impact Low Probability Risks (HILPs) and recommendations forchange
• Received update on cyber security maturity
Compliance, whistle-blowing and fraud Review the adequacy and security of the arrangements for employees and contrac-tors to raise concerns, in confidence, about possible wrongdoing in financial reporting or other matters
• Reviewed the procedures and policies for preventing and detecting fraud and were informed ofany instances of fraud and attempted fraud
• Reviewed procurement compliance• Reviewed compliance processes across the Group• Reviewed and considered updates on status of protected disclosures• Reviewed processes for compliance with State Code• Reviewed the new ethics code and recommended to the Board for approval
Internal audit Monitor and assess the role and effectiveness of the internal audit function
• Reviewed the internal audit plan and monitored progress against this plan to assess theeffectiveness of the function
• Reviewed reports detailing the results of key audits, management’s response and the timelinessof resolution of actions
• Met with the Head of Internal Audit without management being present• Reviewed internal audit key performance indicators
External audit Monitor and review the objectivity, independ-ence and quality of the external auditors and review the findings of the audit with the external auditors
• Assessed the effectiveness of the external audit process including auditor independence andobjectivity
• Reviewed and challenged the proposed external audit plan to ensure that PwC had identified allkey risks and developed robust audit procedures
• Reviewed the report from PwC on its audit of the financial statements and their comments onaccounting, financial control and other audit issues
• Considered and reviewed non-audit services provided by PwC and adherence to ESB policy• Met with the external auditors without management being present, giving PwC the opportunity
to raise any matters in confidence• Reviewed PwC ‘s internal control recommendations and management’s response to these
recommendations
SIGNIFICANT ISSUES CONSIDERED HOW ISSUES WERE ADDRESSED BY THE AUDIT AND RISK COMMITTEE
CARRYING VALUE OF LONG-LIVED ASSETS AND GOODWILL
Republic of Ireland (ROI) and United Kingdom (UK) generation portfolio Impairment reviews were performed on the ROI and UK generation assets where necessary to ensure the carrying values are supported by forecast future discounted cash flows. An impairment charge of €188 million with respect to the Carrington CCGT asset (UK) was necessary following this review. Further details (including details of the assumptions used) are in note 5 and note 11 of the financial statements.
Networks Transmission and Distribution long-lived assets As at 31 December 2020, there were no indicators of impairment of the carrying value of the asset base of ESB Networks (€8.4 billion), which determines the future regulated income to be earned.
Northern Ireland Electricity Networks (NIE Networks) long-lived assets and goodwillAs at 31 December 2020, there were no indicators of impairment of the carrying value of the asset base of NIE Networks (£1.6 billion), which determines the future regulated income to be earned.
Goodwill recognised in the NIE Networks business as at 31 December 2020 amounted to €169 million. Consequently, an annual impairment test of the carrying value of NIE Networks was carried out in accordance with IAS 36 and no reduction in the value of goodwill was required. The significant judgements used to carry out this test are explained fully in note 14 of the financial statements.
The Audit and Risk Committee recognises that the impairment reviews for the carrying value of assets involve a range of judgemental decisions largely related to the assumptions used to assess the value-in-use of the assets being tested.
To assist with their decision on the level of impairment charge the Audit and Risk Committee carried out the following:• Considered detailed papers prepared and presented by
the Executive Director, Group Finance and Commercial, including details of the methodologies and assumptionsapplied in determining the recoverable values including thediscount rates and market and tariff assumptions used
• Constructively challenged the assumptions andprojections presented in the papers
• Considered the sensitivity analysis provided includingscenarios with different discount rates and market andtariff assumptions
• Considered the detailed reporting from, and findings ofthe external auditors
Following the review above, the Audit and Risk Committee is satisfied with the impairment review approach and key assumptions used that the exceptional impairment charge of €188 million taken against the carrying value of the Carrington CCGT asset is appropriate. The charge is reflected in note 5 of the financial statements.
PENSION OBLIGATIONS - ESB DEFINED BENEFIT PENSION SCHEME (THE SCHEME)
In accordance with IAS 19 Employee Benefits, ESB continues to reflect its existing committed obligations on the balance sheet as set out in note 23 of the financial statements. This treatment is based on the following key factors, none of which changed for the year ended 31 December 2020.
• The Scheme is registered as a Defined Benefit Scheme with the Pensions Authority. The regulations governing the Scheme stipulate the benefits that are to be provided and they also stipulate contributions to be paid by both ESB and the contributing members.
• The Scheme is not a typical balance of costs Defined Benefit Scheme (where the employeris liable to pay the balance of contributions required to fund benefits). ESB does not intend that any further contributions, other than the normal ongoing contributions* will be made.* During the year the final payment, committed to under the terms of the 2010 PensionsAgreement was made.
• Should a deficit arise in the future, ESB is obliged under the Scheme regulations to consultwith the parties to the Scheme. However, ESB has no obligation to increase contributions to maintain benefits in the event of a deficit and its rate of contribution cannot be altered without the agreement of ESB and the approval of the Minister for the Environment, Climate and Communications.2020 UPDATE
• The Scheme Actuary confirmed during 2020 that on an actuarial basis, the Scheme’s assets were broadly in balance with its liabilities at the end of 2019. There is however currently a shortfall in a wind-up scenario in a test known as the Minimum Funding Standard (MFS). The parties to the scheme developed a plan that will facilitate the submission of a new funding plan^ to address the regulatory shortfall. As part of this plan a change to the scheme rules has been recommended to, and approved by both, the ESB Board and the Minister for Environment, Climate and Communications and it is expected that an MFS funding plan will be submitted to the Pensions Authority.
^The proposed MFS funding plan does not alter ESB's contribution rates to the Scheme as
prescribed in the Scheme Rules.
The accounting for the obligations to be reflected in the financial statements requires the exercise of judgement. The Audit and Risk Committee is satisfied that the appropriate accounting treatment, determined in accordance with IAS 19 Employee Benefits, is to reflect its existing committed obligations, as set out in the notes of the financial statements.
KEY OBJECTIVESThe role of the Audit and Risk Committee is set out in its terms of reference, a copy of which can be found on the ESB website, www.esb.ie. The Terms of Reference sets out the duties of the Audit and Risk Committee under the following headings:
FINANCIAL REPORTINGThe Audit and Risk Committee receives and
considers the interim and year-end financial
statements from management in addition to
receiving reports from the internal audit team and
discussing the audit strategy and focus of the
external auditors.
• Financial Reporting• Internal Control and Risk Management• Compliance, Whistle-Blowing and Fraud• Internal Audit• External Audit
Considering the information from these activities, the Audit and Risk Committee determined the key areas of judgement in the Group’s financial statements related to the following:
• Carrying value of long-lived assets and goodwill• Pension obligations• Asset retirement obligations
• Legal provisions and disclosures
These issues were discussed with management
during the year. The Audit and Risk Committee
reviewed and agreed the auditors’ Group audit
plan and at the conclusion of the audit of the year-
end financial statements.
102 ESB Annual Report 2020 - Brighter Together ESB Annual Report 2020 103

CO
RP
OR
ATE G
OV
ER
NA
NC
E
02
FINA
NC
IAL S
TATEM
EN
TS
03
01
STR
ATEGY
AN
D P
ER
FOR
MA
NC
E
SIGNIFICANT ISSUES CONSIDERED HOW ISSUES WERE ADDRESSED BY THE AUDIT AND RISK COMMITTEE
ASSET RETIREMENT OBLIGATIONS
ESB has provided for the expected decommissioning costs associated with the closure of certain power stations, windfarms and asset retirement obligations for the ESB Networks creosote treated wood poles in ROI. The costs are capitalised in property, plant and equipment and are depreciated over the useful economic lives of the assets to which they relate unless the related asset has reached the end of its useful life. ESB Networks, has over 2 million creosote treated poles on the network. Due to changes in the estimated price to dispose of a creosote treated wood pole and changes in the Group’s assumptions of the timeframe for the disposal of poles, the asset retirement provision increased by €129 million to €248 million. In accordance with IFRIC 1 Changes in Existing Decommissioning, Restoration and Similar Liabilities, an exceptional charge of €59.7 million has been included in the income statement in respect of the portion of the increase in the provision that relates to assets that have been fully depreciated as at 31 December 2020. In Generation and Trading the provision increased by €45 million in 2020, €30 million of this increase related to assets that had a net nil book value and was charged to the income statement. The closing provision as at 31 December 2020 is €461 million. See note 1 (iii) (c), 5 and 27 of the financial statements.
The accounting for asset retirement obligations reflected in the financial statements requires the exercise of judgement. The Committee have considered papers prepared and presented by management detailing the basis for the provisions and have considered the detailed reporting from and findings of the external auditors.
Following the review above, the Audit and Risk Committee is satisfied with the review of asset retirement obligations and the underlying basis for assumptions used and the exceptional income statement charge of €59.7 million in respect of the creosote treated wood poles and the €30 million charge in respect of decommissioning costs associated with GT assets.
LEGAL PROVISIONS RE CORK FLOODS 2009
Following on from flooding in Cork in November 2009, Aviva as University College Cork’s (UCC) insurer pursued a legal action against ESB in the High Court seeking recovery of €19 million for property damage. The High Court judgment found ESB liable for the damage caused by the flood but discounted the award to UCC by 40% to reflect UCC's contributory negligence.
ESB appealed the High Court decision and the Court of Appeal held that ESB was not liable for any damage caused to UCC's property by the flood. UCC appealed this decision to the Supreme Court who delivered its decision on 8 July 2020. The Supreme Court upheld UCC’s appeal and decided by a 4:1 majority that ESB is liable to UCC for negligence. The Court concluded that ESB has a duty of care which required it to consider the effects of a natural flood on downstream landowners when operating its dams. The Supreme Court has remitted the evaluation of the impact of its decision on the level of ESB's liability to UCC to the High Court for determination. UCC appealed the decision of the High court on contributory negligence to the Court of Appeal. The Court of Appeal decision did not address the full issue of contributory negligence but it did reverse the High court on one element of its rationale for its finding on contributory negligence. The full issue of UCC's contributory negligence was heard by the Supreme Court over two days in November 2020. The Supreme court has reserved its decision and it is expected that its judgement will be delivered in the first half of 2021.
The High Court will now determine what is the level of ESB's liability in relation to the UCC claim. In addition to the UCC claim, since the 2009 High Court judgment in the UCC case, ESB has been served with 388 sets of proceedings relating to the flooding in Cork in November 2009.
Consequently, ESB has estimated the amount of damages and related costs in respect of these claims and a provision of €95 million has been recognised. There are several uncertainties in respect of the nature and quantum of claims made and consequently as further information becomes available, this could materially impact the estimate of the provision. However, ESB does not anticipate that the total amount of damages awarded and related costs for all of the actions, including the Aviva / UCC case, will exceed its insurance cover. As at 31 December 2020, an amount of €94 million has been included in other receivables in respect of the expected reimbursement under the related insurance contracts.
The Audit and Risk Committee recognise that in relation to legal claims, judgement is necessary on the appropriate level of disclosure and provisioning.
To assist with the decision on the classification of the claim as a provision and associated other receivable, the Audit and Risk Committee carried out the following work:
• Considered both the internal and external legal advice inrelation to the case
• Considered updates by the Executive Director, Group Finance and Commercial, on the basis for the provision andthe corresponding other receivable asset, in particular the areas where judgment was required
• Challenged the views taken by management wherenecessary
• Considered the detailed reporting from, and findings of, theexternal auditors
Based on this work, the Audit and Risk Committee is satisfied that that the provision and associated other receivable is appropriately recognised in the financial statements.
The above description of significant issues considered should be read in conjunction with the Independent Auditors’ Report on pages 114 to 119 and the statement of accounting policies disclosed in note 1 of the financial statements on page 128.
• Review of the external auditors’ report• That all key events and issues reported to the
Board during the year, both positive and negative,have been adequately referenced or reflected in the Annual Report
Following its review, the Audit and Risk Committee is of the opinion that the Annual Report and Financial Statements taken as a whole, are fair, balanced and understandable and provide all the necessary information for shareholders / stakeholders to assess the Group’s performance, business model and strategy.
AUDIT AND RISK COMMITTEE EFFECTIVENESSAs part of the Board evaluation process, the operation of the Audit and Risk Committee is also evaluated. Measures taken to improve the effectiveness of the Committee during the year included: - More timely circulation of materials in advance of meetings, which gave Committee members sufficient time to prepare and allowed the Chairman to dedicate more time to question and answer and discussion at the meetings; - Sharing of Group Internal Audit reporting with the SEC Committee in relation to safety and environmental audits which enhanced oversight in these areas; - The succinctness and readability of material provided to the Committee was enhanced, and - a new format was introduced for GIA reporting which assisted Committee members in reviewing internal audit reports more effectively. The Committee also had an additional meeting to consider the potential impact of the COVID-19 pandemic on ESB.
Additionally, on annual basis, an end of year report is prepared for the Committee which reviews materials that were presented to the Committee by reference to their terms of reference and annual workplan to provide assurance that the Committee had adequate coverage of its oversight responsibilities and is delivering against its terms of reference.
EXTERNAL AUDIT
AUDIT QUALITY To maintain audit quality and provide assurance on the integrity of financial reporting, the Audit and Risk Committee reviews and challenges the proposed external audit plan, including its scope and materiality prior to approval, to ensure that the external auditors have identified the key audit risks and developed a robust approach. The Audit and Risk Committee considers the external auditors’ response to accounting, financial control and audit issues as they arise and meets with them at least once annually without management present, providing the external auditors with the opportunity to raise any matters in confidence. The Audit and Risk Committee met with PwC privately in February 2020.
DISCUSSIONS WITH EXTERNAL AUDITORS The Audit and Risk Committee has received and discussed a report from the external auditors on the findings from the audit, including those relating to
FAIR, BALANCED AND UNDERSTANDABLE At the request of the Board, the Audit and Risk Committee has considered whether, in its opinion, the Annual Report and Financial Statements taken as a whole, are fair, balanced and understandable and provide all the necessary information for shareholders / stakeholders to assess the Group’s performance, business model and strategy. Consideration is also given to whether the information is presented in a clear and concise format, avoids the use of jargon and is easily understood by the reader.
To assist in the process of supporting the fair,
the judgemental areas noted on pages 115 to 117.
After reviewing the presentations and reports from management and internal audit and considering views expressed by the external auditors, the Audit and Risk Committee is satisfied that the financial statements appropriately address critical judgements and key estimates. The Audit and Risk Committee is also satisfied that the significant assumptions used for determining the value of assets and liabilities have been appropriately scrutinised, challenged and are sufficiently robust.
Throughout the year, ESB and PwC were engaged in ongoing, open communication on current matters as and when they arose.
INDEPENDENCE The Audit and Risk Committee assesses the auditors’ independence on an ongoing basis. The Committee considers the appointment of the external auditors every five years and this process is subject to public tender. The last tender process was completed in 2016 and a new tender process will be undertaken in 2021.
Auditor independence and objectivity is safeguarded by several control measures, including:
• A limit on the nature and value of non-audit services performed by the external auditors as covered under the policy for non-audit services
• Monitoring the changes in legislation related toauditor objectivity and independence
• Confirmation from PwC that they have appropriateinternal safeguards in place that are consistent with applicable standards
• Audit partner rotation every five years• Providing opportunities to meet with the Audit and
Risk Committee privately• Annual review of the effectiveness of the external
auditors• Annual confirmation of independence by the
external auditors
The Audit and Risk Committee is satisfied that the auditors, PwC, are both independent and objective.
AUDITOR EFFECTIVENESS The effectiveness of the external auditors is reviewed annually, taking into account feedback from a questionnaire on the evaluation of the external auditors by the Audit and Risk Committee. The evaluation focuses on such areas as the robustness of the audit process, audit team, communications and governance.
A review was carried out in 2020 and overall, the Audit and Risk Committee is satisfied with the effectiveness of the external audit.
NON-AUDIT SERVICESThe Audit and Risk Committee has approved a policy on the engagement of ESB’s external auditors for non-audit services to take account of the implementation of the EU Audit Regulation and Directive on non-audit services in compliance with Statutory Instrument No 312/2016 - European Union (Statutory Audits) (Directive 2006/43/EC, as amended by Directive 2014/56/EU, and Regulation (EU) No. 537/2014) Regulations 2016 in Ireland and with the Ethical Standard for Auditors issued in April 2017 by the Irish Auditing and Accounting Supervisory Authority (IAASA).
balanced and understandable assessment statement, management prepared a report to the Audit and Risk Committee setting out the key considerations in arriving at the statement and to assist in its challenge and testing of a fair, balanced and understandable assessment.
In reaching their conclusion, the Audit and Risk Committee considered the following:
• All Board members received copies of the Annual Report and Financial Statements to review early in the reporting cycle to ensure the key messagesin the Annual Report were aligned with the Group’s position, performance and strategy and the narrative sections of the Annual Report were
The policy outlines the governance arrangements that apply to the provision of non-audit services. This policy includes a list of prohibited services, outlines the governance arrangements that apply to the provision of such permitted non-audit services. The policy includes a defined approval process and follows ESB procurement procedures and Group authority levels. As 2020 represents the fourth year of the audit engagement with PwC, the policy was updated in line with The EU Audit Regulation, which established that when a statutory auditor or an audit firm has been providing non-audit services (“NAS”) to the audited Public-Interest Entity (PIE) for a period of three or more consecutive financial years, the total fees for such services in the fourth year will be limited to a maximum of 70% of the average of the fees paid in the last three consecutive financial years for the statutory audit of the audited entity and, where applicable, of its parent undertaking, of its controlled undertakings and of the consolidated financial statements of that group of undertakings.
An update on the nature of PwC non-audit services provided and the value of such services is presented to the Audit and Risk Committee bi-annually to demonstrate that the services are in compliance with the policy and the value is within the cap.
A summary of the audit and non-audit fees paid to the external auditors is set out in note 10 of the financial statements. The primary non-audit related services provided by the external auditors during the year were in respect of permitted work on regulatory accounts and the provision of comfort letters in connection with bond issuance. PwC also provided administrative assistance directly to the ESOP in relation to the ESOP auction process.
The Audit and Risk Committee is satisfied that the fees paid in 2020 did not compromise the independence or integrity of the external auditors. The Committee will continue to monitor the type and level of services provided to prevent any perceived or actual impact on auditors’ independence.
MEETINGSThe internal and external auditors have full and unrestricted access to the Audit and Risk Committee. The Audit and Risk Committee Chairman reports the outcome of its meetings to the Board. Meetings, or part thereof, are routinely attended by the Board Chairman, Chief Executive and/or Deputy Chief Executive, Executive Director, Group Finance and Commercial, Head of Group Internal Audit, Group Compliance Manager and representatives of the external auditors. Committee-only sessions are arranged at the beginning/end of meetings, as determined by the Audit and Risk Committee Chairman.
On behalf of the Audit and Risk Committee
Noreen O’Kelly, CHAIRMAN, AUDIT AND RISK COMMITTEE
26 February 2021
consistent with the financial statements • That a robust process was put in place by
management for the preparation of the AnnualReport and Financial Statements for the year ended 31 December 2020, including early planning, taking into consideration regulatory changes and best practice
• Clear linkages to the strategic objectives areprovided throughout the report
• That the key performance indicators (KPIs) used and reported in the Annual Report are consistent with those provided by management to the Boardthroughout the year
• Review of data and information included in theAnnual Report by internal audit
104 ESB Annual Report 2020 - Brighter Together ESB Annual Report 2020 105

CO
RP
OR
ATE G
OV
ER
NA
NC
E
02
FINA
NC
IAL S
TATEM
EN
TS
03
01
STR
ATEGY
AN
D P
ER
FOR
MA
NC
E
MEMBERS DESIGNATIONLENGTH OF SERVICE
MEETINGS ATTENDED
Anne Butler (Chairman)
Independent Board Member
5 years and 3 months
6
Paul Lynam Independent Board Member
4 years 6
Pat O’Doherty Chief Executive 9 years and 1 month 6Stephen Carrig Worker Board Member 2 years 6
MEMBERS DESIGNATIONLENGTH OF SERVICE
MEETINGS ATTENDED
Andrew Hastings (Chairman)
Independent Board Member
5 years and 3 months 8
Dave Byrne Worker Board Member
7 years and 9 months 9
Seán Kelly Worker Board Member
5 years and 3 months 9
Paul Lynam Independent Board Member
4 years 9
Pat O’Doherty Chief Executive 7 years and 9 months 9Noreen O’Kelly Independent Board
Member5 years and 3 months 9
MEMBERS DESIGNATIONLENGTH OF SERVICE
MEETINGS ATTENDED
Terence O’Rourke, (Chairman)Ellvena Graham OBE*
Chairman
Chairman
2 months
8 years and 7 months
-
3
Andrew Hastings Independent Board Member
5 years and 3 months
3
Noreen WrightIndependent Board Member
9 years 3
*Ellvena Graham OBE retired in July 2020
MEMBERS DESIGNATIONLENGTH OF SERVICE
MEETINGS ATTENDED
Alf Smiddy (Chairman)
Independent Board Member
4 years 4
Anne Butler Independent Board Member
4 years 4
Tony Merriman Worker Board Member
4 years 4
Pat O’Doherty Chief Executive 4 years 4KEY ACTIVITIES OF THE SAFETY, ENVIRONMENT AND CULTURE COMMITTEE IN 2020
Duty Examples of activity
Safety, Health and Environment
Reviewed and considered: • Group safety KPIs• Group environment policy• ESB Networks Environment update• ·Safe and Sound Driving’ update• Environmental incident updates• ESB Group safety, health and environment (SHE) strategy 2020-2025
• Developments in ESG reporting• COVID-19 update and activities initiated to protect staff• Sustainability annual report• Environment and Sustainability update• Health and wellbeing update on mental health support for staff• Group safety policy• ESB safety incidents• External environmental review• Key safety risk updates including lost time injuries, highpotential incidents, near-misses and good catches
• Update on ESB Environmental risk register• Fisheries update• Waste management update• Annual DAM safety review• ESB Networks Annual Environment Report to Commissionfor Regulation of Utilities (CRU)
Culture and Diversity
Reviewed and considered: • Diversity and Inclusion Strategy• Update on development of cultural dashboard
KEY ACTIVITIES OF THE FINANCE AND INVESTMENT COMMITTEE IN 2020
Duty Examples of activity
Investments and Capital Expenditure
Reviewed and recommended to the Board (where applicable):
• Renewable investments (offshore wind and solar)• Major property disposals• Update on major IT system upgrade• Generation plant overhaul programmes• ESB Networks regulatory Price Review 5 (PR5) submission
and progress updates• Quarterly Capex reports• Smart metering updates• Battery energy framework• IT Framework agreement• Generation investments business case realisation review• Tilbury waste energy plant (UK) updates• Telecoms sales contract• Investment hurdle rates• Group Insurance review
Financial Performance
Reviewed and recommended to the Board (whereapplicable):• 2021 budget and the five-year business plan• Quarterly financial performance updates• COVID-19 Financial impact assessment and updates• ESB Energy (GB) business plan• ESB dividend policy and payments• Equity valuation
Funding Reviewed and recommended to the Board (whereapplicable):• Update on RPI swaps• Credit rating update• ESB Funding requirements• Sustainable Revolving Credit Facility (RCF)• Loans, Swaps and Bonds Report
Energy Markets and Trading
Reviewed and considered:• Energy markets and energy strategy• Energy trading and risk management• Capacity auction updates
KEY ACTIVITIES OF THE REMUNERATION AND MANAGEMENT DEVELOPMENT COMMITTEE IN 2020
Duty Examples of activity
Keep under review senior management succession and development plans
• Review of succession planning and leadership competencies• Review of Senior management appointments• Review of Chief Executive and Executive Director career andpersonal development plans
Approve senior management salary and per-formance pay
• Reviewed executive remuneration benchmarks• Reviewed performance against 2019 target• Review 2020 performance targets agreed with the Chief Executive
Agree with the Chief Executive his specific annual perfor-mance targets
• Reviewed performance against 2019 targets• Set 2020 performance targets
Determine the remuneration packages for ESB’s Executive Team
• Reviewed and approved remuneration packages for theExecutive Team
KEY ACTIVITIES OF THE CUSTOMER, MARKETING AND INNOVATION COMMITTEE IN 2020
Duty Examples of activity
Customer Reviewed and considered:• ESB Networks customer update• Customer solutions marketing strategy review• Customer impact of COVID-19• ESB energy update• ESB Networks experience update• Update on impact of ‘Brighter Together’ campaign• Residential marketing campaign
Reputa-tional and Stakeholder Management
Received an update on: • Winter storm preparations• ESB reputation survey update• Electric Ireland reputation update
Innovation and Technology
Reviewed and considered:• ESB digital strategy review• Electric vehicles (Ecars) business performance update• Smart Energy Services business performance update• ESB Telecoms update• ESB innovation strategy• Update on innovation pipeline in respect of start-upcompanies (‘Free Electrons’ update)
Each Board Committee has its terms of reference reviewed and approved by the Board annually. Terms of reference of all committees are available on the 'Governance' section of the ESB website, www.esb.ie or upon request from the Company Secretary.
At the start of 2020, the Committees name was changed from the Health, Safety and Environment Committee to the Safety, Environment and Culture Committee and its scope was revised to better support the Board in providing oversight on culture, corporate social responsibility, employee engagement and wellbeing and diversity/inclusion in ESB.
ROLE: The Safety, Environment and Culture Committee responsibilities are set out in its terms of reference. The Committee Chairman meets as required with the Chairman of the Audit and Risk Committee to agree and update as appropriate the specific risk responsibilities of the Safety, Environment and Culture Committee.
COMMITTEE MEETINGS The Committee held 6 meetings during 2020. The members of the Committee, length of service and the number of meetings attended are set out below:
See pages 72 to 79 for further information on Health, Safety and Environment in 2020 as set out in the Responsible Business Report Section.
ROLE: The Finance and Investment Committee’s responsibilities are set out in its terms of reference.
COMMITTEE MEETINGS The Committee held 9 meetings during 2020. The members of the Committee, length of service and the number of meetings attended are set out below:
Anne Butler, CHAIRMAN Andrew Hastings, CHAIRMAN
BOARD COMMITTEES IN 2020
Safety, Environment and Culture Committee
Finance and Investment Committee
ROLE: The Remuneration and Management Development Committee’s responsibilities are set out in its terms of reference, which were reviewed in 2020.
COMMITTEE MEETINGS The Committee held 3 meetings during 2020. The members of the Committee, length of service and the number of meetings attended are set out below:
At the start of 2020, the Committees name was changed from the Marketing and Customer Committee to the Customer, Marketing and Innovation Committee. The Customer will continue to be a key focus of the Committee and given the importance of stakeholder management/reputation, the pace of change resulting from rapid digital developments and the emphasis in the Brighter Future Strategy on innovation, the name of the Committee and its terms of reference were revised to better support the Board in these areas.
ROLE: The Marketing and Customer Committee’s responsibilities are set out in its Terms of Reference.
COMMITTEE MEETINGS The Committee held 4 meetings during 2020. The members of the Committee, length of service and the number of meetings attended are set out below:
Terence O’Rourke, CHAIRMAN Alf Smiddy, CHAIRMAN
Remuneration and Management Development Committee
Customer, Marketing and Innovation Committee
106 ESB Annual Report 2020 - Brighter Together ESB Annual Report 2020 107

CO
RP
OR
ATE G
OV
ER
NA
NC
E
02
FINA
NC
IAL S
TATEM
EN
TS
03
01
STR
ATEGY
AN
D P
ER
FOR
MA
NC
E
and is now recommending a final dividend for 2020 of 4.13 cent per unit of stock, or €80.8 million. This would bring the total dividends paid over the past decade to €1.2 billion.
SHARE CAPITAL An Employee Share Ownership Plan (ESOP) market liquidity proposal was approved by ESB’s Board in 2015. ESB approved the expenditure of up to €25 million to acquire capital stock in internal ESOP markets, commencing in 2017, with the objective of improving liquidity in the market. This expenditure commitment by ESB matched the expenditure committed by the ESOP Trustee under the proposal. ESB purchased and cancelled capital stock worth €8.4 million in 2020 (2019: €4.6 million). Further details are outlined in notes 19 and 31. Details of ESB’s share capital are outlined in note 19 of the financial statements.
FUTURE DEVELOPMENTS ESB is a strong diversified, vertically integrated utility operating right across the electricity, gas and energy services markets: from generation, through transmission and distribution to supply of customers, with an expanding presence in the GB market. The Strategy to 2030 is designed to ensure that ESB continues to grow as a successful business while maintaining the financial strength to invest in a low-carbon future at the necessary scale and pace (see pages 16 to 21 for more information).
PRINCIPAL RISKS AND UNCERTAINTIES A description of the principal risks and uncertainties facing ESB is set out in the Risk Report on pages 24 to 39.
FINANCIAL INSTRUMENTS The financial risk management objectives and policies of ESB along with a description of the use of financial instruments is set out in note 28 of the financial statements.
ACCOUNTING RECORDS The Board members believe that they have employed accounting personnel with appropriate expertise and provided adequate resources to the financial function to ensure compliance with ESB’s obligation to keep proper books of account. The books of account of ESB are held at Two Gateway, East Wall Road, Dublin 3.
during the previous financial year to ensure that slavery and human trafficking is not operating within either its own business or its supply chains. ESB carried out on-site audits of contractors during the year and risk screening of its suppliers. Based on this, a number of site based supplier audits were commissioned and completed. The most recent Annual Statement was published in May 2020 and is available on the ESB website www.esb.ie. ESB's assessment of human rights and equality issues it believes to be relevant to its functions and policies, plans and actions in place or proposed to be put in place to address the issues in compliance with Section 42 (5) of the Irish Human Rights and Equality Commission Act 2014 will be published separately on ESB's website.
ANTI-BRIBERY, CORRUPTION AND FRAUD ESB has a detailed Anti-bribery, corruption and fraud policy in place, which outlines the standards of behaviour expected of staff in how they work and to promote controls to prevent, deter and detect bribery, corruption and fraud. ESB has a zero-tolerance approach to bribery, corruption and fraud. During 2020 there were no instances of bribery or corruption. Incidents or attempted incidents of fraud are reported to the Audit and Risk Committee on a quarterly basis. The policy is available on the ESB website, www.esb.ie.
ENVIRONMENT AND SUSTAINABILITY Climate change and degradation of our environment resulting in biodiversity loss are the two biggest issues facing humanity. ESB’s Brighter Future Strategy commits to leadership in the transition to low carbon energy and to sustainability. Sustainability in its fullest sense includes carrying out business operations responsibly and with care for the impact on the environment. In 2020 ESB updated its Environment and Sustainability policy; which sets out the high-level principles to guide progress towards these goals. This includes compliance with all relevant statutory and regulatory laws and the achievement of ESB’s low-carbon targets in all parts of the business. ESB discloses its full direct and indirect carbon emissions annually and, in 2020, worked to integrate a range of climate best practices into its business operations. Environmental management systems are operated throughout the company. ESB
The Board members present their report together with the audited financial statements of ESB and of the Group for the year ended 31 December 2020.
PRINCIPAL ACTIVITIESThe principal activities of ESB are the generation, transmission, distribution and supply of electricity, gas, and energy services in the Republic of Ireland (ROI) and Northern Ireland (NI). ESB also operates internationally, in generation and supply of electricity in Great Britain (GB) and is involved in several engineering consultancy projects in Asia and Africa.
ESB ANNUAL GENERAL MEETING (AGM) ESB holds an AGM each year, no later than 15 months after the last AGM. With the restrictions imposed by the COVID-19 pandemic, the 2020 AGM was held virtually on 24 June 2020. The Chairman gave an overview of the year and invited representatives of the Ministerial stockholders and of the Trustee of the ESB ESOP to make any comments they may have. The external auditors attended the AGM.
BUSINESS REVIEWCommentaries on performance in the year ended 31 December 2020, including information on recent events and potential future developments, are contained in the Chairman’s Statement and the Chief Executive’s Review. The performance of the business (including the impact of the COVID-19 pandemic) and its financial position and the principal risks faced by ESB are reflected in the reviews for each major business unit on pages 58 to 67, the Financial Review on pages 52 to 57 and the Risk Report on pages 24 to 39.
RESULTS AND DIVIDEND FOR THE YEAR The financial results of ESB show a profit after tax before exceptional items of €357 million for the financial year 2020, compared with a profit of €419 million for 2019. Profit after tax and exceptional items is €126 million (2019: profit of €338 million). The dividend policy agreed with the Government in 2013 provides for targeted dividends at a rate of 40% of adjusted profit after tax since 2017. The Board did not declare an interim dividend during 2020
REPORT UNDER SECTION 22 OF THE PROTECTED DISCLOSURES ACT 2014 Section 22 of the Protected Disclosures Act 2014 requires ESB to publish an annual report relating to protected disclosures made under the Protected Disclosures Act 2014. In accordance with this requirement, ESB confirms that one protected disclosure was made to ESB in 2020. The matter concerned an employee of a contracting company providing services to ESB and was investigated.
REGULATION OF LOBBYING ACT 2015In accordance with the requirements of the Regulation of Lobbying Act, ESB is registered on the Lobbying Register at www.lobbying.ie and has made the required return for the period 1 January to 31 December 2020.
HUMAN RIGHTS (INCLUDING PROTECTION AGAINST MODERN SLAVERY)ESB is committed to respecting all internationally recognised human rights including those expressed in the International Bill of Human Rights and the principles concerning fundamental rights set out in the International Labour Organization’s Declaration on Fundamental Principles and Rights at Work.
Modern slavery is a criminal offence under the UK Modern Slavery Act 2015. The Act imposes obligations on organisations of a certain size, which carry on a business in the United Kingdom. Modern slavery can occur in various forms, including servitude, forced and compulsory labour and human trafficking, all of which have in common the deprivation of a person’s liberty by another in order to exploit them for personal or commercial gain. ESB maintains policies and operates internal programmes and training on diversity and inclusion as well as modern employee relations and grievance processes. ESB's employee Code of Ethics requires all employees to operate fairly and respect all human rights. As the parent of a number of subsidiary companies with significant operations in the UK, ESB has adopted a policy on modern slavery with the aim of preventing opportunities for modern slavery occurring within its business and supply chains. In accordance with the Act, ESB publishes an Annual Statement setting out the steps that ESB has taken
became a CDP 'A' list company in 2020 based on its adoption of climate action best practices. Information on ESB’s approach to Environment and Sustainability (including Corporate Social Responsibility (CSR) activities) is set out on pages 70 to 79.
ELECTORAL ACT 1997 The Board made no political donations during the year.
PRINCIPAL SUBSIDIARY, JOINT VENTURE AND ASSOCIATED UNDERTAKINGS Details of the principal subsidiary, joint venture and associated undertakings are outlined in note 34 of the financial statements.
PROMPT PAYMENTS REGULATIONThe Board acknowledges its responsibility for ensuring compliance, in all material respects, with the provisions of the Prompt Payment of Accounts Act, 1997 and European Communities (Late Payments in Commercial Transactions) Regulations, 2012 (S.I. No. 580 of 2012) as amended by European Communities (Late Payment in Commercial Transactions) (Amendment) Regulations 2016 (S.I. No. 281 of 2016) 2002. The Board is satisfied that ESB has complied with the requirements of the Regulations.
RELATED PARTY TRANSACTIONSRelated party transactions are set out in note 30 of the financial statements.
RESEARCH AND DEVELOPMENT ESB’s business is involved in innovative projects and programmes to develop the energy sector. A number of these projects and programmes are referred to in the Strategy and Performance Section on pages 6 to 67.
STATEMENT UNDER SECTION 330 OF THE COMPANIES ACT 2014 The ESB Regulations require ESB to observe the provisions of the Companies Act 2014 applying to a Companies Act entity regarding audit and/or auditors. This requires the Board members to make a statement in the form required by Section 330 of the 2014 Act. In
compliance with this requirement, the Board confirms that it applies the standards in Section 330 of the Companies Act 2014 and, in this regard, each of the Board members confirms that:
• so far as the Board member is aware, there isno relevant audit information of which ESB’sstatutory auditors are unaware
• each Board member has taken all the stepsthat he or she ought to have taken as a Boardmember in order to make himself or herselfaware of any relevant audit information andto establish that ESB’s auditors are awareof that information (within the meaning ofSection 330).
AUDIT AND RISK COMMITTEE ESB has an Audit and Risk Committee, the members of which are set out on page 101.
AUDITORS PwC were appointed as ESB’s auditors for the 2021 financial year at the AGM held in 2020, in accordance with Section 7(2) of the Electricity (Supply) Act 1927 (as amended).
At the 2021 AGM, the shareholders will be asked to authorise the directors to fix the remuneration of the auditors in respect of the year ended 31 December 2021.
APPROVAL OF THE 2020 ANNUAL REPORT AND FINANCIAL STATEMENTSThe Board is satisfied, after considering the recommendation of the Audit and Risk Committee that the Annual Report and Financial Statements taken as a whole, are fair, balanced and understandable.
Terence O’RourkeCHAIRMAN
Pat O’Doherty, CHIEF EXECUTIVE
26 February 2021
BOARD MEMBERS' REPORT
108 ESB Annual Report 2020 - Brighter Together ESB Annual Report 2020 109

STR
ATEGY
AN
D P
ER
FOR
MA
NC
E
01
CO
RP
OR
ATE G
OV
ER
NA
NC
E
02
FINA
NC
IAL S
TATEM
EN
TS
03
FINANCIAL STATEMENTS
113 Statement of Board Member's Responsibilties 114 Independent Auditor's Report to
the Stockholders of Electricity Supply Board128 Financial Statements212 Prompt Payments Act
110 ESB Annual Report 2020 - Brighter Together ESB Annual Report 2020 111

STR
ATEGY
AN
D P
ER
FOR
MA
NC
E
01
CO
RP
OR
ATE G
OV
ER
NA
NC
E
02
FINA
NC
IAL S
TATEM
EN
TS
03
112 ESB Annual Report 2020 - Brighter Together ESB Annual Report 2020 113
The Board members are responsible for preparing the annual report, incorporating financial statements for ESB (the Parent) and for ESB Group comprising ESB
and its subsidiaries “the Group”.
Under ESB’s governing regulations, adopted pursuant to Section 6(1) of the Electricity (Supply) Act 1927(as amended) “the ESB Regulations”, the Board is
required to prepare financial statements as are required by companies established under the Companies Act 2014. The preparation of financial statements in
this form satisfies the obligations imposed on the Board (in relation to the keeping of books of account) by Section 7 of the Electricity (Supply) Act 1927(as
amended) and by the Business and Financial Reporting Section of the Code of Practice for the Governance of State Bodies (2016).
ESB is also required, to furnish its annual report, which incorporates the financial statements, to the Minister for Communications, Climate and Environment in
accordance with corporate governance guidelines and to meet its obligations under Section 32 of the Electricity (Supply) Act 1927 (as amended), to make to the
Minister a report of its proceedings during the preceding year.
The Board has elected to prepare ESB’s financial statements in accordance with IFRS as adopted by the European Union and as applied in accordance with the
applicable provisions of the Companies Act 2014 and the ESB Regulations.
The Board members must not approve the financial statements unless they are satisfied that they give a true and fair view of the assets, liabilities and financial
position of the Group and of ESB and of the Group’s profit or loss for that year.
In preparing the financial statements the Board members are required to:
• Select suitable accounting policies and then apply them consistently
• Make judgements and estimates that are reasonable and prudent;
• State that the financial statements comply with IFRS as adopted by the European Union, and as regards ESB, as applied in accordance with the Companies
Act 2014; and
• Prepare the financial statements on the going concern basis unless it is inappropriate to presume that the Group and ESB will continue in business.
The Board members are responsible for keeping adequate accounting records which disclose with reasonable accuracy at any time the assets, liabilities,
financial position and profit or loss of ESB, and which enable them to ensure that the financial statements of ESB and the Group are prepared in accordance with
applicable IFRS as adopted by the European Union and as applied in accordance with applicable provisions of the Companies Act 2014 and ESB Regulations.
The Board Members are also responsible for safeguarding the assets of ESB and the Group, and hence for taking reasonable steps for the prevention and
detection of fraud and other irregularities.
The Board members are responsible for the maintenance and integrity of the corporate and financial information included on the Group’s and ESB’s website
www.esb.ie. Legislation in the Republic of Ireland governing the preparation and dissemination of financial statements may differ from legislation in other
jurisdictions.
Each of the Board members, confirm that, to the best of each person’s knowledge and belief:
• The Group financial statements, prepared in accordance with IFRS as adopted by the European Union and ESB's financial statements prepared in accordance
with IFRS as adopted by the European Union as applied in accordance with the provisions of Companies Act 2014 and as applied by the ESB Regulations,
give a true and fair view of the assets, liabilities, financial position of the Group and of ESB at 31 December 2020 and of the profit of the Group for the year
then ended 31 December 2020;
• The Board members’ report contained in the annual report includes a fair review of the development and performance of the business and the position of the
Group and ESB, together with a description of the principal risks and uncertainties that they face; and
• The annual report and financial statements, taken as a whole, provides the information necessary to assess the Group’s performance, business model and
strategy and is fair, balanced and understandable and provides the information necessary for shareholders to assess ESB's position and performance, business
model and strategy.
On behalf of the Board
Terence O’Rourke, Chairman
Pat O’Doherty, Chief Executive
STATEMENT OF BOARD MEMBERS’ RESPONSIBILITIES
Notes To The Financial Statements
1 Statement of Accounting Policies 1282 Segment Reporting 1413 Revenue from Contracts with Customers 1434 Geographical Information 1445 Exceptional Items 1446 Other Operating Income / (Expenses) 1457 Operating Costs (including Net Impairment Losses on Financial Assets) 1458 Net Finance Cost and Other Financing Charges 1469 Employees 14710 Profit for the Financial Year 14811 Property, Plant and Equipment 14912 Intangible Assets 15213 Right-of-use assets and lease libilities 15414 Goodwill 15615 Financial Asset Investments at Fair Value through Profit or Loss and Equity Accounted Investees 15716 Inventories 16117 Trade and Other Receivables 16118 Cash and Cash Equivalents 16519 Changes in Equity 16520 Taxation 16721 Borrowings and Other Debt 17122 Derivative Financial Instruments 17723 Pension Liabilities 18224 Liability – ESB Pension Scheme and Employee Related Liabilities 18625 Trade and Other Payables 18726 Deferred Income 18727 Provisions 18828 Financial Risk Management and Fair Value 19029 Commitments and Contingencies 20430 Related Party Transactions 20431 ESB ESOP Trustee Limited 20632 Post Balance Sheet Events 20633 Approval of Financial Statements 20634 Subsidiary, Equity Accounted Investees and Associate Undertakings 207
Statement of Board Members’ Responsibilities 113Independent Auditor’s Report to the Stockholders of Electricity Supply Board (ESB) 114
Financial Statements
Group Income Statement 120Group Statement of Comprehensive Income 121Group Balance Sheet 122Parent Balance Sheet 123Group Statement of Changes in Equity 124Parent Statement of Changes in Equity 125Group Cash Flow Statement 126Parent Cash Flow Statement 127
CONTENTS

STR
ATEGY
AN
D P
ER
FOR
MA
NC
E
01
CO
RP
OR
ATE G
OV
ER
NA
NC
E
02
FINA
NC
IAL S
TATEM
EN
TS
03
114 ESB Annual Report 2020 - Brighter Together ESB Annual Report 2020 115
The scope of our audit
As part of designing our audit, we determined materiality and assessed the risks of material misstatement in the financial statements. In particular, we looked
at where the Board members made subjective judgements, for example in respect of significant accounting estimates that involved making assumptions and
considering future events that are inherently uncertain. As in all of our audits we also addressed the risk of management override of internal controls,
including evaluating whether there was evidence of bias by the Board members that represented a risk of material misstatement due to fraud.
Key audit matters
Key audit matters are those matters that, in the auditors’ professional judgement, were of most significance in the audit of the financial statements of the
current period and include the most significant assessed risks of material misstatement (whether or not due to fraud) identified by the auditors, including
those which had the greatest effect on: the overall audit strategy; the allocation of resources in the audit; and directing the efforts of the engagement
team. These matters, and any comments we make on the results of our procedures thereon, were addressed in the context of our audit of the financial
statements as a whole, and in forming our opinion thereon, and we do not provide a separate opinion on these matters. This is not a complete list of all
risks identified by our audit.
REPORT ON THE AUDIT OF THE FINANCIAL STATEMENTS
OPINION
In our opinion, ESB’s Group financial statements and Parent financial statements (the “financial statements”):
• give a true and fair view of the Group’s and the Parent’s assets, liabilities and financial position as at 31 December 2020 and of the Group’s profit and the
Group’s and the Parent’s cash flows for the year then ended;
• have been properly prepared in accordance with International Financial Reporting Standards (“IFRSs”) as adopted by the European Union and, as regards the
Parent’s financial statements, as applied in accordance with the provisions of the Companies Act 2014; and
• have been properly prepared in accordance with the requirements of the Companies Act 2014, as applied by the ESB Acts 1927 to 2014.
We have audited the financial statements, included within the Annual Report and Financial Statements (the "Annual Report"), which comprise:
• the Group and Parent Balance Sheets as at 31 December 2020;
• the Group Income Statement and Group Statement of Comprehensive Income for the year then ended;
• the Group and Parent Cash Flow Statements for the year then ended;
• the Group and Parent Statements of Changes in Equity for the year then ended; and
• the Notes to the financial statements, which include a description of the significant accounting policies.
BASIS FOR OPINION
We conducted our audit in accordance with International Standards on Auditing (Ireland) (“ISAs (Ireland)”) and applicable law. Our responsibilities under
ISAs (Ireland) are further described in the Auditors’ responsibilities for the audit of the financial statements section of our report. We believe that the audit
evidence we have obtained is sufficient and appropriate to provide a basis for our opinion.
Independence
We remained independent of the Group in accordance with the ethical requirements that are relevant to our audit of the financial statements in Ireland,
which includes IAASA’s Ethical Standard and we have fulfilled our other ethical responsibilities in accordance with these requirements.
OUR AUDIT APPROACH
Overview
Materiality
• €21 million (2019: €25 million) - Group financial statements
Based on c. 5% of profit before tax and exceptional items. We consider this to be an appropriate benchmark as the Group is profit orientated and the
exceptional items are significant non-recurring items which are not reflective of the Group’s ongoing trading activity.
• €21 million (2019: €25 million) - Parent financial statements
We considered it appropriate to restrict materiality for the Parent financial statements to €21 million, being that applied to the Group financial
statements.
Audit scope
We conducted our work across the four reportable segments and the head office function. Our audit work covered in excess of 90% of Group revenues,
profit before taxation and exceptional items, total assets and total liabilities.
Key audit matters
• Carrying value of Long-Lived Assets
• Completeness of Pension Obligations
• Revenue Recognition – Unbilled Electric Ireland Revenue
• Asset Retirement Obligations
INDEPENDENT AUDITORS' REPORT TO STOCKHOLDERS OF ELECTRICITY SUPPLY BOARD (ESB) (continued)
INDEPENDENT AUDITORS' REPORT TO STOCKHOLDERS OF ELECTRICITY SUPPLY BOARD (ESB)
Key audit matter How our audit addressed the key audit matter
Carrying value of Long-Lived Assets
Refer to page 103 (Report of the Audit & Risk Committee), notes 1(viii), (ix) and (x) (Statement of Accounting Policies) and notes 5 and 11 to the financial statements
The carrying value of ESB’s property, plant and equipment and intangible assets is €11.5 billion, most of which are long-lived assets designed to deliver a return over 20+ years. The Group is required to assess at the end of each reporting period whether there is any indication that an asset may be impaired. If any such indication exists, the Group is required to perform impairment testing.
The ongoing pressure on energy margins in the UK and lower forecasted demand increases the overall risk in respect of UK thermal assets.
As set out in Note 5, the Group recognised an exceptional impairment charge of €187.6 million in respect of the Carrington thermal asset.
As a result of these factors, the assessment of the carrying value of the Carrington Combined Cycle Gas Turbine (‘CCGT’) plant was a key area of audit focus.
The carrying value of ISEM CCGT assets was also a key area of audit focus due to lower forecasted electricity margins over the asset lives.
The Group’s assessment of the carrying value of these assets involves significant judgement in estimating the inputs to discounted cash flow models used to assess the recoverable amount of these assets, including assumptions in respect of future electricity prices, capacity income, future fuel costs, expected plant running (load factors), discount rates, inflation and plant closure dates.
We focused our audit effort on those thermal generation assets where there was a risk of impairment and on those electricity generation assets where management had identified and recorded an impairment based on the impairment testing performed.
We evaluated management’s assessment of those thermal generation assets which were impaired and those that were potentially impaired by evaluating the critical assumptions in the future cash flow forecasts and considering the overall level of headroom and carrying value of the individual cash generating units.
We obtained an understanding of management’s approach to determining the key assumptions in the impairment models, including comparing them to the latest Board approved business plan. Where there was independent source data, we compared this to the inputs to the models and understood management’s basis for the judgements made in the models. For inputs with no observable data we considered these and challenged management’s assumption in the context of available internal data, including historical data and budget information.
We considered the appropriateness of the discount rates used in the impairment models by assessing the assumptions used in the weighted average cost of capital against external benchmarks. We challenged management on basis of changes in assumptions in comparison to prior year models and were satisfied that these changes were appropriate in the circumstances. We also performed sensitivity analysis to potential changes in key assumptions in the year end models and considered the likelihood of such changes arising.
Based on our procedures we were satisfied that the impairment charges are appropriate.
We also considered the disclosures in the financial statements in relation to these matters.

STR
ATEGY
AN
D P
ER
FOR
MA
NC
E
01
CO
RP
OR
ATE G
OV
ER
NA
NC
E
02
FINA
NC
IAL S
TATEM
EN
TS
03
Group financial statements Parent financial statements
Overall materiality €21 million (2019: €25 million) €21 million (2019: €25 million)
How we determined it c.5% of profit before tax and exceptional items. Based on Group materiality.
Rationale for benchmark applied
We consider that profit before tax and exceptional items is an appropriate benchmark as the Group is profit orientated and the exceptional items are significant non-recurring items which are not reflective of the Group’s ongoing trading activity.
We considered it appropriate to restrict materiality for the Parent financial statements to €21 million, being that applied to the Group financial statements.
We agreed with the Audit Committee that we would report to them misstatements identified during our audit above €500,000 in respect of the Group and Parent audit as well as misstatements below that amount that, in our view, warranted reporting for qualitative reasons.
Conclusions relating to going concern Our evaluation of the Board members’ assessment of the Group and Parent’s ability to continue to adopt the going concern basis of accounting included:- Obtaining an understanding, evaluating and comparison to approved budgets of the assumptions underpinning the Board members’ going concern assessment;- Consideration of available liquidity as set out in Notes 18 and 21 of the financial statements; - Reading and considering the key terms of revolving credit facility agreements to confirm their availability;- Consideration of the overall headroom in the going concern assessment; and - Evaluation of the disclosures in the financial statements and their consistency with the underlying assessment made by the Board members.
116 ESB Annual Report 2020 - Brighter Together ESB Annual Report 2020 117
INDEPENDENT AUDITORS' REPORT TO STOCKHOLDERS OF ELECTRICITY SUPPLY BOARD (ESB) (continued)
How we tailored the audit scopeThe Group is structured across four key reportable segments and the head office function. We determined that there are five reporting components, four in the Republic of Ireland and one in Northern Ireland.
We tailored the scope of our audit to ensure that we performed sufficient work to be able to give an opinion on the financial statements as a whole, taking into account the structure of the Group, the accounting processes and controls, and the industry in which the Group operates.
Our audit work covered in excess of 90% of Group revenues, profit before taxation and exceptional items, total assets and total liabilities. All of the required audit work in respect of the four reporting components in the Republic of Ireland was performed by the Group team.
Under instruction from the Group team, our network firm in Northern Ireland performed an audit of the NIE Networks segment. We determined the level of involvement we needed to have in their audit work to be able to conclude whether sufficient appropriate audit evidence had been obtained as a basis for our opinion on the Group financial statements as a whole. We had regular communications and discussions with our Northern Ireland team throughout the audit process. We received a detailed memorandum of examination on work performed and relevant findings in addition to an audit report which supplemented our understanding of the segment.
MaterialityThe scope of our audit was influenced by our application of materiality. We set certain quantitative thresholds for materiality. These, together with qualitative considerations, helped us to determine the scope of our audit and the nature, timing and extent of our audit procedures on the individual financial statement line items and disclosures and in evaluating the effect of misstatements, both individually and in aggregate on the financial statements as a whole.
Based on our professional judgement, we determined materiality for the financial statements as a whole as follows:
INDEPENDENT AUDITORS' REPORT TO STOCKHOLDERS OF ELECTRICITY SUPPLY BOARD (ESB) (continued)Key audit matter How our audit addressed the key audit matter
Completeness of Pension Obligations
Refer to page 103 (Report of the Audit & Risk Committee), note 1 (xix) (Statement of Accounting Policies) and note 23 to the financial statements
As set out in Note 23 to the financial statements, the regulations governing the “ESB Defined Benefit Scheme” stipulate the benefits that are to be provided and the contributions to be paid by both ESB and the contributing members.
ESB has determined that its legal and/or constructive obligations in respect of contributions payable by it to the ESB Defined Benefit Scheme Fund are limited to the amounts provided for in the Scheme Rules, namely, the normal ongoing contributions and the contribution which was committed by ESB under the 2010 Pensions agreement.
As set out in Note 23, the Defined Benefit Pension Scheme is not a typical “balance of costs” scheme where the employer is liable to pay the balance of contributions required to fund benefits.
We determined this to be a key audit matter as there has been a high level of complexity and judgement involved in the interpretation of the Scheme rules and the determination of the related accounting and adequacy of disclosures in the financial statements.
We updated our understanding of ESB’s assessment of their obligations in respect of the ESB Defined Benefit Scheme and considered the continued appropriateness of the accounting treatment in the context of IAS 19 “Employee Benefits”.
We made enquiries of senior management and internal legal counsel and read the board minutes, internal documentation and correspondence for the year to confirm that there had been no changes to the Group’s position or commitments made to employees since 31 December 2019.
We received a representation from the Board that ESB do not intend to make any further payments to the Scheme other than the contribution which was committed by ESB under the 2010 Pensions agreement, and fixed continuing ongoing contributions of scheme members’ salaries.
We considered the change to the Scheme Rules approved during the year by the ESB Board and the Minister for Environment, Climate and Communications as part of the plan to address the Minimum Funding deficit.
ESB has informed us that the Defined Benefit Pension Scheme is not a typical “balance of costs” scheme where the employer is liable to pay the balance of contributions required to fund benefits.
The accounting treatment and disclosures in the financial statements reflects this position.
Revenue Recognition - Unbilled Electric Ireland Revenue
Refer to note 1 (xx) (Statement of Accounting Policies) and note 17 to the financial statements
Unbilled revenue is the revenue from energy supplied to the customer between the date of their last bill and the year end date and requires estimation.
In determining the unbilled revenue at the year end, volumes are estimated by reference to electricity volume purchases and other assumptions.
In Electric Ireland, given the size of the customer base, estimates used in determining the values attributable to these volumes in the Republic of Ireland are material to the financial statements.
There is also significant complexity in the models used to estimate unbilled revenue at year end. Additional estimates were required for the current year as a result of the need to estimate the impact of COVID 19 on the consumption patterns in the residential and small business markets.
We determined this to be a key audit matter given the level of complexity and estimates involved in determining the unbilled revenue at year end.
We assessed the IT general controls system application configuration and the business process controls in relation to revenue estimation and billing systems.
We evaluated the integrity of the model used by the Group in calculating unbilled revenue. We challenged the appropriateness of the estimates used in the model by reference to historical and current data and current pricing and management’s assessment of the potential impact of COVID 19. Our work included reconciling certain relevant inputs to the model to the underlying source data. We also considered the outturn from retrospective reviews of previous estimates made in comparison to actual billing data and considered other information as part of our consideration of the Group’s estimation techniques including the reasonableness of management’s sensitivity analysis, on key assumptions.
We concluded that the assumptions and methodologies adopted by management to calculate the unbilled revenue at the year end were reasonable.
Key audit matter How our audit addressed the key audit matter
Asset Retirement Obligations
Refer to page 104 (Report of the Audit & Risk Committee), note 1 (xvii) (Statement of Accounting Policies) and note 27 to the financial statements
ESB holds provisions for asset retirement obligations in respect of station closures, creosote treated wood poles and other assets. Given the level of change and focus on environmental obligations, including operational decisions as to how and when assets are disposed of, the identification and quantification of all asset retirement obligations requires judgement.
We determined the provision in respect of creosote treated wood poles to be a key audit matter due to the level of judgement and estimation in determining the amount of provision required, the impact on the income statement during the year, the limited historical data on disposal costs and the significant length of time over which the poles are disposed of and replaced.
We assessed the estimates of asset retirement obligations including considering the quantum, nature and timing of costs. Our evaluation included discussions with management to understand the basis for the assumptions made in relation to the cost of disposal of the creosote treated wood poles. We critically assessed and challenged management in respect of these costs.
We also assessed and challenged the assumptions made in respect of the timing of the pole disposals by reference to the profile of poles in the network, operational plans in respect of the timing and management of future disposals, the ageing and useful economic lives.
We considered the appropriateness of the discount rates used by comparing against external benchmarks.
We also considered the disclosures in the financial statements in relation to these matters.
We concluded that the assumptions and methodologies adopted by management to calculate the Group’s asset retirement obligations were reasonable.

STR
ATEGY
AN
D P
ER
FOR
MA
NC
E
01
CO
RP
OR
ATE G
OV
ER
NA
NC
E
02
FINA
NC
IAL S
TATEM
EN
TS
03
RESPONSIBILITIES FOR THE FINANCIAL STATEMENTS AND THE AUDIT
Responsibilities of the Board members for the financial statementsAs explained more fully in the Statement of Board Members' Responsibilities set out on page 113, the Board members are responsible for the preparation of the financial statements in accordance with the applicable framework and for being satisfied that they give a true and fair view.
The Board members are also responsible for such internal control as they determine is necessary to enable the preparation of financial statements that are free from material misstatement, whether due to fraud or error.
In preparing the financial statements, the Board members are responsible for assessing the Group’s and the Parent’s ability to continue as a going concern, disclosing as applicable, matters related to going concern and using the going concern basis of accounting unless the Board members either intend to liquidate the Group or the Parent or to cease operations, or have no realistic alternative but to do so.
Auditors’ responsibilities for the audit of the financial statementsOur objectives are to obtain reasonable assurance about whether the financial statements as a whole are free from material misstatement, whether due to fraud or error, and to issue an auditors’ report that includes our opinion. Reasonable assurance is a high level of assurance, but is not a guarantee that an audit conducted in accordance with ISAs (Ireland) will always detect a material misstatement when it exists. Misstatements can arise from fraud or error and are considered material if, individually or in the aggregate, they could reasonably be expected to influence the economic decisions of users taken on the basis of these financial statements.
Our audit testing might include testing complete populations of certain transactions and balances, possibly using data auditing techniques. However, it typically involves selecting a limited number of items for testing, rather than testing complete populations. We will often seek to target particular items for testing based on their size or risk characteristics. In other cases, we will use audit sampling to enable us to draw a conclusion about the population from which the sample is selected.
A further description of our responsibilities for the audit of the financial statements is located on the IAASA website at:
https://www.iaasa.ie/getmedia/b2389013-1cf6-458b-9b8f-a98202dc9c3a/Description_of_auditors_responsibilities_for_audit.pdf
This description forms part of our auditors’ report.
Use of this reportThis report, including the opinions, has been prepared for and only for the Stockholders of ESB as a body in accordance with section 391 of the Companies Act 2014, made applicable to ESB by the Regulations adopted pursuant to the ESB Acts 1927 to 2014, and for no other purpose. We do not, in giving these opinions, accept or assume responsibility for any other purpose or to any other person to whom this report is shown or into whose hands it may come save where expressly agreed by our prior consent in writing.
REPORT ON THE AUDIT OF THE FINANCIAL STATEMENTS
Based on the work we have performed, we have not identified any material uncertainties relating to events or conditions that, individually or collectively, may cast significant doubt on the Group’s or the Parent’s ability to continue as a going concern for a period of at least twelve months from the date on which the financial statements are authorised for issue.
In auditing the financial statements, we have concluded that the Board members’ use of the going concern basis of accounting in the preparation of the financial statements is appropriate.
However, because not all future events or conditions can be predicted, this conclusion is not a guarantee as to the Group’s or Parent’s ability to continue as a going concern.
In relation to the Group’s reporting on how they have applied the UK Corporate Governance Code, we have nothing material to add or draw attention to in relation to the Board members’ statement in the financial statements about whether the Board members considered it appropriate to adopt the going concern basis of accounting.
Our responsibilities and the responsibilities of the Board members with respect to going concern are described in the relevant sections of this report.
REPORTING ON OTHER INFORMATION
The other information comprises all of the information in the Annual Report other than the financial statements and our auditors’ report thereon. The Board members are responsible for the other information. Our opinion on the financial statements does not cover the other information and, accordingly, we do not express an audit opinion or, except to the extent otherwise explicitly stated in this report any form of assurance thereon.
In connection with our audit of the financial statements, our responsibility is to read the other information and, in doing so, consider whether the other information is materially inconsistent with the financial statements or our knowledge obtained in the audit, or otherwise appears to be materially misstated. If we identify an apparent material inconsistency or material misstatement, we are required to perform procedures to conclude whether there is a material misstatement of the financial statements or a material misstatement of the other information. If, based on the work we have performed, we conclude that there is a material misstatement of this other information, we are required to report that fact. We have nothing to report based on these responsibilities.
With respect to the Board Members’ Report, we also considered whether the disclosures required by the Regulations of ESB have been included.
Based on the responsibilities described above and our work undertaken in the course of the audit, ISAs (Ireland) and the Companies Act 2014 (CA14), which is made applicable to the audit of the financial statements of ESB by the Regulations of ESB adopted pursuant to the ESB Acts 1927 to 2014, require us to also report certain opinions and matters as described below (required by ISAs (Ireland) unless otherwise stated).
OTHER REQUIRED REPORTING
Companies Act 2014 opinions on other matters
• We have obtained all the information and explanations which we consider necessary for the purposes of our audit.
• In our opinion the accounting records of the Parent were sufficient to permit the Parent financial statements to be readily and properly audited.
• The Parent Balance Sheet is in agreement with the accounting records.
Companies Act 2014 exception reporting
Board Members’ remuneration and transactions
Under the Companies Act 2014 we are required to report to you if, in our opinion, the disclosures of board members’ remuneration and transactions specified by sections
305 to 312 of that Act have not been made. We have no exceptions to report arising from this responsibility.
Mary Cleary
For and on behalf of PricewaterhouseCoopers
Chartered Accountants and Statutory Audit Firm
Dublin
26 February 2021
118 ESB Annual Report 2020 - Brighter Together ESB Annual Report 2020 119
INDEPENDENT AUDITORS' REPORT TO STOCKHOLDERS OF ELECTRICITY SUPPLY BOARD (ESB) (continued)
INDEPENDENT AUDITORS' REPORT TO STOCKHOLDERS OF ELECTRICITY SUPPLY BOARD (ESB) (continued)
Board Members’ Report
• In our opinion, based on the work undertaken in the course of the audit, the information given in the Board Members’ Report for the year ended 31 December 2020 is consistent with the financial statements and has been prepared in accordance with the applicable legal requirements. (CA14)
• Based on our knowledge and understanding of the Group and Parent and their environment obtained in the course of the audit, we did not identify any material misstatements in the Board Members’ Report. (CA14)
Code of Practice for the Governance of State Bodies (the “Code”)
Under the Code of Practice for the Governance of State Bodies (the “Code”) we are required to report to you if the statement regarding the system of internal control included in the Board Governance Report on pages 90 to 100 does not reflect the Group’s compliance with paragraph 1.9(iv) of the Code or if it is not consistent with the information of which we are aware from our audit work on the financial statements. We have nothing to report in respect of this responsibility.
The Board members’ assessment of the prospects of the Group and of the principal risks that would threaten the solvency or liquidity of the Group
As a result of the Board members’ voluntary reporting on how they have applied the UK Corporate Governance Code (the “UK Code”), under ISAs (Ireland) we are required to report to you if we have anything material to add or to draw attention to regarding:
• The Board members’ confirmation on page 98 of the Annual Report that they have carried out a robust assessment of the principal risks facing the Group, including those that would threaten its business model, future performance, solvency or liquidity.
• The disclosures in the Annual Report that describe those risks and explain how they are being managed or mitigated.
• The Board members’ explanation on pages 99 to 100 of the Annual Report as to how they have assessed the prospects of the Group, over what period they have done so and why they consider that period to be appropriate, and their statement as to whether they have a reasonable expectation that the Group will be able to continue in operation and meet its liabilities as they fall due over the period of their assessment, including any related disclosures drawing attention to any necessary qualifications or assumptions.
We have nothing to report in respect of this responsibility.
Other UK Code provisions
As a result of the Board members’ voluntary reporting on how they have applied the UK Code, we are required to report to you if, in our opinion:
• The statement given by the Board members’ on page 113 that they consider the Annual Report taken as a whole to be fair, balanced and understandable and provides the information necessary for the members to assess the Group’s and Parent’s position and performance, business model and strategy is materially inconsistent with our knowledge of the Group and Parent obtained in the course of performing our audit.
• The section of the Annual Report on page 102 describing the work of the Audit and Risk Committee does not appropriately address matters communicated by us to the Audit and Risk Committee.
We have nothing to report in respect of this responsibility.

STR
ATEGY
AN
D P
ER
FOR
MA
NC
E
01
CO
RP
OR
ATE G
OV
ER
NA
NC
E
02
FINA
NC
IAL S
TATEM
EN
TS
03
120 ESB Annual Report 2020 - Brighter Together ESB Annual Report 2020 121
GROUP INCOME STATEMENTFor the year ended 31 December 2020
2020 2019
Notes
Excluding exceptional
items€m
Exceptional items
note 5€m
Total€m
Excluding exceptional
items€m
Exceptional items
note 5€m
Total€m
Revenue 3 3,731.4 - 3,731.4 3,709.5 - 3,709.5
Other operating income (net) 6 18.6 - 18.6 8.7 - 8.7
Net impairment losses on financial assets 5/7/17 (24.8) - (24.8) (11.8) (34.4) (46.2)
Operating costs 5/7 (3,109.2) (247.3) (3,356.5) (3,024.3) (59.8) (3,084.1)
Operating profit 616.0 (247.3) 368.7 682.1 (94.2) 587.9
Net interest on borrowings 8 (125.5) - (125.5) (152.2) - (152.2)Financing charges 8 (18.6) - (18.6) (16.6) - (16.6)Fair value movement on financial instruments 8 (50.4) - (50.4) (15.8) - (15.8)Finance income 8 2.1 - 2.1 2.2 - 2.2 Net finance cost (192.4) - (192.4) (182.4) - (182.4)
Share of equity accounted investees profit / (loss), net of tax 15 9.3 - 9.3 (8.3) - (8.3)
Profit before taxation 432.9 (247.3) 185.6 491.4 (94.2) 397.2
Income tax expense 20 (76.1) 16.3 (59.8) (72.9) 13.5 (59.4)Profit after taxation 356.8 (231.0) 125.8 418.5 (80.7) 337.8
Attributable to:Equity holders of the Parent 360.8 (231.0) 129.8 422.6 (80.7) 341.9 Non-controlling interest (4.0) - (4.0) (4.1) - (4.1)Profit for the financial year 356.8 (231.0) 125.8 418.5 (80.7) 337.8
Notes 1 to 34 form an integral part of these financial statements.
GROUP STATEMENT OF COMPREHENSIVE INCOMEFor the year ended 31 December 2020
2020 2019€m €m
Profit for the financial year 125.8 337.8
Items that will not be reclassified subsequently to profit or loss:NIE Networks pension scheme actuarial losses (26.4) (17.5)Tax on items that will not be reclassified to profit or loss 8.7 3.0
(17.7) (14.5)
Items that are or may be reclassified subsequently to profit or loss:Effective hedge of a net investment in foreign subsidiary 0.1 (0.4)Translation differences on consolidation of foreign subsidiaries (10.2) 8.9 Fair value losses on cash flow hedges (20.9) (18.9)Fair value losses on cash flow hedges in equity accounted investees (36.4) (3.8)Transferred to income statement on cash flow hedges 15.9 (20.6)Tax on items that are or may be reclassified subsequently to profit or loss 2.6 2.4 Tax on items that are or may be reclassified subsequently to profit or loss for equity accounted investees 6.9 0.6 Tax on items transferred to income statement (2.0) 2.6
(44.0) (29.2)
Other comprehensive expense for the financial year, net of tax (61.7) (43.7)
Total comprehensive income for the financial year 64.1 294.1
Attributable to:Equity holders of the Parent 68.1 298.2 Non-controlling interest (4.0) (4.1)Total comprehensive income for the financial year 64.1 294.1

STR
ATEGY
AN
D P
ER
FOR
MA
NC
E
01
CO
RP
OR
ATE G
OV
ER
NA
NC
E
02
FINA
NC
IAL S
TATEM
EN
TS
03
122 ESB Annual Report 2020 - Brighter Together ESB Annual Report 2020 123
GROUP BALANCE SHEET As at 31 December 2020
Terence O’Rourke, Chairman
Pat O’Doherty, Chief Executive
Pat Fenlon, Executive Director, Group Finance and Commercial
2020 2019 restatedNotes €m €m
ASSETSNon-current assetsProperty, plant and equipment 11 10,930.1 11,077.4 Intangible assets 12 426.8 347.7 Right-of-use assets 13 123.6 133.3 Goodwill 14 169.0 178.3 Investments in equity accounted investees 15 378.1 413.5 Financial asset investments at fair value through profit or loss 15 8.6 13.4 Trade and other receivables 17 149.3 12.4 Derivative financial instruments 22 8.3 65.5 Deferred tax assets 20 1.7 2.0 Total non-current assets 12,195.5 12,243.5
Current assetsInventories 16 160.1 151.0 Intangible assets 12 120.1 110.4Derivative financial instruments 22 169.6 244.8 Current tax asset 5.7 -Trade and other receivables 17 942.6 1,105.1 Cash and cash equivalents 18 248.7 125.1 Total current assets 1,646.8 1,736.4
Total assets 13,842.3 13,979.9
EQUITYCapital stock 19 1,957.7 1,966.4 Capital redemption reserve 22.2 13.5 Translation reserve (6.4) 3.7 Other reserves (243.4) (233.2)Cash flow hedging reserve (50.9) (17.0)Retained earnings 2,243.1 2,171.8 Equity attributable to equity holders of the Parent 3,922.3 3,905.2
Non-controlling interest (14.2) (10.0)Total equity 3,908.1 3,895.2
LIABILITIESNon-current liabilitiesBorrowings and other debt 21 5,114.0 4,751.7 Lease liabilities 13 107.3 112.4 Liability – ESB pension scheme 24 95.3 96.1 Liability – NIE Networks pension scheme 23 116.9 116.0 Employee related liabilities 24 47.0 70.4 Deferred income 26 1,269.1 1,259.3 Provisions 27 597.7 322.5 Deferred tax liabilities 20 462.3 467.1 Derivative financial instruments 22 604.9 662.5 Total non-current liabilities 8,414.5 7,858.0
Current liabilitiesBorrowings and other debt 21 129.6 480.7 Lease liabilities 13 17.5 19.6 Liability – ESB pension scheme 24 11.0 296.5 Employee related liabilities 24 90.1 79.7 Trade and other payables 25 821.4 834.6 Deferred income 26 91.0 88.3 Provisions 27 166.4 150.0 Current tax liabilities - 9.5 Derivative financial instruments 22 192.7 267.8 Total current liabilities 1,519.7 2,226.7
Total liabilities 9,934.2 10,084.7
Total equity and liabilities 13,842.3 13,979.9
PARENT BALANCE SHEET As at 31 December 2020
2020 2019 restated Notes € m € m
ASSETSNon-current assetsProperty, plant and equipment 11 7,498.7 7,300.1 Intangible assets 12 370.3 294.6 Right-of-use assets 13 66.9 73.2 Investments in equity accounted investees 15 33.9 43.6 Investments in subsidiary undertakings 15 61.8 61.8 Trade and other receivables 17 1,817.8 1,015.1Derivative financial instruments 22 10.1 27.8 Total non-current assets 9,859.5 8,816.2
Current assetsInventories 16 42.8 54.0 Intangible assets 12 119.5 107.4 Derivative financial instruments 22 129.8 201.4 Current tax asset 0.8 1.6 Trade and other receivables 17 1,319.5 2,676.1 Cash and cash equivalents 18 164.1 58.2 Total current assets 1,776.5 3,098.7
Total assets 11,636.0 11,914.9
EQUITYCapital stock 19 1,957.7 1,966.4 Capital redemption reserve 22.2 13.5 Cash flow hedging and other reserves (11.4) (19.5)Retained earnings 1,707.9 1,711.7 Equity attributable to equity holders of the Parent 3,676.4 3,672.1
LIABILITIESNon-current liabilitiesBorrowings and other debt 21 729.1 887.3 Lease liabilities 13 55.5 58.9 Liability – ESB pension scheme 24 95.3 96.1 Employee related liabilities 24 46.9 70.3 Deferred income 26 862.1 843.4 Provisions 27 485.9 246.5 Deferred tax liabilities 20 373.6 351.0 Derivative financial instruments 22 31.1 43.0 Total non-current liabilities 2,679.5 2,596.5
Current liabilitiesBorrowings and other debt 21 127.7 155.7 Lease liabilities 13 11.2 12.8 Liability – ESB pension scheme 24 11.0 296.5 Employee related liabilities 24 81.9 73.6 Trade and other payables 25 4,732.0 4,751.2 Deferred income 26 59.1 57.9 Provisions 27 106.2 86.3 Derivative financial instruments 22 151.0 212.3 Total current liabilities 5,280.1 5,646.3
Total liabilities 7,959.6 8,242.8
Total equity and liabilities 11,636.0 11,914.9
Parent profit after tax for the financial year ended 31 December 2020 amounted to €46.3 million (2019: profit of €353.4 million).
Terence O’ Rourke, Chairman
Pat O’Doherty, Chief Executive
Pat Fenlon, Executive Director, Group Finance and Commercial

STR
ATEGY
AN
D P
ER
FOR
MA
NC
E
01
CO
RP
OR
ATE G
OV
ER
NA
NC
E
02
FINA
NC
IAL S
TATEM
EN
TS
03
124 ESB Annual Report 2020 - Brighter Together ESB Annual Report 2020 125
GROUP STATEMENT OF CHANGES IN EQUITY As at 31 December 2020
Capital stock
Translation reserve
Capital redemption
reserve
Cash flow hedging reserve
Other reserves1
Retained earnings Total
Non-controlling
interestTotal
equityReconciliation of changes in equity €m €m €m €m €m €m €m €m €m
Balance at 1 January 2019 1,970.8 (4.8) 9.1 20.7 (223.3) 1,877.4 3,649.9 (5.9) 3,644.0
Total comprehensive income / (expense) for the yearProfit for the financial year - - - - - 341.9 341.9 (4.1) 337.8 NIE Networks pension scheme actuarial losses - - - - (17.5) - (17.5) - (17.5)Foreign currency translation adjustments - 8.5 - - - - 8.5 - 8.5 Cash flow hedges:
- Net fair value losses - - - (18.9) - - (18.9) - (18.9)- Transfers to income statement
- Finance cost (interest) - - - (2.4) - - (2.4) - (2.4)- Finance cost (foreign translation movements) - - - (8.3) - - (8.3) - (8.3)- Other operating expenses - - - (9.9) - - (9.9) - (9.9)
Fair value loss for hedges in equity accounted investees - - - (3.8) - - (3.8) - (3.8)Tax on items taken directly to OCI - - - 2.4 3.0 - 5.4 - 5.4 Tax on items transferred to income statement - - - 2.6 - - 2.6 - 2.6 Tax on items taken directly to OCI for equity accounted investees
- - - 0.6 - - 0.6 - 0.6
Total comprehensive income / (expense) for the year - 8.5 - (37.7) (14.5) 341.9 298.2 (4.1) 294.1
Transactions with owners recognised directly in equityDividends - - - - - (42.9) (42.9) - (42.9)Repurchase of own shares1 (4.4) - 4.4 - - (4.6) (4.6) - (4.6)ESOP repurchase provision2 - - - - 4.6 - 4.6 - 4.6 Balance at 31 December 2019 1,966.4 3.7 13.5 (17.0) (233.2) 2,171.8 3,905.2 (10.0) 3,895.2
Balance at 1 January 2020 1,966.4 3.7 13.5 (17.0) (233.2) 2,171.8 3,905.2 (10.0) 3,895.2
Total comprehensive income / (expense) for the yearProfit for the financial year - - - - - 129.8 129.8 (4.0) 125.8 NIE Networks pension scheme actuarial losses - - - - (26.4) - (26.4) - (26.4)Foreign currency translation adjustments - (10.1) - - - - (10.1) - (10.1) Cash flow hedges:
- Net fair value losses - - - (20.9) - - (20.9) - (20.9)- Transfers to income statement
- Finance cost (interest) - - - 5.2 - - 5.2 - 5.2 - Finance cost (foreign translation movements) - - - 20.5 - - 20.5 - 20.5 - Other operating expenses - - - (9.8) - - (9.8) - (9.8)
Fair value loss for hedges in equity accounted investees - - - (36.4) - - (36.4) - (36.4)Tax on items taken directly to OCI - - - 2.6 8.7 - 11.3 - 11.3 Tax on items transferred to income statement - - - (2.0) - - (2.0) - (2.0)Tax on items taken directly to OCI for equity accounted investees
- - - 6.9 - - 6.9 - 6.9
Total comprehensive income / (expense) for the year - (10.1) - (33.9) (17.7) 129.8 68.1 (4.0) 64.1
Transactions with owners recognised directly in equityDividends - - - - - (50.1) (50.1) (0.2) (50.3)Repurchase of own shares1 (8.7) - 8.7 - - (8.4) (8.4) - (8.4)ESOP repurchase provision2 - - - - 7.5 - 7.5 - 7.5 Balance at 31 December 2020 1,957.7 (6.4) 22.2 (50.9) (243.4) 2,243.1 3,922.3 (14.2) 3,908.1
1 Other reserves include (i) other reserves relating to the Northern Ireland Electricity Networks Limited (NIE Networks) pension scheme of (€237.2) million (2019: (€219.5) million), (ii) a non-distributable reserve of (€5.0) million which was created on the sale of the Group’s share in Ocean Communications Limited in 2001; and (iii) an ESOP repurchase provision which relates to the amount that ESB has committed to date to purchase from the ESOP internal market €nil (2019: (€7.5) million). Refer to note 19 for further details on other reserves and note 31 for information on the ESOP repurchase.
2 Refer to note 31 for information on the ESOP repurchase.
PARENT STATEMENT OF CHANGES IN EQUITY As at 31 December 2020
CapitalStock
€m
Capital Redemption
Reserve
Cash flow hedging and
other reserves
Retained earnings
€mTotal
€mReconciliation of changes in equity €m €m
Balance at 1 January 2019 1,970.8 9.1 (25.2) 1,451.5 3,406.2 Change in accounting policy - - - (50.3) (50.3)Restated total equity at 1 January 2019 1,970.8 9.1 (25.2) 1,401.2 3,355.9
Total comprehensive income / (expense) for the yearRestated profit for the financial year - - - 353.4 353.4 Cash flow hedges: - Net fair value losses - - (10.8) - (10.8) - Transfers to income statement
- Finance cost (interest) - - (2.4) - (2.4)- Finance cost (foreign translation movements) - - (8.3) - (8.3)- Other operating expenses - - 22.8 - 22.8
Tax on items taken directly to OCI - - 1.3 - 1.3 Tax on items transferred to income statement - - (1.5) - (1.5)Total comprehensive income for the year - - 1.1 353.4 354.5
Transactions with owners recognised directly in equityDividends - - - (42.9) (42.9)Repurchase of own shares1 (4.4) 4.4 - - - ESOP repurchase provision1 - - 4.6 - 4.6 Balance at 31 December 2019 1,966.4 13.5 (19.5) 1,711.7 3,672.1
Balance at 1 January 2020 1,966.4 13.5 (19.5) 1,711.7 3,672.1
Total comprehensive income for the yearProfit for the financial year - - - 46.3 46.3 Cash flow hedges: - Net fair value losses - - (4.3) - (4.3) - Transfers to income statement
- Finance cost (interest) - - 5.2 - 5.2 - Finance cost (foreign translation movements) - - 20.5 - 20.5 - Other operating expenses - - (20.7) - (20.7)
Tax on items taken directly to OCI - - 0.5 - 0.5 Tax on items transferred to income statement - - (0.6) - (0.6) Total comprehensive income for the year - - 0.6 46.3 46.9
Transactions with owners recognised directly in equityDividends - - - (50.1) (50.1)Repurchase of own shares 1 (8.7) 8.7 - - -ESOP provision 1 - - 7.5 - 7.5 Balance at 31 December 2020 1,957.7 22.2 (11.4) 1,707.9 3,676.4
1 Refer to note 31 for information on the ESOP repurchase.

STR
ATEGY
AN
D P
ER
FOR
MA
NC
E
01
CO
RP
OR
ATE G
OV
ER
NA
NC
E
02
FINA
NC
IAL S
TATEM
EN
TS
03
126 ESB Annual Report 2020 - Brighter Together ESB Annual Report 2020 127
GROUP CASH FLOW STATEMENTFor the year ended 31 December 2020
2020 2019Notes €m €m
Cash flows from operating activities
Profit after taxation 125.8 337.8
Adjustments for:Depreciation and amortisation 7 806.7 806.2 Revenue from supply contributions and other deferred income 26 (111.7) (122.7)Net emissions movements 0.6 22.2 Profit on disposal of non-current assets 6 (11.5) (7.1)Inventory impairment 2.8 9.2 Net finance cost 8 192.4 182.4 Impact of fair value adjustments in operating costs (3.5) (8.7)(Profit) / losses from equity accounted investees (net) 15 (9.3) 8.3 Income tax expense 20 59.8 59.4 Dividend received 6 (0.7) (1.6)Impairment charge 5 / 7 225.5 58.1 Operating cash flows before changes in working capital and provisions 1,276.9 1,343.5
Charge / (credit) in relation to provisions 100.3 (2.8)Charge in relation to employee related liabilities 94.0 131.2 Utilisation of provisions (12.6) (15.6)Payments in respect of employee related liabilities (427.0) (122.4)Deferred income received 145.9 151.5 Decrease / (increase) in trade and other receivables 138.5 (208.6)Increase in inventories (11.6) (26.2)(Decrease) / increase in trade and other payables (2.9) 30.4 Cash generated from operations 1,301.5 1,281.0
Current tax paid (net) (59.6) (30.8)Financing costs paid (163.6) (177.9)Net cash inflow from operating activities 1,078.3 1,072.3
Cash flows from investing activitiesPurchase of property, plant and equipment (828.6) (846.6)Purchase of intangible assets (136.5) (109.1)Proceeds from sale of non-current assets 14.0 8.6 Proceeds from sale of investments 12.8 - Amounts advanced to equity accounted investees as shareholder loans (48.7) - Amounts repaid by equity accounted investees 11.6 30.5 Dividends received from joint venture 15 11.7 13.7 Dividends received from investments measured at fair value through profit and loss 0.7 1.6 Purchase of financial assets and equity accounted investments (5.7) (246.6)Interest received 2.1 2.2 Net cash outflow from investing activities (966.6) (1,145.7)
Cash flows from financing activitiesDividends paid 19 (50.3) (42.9)Principal elements of lease payments (16.4) (16.6)Repurchase of ESOP shares (8.4) (4.6)Repayments of bonds and term debt facilities (396.5) (548.0)Proceeds from the issue of bonds 572.2 592.9 Revolving credit facility arrangement fee (3.6) -Repayment of revolving credit facility and other borrowings (70.0) - Payments on inflation linked interest rate swaps (17.1) (15.2)
Net cash inflow / (outflow) from financing activities 9.9 (34.4)
Net increase / (decrease) in cash and cash equivalents 121.6 (107.8)Cash and cash equivalents at 1 January 18 125.1 229.1 Effect of exchange rate fluctuations on cash held 2.0 3.8 Cash and cash equivalents at 31 December 18 248.7 125.1
PARENT CASH FLOW STATEMENTFor the year ended 31 December 2020
2020 2019 restated Notes €m €m
Cash flows from operating activities
Profit after taxation 46.3 353.4
Adjustments for:Depreciation and amortisation 541.9 543.7 Revenue from supply contributions and other deferred income 26 (61.4) (55.0)Net emissions movements 1.0 (13.8)Profit on disposal of non-current assets (11.8) (5.4)Net finance cost 39.4 42.4 Impact of fair value movement on financial instruments in operating costs 23.3 (8.7)Loss from equity accounted investees (net) 9.7 12.6 Dividend received from subsidiary undertakings (8.9) (9.1)Income tax expense 70.1 56.5 Inventory impairment 2.1 8.3 Provision for amounts due from related undertakings 199.5 31.2 Net impairment losses on financial assets 18.6 - Impairment charge - 8.3 Operating cash flows before changes in working capital and provisions 869.8 964.4
Charge / (credit) in relation to provisions 96.7 (4.4)Charge in relation to employee related liabilities 24 79.6 118.6 Utilisation of provisions (10.8) (6.9)Payments in respect of employee related liabilities 24 (393.4) (89.4)Deferred income received 81.3 88.9 Decrease / (increase) in trade and other receivables 228.0 (5.6)Decrease in inventories 9.2 9.3 Decrease in trade and other payables (266.3) (197.2)Cash generated from operations 694.1 877.7
Current tax paid (net) (34.1) (43.0)Financing costs paid (104.0) (118.0)Net cash inflow from operating activities 556.0 716.7
Cash flows from investing activitiesPurchase of property, plant and equipment (572.9) (549.4)Purchase of intangible assets (120.4) (101.8)Proceeds from the sale of non-current assets 14.0 6.5 Amounts received from / (advanced to) subsidiary undertakings 181.6 (249.8)Interest received 58.5 60.0 Dividends received from subsidiary undertakings 8.9 9.1 Net cash outflow from investing activities (430.3) (825.4)
Cash flows from financing activitiesDividends paid 19 (50.1) (42.9)Principal elements of lease payments (10.6) (11.0)Repayments of term debt facilities (85.5) (286.3)Revolving credit facility arrangement fee (3.6) - Repayment of revolving credit facility (70.0) - Proceeds from loans from subsidiaries 200.0 384.8 Net cash (outflow) / inflow from financing activities (19.8) 44.6
Net increase / (decrease) in cash and cash equivalents 105.9 (64.1)Cash and cash equivalents at 1 January 18 58.2 122.3 Cash and cash equivalents at 31 December 18 164.1 58.2

STR
ATEGY
AN
D P
ER
FOR
MA
NC
E
01
CO
RP
OR
ATE G
OV
ER
NA
NC
E
02
FINA
NC
IAL S
TATEM
EN
TS
03
(I) BASIS OF PREPARATION
Electricity Supply Board (ESB) is a statutory corporation established under the Electricity (Supply) Act, 1927 and is domiciled in Ireland. The consolidated financial statements of ESB as at and for the year ended 31 December 2020 comprise the Parent and its subsidiaries (together referred to as “ESB” or “the Group”) and the Group’s interests in associates and jointly controlled entities.
The Parent and consolidated financial statements are prepared under IFRS (International Financial Reporting Standards) as adopted by the EU (EU IFRS) as applied in accordance with the Companies Act 2014. The Companies Act 2014 provide a Parent entity that presents its individual financial statements together with its consolidated financial statements with an exemption from publishing the Parent income statement and statement of comprehensive income which forms part of the Parent financial statements prepared and approved in accordance with the Act. The financial statements of the Parent and Group have been prepared in accordance with the EU IFRS standards and IFRIC (International Financial Reporting Interpretations Committee) interpretations issued and effective for accounting periods ending on or before 31 December 2020. The Parent and consolidated financial statements have been prepared on the historical cost basis except for derivative financial instruments and certain financial asset investments which are measured at fair value.
The policies set out below have been consistently applied to all years presented in these consolidated financial statements and have been applied consistently by all Group entities – with the exception of adoption of amended standards as set out at note 1 (iv) below. Parent accounting policies are consistent with the consolidated financial statements policies outlined below except where otherwise stated. During the year the Parent changed its accounting policy in respect of investment in equity accounted investees as set out in note 1 (vi).
Going concern
The coronavirus pandemic has had a negative economic impact which saw all-island Irish electricity demand fall by a peak of around 15% in April 2020 relative to the same period in 2019, before gradually recovering and demand levels for 2020 were marginally lower than 2019. While this had a knock-on impact on ESB’s financial performance, ESB delivered operating profits (pre-exceptional items) of €616.0 million for the year ended 31 December 2020.
The funding and liquidity management of the Group are described in note 21. The amount of cash and cash equivalents that the Group had on hand on 31 December 2020 was €248.7 million. The Group also has a revolving credit facility of €1.4 billion providing standby liquidity to February 2025, of which €1.4 billion was undrawn at 31 December 2020. The Group has overall liquidity of €1.8 billion, of which €1.6 billion is undrawn at 31 December 2020. Note 22 and Note 28 includes an overview of financial risk management, details of the Group's financial instruments and hedging activities and its exposure to credit risk and liquidity risk.
The Group has considerable financial resources and the Board believes that the Group is well placed to manage its risks successfully. After making appropriate enquiries the Board is satisfied that ESB has sufficient cash flows, available strong liquidity (see below) and access to capital markets to continue in operational existence for at least twelve months from the date of approval of the financial statements. Accordingly, the consolidated and Parent financial statements are prepared on the going concern basis of accounting.
Certain corresponding amounts have been adjusted so that they are directly comparable with the amounts shown in respect of the current financial year.
(II) BASIS OF CONSOLIDATION
The Group’s financial statements consolidate the financial statements of the Parent and of all subsidiary undertakings together with the Group’s share of the results and net assets of associates and joint ventures made up to 31 December 2020. The results of subsidiary undertakings acquired or disposed of in the year are included in the Group income statement from the date of acquisition or up to the date of disposal. ESB Parent has availed of the exemption in section 304(2) of the Companies Act 2014 not to present its individual income statement, statement of comprehensive income and related notes that form part of the approved Parent financial statements.
Accounting for business combinations
Business combinations are accounted for using the acquisition method as at the acquisition date, which is the date on which control is transferred to the Group.
Acquisitions on or after 1 January 2010
The Group account for business combinations under IFRS 3 Business Combinations. The Group measures goodwill at the acquisition date as: • the fair value of the consideration transferred; plus• the recognised amount of any non-controlling interests in the acquiree; plus if the business combination is achieved in stages, the fair value of the existingequity interest in the acquiree; less
• the net recognised amount (fair value) of the identifiable assets acquired and liabilities assumed.
When the excess is negative, a bargain purchase gain is recognised immediately in profit or loss.
Where settlement of any part of cash consideration is deferred, the amounts payable in the future are discounted to their present value as at the date of exchange. The discount rate used is the entity’s incremental borrowing rate, being the rate at which a similar borrowing could be obtained from an independent financier under comparable terms and conditions.
Contingent consideration is classified either as equity or a financial liability. Amounts classified as a financial liability are subsequently remeasured to fair value, with changes in fair value recognised in profit or loss.
Costs relating to the acquisition (other than those associated with the issue of debt or equity securities) that the Group incur in connection with a business combination are expensed as incurred.
Acquisitions between 1 January 2004 and 1 January 2010
For acquisitions between 1 January 2004 and 1 January 2010, goodwill represents the excess of the cost of the acquisition over the Group’s interest in the recognised amount (fair value) of the identifiable assets, liabilities and contingent liabilities of the acquiree. When the goodwill excess was negative, a bargain purchase gain was recognised immediately in profit or loss. Transaction costs, other than those associated with the issue of debt or equity securities that the Group incurred in connection with business combinations were capitalised as part of the cost of the acquisition.
1. STATEMENT OF ACCOUNTING POLICIES (including use of estimates and judgements) 1. STATEMENT OF ACCOUNTING POLICIES (continued)
(II) BASIS OF CONSOLIDATION (continued)
128 ESB Annual Report 2020 - Brighter Together ESB Annual Report 2020 129
NOTES TO THE FINANCIAL STATEMENTS NOTES TO THE FINANCIAL STATEMENTS
Acquisitions prior to 1 January 2004 (date of transition to IFRS)
As part of its transition to IFRS, the Group elected to restate only those business combinations that occurred on or after 1 January 2003 in accordance with policy elections made by the Group at the time. In respect of acquisitions prior to 1 January 2003, goodwill represents the amount recognised under the Group’s previous accounting framework, Irish / UK GAAP.
IFRS 10 — Consolidated financial statements
The IFRS 10 control model focuses on whether the Group has power over an investee, exposure or rights to variable returns from its involvement with the investee and ability to use its power to affect those returns. In particular, IFRS 10 requires the Group to consolidate investees that it controls on the basis of de facto control.
In accordance with IFRS 10, the Group’s assessment of control is performed on a continuous basis and the Group reassesses whether it controls an investee if facts and circumstances indicate that there are changes to one or more of the elements of the control model.
Subsidiaries
Subsidiaries are entities controlled by ESB (control exists when ESB is exposed to, or has rights to, variable returns from its involvement with the entity and has the ability to affect those returns through its power over the entity). The financial statements of the subsidiaries are included in the consolidated financial statements from the date that control commences until the date that control ceases.
IFRS 11 - Joint arrangements
Under IFRS 11, the Group classifies its interests in joint arrangements as either joint operations or joint ventures depending on the Group’s rights to the assets and obligations for the liabilities of the arrangements. When making this assessment, the Group considers the structure and legal form of the arrangements, the contractual terms of the arrangement agreed by the parties and when relevant, other facts and circumstances.
Joint operations
Joint operations are those undertakings in which ESB is deemed to have joint control of the arrangement and has rights to the assets and obligations for the liabilities of the arrangement. Accordingly, the Company's share of assets, liabilities, revenues, expenses and other comprehensive income are recognised in the respective categories within the consolidated financial statements.
Joint ventures
Joint venture undertakings (joint ventures) are those undertakings over which ESB exercises contractual control jointly with another party, whereby the Group has rights to net assets of the arrangement rather than rights to its assets and obligations for its liabilities.
Joint ventures are accounted for using the equity method of accounting. Under the equity method, the Group’s share of the profits or losses after tax of joint ventures is included in the consolidated income statement after interest and financing charges. The Group’s share of items of other comprehensive income is shown in the statement of comprehensive income.
The Group’s interests in the net assets are included as investments in joint ventures on the face of the consolidated balance sheet at an amount representing the Group’s share of the fair values of the net assets at acquisition plus goodwill, acquisition costs, the Group’s share of post acquisition retained income and expenses less any impairment charge. Net liabilities are only recognised to the extent that ESB has incurred legal or constructive obligations or made payments on behalf of joint ventures.
The amounts included in the consolidated financial statements in respect of post acquisition results of joint ventures are taken from their latest financial information made up to the Group’s balance sheet date.
The Group assesses if a change in the facts and circumstances requires reassessment of whether joint control still exits. The Group has evaluated its involvement in joint arrangements and has confirmed that these investments meet the criteria of joint ventures which continue to be accounted for using the equity method.
Following a change in accounting policy adopted in 2020, the accounting policy for investments in joint ventures in Parent was changed during the year from being carried at cost less impairment charges to the equity method of accounting in line with IAS 28 Investments in Associates and Joint Ventures. This change in accounting policy was applied retrospectively. See note 1 (vi) for more details.
Associates
Entities other than joint arrangements and subsidiaries and over whose operating and financial policies the Group is in a position to exercise significant influence but not control or joint control, are accounted for as associates using the equity method and are included in the consolidated financial statements from the date on which significant influence is deemed to arise until the date on which such influence ceases to exist.
In the Parent financial statements, investments in associates are carried at cost less any impairment charges.
Transactions eliminated on consolidation
Intra-group balances and transactions, and any unrealised income and expenses arising from intra-group transactions, are eliminated in preparing the consolidated financial statements. Unrealised gains arising from transactions with equity accounted investees are eliminated against the investment to the extent of the Group’s interest in the investee. Unrealised losses are eliminated in the same way as unrealised gains, but only to the extent that there is no evidence of impairment.

STR
ATEGY
AN
D P
ER
FOR
MA
NC
E
01
CO
RP
OR
ATE G
OV
ER
NA
NC
E
02
FINA
NC
IAL S
TATEM
EN
TS
03
1. STATEMENT OF ACCOUNTING POLICIES (continued)
(III) USE OF ESTIMATES AND JUDGEMENTS (IV) NEW STANDARDS AND INTERPRETATIONS
V) STANDARDS, INTERPRETATIONS AND AMENDMENTS TO PUBLISHED STANDARDS THAT ARE NOT YET EFFECTIVE
VI) CHANGES TO ACCOUNTING POLICIES
1. STATEMENT OF ACCOUNTING POLICIES (continued)
The preparation of Parent and consolidated financial statements requires a significant number of judgemental assumptions and estimates to be made. These impact on the income and expenses contained within the income statement and the valuation of the assets and liabilities in the balance sheet. Such estimates and judgements are based on historical experience and other factors, including expectations of future events that are believed to be reasonable under the circumstances and are subject to continual re-evaluation.
It should be noted that the impact of variation in some assumptions and estimates can have a particularly material impact on the reported results. These include but are not limited to:
(a) The accounting for the ESB - pension liability requires the exercise of judgement. The Board is satisfied that the appropriate accounting treatment, determined in accordance with IAS 19 - Employee Benefits, is to reflect its existing committed obligations, as set out in the notes to the financial statements (see note 24).
(b) The employees in NIE Networks are entitled to membership of the Northern Ireland Electricity Pension Scheme (the NIE Networks Scheme) which has both defined benefit and defined contribution arrangements. The estimation of and accounting for retirement benefits obligation involves judgements made in conjunction with independent actuaries. This involves estimates about uncertain future events including the life expectancy of scheme members, future salary and pension increases and inflation as well as discount rates. The assumptions used by the Group and a sensitivity analysis of a change in these assumptions are described in note 23.
(c) Assessment of the recoverable amount, being the higher of value in use and the fair value less cost to sell, of property plant and equipment, intangible assets, right-of-use assets, goodwill (described in note 14) and equity accounted investees, in accordance with IAS 36 Impairment of Assets, as described below:
- For power generation assets, value in use is based on the estimated cash flows expected to be generated by the asset which are based on an external review of forecast power generation and forecast power, gas, carbon and capacity prices (where applicable) and the timing and extent of operating costs and capital expenditure.
- For other tangible and intangible assets, value in use is determined based on estimated cashflows or other benefits expected to be derived from use of the assets.- For goodwill recognised on the acquisition of Northern Ireland Electricity Networks, the value in use is based on expected cashflows and a terminal value based on the
Regulated Asset Base (RAB). Expected cashflows are based on assumptions in respect of regulatory returns and inflation.- For equity accounted investees, where value in use is used as a basis for assessing recoverable amount, it is based on estimated cashflows generated and where,
applicable, a terminal value. Estimated cashflows are based on the investee’s management’s assumptions in relation to the future operations of the business. Terminal values are derived, where appropriate, from comparable market transactions.
- Cash flows used in value in use models are discounted to their present value using a pre-tax discount rate that reflects the current market assessments of the time value of money and the risks specific to the asset. The estimation of forecasted revenues and the timing of expenditure requires judgement and is dependent on the economic factors associated with these assets.
- For fair value less cost to sell, fair values are based on independent third party assessments less costs of disposal.
(d) As described in note 28 section (i), the valuation of certain financial instruments is based on a number of judgemental factors and assumptions which of necessity are not based on observable inputs. These have been classified as level 3 financial instruments, under the meaning of IFRS 13 Fair Value Measurement.
(e) Future costs required to settle current provisions such as the power station closure costs, creosote treated wood pole retirement provision and employee liabilities including severance obligations. These liabilities are disclosed in notes 23, 24 and 27.
There is significant estimation and judgement required in the calculation of the provision for generation assets, including the impact of regulation, the accuracy of the site surveys, unexpected contaminants, the impact of alternative technologies and the use of appropriate discount rates.
There is significant estimation required in determining the level of provision required for the disposal of creosote treated wood poles. This includes estimating the disposal cost per pole, which will be determined via competitive tender processes, the period over which poles will be disposed of which is dependent on pole condition and the use of an appropriate discount rate. The period over which poles are disposed of is estimated based on current operational plans which could change significantly in the future as a result of environmental legislation or pole condition.
(f) The measurement of a number of assets, liabilities, income and costs at year end which require a high degree of estimation and judgement, including the calculation of unbilled electricity income and trade and other receivables, amounts due from equity accounted investees, the valuation of fuel stocks, the cost of fuel consumed, the useful lives of property, plant and equipment and also accruals for goods received or work carried out for which supplier invoices have not yet been received. These items are estimated in accordance with the accounting policies of the Group and current EU IFRS.
(g) ESB provide services to around 1.4 million individuals and businesses, mainly on credit terms. It is known that certain debts due to ESB will not be paid through the default of a small number of customers. Estimates, based on historical experience are used in determining the level of debts that is believed will not be collected. These estimates include such factors as the current state of the Irish economy and particular industry issues (see note 17).
(h) Other disclosures, please refer to note 27 for further details of estimates and judgements regarding ongoing legal claims.
(i) Application of IFRS 16 requires the Group to make significant judgements that affect the valuation of lease liabilities, the valuation of right-of-use assets, the discount rate used to discount the lease payments and the lease terms.
(j) The accounting for supply contributions area remains under active consideration within the industry and the accounting profession more broadly, and the accounting treatment ultimately adopted by the Group in this area could therefore be impacted by the outcome of these ongoing discussions.
(k) Recoverability of amounts due from subsidiaries by ESB Parent requires judgement in respect of the ability of subsidiary companies to generate sufficient cash flows to repay the amounts as they fall due.
Management have considered the impact of the COVID-19 pandemic with respect to judgements and estimates it makes in the application of accounting policies.
The key impacts of COVID-19 up to 31 December 2020 include:
• The Group's trade debtors have been assessed for potential risk, and an additional provision was made to reflect the impact of COVID-19 on expected recoverability. Refer to note 17 for further details.
• The Group also assessed the carrying value of property, plant and equipment, goodwill and intangible assets and investments in equity accounted investees forindicators of impairment. Impairment reviews were carried out for those assets where indicators of impairment were noted. Please refer to note 11 and 12 for further details.
The following standards and interpretations are effective for the Group in 2020 but have no material effect on the results or financial positions of the Group:
New standards or amendments Details Effective date
Effect on the results and
financial position of the group
IFRS 3 (Amendments) Business Combinations 01 January 2020 No material effectIFRS 9, IAS 39 and IFRS 7 (Amendments) Interest Rate Benchmark Reform 01 January 2020 No material effectIAS 1 (Amendments) Presentation of Financial
Statements01 January 2020 No material effect
IAS 8 (Amendments) Accounting Policies, Changes in Accounting Estimates and Errors
01 January 2020 No material effect
The Conceptual Framework Revised Conceptual Framework for Financial Reporting
01 January 2020 No material effect
A number of new standards, amendments to standards and interpretations are not yet effective for the year ended 31 December 2020 and have not been applied in preparing these financial statements. The items that may have relevance to the Group are as follows:
New standards or amendments Details Effective date
Effect on the results and
financial position of the group
IAS 1 (Amendments) Presentation of Financial Statements 01 January 2023 No material effectIAS 16 (Amendments) Property, Plant and Equipment 01 January 2022 No material effect
IAS 37 (Amendments) Provisions, Contingent Liabilities and Contingent Assets
01 January 2022 No material effect
IFRS 17 Insurance Contracts 01 January 2023 No material effectIFRS 9, IAS 39, IFRS 7, IFRS 4 and IFRS 16 (Amendments)
Interest Rate Benchmark Reform 01 January 2024 No material effect
The accounting policy for investments in joint ventures in Parent was changed during the year from being carried at cost less impairment charges to the equity method of accounting in line with IAS 28 Investments in Associates and Joint Ventures. This change in accounting policy was applied retrospectively.
This change brings the accounting policy in Parent in line with the Group accounting policy and provides more reliable and relevant information by disclosing investments in joint ventures at the same carrying value in Parent and consolidated Group financial statements.
The following table summarises the impact of this change in accounting policy on the Parent income statement:
Parent Income statement extract
2019€m
Impact of change in
Accounting Policy
€m
Restated 2019
€m
Share of equity accounted investees loss, net of tax - (12.6) (12.6)Profit after tax for the year 366.0 (12.6) 353.4
The following table summarises the impact of this change in accounting policy on the Parent cash flow statement:
Parent Cash flow statement extract
2019€m
Impact of change in
Accounting Policy
€m
Restated 2019
€m
Profit after tax 366.0 (12.6) 353.4 Adjustments for:Losses from equity accounted investees (net) - 12.6 12.6
The following table summarises the impact of this change in accounting policy on the opening balance of Parent's assets and equity:
ParentBalance sheet extract
Original carrying amount
1 January 2019€m
Impact of change in
Accounting Policy
€m
Restated Carrying Amount
1 January 2019€m
Impact of change in
Accounting Policy
€m
Movements during the
year€m
Restated Carrying Amount
31 December 2019€m
Non-current assetInvestments in equity investees 106.5 (50.3) 56.2 (12.6) - 43.6EquityRetained earnings 1,451.5 (50.3) 1,401.2 (12.6) 323.1 1,711.7
130 ESB Annual Report 2020 - Brighter Together ESB Annual Report 2020 131
NOTES TO THE FINANCIAL STATEMENTS NOTES TO THE FINANCIAL STATEMENTS

STR
ATEGY
AN
D P
ER
FOR
MA
NC
E
01
CO
RP
OR
ATE G
OV
ER
NA
NC
E
02
FINA
NC
IAL S
TATEM
EN
TS
03
(VII) FOREIGN CURRENCIES
These financial statements are presented in euro, which is the Parent’s functional currency.
(a) Functional and presentation currency
Items included in the financial statements of each of the Group’s entities are measured using the currency of the primary economic environment in which the entity operates (the functional currency). The consolidated financial statements are presented in euro.
(b) Transactions and balances
Foreign currency transactions are translated into the functional currency using the exchange rates at the dates of the transactions. Foreign exchange gains and losses resulting from the settlement of such transactions and from the translation of monetary assets and liabilities denominated in foreign currencies at year end exchange rates are generally recognised in profit or loss. They are deferred in equity if they relate to qualifying cash flow hedges and qualifying net investment hedges or are attributable to part of the net investment in a foreign operation.
Non-monetary items that are measured at fair value in a foreign currency are translated using the exchange rates at the date when the fair value was determined. Translation differences on assets and liabilities carried at fair value are reported as part of the fair value gain or loss. For example, translation differences on non-monetary assets and liabilities such as equities held at fair value through profit or loss are recognised in profit or loss as part of the fair value gain or loss.
(c) Group companies
The results and financial position of foreign operations (none of which has the currency of a hyperinflationary economy) that have a functional currency different from the presentation currency are translated into the presentation currency as follows: • assets and liabilities for each balance sheet presented are translated at the closing rate at the date of that balance sheet• income and expenses for each statement of profit or loss and statement of comprehensive income are translated at average exchange rates (unless this is nota reasonable approximation of the cumulative effect of the rates prevailing on the transaction dates, in which case income and expenses are translated at theexchange rates at the dates of the transactions); and
• all resulting exchange differences are recognised in other comprehensive income.
On consolidation, exchange differences arising from the translation of any net investment in foreign entities, and of borrowings and other financial instruments designated as hedges of such investments, are recognised in other comprehensive income. When a foreign operation is sold or any borrowings forming part of the net investment are repaid, the associated exchange differences are reclassified to profit or loss, as part of the gain or loss on sale.
Goodwill arising on the acquisition of a foreign operation are treated as assets and liabilities of the foreign operation and translated at the closing rate.
(VIII) PROPERTY, PLANT AND EQUIPMENT AND DEPRECIATION
Recognition and measurement
Property, plant and equipment is stated at cost less accumulated depreciation and provisions for impairment in value, except for land which is shown at cost less impairment. Property, plant and equipment includes capitalised employee, interest and other costs that are directly attributable to the asset and an appropriate portion of relevant overheads.
Depreciation
The charge for depreciation is calculated to write down the cost of property, plant and equipment to its estimated residual value over its expected useful life using methods appropriate to the nature of the Group’s business and to the character and extent of its property, plant and equipment. No depreciation is provided on freehold land or on assets in the course of construction. Depreciation on other items of property, plant and equipment is calculated using the straight-line method to allocate their depreciable amounts over their estimated useful lives as follows:
Generation plant and thermal station structures 20 years
Wind farm generating assets 20 / 25 years
Distribution plant and structures 25 / 30 years
Transmission plant and structures 30 years
General buildings and hydro stations 50 years
Subsequent expenditure
Subsequent expenditure on property, plant and equipment is included in the asset’s carrying amount or recognised as a separate asset, as appropriate, only when it is probable that future economic benefits associated with the item will flow to the Group and the cost of the item can be measured reliably. All other repairs and maintenance costs are charged in the income statement during the financial period in which they are incurred.
Included in property, plant and equipment are strategic spares in relation to the Electricity Generation business. Capital stock in the Networks business is carried within assets under construction pending commissioning.
1. STATEMENT OF ACCOUNTING POLICIES (continued)
(IX) INTANGIBLE ASSETS AND GOODWILL
(a) Goodwill
Goodwill that arises on the acquisition of subsidiaries is presented separately on the balance sheet.
Subsequent measurement
Goodwill is measured at cost less accumulated impairment losses. Goodwill is tested annually for impairment. An impairment loss is recognised if the carrying amount of the asset or cash-generating unit (CGU) exceeds its recoverable amount.
The recoverable amount of an asset or CGU is the greater of its value in use and its fair value less costs to sell. In assessing value in use, the estimated future cash flows are discounted to their present value using a pre-tax discount rate that reflects current market assessments of the time value of money and the risks specific to the asset or CGU.
Impairment losses in respect of goodwill are recognised in profit or loss, and are not reversed.
(b) Emission allowances and renewable obligation certificates (ROCs)
Emission allowances purchased by ESB are recorded as intangible assets at cost.
As emissions arise, a charge is recorded in the income statement to reflect the amount required to settle the liability to the relevant authority. This provision includes the carrying value of the emission allowances held, as well as the current market value of any additional allowances required to settle the obligation. These allowances are returned to the relevant Authority in charge of the scheme within four months of the end of that calendar year, in order to cover the liability for actual emissions of CO2 during that year.
ROCs are certificates issued to operators of accredited renewable generating stations in the UK for the eligible renewable electricity they generate. The Group purchases ROCs from certain of its joint ventures. Purchased ROCs are recognised initially at cost (purchase price) within intangible assets. The liability for actual emissions of CO2 is measured at the cost of purchased allowances up to the level of purchased allowances held, and then at the market price of allowances ruling at the balance sheet date, with movements in the liability recognised in operating profit.
Emission allowances and ROCs held at cost as intangible assets are therefore not amortised as they are held for settlement of the related liabilities in the following year.
(c) Software costs and other intangible assets
Acquired computer software licenses and other intangible assets including grid connections and other acquired rights, are capitalised on the basis of the costs incurred to acquire and bring the specific asset into use. These assets are measured at cost less accumulated amortisation, which is estimated over their useful lives on a straight-line basis, and accumulated impairment losses. Major asset classifications and their allotted life spans are:
Software 3 / 5 years
Other intangibles up to 20 years
Development costs that are directly associated with the production of identifiable and unique software products controlled by the Group and that will probably generate economic benefits exceeding costs beyond one year, are recognised as intangible assets when the following criteria are met:
• management intends to complete the software and use or sell it • there is an ability to use or sell the software • it can be demonstrated how the software will generate probable future economic benefits • there are adequate technical, financial and other resources to complete the development and to use or sell • the expenditure attributable to the software during its development can be reliably measured.
Direct costs include the costs of software development, employees and an appropriate portion of relevant overheads. These assets are measured at cost less accumulated amortisation, which is estimated over their estimated useful lives (three to five years) on a straight-line basis, and accumulated impairment losses.
(d) Research and development
Research expenditure and development expenditure that does not meet the criteria above is recognised as an expense as incurred. Development costs previously recognised as an expense are not recognised as an asset in a subsequent period.
1. STATEMENT OF ACCOUNTING POLICIES (continued)
132 ESB Annual Report 2020 - Brighter Together ESB Annual Report 2020 133
NOTES TO THE FINANCIAL STATEMENTS NOTES TO THE FINANCIAL STATEMENTS

STR
ATEGY
AN
D P
ER
FOR
MA
NC
E
01
CO
RP
OR
ATE G
OV
ER
NA
NC
E
02
FINA
NC
IAL S
TATEM
EN
TS
03
(X) IMPAIRMENT OF NON-CURRENT ASSETS OTHER THAN GOODWILL
Assets that have an indefinite useful life are not subject to amortisation and are tested annually for impairment. Assets that are subject to depreciation and amortisation are tested for impairment whenever events or changes in circumstance indicate that the carrying amount may not be recoverable. Assets not yet in use are tested annually for impairment. An impairment loss is recognised for the amount by which an asset’s carrying amount exceeds its recoverable amount. The recoverable amount is the higher of an asset’s fair value less costs to sell and its value in use. For the purposes of assessing impairment, assets are grouped at the lowest levels for which there are separately identifiable cash flows (cash-generating units).
For power generation assets, value in use is based on the estimated cash flows expected to be generated by the asset and is based on estimates of forecast power generation and forecast power, gas, carbon and capacity prices (where applicable) and the timing and extent of operating costs and capital expenditure. These cash flows are discounted to their present value using a pre-tax discount rate that reflects the current markets assessment of the time value of money and the risks specific to the asset.
(XI) RIGHT-OF-USE OF ASSETS AND LEASE LIABILITIES
IFRS 16 Leases became effective on 1 January 2019 and lease liabilities were measured as at the transition date for the remaining lease payments using the discount rate, lease term and other assumptions (reasonable certainty of extensions, terminations, etc) as at 1 January 2019.
Leases are recognised as a right-of-use asset and a corresponding liability at the date at which the leased asset is available for use by the Group. At the inception of a lease contract the Group assess whether a contract is, or contains, a lease. If the contract conveys the right to control the use of an asset for a period of time in exchange for consideration, it is recognised as a lease.
To assess the right to control an asset, the Group considers the following:
• does the contract contain an identifiable asset • does the Group have the right to obtain substantially all of the economic benefits of the asset • does the Group have the right to operate the asset throughout the period of the contract.
Assets and liabilities arising from a lease are initially measured on a present value basis. Lease liabilities include the net present value of the lease payments. Lease payments to be made under reasonably certain extension options are also included in the measurement of the liability. The lease payments are discounted using the interest rate implicit in the lease. If that rate cannot be readily determined, which is generally the case for leases in the Group, the lessee’s incremental borrowing rate is used, being the rate that the individual lessee would have to pay to borrow the funds necessary to obtain an asset of similar value to the right-of-use asset in a similar economic environment with similar terms, security and conditions.
Lease payments are allocated between principal and finance cost. The finance cost is charged to profit or loss over the lease period so as to produce a constant periodic rate of interest on the remaining balance of the liability for each period.
Right-of-use assets are measured at cost comprising the following:
• the amount of the initial measurement of lease liability• any lease payments made at or before the commencement date less any lease incentives received• any initial direct costs, and• restoration costs.
Right-of-use assets are generally depreciated over the shorter of the asset's useful life and the lease term on a straight-line basis. If the Group is reasonably certain to exercise a purchase option, the right-of-use asset is depreciated over the underlying asset’s useful life.
Payments associated with short-term leases of equipment and vehicles and all leases of low-value assets are recognised on a straight-line basis as an expense in profit or loss. Short-term leases are leases with a lease term of 12 months or less. Low-value assets are considered low value if the value of the asset when new is less than €5,000. Low-value assets within ESB comprise predominantly of IT equipment and small items of office furniture.
The Group leases various land and buildings, wind farm land and motor vehicles. Rental contracts are typically made for fixed periods but may have extension options. Lease terms are negotiated on an individual basis and contain a wide range of different terms and conditions. The lease agreements do not impose any covenants, but leased assets may not be used as security for borrowing purposes.
(XII) BORROWING COSTS
Borrowing costs attributable to the construction of major assets, which necessarily take substantial time to get ready for intended use, are added to the cost of those assets at the weighted average cost of borrowings, until such time as the assets are substantially ready for their intended use. The capitalisation rate applied equates to the average cost of ESB’s outstanding debt and where applicable, a project specific rate is applied. All other borrowing costs are recognised in the income statement in the period in which they are incurred.
(XIII) INVENTORIES
Inventories are carried at the lower of average cost and net realisable value. Cost comprises all purchase price and direct costs that have been incurred in bringing the inventories to their present location and condition. Net realisable value is based on normal selling price less further costs expected to be incurred prior to disposal.
Specific provision is made for damaged, deteriorated, obsolete and unusable items where appropriate.
1. STATEMENT OF ACCOUNTING POLICIES (continued)
(XIV) FINANCIAL ASSETS AND LIABILITIES
Classification and measurement
The following accounting policies apply to the measurement of financial assets in the ESB's consolidated financial statements:
Financial assets at fair value through profit or loss (FVTPL)
These assets are subsequently measured at fair value. Net gains and losses, including any interest or dividend income, are recognised in profit or loss.
Financial assets at fair value through other comprehensive income (FVOCI)
These assets are subsequently measured at fair value. Net gains and losses are recognised in other comprehensive income.
Financial assets at amortised cost
These assets are subsequently measured at amortised cost using the effective interest method. The amortised cost is reduced by impairment losses. Interest income, foreign exchange gains and losses and impairment is recognised in profit or loss. Any gain or loss on derecognition is recognised in profit or loss.
Trade and other receivables
Trade and other receivables are initially recognised at fair value, which is usually the original invoiced amount and subsequently carried at amortised cost using the effective interest method less allowance made for impairment.
The Group applies the IFRS 9 simplified approach to measuring expected credit losses which uses a lifetime expected loss allowance for all trade and other receivables except on the shareholder loans advanced to equity accounted investees which are measured using the general approach. The loss allowances for financial assets are based on assumptions about risk of default and expected loss rates. The Group uses judgement in making these assumptions and selecting the inputs to the expected credit loss calculations, based on the Group’s past history, existing market conditions and forward-looking estimates at the end of each reporting period.
Loans and balances with equity accounted investees
Loans and balances with equity accounted investees are non-derivative financial assets or liabilities which are not quoted in an active market. They are included in current assets or current liabilities on the balance sheet, except for those with maturities greater than twelve months after the balance sheet date, which are included in non-current assets or non-current liabilities and are initially recorded at fair value and thereafter at amortised cost using the effective interest method less loss allowance made for impairment.
Loans and balances with Group companies (Parent)
Loans and balances with Group companies are non-derivative financial assets or liabilities which are not quoted in an active market. They are included in current assets or current liabilities on the balance sheet, except for those with maturities greater than twelve months after the balance sheet date, which are included in non-current assets or non-current liabilities. Loans and balances are included within trade and other receivables or trade and other payables in the Parent balance sheet and are initially recorded at fair value and thereafter at amortised cost.
Trade and other payables
Trade and other payables are initially recorded at fair value, which is usually the original invoiced amount, and subsequently carried at amortised cost using the effective interest rate method.
Impairment
The Group assesses on a forward-looking basis the expected credit losses associated with its debt instruments carried at amortised cost. The impairment methodology applied depends on whether there has been a significant increase in credit risk.
For loans and balances with Group companies, the Parent applies the general approach permitted by IFRS 9, which requires 12 month expected credit losses to be recognised on initial recognition of these receivables. If a significant increase in credit risk occurs, this requires expected lifetime credit losses to be recognised on these receivables.
Cash and cash equivalents
Cash and cash equivalents include cash in hand, deposits repayable on demand and other short-term highly liquid investments with original maturities of three months or less. Cash and cash equivalents for the purpose of cash flow include bank overdrafts payable on demand. Bank overdrafts are shown within borrowings in current liabilities in the balance sheet.
1. STATEMENT OF ACCOUNTING POLICIES (continued)
134 ESB Annual Report 2020 - Brighter Together ESB Annual Report 2020 135
NOTES TO THE FINANCIAL STATEMENTS NOTES TO THE FINANCIAL STATEMENTS

STR
ATEGY
AN
D P
ER
FOR
MA
NC
E
01
CO
RP
OR
ATE G
OV
ER
NA
NC
E
02
FINA
NC
IAL S
TATEM
EN
TS
03
(XIV) FINANCIAL ASSETS AND LIABILITIES (continued)
(a) Borrowings
Interest bearing borrowings
Interest bearing borrowings are recognised initially at fair value less attributable transaction costs. Subsequent to initial recognition these borrowings are stated at amortised cost using the effective interest rate method. If a financial liability measured at amortised cost is modified without this resulting in derecognition, a gain or loss is recognised in profit or loss. The gain or loss is calculated as the difference between the original contractual cash flows and the modified cash flows discounted at the original effective interest rate.
(b) Derivative financial instruments and other hedging instruments
The Group uses derivative financial instruments to hedge its exposure to commodity price, foreign exchange and interest rate risk arising from operational, financing and investing activities. The principal derivatives used include interest rate swaps, inflation-linked interest rate swaps, currency swaps and forward foreign currency contracts. Commodity contracts are also used to hedge the Group's exposures to the purchase of fuel and sale of electricity. The Group applies the general hedge accounting model in IFRS 9. This requires the Group to ensure that hedge accounting relationships are aligned with its risk management objectives and strategy and to apply a more qualitative and forward looking approach to assessing hedge effectiveness.
ESB funds its operations using borrowings and uses deposit instruments to invest surplus funds. ESB also uses interest rate and foreign currency instruments to manage interest rate and currency risks that arise in the normal course of operations from US dollar and sterling denominated borrowings, from its foreign currency subsidiaries and from the use of foreign currency suppliers.
Within its regular course of business, the Group routinely enters into sale and purchase contracts for commodities, including gas and electricity. Where the contract was entered into and continues to be held for the purposes of receipt or delivery of the commodities in accordance with the Group’s expected sale, purchase or usage requirements, the contracts are designated as own use contracts and are accounted for as executory contracts. These contracts are therefore not within the scope of IFRS 9 Financial Instruments.
Commodity contracts which are not designated as own use contracts are accounted for as trading derivatives and are recognised in the balance sheet at fair value. The changes in fair value when a hedge accounting relationship exists and the contract has been designated as held for hedging purposes will be recognised in accordance with IFRS 9 as cash flow hedges.
Financial derivative instruments are used by the Group to hedge interest rate and currency exposures. All such derivatives are recognised at fair value and are re-measured to fair value at the balance sheet date. With the exception of the inflation-linked interest rate swaps the majority of other derivative financial instruments are designated as being held for hedging purposes.
The designation of the hedge relationship is established at the inception of the contract. The treatment of gains and losses on subsequent re-measurement is dependent on the classification of the hedge and whether the hedge relationship is designated as either a fair value or cash flow hedge.
All fair value movements on derivatives that are not designated as hedging relationships are recorded through the income statement within finance income and expense or other operating costs, as appropriate.
Cash flow hedges
Where a derivative financial instrument is designated as a hedge of the variability in cash flows of a recognised liability, a firm commitment or a highly probable forecast transaction, the effective part of any gain or loss on the derivative financial instrument is recognised directly in other comprehensive income. When the firm commitment or forecasted transaction results in the recognition of a non-financial asset or liability, the cumulative gain or loss is removed from other comprehensive income and included in the initial measurement of that asset or liability. Otherwise the cumulative gain or loss is removed from other comprehensive income and recognised in the income statement at the same time as the hedged transaction. The gain or loss relating to the ineffective portion is recognised in the income statement immediately.
When a hedging instrument or hedge relationship is terminated but the hedged transaction is still expected to occur, the cumulative gain or loss at that point remains in other comprehensive income and is recognised in accordance with the above policy when the transaction occurs. If the hedged transaction is no longer probable, the cumulative unrealised gain or loss recognised in other comprehensive income is recognised in the income statement immediately.
Hedge of net investment in foreign entity
Where a foreign currency liability hedges a net investment in a foreign operation, foreign exchange differences arising on translation of the liability are recognised directly in other comprehensive income, and taken to the translation reserve, with any ineffective portion recognised in the income statement immediately.
(c) Guarantees
During the normal course of business, the Group provides guarantees and bonds to third parties, subsidiary companies of the Parent and equity accounted investees. Where claims are probable, the expected credit loss model is applied.
1. STATEMENT OF ACCOUNTING POLICIES (continued)
(XV) CAPITAL STOCK
The units of capital stock are measured at the price at which they were initially issued to the Department of Finance, the Department of Environment, Climate and Communications and ESB ESOP Trustee Limited.
(XVI) INCOME TAX
Income tax on the profit or loss for the year comprises current and deferred tax. Income tax is recognised in the income statement, except to the extent that it relates to items recognised directly in other comprehensive income or equity.
(a) Current tax
Current tax is provided at current rates and is calculated on the basis of results for the year. The income tax expense in the income statement does not include taxation on the Group’s share of profits of joint venture undertakings, as this is included within the separate line on the face of the income statement for share of equity accounted investee profit / (loss), net of tax.
(b) Deferred tax
Deferred tax is provided using the balance sheet liability method, providing for temporary differences between the carrying amounts of assets and liabilities for financial reporting purposes and the amounts used for taxation purposes.
Deferred tax assets are recognised only to the extent that the Board consider that it is more likely than not that there will be suitable taxable profits from which the future reversal of the underlying temporary differences can be deducted.
Deferred tax is measured at the tax rates that are expected to apply in the periods in which temporary differences reverse, based on tax rates and laws enacted or substantively enacted at the balance sheet date.
(XVII) PROVISIONS
A provision is recognised if, as a result of a past event, the Group has a present legal or constructive obligation that can be estimated reliably, and it is probable that an outflow of economic benefits will be required to settle the obligation. Provisions are determined by discounting the expected future cash flows at a pre-tax rate that reflects current market assessments of the time value of money and the risks specific to the liability. The unwinding of the discount is recognised as a finance cost.
Provision for asset retirement obligations
The provision for retirement and decommissioning of assets, which comprise mainly generating stations, wind farms and ESB Networks creosote treated wood poles represents the present value of the current estimate of the costs of closure of the stations and the disposal of the poles at the end of their useful lives.
The estimated costs of closing stations and other asset retirement obligations are recognised in full at the outset of the asset life, but discounted to present values using an appropriate pre-tax discount rate. The costs are capitalised in property, plant and equipment and are depreciated over the useful economic lives of the stations or other assets to which they relate unless the related asset has reached the end of its useful life. Subsequent changes in the liability in respect of assets that have reached the end of their useful life are recognised in the income statement as they occur. The costs are reviewed each year and amended as appropriate. Amendments to the discounted estimated costs are capitalised into the relevant assets and depreciated over the remaining life of those assets to the extent that the assets are still in use.
As the costs are capitalised and initially provided on a discounted basis, the provision is increased by a financing charge in each period, which is calculated based on the provision balance and discount rate applied at the last measurement date (updated annually) and is included in the income statement as a financing charge. In this way, the provision will equal the estimated closure costs at the end of the useful economic lives of stations or other assets. The actual expenditure is set against the provision as stations are closed or other obligations are met.
The provision for generating station closure costs and other asset retirement obligations is included within current or non-current provisions as appropriate on the balance sheet.
(XVIII) EMPLOYEE RELATED LIABILITIES(a) Restructuring liabilities
Voluntary termination benefits are payable under various collective agreements between the Board of ESB and Union Staff when an employee accepts voluntary redundancy in exchange for these benefits. The Group recognises termination benefits when it is demonstrably committed, without realistic possibility of withdrawal, to a formal detailed plan to either terminate employment before the normal retirement age, or to provide termination benefits as a result of an offer made to employees to encourage voluntary redundancy. Ordinary termination benefits not covered by the aforementioned agreement are recognised at the earlier of when the Group can no longer withdraw the offer of those benefits and when the Group begins to implement the restructuring plan. Benefits expected to be settled more than twelve months after the balance sheet date are discounted to present value. Future operating losses are not provided for.
(b) Other short-term employee related liabilities
The costs of holiday leave and bonuses accrued are recognised when employees render the service or performance that increases their entitlement to future compensated absences or payments.
1. STATEMENT OF ACCOUNTING POLICIES (continued)
136 ESB Annual Report 2020 - Brighter Together ESB Annual Report 2020 137
NOTES TO THE FINANCIAL STATEMENTS NOTES TO THE FINANCIAL STATEMENTS

STR
ATEGY
AN
D P
ER
FOR
MA
NC
E
01
CO
RP
OR
ATE G
OV
ER
NA
NC
E
02
FINA
NC
IAL S
TATEM
EN
TS
03
(XIX) PENSION OBLIGATIONS
The Group companies operate various pension schemes in the Republic of Ireland and Northern Ireland, which are funded through payments to trustee administered funds.
Pension schemes in the Republic of Ireland
The Group operates two pension schemes, which are called the ESB Defined Benefit Pension Scheme and the ESB Defined Contribution Pension Scheme.
Pensions for the majority of employees in the electricity business are funded through a contributory pension scheme called the ESB Defined Benefit Pension Scheme. The fund is vested in Trustees nominated by ESB and its members for the sole benefit of employees and their dependants. The Scheme is registered as a Defined Benefit Scheme with the Pensions Authority.
The regulations governing the Scheme stipulate the benefits that are to be provided and the contributions to be paid by both ESB and the contributing members. Benefits payable are determined by reference to a Career Average Revalued Earnings (CARE) pension model for benefits earned after 1 January 2012 (previously based on final salary). ESB has no legal obligation to increase contributions to maintain benefits in the event of a deficit and ESB’s rate of contribution cannot be altered without the agreement of ESB and approval of the Minister for Environment, Climate and Communications. Should an actuarial deficit arise in the future, ESB is obliged under the Scheme regulations to consult with the Superannuation Committee, the Trustees and the Scheme Actuary to consider the necessity of submitting an amending Scheme for Ministerial approval.
Under the 2010 Pensions Agreement (approved by employees in July 2010 and formally ratified by the Board of ESB on 20 October 2010), ESB agreed to a once off cash injection into the Scheme, payable over a number of years, which had an agreed valuation for actuarial purposes as at 1 January 2010 of €591.0 million. The fixed contribution rates for the employer and for employees were not changed. Under the Agreement membership of the Scheme has been closed to new joiners.
The obligations to the Scheme reflected in ESB’s financial statements have been determined in accordance with IAS 19 Employee Benefits. Given that the Scheme is not a typical “balance of costs” Defined Benefit Scheme (where the employer is liable to pay the balance of contributions required to fund benefits), the obligations to be reflected in the financial statements require the exercise of judgement. Should a deficit arise in the future, the Company, as noted above, is obliged to consult with the parties to the Scheme. However, ESB has no obligation to increase contributions to maintain benefits in the event of a deficit and the Company does not intend that any further contributions, other than the normal on-going contributions and the balance of the Company’s €591.0 million additional contribution (committed to as part of the 2010 Pensions Agreement), will be made. Therefore, ESB has concluded that the financial statements should reflect its obligations to the Scheme, which consist of:
(a) any remaining amounts to be paid in relation to the once-off contribution agreed pursuant to the 2010 Agreement (€591.0 million in 2010 money to be paid over a number of years);
(b) pre-existing commitments relating to past service (the present value of the agreed contributions that relates to service prior to October 2010); and
(c) Past Voluntary Severance (VS) Programmes – in 2010 the Company recognised a future commitment in respect of staff who have left the Company under past VS programmes. ESB will make pension contributions in respect of those staff and these are recognised at fair value.
Ongoing contributions (up to 16.4%) are recognised in the income statement as incurred. Any unpaid amounts at year end are recognised as liabilities on the balance sheet.
The ESB Defined Contribution Pension Scheme is a defined contribution scheme and contributions to the Scheme are accounted for on a defined contribution basis with the employers’ contribution charged to income in the period the contributions become payable.
Pension scheme in Northern Ireland
The Group’s wholly owned subsidiary undertaking, Northern Ireland Electricity Networks Limited (NIE Networks), operates a pension scheme which has two sections: Defined Contribution Options, Defined Benefit Focus. Focus has been closed to new members since 1998. The defined benefit obligation of NIE Networks is calculated annually by independent actuaries using the projected unit credit method, and discounted at a rate selected with reference to the current rate of return of high quality corporate bonds of equivalent currency and term to the liabilities. Pension scheme assets are measured at fair value. Full actuarial valuations are obtained at least triennially and are updated annually thereafter. Actuarial gains and losses are recognised in full in the period in which they occur and are recognised in other comprehensive income.
The cost of providing benefits under the defined benefit scheme is charged to the income statement over the periods benefiting from employees’ service. Past service costs including curtailment losses are recognised in the income statement in the period they occur. The interest income from pension scheme assets and the interest expense on pension scheme liabilities are included within net finance cost.
(XX) REVENUE FROM CONTRACTS WITH CUSTOMERS
Revenue principally comprises the sales values derived from the following:
• Customer Solutions revenues consist primarily of sales to electricity and gas customers.• ESB Networks and NIE Networks earn Use of System income in the Republic of Ireland and Northern Ireland respectively.• Generation and Trading revenue derives mainly from electricity generation.• Revenue derived from the provision of engineering, telecommunication and other services.
1. STATEMENT OF ACCOUNTING POLICIES (continued)
(XX) REVENUE FROM CONTRACTS WITH CUSTOMERS (continued)
Customer Solutions Revenue from sales to electricity and gas customers
This revenue is earned from both residential and business customers in the Republic of Ireland (ROI), Northern Ireland (NI) and Great Britain (GB). Revenue is recognised over time on consumption of gas and electricity. Electricity and gas revenue includes the value of units supplied to customers between the date of the last meter reading and the period end. This estimate is initially included in trade and other receivables in the balance sheet as retail electricity - unbilled, customers are billed monthly or bi-monthly depending on the type of account, and are subsequently recognised as retail electricity receivables - billed. Residential credit terms and debtor days in respect of retail electricity receivables are 14 days. Credit terms for business customers vary by contract.
Unbilled revenue is arrived at by using estimated revenue which is calculated by applying the tariffs applicable to specific customers types to estimated volume of electricity or gas consumed across those customers types, less the total amounts already billed for the relevant period. This process includes the analysis of calculated unbilled volumes and rates (in GWh and millions of therms) taking into consideration, movements in pricing tariffs, seasonality and data on total consumption by supplier obtained by I-SEM. There are a number of offerings such as sign-up bonuses, discounts and rewards available to customers which are all accounted for as variable consideration under IFRS 15. Discounts and rewards that are enduring and are applied over time to our relevant customer bills. On joining the sign-up bonuses are applied to customer accounts which are recognised over time in line with customer usage.
Other revenue
Other revenue comprises of income derived from the provision of energy and telecommunications services and represents the fair value of services and works delivered to customers. Services are deemed to have been delivered to customers when, and to the extent that, the entity has met its performance obligations under its contracts. Revenue is recognised over time in accordance with the input method in the income statement in line with the contract terms in proportion to the stage of completion, based on total costs of the contract. Billed revenue is recognised as a trade receivable-non electricity and is normally settled in 30 business days. Unbilled revenue is recognised in other receivables.
ESB Networks - Revenue from Use of System charges to customers
ESB Networks mainly recognises revenue from Use of System that comprises of Distribution Use of System (DUoS) revenue and Transmission Use of System (TUoS) revenue. ESB Networks operates in the Republic of Ireland and is a regulated business, earning its revenue primarily from an allowed return on its Regulated Asset Base (RAB).
DUoS revenue is earned through charges to suppliers for the use of the ESB Networks distribution system. DUoS revenue is recognised in line with the use of the system by suppliers and any outstanding billed and unbilled usage for DUoS is included as a Use of System receivable on the balance sheet. DUoS revenue is invoiced on a bi-monthly basis. Revenue is also earned from operations & maintenance annual charges for generators connected to the Distribution system. These are based on a standard amount per km line or cable and are recognised over time as the performance obligation is satisfied.
TUoS revenue is earned by maintaining the transmission assets to facilitate the effective operation by EirGrid. For this fixed price contract TUoS revenue is recognised over time on a straight-line basis and a Use of System receivable is recognised on the balance sheet.
ESB Networks receives non-repayable supply contributions income as a result of providing new connections to its existing network in respect of property, plant and equipment. These contributions are held in trade payables as progress payments until their performance obligation is satisfied, when the work on the connection has met the performance obligation they are transferred to deferred income and released to revenue in the income statement over the estimated useful economic lives of the related assets. The useful life of these assets is estimated at 25 and 30 years for distribution and transmission respectively.
ESB Networks also recognises revenue from a number of unregulated sources. Revenue is recognised from providing ancillary network services and other miscellaneous income. All unregulated income is recognised at a point in time with a corresponding receivable carried on the balance sheet for each item.
NIE Networks - Revenue from Use of System charges to customers
NIE Networks derives its revenue principally through charges for use of the distribution system (DUoS) levelled on electricity suppliers and transmission service charges (TSC) mainly for use of the transmission system levied on System Operator for Northern Ireland (SONI).
DUoS revenue is recognised in line with the use of the system by suppliers and any outstanding billed and unbilled usage for DUoS is included within Use of System receivable at the balance sheet date.
TSC revenue is earned by maintaining the transmission assets to facilitate the effective operation by SONI. For this fixed price contract TSC revenue is recognised over time on a straight line basis and a Use of System receivable is recognised on the balance sheet.
NIE Networks receives non-repayable supply contributions income as a result of providing new connections to its existing network in respect of property, plant and equipment. These contributions are held in trade payables as progress payments until their performance obligation is satisfied, when the work on the connection has met the performance obligation they are transferred to deferred income and released to revenue in the income statement over the estimated useful economic lives of the related assets.
Generation and Trading Revenue derives mainly from electricity generation
Republic of Ireland
Integrated-Single Electricity Market (I-SEM)
The I-SEM is wholesale electricity market arrangement for Ireland and Northern Ireland that went live on 1 October 2018. The SEM market is now replaced by multiple markets or auctions, each spanning different trading time frames, with separate (although related) clearing and settlement mechanisms.
There are two ex-ante markets for physical energy: the Day-Ahead Market and the Intraday Market. In addition, Energy balancing services are offered into the Balancing Market by generators (energy producers) and suppliers (energy consumers). Capacity is a commitment by a generator or interconnector owner to be available to deliver energy into the grid, if called on to do so. Capacity providers who are successful in the Capacity Market receive a regular capacity payment, which assists with funding generation capacity. Revenue from the sale of electricity in the I-SEM markets are recognised over time on consumption of electricity and an I-SEM receivable is recognised on the balance sheet and settled daily for the ex-ante market and weekly for the ex-post market.
Capacity income is received through the 'Capacity Remuneration Mechanism' (CRM) where a capacity payment is made to a participant in respect of a Generator Unit in each Capacity Period on the basis of the Unit’s Eligible Availability, which is based on the Unit’s Availability Profile. Revenue is recognised over time and recognised as an I-SEM receivable on the balance sheet and settled within one month.
Ancillary income is received through 'Delivering a Secure Sustainable Electricity System' (DS3) programme for provision of frequency response services to the grid. Ancillary income is recognised over time. Ancillary income is recognised as a SEM / I-SEM receivable on the balance sheet and settled within one month.
1. STATEMENT OF ACCOUNTING POLICIES (continued)
NOTES TO THE FINANCIAL STATEMENTS
138 ESB Annual Report 2020 - Brighter Together ESB Annual Report 2020 139
NOTES TO THE FINANCIAL STATEMENTS

STR
ATEGY
AN
D P
ER
FOR
MA
NC
E
01
CO
RP
OR
ATE G
OV
ER
NA
NC
E
02
FINA
NC
IAL S
TATEM
EN
TS
03
140 ESB Annual Report 2020 - Brighter Together ESB Annual Report 2020 141
(XX) REVENUE FROM CONTRACTS WITH CUSTOMER (continued)
Generation and Trading revenue derives mainly from electricity generation
Great Britain
British Electricity Trading and Transmission Arrangements is the wholesale electricity market operating in Great Britain (GB). Unlike the I-SEM, trading can take place between generators and suppliers either bilaterally or through exchanges. Both physical and financial contracts can be struck to manage price volatility, for timescales ranging from several years ahead to on-the-day trading markets. The British Government operates a capacity remuneration scheme and under the scheme, generators are awarded capacity contracts (based on the outcome of an auction) that enable them to receive payments for the provision of generation capacity while also receiving penalties for non-delivery during scarcity events. Revenue in respect of capacity payments is recognised over time.
Revenue derived from GB is through the sale of power to individual UK counterparties and is recognised over time when performance obligations are satisfied. Revenue relating to the GB market is recognised as other electricity receivables on the balance sheet and settled daily or monthly depending on the terms of the individual contract.
Other Segments - Other revenue
Other revenue comprises of income derived from the provision of electrical, mechanical, civil, environmental, engineering and consultancy services and represents the fair value of services and works delivered to customers.
Services are deemed to have been delivered to customers when, and to the extent that, the entity has met its performance obligations under its contracts. Revenue is recognised over time in accordance with the input method in the income statement in line with the contract terms in proportion to the stage of completion, based on total costs of the contract. Billed revenue is recognised as a trade receivable-non electricity and settled in 30 business days. Unbilled revenue is recognised in other receivables.
(XXI) OTHER OPERATING INCOME
Other operating income comprises of income which accrues to the Group outside of the Group’s normal trading activities.
(XXII) OPERATING SEGMENTS - IFRS 8
ESB have voluntarily applied the disclosure requirements of IFRS 8 Operating Segments to the Group. IFRS 8 specifies how an entity should disclose information about its segments using a "management approach" under which segment information is presented on the same basis as that used for internal reporting. Financial information for segments whose operating activities are regularly reviewed by the Executive Team and the Board, collectively the Chief Operating Decision Maker (CODM), in order to make decisions about allocating resources and assessing performance has been presented in note 2 to the financial statements.
(XXIII) COSTS
(a) Employee costs
Salaries, overtime, expenses, bonuses, social welfare contributions (PRSI), national insurance, paid annual leave and sick leave are accrued in the period in which the associated services are rendered by the employees of the Group.
(b) Energy costs
Energy costs comprise direct fuel (primarily coal and gas), purchased electricity, Use of System charges (other electricity costs) and net emissions costs. Fuel and purchased electricity costs are recognised as they are utilised. The Group has entered into certain long term power purchase agreements for fixed amounts. Amounts payable under the contracts that are in excess of or below market rates are recoverable by the Group or repayable to the market under the Public Service Obligation (PSO) levy.
(c) Operating and other maintenance costs
Operating and other maintenance costs relate primarily to overhaul and project costs, contractor costs and establishment costs. These costs are recognised in the income statement as they are incurred.
(d) Finance income and finance costs
Finance income comprises interest income on bank deposits, which attract interest at prevailing deposit interest rates in addition to interest income on loans.
Finance costs comprise interest expense on borrowings, unwinding of the discount on provisions, pension financing charges, fair value gains and losses on financial instruments not qualifying for where hedge accounting is not applied, losses on hedging instruments that are not recognised in operating costs and reclassifications of amounts previously recognised in other comprehensive income.
(XXIV) EXCEPTIONAL ITEMS
The Group has used the term “exceptional” to describe certain items which, in management’s view, warrant separate disclosure by virtue of their size or incidence, or due to the fact that certain gains or losses are determined to be non-recurring in nature. Exceptional items may include restructuring, significant impairments, profit or loss on asset disposals, material changes in estimates or once off costs where separate identification is important to gain an understanding of the financial statements. Further details of the Group's exceptional items are provided in note 5 of the financial statements.
1. STATEMENT OF ACCOUNTING POLICIES (continued)
NOTES TO THE FINANCIAL STATEMENTS 2. SEGMENT REPORTING
NOTES TO THE FINANCIAL STATEMENTS
The Group has applied IFRS 8 Operating Segments, and has made the appropriate disclosures in these financial statements.
For management purposes, the Group is organised into four key reportable segments, being the Group's strategic divisions which are managed separately and in respect of which internal management information is supplied to Executive Management and to the Board being collectively the Chief Operating Decision Maker (CODM) of the Group. Three further corporate divisions provide support and other services to the principal operating divisions of the Group and are combined as Other Segments in the information below.
A description of the Group's key reportable segments is as follows:
(a) Customer Solutions develops, markets, sells and services innovative energy supply and service offerings through all of ESB’s customer-facing brands (Electric Ireland, Smart Energy Services, ESB e-Cars, ESB Telecoms and ESB Energy) in Ireland (ROI and NI) and Great Britain (GB). Electric Ireland is the leading supplier of electricity and gas to domestic customers on the island of Ireland. Customer Solutions operates in the GB domestic market through ESB Energy. Electric Ireland also has a substantial market share in the non-domestic sector in both the ROI and NI. Revenues are primarily derived from sales to electricity and gas customers.
(b) ESB Networks is principally concerned with the ownership and operation of the electricity distribution network and the ownership of the electricity transmission network in ROI. ESB Networks is a regulated business earning an allowed return on its Regulated Asset Base (RAB) and derives its revenue principally from charges for the use of the distribution system levied on electricity suppliers and from charges for transmission services collected from EirGrid Plc. It is ring-fenced by regulation from the Group's generation and supply business.
(c) Generation and Trading operates, develops, constructs and trades the output of power stations and wind farms in ROI, NI and GB. This includes wholly owned subsidiaries and investments in joint ventures.
(d) NIE Networks is principally concerned with the ownership and operation of the electricity distribution network and the ownership of the electricity transmission network in NI. NIE Networks is a regulated business earning an allowed return on its Regulated Asset Base (RAB) and derives its revenue principally from charges for the use of the distribution system levied on electricity suppliers and from charges for transmission services collected from the System Operator for Northern Ireland (SONI).
(e) Other Segments include the results of internal service providers, which supply the main business units of the Group with support services. These segments are governed by regulation, and service level agreements are designed to ensure that transactions between operating segments are on an arm's length basis similar to transactions with third parties. This segment also includes most finance costs in the Group, as the majority of Treasury activity is conducted centrally. Finance costs incurred centrally are not recharged to other operating segments.
The CODM monitors the operating results of the segments separately in order to allocate resources between segments and to assess performance. Segment performance is predominantly evaluated based on operating profit. Assets and liabilities are not reported by segment to the CODM.
Revenue by productReportable segments are split by type of product revenue earned. Customer Solutions revenues consist of sales to electricity and gas customers and other related services as set out at (a) above. Generation and Trading revenue derives mainly from electricity generation. ESB Networks and NIE Networks earn Use of System income in the ROI and NI respectively. Revenue included within Other Segments relates primarily to engineering services.

STR
ATEGY
AN
D P
ER
FOR
MA
NC
E
01
CO
RP
OR
ATE G
OV
ER
NA
NC
E
02
FINA
NC
IAL S
TATEM
EN
TS
03
142 ESB Annual Report 2020 - Brighter Together ESB Annual Report 2020 143
NOTES TO THE FINANCIAL STATEMENTS 2. SEGMENT REPORTING (continued)
(a) Income statement
(i) Segment revenue - 2020Customer Solutions
ESB Networks
Generation and Trading
NIE Networks
Other Segments
Consolidation and
eliminations Total€m €m €m €m €m €m €m
External revenues 2,170.0 847.5 399.7 293.1 21.1 - 3,731.4 Inter-segment revenue 1.8 384.4 946.7 43.5 307.9 (1,684.3) - Revenue 2,171.8 1,231.9 1,346.4 336.6 329.0 (1,684.3) 3,731.4
(ii) Segment operating costs - 2020
Depreciation and amortisation (20.2) (469.5) (130.9) (161.3) (24.8) - (806.7)Net other operating costs (2,069.8) (394.0) (1,094.3) (89.9) (307.1) 1,684.3 (2,270.8)Impairment charge - - (13.1) - - - (13.1)Net impairment losses on financial assets (24.0) (0.3) - (0.3) (0.2) - (24.8)Exceptional operating costs including impairment charges
- (59.7) (187.6) - - - (247.3)
Costs (2,114.0) (923.5) (1,425.9) (251.5) (332.1) 1,684.3 (3,362.7)
(iii) Operating result - 2020
Operating profit / (loss) - including exceptional items 57.8 308.4 (79.5) 85.1 (3.1) - 368.7 Net finance cost (0.4) (2.1) (36.5) (42.3) (111.1) - (192.4)
Share of equity accounted investees' profit / (loss) - - 19.0 - (9.7) - 9.3 Profit / (loss) before taxation 57.4 306.3 (97.0) 42.8 (123.9) - 185.6
(i) Segment revenue - 2019
Customer Solutions
ESB Networks
Generation and Trading
NIE Networks
Other Segments
Consolidation and
eliminations Total€m €m €m €m €m €m €m
External revenues 2,061.2 787.3 557.3 267.7 36.0 - 3,709.5 Inter-segment revenue 8.2 368.7 961.0 34.8 290.0 (1,662.7) - Revenue 2,069.4 1,156.0 1,518.3 302.5 326.0 (1,662.7) 3,709.5
(ii) Segment operating costs - 2019
Depreciation and amortisation (30.5) (435.0) (159.6) (154.3) (26.8) - (806.2)Net other operating costs (1,968.4) (376.7) (1,149.4) (87.4) (278.3) 1,662.7 (2,197.5)Impairment charge - - (11.9) - - - (11.9)Net impairment losses on financial assets (11.1) - (34.4) - (0.7) - (46.2)Exceptional operating costs excluding impairment charges
- - (59.8) - - - (59.8)
Costs (2,010.0) (811.7) (1,415.1) (241.7) (305.8) 1,662.7 (3,121.6)
(iii) Operating result - 2019
Operating profit - including exceptional items 59.4 344.3 103.2 60.8 20.2 - 587.9 Net finance cost (0.2) (2.2) (36.8) (42.6) (100.6) - (182.4)
Share of equity accounted investees' profit / (loss) - - 4.5 - (12.8) - (8.3)
Profit / (loss) before taxation 59.2 342.1 70.9 18.2 (93.2) - 397.2
All inter-segment revenues are eliminated upon consolidation and are reflected in the eliminations column above.
NOTES TO THE FINANCIAL STATEMENTS NOTES TO THE FINANCIAL STATEMENTS 2. SEGMENT REPORTING (continued)
(b) Other disclosures 2020 2019€m €m
Additions to non-current assetsCustomer Solutions 27.0 28.4 ESB Networks 748.5 580.8 Generation and Trading 121.3 423.9 NIE Networks 140.4 154.2 Other Segments 77.7 55.3 Total 1,114.9 1,242.6
Additions to non-current assets (excluding acquisitions) includes investments in property, plant and equipment, intangible assets (excluding emission allowances), financial assets and equity accounted investees.
3. REVENUE FROM CONTRACTS WITH CUSTOMERS
IFRS 15 requires disclosure to reflect the nature, timing, amount and uncertainty of its revenue within its disclosure requirements. ESB has determined that the disaggregation using existing segments and the nature of revenues is appropriate for its circumstances.
2020Customer Solutions
ESB Networks
Generation and Trading
NIE Networks
Other Segments
Consolidation and
eliminations Total€m €m €m €m €m €m €m
External revenues Revenue from power generation - - 399.7 - - - 399.7 Revenue from Use of System charges to customers
- 786.9 - 275.4 - - 1,062.3
Revenue from supply contributions - 60.6 - 17.7 - - 78.3 Revenue from sales to electricity and gas customers
2,105.6 - - - - - 2,105.6
Other revenue 64.4 - - - 21.1 - 85.5 Revenue from contracts with customers
2,170.0 847.5 399.7 293.1 21.1 - 3,731.4
Inter-segment revenue 1.8 384.4 946.7 43.5 307.9 (1,684.3) - Total ESB Group revenue 2,171.8 1,231.9 1,346.4 336.6 329.0 (1,684.3) 3,731.4
2019Customer Solutions
ESB Networks
Generation and Trading
NIE Networks
Other Segments
Consolidation and
eliminations Total€m €m €m €m €m €m €m
External revenues Revenue from power generation - - 557.3 - - - 557.3 Revenue from Use of System charges to customers
- 734.9 - 251.6 - - 986.5
Revenue from supply contributions - 52.4 - 16.1 - - 68.5 Revenue from sales to electricity and gas customers
2,030.7 - - - - - 2,030.7
Other revenue 30.5 - - - 36.0 - 66.5 Revenue from contracts with customers
2,061.2 787.3 557.3 267.7 36.0 - 3,709.5
Inter-segment revenue 8.2 368.7 961.0 34.8 290.0 (1,662.7) - Total ESB Group revenue 2,069.4 1,156.0 1,518.3 302.5 326.0 (1,662.7) 3,709.5

STR
ATEGY
AN
D P
ER
FOR
MA
NC
E
01
CO
RP
OR
ATE G
OV
ER
NA
NC
E
02
FINA
NC
IAL S
TATEM
EN
TS
03
144 ESB Annual Report 2020 - Brighter Together ESB Annual Report 2020 145
NOTES TO THE FINANCIAL STATEMENTS 4. GEOGRAPHIC INFORMATION
(a) Non-current assets by geographic location 2020 2019€m €m
Ireland 8,474.4 8,386.7 UK including Northern Ireland 3,175.1 3,460.4 Total 11,649.5 11,847.1
Non-current assets for this purpose consist of property, plant and equipment, intangible assets, right-of-use assets and goodwill. Investments in equity accounted investees, financial asset investments, trade and other receivables, derivative financial instruments and deferred tax assets are excluded.
(b) External revenue by geographic market 2020 2019€m €m
Ireland 2,809.3 2,822.3 UK including Northern Ireland 897.8 858.2 Rest of world 24.3 29.0 Total 3,731.4 3,709.5
5. EXCEPTIONAL ITEMS
2020 2019€m €m
Net impairment losses on financial assets - 34.4
Impairment charges 187.6 - Exit costs - severance schemes - 54.8 Operating costs 59.7 5.0 Operating costs 247.3 59.8
2020 Impairment charges
IAS 36 - Impairment of Assets stipulates that an impairment loss is the amount by which the carrying value of an asset exceeds its recoverable amount. The recoverable amount is the higher of an asset’s fair value less costs of disposal and its value in use. Value in use is calculated by taking the Net Present Value (NPV) of expected future cash flows from the asset discounted at an appropriate discount rate.
The impact of COVID-19 on electricity demand in the short term, in addition to lower forecast wholesale electricity margins in both the GB market and the Integrated Single Electricity Market (I-SEM) were the indicators that prompted an impairment review as at 31 December 2020. The main assumptions used in preparing impairment reviews are outlined below:• Specific discount rates are applied to each class of asset and applied to their cash inflows and outflows in determining the NPV.• Forecast cash inflows for each asset and generation plant are based on the expected energy margin produced by the plant which is calculated based
on forecasted running profiles for the plants, regulatory support, forward market and AFRY prices for electricity, gas and carbon.• Forecast cash outflows reflect the forecast operating and capital expenditure plans based on the Board approved five-year business plans and 10-year
long term asset plans updated for management’s latest view. Thereafter, forecast cash outflows are extrapolated based on forecast inflation rates,forecast running profile and management's view of required operating and capital expenditure.
• Sensitivity analysis is performed in respect of significant assumptions.
Carrington is an 885MW Combined Cycle Gas Turbines plant in the Generation and Trading segment located in Great Britain (GB). It was commissioned in September 2016.
A value in use calculation was used to determine the recoverable amount as €383.0 million as at 31 December 2020. This resulted in an impairment charge of €187.6 million, (31 December 2019: €nil). The impairment reflected somewhat lower forecasted demand in addition to lower day ahead power prices and lower peak prices, both resulting in lower forecasted revenue and margins. The real discount rate applied to the projected cash flows to determine the NPV was a pre-tax rate of 6.1% (2019: 6.1%).
2020 Operating costs
The Group provides for the estimated future costs arising from certain obligations in relation to the retirement and decommissioning of ESB Networks creosote treated wood poles at the end of their useful economic life (see note 27) in line with IAS 37, Provisions, Contingent Liabilities and Contingent Assets. This asset retirement provision is re-examined annually, and the liability re-calculated in accordance with the most recent expected estimates.
The asset retirement provision for the disposal creosote wood poles has increased by €129 million. In accordance with IFRIC 1 Changes in Existing Decommissioning, Restoration and Similar Liabilities, a charge of €59.7 million has been included in the income statement in respect of the portion of the increase in the provision that relates to assets that have been fully depreciated as at 31 December 2020.
The increase in the provision arises from the Group’s estimate of the increased cost of disposal per pole, partially offset by changes in the Group’s assumptions of the timeframe for the disposal of poles.
NOTES TO THE FINANCIAL STATEMENTS
6. OTHER OPERATING INCOME / (EXPENSES)
2020 2019€m €m
Profit on disposal of property, plant and equipment and intangible assets 11.5 7.1 Dividends received 0.7 1.6 Fair value movements on assets through profit and loss 6.4 - Total 18.6 8.7
5. EXCEPTIONAL ITEMS (continued)
2019 Net impairment losses on financial assets
Tilbury Green Power Holdings Limited owns a 40MW biomass fuelled power plant that ESB jointly invested in along with UK Green Infrastructure Platform and the EPC Consortium. The plant is located approximately 30km east of London and uses sustainable, locally sourced, waste wood from the greater London area. The plant achieved commercial operation in 2019. An impairment review of the shareholder loan to the project was completed prompted by the existence of impairment indicators primarily due to delays in achieving commercial operation and reduced plant running versus expected levels arising from technical issues. The impairment assessment of the shareholder loan was based on forecast interest and debt repayments and was discounted at 12.56% being the effective rate of interest on the loan in line with IFRS 9. Impairment charges of €34.4 million were recognised in operating costs in relation to the shareholder loan. The full value of the loan outstanding as at 31 December 2019 was impaired.
2019 Exit costs - severance schemes
During 2019 the closure of the peat stations in the midlands at the end of 2020 was announced and the North Wall plant in Dublin ceased operations. Demand for coal fired generation fell in 2019 and this led to a significant rationalisation of operations at the Moneypoint plant. As a result of these developments in the business and after consultation with stakeholders a provision for the cost of severance schemes was put in place. At 31 December 2019 a charge of €54.8 million was taken to the Income Statement in respect of the severance schemes.
2019 Operating costs
In addition to the severance schemes, a charge of €5.0 million was included in operations and maintenance costs representing ESB’s contribution to a ‘Just Transition Fund’ for the midlands in recognition of the economic impact on the region in the wake of announcement of the planned closure of the two peat stations.
7. OPERATING COSTS (including net impairment losses on financial assets)
2020 2019€m €m
Employee costs (note 9) 494.3 545.1 Energy costs1 1,270.1 1,287.1 Operations and maintenance2 584.7 433.8 Net impairment losses on financial assets (note 17)3 24.8 46.2 Depreciation and amortisation (notes 11 / 12 / 13) 806.7 806.2 Impairment charges4 200.7 11.9 Total 3,381.3 3,130.3
1 Included in energy costs is a charge of €2.6 million (2019: €8.7 million) relating to the fair valuing of fuel commodity swaps which have not been designated as accounting hedges.
2 Included in operations and maintenance is a foreign exchange retranslation loss of €13.0 million (2019: €25.0 million gain) on sterling denominated intercompany positions.
3 Net impairment losses on financial assets include impairment losses incurred on trade and other receivables of €24.8 million (2019: €11.8 million) and exceptional impairment charges incurred on loans to equity accounted investees of €nil (2019: €34.4 million) - see further detail in notes 5 and 17.
4 Impairment charges of €200.7 million (2019: €11.9 million) in respect of Property, plant and equipment, intangible assets and right-of-use assets have been recognised in 2020, €187.6 million (2019: €nil) of which have been disclosed as exceptional items in the Income Statement.

STR
ATEGY
AN
D P
ER
FOR
MA
NC
E
01
CO
RP
OR
ATE G
OV
ER
NA
NC
E
02
FINA
NC
IAL S
TATEM
EN
TS
03
146 ESB Annual Report 2020 - Brighter Together ESB Annual Report 2020 147
NOTES TO THE FINANCIAL STATEMENTS NOTES TO THE FINANCIAL STATEMENTS NOTES TO THE FINANCIAL STATEMENTS 8. NET FINANCE COST AND OTHER FINANCING CHARGES
2020 2019€m €m
Interest payable on borrowings 149.7 179.7 Less capitalised interest (24.2) (27.5)Net interest on borrowings 125.5 152.2
Financing charges:- on NIE Networks pension scheme (note 23) 2.1 2.7 - on ESB pension scheme (note 24) 12.4 9.5 - on provisions (note 27) 2.0 2.4 - on lease obligations (note 13) 2.1 2.0 Total financing charges 18.6 16.6
Fair value (gains) / losses on financial instruments: - currency / interest rate swaps: cash flow hedges, transfer from OCI 5.2 (2.4) - interest rate swaps and inflation linked swaps not qualifying for hedge accounting 45.2 18.1 - foreign exchange contracts not qualifying for hedge accounting - 0.1 Total fair value losses on financial instruments 50.4 15.8
Finance cost 194.5 184.6 Finance income (2.1) (2.2)
Net finance cost 192.4 182.4
The financing charges on provisions are calculated in accordance with the policy for discounting of future payment obligations as disclosed in the accounting polices - see note 1.
Included in interest rate swaps and inflation linked swaps not qualifying for hedge accounting are fair value losses relating to interest rate swaps, fair value losses on inflation linked interest rate swaps and fair value gains on currency swaps. See note 22a for further details of these movements.
Included in finance income is interest on borrowings receivable from Aldeburgh Offshore Wind Holdings Limited €nil (2019: €0.2 million), Oweninny Power DAC €0.3 million (2019: €0.3 million). See note 15 for further details.
9. EMPLOYEES
GROUP
(a) Average number of employees in year by business activity, including temporary employees: 2020Number
2019Number
Generation and Trading 796 914 Customer Solutions 614 551 ESB Networks 3,436 3,490 NIE Networks 1,209 1,208 Other Segments 1,883 1,811 Total 7,938 7,974
(b) Employee costs in year 2020 2019€m €m
Current staff costs (excluding pension)Salaries 541.0 529.2 Overtime 38.3 41.2 Social welfare costs (PRSI and national insurance) 45.0 43.0 Other payroll benefits1 26.2 37.0 Payroll cost for employees 650.5 650.4
(c) Pension and other employee benefit costsExit costs - severance programmes3 1.7 55.2 Pensions charge - other schemes2 50.4 52.5 NIE Networks pension scheme charge4 7.5 7.9
710.1 766.0
Capitalised payroll (215.8) (220.9)Total employee related costs charged to the Income Statement 494.3 545.1
1 These benefits primarily include travel and subsistence allowances.
2 The pension charge for other schemes include contributions of €25.6 million (2019: €30.1 million) to the ESB Defined Benefit Pension Scheme, €15.8 million (2019: €14.1 million) to the ESB Defined Contribution Scheme, €8.2 million (2019: €7.3 million) to the Options section of the NIE Networks Pension Scheme (NIE Networks Scheme) and €0.8 million (2019: €1.0 million) to the stakeholder pension scheme for Great Britain (GB) employees (FMUK Pension Scheme). This charge also includes past service credit of €0.9 million (2019: €nil). See note 23 and 24 for further details.
3 During 2019 ESB announced the planned closure of two peat-fired power generating plants, closure of North Wall station and significant rationalisation of Moneypoint operations. Further details are set out in note 5.
4 The NIE Networks Pension Scheme charge relates solely to the Focus section of the Northern Ireland Electricity Scheme (the NIE Networks Scheme). See note 23 for further details.

STR
ATEGY
AN
D P
ER
FOR
MA
NC
E
01
CO
RP
OR
ATE G
OV
ER
NA
NC
E
02
FINA
NC
IAL S
TATEM
EN
TS
03
148 ESB Annual Report 2020 - Brighter Together ESB Annual Report 2020 149
NOTES TO THE FINANCIAL STATEMENTS NOTES TO THE FINANCIAL STATEMENTS NOTES TO THE FINANCIAL STATEMENTS 9. EMPLOYEES (continued)
PARENT
(a) Average number of employees in year by business activity, including temporary employees: 2020Number
2019Number
Generation and Trading 534 636 Customer Solutions 354 343 ESB Networks 3,418 3,473 Other Segments 1,729 1,649 Total 6,035 6,101
(b) Employee costs in year 2020 2019€m €m
Current staff costs (excluding pension)Salaries 429.9 421.2 Overtime 31.8 34.9 Social welfare costs (PRSI) 35.2 33.4 Other payroll benefits1 20.6 30.4 Payroll cost for employees 517.5 519.9
(c) Pension and other employee benefit costsExit costs - severance programmes 1.7 55.2 Pension charge2 37.9 40.6
557.1 615.7
Capitalised payroll (164.6) (166.2)Total employee related costs charged to the Income Statement 392.5 449.5
1 These benefits primarily include travel and subsistence allowances.
2 The pension charge includes contributions to the ESB Defined Contribution Scheme and the ESB Defined Benefit Pension Scheme. See note 23 for further details.
10. PROFIT FOR THE FINANCIAL YEAR 2020 2019€m €m
The profit for the financial year is stated after charging / (crediting):
Auditor's remuneration:- Audit of individual and Group financial statements1 1.0 1.3 - Other assurance services 0.2 0.2 - Other non-audit services - 0.1
ESB (Parent) Board members' remuneration:- Emoluments 0.5 0.5 - Pension contributions 0.1 0.1
The details of Board members remuneration do not include amounts paid to four Worker Board members as employees of ESB (as such pay is neither increased nor decreased because of their membership of the Board), but do include amounts paid to them by way of Board fees.
1 €0.4 million (2019: €0.4 million) related to the audit of Parent company. Additionally, €0.1 million is payable to PwC Belfast in respect of the 2020 audit of NIE Networks (2019: €0.1 million). The audit of individual and Group financial statements includes the audit of subsidiary companies.
11. PROPERTY, PLANT & EQUIPMENTLand and Plant and Total assets in Assets underbuildings machinery commission construction Total
GROUP €m €m €m €m €m
CostBalance at 1 January 2019 1,217.0 19,417.9 20,634.9 1,236.3 21,871.2
Additions 12.4 430.5 442.9 444.8 887.7 Retirements / disposals (35.4) (184.9) (220.3) - (220.3)Transfers out of assets under construction 25.6 288.9 314.5 (314.5) - Transfers from intangible assets - 0.6 0.6 - 0.6 Translation differences 0.5 260.1 260.6 0.2 260.8
Balance at 31 December 2019 1,220.1 20,213.1 21,433.2 1,366.8 22,800.0
Balance at 1 January 2020 1,220.1 20,213.1 21,433.2 1,366.8 22,800.0
Additions - 443.2 443.2 510.5 953.7 Retirements / disposals (1.0) (31.9) (32.9) - (32.9)Transfers out of assets under construction 22.7 550.1 572.8 (572.8) - Transfers from intangible assets - 0.7 0.7 0.5 1.2 Translation differences (1.0) (284.6) (285.6) (1.7) (287.3)
Balance at 31 December 2020 1,240.8 20,890.6 22,131.4 1,303.3 23,434.7
Depreciation Balance at 1 January 2019 713.3 10,402.7 11,116.0 - 11,116.0
Charge for the year 20.5 696.1 716.6 - 716.6 Retirements / disposals (34.8) (184.0) (218.8) - (218.8)Impairment - 5.3 5.3 - 5.3 Translation differences 0.1 103.4 103.5 - 103.5
Balance at 31 December 2019 699.1 11,023.5 11,722.6 - 11,722.6
Balance at 1 January 2020 699.1 11,023.5 11,722.6 - 11,722.6
Charge for the year 21.4 711.7 733.1 - 733.1 Retirements / disposals (0.9) (29.9) (30.8) - (30.8)Other transfers (0.8) 0.8 - - - Impairment - 197.8 197.8 1.6 199.4 Translation differences - (119.7) (119.7) - (119.7)
Balance at 31 December 2020 718.8 11,784.2 12,503.0 1.6 12,504.6
Net book value at 31 December 2020 522.0 9,106.4 9,628.4 1,301.7 10,930.1
Net book value at 31 December 2019 521.0 9,189.6 9,710.6 1,366.8 11,077.4
Net book value at 1 January 2019 503.7 9,015.2 9,518.9 1,236.3 10,755.2

STR
ATEGY
AN
D P
ER
FOR
MA
NC
E
01
CO
RP
OR
ATE G
OV
ER
NA
NC
E
02
FINA
NC
IAL S
TATEM
EN
TS
03
150 ESB Annual Report 2020 - Brighter Together ESB Annual Report 2020 151
Depreciation Balance at 1 January 2019 693.0 8,398.7 9,091.7 - 9,091.7
Charge for the year 20.1 459.7 479.8 - 479.8 Retirements / disposals (31.1) (183.3) (214.4) - (214.4)Other transfers - 8.3 8.3 - 8.3 Balance at 31 December 2019 682.0 8,683.4 9,365.4 - 9,365.4
Balance at 1 January 2020 682.0 8,683.4 9,365.4 - 9,365.4
Charge for the year 20.9 463.4 484.3 - 484.3 Retirements / disposals (0.9) (29.3) (30.2) - (30.2)Balance at 31 December 2020 702.0 9,117.5 9,819.5 - 9,819.5
Net book value at 31 December 2020 499.5 5,872.1 6,371.6 1,127.1 7,498.7
Net book value at 31 December 2019 501.4 5,715.3 6,216.7 1,083.4 7,300.1
Net book value at 1 January 2019 493.9 5,611.5 6,105.4 1,095.6 7,201.0
NOTES TO THE FINANCIAL STATEMENTS NOTES TO THE FINANCIAL STATEMENTS
11. PROPERTY, PLANT & EQUIPMENT (continued)
During the year the Group capitalised interest of €22.0 million (2019: €25.9 million) in assets under construction, using an effective interest rate of 2.5%(2019: 2.9%).
The carrying value of non-depreciable assets (land) at 31 December 2020 is €93.7 million (2019: €94.9 million).
Property, plant and equipment with a net book value of €nil at 31 December 2020 is included above at a cost of €5,195.2 million(2019: €5,039.0 million).
Included within additions in 2020 is the capitalisation of an increase in the asset retirement provision for Generation and Trading and ESB Networks for€83.9 million (2019: €10.8 million). See note 27 for further details.
Retirements / disposals in both 2020 and 2019 primarily relate to the retirement of assets that have been fully depreciated.
Impairment charge
IAS 36 - Impairment of Assets stipulates that an impairment loss is the amount by which the carrying value of an asset exceeds its recoverable amount.Recoverable amount is the higher of its fair value less costs of disposal and its value in use. Value in use is calculated by taking the Net Present Value(NPV) of expected future cash flows from the asset discounted at an appropriate discount rate. Entities are required to conduct impairment tests wherethere is an indication of impairment of an asset.
The impact of COVID-19 on electricity demand in the short term, in addition to lower forecast wholesale electricity margins in both the GB market andthe Integrated Single Electricity Market (I-SEM) were the indicators that prompted impairment reviews as at 31 December 2020. Impairment reviewswere undertaken in respect of the following assets: I-SEM thermal and onshore windfarm assets, GB thermal and onshore windfarm assets.
An impairment review has been carried out on assets displaying indications of impairment by comparing the Net Present Value of future cash flows totheir net book value as at 31 December 2020 resulting in an impairment charge of €199.4 million (2019: €5.3 million).
• A review of thermal generation assets resulted in an impairment charge of €187.6 million (2019: €nil) in respect of Carrington. Refer to note 5 formore details on this exceptional impairment charge.
• A review of the I-SEM wind farm portfolios highlighted the requirement for an impairment charge of €11.9 million (2019: €5.3 million). The driverof the impairment charge is a reduction in market revenue. The real discount rate applied to the cashflows to determine the NPV was real a pre-taxrate of 3.7% (2019: 3.5%).
All forecast cash inflows for each asset and generation plant are based on the forecasted running profiles for the plants, regulatory support, forward prices for electricity, gas and carbon. Forecast cash outflows reflect the forecast operating and capital expenditure plans based on board approved five-year business plans and 10-year long term asset plans updated for managements latest views. Thereafter, forecast cash outflow are extrapolated based on forecast inflation rates, forecast running profile, and managements view of required operational and capital expenditure.
11. PROPERTY, PLANT & EQUIPMENT (continued)Land and buildings
Plant and machinery
Total assets incommission
Assets underconstruction Total
PARENT €m €m €m €m €m
CostBalance at 1 January 2019 1,186.9 14,010.2 15,197.1 1,095.6 16,292.7
Additions 0.6 282.1 282.7 288.3 571.0 Retirements / disposals (31.8) (183.7) (215.5) - (215.5)Transfers out of assets under construction 25.5 275.0 300.5 (300.5) - Transfers from intangible assets - 0.6 0.6 - 0.6 Other transfers 2.2 14.5 16.7 - 16.7 Balance at 31 December 2019 1,183.4 14,398.7 15,582.1 1,083.4 16,665.5
Balance at 1 January 2020 1,183.4 14,398.7 15,582.1 1,083.4 16,665.5
Additions - 306.6 306.6 366.3 672.9 Retirements / disposals (1.0) (31.4) (32.4) - (32.4)Transfers out of assets under construction 19.1 315.0 334.1 (334.1) - Other transfers - - - 11.5 11.5 Transfers from intangible assets - 0.7 0.7 - 0.7 Balance at 31 December 2020 1,201.5 14,989.6 16,191.1 1,127.1 17,318.2
During the year the Parent capitalised interest of €17.7 million (2019: €19.1 million) in assets under construction, using an effective interest rate of 2.5% (2019: 2.9%).
The carrying value of non-depreciable assets (land) at 31 December 2020 is €77.8 million (2019: €77.8 million).
Property, plant and equipment with a net book value of €nil at 31 December 2020 are included above at a cost of €4,184.1 million (2019: €4,034.6 million).
Included within additions in 2020 is the capitalisation of an increase in the asset retirement provision for Generation and Trading and ESB Networks for €71.6 million (2019: €10.8 million). See note 27 for further details.
Retirements / disposals in both 2020 and 2019 primarily relate to the retirement of assets that have been fully depreciated.
Impairment
IAS 36 - Impairment of Assets stipulates that an impairment loss is the amount by which the carrying value of an asset exceeds its recoverable amount. Recoverable amount is the higher of its fair value less costs of disposal and its value in use. Value in use is calculated by taking the Net Present Value (NPV) of expected future cash flows from the asset discounted at an appropriate discount rate. Entities are required to conduct impairment tests where there is an indication of impairment of an asset. The impact of COVID-19 on electricity demand in the short term, in addition to lower forecast wholesale electricity margins in the Integrated Single Electricity Market (I-SEM) were the indicators that prompted impairment reviews as at 31 December 2020.
An impairment review has been carried out on assets displaying indications of impairment by comparing the net present value of future cash flows using a real pre-tax discount rate of 6.1% (2019: 6.2%) to their net book value as at 31 December 2020 and no impairments were identified (2019: €nil).
All forecast cash inflows for each asset and generation plant are based on the forecasted running profiles for the plants, regulatory support, forward prices for electricity, gas and carbon. Forecast cash outflows reflect the forecast operating and capital expenditure plans based on Board approved five-year business plans and 10-year long term asset plans updated for managements latest views. Thereafter, forecast cash outflow are extrapolated based on forecast inflation rates, forecast running profile, and managements view of required operating and capital expenditure.

STR
ATEGY
AN
D P
ER
FOR
MA
NC
E
01
CO
RP
OR
ATE G
OV
ER
NA
NC
E
02
FINA
NC
IAL S
TATEM
EN
TS
03
152 ESB Annual Report 2020 - Brighter Together ESB Annual Report 2020 153
NOTES TO THE FINANCIAL STATEMENTS 12. INTANGIBLE ASSETS
Emission allowances
& ROCs
Softwareunder
development
Softwareand other
intangible assets TotalGROUP €m €m €m €m
CostBalance at 1 January 2019 721.0 87.7 109.2 917.9
Software additions 3.4 - 105.7 109.1 Purchase of emission allowances - 92.4 - 92.4 Settlement of emission allowances - (70.5) - (70.5)Software retirements (3.9) - - (3.9)Transfers out of software under development 45.5 - (45.5) - Transfers to property, plant and equipment (0.6) - - (0.6)Translation differences 9.7 0.8 0.1 10.6 Balance at 31 December 2019 775.1 110.4 169.5 1,055.0
Balance at 1 January 2020 775.1 110.4 169.5 1,055.0
Software additions 4.3 - 134.4 138.7 Purchase of emission allowances - 125.4 - 125.4 Settlement of emission allowances - (115.5) - (115.5)Software retirements (3.5) - - (3.5)Transfers out of software under development 40.0 - (40.0) - Transfers to property, plant and equipment (0.7) - (0.5) (1.2)Translation differences (11.1) (0.2) - (11.3)Balance at 31 December 2020 804.1 120.1 263.4 1,187.6
AmortisationBalance at 1 January 2019 516.1 - - 516.1
Charge for the year 70.9 - - 70.9 Retirements (3.9) - - (3.9)Impairment 6.6 - - 6.6 Translation differences 7.2 - - 7.2 Balance at 31 December 2019 596.9 - - 596.9
Balance at 1 January 2020 596.9 - - 596.9
Charge for the year 55.0 - - 55.0 Retirements (3.5) - - (3.5)Impairment 1.0 - - 1.0 Translation differences (8.7) - - (8.7)Balance at 31 December 2020 640.7 - - 640.7
Net book value at 31 December 2020 163.4 120.1 263.4 546.9
Net book value at 31 December 2019 178.2 110.4 169.5 458.1
Net book value at 1 January 2019 204.9 87.7 109.2 401.8
Analysed as follows:Non-current intangible assets 163.4 - 263.4 426.8 Current intangible assets - 120.1 - 120.1Total intangible assets 163.4 120.1 263.4 546.9
Certain corresponding amounts have been adjusted so that they are directly comparable with the amounts shown in respect of the current financial year.
Software assets include both internally developed and externally purchased assets with the majority being represented by internally developed assets.
Other intangibles include grid connections with a net book value of €4.8 million (2019: €6.1 million).
During the year the Group capitalised interest of €2.2 million (2019: €1.6 million) in sofware under development, using an effective interest rate of 2.5% (2019: 2.9%)
NOTES TO THE FINANCIAL STATEMENTS
Impairment charge
An impairment review has been carried out on assets displaying indications of impairment by comparing the Net Present Value (NPV) of future cash flows using a pre-tax discount rate of 3.7% (2019: 3.5%) to their net book value as at 31 December 2020 resulting in a charge of €1.0 million (2019: €6.6 million).
Emission allowances
Softwareunder
development
Softwareand other
intangible assets TotalPARENT €m €m €m €m
CostBalance at 1 January 2019 541.7 81.8 104.7 728.2
Software additions - - 101.8 101.8 Purchase of emission allowances - 71.8 - 71.8 Settlement of emission allowances - (46.2) - (46.2) Software retirements (2.6) - - (2.6)Transfers out of software under development 40.4 - (40.4) - Transfers to property, plant and equipment (0.6) - - (0.6)Other transfers 1.6 - - 1.6 Balance at 31 December 2019 580.5 107.4 166.1 854.0
Balance at 1 January 2020 580.5 107.4 166.1 854.0
Software additions - - 122.6 122.6 Purchase of emission allowances - 69.0 - 69.0Settlement of emission allowances - (56.9) - (56.9)Software retirements (3.5) - - (3.5)Transfers out of software under development 33.9 - (33.9) - Transfers to property, plant and equipment (0.7) - - (0.7)Other transfers - - (0.5) (0.5)Balance at 31 December 2020 610.2 119.5 254.3 984.0
AmortisationBalance at 1 January 2019 401.4 - - 401.4
Charge for the year 51.6 - - 51.6 Retirements / disposals (2.6) - - (2.6)Other transfers 1.6 - - 1.6 Balance at 31 December 2019 452.0 - - 452.0
Balance at 1 January 2020 452.0 - - 452.0
Charge for the year 45.7 - - 45.7 Retirements / disposals (3.5) - - (3.5)Balance at 31 December 2020 494.2 - - 494.2
Net book value at 31 December 2020 116.0 119.5 254.3 489.8
Net book value at 31 December 2019 128.5 107.4 166.1 402.0
Net book value at 1 January 2019 140.3 81.8 104.7 326.8
Analysed as follow:Non-current intangible assets 116.0 - 254.3 370.3 Current intangible assets - 119.5 - 119.5Total intangible assets 116.0 119.5 254.3 489.8
Certain corresponding amounts have been adjusted so that they are directly comparable with the amounts shown in respect of the current financial year.
Software assets include both internally developed and externally purchased assets with the majority being represented by internally developed assets.
Other intangible assets include grid connections with a net book value of €1.7 million (2019: €1.9 million).
During the year the Parent capitalised interest of €2.2 million (2019: €1.6 million) in software under development, using an effective interest rate of 2.5% (2019: 2.9%).
12. INTANGIBLE ASSETS (continued)

154 ESB Annual Report 2020 - Brighter Together ESB Annual Report 2020 155S
TRATEG
Y A
ND
PE
RFO
RM
AN
CE
01
CO
RP
OR
ATE G
OV
ER
NA
NC
E
02
FINA
NC
IAL S
TATEM
EN
TS
03
NOTES TO THE FINANCIAL STATEMENTS 13. RIGHT-OF-USE ASSETS AND LEASE LIABILITIES
GROUP
(a) Amounts recognised in the balance sheet
Land andRight-of-use assets buildings Motor vehicles Total
€m €m €m
Balance at 1 January 2019 127.6 5.3 132.9
Additions 8.3 2.9 11.2 Depreciation (16.2) (2.5) (18.7)Remeasurement of right-of-use assets 6.5 - 6.5 Translation differences 1.2 0.2 1.4 Balance at 31 December 2019 127.4 5.9 133.3
Balance at 1 January 2020 127.4 5.9 133.3
Additions 8.9 2.2 11.1 Depreciation (16.0) (2.6) (18.6)Impairment (0.3) - (0.3)Translation differences (1.6) (0.3) (1.9)Balance at 31 December 2020 118.4 5.2 123.6
TotalLease liabilities €m
Balance at 1 January 2019 (132.9)
Additions (11.2)Interest expense (2.0)Effect of modification of lease liability (3.2)Lease payments1 18.6 Translation differences (1.3)Balance at 31 December 2019 (132.0)
Balance at 1 January 2020 (132.0)
Additions (11.1)Interest expense (2.1)Lease payments1 18.5 Translation differences 1.9 Balance at 31 December 2020 (124.8)
Analysed as follows:2020
€m2019
€mNon-current liabilities (107.3) (112.4)Current liabilities (17.5) (19.6)Total (124.8) (132.0)1Lease payments include principal elements of €16.4 million (2019: €16.6 million).
(b) Other amounts recognised in the income statement 2020
€m2019
€m
Expenses relating to short-term leases 1.6 1.4 Expenses relating to low-value assets that are not short-term leases - 0.1 Expenses relating to variable lease payments not included in lease liabilities 1.9 2.0 Total 3.5 3.5
Payments associated with short-term leases and leases of low-value assets are recognised on a straight-line basis as an expense in profit or loss. Short-term leases are leases with a lease term of 12 months or less.
NOTES TO THE FINANCIAL STATEMENTS 13. RIGHT-OF-USE ASSETS AND LEASE LIABILITIES (continued)
PARENT
(a) Amounts recognised in the balance sheet
Land and buildings
Right-of-use assets €m
Balance at 1 January 2019 77.6
Additions 3.1 Depreciation (12.3)Remeasurement of right-of-use assets 4.8 Balance at 31 December 2019 73.2
Balance at 1 January 2020 73.2
Additions 5.6 Depreciation (11.9)Balance at 31 December 2020 66.9
Lease liabilitiesTotal
€m
Balance at 1 January 2019 (77.6)
Additions (3.1)Interest expense (0.8)Effect of modification of lease liabilities (1.9)Lease payments1 11.7 Balance at 31 December 2019 (71.7)
Balance at 1 January 2020 (71.7)
Additions (5.6)Interest expense (0.8)Lease payments1 11.4 Balance at 31 December 2020 (66.7)
Analysed as follows:2020
€m2019
€mNon-current liabilities (55.5) (58.9)Current liabilities (11.2) (12.8)Total (66.7) (71.7)
1Lease payments include principal elements of €10.6 million (2019: €11.0 million).
(b) Other amounts recognised in the income statement 2020
€m2019
€m
Expenses relating to short-term leases 1.1 0.8 Expenses relating to low-value assets that are not short-term leases - 0.1 Expenses relating to variable lease payments not included in lease liabilities 0.4 0.2 Total 1.5 1.1
Payments associated with short-term leases and leases of low-value assets are recognised on a straight-line basis as an expense in profit or loss. Short-term leases are leases with a lease term of 12 months or less.

156 ESB Annual Report 2020 - Brighter Together ESB Annual Report 2020 157S
TRATEG
Y A
ND
PE
RFO
RM
AN
CE
01
CO
RP
OR
ATE G
OV
ER
NA
NC
E
02
FINA
NC
IAL S
TATEM
EN
TS
03
NOTES TO THE FINANCIAL STATEMENTS 14. GOODWILL
€m
Balance at 1 January 2019 169.6Translation differences 8.7Balance at 31 December 2019 178.3
Balance at 1 January 2020 178.3Translation differences (9.3)Balance at 31 December 2020 169.0
Goodwill was recognised on the acquisition of Northern Ireland Electricity Networks (NIE Networks) in December 2010. Goodwill is reviewed annually in December for impairment, by assessing the recoverable amount of the investment, based on its value in use.
The annual impairment test of goodwill was carried out in December 2020 in accordance with IAS 36. No reduction in the value of goodwill was deemed to be required.
The Group calculates the value in use using a 20-year discounted cash flow model and a terminal value based on the Regulated Asset Base (RAB), corresponding to the expected useful life of the underlying asset base. The future cash flows are adjusted for risks specific to the investment and are discounted using a post-tax discount rate of 5.5% (2019: 5.6%).
Key drivers of the discounted cash flow include inflation and regulatory assumptions. Inflation rates used were sourced from the UK Office for Budget Responsibility and Bloomberg and a long-term rate of 3.08% (2019: 3.08%) was applied. Assumptions in relation to regulatory return and capital expenditure are made by reference to previous regulatory decisions for NIE Networks. The discount rate used is also a key driver for valuation and the rate was determined by building up an appropriate Weighted Average Cost of Capital (WACC) for the NIE Networks business.
Key drivers also include expectations of future levels of capital spend and the allowed return on the RAB. Both are agreed with the Utility Regulator in Northern Ireland (NIAUR) as part of the Regulatory Price Reviews, the most recent of which, RP6, was published on 30 June 2017 and covers the period to 31 March 2024. Estimates beyond the period covered by the latest Regulatory Price Review are based on the average annual capital spend and the allowed return under RP6.
NOTES TO THE FINANCIAL STATEMENTS 15. FINANCIAL ASSET INVESTMENTS AT FAIR VALUE THROUGH PROFIT OR LOSS AND EQUITY ACCOUNTED INVESTEES
Equityaccountedinvestees
Financial assets atfair value through
profit or loss Total (a) GROUP €m €m €m
Balance at 1 January 2019 189.8 10.5 200.3
Additions 242.9 2.9 245.8 Share of loss (net) (8.3) - (8.3)Fair value movement on cash flow hedges (3.2) - (3.2)Dividends received (13.7) - (13.7)Translation differences 6.0 - 6.0 Balance at 31 December 2019 413.5 13.4 426.9
Balance at 1 January 2020 413.5 13.4 426.9
Additions 21.1 1.4 22.5 Disposal of investments - (12.8) (12.8)Share of profit (net) 9.3 - 9.3 Fair value movement on cash flow hedges (29.5) - (29.5)Fair value movement through profit or loss - 6.4 6.4 Dividends received (11.7) - (11.7)Repayments (5.5) - (5.5)Translation differences (19.1) 0.2 (18.9)Balance at 31 December 2020 378.1 8.6 386.7
Equity accounted investees The fair value movement on cash flow hedges for equity accounted investees relates to derivatives held in Aldeburgh Offshore Wind Holdings Limited, NNG Windfarm Holdings Limited and Raheenleagh Power DAC which have been designated as cash flow hedging relationships in these entities.
Translation differences for equity accounted investees relate to Aldeburgh Offshore Wind Holdings Limited, Inch Cape Offshore Holdings Limited and NNG Windfarm Holdings Limited as these companies' functional currency is sterling.
Interests in equity accounted investees Holding2020
% of share capital owned
Holding2019
% of share capital ownedName of the company Country
Inch Cape Offshore Holdings Limited Great Britain 50 0 NNG Windfarm Holdings Limited Great Britain 50 50Aldeburgh Offshore Wind Holdings Limited Great Britain 50 50SIRO Limited Republic of Ireland 50 50Tilbury Green Power Holdings Limited Great Britain 47 47Raheenleagh Power DAC Republic of Ireland 50 50Oweninny Power DAC Republic of Ireland 50 50Emerald Bridge Fibres DAC Republic of Ireland 50 50Kingspan ESB Limited Great Britain 50 50
Inch Cape Offshore Holdings Limited
During the year ended 31 December 2020, the Group acquired a 50% stake in Inch Cape Offshore Holdings Limited (ICOHL), a joint arrangement with Red Rock Power Limited. Equity accounted investee additions of €19.2 million in the year includes €16.8 million of contingent consideration which is contingent upon achieving project milestones and specified returns included in the financial investment decision. In addition a shareholder loan of €45.4 million was advanced during the year.
ICOHL owns 100% of Inch Cape Offshore Limited (IC). The project, located off the east coast of Scotland, has a grid connection agreement for 936MW. The 50% investment in ICOHL indirectly provides ESB with a 50% stake in IC.
ICOHL is legally separated from the parties and the legal form and the contractual arrangement do not give the parties direct rights to the assets and liabilities of the vehicle. Having assessed the investment in ICOHL, ESB have concluded that they have joint control under IFRS 10 and IFRS 11. Accordingly, ESB’s 50% investment in ICOHL is equity accounted in line with IAS 28.
The Group's share of capital commitments at 31 December 2020 amounts to €nil.

158 ESB Annual Report 2020 - Brighter Together ESB Annual Report 2020 159S
TRATEG
Y A
ND
PE
RFO
RM
AN
CE
01
CO
RP
OR
ATE G
OV
ER
NA
NC
E
02
FINA
NC
IAL S
TATEM
EN
TS
03
NOTES TO THE FINANCIAL STATEMENTS 15. FINANCIAL ASSET INVESTMENTS AT FAIR VALUE THROUGH PROFIT OR LOSS AND EQUITY ACCOUNTED INVESTEES (continued)
NNG Windfarm Holdings Limited (Neart na Gaoithe)
In December 2019 the Group acquired a 50% stake in NNG Windfarm Holdings Limited (NNGWH), a joint arrangement with EDF Renewables UK Limited. Theamount invested to date is €231.3 million.
NNGWH owns 100% of Neart na Gaoithe Offshore Wind Limited (NNGOW). The purpose of this joint arrangement is to develop a 448MW wind farm off the eastcoast of Scotland. The 50% investment in NNGWH indirectly provides ESB with a 50% stake in NNGOW.
NNGWH is legally separated from the parties and the legal form and the contractual arrangement do not give the parties direct rights to the assets and liabilities of the vehicle. Having assessed the investment in NNGWH, ESB have concluded that they have joint control under IFRS 10 and IFRS 11. Accordingly, ESB’s 50%investment in NNGWH is equity accounted in line with IAS 28.
A contractor involved in the construction of Neart na Gaoithe offshore windfarm project has submitted a claim citing a variation in their contract. An impairmentreview of the carrying value of ESB's equity investment in NNGWH was carried out which takes account of the best estimate of the potential cost at this time.
The Group's share of capital commitments at 31 December 2020 amounts to €334.0 million (2019: €352.6 million).
Aldeburgh Offshore Wind Holdings Limited (AOWHL)
In March 2018 the Group acquired 50% of the issued share capital of AOWHL. The Group also acquired 50% of the loan notes issued by Aldeburgh Offshore Wind Investments Limited (AOWIL) a 100% owned subsidiary of AOWHL to become a 50% Joint Venture Partner with Sumitomo Corporation Europe Limited. Theamount invested by ESB to date amounts to €115.3 million, all of which was advanced as equity. Shareholder loans advanced of €27.2 million were fully repaid in January 2019.
AOWHL has a 25% stake in the Galloper Wind Farm project. The Galloper project is a 353MW development located in the Outer Thames estuary, 30km off thecoast of Suffolk, England. The 50% investment in AOWHL indirectly provides ESB with a 12.5% stake in the Galloper project.
AOWHL is legally separated from the parties and the legal form and the contractual arrangement do not give the parties direct rights to the assets and liabilities ofthe vehicle. Having assessed the investment in AOWHL/AOWIL ESB have concluded that they have joint control under IFRS 10 and IFRS 11. Accordingly, ESB’s 50% investment in AOWHL/AOWIL is equity accounted in line with IAS 28.
SIRO Limited (SIRO)
SIRO is an unlisted joint arrangement in which the Group has joint control and a 50% ownership interest. SIRO was founded by the Group with Vodafone IrelandLimited acquiring a 50% stake in November 2014.
Vodafone’s acquisition of shares in SIRO was pursuant to a Joint Venture Arrangement (JVA) concluded between both parties.
SIRO is structured as a separate vehicle, is jointly controlled by the Group and Vodafone Ireland Limited, and the Group has a residual interest in the net assets ofthe Company. Accordingly, the Group has classified its interest in SIRO as an equity accounted investee. ESB has committed to provide capital funding to SIRO of €93.0 million, of which €93.0 million has been advanced as a short-term shareholder loan to date. The Group's share of capital commitments at 31 December 2020 amounts to €21.4 million (2019: €37.5 million).
The Group has guaranteed 50% of the drawings on a €230.0 million loan facility of SIRO, the total amount drawn down at 31 December 2020 is €182.0 million(2019: €123.0 million). The Group share of the amount drawn down by SIRO is €91.0 million (2019: €61.5 million).
Tilbury Green Power Holdings Limited (Tilbury)
The Group is a 47% partner in Tilbury, a joint arrangement formed with Green Investment Bank (47%) and Scandinavian equipment suppliers BWSC and AET(6%). This joint arrangement operates a waste wood to energy plant in Great Britain.
The amount invested in Tilbury to date as a shareholder loan amounts to €1.6 million (after impairment). Interest on borrowings receivable from Tilbury amount to €nil (31 December 2019: €nil). Loans to Tilbury were impaired by €51.9 million at 31 December 2020 (2019: €51.9 million) in relation to outstanding loans andaccrued interest.
Tilbury is legally separated from the parties and the legal form and the contractual arrangement do not give the parties direct rights to the assets and liabilities of thevehicle. Accordingly, the Group has classified its interest in Tilbury as an equity accounted investee as both parties have a residual interest in the net assets of the arrangement.
The Group has entered into a 15-year arrangement with Tilbury to purchase physical power and renewable obligation certificates from the plant. Payments madeunder this contract are contingent upon actual production.
Raheenleagh Power DAC (Raheenleagh)
The Group is a 50% partner in Raheenleagh, a joint arrangement with GR Wind Farms 1 Limited. This joint arrangement operates a 35MW wind farm in Co.Wicklow. The amount invested in Raheenleagh to date amounts to €3.1 million advanced.
Raheenleagh is legally separated from the parties and the legal form and the contractual arrangement do not give the parties direct rights to the assets and liabilitiesof the vehicle. Accordingly, the Group has classified its interest in Raheenleagh as an equity accounted investee as both parties have a residual interest in the net assets of the arrangement.
The Group entered into a 15-year arrangement with Raheenleagh in 2015 to purchase physical power from the wind farm. Payments made under this contract arebased upon actual production.
Raheenleagh reached commercial operation in 2016.
Oweninny Power DAC (Oweninny)
The Group is a 50% partner in Oweninny, a joint arrangement formed with Bord na Móna. This joint arrangement operates a 172MW wind farm located in Bellacorrick, Co. Mayo. As at 31 December 2020 the amount invested in Oweninny as a shareholder loan amounts to €8 million. Interest on borrowings receivable to date from Oweninny amounts to €1.7 million (2019: €1.4 million). The Group's share of capital commitments at 31 December 2020 amounts to €nil (2019: €7.5million).
Investment in Oweninny was held at €nil at 31 December 2020 (2019: €nil).
Oweninny reached commercial operation in November 2019.
15. FINANCIAL ASSET INVESTMENTS AT FAIR VALUE THROUGH PROFIT OR LOSS AND EQUITY ACCOUNTED INVESTEES (continued)
Emerald Bridge Fibres DAC (EBFD)
The Group is a 50% partner in EBFD, a joint arrangement with ZAYO Group. The purpose of this joint arrangement is the development and provision of telecommunication infrastructure between Ireland and the United Kingdom in the form of a subsea fibre optic cable network. The amount invested in EBFD to dateamounts to €6.2 million of which €2.5 million was advanced as equity and €3.7 million as shareholder loans. Loans and interest on borrowings receivable from EBFD were fully impaired at 31 December 2020 (2019: €5.7 million, also fully impaired).
Investment in EBFD was held at €nil at 31 December 2020 (2019: €nil).
Please refer to note 30 for further information regarding transactions with equity accounted investees for the years ended 31 December 2020 and 2019.
NOTES TO THE FINANCIAL STATEMENTS
The Group's aggregate share of the non-current assets, current assets, non-current liabilities, current liabilities, income and expenses related to its interests in these joint ventures are as follows:
NNG Windfarm Holdings Limited
Aldeburgh Offshore Wind
Holdings Limited SIRO Limited
Tilbury Green Power Holdings
Limited
Other equity accounted investees4
Summarised income statement1
2020 2019 2020 2019 2020 2019 2020 2019 2020 2019€m €m €m €m €m €m €m €m €m €m
Revenue - - 6.9 - 22.9 15.0 31.9 15.7 37.6 11.9 Depreciation - - - - (28.1) (23.0) (7.5) (9.3) (2.3) (2.1)Interest income / (interest paid) - - - (0.4) (6.6) (1.9) (20.6) (14.0) (5.5) (3.0)Income tax - - (0.2) 0.2 13.1 5.5 - - (0.5) 0.1 Total gain / (loss) 21.9 - 14.6 10.5 (19.4) (25.1) (21.1) (61.5) 10.5 1.9 Group share of (loss) / gain 10.9 - 7.3 5.3 (9.7) (12.6) (9.9) (28.9) 5.3 0.8
Other adjustments2 - - - (1.7) - - 9.9 28.9 (4.5) (0.1)Group share of fair value movements on cash flow hedges (25.8) - (3.5) (2.7) - - - - (0.2) (0.5)Total comprehensive (loss) / gain (14.9) - 3.8 0.9 (9.7) (12.6) - - 0.6 0.2
2020 2019 2020 2019 2020 2019 2020 2019 2020 2019Summarised balance sheet €m €m €m €m €m €m €m €m €m €m
Cash 20.3 49.9 0.7 2.7 3.0 3.5 7.1 5.5 7.9 14.4 Current assets 59.2 148.1 - - 6.2 6.4 9.8 8.0 27.8 8.3 Non-current assets 1,611.8 1,092.7 20.0 43.2 445.4 419.3 134.2 190.7 330.9 202.2 Current liabilities (97.1) (16.3) (3.5) (3.5) (214.5) (226.6) (111.4) (23.1) (111.9) (21.1)Non-current liabilities (1,594.7) (1,257.1) - - (184.4) (127.4) (170.0) (263.7) (233.8) (223.5)Net assets / (liabilities) (0.5) 17.3 17.2 42.4 55.7 75.2 (130.3) (82.6) 20.9 (19.7)
Reconciliation of the above amounts to the investment recognised in the consolidated balance sheet.
Group equity interest 50% 50% 50% 50% 50% 50% 47% 47%Net assets / (liabilities) (0.5) 17.3 17.2 42.4 55.7 75.2 (130.3) (82.6) 20.9 (19.7)Group share (0.3) 8.7 8.6 21.2 27.9 37.6 (61.2) (38.9) 10.5 (10.6)Other adjustments3 216.4 234.0 96.1 101.7 6.0 6.0 61.2 38.9 12.9 14.9 Carrying value of Group's equity interest 216.1 242.7 104.7 122.9 33.9 43.6 - - 23.4 4.3
1 The numbers included in the above table are based on unaudited management accounts. When audited financial statements become available, any adjustments are reflected in the following year.
2 Where the Group's share of losses of an associate or joint venture equals or exceeds its interest in the associate or joint venture, the Group discontinues recognising its share of further losses unless there is legal or constructive obligation to recognise further losses. Unrecognised losses in 2020 include Tilbury Green Power Holdings Limited of €9.9 million (cumulative unrecognised losses to date of €49.7 million) and Kingspan ESB Limited of €nil (cumulative unrecognised losses to date of €0.3 million).
3 Other adjustments represent the difference between the carrying value of the Group's share of the net assets acquired and the investment amount.
4 Other equity accounted investees' includes ESB's 50% share in Emerald Bridge Fibres DAC, Kingspan ESB DAC, Raheenleagh Power DAC, Oweninny Power DAC and Inch Cape Offshore Holdings Limited.
Interest in financial assets held at fair value through profit and lossThe Group owns a venture capital fund, ESB Novusmodus Limited Partnership, in which seed capital is invested into emerging technology entities. These investments are managed purely for an investment return and are consequently carried at fair value through the income statement. No financial assets held at fair value through profit or loss are controlled by ESB. The investments comprise of a number of clean energy and new technology companies. These investments have been fair valued at the year end and the movement is reflected in the income statement.
During the year ended 2020, the Group invested €0.9 million (2019: €2.4 million) in Oriel Offshore Wind Farm Limited. The Group has a 5% share in Oriel Offshore Wind Farm Limited and this investment is accounted under fair value as a financial asset investment in line with IFRS 9.

160 ESB Annual Report 2020 - Brighter Together ESB Annual Report 2020 161S
TRATEG
Y A
ND
PE
RFO
RM
AN
CE
01
CO
RP
OR
ATE G
OV
ER
NA
NC
E
02
FINA
NC
IAL S
TATEM
EN
TS
03
NOTES TO THE FINANCIAL STATEMENTS NOTES TO THE FINANCIAL STATEMENTS 15. FINANCIAL ASSET INVESTMENTS AT FAIR VALUE THROUGH PROFIT OR LOSS AND EQUITY ACCOUNTED INVESTEES (continued)
Equity accounted investees
investments
€m
Subsidiary undertakings
€m
(b) PARENT
Balance at 1 January 2019 106.5 61.8 Change in accounting policy (50.3) - Restated Balance at 1 January 2019 56.2 61.8
Share of loss (12.6) - Balance at 31 December 2019 43.6 61.8
Balance at 1 January 2020 43.6 61.8 Share of loss (9.7) - Balance at 31 December 2020 33.9 61.8
During the year the accounting policy for investments in joint ventures in Parent was changed from being carried at cost less impairment charges to the equity method of accounting in line with IAS 28 Investments in Associates and Joint Ventures. Refer note 1 part (vi) for more details.
16. INVENTORIES GROUP PARENT2020 2019 2020 2019
€m €m €m €m
Materials 36.6 33.4 12.6 12.7 Fuel 37.1 48.8 30.2 41.3 Construction work in progress 86.4 68.8 - - Total 160.1 151.0 42.8 54.0
Inventories consumed during the year ended 31 December 2020 totalled €52.4 million (2019: €57.6 million). Provision for impairments recognised during the year was €2.8 million (2019: €9.2 million).
Construction work in progress includes property assets which are being constructed for resale and stated at the lower of cost and net realisable value.
17. TRADE AND OTHER RECEIVABLES
GROUP PARENT2020 2019 2020 2019
€m €m €m €m
Current receivables:Retail electricity receivables - billed 56.1 70.6 37.6 41.6 Retail electricity receivables - unbilled 236.1 212.8 133.2 137.2 Total retail electricity receivables 292.2 283.4 170.8 178.8 I-SEM / SEM pool related receivables 22.5 26.0 18.1 21.6 Use of System receivables (including unbilled) 242.7 235.0 55.2 48.4 Other electricity receivables 40.2 27.8 - - Total electricity receivables 597.6 572.2 244.1 248.8 Trade receivables - non-electricity 102.6 286.9 57.7 243.8 Amounts due from equity accounted investees 104.4 111.8 96.8 97.2 Other receivables 58.1 58.8 10.3 21.7 Amounts due from subsidiary undertakings - - 895.6 2,050.2 Prepayments 79.9 75.4 15.0 14.4 Total 942.6 1,105.1 1,319.5 2,676.1
GROUP PARENT2020 2019 2020 2019
€m €m €m €m
Non-current receivables:Amounts due from equity accounted investees 55.1 12.4 - - Amounts due from subsidiary undertakings - - 1, 723.6 1,015.1Amounts due from insurers 94.2 - 94.2 - Total non-current receivables 149.3 12.4 1,817.8 1,015.1
Total receivables 1,091.9 1,117.5 3,137.3 3,691.2
Certain corresponding amounts have been adjusted so that they are directly comparable with the amounts shown in respect of the current financial year.
Included in the above are amounts due from equity accounted investees at 31 December 2020 of €12.2 million (2019: €8.3 million) in respect of normal trading activities.
Wholesale and retail credit risk
Trade and other receivables can be divided into electricity receivables, other (non-electricity) receivables, insurance receivables, equity accounted investees and amounts due from subsidiary undertakings.
Expected credit loss allowance
Under IFRS 9 an expected credit loss (ECL) impairment model is in place for the calculation of impairment loss allowances. Under this impairment model, it is assumed that all receivables carry a risk of default. This impairment model is used to calculate the probability of default at a range of possible outcomes, weighted by the probability of their occurrence. These ECLs are measured under the general approach or simplified approach.
The simplified approach is applied to ESB's trade and other receivables within the scope of IFRS 15. Under the simplified approach, an entity will recognise a loss based on the lifetime ECLs. It allows an entity to use a provision matrix for calculating the ECLs. This matrix considers the historical default rates over the expected life of the trade receivable and is adjusted for forward-looking estimates.

162 ESB Annual Report 2020 - Brighter Together ESB Annual Report 2020 163S
TRATEG
Y A
ND
PE
RFO
RM
AN
CE
01
CO
RP
OR
ATE G
OV
ER
NA
NC
E
02
FINA
NC
IAL S
TATEM
EN
TS
03
NOTES TO THE FINANCIAL STATEMENTS 17. TRADE AND OTHER RECEIVABLES (continued)
The general approach is applied to the Group's shareholder loans advanced to equity accounted investees. Under the general approach, an entity must determine whether the financial asset is in one of three stages in order to determine the amount of ECL to recognise;
Stage 1 is where credit risk has not increased significantly since initial recognition. For financial assets in stage 1, entities are required to recognise 12 month ECL and recognise interest income on a gross basis – this means that interest will be calculated on the gross carrying amount of the financial asset before adjusting for ECL.
Stage 2 is where credit risk has increased significantly since initial recognition. When a financial asset transfers to stage 2 entities are required to recognise lifetime ECL but interest income will continue to be recognised on a gross basis.
Stage 3 is where the financial asset is credit impaired. This is effectively the point at which there has been an incurred loss event. For financial assets in stage 3, entities will continue to recognise lifetime ECL but they will now recognise interest income on a net basis. This means that interest income will be calculated based on the gross carrying amount of the financial asset less ECL.
The general approach applies to all loans and receivables not eligible for application of the simplified approach, which for the Group are primarily loans to equity accounted investees and for Parent also includes amounts due from subsidiary undertakings. Assessment of the probability of default for loans to equity accounted investees is included below. For further details of these loans see note 15.
The maximum credit exposure of the Group at 31 December 2020 and 31 December 2019 is set out on the following tables. In the case of the Parent company balances stated in the following tables exclude amounts due from subsidiary undertakings of €2,619.2 million (2019: €3,065.3 million).
Impact of COVID-19
The economic impacts arising from the COVID-19 pandemic and associated government responses in the geographies in which the Group operates have increased the level of uncertainty around the estimates the Group makes in measuring provisions for the impairment of financial assets. Where customers experience difficulties in settling balances, the increased aging of these amounts results in an increase in provisions held in respect of them under the simplified approach employed. In measuring the provision for expected losses, the Group has also considered macroeconomic forecasts and the potential economic impacts of COVID-19 on the sectors in which they operate. Government support schemes currently in place for the benefit of customers are expected to mitigate, to some degree, the near-term impacts of any forecast economic decline on financial assets recognised at 31 December 2020.
The assumptions made in estimating the impairment charge for the period and provisions held at the reporting date are felt to be appropriate, however the current high level of economic uncertainty means that impairment charges and provisions in respect of financial assets are a matter of significant judgement. The impact of any worsening of the economic outlook and any future recession could impact receivables from residential and business customers to differing extents.
Simplified approach - Expected Credit Losses 2020
GROUP PARENTGross amount
receivableLoss
allowanceNet amount
receivableGross amount
receivableLoss
allowanceNet amount
receivable€m €m €m €m €m €m
Not past due receivables 563.9 (3.7) 560.2 225.0 (2.6) 222.4Past due < 30 days 152.6 (2.8) 149.8 79.9 (2.4) 77.5Past due 30 - 120 days 26.6 (5.8) 20.8 5.2 (4.1) 1.1Past due > 120 days 42.2 (21.6) 20.6 24.5 (16.6) 7.9Past due by more than one year 30.9 (24.0) 6.9 20.0 (16.8) 3.2Total 816.2 (57.9) 758.3 354.6 (42.5) 312.1
2019GROUP PARENT
Gross amount receivable
Lossallowance
Net amount receivable
Gross amount receivable
Loss allowance
Net amount receivable
€m €m €m €m €m €m
Not past due receivables 547.9 (4.3) 543.6 229.5 (2.8) 226.7Past due < 30 days 321.5 (2.7) 318.8 265.9 (2.3) 263.6Past due 30 - 120 days 22.4 (5.0) 17.4 11.3 (4.1) 7.2Past due > 120 days 37.7 (11.0) 26.7 19.2 (9.0) 10.2Past due by more than one year 29.4 (18.0) 11.4 19.4 (12.8) 6.6Total 958.9 (41.0) 917.9 545.3 (31.0) 514.3
NOTES TO THE FINANCIAL STATEMENTS 17. TRADE AND OTHER RECEIVABLES (continued)
General approach - Expected Credit Losses
2020GROUP PARENT
Gross amount receivable
Lossallowance
Net amount receivable
Gross amount receivable
Loss allowance
Net amount receivable
€m €m €m €m €m €mStage 1 - 12 Month ECL (not credit impaired) 68.5 (1.2) 67.3 4.6 - 4.6 Stage 2 - Lifetime ECL (not credit impaired) 93.0 (0.8) 92.2 93.0 (0.8) 92.2 Stage 3 - Lifetime ECL (credit impaired) 51.9 (51.9) - - - - Total 213.4 (53.9) 159.5 97.6 (0.8) 96.8
2019GROUP PARENT
Gross amount receivable
Lossallowance
Net amount receivable
Gross amount receivable
Loss allowance
Net amount receivable
€m €m €m €m €m €mStage 1 - 12 Month ECL (not credit impaired) 124.2 - 124.2 97.2 - 97.2 Stage 2 - Lifetime ECL (not credit impaired) - - - - - - Stage 3 - Lifetime ECL (credit impaired) 51.9 (51.9) - - - - Total 176.1 (51.9) 124.2 97.2 - 97.2
GROUP PARENTExpected Credit Losses Reconciliation 2020 2019 2020 2019
€m €m €m €m
Simplified approach 758.3 917.9 312.1 514.3 General approach 159.5 124.2 96.8 97.2 Prepayments 1
Amounts due from insurers79.9 94.2
75.4-
15.094.2
14.4 -
Amounts due from subsidiary undertakings - - 2,619.2 3,065.3 Total 1,091.9 1,117.5 3,137.3 3,691.2
1Prepayments are excluded from the analysis as no credit exposure is perceived in relation to this balance.
Amounts due from subsidiary undertakings (Parent)At 31 December 2020, the Parent company had balances receivable of €2,619.2 million (2019: €3,065.3 million) from its subsidiaries. These receivables mainly relate to management services and loans to subsidiaries as well as electricity charges including Use of System charges. Total provision in respect of amounts due from subsidiary undertakings at 31 December 2020 is €59.5 million (2019: €396.5 million).
The impairment loss recognised in the Parent company in respect of amounts due from subsidiary undertakings has been calculated using expected credit loss model as required by IFRS 9. In determining the impairment loss, amounts due from subsidiaries were classified as either amounts repayable on demand, low credit risk receivables or amounts for which there has been a substantial increase in credit risk since initial recognition. In determining the expected credit loss (including probability of default and loss given default), regard was given to the historic performance of the relevant loan as well as forward looking information for the relevant subsidiary including detailed discounted cash flow forecasts. For repayable on demand loans where the loan could not be repaid at the reporting date, expected credit losses were calculated by considering the likely recovery strategies of the Parent company, including consideration of ‘repay over time’ strategies. For loans with a substantial increase in credit risk, consideration was given to the future activities and cash flows of the subsidiary and lifetime expected credit losses were recognised accordingly where appropriate.
Movement in the expected credit loss of trade and other receivables The loss allowances for financial assets are based on assumptions about risk of default and expected loss rates. The Group uses judgement in making these assumptions and selecting the inputs to the expected credit loss calculations, based on the Group’s past history, existing market conditions as well as forward looking estimates at the end of each reporting period. The movement in the expected credit loss in respect of trade receivables during the year was as follows:
GROUP PARENT2020 2019 2020 2019€m €m €m €m
Balance at 1 January 41.0 39.8 31.0 32.4 Impairment loss recognised (net) 24.8 11.8 18.6 8.3 Bad debts recovered (0.4) (0.7) - -Provision utilised (7.5) (9.9) (7.1) (9.7)Balance at 31 December 57.9 41.0 42.5 31.0

164 ESB Annual Report 2020 - Brighter Together ESB Annual Report 2020 165S
TRATEG
Y A
ND
PE
RFO
RM
AN
CE
01
CO
RP
OR
ATE G
OV
ER
NA
NC
E
02
FINA
NC
IAL S
TATEM
EN
TS
03
NOTES TO THE FINANCIAL STATEMENTS
531.2
NOTES TO THE FINANCIAL STATEMENTS 17. TRADE AND OTHER RECEIVABLES (continued)
TUoS credit risk is managed through the timely collection procedures in place and the monitoring of debtor days to keep these to a minimum. Procedures for the payment by EirGrid of TUoS income due to ESB Networks DAC as TAO are governed by the Infrastructure Agreement between EirGrid and ESB. This is not a normal bilateral contract freely entered into by the will of the parties, but an arrangement required by legislation and many of whose terms are specified in that legislation. Accordingly, the credit risk in relation to TUoS receivables is considered to be low. The amount due in respect of TUoS income at 31 December 2020 was €55.2 million (2019: €48.4 million), which is the largest Use of System receivable balance in ROI.
In respect of the Networks business in NI, revenue is derived principally from charges for use of the distribution system, PSO charges levied on electricity suppliers and charges for transmission services levied on SONI (System Operator for Northern Ireland). Credit risk in respect of Use of System receivables from electricity suppliers is mitigated by security received in the form of cash deposits, letters of credit or Parent company guarantees. With the exception of public bodies, payments in relation to new connections or alterations are paid for in advance of the work being carried out. Normal credit terms and debtor days in respect of trade receivables from electricity suppliers are less than 30 days. The largest Use of System electricity receivable in NI at 31 December 2020 is €10.1 million (2019: €10.7 million).
Other electricity receivables
Other electricity receivables include amounts in relation to ancillary services and amounts in relation to electricity trading in the UK market which is not included in the I-SEM.
Trade and other receivables - non-electricity
Trade receivables (non-electricity) relate to balances due in respect of the Group's non-electricity trading and other operations. It includes amounts due in respect of the Group's telecommunications, consultancy, facility management and other ancillary operations. Credit risk with regard to these balances is not considered to be significant. The largest unsecured single balance included within this category at 31 December 2020 is an amount of €4.4 million (2019: €11.8 million) due from an external company. Included within these categories are collateral amounts pledged by the Group to bilateral parties and clearing banks for exchange trading of gas, carbon and power of €10.4 million (2019: €195.9 million). The amounts pledged cover initial margin and daily mark to market movements which are returned to ESB prior to or on settlement.
17. TRADE AND OTHER RECEIVABLES (continued)
Amounts due from equity accounted investees
Amounts due from equity accounted investees include shareholder loans, interest on these loans and trade receivable balances. Trade receivablebalances from equity accounted investees are assessed for probability of default using the simplified approach under IFRS 9. All other balances duefrom equity accounted investees are assessed for probability of default using the general approach. In applying the general approach, the Group hasused judgement in making assumptions and selecting the inputs to the expected credit loss calculation based on market conditions as well as forwardlooking estimates at the end of the reporting period. The Group has no purchased credit impaired loans.
Following an assessment of all ESB's shareholder loans advanced to equity accounted investees an expected credit losses of €0.8 million wasrecognised in the income statement during the year in relation to the amount due from SIRO Ltd in line with the requirements of IFRS 9.
In 2018, following the assessment of the carrying value of all ESB's shareholder loans advanced to equity accounted investees, it was determined thatthere was an increase in the credit risk of loans to one of ESB's equity accounted investees since initial recognition; Tilbury Green Power HoldingsLimited (TGPHL). The assessment on the amount due from TGPHL was based on the expected available cash flows, and discounted cash flows at theeffective rate of interest on this shareholder loan, in line with the requirements of IFRS 9. As a result, this loan was accounted for as a stage 3 (creditimpaired) asset and expected credit losses of €34.4 million was recognised in 2019 in relation to TGPHL.
The remaining shareholder loans to equity accounted investees are assessed as stage 1 (not credit impaired) financial assets. The 12-month expected credit loss approach has been applied to the stage 1 loans consisting of analysis on both historical and forward looking qualitative and quantitative information to determine the credit risk. These loans are deemed to be of low credit risk given no indications of an increase in credit risk since initial recognition. As a result, no expected credit loss has been recognised in relation to these loans. The total amount of undiscounted expected credit losses at initial recognition on financial assets that were initially purchased or originated credit-impaired during the year ended 31 December 2020 is €nil (2019: €nil).
Retail electricity receivables
Retail electricity receivables which includes electricity and gas customers relate to both residential and business customers. The credit risk on electricity accounts is managed through the ongoing monitoring of debtor days, putting in place appropriate collateral and a collection policy based on the credit worthiness, size and duration of debt. The concentration of risk in Customer Solutions is in relation to retail electricity accounts that have closed in arrears. In addition, given the continuing increase in competition, certain customers may switch suppliers before they have settled their outstanding balances. These accounts are managed within the Group's debt collection policy by a combination of internal debt follow-up, the use of debt collection agencies and legal action where necessary including the obtaining of publication of judgements.
Providing for future expected losses in relation to retail electricity receivables, including both billed and unbilled, is based on analysis of recent debt performance and an evaluation of the impact of economic conditions and industry issues. Current economic conditions have been significantly impacted by the COVID-19 pandemic. Whilst the full extent of the financial impact on receivables as a result of COVID-19 remains unknown an additional provision has been made on a portfolio basis to cover anticipated losses resulting from the pandemic. Collateral is held in the form of security deposits on new customer accounts not on direct debit arrangements.
Controls around electricity receivables are focused on the full recovery of amounts invoiced. Electricity receivables to the value of €57.9 million (2019: €41.0 million) were provided for at year end. The single largest customer amount written off during the year was €26,000 (2019: €31,000) relating to Company dissolution / liquidation. Retail electricity receivables arise largely in the Republic of Ireland (ROI), with 14% (2019: 12%) relating to Northern Ireland (NI) revenue and 3% (2019: 2%) relating to Great Britain (GB) revenue.
Unbilled electricity receivables represent estimates of consumption not yet invoiced. Credit risk in relation to unbilled electricity is managed in line with billed electricity receivables as discussed above.
Integrated Single Electricity Market (I-SEM) receivables
Credit risk in relation to the I-SEM related receivables is managed by the Energy Trading and Risk functions (ET&R) within those business units engaged in electricity trading through the I-SEM. Each of these functions is ring-fenced from each other and segregation of responsibilities between the back office, middle office and front office functions is maintained in each case. The Trading back office function is responsible for invoicing customers and maintaining all accounts receivable. Payment terms for all trading balances relating to each of the I-SEM revenue streams are governed by the I-SEM settlement calendar.
Use of System receivables
Use of System income in ROI comprises of Distribution Use of System (DUoS) income, Transmission Use of System (TUoS) income and Operation and Maintenance (O&M) charges for generators connected to the Distribution System. The credit terms for DUoS are 10 business days and there are currently 52 suppliers. TUoS is collected by EirGrid, and the Transmission Asset Owner (TAO) allowed revenue is invoiced to EirGrid over 12 monthly instalments with each invoice due 36 days after month end. Invoices were issued in respect of 228 generators during 2020 for O&M charges, credit terms for O&M charges are 30 days. Generators are invoiced for connection charges on a staged basis, as approved by CRU, with 65% of the capital contribution recouped in advance of construction, 90% in advance of energisation and the balance post energisation. Included in amounts due from subsidiary undertakings in Parent are amounts billed and collected through ESB Networks DAC, a subsidiary of the Parent in respect of Use of System receivables €79.7 million (2019: €233.9 million).
The credit risk in relation to DUoS is managed by the invocation of section 7 of the DUoS Framework Agreement approved by CRU on 1 August 2002. This section provides for the provision of security by each supplier. Before a supplier can register as a customer they must sign up to the DUoS agreement. All suppliers must provide security in accordance with section 7.2. The DUoS credit risk is also managed through the timely collection procedures in place which are in line with what is outlined in section 6 of the DUoS Framework Agreement and the monitoring of debtor days to keep these to a minimum. In the event of a supplier defaulting in line with section 7 of the DUoS Framework Agreement there is security cover in place for all suppliers.
18. CASH AND CASH EQUIVALENTS
GROUP PARENT2020 2019 2020 2019€m €m €m €m
Cash at bank and in hand 248.7 125.1 164.1 58.2
19. CHANGES IN EQUITY
(i) Capital stockThere are 1,957,681,855 units of capital stock in issue at a par value of €1.00 each (2019: 1,966,381,855 units)
2020 2019€m €m
Comprised as:Stock issued from converted reserves 1,880.9 1,880.9 Stock issued for subscription by ESOT 76.8 85.5
1,957.7 1,966.4
In accordance with the Electricity (Supply) (Amendment) Act 2001, on 30 December 2001, the equity of ESB was converted to capital stock which was issued to the Department of Finance. At the same time, ESB ESOP Trustee Limited, established to act as Trustee for an ESB employee shareholding scheme, subscribed for 5% of the stock. The principal rights attaching to each unit of capital stock include the rights to exercise a vote at annual meetings, entitlements to dividends from profits when declared and the rights to proportionate participation in a surplus on winding up.
The Energy (Miscellaneous Provisions) Act 2006 amended Section 2 of the 2001 Act and as a result 10.1% of issued capital stock in ESB now stands vested in the Minister for Environment, Climate and Communications, with the Minister for Finance retaining 86.0% of ESB's capital stock and the ESOP retaining 3.9% of the stock at that date.
The Ministers and Secretaries Amendment Act 2011, which came into force on 6 July 2011, establishes the office of the Minister for Public Expenditure and Reform. The 2011 Act has the effect of transferring ownership of the stock previously held by the Minister for Finance in ESB to the Minister for Public Expenditure and Reform as and from 6 July 2011.

166 ESB Annual Report 2020 - Brighter Together ESB Annual Report 2020 167S
TRATEG
Y A
ND
PE
RFO
RM
AN
CE
01
CO
RP
OR
ATE G
OV
ER
NA
NC
E
02
FINA
NC
IAL S
TATEM
EN
TS
03
NOTES TO THE FINANCIAL STATEMENTS NOTES TO THE FINANCIAL STATEMENTS
Dividends 2020€m
2019€mGROUP
Dividends on capital stock:Total dividend paid 2.53 (2019: 2.18) cent per capital stock unit 50.1 42.9 Dividend to non-controlling interest 0.2 - Total 50.3 42.9
2020€m
2019€mPARENT
Dividends on capital stock:
Total dividend paid 2.53 (2019: 2.18) cent per capital stock unit 50.1 42.9 Total 50.1 42.9
Total dividends paid during 2020 amounted to €50.1 million and include a final dividend of €50.1 million (2.53 cents per unit of stock) in respect of 2019.
The Board is now recommending that a final dividend of 4.13 cent per unit of capital stock, or €80.8 million in aggregate, in accordance with the dividend policy of 40% of adjusted profit after tax agreed with the government.
19. CHANGES IN EQUITY (continued)
(ii) Capital redemption reserve
In May 2015, the ESB Board approved an ESOP market liquidity proposal. The objective of the proposal is to improve liquidity in the Employee Share Ownership Plan (ESOP) market whereby the ESOP Trustee is committing to spend €25.0 million of funds to acquire capital stock in the ESOP internal market. ESB will match the expenditure committed by the ESOP Trustee up to €25.0 million from 2014.
During 2020, ESB continued to repurchase ESOP capital stock and consequently the capital redemption reserve increased due to the purchase and cancellation of own share capital €8.7 million for a consideration of €8.4 million and represents the nominal amount of the share capital cancelled (note 31).
(iii) Cash flow hedging and other reserves – Group and Parent
The hedging reserve primarily represents the fair value of derivatives which are part of effective cash flow hedging relationships at year end. As the derivatives are held for hedging purposes as defined by IFRS 9 and designated as hedges, their fair value movements are retained in OCI instead of being charged to the Income Statement during the year and will be charged to income in the same period as the corresponding transaction.
(iv) Other reserves
Group other reserves include the following:
• Non-distributable reserves of (€5.0) million which was created on the sale of the Group's share in Ocean Communications Limited in 2001; and• Actuarial movements on the NIE Networks defined benefit scheme, net of the related deferred tax adjustments, totalling (€237.2) million (2019:
(€219.5) million); and• ESOP repurchase provision of €nil (2019: (€7.5) million) which relates to the amount that ESB has committed to date to repurchase from the ESOP
internal market.
Parent other reserves include the following:ESOP repurchase provision of €nil (2019: (€7.5) million) which relates to the amount that ESB has committed to date to repurchase from the ESOP internal market.
(v) Non-controlling interest - GroupNon-controlling interests at 31 December 2020 relate to the minority shareholdings in Crockahenny Wind Farm DAC, Mountain Lodge Power DAC and other companies associated with wind and solar projects.
20. TAXATION
2020 2019(a) Income tax expense €m €m
Current tax expense 52.7 62.0 Current tax (4.7) (2.4)Prior year over provision 3.0 3.6 Value of tax losses paid to equity accounted investees 51.0 63.2
Deferred tax expenseOrigination and reversal of temporary differences (6.0) (3.6)Effect of increase in UK tax rate 9.6 - Prior year under / (over) provision 5.2 (0.2)
8.8 (3.8)Total 59.8 59.4
2020 2019Reconciliation of effective tax rate €m €m
Profit before tax 185.6 397.2 (Less) / Plus: after tax share of (profits) / losses from equity accounted investees (net) (9.3) 8.3 Profit before tax (excluding equity accounted investees (profit) / loss) 176.3 405.5
Taxed at 12.5% 22.0 50.7
Expenses not deductible 25.1 6.9 Higher tax on chargeable gains - 2.2 Income taxed at higher rates - 1.5 Deferred tax impact of reinstatement of the 19% UK Corporation tax rate 9.6 - Higher tax rates on overseas profits 2.6 0.7 Prior year under / (over) provisions 0.5 (2.6)Income tax expense 59.8 59.4

168 ESB Annual Report 2020 - Brighter Together ESB Annual Report 2020 169S
TRATEG
Y A
ND
PE
RFO
RM
AN
CE
01
CO
RP
OR
ATE G
OV
ER
NA
NC
E
02
FINA
NC
IAL S
TATEM
EN
TS
03
2020 Balance at 1 January
Recognised in income
Recognised in OCI
Translation differences
Balance at 31 December
€m €m €m €m €m
ASSETSProperty, plant and equipment and intangible assets 6.7 (0.4) - - 6.3 Liability – NIE Networks pension scheme 19.8 (6.3) 8.7 - 22.2 Liability – ESB pension scheme 49.1 (7.1) - - 42.0 Borrowings 5.4 (1.8) - - 3.6 Provisions 1.0 0.7 - - 1.7 Tax losses forward 7.9 (2.0) - - 5.9 Derivative financial instruments 90.8 (1.1) (9.5) 1.1 81.3 Total deferred tax assets 180.7 (18.0) (0.8) 1.1 163.0
LIABILITIESProperty, plant and equipment and intangible assets 611.3 (5.2) - (1.2) 604.9 Provisions 7.2 0.1 - - 7.3 Derivative financial instruments 26.0 (5.8) (10.1) (1.7) 8.4 Capital gains tax 1.3 1.7 - - 3.0 Total deferred tax liabilities 645.8 (9.2) (10.1) (2.9) 623.6 Net deferred tax (liability) / asset (465.1) (8.8) 9.3 4.0 (460.6)
NOTES TO THE FINANCIAL STATEMENTS 20. TAXATION (continued)
(b) Deferred tax assets and liabilities
2020 2019GROUP €m €m
Deferred tax assetsProperty, plant and equipment and intangible assets 6.3 6.7Liability – NIE Networks pension scheme 22.2 19.8 Liability – ESB pension scheme 42.0 49.1 Borrowings 3.6 5.4 Provisions 1.7 1.0 Tax losses forward 5.9 7.9 Derivative financial instruments 81.3 90.8 Total deferred tax assets 163.0 180.7
Less deferred tax asset recognised separately on the Balance Sheet (1.7) (2.0) Net deferred tax asset being netted against deferred tax liability 161.3 178.7
Deferred tax liabilitiesProperty, plant and equipment and intangible assets 604.9 611.3 Provisions 7.3 7.2 Derivative financial instruments 8.4 26.0 Capital gains tax 3.0 1.3 Total deferred tax liabilities 623.6 645.8
Netted deferred tax liabilities (462.3) (467.1)
Net deferred tax liability (460.6) (465.1)
Certain corresponding amounts have been adjusted so that they are directly comparable with the amounts shown in respect of the current financial year.
The movement in temporary differences for the Group were as follows:
NOTES TO THE FINANCIAL STATEMENTS
2020 2019PARENT €m €m
Deferred tax assetsLiability – ESB pension scheme 42.0 49.1 Borrowings 3.6 5.4 Provisions 1.8 17.9 Derivative financial instruments 5.5 5.6 Total deferred tax assets 52.9 78.0
Deferred tax liabilitiesProperty, plant and equipment 421.5 423.9 Derivative financial instruments 3.8 3.9 Capital gains tax 1.2 1.2 Total deferred tax liabilities 426.5 429.0 Net deferred tax liability (373.6) (351.0)
20. TAXATION (continued)
(b) Deferred tax assets and liabilities (continued)
2019 Balance at 1 January
Recognised in Income
Recognised in OCI
Translation differences
Balance at 31 December
€m €m €m €m €m
ASSETSProperty, plant and equipment and intangible assets 4.5 2.2 - - 6.7 Liability – NIE Networks pension scheme 18.9 (2.1) 3.0 - 19.8 Liability – ESB pension scheme 49.4 (0.3) - - 49.1 Borrowings 7.2 (1.8) - - 5.4 Provisions 2.5 (1.5) - - 1.0 Tax losses forward 9.7 (1.8) - - 7.9 Derivative financial instruments 84.1 5.3 2.5 (1.1) 90.8 Total deferred tax assets 176.3 - 5.5 (1.1) 180.7
LIABILITIESProperty, plant and equipment and intangible assets 623.4 (13.7) - 1.6 611.3 Provisions 7.2 - - - 7.2 Derivative financial instruments 16.3 9.8 (2.5) 2.4 26.0 Capital gains tax 1.2 0.1 - - 1.3 Total deferred tax liabilities 648.1 (3.8) (2.5) 4.0 645.8 Net deferred tax (liability) / asset (471.8) 3.8 8.0 (5.1) (465.1)
There is no expiry date to when tax losses in the Group can be utilised. A deferred tax asset of €1.7 million relating to tax losses carried forward in an Irish subsidiary company is recognised separately on the Balance Sheet as these losses are ringfenced to that legal entity.
Deferred tax has not been provided for in relation to unremitted reserves of the Group's overseas subsidiaries for two reasons: either there is no commitment for these reserves to be distributed in the foreseeable future or it has been established that no tax would arise on the remittance. Deferred tax has not been provided for in relation to unremitted reserves of the Group's overseas joint ventures as the Group has the ability to control the repatriation of these reserves to the Republic of Ireland. Cumulative unremitted reserves of overseas subsidiaries and joint ventures totalled €744.5 million (2019: €673.4 million) as at 31 December 2020.

170 ESB Annual Report 2020 - Brighter Together ESB Annual Report 2020 171S
TRATEG
Y A
ND
PE
RFO
RM
AN
CE
01
CO
RP
OR
ATE G
OV
ER
NA
NC
E
02
FINA
NC
IAL S
TATEM
EN
TS
03
NOTES TO THE FINANCIAL STATEMENTS 20. TAXATION (continued)
(b) Deferred tax assets and liabilities (continued)
PARENT (continued)
The movement in temporary differences for the Parent were as follows:
2020 Balance at 1 January
Recognised in income
Recognised in OCI
Balance at 31 December
€m €m €m €m
ASSETSLiability – ESB pension scheme 49.1 (7.1) - 42.0 Borrowings 5.4 (1.8) - 3.6 Provisions 17.9 (16.1) - 1.8 Derivative financial instruments 5.6 - (0.1) 5.5 Total deferred tax assets 78.0 (25.0) (0.1) 52.9
LIABILITIESProperty, plant and equipment 423.9 (2.4) - 421.5 Derivative financial instruments 3.9 - (0.1) 3.8 Capital gains tax 1.2 - - 1.2 Total deferred tax liabilities 429.0 (2.4) (0.1) 426.5 Net deferred tax (liability) / asset (351.0) (22.6) - (373.6)
Certain corresponding amounts have been adjusted so that they are directly comparable with the amounts shown in respect of the current financial year.
2019 Balance at 1 January
Recognised in income
Recognised in OCI
Balance at 31 December
€m €m €m €m
ASSETSLiability – ESB pension scheme 49.4 (0.3) - 49.1 Borrowings 7.2 (1.8) - 5.4 Provisions 18.0 (0.1) - 17.9 Derivative financial instruments 6.2 - (0.6) 5.6 Total deferred tax assets 80.8 (2.2) (0.6) 78.0
LIABILITIESProperty, plant and equipment 429.1 (5.2) - 423.9 Derivative financial instruments 4.2 - (0.3) 3.9 Capital gains tax 1.2 - - 1.2 Total deferred tax liabilities 434.5 (5.2) (0.3) 429.0 Net deferred tax (liability) / asset (353.7) 3.0 (0.3) (351.0)
NOTES TO THE FINANCIAL STATEMENTS 21. BORROWINGS AND OTHER DEBT
Recourse Non-recourse 2020 2019borrowings borrowings Total Total
GROUP €m €m €m €m
Current borrowings - Repayable by instalments 72.6 1.9 74.5 88.7 - Repayable other than by instalments 55.1 - 55.1 392.0Total current borrowings 127.7 1.9 129.6 480.7
Non-current borrowings - Repayable by instalments Between one and two years 69.4 2.0 71.4 75.7 Between two and five years 194.5 5.8 200.3 216.2 After five years 233.6 2.3 235.9 294.2
497.5 10.1 507.6 586.1 - Repayable other than by instalments Between one and two years - - - 57.6 Between two and five years 531.2 388.6 919.8 553.7 After five years 3,242.5 444.1 3,686.6 3,554.3
3,773.7 832.7 4,606.4 4,165.6
Total non-current borrowings 4,271.2 842.8 5,114.0 4,751.7
Total borrowings outstanding 4,398.9 844.7 5,243.6 5,232.4
See section (b) for details of applicable interest rates.
2020 2019 Current borrowings by facility Ref €m €m
ESB Eurobonds 1 - 323.2Non-recourse long-term project finance debt 2 1.9 1.9Long-term bank borrowings 4 72.1 -Private placement borrowings 5 55.6 155.6
129.6 480.7
2020 2019 Non-current borrowings by facility Ref €m €m
ESB Eurobonds 1 3,542.1 2,973.1Non-recourse long-term project finance debt 2 10.1 12.7Non-recourse NIE Networks Sterling bonds 3 832.7 878.5Long-term bank borrowings 4 494.8 573.4Private placement borrowings 5 234.3 314.0
5,114.0 4,751.7
With the exception of borrowings relating to non-recourse project finance debt, which is secured against specific assets, none of the borrowings are secured against the Group assets.
ESB was rated A- from Standard & Poor's (outlook stable) and A3 (equivalent to A-) from Moody's (outlook stable).
1. ESB EurobondsThe table below provides details of ESB Eurobonds included in borrowings at 31 December 2020:
Issuer Value Issue Date Tenor CouponESB Finance DAC Euro €300.0 million November 2013 10 years 3.494%ESB Finance DAC Euro €500.0 million June 2015 12 years 2.125%ESB Finance DAC Euro €600.0 million June 2016 15 years 1.875%ESB Finance DAC Euro €500.0 million January 2017 12 years 1.750%ESB Finance DAC Euro €500.0 million November 2018 15 years 2.125%ESB Finance DAC Euro €100.0 million April 2019 25 years 2.000%ESB Finance DACESB Finance DAC
Euro €700.0 million (Green Bond)1 Stg £325.0 million
June 2019 / July 2020January 2020
11 years15 years
1.125%1.875%
1€500.0 million was issued in June 2019 and €200.0 million was issued in July 2020.

STR
ATEGY
AN
D P
ER
FOR
MA
NC
E
01
CO
RP
OR
ATE G
OV
ER
NA
NC
E
02
FINA
NC
IAL S
TATEM
EN
TS
03
NOTES TO THE FINANCIAL STATEMENTS NOTES TO THE FINANCIAL STATEMENTS 21. BORROWINGS AND OTHER DEBT (continued)
2. Non-recourse long-term project finance debtThis debt relates to a wind farm in Great Britain (GB).
3. Non-recourse NIE Networks Sterling BondsThe table below provides details of non-recourse NIE Networks Sterling Bonds included in borrowings at 31 December 2020:
Issuer Value Issue Date Tenor CouponNIE Networks Limited Stg £400.0 million June 2011 15 years 6.375%NIE Networks Limited Stg £350.0 million September 2018 7 years 2.500%
4. Long-term bank borrowingsThe table below provides details of long-term bank borrowings included in borrowings at 31 December 2020:
IssuerBalance at 31 December 2020
Balance at 31 December 2019
€200 million European Investment Bank (EIB) to support renewable connections to the electricity network in the southwest of Ireland
Euro €200.0 million Euro €200.0 million
Other long term bank borrowings of floating rate debt borrowed on a bilateral basis (apart from above €200million)
Euro €43.7 million Euro €33.0 million
€150.0 million European Investment Bank (EIB) to support the roll out of Smart Meters in Ireland
- -
€1.4 billion Revolving Credit Facility (with a syndicate of 14 banks) - Euro €70.0 million
A €200.0 million facility with the European Investment Bank (EIB) to support renewable connections to the electricity network in the southwest of Ireland was drawn down in full at 31 December 2020 (2019: €200.0 million).
A €150.0 million facility with the European Investment Bank (EIB) to support the roll out of Smart Meters in Ireland was signed in August 2020 and remained fully undrawn at 31 December 2020.
In February 2020 ESB entered into a new €1.4 billion Sustainability linked Revolving Credit Facility up to February 2025 with a group of fourteen international banks. This replaced the previous €1.44 billion facility signed in 2015. €Nil of this facility was drawn down at 31 December 2020 (2019: €70 million).
5. Private placement borrowingsThe table below provides details of private placement borrowings included in borrowings at 31 December 2020:
The private placement debt and certain other facilities have conditions which require ESB to maintain certain interest cover and asset covenants. At 31 December 2020 ESB is fully in compliance with all the covenant requirements associated with the private placement debt and other facilities.
Hedge of net investment in foreign operations Included in 2019 borrowings above are sterling denominated bank loans, which have been designated as a hedge of the Group’s investment in a sterling denominated subsidiary in the United Kingdom. These loans were repaid in full during the year, as outlined below:
Sterling denominated loans designated as a hedge of Group's investment in subsidiary 2020 2019€m €m
Value at 1 January 22.4 32.0 Repayments in year (21.6) (11.2)(Loss) / gain on translation to Euro (0.8) 1.6 Value at 31 December - 22.4
(Loss) / gain on translation of intra-group Euro loan to subsidiary (taken to OCI) (0.7) 1.2
Balance at 31 December 2020
Balance at 31 December 2019 Issue Date Maturity Date
First Private Placement Senior unsecured notes USD $273.5 millionStg £10.0 million
USD $273.5 millionStg £10.0 million
December 2003December 2003
December 2023December 2023
Second Private Placement Senior unsecured notes Stg £50.0 million Stg £50.0 million June 2009 June 2021
21. BORROWINGS AND OTHER DEBT (continued) RECOURSE BORROWINGS2020 2019Total Total
PARENT €m €m
Current borrowings - Repayable by instalments 72.6 86.8 - Repayable other than by instalments 55.1 68.9Total current borrowings 127.7 155.7
Non-current borrowings - Repayable by instalments Between one and two years 69.4 73.7 Between two and five years 194.5 209.7 After five years 233.6 290.0
497.5 573.4 - Repayable other than by instalments Between one and two years (0.6) 57.6 Between two and five years 232.2 256.3 After five years - -
231.6 313.9
Total non-current borrowings 729.1 887.3
Total borrowings outstanding 856.8 1,043.0
(a) Funding and liquidity management
The principal liquidity risks faced by the Group relate to cash flow requirements arising from day-to-day operations, maturing debt obligations and the funding of capital investment programmes. The Group’s treasury function manages this risk through a combination of liquid investments, cash and cash equivalents and undrawn committed bank facilities. The Group negotiates facilities with relationship banks and raises funds in debt capital markets to pre-fund, or pre-hedge, any funding requirements arising from maturing debt, capital expenditure and general business requirements.
At 31 December 2020 the Group had over €1.8 billion available in cash or cash equivalents and committed bank facilities, ensuring liquidity demands can be met as required. The committed bank facilities include a syndicated loan facility with a large number of well-rated financial institutions as well as an undrawn facility from the European Investment Bank.
The Group’s debt management strategy targets a debt portfolio profile with a diverse mix of counterparties, funding sources and maturities. Structured non-recourse and limited recourse financing is used where appropriate, taking into account both funding costs and risk mitigation. All borrowing facilities are in compliance with the Electricity Acts and relevant regulatory requirements.
The maturity profile of the carrying amount of the Group’s borrowings, and the expiry of material undrawn committed bank borrowing facilities are as follows:
Drawn Debt - Group Drawn Debt - ParentUndrawn Facility - Group
and Parent2020 2019 2020 2019 2020 2019
Maturing €m €m €m €m €m €m
In one year or less 129.6 480.7 127.7 155.7 - - Between one and two years 71.4 133.3 68.8 131.3 - - Between two and five years 1,120.1 769.9 426.7 466.0 1,400.0 1,370.0 In more than five years 3,922.5 3,848.5 233.6 290.0 - -
5,243.6 5,232.4 856.8 1,043.0 1,400.0 1,370.0
172 ESB Annual Report 2020 - Brighter Together ESB Annual Report 2020 173

STR
ATEGY
AN
D P
ER
FOR
MA
NC
E
01
CO
RP
OR
ATE G
OV
ER
NA
NC
E
02
FINA
NC
IAL S
TATEM
EN
TS
03
NOTES TO THE FINANCIAL STATEMENTS 21. BORROWINGS AND OTHER DEBT (continued)
(a) Funding and liquidity management (continued)
The following table sets out the contractual maturities of Group borrowings, including the associated interest payments. Borrowings with a carrying value of €4,386.8 million (31 December 2019: €4,189.4 million) relate to borrowings of subsidiaries in the Group.
Carrying amount
Contractual cashoutflows /
(inflows) - net Within 1 year 1 - 2 years 2 - 5 yearsMore than 5
years€m €m €m €m €m €m
31 December 2020Recourse borrowings 4,398.9 5,227.4 227.7 162.8 968.4 3,868.5 Non-recourse borrowings 844.7 1,067.4 40.4 40.4 510.4 476.2 Total borrowings 5,243.6 6,294.8 268.1 203.2 1,478.8 4,344.7
31 December 2019Recourse borrowings 4,339.3 5,200.3 600.8 227.9 1,016.4 3,355.2 Non-recourse borrowings 893.1 1,169.3 42.6 42.5 128.0 956.2 Total borrowings 5,232.4 6,369.6 643.4 270.4 1,144.4 4,311.4
(b) Interest rate risk management
The Group’s interest rate policy was updated in 2020 and the target is to have a significant majority of its debt at fixed (or inflation-linked) interest rate to maturity, with a minimum of 60% fixed (or inflation-linked) at all times. This is achieved either by borrowing directly at fixed interest rates or via interest rate swaps. At 31 December 2020, 96.3% of the Group’s debt was fixed to maturity or inflation-linked (31 December 2019: 97.2%). The fair value of interest rate swaps is disclosed in note 22.
In respect of interest-bearing financial liabilities, the following table indicates their effective interest rates at the balance sheet date taking into account the effect of interest rate swaps and cross currency swaps:
NOTES TO THE FINANCIAL STATEMENTS
Effective interest rate Total Within 1 year 1 - 2 years 2 - 5 years
More than 5 years
% €m €m €m €m €m
Private placement borrowings (fixed interest rate) 6.67 289.6 55.6 - 234.0 - Non-recourse borrowings (fixed interest rate) 4.67 844.7 1.9 2.0 394.4 446.4 Other long-term borrowings (fixed and variable interest rate) 2.24 4,109.2 72.1 69.4 491.6 3,476.1
Included within other long-term borrowings in this analysis are floating rate liabilities of €244 million (31 December 2019: €233 million).
The effective interest rate on the private placement borrowings has been fixed through the use of cross currency swaps and interest rate swaps. The effective rate of non-recourse sterling borrowings of £11.1 million has been fixed using interest rate swaps. In the absence of these interest rate swaps, the floating rate on the underlying sterling and euro borrowings at 31 December 2020 would be 1.68%, in line with prevailing interest rates in those monetary areas on borrowings of a similar duration. Inflation-linked swaps are included at equivalent nominal interest rate levels.
21. BORROWINGS AND OTHER DEBT (continued)
(b) Interest rate risk management (continued)
In managing interest rate risk, the Group aims to reduce the impact of short-term fluctuations on the Group's earnings. Over the longer term, however, permanent changes in interest rates will have an impact on consolidated earnings. It is estimated that a general increase of 50 basis points in interest rates (and corresponding real interest rates) for the year would have increased profit before taxation and reduced equity by the amounts shown below. This analysis assumes that all other variables, in particular foreign currency rates, remain constant, including the assumption that there is no change in inflation rates.
31 December 2020 31 December 201950 bp
increase50 bp
decrease50 bp
increase50 bp
decreasegain / (loss) gain / (loss) gain / (loss) gain / (loss)
€m €m €m €m
Profit before taxationInterest payable (0.7) 0.2 (0.8) 0.4 Fair value movements on financial instruments 53.3 (56.7) 58.6 (62.5)
Other comprehensive incomeFair value gains / (losses) 3.2 (3.4) (0.3) 0.3
The following assumptions were made in respect of the sensitivity analysis above:
• the balance sheet sensitivity to interest rates relates only to derivative financial instruments, as debt and other deposits are carried at amortised costand so their carrying value does not change as interest rates move;
• the sensitivity of accrued interest to movements in interest rates is calculated on net floating rate exposures on debt, deposits and derivativeinstruments;
• derivatives designated as cash flow hedges against movements in interest rates are assumed to be fully effective, recorded fully within equity with noimpact on the Income Statement;
• changes in the carrying value of derivative financial instruments not in hedging relationships affect the Income Statement only; and
• the floating leg of any swap or any floating rate debt is treated as not having any interest rate already set, therefore a change in interest rates affectsa full 12-month period for the accrued interest portion of the sensitivity calculations.
(c) Reconciliation of external borrowings
GROUP
2020Balance at 1 January Proceeds Repayments
Effects offoreign
exchange OtherBalance at
31 DecemberDebt Facilities €m €m €m €m €m €m
ESB Eurobonds 3,296.3 572.2 (309.1) (18.9) 1.6 3,542.1 Non-recourse long-term project finance debt 14.6 - (1.9) (0.8) 0.1 12.0 Non-recourse NIE Networks Sterling bonds 878.5 - - (46.2) 0.4 832.7 Long-term bank borrowings 729.0 - (155.5) (7.0) 0.4 566.9 Private placement borrowings 314.0 - - (24.0) (0.1) 289.9 Total 5,232.4 572.2 (466.5) (96.9) 2.4 5,243.6
2019Balance at 1 January Proceeds Repayments
Effects offoreign
exchange OtherBalance at
31 DecemberDebt Facilities €m €m €m €m €m €m
ESB Eurobonds 2,898.8 592.9 (214.9) 15.8 3.7 3,296.3 Non-recourse long-term project finance debt 60.6 - (46.8) 0.8 - 14.6 Non-recourse NIE Networks Sterling bonds 835.0 - - 43.9 (0.4) 878.5 Long-term bank borrowings 806.3 - (85.1) 7.8 - 729.0 Private placement borrowings 543.3 - (201.2) 12.6 (40.7) 314.0 Total 5,144.0 592.9 (548.0) 80.9 (37.4) 5,232.4
174 ESB Annual Report 2020 - Brighter Together ESB Annual Report 2020 175

STR
ATEGY
AN
D P
ER
FOR
MA
NC
E
01
CO
RP
OR
ATE G
OV
ER
NA
NC
E
02
FINA
NC
IAL S
TATEM
EN
TS
03
NOTES TO THE FINANCIAL STATEMENTS NOTES TO THE FINANCIAL STATEMENTS PARENT
2020Balance at 1 January Proceeds Repayments
Effects offoreign
exchange OtherBalance at
31 DecemberDebt Facilities €m €m €m €m €m €m
Long-term bank borrowings 729.0 - (155.5) (7.0) 0.4 566.9 Private placement borrowings 314.0 - - (24.0) (0.1) 289.9 Total 1,043.0 - (155.5) (31.0) 0.3 856.8
2019Balance at 1
January Proceeds Repayments
Effects offoreign
exchange OtherBalance at
31DecemberDebt Facilities €m €m €m €m €m €m
Long-term bank borrowings 806.3 - (85.1) 7.8 - 729.0 Private placement borrowings 543.3 - (201.2) 12.6 (40.7) 314.0 Total 1,349.6 - (286.3) 20.4 (40.7) 1,043.0
22. DERIVATIVE FINANCIAL INSTRUMENTS
(a) Fair value by class of derivative financial instrument
Derivative financial instruments are carried at fair value. The fair value of a financial instrument is the price that would be received to sell an asset or paid to transfer a liability in an orderly transaction between market participants at the measurement date. The method used to calculate the fair value of the Group's financial instruments is discounted cash flow analysis, using a Libor discount rate and reflecting counterparty credit risk. This method enables the Group to discount the cash flows at a rate equal to the prevailing market rate of interest taking into account maturity and credit margin.
The fair values of financial instruments, grouped by class of instrument, are as follows:
2020Non-current
assetsCurrentassets
Non-currentliabilities
Currentliabilities Total
GROUP €m €m €m €m €m
Interest rate swaps 3.4 0.4 (1.6) - 2.2 Inflation-linked interest rate swaps - - (571.3) (21.2) (592.5)Currency swaps - - (19.4) - (19.4)Foreign exchange contracts 1.4 2.7 (3.5) (4.6) (4.0)Forward fuel price contracts1 3.5 166.5 (9.1) (166.9) (6.0)
8.3 169.6 (604.9) (192.7) (619.7)
1Contracts that link the forward electricity price more closely with forward fuel prices are presented net in forward fuel price contracts at 31 December 2020.
2019Non-current
assetsCurrentassets
Non-currentliabilities
Currentliabilities Total
€m €m €m €m €m
Interest rate swaps 1.1 4.6 (1.9) - 3.8 Inflation-linked interest rate swaps - - (578.5) (16.9) (595.4)Currency swaps - - (24.9) - (24.9)Foreign exchange contracts 4.6 20.7 (7.3) (5.4) 12.6 Forward fuel price contracts 17.7 180.3 (49.9) (245.5) (97.4)Forward electricity price contracts 42.1 39.2 - - 81.3
65.5 244.8 (662.5) (267.8) (620.0)
2020Non-current
assetsCurrentassets
Non-currentliabilities
Currentliabilities Total
PARENT €m €m €m €m €m
Interest rate swaps 3.4 0.4 (0.5) - 3.3 Currency swaps - - (19.4) - (19.4)Foreign exchange contracts 3.4 2.7 (3.5) (4.6) (2.0)Forward fuel price contracts 3.3 126.7 (7.7) (146.4) (24.1)
10.1 129.8 (31.1) (151.0) (42.2)
2019Non-current
assetsCurrentassets
Non-currentliabilities
Currentliabilities Total
€m €m €m €m €m
Interest rate swaps 1.1 - - - 1.1 Currency swaps - - (24.9) - (24.9)Foreign exchange contracts 9.0 21.1 (7.2) (5.3) 17.6 Forward fuel price contracts 17.7 180.3 (10.9) (207.0) (19.9)
27.8 201.4 (43.0) (212.3) (26.1)
176 ESB Annual Report 2020 - Brighter Together ESB Annual Report 2020 177

STR
ATEGY
AN
D P
ER
FOR
MA
NC
E
01
CO
RP
OR
ATE G
OV
ER
NA
NC
E
02
FINA
NC
IAL S
TATEM
EN
TS
03
NOTES TO THE FINANCIAL STATEMENTS NOTES TO THE FINANCIAL STATEMENTS 22. DERIVATIVE FINANCIAL INSTRUMENTS (continued)
(a) Fair value by class of derivative financial instrument (continued)
The Group decides at inception whether to designate financial instruments into hedge relationships for certain arrangements that meet the specific hedging accounting criteria of IFRS 9.
When interpreting the positive and negative fair values of derivative financial instruments, it should be noted that they are matched with underlying transactions with offsetting risks.
(i) Interest rate swaps
The Group has executed interest rate swaps of Stg£454.0 million (2019: Stg£431.1 million) in connection with a certain portion of its borrowings held by the Parent and ESB Finance DAC and certain debt held in other wind farms assets within the Group.
For interest rate swaps, the fair value takes into account the fixed, floating and market rates prevailing at the balance sheet date. As interest rate swaps are marked to market at 31 December 2020, their carrying value is equal to their fair value.
The fair value of the interest rate swaps has decreased by €1.6 million. The movement reflects positive mark to market movements in the underlying swaps of €2.9 million and expiration on swaps with a mark to market position of €4.5 million during the year.
(ii) Inflation-linked interest rate swaps
Inflation-linked interest rate swaps with a fair value on acquisition of €272.5 million were acquired in December 2010 as part of the purchase of the NIE Networks business. The inflation-linked interest rate swaps did not qualify for hedge accounting under IFRS 9 on acquisition of the NIE Networks business. The fair value of the inflation-linked interest rate swaps is affected by relative movements in interest rates and in market expectations of future Retail Price Index (RPI) movements in the United Kingdom (UK).
Arising from movements in forward interest rates, UK RPI forward prices, foreign currency exchange rates and payments during the year, the fair value of the liability has decreased by €2.9 million on these swaps in the year ended 31 December 2020 (2019: fair value of the liability increased by €37.1 million). The movement reflects negative mark to market movements in the underlying swaps of €47.4 million (2019: negative movement €23.3 million), reflected in finance costs in the income statement (note 8) and payments of €17.1 million (2019: €15.2 million) arising under the swaps during the year. In addition, positive translation movements of €33.2 million (2019: negative translation movements of €29.0 million) during the year on translation of the swaps from sterling to euro are reflected in the OCI.
(iii) Currency swaps
The fair value of currency swaps are affected by movements in foreign exchange and interest rates. ESB's currency swaps are primarily classified as cash flow hedges and relate mainly to the cross-currency swaps entered into in connection with the private placement debt, which is described in note 21. These cross-currency swaps were entered into in order to swap US dollar and sterling interest and principal repayments on the underlying debt toeuro, thereby hedging the risk on these payments over the years to maturity from 2010 to 2023. During 2019, a portion of the cross-currency swaps matured due to US$226.0 million of private placement debt being repaid.
No ineffectiveness under the meaning of IFRS 9 arose on the currency swaps during the year (2019: €nil). Separately included in the income statement for the year 31 December 2020 is a loss of €20.5 million (2019: gain of €8.3 million) arising on cross-currency swaps which is substantially offset by movements in the translation of the underlying hedged foreign currency borrowings at the prevailing exchange rates and a fair value gain of €4.3 million relating to the novated element of the Currency Swaps.
(iv) Foreign exchange contracts
In addition to foreign exchange contracts entered into in relation to the Group's borrowings, the Group has entered into foreign exchange contracts in relation to energy costs, Long Term Service Agreements (LTSAs) and fuel purchase requirements (which are in US dollar and sterling). These contracts have maturities extending until 2024. Total negative fair value movements of €16.6 million (2019: positive movements of €2.3 million) were recognised during the year in relation to such foreign exchange contracts, of which a positive fair value movement of €0.2 million (2019: negative movements of €7.1 million) was recognised through OCI and a negative fair value movement of €16.8 million (2019: positive movement of €9.4 million) was recognised in the Income Statement.
Fair value hierarchy
Further information on the methods of valuing financial instruments is included in note 28.
22. DERIVATIVE FINANCIAL INSTRUMENTS (continued)
(b) Funding and liquidity management - maturity of derivative financial instruments
The following table sets out the contractual maturities of derivative financial instruments, including the associated undiscounted net cash flows attributable to them. Derivatives are entered into to hedge exposures to interest rates, foreign currency rates and commodity price movements. The derivative financial instruments are expected to impact the profit and loss at the same time as the hedge exposures impacts the Income Statement. Net derivative financial instrument liabilities of €577.5 million (2019: €593.9 million) are included in the Group balances below, but do not comprise part of the Parent's assets and liabilities as they are not held directly by the Parent. See note 28 (b) for further analysis of Group and Parent financial assets and liabilities.
Carrying amount
Contractual cash
inflows /(outflows) - net Within 1 year 1 - 2 years 2 - 5 years
More than 5 years
31 December 2020 €m €m €m €m €m €m
Interest rate swaps 3.8 4.0 1.9 1.2 0.9 - Foreign exchange contracts 4.1 4.5 3.8 0.7 - - Forward fuel price contracts 170.0 170.0 166.4 2.9 0.7 - Total assets 177.9 178.5 172.1 4.8 1.6 -
Interest rate swaps (1.6) (1.7) (0.5) (0.4) (0.7) (0.1)Inflation-linked interest rate swaps1 (592.5) (598.5) (21.2) (577.3) - - Currency swaps (19.4) (18.0) (4.1) (3.3) (16.3) 5.7 Foreign exchange contracts (8.1) (8.6) (5.2) (0.6) (2.8) - Forward fuel price contracts2 (176.0) (176.0) (166.8) (7.3) (1.9) - Total liabilities (797.6) (802.8) (197.8) (588.9) (21.7) 5.6
Net derivative assets / (liabilities) (619.7) (624.3) (25.7) (584.1) (20.1) 5.6
1 A mandatory break in June 2022 on the RPI linked interest rate swap portfolio brings forward contractual cashflows which would otherwise be payable over the life of the swaps. The swaps have maturities in 2026, 2031 and 2036. At 31 December 2020, negotiations to extend the mandatory break are at an advanced stage.
2 Contracts that link the forward electricity price more closely with forward fuel prices are presented net in forward fuel price contracts at 31 December 2020.
31 December 2019Interest rate swaps 5.7 5.8 5.2 0.4 0.1 0.1 Foreign exchange contracts 25.3 25.3 20.6 4.5 0.2 - Forward fuel price contracts 198.0 198.2 180.6 15.7 1.9 - Forward electricity price contracts 81.3 81.0 39.1 38.1 3.8 - Total assets 310.3 310.3 245.5 58.7 6.0 0.1
Interest rate swaps (1.9) (1.7) (0.4) (0.4) (0.7) (0.2)Inflation-linked interest rate swaps1 (595.4) (648.3) (17.0) (17.9) (613.4) -Currency swaps (24.9) (23.0) (4.2) (4.6) (3.9) (10.3)Foreign exchange contracts (12.7) (12.8) (5.3) (2.8) (4.7) - Forward fuel price contracts (295.4) (295.4) (245.8) (46.5) (3.1) - Total liabilities (930.3) (981.2) (272.7) (72.2) (625.8) (10.5)
Net derivative assets / (liabilities) (620.0) (670.9) (27.2) (13.5) (619.8) (10.4)
1 Inflation-linked interest rate swaps have been restated to reflect a mandatory break in June 2022 on the RPI linked interest rate swap portfolio which brings forward contractual cashflows that were previously presented as payable over the life of the swaps. The swaps have maturities in 2026, 2031 and 2036. At 31 December 2020, negotiations to extend the mandatory break are at an advanced stage. Certain corresponding amounts have been adjusted so that they are directly comparable with the amounts shown in respect of the current financial year.
178 ESB Annual Report 2020 - Brighter Together ESB Annual Report 2020 179

STR
ATEGY
AN
D P
ER
FOR
MA
NC
E
01
CO
RP
OR
ATE G
OV
ER
NA
NC
E
02
FINA
NC
IAL S
TATEM
EN
TS
03
NOTES TO THE FINANCIAL STATEMENTS NOTES TO THE FINANCIAL STATEMENTS 22. DERIVATIVE FINANCIAL INSTRUMENTS (continued)
(c) Hedging Reserves
The Group's hedging reserves movements relate to the following hedging instruments:
Cash flow hedging reserve1
Cross-currency interest rate
swapsInterest rate
swaps
Foreign exchange contracts
Forward fuel price contracts2 Total
€m €m €m €m €m
Net fair value movements 4.0 - (0.8) 17.7 20.9 Net fair value movements for equity accounted investees - 47.8 (11.4) - 36.4 Transfers to the income statement (4.8) - - (11.1) (15.9)Deferred tax movements 0.1 (9.1) 2.3 (0.8) (7.5)
(0.7) 38.7 (9.9) 5.8 33.9
1The cash flow hedge reserve includes an amount of €2.6 million relating to the cost of hedging. 2Contracts that link the forward electricity price more closely with forward fuel prices are presented net in forward fuel price contracts at 31 December 2020.
Hedge IneffectivenessHedge effectiveness is determined at the inception of the hedge relationship and through periodic prospective effectiveness assessments to ensure that an economic relationship exists between the hedged item and the hedging instrument.
Foreign exchange contracts
For hedges of foreign currency purchases, the Group enters into hedge relationships where the critical terms of the hedging instrument match exactly with the terms of the hedged item. The Group performs a qualitative assessment of effectiveness. If changes in circumstances affect the terms of the hedged item such that the critical terms no longer match exactly with the critical terms of the hedging instrument, the group uses the hypothetical derivative method to determine ineffectiveness.
In hedges of foreign currency purchases, ineffectiveness may arise if the timing of the forecast transaction changes from what was originally estimated, or if there are changes in credit risk.
Forward fuel and electricity contracts
For hedges of forward fuel and forward electricity contracts, the Group enters into hedge relationships where the critical terms of the hedging instrument match with the terms of the hedged item. Ineffectiveness may arise if the timing or quantity of the forecast transaction changes from what was originally estimated, or if there are changes in credit risk. Hedge ineffectiveness for forward fuel and electricity contracts is measured using the hypothetical derivative method.
Within its regular course of business, the Group routinely enters into sale and purchase contracts for commodities, including gas and electricity. Where the contract was entered into and continues to be held for the purposes of receipt or delivery of the commodities in accordance with the Group’s expected sale, purchase or usage requirements, the contracts are designated as own use contracts and are accounted for as executory contracts. These contracts are therefore not within the scope of IFRS 9 - Financial Instruments.
Cross-Currency interest rate swaps
The Group enters into interest rate swaps that have similar critical terms as the hedged item, such as reference rate, payment dates, maturities and notional amount. The hedged item is identified as a proportion of the outstanding amount up to the notional amount of the swaps. Hedge ineffectiveness for interest rate swaps is measured using the same principals as for hedges of foreign exchange contracts. It may occur primarily due to differences in critical terms between the interest rate swaps and the loans.
22. DERIVATIVE FINANCIAL INSTRUMENTS (continued)
(d) Effects of hedge accounting on the financial position and performance
Below table comprises carrying amounts of hedged financial instruments and associated changes in fair value in connection with cash flow hedges that impacted the Group's balance sheet:
USD Cross-currency
interest rate swaps
GBP Cross-currency
interest rate swaps
Foreign exchange
contracts - USD
Forward fuel price contracts
- Coal
Forward fuel price contracts
- Gas (Level 3)2
Forward electricity price
contracts (Level 3)2
€m €m €m €m €m €m
Carrying amount - asset / (liability) as at 31 December 2020
(7.8) (4.6) 0.6 (0.2) (16.4) 13.6
Notional amount 173.5 323.0 14.5 0.0 1.4 1.4
Notional unit USD GBP USD Tn Mwh Mwh
Maturity date - earliest Dec-23 Nov-28 Mar-21 Dec-21 Jan-21 Jan-21
Maturity date - latest Dec-23 Nov-28 Dec-21 Dec-21 Dec-24 Dec-24
Hedge ratio1 1:1 1:1 1:1 1:1 1:1 1:1 Change in fair value of outstandinghedging instruments since 1 January
(7.1) 15.7 0.3 (0.1) 61.0 (67.6)
Change in value of hedged item usedto determine hedge effectiveness
7.1 (15.7) (0.3) 0.1 (61.0) 67.6
Weighted average hedged rate / price
5.69%/ 1.19 3.25%/ 0.8882
1.18 81.00 - -
Unit of rate/price Interest rate %
/ FX rate Interest rate %
/ FX rate$/€ €/Tn - -
1 The hedge ratio is the quantity of hedging instrument per quantity of hedged item. The appropriate hedge ratio is determined based on specific factors such as volumes of commodities required, contracted foreign exchange and interest rate exposures.
2 Weighted average hedged rate / price is not applicable to the Level 3 contracts above. Level 3 hedge instruments link electricity more closely to fuel inputs.
In addition to the hedge relationships disclosed above, FX forwards with a nominal €67.3 million were de-designated during the period, the accumulated amount remaining in the statement of changes in equity for the discontinued hedge relationships of €4.2 million.
The tables as set out above, reflect the hedging relationships affected by interest rate benchmark reform (IBOR reform) as financial instruments transition to risk free rates. The principal change is expected to be for the contractual terms of IBOR-referenced interest rate swaps and debt instruments and the related impact on hedge designation, systems and processes. While general communication with swap and debt counterparties has commenced, no specific changes have been agreed to date. In assessing the potential impact the Group has assumed that the uncertainty in relation to the IBOR reform will remain until the Group has completed specific changes with the swap and debt counterparties and the Group will continue to apply the amendments to IFRS 9 until this date.
180 ESB Annual Report 2020 - Brighter Together ESB Annual Report 2020 181

STR
ATEGY
AN
D P
ER
FOR
MA
NC
E
01
CO
RP
OR
ATE G
OV
ER
NA
NC
E
02
FINA
NC
IAL S
TATEM
EN
TS
03
NOTES TO THE FINANCIAL STATEMENTS 23. PENSION LIABILITIES (continued)
(a) Parent and Group - Republic of Ireland (continued)
(i) ESB Defined Benefit Pension Scheme (The Scheme) (continued)
AccountingIAS 19 (revised) Employee Benefits is the relevant accounting standard to determine the way post-employment benefits should be reflected in ESB’s financial statements.
The financial statements reflect the following obligations to the Scheme:
• Ongoing contributions - these are recognised in the income statement as incurred. Any unpaid amounts at year end are recognised as liabilities on thebalance sheet.
• Obligations of €106.3 million to the Scheme are also included on the balance sheet, made up of:- Past service contributions – the on-going rate of contribution by ESB includes a contribution towards past service accrued in 2010. The presentvalue of future contributions in respect of that past service are recognised on the balance sheet. Amounts yet to be paid are subject to an annualfinancing charge and this is expensed in the income statement.- Past Voluntary Severance (VS) Programmes – in 2010 ESB recognised a future fixed commitment in respect of staff who had left the Companyunder previous VS programmes. ESB will make pension contributions in respect of those staff and the fair value of those future contributions are alsorecognised on the balance sheet. Amounts yet to be paid are subject to an annual financing charge and this is expensed in the income statement.
23. PENSION LIABILITIES
The Group operates a number of pension Schemes for staff in both the Republic of Ireland, Northern Ireland and the United Kingdom (UK). Pension arrangements in respect of staff in the Republic of Ireland including ESB employees seconded overseas are set out in section (a) below. Pension arrangements in respect of staff in the UK and Northern Ireland are described in section (b) and (c).
(a) Parent and Group - Republic of Ireland
(i) ESB Defined Benefit Pension Scheme (The Scheme)
Pensions for the majority of employees in the electricity business are funded through a contributory pension Scheme called the ESB Defined Benefit Pension Scheme. The fund is vested in Trustees nominated by ESB and its members for the sole benefit of employees and their dependants. The Scheme is a defined benefit Scheme and is registered as such with the Pensions Authority.
The regulations governing the Scheme stipulate the benefits that are to be provided and the contributions to be paid by both ESB and the contributing members. Notwithstanding the defined benefit nature of the benefits, ESB has no legal obligation to increase contributions to maintain those benefits in the event of a deficit. ESB’s rate of contribution cannot be altered without the agreement of ESB and approval of the Minister for Environment, Climate and Communications. Should a deficit arise in the future, ESB is obliged under the regulations to consult with the Superannuation Committee, the Trustees and the Scheme Actuary to consider the necessity of submitting an amending Scheme for Ministerial approval. This is different to the normal ‘balance of cost’ defined benefit approach, where the employer is liable to pay the balance of contributions required to fund benefits.
History
Historically the contributions of both ESB and members have been fixed by the Scheme regulations for long periods. On a number of occasions since the early 1980s, a deficit in the Scheme has been reported by the Scheme Actuary. On each occasion ESB has, in accordance with its obligations under the Scheme rules, consulted with the Committee, the Trustees and the Actuary. Following discussions with the unions, deficits were resolved by increasing contributions by both ESB and pension Scheme members.
The 2010 Pensions Agreement followed a 31 December 2008 actuarial deficit of €1,957.0 million. It was recognised that it was not feasible to address such a deficit through increased contributions. Negotiations between ESB and ESB Group of Unions (employee representatives) concluded with the landmark 2010 Pensions Agreement (approved by employees in July 2010 and formally ratified by the Board of ESB on 20 October 2010). The main features of the Agreement included the introduction of a Career Average Revalued Earnings (CARE) pension model for benefits earned after 1 January 2012, pension and pay freezes, the cessation of the historic link between salary and pension increases, and the application of a solvency test in relation to any future pension increases. The fixed contribution rates for the employer and for Scheme members were not changed. Under the Agreement ESB agreed to a once off cash injection into the Scheme, payable over a number of years, which had an agreed valuation for actuarial purposes as at 1 January 2010 of €591.0 million. In 2020, the remaining balance of this amount was paid to the Trustees of the Scheme by ESB. Under the Agreement membership of the Scheme has been closed to new joiners. The changes brought about by the 2010 Pensions Agreement were subsequently approved by the Minister.
The Scheme Actuary confirmed during 2020 that on an actuarial basis, the Scheme’s assets were broadly in balance with its liabilities at the end of 2019. Should an actuarial deficit arise in the future, the obligation on ESB, as set out in the Scheme regulations, to consult with the parties to the Scheme remains unchanged. However, there is currently a shortfall in a wind-up scenario under the Minimum Funding Standard (MFS). Refer to Wind Up / Minimum Funding Standard Valuation section below.
ESB does not intend that any further contributions, other than those currently provided for under the scheme regulations (described below) will be made.
Definitions
There are three different methods of assessing the financial status of the Scheme:• Ongoing Actuarial Valuation.• Minimum Funding Standard, under the Pensions Act.• Accounting, as set out in International Accounting Standard 19, Employee Benefits.
Each of these methods assesses the Scheme from specific perspectives using assumptions and projections which may differ.
Ongoing Actuarial Valuation
This valuation method assumes that both the Scheme and ESB continue in existence for the foreseeable future - it is not a wind-up valuation. The Scheme Actuary confirmed in 2020 that the Scheme was broadly in balance on an ongoing actuarial basis at the end of 2019, i.e. that based on the assumptions made, the Scheme is projected to be able to meet its obligations as they fall due.
Wind-Up / Minimum Funding Standard Valuation
The Pensions Act requires the Trustees of the Scheme to also assess whether it could meet a certain prescribed standard, known as the Minimum Funding Standard (MFS). This assesses whether if the Scheme were wound up on a specified theoretical valuation date, it could secure the benefits on that date. It should be noted that ESB does not envisage the winding up of the Scheme. The Scheme Actuary confirmed in 2020 that the MFS was not met as at 31 December 2019 and that the risk reserve requirement was also not met.
The parties to the Scheme developed a plan that will facilitate the submission of a new Funding Plan to address the regulatory shortfall. As part of this plan a change to the Scheme rules was approved by the ESB Board in February 2020 and submitted to the Minister for Environment, Climate and Communications for approval. Ministerial approval for the rule change was received in December 2020, and it is expected that an MFS Funding Plan will be submitted to the Pensions Authority when approved by the Minister.
ESB does not intend that any further contributions, other than the normal on-going contributions (up to 16.4% of pensionable salary, in addition to employee contributions of up to 8.5%).
NOTES TO THE FINANCIAL STATEMENTS
(ii) ESB Defined Contribution Pension Scheme
ESB also operates an approved defined contribution Scheme called ESB Defined Contribution Pension Scheme for employees of ESB subsidiary companies (other than NIE Networks) and, from 1 November 2010, new staff of the Parent. Contributions are paid by the members and the employer at fixed rates. The benefits secured at retirement reflect each employee's accumulated fund and the cost of purchasing benefits at that time. Death benefits are insured on a Group basis and may be paid in the form of a lump sum and/or survivor’s pension. The pension charge for the year represents the defined employer contribution and amounted to €15.8 million (2019: €14.1 million).
(b) FM United Kingdom Stakeholder Scheme
In addition, ESB operates a stakeholder pension scheme in the UK for all its GB employees. Contributions are paid by the members and the employer at fixed rates. The benefits secured at retirement reflect each employee's accumulated fund and the cost of purchasing benefits at that time. Death benefits are insured on a Group basis and may be paid in the form of a lump sum and / or survivor’s pension. The assets of this Scheme are held in individual stakeholder accounts managed by Legal & General Assurance Society Limited. The pension charge for the year represents the defined employer contribution and amounted to €0.8 million (2019: €1.0 million).
(c) Northern Ireland Electricity Pension Scheme
The majority of the employees in NIE Networks are members of the Northern Ireland Electricity Pension Scheme (the NIE Networks Scheme). This has two sections: 'Options', which is a money purchase arrangement whereby the employer generally matches the members' contributions up to a maximum of 8% of salary, and 'Focus' which provides benefits based on pensionable salary at retirement or earlier exit from service. Focus has been closed to new members since 1998 and therefore under the projected unit credit method the current service cost for members of this section as a percentage of salary will increase as they approach retirement age. The assets of the NIE Networks Scheme are held under trust and invested by the Trustees on the advice of professional investment managers.
UK legislation requires that pension schemes are funded prudently. The last funding valuation of the scheme was carried out by a qualified Actuary as at 31 March 2017 and showed a deficit of €154.7 million. The Company is paying deficit contributions of €19.7 million per annum (increasing in line with inflation) from 1 April 2017. The NIE Networks also pays contributions of 39.6% of pensionable salaries in respect of current accrual plus €90,000 monthly expenses (2019: 46.8% and €90,000 respectively), with active members paying a further 6% of pensionable salaries.
Profile of the Scheme
The net liability includes benefits for current employees, former employees and current pensioners. Broadly, about 18% of the liabilities are attributable to current employees, 5% to former employees and 77% to current pensioners. The Scheme duration is an indication of the weighted average time until benefit payments are made. For the NIE Networks Scheme, the duration is around 14 years (2019: 14 years) based on the last funding valuation.
Financial assumptions
The valuation of the Focus section of the NIE Networks Scheme by independent actuaries for the purpose of IAS 19 disclosures is based on the following assumptions:
% at 31 December
2020
% at 31 December
2019Rate of interest applied to discount liabilities1 1.30 2.00Price inflation (CPI in the United Kingdom) 2.30 2.10Rate of increase of pensionable salaries 3.00 2.75Rate of increase of pensions in payment 2.30 2.10
1The discount rate used in the calculation of the pension liability at 31 December 2020 was 1.30% (2019: 2.0%). This was determined by reference to market yields as at that date on high quality corporate bonds. The currency and term of the corporate bonds was consistent with the currency and estimated term of the post-employment benefit obligations.
182 ESB Annual Report 2020 - Brighter Together ESB Annual Report 2020 183

STR
ATEGY
AN
D P
ER
FOR
MA
NC
E
01
CO
RP
OR
ATE G
OV
ER
NA
NC
E
02
FINA
NC
IAL S
TATEM
EN
TS
03
NOTES TO THE FINANCIAL STATEMENTS NOTES TO THE FINANCIAL STATEMENTS
At 31 December
2020
At 31 December
2019€m €m
Equities – quoted 304.4 253.3 Bonds – quoted 276.4 369.1 Multi-asset credit investments 309.2 443.2 Diversified growth – quoted 428.0 253.2 Cash 25.0 14.4
Fair value of plan assets 1,343.0 1,333.2 Present value of funded obligations (1,459.9) (1,449.2)Net deficit (116.9) (116.0)
History of experience gains and losses At 31 December
2020
At 31 December
2019€m €m
Change in benefit obligationBenefit obligation at the beginning of the year 1,449.2 1,290.3 Movement during the year:Current service cost 6.3 6.1 Interest cost 27.4 35.7 Plan members' contributions 0.3 0.3 Actuarial loss - impact of financial assumption changes 161.7 127.9 Actuarial gain - experience loss (29.0) (3.0)Benefits paid (76.1) (77.4)Curtailment cost 0.2 0.1 Past service credit (1.5) - Translation difference on benefit obligation in the year (78.6) 69.2 Benefit obligation at the end of the year 1,459.9 1,449.2
Change in plan assetsFair value of plan assets at the beginning of the year 1,333.2 1,179.5 Movement during the year:Interest on plan assets 25.3 33.0 Actual returns on assets less interest 106.3 107.4 Employer contributions 28.7 28.6 Plan members' contributions 0.3 0.3 Actual admin expenses (incl PPF Levy) paid (2.5) (1.7)Benefits paid (76.1) (77.4)Translation difference on assets in the year (72.2) 63.5 Fair value of plan assets at the end of the year 1,343.0 1,333.2
Actual return on plan assets for the year 131.6 140.4
The Group expects to make contributions of approximately €28.5 million to Focus in 2021.
23. PENSION LIABILITIES (continued)
(c) Northern Ireland Electricity Pension Scheme (continued)
Mortality assumptionsThe assumptions relating to life expectancy at retirement for members are set out below. These assumptions are based on standard actuarial mortality tables and include an allowance for future improvements in life expectancy.
At 31 December 2020 At 31 December 2019Males Females Males FemalesYears Years Years Years
Current pensioners at aged 60 26.7 28.9 26.3 28.7 Future pensioners currently aged 40 (life expectancy age 60) 28.1 30.4 27.9 30.3
Pension assets and liabilitiesThe assets and liabilities in the Focus section of the NIE Networks Scheme are:
23. PENSION LIABILITIES (continued)
(c) Northern Ireland Electricity Pension Scheme (continued)
Analysis of the amounts recognised in the employee costs as part of the employee benefit charge were as follows:
2020€m
2019€m
Current service cost (6.3) (6.1)Curtailment cost (0.2) (0.1)Past service credit 0.9 - Actual admin expenses (incl PPF Levy) paid (1.9) (1.7)Total defined benefit charge in year (7.5) (7.9)
2020 2019Analysis of the amounts recognised in the finance costs, as net pension scheme interest: €m €mInterest on pension scheme assets 25.3 33.0 Interest on pension scheme liabilities (27.4) (35.7)Net pension scheme charge (2.1) (2.7)
Analysis of the amounts recognised in the statement of comprehensive income (excluding translation)
2020€m
2019€m
Actual returns on assets less interest 106.3 107.4 Actuarial loss (132.7) (124.9)Net actuarial loss (26.4) (17.5)
Sensitivity analysis
Reasonably possible changes at the reporting date to one of the relevant actuarial assumptions, holding other assumptions constant, would have affected the defined benefit obligation by the amounts shown below.
Impact on scheme liabilities(increase) / decrease
2020 2019Pension liability €m €mDiscount rate (0.1% increase) 21.7 19.1 Inflation rate (0.1% increase) (19.3) (17.8)Future mortality (1 year increase) (58.3) (55.3)
Although the analysis does not take account of the full distribution of cash flows expected under the plan, it does provide an approximation of the sensitivity of the assumptions shown.
184 ESB Annual Report 2020 - Brighter Together ESB Annual Report 2020 185

STR
ATEGY
AN
D P
ER
FOR
MA
NC
E
01
CO
RP
OR
ATE G
OV
ER
NA
NC
E
02
FINA
NC
IAL S
TATEM
EN
TS
03
NOTES TO THE FINANCIAL STATEMENTS NOTES TO THE FINANCIAL STATEMENTS 24. LIABILITY - ESB PENSION SCHEME AND EMPLOYEE RELATED LIABILITIES
Employee related liabilitiesLiability -
ESB pension scheme
Restructuringliabilities Other Total
GROUP €m €m €m €m
Balance at 1 January 2019 395.2 53.9 54.6 108.5
Movements during the year:Charge to the income statement - 55.2 68.1 123.3 Utilised during the year (12.1) (15.9) (65.8) (81.7)Financing charge 9.5 - - - Balance at 31 December 2019 392.6 93.2 56.9 150.1
Balance at 1 January 2020 392.6 93.2 56.9 150.1
Movements during the year:Charge to the income statement - 1.7 84.8 86.5 Utilised during the year (298.7) (22.5) (76.9) (99.4)Financing charge 12.4 - - - Translation differences - - (0.1) (0.1)Balance at 31 December 2020 106.3 72.4 64.7 137.1
Analysed as follows:Non-current liabilities 95.3 47.0 - 47.0 Current liabilities 11.0 25.4 64.7 90.1 Total 106.3 72.4 64.7 137.1
Employee related liabilitiesLiability -
ESB pension scheme
Restructuring liabilities Other Total
PARENT €m €m €m €m
Balance at 1 January 2019 395.2 53.0 44.5 97.5
Movements during the year:Charge to the income statement - 55.2 63.4 118.6 Utilised during the year (12.1) (15.2) (62.1) (77.3)Financing charge 9.5 - - - Transfer from Group company - - 5.1 5.1 Balance at 31 December 2019 392.6 93.0 50.9 143.9
Balance at 1 January 2020 392.6 93.0 50.9 143.9
Movements during the year:Charge to the income statement - 1.7 77.9 79.6 Utilised during the year (298.7) (22.4) (72.3) (94.7)Financing charge 12.4 - - - Balance at 31 December 2020 106.3 72.3 56.5 128.8
Analysed as follows:Non-current liabilities 95.3 46.9 - 46.9 Current liabilities 11.0 25.4 56.5 81.9 Total 106.3 72.3 56.5 128.8
Liability - ESB pension scheme
See note 23 (a) part (i).
Restructuring liabilities
This provision represents the estimated cost of providing post-employment payments to former employees, other than those amounts covered by the pension scheme. It includes liabilities for continuing payments to employees who left under past voluntary severance initiatives, which are expected to be materially discharged by 2035. Expected future cash flows are discounted to the present value using long-term interest rates based on zero discount curve at the reporting date plus an appropriate credit spread.
Other
In accordance with the requirements of IAS 19 Employee Benefits, provision has been made for employee remuneration liabilities, including accrued holiday leave and performance related payments.
25. TRADE AND OTHER PAYABLES GROUP PARENT2020 2019 2020 2019
€m €m €m €m
Current payables:Progress payments on work in progress 107.8 136.1 73.3 94.8 Trade payables 227.9 252.1 131.9 183.1 Capital creditors 91.4 78.9 69.7 59.0 Other payables 92.1 58.3 63.4 33.2 Payroll taxes 14.5 13.7 13.5 12.2 Pay related social insurance 6.0 5.7 5.1 4.7 Value added tax 69.1 42.6 22.2 14.7 Accruals 146.5 167.9 30.8 49.7 Amounts owed to subsidiary undertakings - - 4,279.4 4,258.0 Accrued interest on borrowings 66.1 79.3 42.7 41.8 Total 821.4 834.6 4,732.0 4,751.2
26. DEFERRED INCOME
GROUP
Supply contributions and
others €m
Deferred income€m
Total€m
Balance at 1 January 2019 1,235.3 40.8 1,276.1
Receivable 123.7 49.9 173.6 Released to the income statement (71.2) (51.5) (122.7)Translation differences 19.6 1.0 20.6 Balance at 31 December 2019 1,307.4 40.2 1,347.6
Balance at 1 January 2020 1,307.4 40.2 1,347.6
Receivable 109.6 36.3 145.9 Released to the income statement (80.9) (30.8) (111.7)Translation differences (20.1) (1.6) (21.7)Balance at 31 December 2020 1,316.0 44.1 1,360.1
Analysed as follows: Non-current liabilities 1,235.1 34.0 1,269.1 Current liabilities 80.9 10.1 91.0 Total 1,316.0 44.1 1,360.1
PARENT
Supply contributions and
others €m
Deferred income€m
Total€m
Balance at 1 January 2019 858.0 - 858.0
Receivable 98.3 - 98.3 Released to the income statement (55.0) - (55.0)Balance at 31 December 2019 901.3 - 901.3
Balance at 1 January 2020 901.3 - 901.3
Receivable 81.3 - 81.3 Released to the income statement (61.4) - (61.4)Balance at 31 December 2020 921.2 - 921.2
Analysed as follows:Non-current liabilities 862.1 - 862.1 Current liabilities 59.1 - 59.1 Total 921.2 - 921.2
186 ESB Annual Report 2020 - Brighter Together ESB Annual Report 2020 187

STR
ATEGY
AN
D P
ER
FOR
MA
NC
E
01
CO
RP
OR
ATE G
OV
ER
NA
NC
E
02
FINA
NC
IAL S
TATEM
EN
TS
03
27. PROVISIONS
Asset retirement Emissionsprovision provision Other Total
GROUP €m €m €m €m
Balance at 1 January 2019 283.2 79.3 92.3 454.8
Charged / (credited) to the income statement- Emission allowances - 105.4 - 105.4 - Legal and other - - 4.0 4.0 - Asset retirement (6.8) - - (6.8)Reduction in other provisions capitalised - - (9.7) (9.7)ESOP provision charged to equity (note 31) - - 0.3 0.3 Provision capitalised in the year (net) 10.8 - - 10.8 Utilised in the year (1.9) (70.5) (18.4) (90.8)Financing charge 2.4 - - 2.4 Translation differences 1.6 - 0.5 2.1 Balance at 31 December 2019 289.3 114.2 69.0 472.5
Balance at 1 January 2020 289.3 114.2 69.0 472.5
Charged to the income statement- Emission allowances - 125.9 - 125.9- Legal and other - - 10.6 10.6- Asset retirement 89.7 - - 89.7Legal provision recognised (see Legal Case note below) - - 94.2 94.2Provision capitalised in the year 83.9 - 23.7 107.6ESOP provision charged to equity (note 31) - - 0.9 0.9Utilised in the year (1.8) (112.8) (19.3) (133.9)Financing charge 2.1 - (0.1) 2.0Translation differences (2.1) (2.8) (0.5) (5.4)Balance at 31 December 2020 461.1 124.5 178.5 764.1
Analysed as follows:Non-current liabilities 442.0 - 155.7 597.7Current liabilities 19.1 124.5 22.8 166.4Total 461.1 124.5 178.5 764.1
Asset retirement Emissionsprovision provision Other Total
PARENT €m €m €m €m
Balance at 1 January 2019 226.1 52.9 75.5 354.5
Charged / (credited) to the income statement- Emission allowances - 47.9 - 47.9 - Legal and other - - 3.2 3.2 - Asset retirement (7.5) - - (7.5)Reduction in provisions capitalised - - (9.7) (9.7)ESOP provision charged to equity (note 31) - - 0.3 0.3 Utilised in the year (1.9) (46.2) (9.9) (58.0)Financing charge 2.1 - - 2.1 Balance at 31 December 2019 218.8 54.6 59.4 332.8
Balance at 1 January 2020 218.8 54.6 59.4 332.8
Charged to the income statement- Emission allowances - 70.0 - 70.0 - Legal and other - - 8.9 8.9 - Asset retirement provision 87.9 - - 87.9 Legal provision recognised (see Legal Case note below) - - 94.2 94.2 Provision capitalised in the year 71.6 - - 71.6 ESOP provision charged to equity (note 31) - - 0.9 0.9 Utilised in the year (1.7) (57.0) (17.4) (76.1)Financing charge 2.0 - (0.1) 1.9 Balance at 31 December 2020 378.6 67.6 145.9 592.1
Analysed as follows:Non-current liabilities 359.5 - 126.4 485.9 Current liabilities 19.1 67.6 19.5 106.2 Total 378.6 67.6 145.9 592.1
NOTES TO THE FINANCIAL STATEMENTS 27. PROVISIONS (continued)
Asset retirement provision
The Group provision at 31 December 2020 of €461.1 million (2019: €289.3 million) for asset retirement represents the present value of the current estimate of the costs arising from certain obligations in relation to the retirement and decommission of generation assets, windfarms and ESB Networks creosote treatedwood poles at the end of their useful economic lives.
The expected closure dates of generation assets and windfarms are up to 2045. Due to changes in estimates during the year ended 31 December 2020 the asset retirement provision in relation to the retirement and decommission of generating assets and windfarms increased by €44.6 million (2019: €4.0 million increase). The estimated value of future retirement costs at the balance sheet date includes physical dismantling, site remediation and associated costs. There issignificant estimation and judgement required in the calculation of the provision for generation assets, including the impact of regulation, the accuracy of the site surveys, unexpected contaminants, the impact of alternative technologies and use of appropriate changes in the discount rates.
Creosote treated wood poles in the network are expected to be disposed over a period of 60 years. Due to changes in the cost of disposing of creosote treated wood poles and changes in the Group’s assumptions of the timeframe for the disposal of poles, the asset retirement provision increased by €129 million. There is significant judgement in estimating the level of provision as operational plans and the cost of disposal may change significantly in the future as a result of environmental legislation or pole condition given the length of time over which they are held. Such changes could materially impact the level of provision required.
The Group has made its best estimate of the financial effect of these uncertainties in determining the level of provisions required, but future material changes inany of the assumptions could materially impact on the calculation of the provisions.
As the costs are provided on a discounted basis, a financing charge is included in the income statement and credited to the provision each year. The asset retirement provision is re-examined annually and the liability re-calculated in accordance with the most recent expected estimate. Expected future cash flows arediscounted to present values using an appropriate pre-tax discount rate.
Emissions provision
In accordance with the provisions of the European CO2 emissions trading scheme, a provision is recognised to cover the liability for actual emissions during the year. Allowances purchased during the year are returned to the relevant Authority in charge of the scheme within four months from the end of that calendar year, in line with the actual emissions of CO2 during the year. The provision represents the obligation to return emission allowances equal to the actual emissions. This obligation is measured at the cost of the CO2 emission allowances purchased and held as intangible assets together with the market value of any additionalallowances required to settle the year end liability.
Other
Legal case - Cork flooding
Following on from flooding in Cork in November 2009, Aviva as University College Cork’s (UCC) insurer pursued a legal action against ESB in the High Court seeking recovery of €19 million for property damage. The High Court judgement found ESB liable for the damage caused by the flood but discounted the awardto UCC by 40% to reflect UCC's contributory negligence. ESB appealed the High Court decision and the Court of Appeal held that ESB was not liable for any damage caused to UCC's property by the flood. UCC appealed this decision to the Supreme Court who delivered its decision on 8 July 2020. The Supreme Court upheld UCC’s appeal and decided, by a 4:1 majority, that ESB is liable to UCC for negligence. The Court concluded that ESB has a duty of care which required it to consider the effects of a natural flood on downstream landowners when operating its dams. The Supreme Court has remitted the evaluation of the impact of its decision on the level of ESB’s liability to UCC to the High Court for determination.
UCC appealed the decision of the High Court on contributory negligence to the Court of Appeal. The Court of Appeal decision did not address the full issue of contributory negligence but it did reverse the High Court on one element of its rationale for its finding on contributory negligence. The full issue of UCC’s contributory negligence was heard by the Supreme Court over two days in November 2020. The Supreme Court has reserved its decision and it is expected thatits judgement will be delivered in the first half of 2021.
The High Court will now determine what is the level of ESB’s liability in relation to the UCC claim. In addition to the UCC claim, since the 2009 High Courtjudgment in the UCC case, ESB has been served with 388 sets of proceedings relating to the flooding in Cork in November 2009.
Consequently, ESB has estimated the amount of damages and related costs in respect of these claims and a provision of €95 million has been recognised.There are several uncertainties in respect of the nature and quantum of claims made and consequently as further information becomes available, this could materially impact the estimate of the provision. However, ESB does not anticipate that the total amount of damages awarded and related costs for all of the actions, including the Aviva / UCC case, will exceed its insurance cover. As at 31 December 2020 an amount of €94 million has been included in other receivables in respect of the expected reimbursement under the related insurance contracts.
Other legal
Other provisions also include estimates of liabilities to third parties, in respect of claims notified or provided for at year end. The year end provision includes anestimate for liabilities incurred but not yet reported.
Other receivables also include €0.9 million insurance recoveries in respect of these claims.
Other provisions
Other provisions include an amount of €16.8 million in relation to deferred consideration for the acquisition of a 50% stake in Inch Cape Offshore Holdings Limited (ICOHL), a joint arrangement with Red Rock Power Limited (see note 15). This consideration is contingent on ICOHL achieving project milestones andspecified returns.
NOTES TO THE FINANCIAL STATEMENTS
188 ESB Annual Report 2020 - Brighter Together ESB Annual Report 2020 189

STR
ATEGY
AN
D P
ER
FOR
MA
NC
E
01
CO
RP
OR
ATE G
OV
ER
NA
NC
E
02
FINA
NC
IAL S
TATEM
EN
TS
03
28. FINANCIAL RISK MANAGEMENT AND FAIR VALUE
(a) Overview of financial risk management
Risk environment
The main financial risks faced by the Group relate to foreign exchange (particularly movements in the value of the euro relative to sterling and the US dollar) and commodity (electricity and fuel) price movements. Liquidity risk, and exposure to interest rate volatility, are key long-term financial risks also, but have been substantially addressed in the short run. Policies to protect the Group from these risks and other risk areas, such as credit risk, are regularly reviewed, revised and approved by the Board as appropriate. Group Treasury is responsible for the day-to-day treasury activities of the Group. The Finance and Investment Committee is regularly updated on key treasury matters, risk and associated mitigants.
Commodity price risk is managed by the front and middle office functions of the relevant business units: ESB Trading (within Generation and Trading) and Customer Solutions. This is done in the context of an overall Group risk management framework. These activities are reviewed regularly by Group Internal Audit. It is the responsibility of the Trading Risk Management Committees within these two business units to ensure that internal audit findings and recommendations are adequately addressed. This is overseen by the Executive Director level Group Trading Committee (GTC). The Group Trading Risk Management function ensures that the Group’s market, credit and operational risks are managed in a way designed to protect the Group from loss, while respecting the ring-fencing obligations in place between the business units.
Contracts entered into in order to hedge exposures arising from the production and sale of electricity may be divided into forward fuel price contracts, forward electricity price contracts and foreign exchange contracts. Financial instruments are derecognised on settlement or sale.
Risk reporting structure
Through the Chief Executive, the Board has delegated to the GTC, the broader responsibility of managing ESB’s trading risk in a manner consistent with the Group’s risk tolerances and business strategies. The GTC has established risk limits to manage and limit trading risk exposure at Group and business unit level. These limits are documented for each of the ESB businesses engaged in wholesale trading activities. Furthermore the Group Trading Risk Management Policy is applicable to each of these businesses.
In both Generation and Trading and Customer Solutions, separate Trading Risk Management Committees meet on a monthly basis (or more frequently as required) and serve as the primary overseer of trading risk at individual ring-fenced business unit level. These committees include the head of the Front Office function, the Trading Risk (Middle Office) Manager, a representative from Group Trading Risk Management, and the business unit Financial Controller. The Trading Risk Management Committees are responsible for formulating trading risk strategy in accordance with the Group Trading Risk Management Policy and ensuring compliance with same, trading risk limit management, and for ensuring that an effective control framework is in place.
The Middle Office function in each business unit maintains a separate reporting line to the Group Trading Risk Management function, which is responsible for ensuring that the Group’s net exposure to movements in commodity or other price movements is adequately managed in accordance with Group Trading Risk Management Policy.
Hedge accounting
ESB funds its operations using borrowings and uses deposit instruments to invest surplus funds. ESB also uses interest rate and foreign currency instruments to manage interest rate and currency risks that arise in the normal course of operations from US dollar and sterling denominated borrowings, from its foreign currency subsidiaries and from the use of foreign currency suppliers. Hedge accounting pursuant to IFRS 9 is used both for hedges of foreign currency liabilities and interest rate risks from current and non-current liabilities.
In addition, the Group enters into certain commodity hedging transactions to fix fuel costs and to link electricity revenues more closely to fuel inputs, where possible. The Group decides at inception whether to designate financial instruments into hedge relationships. Certain arrangements meet the specific hedging accounting criteria of IFRS 9.
Within its regular course of business, the Group routinely enters into sale and purchase contracts for commodities, including gas and electricity. Where the contract was entered into and continues to be held for the purposes of receipt or delivery of the commodities in accordance with the Group’s expected sale, purchase or usage requirements, the contracts are designated as own use contracts and are accounted for as executory contracts. These contracts are therefore not within the scope of IFRS 9 - Financial Instruments.
NOTES TO THE FINANCIAL STATEMENTS 28. FINANCIAL RISK MANAGEMENT AND FAIR VALUE (continued)
(b) Overview of financial assets and liabilitiesFinancial assets and liabilities, excluding employee related liabilities, at 31 December 2020 and at 31 December 2019 can be analysed as follows:
Financial assets at fair value through
profit or loss
Assets / liabilities held at amortised
cost
Derivative financial instruments with
hedging relationships
Derivative financial instruments with no
hedging relationships Total2020 2019 2020 2019 2020 2019 2020 2019 2020 2019
GROUP €m €m €m €m €m €m €m €m €m €m
ASSETSNon-current assetsAmounts due from insurers - - 94.2 - - - - - 94.2 - Trade and other receivables - - 55.1 12.4 - - - - 55.1 12.4 Financial asset investments 8.6 13.4 - - - - - - 8.6 13.4 Derivative financial instruments - - - - 0.6 37.4 7.7 28.1 8.3 65.5 Total non-current financial assets 8.6 13.4 149.3 12.4 0.6 37.4 7.7 28.1 166.2 91.3
Current assetsTrade and other receivables* - - 862.7 1,029.7 - - - - 862.7 1,029.7 Cash and cash equivalents - - 248.7 125.1 - - - - 248.7 125.1 Derivative financial instruments - - - - - 44.4 169.6 200.4 169.6 244.8 Total current financial assets - - 1,111.4 1,154.8 - 44.4 169.6 200.4 1,281.0 1,399.6
Total financial assets 8.6 13.4 1,260.7 1,167.2 0.6 81.8 177.3 228.5 1,447.2 1,490.9
LIABILITIESNon-current liabilitiesBorrowings and other debt - - 5,114.0 4,751.7 - - - - 5,114.0 4,751.7 Lease liabilities - - 107.3 112.4 - - - - 107.3 112.4 Derivative financial instruments - - - - 13.8 51.7 591.1 610.8 604.9 662.5 Total non-current financial liabilities - - 5,221.3 4,864.1 13.8 51.7 591.1 610.8 5,826.2 5,526.6
Current liabilitiesBorrowings and other debt - - 129.6 480.7 - - - - 129.6 480.7 Lease liabilities - - 17.5 19.6 - - - - 17.5 19.6 Trade and other payables** - - 731.8 772.6 - - - - 731.8 772.6 Derivative financial instruments - - - - 1.6 39.5 191.1 228.3 192.7 267.8 Total current financial liabilities - - 878.9 1,272.9 1.6 39.5 191.1 228.3 1,071.6 1,540.7 Total financial liabilities - - 6,100.2 6,137.0 15.4 91.2 782.2 839.1 6,897.8 7,067.3
* Prepayments have been excluded as they are not classified as a financial asset.** VAT and employment taxes have been excluded as these are statutory liabilities.
The Group's provisions and employee related liabilities are not analysed in the table above, or in the further analysis on the following page. This includes the liability for pension obligation of €106.3 million at 31 December 2020 (2019: €392.6 million). See notes 23 and 24 in relation to this and employee related liabilities.
NOTES TO THE FINANCIAL STATEMENTS
190 ESB Annual Report 2020 - Brighter Together ESB Annual Report 2020 191

STR
ATEGY
AN
D P
ER
FOR
MA
NC
E
01
CO
RP
OR
ATE G
OV
ER
NA
NC
E
02
FINA
NC
IAL S
TATEM
EN
TS
03
28. FINANCIAL RISK MANAGEMENT AND FAIR VALUE (continued)
(b) Overview of financial assets and liabilities (continued)
Financial assets at fair value through
profit or loss
Assets / liabilities held at amortised
cost
Derivative financial instruments with
hedging relationships
Derivative financial instruments with no
hedging relationships Total2020 2019 2020 2019 2020 2019 2020 2019 2020 2019
PARENT €m €m €m €m €m €m €m €m €m €m
ASSETSNon-current assetsAmounts due from insurersAmounts due from subsidiary undertakings
- -
- -
94.2 1,723.6
- 1,015.1
- -
--
--
--
94.21,723.6
-1,015.1
Derivative financial instruments - - - - - 4.4 10.1 23.4 10.1 27.8 Total non-current financial assets - - 1,817.8 1,015.1 - 4.4 10.1 23.4 1,827.9 1,042.9
Current assetsTrade and other receivables* - - 1,304.5 2,661.7 - - - - 1,304.5 2,661.7 Cash and cash equivalents - - 164.1 58.2 - - - - 164.1 58.2 Derivative financial instruments - - - - - 1.0 129.8 200.4 129.8 201.4 Total current financial assets - - 1,468.6 2,719.9 - 1.0 129.8 200.4 1,598.4 2,921.3
Total financial assets - - 3,286.4 3,735.0 - 5.4 139.9 223.8 3,426.3 3,964.2
LIABILITIESNon-current liabilitiesBorrowings and other debt - - 729.1 887.3 - - - - 729.1 887.3 Lease liabilities - - 55.5 58.9 - - - - 55.5 58.9 Derivative financial instruments - - - - 12.4 12.6 18.7 30.4 31.1 43.0 Total non-current financial liabilities - - 784.6 946.2 12.4 12.6 18.7 30.4 815.7 989.2
Current liabilitiesBorrowings and other debt - - 127.7 155.7 - - - - 127.7 155.7 Lease liabilities - - 11.2 12.8 - - - - 11.2 12.8 Trade and other payables** - - 4,691.2 4,719.6 - - - - 4,691.2 4,719.6 Derivative financial instruments - - - - 0.3 0.9 150.7 211.4 151.0 212.3 Total current financial liabilities - - 4,830.1 4,888.1 0.3 0.9 150.7 211.4 4,981.1 5,100.4
Total financial liabilities - - 5,614.7 5,834.3 12.7 13.5 169.4 241.8 5,796.8 6,089.6
* Prepayments have been excluded as they are not classified as a financial asset.** VAT and employment taxes have been excluded as these are statutory liabilities.
The Parent's employee related liabilities are not analysed in the table above, or in the further analysis on the following page. This includes the liability for pension obligation of €106.3 million at 31 December 2020 (2019: €392.6 million). See notes 23 and 24 in relation to this and employee related liabilities.
NOTES TO THE FINANCIAL STATEMENTS 28. FINANCIAL RISK MANAGEMENT AND FAIR VALUE (continued)
(c) Funding and liquidity management
The following table sets out the contractual maturities of financial liabilities (and assets of a similar nature), including the interest payments associated with borrowings and the undiscounted net cash flows attributable to derivative financial instruments. Borrowings with a carrying value of €4,386.8 million (2019: €4,189.4 million) and net derivative financial instrument liabilities of €577.5 million (2019: €593.9 million) are included in the Group balances below, but do not comprise part of the Parent's assets and liabilities as they are not held directly by the Parent. See notes 13, 21, 22 and 25 for further analysis of Group and Parent financial assets and liabilities.
Carrying amount
Contractual cash outflows /
inflows - net Within 1 year 1-2 years 2-5 yearsMore than 5
yearsGROUP €m €m €m €m €m €m31 December 2020
Borrowings1 5,243.6 6,294.8 268.1 203.2 1,478.8 4,344.7 Lease liabilities 124.8 134.3 14.7 11.5 27.7 80.4 Trade and other payables (excluding tax balances and accrued interest on borrowings)
665.7 665.7 665.7 - - -
Derivative financial instruments2 797.6 802.8 197.8 588.9 21.7 (5.6) Total liabilities 6,831.7 7,897.6 1,146.3 803.6 1,528.2 4,419.5
Derivative financial instruments 177.9 178.5 172.1 4.8 1.6 - Total assets 177.9 178.5 172.1 4.8 1.6 -
Net liabilities 6,653.8 7,719.1 974.2 798.8 1,526.6 4,419.5 31 December 2019
Borrowings1 5,232.4 6,369.6 643.4 270.4 1,144.4 4,311.4 Lease liabilities 132.0 138.3 15.1 10.4 25.8 87.0 Trade and other payables (excluding tax balances and accrued interest on borrowings)
693.3 693.3 693.3 - - -
Derivative financial instruments2 930.3 981.2 272.7 72.2 625.8 10.5 Total liabilities 6,988.0 8,182.4 1,624.5 353.0 1,796.0 4,408.9
Derivative financial instruments 310.3 310.3 245.5 58.7 6.0 0.1 Total assets 310.3 310.3 245.5 58.7 6.0 0.1
Net liabilities 6,677.7 7,872.1 1,379.0 294.3 1,790.0 4,408.8
1Included in contractual cash flows are amounts related to interest commitments. Accrued interest of €66.1 million (31 December 2019: €79.3 million) is not included in the carrying value of borrowings.
2A mandatory break in June 2022 on the RPI linked interest rate swap portfolio brings forward contractual cashflows which would otherwise be payable over the life of the swaps. The swaps have maturities in 2026, 2031 and 2036. At 31 December 2020, negotiations to extend the mandatory break are at an advanced stage. Certain corresponding amounts have been adjusted so that they are directly comparable with the amounts shown in respect of the current financial year.
Carrying amount
Contractual cash outflows / inflows - net
More than 5 yearsWithin 1 year 1-2 years 2-5 years
PARENT €m €m €m €m €m €m31 December 2020Borrowings1 856.8 980.1 159.3 94.4 473.8 252.6 Lease liabilities 66.7 70.6 7.1 5.7 15.2 42.6 Trade and other payables (excluding tax balances and accrued interest on borrowings)
4,648.5 4,648.5 4,648.5 - - -
Derivative financial instruments 182.1 186.0 160.2 10.3 21.2 (5.7)Total liabilities 5,754.1 5,885.2 4,975.1 110.4 510.2 289.5
Derivative financial instruments 139.9 138.9 133.9 4.2 0.8 - Total assets 139.9 138.9 133.9 4.2 0.8 -
Net liabilities 5,614.2 5,746.3 4,841.2 106.2 509.4 289.5 31 December 2019Borrowings1 1,043.0 1,235.4 197.1 168.5 538.3 331.5 Lease liabilities 71.7 80.2 11.2 6.5 15.4 47.1 Trade and other payables (excluding tax balances and accrued interest on borrowings)
4,677.8 4,677.8 4,677.8 - - -
Derivative financial instruments 255.3 253.7 216.7 18.4 8.3 10.3 Total liabilities 6,047.8 6,247.1 5,102.8 193.4 562.0 388.9
Derivative financial instruments 229.2 229.4 202.2 20.5 6.6 0.1 Total assets 229.2 229.4 202.2 20.5 6.6 0.1
Net liabilities 5,818.6 6,017.7 4,900.6 172.9 555.4 388.8 1Included in contractual cash flows are amounts related to interest commitments. Accrued interest of €42.7 million (31 December 2019: €41.8 million) is not included in the carrying value of borrowings.
NOTES TO THE FINANCIAL STATEMENTS
192 ESB Annual Report 2020 - Brighter Together ESB Annual Report 2020 193

STR
ATEGY
AN
D P
ER
FOR
MA
NC
E
01
CO
RP
OR
ATE G
OV
ER
NA
NC
E
02
FINA
NC
IAL S
TATEM
EN
TS
03
28. FINANCIAL RISK MANAGEMENT AND FAIR VALUE (continued)
(d) Master netting or similar agreements
The Group enters into derivative transactions under International Swaps and Derivatives Association (ISDA) master netting agreements. The ISDA agreements do not meet the criteria for offsetting in the consolidated balance sheet. This is because the Group does not have any current legally enforceable right to offset recognised amounts, because the right to offset is enforceable only on the occurrence of future events such as a default on the bank loans or other credit events.
The following table sets out the carrying amounts of recognised financial instruments that are subject to the above agreements.
Gross amount of financial
instruments in the statement
of financial position
Amounts not offset on the
balance sheet Net amountGROUP €m €m € m
31 December 2020Financial assetsInterest rate swaps 3.8 (3.5) 0.3 Foreign exchange contracts 4.1 (3.4) 0.7 Forward fuel price contracts 170.0 (144.1) 25.9
177.9 (151.0) 26.9
Financial liabilitiesInterest rate swaps (1.6) - (1.6)Inflation-linked interest rate swaps (592.5) - (592.5)Currency swaps (19.4) 1.8 (17.6)Foreign exchange contracts (8.1) 4.5 (3.6)Forward fuel price contracts (176.0) 144.7 (31.3)
(797.6) 151.0 (646.6)
31 December 2019Financial assetsInterest rate swaps 5.7 (5.0) 0.7 Foreign exchange contracts 25.3 (20.1) 5.2 Forward fuel price contracts 198.0 (194.0) 4.0 Forward electricity price contracts 81.3 (77.5) 3.8
310.3 (296.6) 13.7
Financial liabilitiesInterest rate swaps (1.9) 0.9 (1.0)Inflation-linked interest rate swaps (595.4) - (595.4)Currency swaps (24.9) 10.3 (14.6)Foreign exchange contracts (12.7) 12.1 (0.6)Forward fuel price contracts (295.4) 273.3 (22.1)
(930.3) 296.6 (633.7)
NOTES TO THE FINANCIAL STATEMENTS 28. FINANCIAL RISK MANAGEMENT AND FAIR VALUE (continued)
(d) Master netting or similar agreements (continued)
Gross amount of financial
instruments in the statement of financial position
Amounts not offset on the
balance sheet Net amountPARENT €m €m €m
31 December 2020Financial assetsInterest rate swaps 3.8 (3.0) 0.8 Foreign exchange contracts 6.1 (2.7) 3.4 Forward fuel price contracts 130.0 (125.1) 4.9
139.9 (130.8) 9.1
Financial liabilitiesInterest rate swaps (0.5) - (0.5)Currency swaps (19.4) 1.5 (17.9)Foreign exchange contracts (8.1) 3.8 (4.3)Forward fuel price contracts (154.1) 125.5 (28.6)
(182.1) 130.8 (51.3)
31 December 2019Financial assetsInterest rate swaps 1.1 (0.8) 0.3 Foreign exchange contracts 30.1 (20.8) 9.3 Forward fuel price contracts 198.0 (193.9) 4.1
229.2 (215.5) 13.7
Financial liabilitiesCurrency swaps (24.9) 10.6 (14.3)Foreign exchange contracts (12.5) 12.5 -Forward fuel price contracts (217.9) 192.4 (25.5)
(255.3) 215.5 (39.8)
NOTES TO THE FINANCIAL STATEMENTS
194 ESB Annual Report 2020 - Brighter Together ESB Annual Report 2020 195

STR
ATEGY
AN
D P
ER
FOR
MA
NC
E
01
CO
RP
OR
ATE G
OV
ER
NA
NC
E
02
FINA
NC
IAL S
TATEM
EN
TS
03
28. FINANCIAL RISK MANAGEMENT AND FAIR VALUE (continued)
(e) Credit risk
Credit risk arises from cash and cash equivalents, derivative financial instruments and deposits with banks and financial institutions, as well as credit exposures to wholesale and retail customers, including amounts due from equity accounted investees, amounts due from insurers under insurance arrangements, outstanding receivables and committed transactions. In Parent credit risk also arises in respect of amounts due from subsidiary undertakings.
2020 2019GROUP PARENT GROUP PARENT
Financial assets €m €m €m €mAmounts due from insurers 94.2 94.2 - - Trade and other receivables* 917.8 3,028.1 1,042.1 3,676.8 Cash and cash equivalents 248.7 164.1 125.1 58.2 Derivative financial instruments 177.9 139.9 310.3 229.2
1,438.6 3,426.3 1,477.5 3,964.2
*Prepayments have been excluded as they are not classified as a financial asset.
Trade and other receivables
Wholesale and credit risk arising from trade and other receivables has been disclosed in note 17. Trade and other receivables in Parent includeamounts due from subsidiary undertakings.
Treasury related credit risk (relating to cash and derivative instruments)
The Group is exposed to credit risk from the counterparties with whom it holds its bank accounts and transacts with in the financial markets. TheGroup's policy is to limit its exposure to each financial institution based on accepted credit ratings of not less than BBB- or equivalent.
Trading in derivatives is performed to mitigate financial risks and is executed in compliance with the Specification and Requirements of the Ministerfor Finance issued under the aegis of the Financial Transactions of Certain Companies and Other Bodies Act 1992, most recently in December 2017.The Specification and Requirements outline the type of derivatives which ESB can transact and the associated requirements which ESB must satisfyregarding each derivative counterparty. Dealing activities are controlled by putting in place robust dealing mandates with counterparties. The Groupdoes not hold or trade derivative instruments for speculative purposes. Exposures, related limits and compliance with the Minister’s Specification andRequirements are subject to ongoing review and monitoring. The Group has not experienced any losses due to failure of such counterparties to deliveron their obligations.
Financial Guarantees
The Group enters into various commitments. These consist of financial guarantees, letters of credit and other commitments.Even though these obligations may not be recognised on the Group balance sheet, credit risk exists in relation to these instruments as they commit theGroup to make payments on behalf of subsidiary companies in the event of a specific act and therefore they form part of the overall risk of the Group.
The nominal values of such commitments are listed below:
2020 2019€m €m
Financial guarantees 324.1 316.8Letters of credit 304.0 333.0Other 2.3 3.4Total 630.4 653.2
Commodity credit risk (relating to derivatives)
The Group also has credit risk associated with commodity positions. These arise from derivative financial instruments that are entered into to hedge energy and fuel price risks and are managed in accordance with the Minister's Specification and Requirements (Financial Transactions of Certain Companies and Other Bodies Act 1992). The Group establishes counterparty credit risk limits to restrict uncollateralised exposure. Net exposures, collateral requirements and compliance are monitored on an ongoing basis. Collateral, in the form of bonds and guarantees, is required by ESB business units from various parties, specifically in the form of Letters of Credit from certain power Contract for Differences (CfD) counterparties. Total such collateral received by ESB in respect of power CfD positions at 31 December 2020 was €33.6 million (2019: €42.2 million collateral received by ESB). In addition an increasing proportion of fuel commodity purchases are executed on regulated exchanges. The group's positions on trades executed on such exchanges are collateralised through the posting of initial margin and collateral in respect of the mark to market position on open forward trades. Total net collateral at 31 December 2020 received by ESB was €18.7 million (2019: €131.3 million collateral paid by ESB). The Group is cognisant of any changes in the creditworthiness of counterparties, and all appropriate steps are taken to further secure the Group's position, both by negotiating adequate protections in advance in the underpinning contractual master agreements and active management of any exposures, particularly where indications exists of a deterioration in the financial standing of counterparties.
NOTES TO THE FINANCIAL STATEMENTS 28. FINANCIAL RISK MANAGEMENT AND FAIR VALUE (continued)
(f) Foreign currency risk management
Foreign currency exposures arise mainly through the purchase of fuel and power, station overhaul costs, other purchases denominated in foreign currencies, borrowings in foreign currencies (including the private placement as described in note 21) and investments outside the Eurozone.
Foreign currency forward purchase contracts and cross currency swaps are used to reduce volatility arising from foreign currency exposures. The foreign currency forward purchase contracts in place at 31 December 2020 relate to forecast cash flows expected to occur up to 2028.
At year end, ESB's total debt portfolio amounted to €5.2 billion (2019: €5.2 billion), of which the Parent held €0.9 billion (2019: €1.0 billion). The underlying debt, before and after swaps, was denominated in the following currencies:
Before swaps After swaps2020 2019 2020 2019
GROUP (%) (%) (%) (%)
CurrencyEuro 70 69 66 72 US dollar 4 4 - - Sterling 26 27 34 28 Total 100 100 100 100
Before swaps After swaps2020 2019 2020 2019
PARENT (%) (%) (%) (%)
CurrencyEuro 54 58 80 66 US dollar 26 22 - - Sterling 20 20 20 34 Total 100 100 100 100
As shown above, the majority of the debt portfolio is either denominated in or swapped into euro for both principal and interest, thereby reducing the foreign currency risk exposure in the Group. In managing its foreign operations, the Group is cognisant of borrowing in currencies that match the functional currency of the foreign operation. Therefore a proportion of debt is sterling-denominated primarily as a result of the NIE Networks acquisition and the operations of Carrington Power Limited.
Movements in the Euro / Sterling exchange rate impact on the carrying value of Sterling Debt, in Euro terms. Overall sensitivity to exchange rate volatility is driven by the level of Sterling denominated debt. This sensitivity exists whether or not the debt is held in a Group company whose functional currency is Sterling. Whether the movement is recognised in the OCI or profit or loss however depends on the functional currency of the company. Translation movements arising on Sterling denominated debt and intra Group balances loans in Group companies whose functional currency is Euro entities are recognised in profit or loss. Translation movements on Sterling denominated debt in Group companies whose functional currency is Sterling are recognised in the translation reserve on consolidation.
A change of 10% in foreign currency exchange rates at 31 December 2020 would increase equity and profit before taxation by the amount set out below. This analysis assumes that all other variables remain constant.
31 December 2020 31 December 2019Other
comprehensive income
gain / (loss)
Profit before taxation
gain / (loss)
Other comprehensive
income gain / (loss)
Profit before taxation
gain / (loss)GROUP €m €m €m €m
10% strengtheningUS dollar - (0.6) 0.5 1.3 Sterling 128.3 (0.2) 154.1 15.9
10% weakeningUS dollar - 1.8 0.6 (1.6)Sterling (156.8) 9.9 (188.3) (19.5)
The following assumptions were made in respect of the sensitivity analysis above:• changes in the carrying value of derivative financial instruments not in hedging relationships affect the income statement only;• changes in the carrying value of derivative financial instruments that are cash flow hedges impact other comprehensive income only.
NOTES TO THE FINANCIAL STATEMENTS
196 ESB Annual Report 2020 - Brighter Together ESB Annual Report 2020 197

STR
ATEGY
AN
D P
ER
FOR
MA
NC
E
01
CO
RP
OR
ATE G
OV
ER
NA
NC
E
02
FINA
NC
IAL S
TATEM
EN
TS
03
28. FINANCIAL RISK MANAGEMENT AND FAIR VALUE (continued)
(g) Commodity price risk management
The volatility of the fuel prices required for the Group's electricity generation activities has been significant in recent years and the resulting exposures to fuel price movements are managed by the Group on a selective hedging basis. The Group has entered into forward commodity price contracts in relation to the purchase of gas and coal required for electricity generation activities, refer to note 22 for further details. Forward fuel price contracts are valued based on physical volumes contracted and outstanding, and on the forward prices of products of a similar nature, at the balance sheet date, discounted where necessary based on an appropriate forward interest curve.
Within its regular course of business, the Group routinely enters into sale and purchase contracts for commodities, including gas and electricity. Where the contract was entered into and continues to be held for the purposes of receipt or delivery of the commodities in accordance with the Group’s expected sale, purchase or usage requirements, the contracts are designated as own use contracts and are accounted for as executory contracts.
A general increase of 10% in the price of gas and coal at 31 December 2020 would impact equity and profit before taxation by the amount set out below. This analysis assumes that all other variables, in particular foreign exchange rates remain constant and includes the impact of the value of commodity swaps in place. A 10% reduction would have an equal and opposite effect, on the basis that all other variables remain constant.
31 December 2020 31 December 2019Other
comprehensive income
gain
Profit before
taxation (loss)
Other comprehensive
incomegain
Profit before
taxation (loss)
GROUP €m €m €m €m
Gain / (loss) due to 10% increase in gas and coal prices 4.3 (2.8) 8.3 (2.0)
31 December 2020 31 December 2019Other
comprehensive income
gain / (loss)
Profit before
taxation (loss)
Other comprehensive
incomegain
Profit before
taxation (loss)
PARENT €m €m €m €m
Gain / (loss) due to 10% increase in gas and coal prices - (12.0) 0.1 (2.0)
A general increase of 10% in the wholesale electricity price of the I-SEM at 31 December 2020 would impact other comprehensive income and profit before taxation by the amounts set out below. This analysis assumes that all other variables, in particular foreign exchange rates remain constant. A 10% reduction would have an equal and opposite effect, on the basis that all other variables remained constant.
31 December 2020 31 December 2019Other
comprehensive income
(loss)
Profit before
taxation gain / (loss)
Other comprehensive
income(loss)
Profit before
taxation gain / (loss)
GROUP €m €m €m €m
Loss due to 10% increase in the Wholesale Electricity Price (9.6) - (16.8) -
31 December 2020 31 December 2019Other
comprehensive income
gain / (loss)
Profit before
taxation gain / (loss)
Other comprehensive
incomegain / (loss)
Profit before
taxation gain / (loss)
PARENT €m € m €m €m
Gain / (loss) due to 10% increase in the Wholesale Electricity Price - - - -
The sensitivity analysis provided above for the Group and Parent has been calculated as at 31 December 2020 using the following base commodity prices and foreign currency rates:
2020 2019Gas (Stg. p/therm) 35.28 39.70Wholesale Electricity Price (€/MWh) 50.21 51.41Coal (US$/tonne) 68.68 56.50Foreign currency rate (US$ = €1) 1.23 1.12Foreign currency rate (Stg£ = €1) 0.8981 0.8508
NOTES TO THE FINANCIAL STATEMENTS 28 . FINANCIAL RISK MANAGEMENT AND FAIR VALUE (continued)
(h) Fair value
The fair values of financial assets and liabilities carried at amortised cost together with the carrying amounts shown in the balance sheet are as follows:
GROUP PARENTCarrying value
€m Fair value
€m Carrying value
€m Fair value
€m
31 December 2020Long-term debt1 5,114.0 5,983.9 729.1 913.5 Short-term borrowings 129.6 140.9 127.7 138.6 Lease liabilities 124.8 124.8 66.7 66.7 Total borrowings 5,368.4 6,249.6 923.5 1,118.8
Current trade and other payables 731.8 731.8 4,691.2 4,691.2 Amounts due from insurers (94.2) (94.2) (94.2) (94.2)Non-current trade and other receivables (55.1) (55.1) (1,723.6) (1,723.6)
Current trade and other receivables (862.7) (862.7) (1,304.5) (1,304.5)Cash and cash equivalents (248.7) (248.7) (164.1) (164.1)Net liabilities 4,839.5 5,720.7 2,328.3 2,523.6
GROUP PARENTCarrying value
€mFair value
€m Carrying value
€m Fair value
€m
31 December 2019Long-term debt 4,751.7 5,351.6 887.3 975.5 Short-term borrowings 480.7 505.6 155.7 177.2 Lease liabilities 132.0 132.0 71.7 71.7 Total borrowings 5,364.4 5,989.2 1,114.7 1,224.4
Current trade and other payables 772.6 772.6 4,719.6 4,719.6 Non-current trade and other receivables (12.4) (12.4) (1,015.1) (1,015.1)Current trade and other receivables (1,029.7) (1,029.7) (2,661.7) (2,661.7)Cash and cash equivalents (125.1) (125.1) (58.2) (58.2)Net liabilities 4,969.8 5,594.6 2,099.3 2,209.0
1Cross currency swaps that swap fixed US dollar debt to euro fixed are included in fair value of long-term debt above, the fair value of the related derivative is a liability of €14.8 million (31 December 2019: €4.6 million).
Current trade and other receivables and trade and other payables are all due within one year, and have been provided for where impaired, their carrying value is considered to be materially in line with their fair value.
ESB Eurobonds and NIE Networks Sterling bonds are regarded as Level 1 fair values. The fair value of these bonds are derived from observation of the most recent traded values for these bonds in liquid markets at the balance sheet date. Other borrowings and debt are Level 2 fair values. The primary valuation technique used for borrowings and other debt classified as Level 2 fair values is discounting of the future associated cash flows using the zero coupon discount curve of the relevant currency.
Fair value - discount rates
The interest rates used to discount future estimated cash flows, where applicable, are based on the applicable EURIBOR or LIBOR yield curve at the reporting date plus an appropriate constant credit spread.
NOTES TO THE FINANCIAL STATEMENTS
198 ESB Annual Report 2020 - Brighter Together ESB Annual Report 2020 199

STR
ATEGY
AN
D P
ER
FOR
MA
NC
E
01
CO
RP
OR
ATE G
OV
ER
NA
NC
E
02
FINA
NC
IAL S
TATEM
EN
TS
03
28. FINANCIAL RISK MANAGEMENT AND FAIR VALUE (continued)
(i) Fair value hierarchyThe table below analyses financial assets and liabilities carried at fair value, by valuation method. The different levels relevant to financial assets and liabilities held by the Group have been defined as follows: • Level 2: inputs, other than unadjusted quoted prices in active markets for identical assets and liabilities, that are observable for the asset or liability,
either directly (i.e. as prices) or indirectly (i.e. derived from prices); • Level 3: inputs for the asset or liability that are not based on observable market data (unobservable inputs).
GROUPLevel 2
€mLevel 3
€mTotal
€m
31 December 2020ASSETSDerivative financial instruments - Interest rate swaps 3.8 - 3.8 - Foreign exchange contracts 4.1 - 4.1
- Forward fuel price contracts1 170.0 - 170.0 Financial assets at fair value through profit or loss - 8.6 8.6
177.9 8.6 186.5
LIABILITIESDerivative financial instruments - Interest rate swaps (1.6) - (1.6) - Currency swaps (19.4) - (19.4) - Foreign exchange contracts (8.1) - (8.1) - Forward fuel price contracts1 (173.1) (2.9) (176.0) - Inflation-linked interest rate swaps (592.5) - (592.5)
(794.7) (2.9) (797.6)
Net (liability) / asset (616.8) 5.7 (611.1)
Level 2 Level 3 Total€m €m €m
31 December 2019 ASSETSDerivative financial instruments - Interest rate swaps 5.7 - 5.7 - Foreign exchange contracts 25.3 - 25.3 - Forward fuel price contracts 198.0 - 198.0 - Forward electricity price contracts - 81.3 81.3 Financial assets at fair value through profit or loss - 13.4 13.4
229.0 94.7 323.7
LIABILITIESDerivative financial instruments - Interest rate swaps (1.9) - (1.9) - Currency swaps (24.9) - (24.9) - Foreign exchange contracts (12.7) - (12.7) - Forward fuel price contracts (217.9) (77.5) (295.4) - Inflation-linked interest rate swaps (595.4) - (595.4)
(852.8) (77.5) (930.3)
Net (liability) / asset (623.8) 17.2 (606.6)
1 Contracts that link the forward electricity price more closely with forward fuel prices are presented net in forward fuel at 31 December 2020.
When interpreting the positive and negative fair values of derivative financial instruments, it should be noted that they are matched with underlying offsetting risks. The fair value of derivative financial instruments is determined by discounting the difference between the contractual forward price and the current forward price for the residual maturity of the contract using a risk-free interest rate.
NOTES TO THE FINANCIAL STATEMENTS 28. FINANCIAL RISK MANAGEMENT AND FAIR VALUE (continued)
(i) Fair value hierarchy (continued)
Level 2 Level 3 TotalPARENT €m €m €m
31 December 2020ASSETSDerivative financial instruments - Interest rate swaps 3.8 - 3.8 - Foreign exchange contracts 6.1 - 6.1 - Forward fuel price contracts 130.0 - 130.0
139.9 - 139.9
LIABILITIESDerivative financial instruments - Interest rate swaps (0.5) - (0.5) - Currency swaps (19.4) - (19.4) - Foreign exchange contracts (8.1) - (8.1) - Forward fuel price contracts (154.1) - (154.1)
(182.1) - (182.1)
Net liability (42.2) - (42.2)
Level 2 Level 3 Total€m €m €m
31 December 2019ASSETSDerivative financial instruments - Interest rate swaps 1.1 - 1.1 - Foreign exchange contracts 30.1 - 30.1 - Forward fuel price contracts 198.0 - 198.0
229.2 - 229.2
LIABILITIESDerivative financial instruments - Currency swaps (24.9) - (24.9) - Foreign exchange contracts (12.5) - (12.5) - Forward fuel price contracts (217.9) - (217.9)
(255.3) - (255.3)
Net liability (26.1) - (26.1)
NOTES TO THE FINANCIAL STATEMENTS
200 ESB Annual Report 2020 - Brighter Together ESB Annual Report 2020 201

STR
ATEGY
AN
D P
ER
FOR
MA
NC
E
01
CO
RP
OR
ATE G
OV
ER
NA
NC
E
02
FINA
NC
IAL S
TATEM
EN
TS
03
28. FINANCIAL RISK MANAGEMENT AND FAIR VALUE (continued)
(i) Fair value hierarchy (continued)
Measurement of fair values - valuation techniques and significant unobservable inputsThe following table shows the valuation technique used in measuring Level 2 and Level 3 fair values, as well as the significant unobservable inputs used.
Type Valuation techniques
Significant unobservable inputs
Inter relationship between significant unobservable inputs and fair value measurement
Currency swaps, foreign exchange contracts and interest rate swaps
Level 2 - Present valuation of future cashflows contracted using market observable inputs and discounted back to present value.
Forward fuel and electricity price contracts
Level 2 - The fair value of forward fuel contracts is determined by reference to gas, coal and carbon prices with the resulting value discounted to present values.
Level 3 - The fair value of some specific forward fuel and electricity contracts are determined by reference to forward electricity prices which are unobservable.
Forward electricity prices
The estimated fair value would increase / (decrease) if Wholesale Electricity Price was higher / (lower). Generally a change in gas prices is accompanied by a directionally similar change in Wholesale Electricity Price.
Inflation-linked interest rate swaps
Level 2 - Independent valuations are used and validated using the present valuation of expected cash flows using the interest rate yield curve of the relevant currency. The zero-coupon curve is based on using the interest rate yield curve of the relevant currency.
Financial assets at fair value through profit or loss
Financial assets at fair value through profit or loss are carried at fair value. Where applicable, valuations are based on the most recent information available at the period end, taking into account any other known and relevant factors.
Unquoted investments are valued by deriving an enterprise value using one of the following methodologies:• the price of a recent investment;• revenue multiple;• cost, less any required provision;• realised value.
Forecast annual revenue growth rate. Forecast gross margin
Novusmodus typically assess the value ofinvestments based on its expectations of the proceeds which could be realised in a disposal. See note 6 and 15.
This value will usually be driven by a number of inputs including the ability of the investee to grow its revenue and associated margins leading to higher EBITDA thus higher values.
NOTES TO THE FINANCIAL STATEMENTS 28. FINANCIAL RISK MANAGEMENT AND FAIR VALUE (continued)
(i) Fair value hierarchy (continued)
The following table shows a reconciliation from opening balances at 1 January 2019 to the year ended 31 December 2020 for fair value measurements in Level 3 of the fair value hierarchy:
Financial assets at fair value
through profit or loss
€m
Forward electricity price
contracts1
€m
Forward fuel price contracts
€m
GROUPTotal
€m
Balance at 1 January 2019 10.5 82.8 (44.3) 49.0
Additions 2.9 30.5 (26.1) 7.3 Total gains / (losses): - in OCI - (13.5) 9.7 (3.8)Settlements - (18.5) (16.8) (35.3)Balance 31 December 2019 - net 13.4 81.3 (77.5) 17.2
Balance 1 January 2020 13.4 81.3 (77.5) 17.2 Transfer to Forward Fuel Price contracts - (81.3) 81.3 - Additions 1.4 - (0.3) 1.1 Disposal of investments (12.8) - - (12.8)Total gains / (losses): - in profit or loss 6.4 - - 6.4 - in OCI - - (17.2) (17.2)Settlements - - 10.8 10.8 Translation movements 0.2 - - 0.2 Balance 31 December 2020 - net 8.6 - (2.9) 5.7
1Contracts that link the forward electricity price more closely with forward fuel prices are presented net in forward fuel at 31 December 2020.
Financial assets at fair value through profit or loss are carried at fair value. Where applicable, valuations are based on the most recent independent information available at year end, taking into account any other known and relevant factors.
Unquoted investments are valued by deriving an enterprise value using one of the following methodologies:• the price of a recent investment;• revenue multiple;• cost, less any required provision;• realised value.
As this requires the use of model based valuation techniques, with a number of unobservable inputs, all financial assets at fair value through profit or loss have been categorised as Level 3 investments in the current year.
Forward fuel price contracts and forward electricity price contracts included at Level 3 in the fair value hierarchy relate to long-term contracts whose valuations are based on a number of forward price assumptions, with some unobservable inputs, including assumed forward electricity, carbon and gas inputs for longer term periods.
Sensitivity analysis - Level 3 fair values For the fair values of forward fuel and electricity price contracts reasonably possible changes at the reporting date to one of the significant unobservable inputs, holding other inputs constant, would have the following effects:
31 December 2020 31 December 2019Other
comprehensive income
gain / (loss)€m
Profit before
taxationgain / (loss)
€m
Other comprehensive
income gain / (loss)
€m
Profit before taxation
gain / (loss)€m GROUP
Gain due to 10% increase in gas prices 4.3 - 8.3 - Loss due to 10% increase in the Wholesale Electricity Prices (9.6) - (16.8) -
NOTES TO THE FINANCIAL STATEMENTS
202 ESB Annual Report 2020 - Brighter Together ESB Annual Report 2020 203

STR
ATEGY
AN
D P
ER
FOR
MA
NC
E
01
CO
RP
OR
ATE G
OV
ER
NA
NC
E
02
FINA
NC
IAL S
TATEM
EN
TS
03
29. COMMITMENTS AND CONTINGENCIES
(a) Capital commitments 2020
€m2019
€m Tangible assets contracted for 443.4 306.3 Intangible assets contracted for 14.0 12.4 Total contracted for 457.4 318.7
2020€m
2019€mShare of equity accounted investees commitments
Contracted for 355.4 397.6
(b) Fuel contract commitments
There are a number of long-term gas supply arrangements in place for different periods up to 2024. These arrangements provide for pricing changes in line with changes in inbuilt energy market indicators. Where appropriate, embedded derivatives have been separated and valued in accordance with IFRS 9.
(c) Other disclosures
A number of other lawsuits, claims and disputes with third parties have arisen in the normal course of business. While any litigation or dispute has an element of uncertainty, the Board members believe that there were no contingent liabilities which would have a materially adverse effect on the Group's financial position.
NOTES TO THE FINANCIAL STATEMENTS
30. RELATED PARTY TRANSACTIONS
Ultimate controlling party
The Group is a state-owned company. 86.0% of the issued share capital is held by the Minister for Finance (whose shares now stand transferred to the Minister for Public Expenditure and Reform), a further 10.1% of the issued share capital is held by the Minister for Environment, Climate and Communications and the ESOP retaining 3.9% of the stock (see note 19 for further details).
Related party disclosures
In accordance with Paragraph 25 of IAS 24, ESB Group is exempt from disclosing related party transactions with another entity that is a related party solely because the Irish Government has control, joint control or significant influence over both the Group and that entity.
Semi-state bodies
In the ordinary course of business, the Group purchased / sold goods and services from entities controlled by the Irish Government such as Ervia, Bord na Móna, EirGrid and Coillte Teoranta.
The Group operates a long-term agreement with Bord na Móna in relation to the purchase of peat and the utilisation of ancillary services for the running of power stations. Receipt of these services in the year ended 31 December 2020 amounted to €15.9 million (2019: €60.9 million) and amounts due to these entities at 31 December 2020 amounted to €0.6 million (2019: €nil). The peat stations closed at the end of 2020.
An infrastructure agreement is in place between the Group and EirGrid Plc under the auspices of the Commission for Regulation of Utilities (CRU), in relation to the role of owner of the transmission system.
Banks owned by the Irish State
In the normal course of business ESB transacts with certain Irish banks which have become wholly or partially controlled by the Irish Government. All of ESB's transactions with such banks are on normal commercial terms. ESB had no material concentration of borrowings with any such banks during the period or at 31 December 2020. A portion of the cash and cash equivalents as disclosed in note 18 was on deposit with such banks.
NOTES TO THE FINANCIAL STATEMENTS 30. RELATED PARTY TRANSACTIONS (continued)
Board members' interests
Other than agreed allocations under ESOP, Board members had no beneficial interest in ESB or its subsidiaries at any time during the year.
ESOP
During the year ended 31 December 2020, ESB paid fees of €0.5 million (2019: €0.1 million) on behalf of ESOP. Please refer to note 31 for details of ESOP repurchase.
Pensions
The Group operates a number of pension schemes for staff in the Republic of Ireland, Northern Ireland and the United Kingdom. See note 9 and note 23 for further details.
Subsidiary undertakings
During the year ended 31 December 2020, ESB Parent purchased gas, engineering, consulting and other services, including rental services of €323.8 million (2019: €113.3 million) from its subsidiaries.
During the year, ESB Parent had sales of €341.2 million (2019: €350.3 million) to subsidiaries. These sales mainly relate to management services, as well as electricity charges including Use of System Charges and sales of electricity and gas.
During the year, ESB Parent earned interest of €56.1 million (2019: €55.5 million) from subsidiaries and paid interest of €62.9 million (2019: €68.4 million) to subsidiaries on inter-company loans.
At 31 December 2020, ESB Parent had gross amounts payable of €4,279.4 million (2019: €4,258.0 million) to its subsidiaries. These payables mainly relate to amounts held on deposit for subsidiaries and other amounts due to subsidiaries, borrowings raised by ESB Finance DAC and loaned to ESB Parent and amounts due in respect of engineering and consulting services.
At 31 December 2020, ESB Parent had balances receivable of €2,619.2 million (2019: €3,065.3 million) from its subsidiaries (net of provisions). These receivables mainly relate to management services and loans to subsidiaries as well as electricity charges including Use of System Charges. The total impairment provision in respect of amounts owed by subsidiary undertakings at 31 December 2020 was €59.5 million (2019: €396.5 million).
Equity accounted investees
Sale of goods / services1
Purchase of goods / services
Amounts owed (to) / from as at 31
December2&3
Equity advanced / (repayments) during
the year2020 2019 2020 2019 2020 2019 2020 2019
GROUP €m €m €m €m €m €m €m €m
Inch Cape Offshore Holdings Limited4 - - - - 45.4 - 0.9 - NNG Wind Farm Holdings Limited - - - - - - 1.0 242.7 Aldeburgh Offshore Wind Holdings Limited - - - - - - (4.8) - SIRO Limited5 9.9 9.4 - - 96.6 106.0 - - Tilbury Green Power Holdings Limited6 1.2 1.2 47.8 23.4 3.2 - - - Raheenleagh Power DAC 0.6 0.4 9.8 9.3 (1.9) 0.2 - - Oweninny Power DAC 2.2 2.6 - - 14.0 17.5 - - Emerald Bridge Fibres DAC 0.2 0.2 - - 0.2 - - 0.2 Kingspan ESB DAC - - - - 0.1 0.1 - - Total 14.1 13.8 57.6 32.7 157.6 123.8 (2.9) 242.9
1ESB provided electricity sales, management and other professional services during the year to equity accounted investees as set out in the above table.
2Amounts owed (to) / from equity accounted investees include shareholders loans (shown net of any impairments), interest on these loans and trade receivable and payable balances of €1.7 million (2019: €1.4 million). Interest receivable on loans to equity accounted investees relates to Oweninny Power DAC €1.7 million (2019: €1.4 million). For further details on the impairment charges in relation to Tilbury Green Power Holdings Ltd and Emerald Bridge Fibres DAC see note 15.
3Included in the bad debt provision is €52.9 million in respect of balances owed from Tilbury Green Power Holdings Limited, €0.8m in respect of balances owed from SIRO Limited and €0.2 million in respect of the balances owed from Emerald Bridge Fibres DAC.
4In addition to the equity advanced to Inch Cape Offshore Holdings Limited during the year ESB recognised contingent consideration of €16.8 million which is contingent upon achieving project milestones and specified returns (see note 15 and 17).
5ESB committed to provide capital funding to SIRO Ltd of €93.0 million, of which €93.0 million has been advanced as a short-term shareholder loan as disclosed above. ESB has guaranteed 50% of the drawings on a €230.0 million loan facility of SIRO, the amount drawn down as at 31 December 2020 is €182.0 million (2019: €123.0 million). Fees payable by SIRO to ESB in respect of this guarantee amounted to €3.1 million (2019: €1.3 million).
6Included in purchase of goods / services from Tilbury Green Power Holdings Ltd is €9.4 million for the purchase of development rights to Thameside Energy Recovery Ltd.
Terms and conditions Sales to and purchases from equity accounted investees and associates are conducted in the ordinary course of business. The outstanding balances included in receivables and payables as at the balance sheet date in respect of transactions with equity accounted investees and associates are unsecured and settlement arises in cash. No guarantees have been either requested or provided in relation to related party receivables and payables.
204 ESB Annual Report 2020 - Brighter Together ESB Annual Report 2020 205

STR
ATEGY
AN
D P
ER
FOR
MA
NC
E
01
CO
RP
OR
ATE G
OV
ER
NA
NC
E
02
FINA
NC
IAL S
TATEM
EN
TS
03
30. RELATED PARTY TRANSACTIONS (continued)
Key management compensation 2020 2019€m €m
Salaries and other short-term employee benefits 3.6 3.7 Post-employment benefits 0.4 0.4
4.0 4.1
The key management compensation amounts disclosed above represent compensation to those people having the authority and responsibility for planning, directing and controlling the activities of the Group. These include the remuneration of senior executives and board members. The details of Board members remuneration do not include amounts paid to four Worker Board members as employees of ESB (as such pay is neither increased nor decreased because of their membership of the Board), but do include amounts paid to them by way of Board fees.
31. ESB ESOP TRUSTEE LIMITED
ESB ESOP Trustee Limited was incorporated by ESB during 2001, with a €1 investment, as Trustee to the ESB Employee Ownership Trust (ESOT) and the ESB Approved Profit Sharing Scheme (APSS). Under the terms of the creation of ESB ESOP Trustee Limited, ESB has no ability or rights to exert control over the assets or management of the Company. The Trustee Company is chaired by an independent professional Trustee with four directors representing ESB employees and two directors representing ESB. As such, severe restrictions which substantially hinder the exercise of the rights of ESB over the assets and management of the company exist. In accordance with IFRS 10 Consolidated Financial Statements, the financial statements for ESB ESOP Trustee Limited are not consolidated with the results of the ESB Group.
During the year ended 31 December 2015, ESB entered into an agreement to support the acquisition of capital stock in future ESOP internal markets. As part of the agreement ESB committed to match the acquisitions made by the ESOP Trustees up to a value of €25.0 million. An ESOP provision of €0.9 million (2019: €0.3 million) was recognised in the 2020 financial statements in relation to the capital stock repurchase by the ESOP Trustee.
During 2020, ESB continued the repurchase of the ESOP capital stock and consequently a capital redemption reserve of €8.7 million (2019: €4.4 million)arose from the purchase and cancellation of the €8.7 million ESOP share capital (2019: €4.4 million) for a consideration of €8.4 million (2019: €4.6 million)and represents the nominal amount of the share capital cancelled.
The repurchase reduced the ESOP repurchase provision by €8.4 million (2019: €4.6 million) and at 31 December 2020 the ESOP repurchase provision(note 27) recognised in other provisions amounts to €nil (2019: €7.5 million).
32. POST BALANCE SHEET EVENTS
Details of dividend declared since the year end are set out in note 19.
There are no other post balance sheet events that the directors believe require adjustment to or disclosure in the financial statements.
33. APPROVAL OF FINANCIAL STATEMENTS
The Board approved the financial statements on 26 February 2021.
NOTES TO THE FINANCIAL STATEMENTS NOTES TO THE FINANCIAL STATEMENTS 34. SUBSIDIARY, EQUITY ACCOUNTED INVESTEES AND ASSOCIATE UNDERTAKINGS
Company nameRegistered
officeGroup
share % Nature of business
Subsidiary undertakings
Direct subsidiary
Electric Ireland Ltd. (UK) 4 100 Dormant
ESB Energy International Ltd. 2 100 Holding company
ESB Electric Ireland Ltd. (UK) 4 100 Dormant
ESB Finance DAC. 2 100 Finance
ESB Financial Enterprises Ltd. 2 100 Holding company
ESB International Investments Ltd. 2 100 Holding company
ESB International Ltd. 2 100 Holding company
ESB Networks DAC. 8 100 Power distribution
ESBNI Ltd. 5 100 Holding company
Indirect subsidiary
Airstream Wind Energy Ltd. 2 100 Development and construction of a wind farm
Airvolution Energy (Car Ban Wind Farm) Ltd. 7 100 Dormant
Airvolution Energy (Shotts 2) Ltd. 7 100 Dormant
Airvolution Energy (Tarvie) Ltd. 7 100 Dormant
Airvolution Energy Ltd. (UK) 7 100 Power generation
Blarghour Wind Farm Ltd. 9 8 Power generation
Bullstown Solar Ltd 2 100 Business development
Cambrian Renewable Energy Ltd. 4 100 Power generation
Capital Pensions Management Ltd. 6 100 Pension scheme administration
Cappawhite Wind Ltd. 2 100 Power generation
Carrington Power Ltd. 4 100 Power generation
Castlepook Power DAC. 2 100 Power generation
Chirmorie Wind Farm Ltd. 9 8 Power generation
Clogherhead Offshore Wind DAC. 2 100 Dormant
Coolkeeragh ESB Ltd. 5 100 Power generation
Corby Power Ltd. 3 100 Power generation
Corvoderry Wind Farm Ltd. 2 100 Development and construction of a wind farm
Crockagarran Windfarm Ltd. 5 100 Power generation
Crockahenny Wind Farm DAC. 2 75 Power generation
Crockdun Windfarm (NI) Ltd. 5 100 Dormant
Curryfree Wind Farm Ltd. 5 100 Power generation
Dell Wind Farm Ltd. 9 8 Power generation
Devon Wind Power Ltd. 4 100 Power generation
EC02 Cambrian Ltd. 4 100 Dormant
ESB 1927 Ltd. 2 100 Dormant
ESB Asset Development (UK) Ltd. 4 100 Business development
ESB Commercial Properties Ltd. 2 100 Property management and development
ESB Energy Ltd. 4 100 Supply company
ESB Electric Ireland Ltd. 2 100 Dormant
ESB Group (UK) Ltd. 4 100 Engineering and consultancy
ESB Independent Energy (NI) Ltd. 2 100 Electricity and gas sales
ESB Independent Energy Ltd. 2 100 Electricity and gas sales
ESB Independent Generation Trading Ltd. 2 100 Electricity and gas trading
ESB Innovation UK Ltd. 4 100 Provision of energy and electromobility services
206 ESB Annual Report 2020 - Brighter Together ESB Annual Report 2020 207

STR
ATEGY
AN
D P
ER
FOR
MA
NC
E
01
CO
RP
OR
ATE G
OV
ER
NA
NC
E
02
FINA
NC
IAL S
TATEM
EN
TS
03
NOTES TO THE FINANCIAL STATEMENTS
ESB Innovation ROI Ltd. 2 100 Provision of energy and electromobility services
ESB International (Malaysia) Sdn. Bhd 17 100 Dormant
ESB Novus Modus GP Ltd. 2 100 Clean technology investment
ESB Power Generation Holding Company Ltd. 2 100 Holding company
ESB Solar (Ireland) Ltd. 2 100 Business and management consultancy activities
ESB Solar (NI) Ltd. 5 100 Business and management consultancy activities
ESB Telecoms Ltd. 2 100 Telecommunications
ESB Trading Ltd. 2 100 Management and operation services
ESB Wind Development Ltd. 2 100 Business development
ESBI Carbon Solutions Ltd. 2 100 Dormant
ESBI Computing Ltd. 2 100 Dormant
ESBI Consultants Ltd. 1 100 Dormant
ESBI Contracting Ltd. 2 100 Dormant
ESBI Engineering & Facility Management (Liberia) Ltd. 30 100 Engineering and consultancy
ESBI Engineering and Facility Management Ltd. 1 100 Engineering
ESBII UK Ltd. 4 100 Holding company
ESBI Luxembourg S.A. 26 100 Electricity generating assets investment
Facility Management UK Ltd. 4 100 Facility management
Fitzwilliam Street Lower Management Limited 2 100 Property Management
Garravagh Solar Farm Ltd 2 100 Business development
Garvagh Glebe Power Ltd. 2 100 Power generation
Garvary Wind Farm Ltd. 9 8 Power generation
Geothermal International Ltd. 10 92.6 Heat and air conditioning installation
Geothermal International Polska Sp Zoo (Spolka Z Organiczona Odpowiedzialnoscia).
25 89 Dormant
Glendye Wind Farm Ltd. 9 8 Power generation
Gort Windfarms Ltd. 2 100 Power generation
Greengate Energy Recovery Ltd. 4 100 Dormant
Greystone Knowe Wind Farm Ltd. 9 8 Power generation
Harmony Solar Dennistown Ltd. 33 70 Business development
Harmony Solar Kildare Ltd. 33 70 Business development
Harmony Solar Ralphtown Ltd. 33 60 Business development
Harmony Solar Mullingar Ltd. 33 60 Business development
Harmony Solar Smithstown Ltd. 33 60 Business development
Harmony Solar Longford Ltd. 33 60 Business development
Harmony Solar Mayglass Ltd. 33 60 Business development
Harmony Solar Knockanoura Ltd. 33 60 Business development
Harmony Solar Louth Ltd. 33 30 Business development
Hibernian Wind Power Ltd. 2 100 Power generation
Hunter's Hill Wind Farm Ltd. 5 100 Power generation
Kerry Wind Power Ltd. 2 100 Power generation
Kirkan Wind Farm Ltd. 9 8 Power generation
Kirk Hill Wind Farm Ltd. 9 100 Power generation
Knottingley Power Ltd. 4 100 Dormant
Mount Eagle Wind Farm Ltd. 2 100 Power generation
Mountainlodge Power DAC. 2 85.9 Power generation
NIE Finance PLC. 6 100 Finance
34. SUBSIDIARY, EQUITY ACCOUNTED INVESTEES AND ASSOCIATE UNDERTAKINGS (continued)
Company nameRegistered
officeGroup
share % Nature of business
Indirect subsidiary (continued)
34. SUBSIDIARY, EQUITY ACCOUNTED INVESTEES AND ASSOCIATE UNDERTAKINGS (continued)
Company nameRegistered
officeGroup
share % Nature of business
Indirect subsidiary (continued)
NOTES TO THE FINANCIAL STATEMENTS
NIE Ltd. 6 100 Dormant
NIE Networks Services Ltd. 6 100 Non-trading
Northern Ireland Electricity Ltd. 6 100 Dormant
Northern Ireland Electricity Networks Ltd. 6 100 Power transmission and distribution
Orliven Ltd. 2 100 Power generation
Planet 9 Energy Ltd. 4 100 Trade of electricity
REG Greenburn Ltd. 27 10 Power generation
REG Knockodhar Ltd. 27 10 Power generation
Shantallow Solar Farm Ltd. 2 100 Business development
Sillahertane Energy Project Two Ltd. 2 100 Dormant
Synergen Power Ltd. 14 100 Power generation
Thameside Energy Recovery Holding Company Ltd. 4 100 Dormant
Thameside Energy Recovery Ltd. 4 100 Dormant
Tullamore Solar Farm Ltd. 2 100 Business development
Tullynahaw Power Ltd. 2 100 Power generation
Waterfern Ltd. 2 100 Power generation
West Durham Wind Farm (Holdings) 2 Ltd. 4 100 Dormant
West Durham Wind Farm (Holdings) Ltd. 4 100 Dormant
West Durham Wind Farm Ltd. 4 100 Power generation
Woodhouse Wind Farm Ltd. 2 100 Power generation
Y Bryn Wind Farm Ltd. 9 8 Power generation
208 ESB Annual Report 2020 - Brighter Together ESB Annual Report 2020 209

STR
ATEGY
AN
D P
ER
FOR
MA
NC
E
01
CO
RP
OR
ATE G
OV
ER
NA
NC
E
02
FINA
NC
IAL S
TATEM
EN
TS
03
34. SUBSIDIARY, EQUITY ACCOUNTED INVESTEES AND ASSOCIATE UNDERTAKINGS (continued)
Company nameRegistered
officeGroup
share % Nature of business
Equity accounted investees
Aldeburgh Offshore Wind Holdings Ltd. 28 50 Holding company
Aldeburgh Offshore Wind Investments Ltd. 28 50 Holding company
Emerald Bridge Fibres DAC. 2 50 Telecommunications
Five Estuaries Offshore Wind Farm Ltd. 29 12.5 Power generation
Galloper Wind Farm Holding Company Ltd. 29 12.5 Holding company
Galloper Wind Farm Ltd. 29 12.5 Power generation
Inch Cape Offshore Holdings Ltd. 34 50 Holding company
Inch Cape Offshore Ltd. 34 50 Business developments
Kingspan ESB DAC. 2 50 Dormant
NNG Windfarm Holdings Ltd. 32 50 Holding company
Neart Na Gaoithe Offshore Wind Ltd. 32 50 Power generation
Oweninny Power DAC. 2 50 Power generation
Oweninny Power Holdings DAC. 2 50 Holding company
Oweninny Power 2 DAC. 2 50 Power generation
Raheenleagh Power DAC. 2 50 Power generation
SIRO Ltd. 2 50 Fibre to the building
Sundew Solar DAC. 2 50 Power generation
Tilbury Green Power Holdings Ltd. 4 47 Holding company
Tilbury Green Power Ltd. 4 47 Power generation
Associate undertakings
Terra Solar Ltd. 24 25 Power generation
Investments
Endeco Technologies Ltd. 19 17.2 Clean technology investment
Heliex Power Ltd. 20 34.3 Clean technology investment
Nualight Ltd. 21 42.3 Clean technology investment
Oriel Wind Farm Ltd. 31 5 Power generation
Pesaka Technologies. 16 30 Power generation
Rousch Pakistan Power. 13 7 Power generation
TenKsolar Inc. 23 4 Clean technology investment
VantagePoint Cleantech Partners II, L.P. 22 4.5 Clean technology investment
Other
ESB ESOP Trustee Ltd. 15 100 Staff shareholding scheme
NOTES TO THE FINANCIAL STATEMENTS 34. SUBSIDIARY, EQUITY ACCOUNTED INVESTEES AND ASSOCIATE UNDERTAKINGS (continued)
ESB's principal place of business is Two Gateway, East Wall Road, Dublin 3, D03 A995
Notes:
1 ESB International, One, Dublin Airport Central, Dublin Airport, Cloghran, Co. Dublin, K67 XF72
2 Two Gateway, East Wall Road, Dublin 3, D03 A995
3 Mitchell Road, Phoenix Parkway, Corby, Northamptonshire MN17 1Q7
4 Tricor Services Europe LLP, 4th Floor, 50 Mark Lane, London, EC3R 7QR
5 2 Electra Road, Maydown, Derry, BT47 6 UL
6 120 Malone Road Belfast, BT9 5HT
7 Palladium House, 1-4 Argyll Street, London, W1F 7TA
8 Clanwilliam House, Clanwilliam Court, Dublin 2, D02 CV61
9 22-24 King Street, Maidenhead, SL6IEF
10 Shellingwood House, Westwood Way, Westwood Business Park, Coventry, CV48J2
11 Deloitte House, First Floor, Plot, 64518, Fairgrounds Office Park, Gaborne, Botswana
12 22nd Floor, Menara, EON Bank, Lala Raja Laut, 50350, Kuala Lumpur, Malaysia
13 94-W, 3rd Floor, AAMIR Plaza, Jinnah Avenue, Blue Area, Islambad, Pakistan
14 ESB Dublin Bay, Pigeon House Road, Ringsend, Dublin 4, D04 Y5N2
15 43 Merrion Square, Dublin 2, D02 R997
16 Level 1, Menara Yavasan, Tun Razak, Zoo, Jalan Bukit Bintang, 55100 Kuala Lumpur, Malaysia
17 10th Floor, Wisma Havela, Thakardos, No 1 Jalan Raja Laut, 50350 Kuala Lumpur,Malaysia
18 Clonshaugh Business and Technology Park, Clonshaugh, Dublin 17, D17 A662
19 3015, Lake Drive, Citywest Business Park, Dublin 24, D24 DKP4
20 Kelvin Building Bramah Avenue, East Kilbride, Glasgow, G75 0RD
21 Cork Business and Technology Park, Model Farm Road, Cork, T12 PW29
22 C/O Codan Trust Company (Cayman) Limited, Cricket Square, Hutchins Drive, P.O Box 2681, Grand Cayman, KY1-1111, Cayman Islands
23 9231 Penn Avenue South, Minneapolis, Minnesota, 55431
24 57 Hollybank Avenue Lower, Ranelagh, Dublin 6, D06 V8N4
25 Geothermal International Polska, Parkova 21 lok 7, 00-759 Warszawa, Poland
26 6, Rue Eugene Ruppert, L-2453, Luxembourg
27 2nd Floor Edgeborough House, Edgeborough Road, Guildford, Surrey, GU1 2BJ
28 St. Swithin's Lane, 4th Floor, London, England, EC4N 8AD
29 Windmill Hill Business Park, Whitehall Way, Swindon SN5 6PB, United Kingdom
30 25 Benson Street, East Corner of Benson & McDonald Streets Monrovia, Liberia
31 302 - 303 Balheary Demesne, Balheary Road, Swords, K67 E5AO, Co Dublin
32 Atria One, 144 Morrison Street, Edinburgh, United Kingdom EH3 8EX
33 Ballyseskin House, Ballyseskin, Kilmore, Co. Wexford
34 5th Floor, 40 Princes Street, Edinburgh, EH2 2BY
NOTES TO THE FINANCIAL STATEMENTS
210 ESB Annual Report 2020 - Brighter Together ESB Annual Report 2020 211

STR
ATEGY
AN
D P
ER
FOR
MA
NC
E
01
CO
RP
OR
ATE G
OV
ER
NA
NC
E
02
FINA
NC
IAL S
TATEM
EN
TS
03
IntroductionPayments terms during 2020 were governed by:
The Prompt Payment of Accounts Act, 1997. European Communities (Late Payments in Commercial Transactions) Regulations, 2012 (S.I. No. 580 of 2012) as amended by European Communities
(Late Payment in Commercial Transactions) (Amendment) Regulations 2016 (S.I. No. 281 of 2016) to combat late payments in commercialtransactions. These Regulations apply to contracts for goods and services supplied to ESB.
Construction Contracts Act 2013. This Act applies to construction contracts over €10,000.
Statement of payment practicesESB is committed to paying all undisputed supplier invoices within their agreed terms of payment.
Procedures and controls in placeAppropriate internal financial controls have been implemented including clearly defined roles and responsibilities. These procedures provide assurance against material non-compliance with the legislation.
Prompt Payment Code of Conduct In 2015 the Government launched the Prompt Payment Code of Conduct, which can be found at www.promptpayment.ie. ESB is a signatory to this Code and undertakes to pay suppliers on time; give clear guidance to suppliers on payment procedures; and encourage the adoption of the Code by suppliers within their own supply chains.
Construction Contracts Act 2013This Act came into effect on 25 July 2016. ESB has reviewed its responsibilities under this Act and has communicated these responsibilities to relevant staff.
Details of late payment interest in respect of 2020When ESB validates a late payment request from a supplier, it is ESB’s policy to pay interest due on such late payments. No such payments were made in respect of late payments during the year 2020 (2019: Nil).
Terence O'Rourke,Chairman
Pat O’Doherty
Chief Executive
26 February 2021
Report of Board Members on Compliance with the Prompt Payment of Accounts Act, 1997 and European Communities (Late Payments in Commercial Transactions) Regulations, 2012 (S.I. No. 580 of 2012) as amended by European Communities (Late Payment in Commercial Transactions) (Amendment) Regulations 2016 (S.I. No. 281 of 2016)
GLOSSARY1. Balancing Market/Balancing
Mechanism
The Balancing Market or Balancing Mechanism
(BM) allows the TSO to balance electricity
supply and demand close to real time.
2. British Electricity Trading and
Transmission Arrangements (BETTA)
British Electricity Trading and Transmission
Arrangements (BETTA) is the wholesale
electricity market operating in Great Britain
(GB).
3. Brexit
Brexit is the departure of the United Kingdom
from the European Union.
4. Commission for Regulation of Utilities,
Water and Energy
The Commission for Regulation of Utilities,
(CRU) is the independent regulator of water and
energy in the Republic of Ireland.
5. Contracts for Difference (CfDs)
A contract for difference (CfD) is a contract
between two parties, a buyer and a seller,
stipulating that the buyer will pay to the seller
the difference between the current value of
an asset and its value at contract time. If the
difference is negative, the seller pays instead of
the buyer.
6. COVID-19
COVID-19 is a disease caused by a new strain
of coronavirus. 'CO' stands for corona, 'VI' for
virus, and 'D' for disease.
7. DAM
The Day-Ahead Market allows market
participants to buy or sell wholesale electricity
one day before the operating day. It is the
largest market for trading power and the biggest
component of the wholesale electricity price.
8. EBITDA
Earnings before interest, taxation, depreciation,
impairments, amortisation (including
amortisation of supply contributions),
impairments and non-trading net impairment
losses on financial assets.
9. Energy for Generations Fund
In November 2013, ESB launched the Energy
for Generations Fund, a corporate responsibility
investment which will see over €1 million per
year disbursed across a range of community and
issues-based initiatives.
10. Environmental Protection Agency (EPA)
The Environmental Protection Agency is an
independent public body established under the
Environmental Protection Agency Act, 1992. It is
at the front line of environmental protection and
policing.
11. Gigabit (Gb/s)
Gigabit (Gb/s) is a unit of data transfer rate
equal to: 1,000 megabits per second
12. Gigawatt (GW)
Gigawatt, being the amount of power equal to 1
billion watts.
13. Gigawatt Hours (GWh)
Gigawatt hours, being the amount of energy
equivalent to delivering 1 billion watts of power
for a period of one hour.
14. Great Britain (GB)
England, Wales and Scotland.
15. Impairment
An impairment charge is determined when the
carrying value (book value) of assets exceeds its
recoverable amount.
16. Integrated Single Electricity Market
(I-SEM)
This European Target Model is a development
flowing from the Third Energy Package and is an
umbrella term for a detailed list of new common
EU guidelines, procedures and codes to be put
in place to enable a single EU-wide wholesale
electricity market. The implementation of these
common EU guidelines, procedures and codes
across the EU will allow electricity and gas to be
traded freely across the Union
17. Joint Venture
A company or other entity which is controlled
jointly with other parties.
18. Lost Time Injuries (LTIs)
A work related injury causing an absence for
one or more working days, counting from the
day after the injury, before the person returns
to normal or restricted work.
19. Megawatt (MW)
Megawatt, being the amount of power equal to
1 million watts.
20. Megawatt Hours (MWh)
Megawatt hours, being the amount of energy
equivalent to delivering 1 million watts of power
for a period of one hour.
21. Novusmodus Fund
The Novusmodus Fund is a venture capital fund
in which seed capital is invested into emerging
technologies.
22. OHSAS 18001
OHSAS 18001 Occupational, Health and
Safety Management Certification is an
international standard which provides a
framework to identify, control and decrease the
risks associated with health and safety within
companies.
23. Over the Counter Trading Platform
Financial instruments (specifically electricity
price contracts) which enable participants in
the SEM to reduce their risk (and therefore
electricity price volatility for their customers)
by trading these products directly (over the
counter) with each other, rather than via an
intermediary or through an exchange, in order
to hedge their exposure to movements in the
wholesale price of electricity.
24. P1 Incidents
Incidents which have a high probability of
causing high consequence injuries such as
fatality, amputation, loss of eye, multiple injuries,
major fracture, 2nd/ 3rd degree burns, being
unconscious (major / serious), Road Traffic
Collision reportable injuries, fatalities, excessive
material damage.
25. Price Review 4 (PR4)
Regulatory periods are of 5 years' duration
and the Price Control Review (PR4) covers the
period 2016 to 2020 and sets out the total
regulated allowed revenues over that period as
determined by the Commission for Regulation
of Utilities (CRU).
212 ESB Annual Report 2020 - Brighter Together ESB Annual Report 2020 213

STR
ATEGY
AN
D P
ER
FOR
MA
NC
E
01
CO
RP
OR
ATE G
OV
ER
NA
NC
E
02
FINA
NC
IAL S
TATEM
EN
TS
03
GLOSSARY (Continued)26. Price Review 5 (PR5)
Regulatory periods are of 5 years' duration
and the Price Control Review (PR5) covers the
period 2021 to 2025 and sets out the total
regulated allowed revenues over that period as
determined by the Commission for Regulation
of Utilities (CRU).
27. Regulatory Period 6 (RP6)
Regulatory Period 6 (RP6), is a regulatory
period of 5 years’ duration for price control,
covering the period 1 April 2017 to 31 March
2024, determined by the Utility Regulator in
Northern Ireland.
28. Return on Capital Employed (ROCE)
The return on capital employed shows the
overall return on capital provided by both debt
and equity.
29. Safe and Sound
An ESB culture change program that will
serve to build a world-class safety culture and
environment that is sustainable over time.
30. Single Electricity Market (SEM)
The Single Electricity Market is a wholesale
pool-based electricity market operating north
and south of the Irish Border.
31. Single Electricity Market Operator
(SEMO)
The SEM is operated by SEMO, a joint venture
between EirGrid and SONI, the transmission
system operators in Ireland and Northern Ireland
respectively.
32. SIRO
A joint venture with Vodafone, which will bring
1 gigabit per second (Gb/s) broadband to
500,000 customers in fifty towns across Ireland
using the existing distribution network.
33. Smart Energy Services
Smart Energy Services is a complete energy
management solution that brings all of the skills
and experience of a global energy innovator to
businesses.
34. Smart Grid
A transformed electricity transmission and
distribution network or Grid that uses robust
two-way communications, advanced sensors
and distributed computers to improve the
efficiency, reliability and safety of power delivery
and use.
35. Smart Meter Programme
The smart meter programme is the next
generation of energy meter. They will replace the
traditional electricity and gas meters removing
the need for a home visit to read the meter
and will eliminate the need to use estimates
whenever a meter cannot be read.
36. Safety Leadership Strategy
A framework that shows a clear and simple
way of articulating the safety responsibilities,
obligations and expectations that everyone in
ESB has in order to maintain a safe environment.
37. Sustainable Energy Authority of
Ireland (SEAI)
The Sustainable Energy Authority of Ireland was
established as Ireland's national energy authority
under the Sustainable Energy Act 2002.
38. System Operator for Northern Ireland
(SONI)
The System Operator for Northern Ireland
ensures the safe, secure
and economic operation of the high voltage
electricity grid in Northern Ireland and in
co-operation with EirGrid colleagues is also
responsible for running the all-island wholesale
market for electricity.
39. The way we work at ESB
The Way We Work at ESB brings together
ESB’s purpose, strategy and values. In ESB,
the purpose statement tells the world why ESB
exists – the reason for being, beyond profit. It's
who ESB is, and it's lived through its values.
Values are how ESB puts the purpose into
action. It encapsulates and aligns the culture and
informs behaviours.
40. United Kingdom (UK)
England, Wales, Scotland and Northern Ireland.
41. Utility Regulator (UR)
The independent non-ministerial government
department set-up to ensure the effective
regulation of the electricity, gas and water and
sewerage industries in Northern Ireland.
42. Vertically Integrated Utility
The Vertically Integrated Utility (VIU) refers to
presence within and ownership of, assets across
all of the elements of the electricity value chain
including the generation, trading, transmission,
distribution and supply of power to customers.
214 ESB Annual Report 2020 - Brighter Together ESB Annual Report 2020 215

ESB Head Office Two GatewayEast Wall RoadDublin 3D03 A995 IrelandT: +353 1 676 5831E: [email protected] Twitter: @ESBGroupLinkedIn: https://www.linkedin.com/company/esbYouTube: https://www.youtube.com/user/ESBVideo
FSC® C022287