bring on tomorrow - american international group · our balance sheet is stronger as a result of...
TRANSCRIPT

American International Group, Inc.2012 Annual Report
Bring on tomorrow
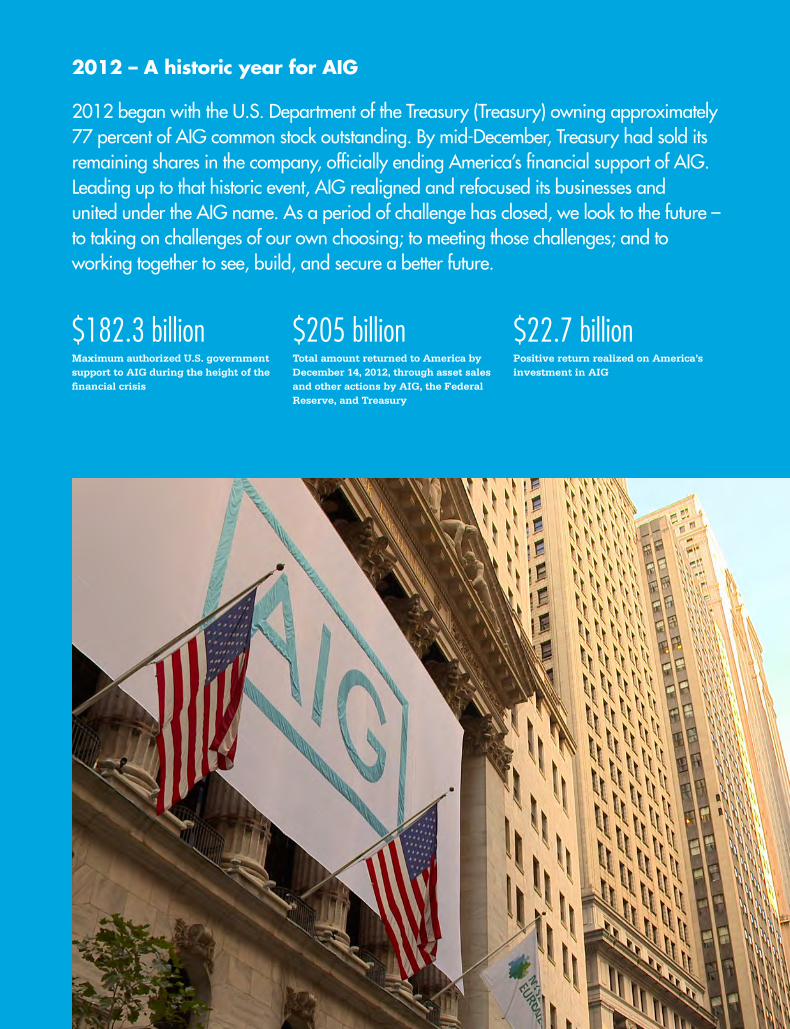
2012 began with the U.S. Department of the Treasury (Treasury) owning approximately 77 percent of AIG common stock outstanding. By mid-December, Treasury had sold its remaining shares in the company, officially ending America’s financial support of AIG. Leading up to that historic event, AIG realigned and refocused its businesses and united under the AIG name. As a period of challenge has closed, we look to the future – to taking on challenges of our own choosing; to meeting those challenges; and to working together to see, build, and secure a better future.
2012 – A historic year for AIG
$182.3 billionMaximum authorized U.S. government support to AIG during the height of the financial crisis
$205 billionTotal amount returned to America by December 14, 2012, through asset sales and other actions by AIG, the Federal Reserve, and Treasury
$22.7 billionPositive return realized on America’s investment in AIG

OUR GLOBAL NETWORK Countries where AIG products are sold
KEY FACTS & FIGURES
98%Percent of Fortune 500 companies AIG serves
52,000+ $65.7 billion
18 million
Families that AIG helped stay in their homes in 2012
AIG’s revenues in 2012
Americans who AIG helps plan for retirement
Claims paid by AIG Property Casualty in 2012
Donations made by AIG’s Matching Grants Program to match employees’ gifts to charitable organizations in 2012
$27.6 billion
$6.7 million
1

Over the past several years, the people of AIG have demon-strated that we keep our promises – to our customers around the world, to the communities where we work and live, and to America.
When I joined AIG in August 2009, we were selling off valuable assets for far less than their true value. Everywhere I turned, I found great people who were committed to serving their clients and to doing the right thing – but who were becoming increas-ingly demoralized as they witnessed their company being rapidly dismantled amid unprecedented public criticism levied at the expense of their commitment to make things right.
It was clear that AIG was too big, too diverse, and not transpar-ent enough. As we identified the insurance businesses that formed the core of the company, and those that ultimately would need to be sold to help repay America, we realized we needed to change in many ways to meet and exceed the expectations of our customers, our regulators, our investors, and each other.
Only by reenergizing and empowering the people of AIG were we able to envision a future worth working toward.
Fast-forward to the end of 2012 – a year that I know will go down in AIG history as a pivotal year. We are deeply proud of the progress we’ve made and the promises we’ve kept:
■ We said we would fully repay the $182.3 billion in financial support that America extended to us – plus a profit. By December 2012, the people of AIG had made good on that promise, returning more than $205 billion to America. That’s every penny, plus a profit of more than $22 billion.
■ We said we would become a smaller, more focused company. Today, I am very proud that the insurance businesses that we identified in 2009 as core to the new AIG – property casualty, life and retirement, and mortgage guaranty – continue to thrive as we have sold off other businesses, and streamlined our operations and support functions. We have become, truly, one AIG – and rebranded our core insurance operations under the AIG name with a new, reinvigorated AIG logo.
■ We said we would pay for performance. 2012 marks three years that we have adhered to comprehensive pay- for -performance processes and standards – ensuring that our people are properly motivated and appropriately rewarded for their efforts to balance profit, growth, and risk.
■ We said we would focus on the right growth opportunities. We’ve forged a number of strategic partnerships, including our investment in People's Insurance Company (Group) of China Limited, and our acquisitions of Woodbury Financial Services, Inc. and Fuji Fire and Marine Insurance Co., Ltd.
■ We said we would manage risk better. Now risk management is integrated across all of AIG and is a key element of how we make decisions and manage our businesses. We also routinely conduct enterprise-wide stress tests under a range of worst -case scenarios to better manage our financial resources in order to maintain our financial strength. This risk management framework provides AIG management and our Board of Directors with insight and an understanding of the major risk positions across AIG.
TO OUR SHAREHOLDERS,
ROBERT H. BENMOSCHE Pres ident and Ch ief Execut ive Of f i ce r
We are committed to building on our successes and demonstrating what the new AIG can do.
2

■ We said we would return to profitability and recommit to focusing on customers. 2012 marks the third straight year of full-year profits. Even with Storm Sandy – the second largest catastrophic event for AIG in the U.S. – we earned a profit in 2012. And we have realigned our Property Casualty and Life and Retirement businesses to be more streamlined and refocused on seamlessly serving our commercial and consumer customers.
A closer look at our results in 2012 shows the benefit of the work we’ve done and the progress we’ve made:
■ AIG Property Casualty reported improved operating income and continued to experience positive pricing trends. With $34.4 billion of net premiums written in 2012, AIG Property Casualty is the number one U.S.-based commercial insurer in the U.S. and Canada, the largest U.S.-based property casualty insurer in Europe, and the number one foreign property casualty insurer in Japan and China.
■ AIG Life and Retirement assets under management grew significantly in 2012. And, even with interest rates at continued historic lows, AIG Life and Retirement is a market leader delivering innovative, compelling retirement products that provide meaningful, long-term peace of mind to our customers while making sense for AIG.
■ United Guaranty reported new insurance written of $37.5 billion for 2012 compared to $18.8 billion in 2011, and has experienced improving credit trends.
■ Our investment portfolio performance improved through the use of yield enhancements within our risk appetite, including the purchases of securities acquired through the Federal Reserve Bank of New York’s auction of Maiden Lane III LLC assets.
■ Our balance sheet is stronger as a result of the issuance of unsecured notes and monetization of non-core assets – including our agreement to sell our largest non-core asset, International Lease Finance Corporation, our leading aircraft leasing business, and the sale of our remaining shares of AIA Group Limited.
While a new era for AIG has begun, our work is not done. We have more promises to keep.
We are committed to building on our successes and demonstrat-ing what the new AIG can do. Every day, we are working to reestablish AIG as the trusted partner of companies, families, and society. We are focused on expense reduction to cut costs, and to strengthen our businesses; stronger businesses will improve our credit ratings and further increase investor interest in AIG. We are focused on rolling out better technology and new operations plat-forms to help leverage shared services to make us more efficient, which in turn will help us cut costs and streamline work processes. We are committed to developing and retaining our best talent, promoting diversity, and encouraging and empowering employ-ees to work together. We are smarter than ever before, making more informed decisions by using and analyzing the enormous amount of data we have across the company.
That is the power of the new AIG and our promise for the future.
Yes, we have been met with challenges, but we have met those challenges together – hitting every major milestone on our jour-ney. So when we say we are going to do something, you can have confidence that the people of AIG will get it done.
Bring on tomorrow.
Robert H. Benmosche February 21, 2013
3

When I said in my letter for AIG’s 2011 Annual Report that “time will tell” if the people of AIG had executed the largest turnaround in corporate history, it was with optimism that I believed it would happen so quickly.
Beyond its impressive exit of government ownership, AIG contin-ued to make sound business decisions in 2012, helping position the company for a strong future by divesting non-core assets, streamlining global operations under clear reporting lines, and looking for smart opportunities to grow AIG’s business. Now the true measure of success will be what we can do together as we open a new chapter in 2013.
We believe the role of the Board of Directors is to fully under-stand the business of AIG and, using that knowledge, to provide true oversight and make informed decisions.
With this belief in mind, we have been an engaged Board, with our sleeves rolled up, working independently and alongside management to better guide AIG’s future. We will continue to do whatever it takes, and we remain committed to implementing and overseeing a set of guiding principles that act as AIG’s foundation.
For example, at every Board of Directors meeting, we get updates from AIG’s Enterprise Risk Management (ERM) function and review the results of stress tests that examine how AIG would be affected by any number of scenarios. I firmly believe that the work of the Board and the ERM team will help ensure that AIG never again faces the kind of crisis we did in 2008.
Another example is Federal Reserve (Fed) oversight. In 2012, when U.S. government ownership of AIG fell below 50 percent, the Fed became AIG’s global regulator. AIG has welcomed the Fed’s presence, as it has served to strengthen us by holding our company to the highest standards. We feel strongly that it is im-portant to maintain a transparent relationship and open dialogue with the Fed – at the corporate level and at the Board level. Besides me, several key Board committee chairs meet regularly
with representatives from the Fed to share perspectives. We will continue to listen and respond to their questions, suggestions, and guidance.
The Board also sees firsthand AIG’s operations in action, as we schedule our meetings at various company locations around the world. In the days after Storm Sandy, I, along with a group of Board members, went to AIG’s Operations & Systems facility in Kuala Lumpur, where we were surrounded by IT professionals, a mobilized command center working seamlessly with its sister com-mand center in Fort Worth, Texas, and a team of AIG colleagues working tirelessly to support our business operations in New Jersey and New York. While we need to continue to review and strengthen our business continuity capabilities, AIG already has proven its ability to deal with disruption. The global reach of this company is impressive and invaluable in overcoming adversity and seeking new opportunities.
And I see no more telling sign of AIG’s recovery than the decision to retire the Chartis and SunAmerica Financial Group names, again making AIG the go-to-market brand of our Property Casualty business, and renaming the life and retirement business AIG Life and Retirement. Coupled with a refreshed logo and brand promise encouraging employees, clients, and partners to bring on the challenges of tomorrow, we truly are looking to the future.
A good Board of Directors should empower people to stretch and expand the limits of what is possible, and we will continue to work hard to help AIG reach its full potential. We cannot wait to begin the next chapter in the AIG story. We have a past, we have a present, and – with thanks to AIG’s employees and Amer-ica’s support – now we have a future. This is the time to make the most of it.
DEAR AIG SHAREHOLDER,
ROBERT S. MILLER Non-Execut ive Cha i rman of the Board
We have a past, we have a present, and – with thanks to AIG’s employees and America’s support – now we have a future.
Robert S. Miller February 21, 2013
4

5
Years Ended December 31,
(dollars in millions, except per share data) 2012 2011 2010
Operating results: Total revenues $ 65,656 $ 59,812 $ 72,829
Net income attributable to AIG 3,438 20,622 10,058
After-tax operating income (loss) 6,635 2,086 (1,549 )
Earnings (loss) per share (EPS): Net income (loss) attributable to AIG 2.04 11.01 14.98
After-tax operating income (loss) attributable to AIG $ 3.93 $ 1.16 $ (11.34 )
Balance sheet: Total assets $ 548,633 $ 553,054 $ 675,573
Shareholders' equity 98,002 101,538 78,856
Book value per share(1) 66.38 53.53 43.20
Book value per share, excluding Accumulated other comprehensive income (AOCI)(1) $ 57.87 $ 50.11 $ 38.27
Key metrics: AIG Property Casualty combined ratio 108.6 108.8 116.8
AIG Property Casualty accident year combined ratio, as adjusted(2) 99.9 99.2 100.3
AIG Life and Retirement premiums, deposits and other considerations $ 20,994 $ 24,392 $ 19,505
(1) 2011 and 2010 adjusted to reflect reclassification of income taxes from Accumulated other comprehensive income to Additional paid-in capital. Book value per share in 2010 is presented on a pro forma basis as if to reflect completion of the recapitalization prior to January 2011.
(2) Combined ratio presented excluding catastrophe losses and related reinstatement premiums, prior year development, net of premium adjustments and the impact of reserve discount.
Financial Highlights
2010
Book Value per ShareExcluding AOCI
$38.
27
$50.
11 $57.
87
2011 20122010
After-Tax Operating Income (Loss)($ in billions)
$(1.
5)
$2.1
$6.6
2011 2012 2010
Total Assets($ in billions)
$675
.6
$553
.1
$548
.6
2011 2012 2010
Shareholders' Equity($ in billions)
$78.
9
$101
.5
$98.
0
2011 2012

UNITEDBring on tomorrow
Together, we’re working to help see, build, and secure a better future for everyone.
Bring on tomorrowAs AIG’s brand promise, these three words are more than window dressing to go along with our refreshed logo. They are a call to action, a rallying cry for our employees. We are a revitalized AIG, one team of approximately 63,000 people helping clients in more than 130 countries, with the drive and ambition to solve the problems and innovate for the future that our partners and customers will face.
Bring on teamworkWe know that even when the odds are against you, when the right people come together, with the right values and a lot of hard work, even the toughest challenges can be overcome. We found these values echoed in the tenacity, integrity, and international com-munity surrounding rugby. Now we’re partnering with USA Rugby to sponsor the Junior and Collegiate All-American teams, and we’re sponsoring the New Zealand Rugby Union and its legendary All Blacks – one of the most successful teams in sporting history.
Bring on one AIGWe have reunited our businesses under the AIG name because we believe that together we’re stronger. We are one AIG, and working together across our company and with our partners, our collective drive can surmount even the biggest obstacles. Our network of unparalleled data and experience around the globe mean we can offer our customers solutions that no one else can.
6

UNITEDBring on tomorrow
Together, we’re working to help see, build, and secure a better future for everyone.
~63,000AIG EMPLOYEES AROUND THE WORLD WORKING TOWARD A COMMON GOAL
7

TRUSTBring on tomorrow
We promise to be there – because by supporting our customers, we enable them to be at their best, to realize their dreams, and to find success every day.
Bring on keeping promises We keep our promises. That’s what has gotten AIG to where we are today. So when we made a promise from the beginning to fully repay the American taxpayers’ investment in AIG, plus a positive return, we fully intended to keep it. And we did, repaying the U.S. government’s commitment to AIG – and a positive return of more than $22 billion.
Bring on rebuildingWe promise our customers that we will be there for the unexpected. When tornadoes destroyed schools in Kentucky in March 2012, we were there within days to give the Kentucky School Boards Insurance Trust a $5 million check to help schools start rebuilding. When Storm Sandy hit the northeastern U.S. in October, many of our employees in the region were directly in its path. That didn’t stop us from helping clients, setting up a mobile catastrophe center in one of the hardest-hit areas, and paying out over $175 million to clients within the first 30 days.
Bring on securityWe promise we will help build a better future, whether for a growing company or for a family of four. For example, Tata AIG has developed innovative microinsurance programs to help farmers in rural India track 350,000 head of cattle – and protect their owners’ liveli-hoods. In Life and Retirement, our Quality of Life…Insurance offers affordable ways to cover critical illness, long-term care, disability, and life insurance needs. SunAmerica Retirement Markets provides guaranteed lifetime income – no matter how long retirement lasts.
8

$115.1 millionAVERAGE CLAIMS PAID EACH DAY BY AIG PROPERTY CASUALTY IN 2012
9

Bring on giving backAIG employees are passionate people – passionate about their work but also about their communities. We want to help our people give to causes and organizations that matter – to them. To assist employees in supporting the causes they care most about, we launched a bigger and better Matching Grants Program in 2012. It includes a 2:1 match ratio for employee dona-tions of up to $5,000 to qualifying nonprofit organizations, making AIG’s maximum donation under the program $10,000.
Bring on doing moreFor the past 24 years, AIG has held its Winter Summit, combining business sessions led by AIG Property Casualty with ski and snowboarding races. Since 2011, the event has also raised more than $1.5 million for Disabled Sports USA, whose Warfighter Sports Program offers sports rehabilitation for those severely wounded in combat, and veterans from the program ski alongside event attendees. Our new Pro Bono Legal Program lets AIG’s legal experts share their expertise with nonprofit organiza-tions and those with limited means.
Bring on giving timeOur new Volunteer Time Off program encourages employees to take their talents out of the office and into the community. Around the world, employees are stepping up. In Singapore and Korea, employees worked with community outreach organizations to make and deliver meals to local low-income families. In the Philippines, employees raised funds and donated essential goods to help victims of the August 2012 Habagat floods.
COMMUNITYBring on tomorrow
We’re giving back to our communities – sharing resources and volunteering time to make tomorrow better around the world.
10

$10,000MAXIMUM DONATION MADE BY AIG’S MATCHING GRANTS PROGRAM TO MATCH AN EMPLOYEE DONATION TO A CHARITABLE ORGANIZATION
11

From left
Arthur C. Martinez Former Chairman of the Board, President, and Chief Executive Officer Sears, Roebuck and Co.
W. Don Cornwell Former Chairman of the Board and Chief Executive Officer Granite Broadcasting Corporation
Henry S. Miller Chairman Marblegate Asset Management, LLC Former Chairman and Managing Director Miller Buckfire & Co., LLC
John H. Fitzpatrick Secretary General The Geneva Association Former Chief Financial Officer, Head of the Life and Health Business Group, and Head of Financial Services Swiss Re
Morris W. Offit Chairman, Offit Capital Founder and Former Chief Executive Officer OFFITBANK
Suzanne Nora Johnson Former Vice Chairman The Goldman Sachs Group, Inc.
Robert S. Miller Non-Executive Chairman of the Board American International Group, Inc. Former Chief Executive Officer Hawker Beechcraft, Inc.Former Executive ChairmanDelphi Corporation
Robert H. Benmosche President and Chief Executive Officer American International Group, Inc.
Christopher S. Lynch Former National Partner in Charge of Financial Services KPMG LLP
George L. Miles, Jr. Chairman Emeritus Chester Engineers, Inc. Former President and Chief Executive Officer WQED Multimedia
Ronald A. Rittenmeyer Chairman, President, and Chief Executive Officer Expert Global Solutions, Inc. Former Chairman, Chief Executive Officer, and President Electronic Data Systems Corporation
Douglas M. Steenland Former President and Chief Executive Officer Northwest Airlines Corporation
BOARD OF DIRECTORS
12

Form 10-KAmerican International Group, Inc.
13

26OCT201220500047
UNITED STATESSECURITIES AND EXCHANGE COMMISSION
Washington, D.C. 20549
FORM 10-KANNUAL REPORT PURSUANT TO SECTION 13 OR 15(d) OF THE SECURITIES EXCHANGE ACT OF 1934
For the fiscal year ended December 31, 2012 Commission file number 1-8787
American International Group, Inc. (Exact name of registrant as specified in its charter)
Delaware 13-2592361(State or other jurisdiction of (I.R.S. Employerincorporation or organization) Identification No.)
180 Maiden Lane, New York, New York 10038(Address of principal executive offices) (Zip Code)
Registrant’s telephone number, including area code (212) 770-7000
Securities registered pursuant to Section 12(b) of the Act: See Exhibit 99.02
Securities registered pursuant to Section 12(g) of the Act: None
Indicate by check mark if the registrant is a well-known seasoned issuer, as defined in Rule 405 of the Securities Act. Yes � No �
Indicate by check mark if the registrant is not required to file reports pursuant to Section 13 or Section 15(d) of the Act. Yes � No �
Indicate by check mark whether the registrant (1) has filed all reports required to be filed by Section 13 or 15(d) of the Securities Exchange Act of 1934 during the preceding 12 months (or for such shorter period that the registrant was required to file such reports), and (2) has been subject to such filing requirements for the past 90 days. Yes � No �
Indicate by check mark whether the registrant has submitted electronically and posted on its corporate Web site, if any, every Interactive Data File required to be submitted and posted pursuant to Rule 405 of Regulation S-T (§232.405 of this chapter) during the preceding 12 months (or for such shorter period that the registrant was required to submit and post such files). Yes � No �
Indicate by check mark if disclosure of delinquent filers pursuant to Item 405 of Regulation S-K (§229.405 of this chapter) isnot contained herein, and will not be contained, to the best of registrant’s knowledge, in definitive proxy or information statements incorporated by reference in Part III of this Form 10-K or any amendment to this Form 10-K. �
Indicate by check mark whether the registrant is a large accelerated filer, an accelerated filer, a non-accelerated filer, or a smaller reporting company. See the definitions of ‘‘large accelerated filer,’’ ‘‘accelerated filer’’ and ‘‘smaller reporting company’’ in Rule 12b-2 of the Exchange Act.
Large accelerated filer � Accelerated filer � Non-accelerated filer � Smaller reporting company �(Do not check if a
smaller reporting company)
Indicate by check mark whether the registrant is a shell company (as defined in Rule 12b-2 of the Act). Yes � No �
The aggregate market value of the voting and nonvoting common equity held by nonaffiliates of the registrant (based on the closing price of the registrant’s most recently completed second fiscal quarter) was approximately $21,463,000,000.
As of February 15, 2013, there were outstanding 1,476,322,473 shares of Common Stock, $2.50 par value per share, of the registrant.
DOCUMENTS INCORPORATED BY REFERENCE
Document of the Registrant Form 10-K Reference Locations
Portions of the registrant’s definitive proxy statement for the Part III, Items 10, 11, 12, 13 and 142013 Annual Meeting of Shareholders


AMERICAN INTERNATIONAL GROUP, INC.ANNUAL REPORT ON FORM 10-K FOR THE YEAR ENDED DECEMBER 31, 2012TABLE OF CONTENTS
Item 1. Business 2• AIG’s Global Insurance Operations 3• A Review of Liability for Unpaid Claims and Claims Adjustment Expense 20• Reinsurance Activities 23• Generating Revenues: Investment Activities of Our Insurance Operations 24• Regulation 24• Our Competitive Environment 29• Our Employees 29• Directors and Executive Officers of AIG 30• Available Information about AIG 31
Item 1A. Risk Factors 32Item 1B. Unresolved Staff Comments 44Item 2. Properties 44Item 3. Legal Proceedings 44Item 4. Mine Safety Disclosures 44
Item 5. Market for Registrant’s Common Equity, Related Stockholder Matters and Issuer Purchases ofEquity Securities 45
Item 6. Selected Financial Data 48Item 7. Management’s Discussion and Analysis of Financial Condition and Results of Operations 52
• Cautionary Statement Regarding Forward-Looking Information 52• Use of Non-GAAP Measures 54• Executive Overview 56• Results of Operations 68• Liquidity and Capital Resources 120• Regulation and Supervision 137• Investments 138• Enterprise Risk Management 155• Critical Accounting Estimates 172• Glossary 195• Acronyms 199
Item 7A. Quantitative and Qualitative Disclosures about Market Risk 200Item 8. Financial Statements and Supplementary Data 201
Index to Financial Statements and Schedules 201Item 9. Changes in and Disagreements with Accountants on Accounting and Financial Disclosure 344Item 9A. Controls and Procedures 344
Item 10. Directors, Executive Officers and Corporate Governance 345Item 11. Executive Compensation 345Item 12. Security Ownership of Certain Beneficial Owners and Management and Related Stockholder
Matters 345Item 13. Certain Relationships and Related Transactions, and Director Independence 345Item 14. Principal Accounting Fees and Services 345
Item 15. Exhibits, Financial Statement Schedules 346
347
..................................................................................................................................................................................................................................
AIG 2012 Form 10-K 1
.........................................................................................................................................................................................................
.........................................................................................................................................................................................................
.........................................................................................................................................................................................................
.........................................................................................................................................................................................................
.........................................................................................................................................................................................................
.........................................................................................................................................................................................................
FORM 10-KItem Number Description Page
PART I
PART II
PART III
PART IV
SIGNATURES

PART I..............................................................................................................................................................................................
..............................................................................................................................................................................................
American International Group, Inc. (AIG) is a leading global insurance company. Founded
in 1919, today we provide a wide range of property casualty insurance, life insurance, retirement products, mortgage
insurance and other financial services to customers in more than 130 countries. Our diverse offerings include
products and services that help businesses and individuals protect their assets, manage risks and provide for
retirement security. AIG common stock is listed on the New York Stock Exchange and the Tokyo Stock Exchange.
AIG’s key strengths include:
World class insurance franchises that are leaders in their
categories and are improving their operating performance;..............................................................................................................................................................................................
A diverse mix of businesses with a presence in most international
markets;..............................................................................................................................................................................................
Effective capital management of the largest shareholders’ equity of
any insurance company in the world*, supported by enhanced risk
management;..............................................................................................................................................................................................
Execution of strategic objectives, such as the recent divestiture of
non-core businesses and fulfillment of our commitment to repay the
U.S. taxpayers; and..............................................................................................................................................................................................
Improved profitability, as demonstrated by three consecutive years
of full-year profit...............................................................................................................................................................................................
* At June 30, 2012, the latest date for which information was available for certain foreign insurance companies.
..................................................................................................................................................................................................................................
AIG 2012 Form 10-K2
ITEM 1 / BUSINESS

I T E M 1 / B U S I N E S S / A I G.....................................................................................................................................................................................
In this Annual Report on Form 10-K, unless otherwise mentioned or unless the context indicatesotherwise, we use the terms ‘‘AIG,’’ the ‘‘Company,’’ ‘‘we,’’ ‘‘us’’ and ‘‘our’’ to refer to AIG, aDelaware corporation, and its consolidated subsidiaries. We use the term ‘‘AIG Parent’’ to refer solelyto American International Group, Inc., and not to any of its consolidated subsidiaries.
A reference summary of certain technical terms and acronyms used throughout this Annual Reporton Form 10-K is available on pages 195-199.
AIG’s Global Insurance Operations
HOW WE GENERATE REVENUES AND PROFITABILITY..............................................................................................................................................................................................
We earn revenues primarily from insurance premiums, policy fees from universal life insurance and investment
products, and income from investments.
Our operating expenses consist of policyholder benefits and claims incurred, interest credited to policyholders,
commissions and other costs of selling and servicing our products, and general business expenses.
Our profitability is dependent on our ability to price and manage risk on insurance and annuity products, to manage
our portfolio of investments effectively, and control costs through expense discipline.
Commencing in the third quarter of 2012, the Chartis segment was renamed AIG Property Casualty and the
SunAmerica segment was renamed AIG Life and Retirement, although certain existing brands will continue to be
used in certain geographies and market segments.
AIG Property Casualty AIG Life and Retirement
AIG Property Casualty is a leading provider of AIG Life and Retirement is a premier provider of life
insurance products for commercial, institutional and insurance and retirement services in the United States. It
individual customers through one of the world’s most is among the largest life insurance and retirement
far-reaching property casualty networks. AIG Property services businesses in the United States. With one of
Casualty offers one of the industry’s most extensive the broadest distribution networks and most diverse
ranges of products and services, through its diversified, product offerings in the industry, AIG Life and
multichannel distribution network, benefitting from its Retirement helps to ensure financial and retirement
strong capital position. security for more than 18 million customers.
Other Operations
Mortgage Guaranty (United Guaranty Corporation or UGC), is a leading provider of private residential mortgage
guaranty insurance (MI). MI covers mortgage lenders for the first loss from mortgage defaults on high loan-to-value
conventional first-lien mortgages. By providing this coverage to lenders, UGC enables mortgage lenders to remain
competitive, while generating a sound and responsible book of business, and enables individuals to purchase a
house with a lower down payment.
Other operations also include Global Capital Markets, Direct Investment book, Retained Interests and Corporate &
Other operations.
On December 9, 2012, AIG announced an agreement to sell 80.1 percent of International Lease Finance Corporation
(ILFC) with an option for the purchaser to buy an additional 9.9 percent stake. As a result, ILFC operating results,
which were previously presented in the Aircraft Leasing segment, have been classified as discontinued operations in
all periods, and associated assets and liabilities have been classified as held-for-sale at December 31, 2012.
..................................................................................................................................................................................................................................
AIG 2012 Form 10-K 3

15FEB201302432775
I T E M 1 / B U S I N E S S / A I G.....................................................................................................................................................................................
AIG 2012 Revenue Sources ($ millions)
Commercial
Insurance
$23,609Other
$1,769
Consumer
Insurance
$14,403
41%
16%
13%
25%
3%
Life
Insurance
$9,509
Retirement
Services
$7,258AIG
PROPERTY
CASUALTY
69%
AIG LIFE AND
RETIREMENT
29%
MORTGAGE
GUARANTY$867
2%
For financial information concerning our reportable segments, including geographic areas of operation and changes
made in 2012, see Note 3 to the Consolidated Financial Statements. Prior periods have been revised to conform to
the current period presentation for segment changes and discontinued operations.
Restructuring and Rebuilding: AIG Moving Forward
We have taken significant steps to position our company for future growth
and in 2012 fully repaid governmental financial support of AIG. These
amounts are discussed below in 2011-2012 Accomplishments. We have made substantial
progress in each of these fourFederal Reserve Bank of New York
main priority areas during theWe repaid the governmental support that we received in September 2008
past few years. Our effortsand thereafter during the global economic crisis. This support included a
have centered on protectingcredit facility from the Federal Reserve Bank of New York (the FRBNY and
such credit facility, the FRBNY Credit Facility) and funding from the and enhancing the value ofDepartment of the Treasury through the Troubled Asset Relief Program
our key businesses, restoring(TARP). After receiving this support, our Board of Directors and
management placed a strong focus on improving our businesses and AIG’s financial strength,pursued four main priorities:
repaying U.S. taxpayers and
reducing risk.• building AIG’s value by strengthening our international property and
casualty and domestic life insurance and retirement businesses;
• repaying support from the U.S. government, including through significant
divestitures;
• decreasing our operating costs; and
• reducing risk by winding down our exposure to certain financial products
and derivatives trading activities.
..................................................................................................................................................................................................................................
AIG 2012 Form 10-K4

19FEB201322181508
I T E M 1 / B U S I N E S S / A I G.....................................................................................................................................................................................
Department of the Treasury
Through a series of transactions that closed on January 14, 2011 (the Recapitalization), we exchanged various forms
of government support for AIG Common Stock, and the Department of the Treasury became AIG’s majority
shareholder, with approximately 92 percent of outstanding AIG Common Stock at that time.
The Department of the Treasury, as selling shareholder, sold all of its shares of AIG Common Stock through six
registered public offerings completed in May 2011 and March, May, August, September and December 2012. We
purchased approximately 421 million shares of AIG Common Stock in the first four of the 2012 offerings for
approximately $13.0 billion. We did not purchase any shares in the May 2011 or December 2012 offerings.
See Item 7. MD&A – Liquidity and Capital Resources and Notes 4, 17, 18, and 25 to the Consolidated Financial
Statements for further discussion of the government support provided to AIG, the Recapitalization and significant
asset dispositions.
These and other key accomplishments are described in the following table:
2011 and 2012 Accomplishments
AREA OF FOCUS ACTION
$67.7 bn
$51.6 bn*
$1.6 bn in 2012
$1.0 bn in 2011
3.5 points in
2012
$4.2 bn (80.1%)
$16.6 bn
$5.2 bn and
$3.3 bn
$4.0 bn
$12.85
$3.8 bn and
$2.0 bn
$13.0 bn
$2.9 bn
RESULT
COMPLETEREPAYMENT OFGOVERNMENTSUPPORT
COREBUSINESSDEVELOPMENTS
NON-CORE ASSETDIVESTITURES
STRENGTHENLIQUIDITY AND CAPITAL
CAPITALMARKETSTRANSACTIONS
EXITED FROMGOVERNMENTOWNERSHIP
FOCUSEDPORTFOLIO OFBUSINESSES
INCREASEDFINANCIALFLEXIBILITY
• Completed Recapitalization in 2011• Department of the Treasury exited ownership of AIG through six offerings of AIG Common Stock in 2011 and 2012
• Improved insurance operating income
• Improved 2012 current accident year loss ratio, excluding catastrophe losses and prior year development• Completed cash redeployment in 2011• Strategic investments in People’s Insurance Company (Group) of China Limited (PICC), Woodbury Financial Services, Inc. and Service Net in 2012
• Remaining interests in Maiden Lane II LLC (ML II) and Maiden Lane III LLC (ML III) monetized and sold remaining interest in AIA Group Limited (AIA) in 2012• Entered into agreement to sell up to 90% of ILFC in 2012• Sold AIG Star and AIG Edison, Nan Shan and MetLife securities in 2011
• Cash distributions from subsidiaries in 2012 and 2011• Amended, extended and increased syndicated, revolving four year credit facility• Growth in book value per share from 2011 to 2012
• AIG note offerings in 2011 and 2012
• AIG Common Stock purchases in 2012• Sale of AIG Common Stock in 2011
$0.7 bn in 2012
$24.6 bn
* AIG did not receive any proceeds from the sale of AIG Common Stock by the Department of the Treasury. The Department of the Treasurystill owns ten-year warrants to purchase approximately 2.7 million shares of AIG Common Stock.
..................................................................................................................................................................................................................................
AIG 2012 Form 10-K 5

.....................................................................................................................................................................................
AIG Property Casualty
Business Strategy
Business Mix Shift:
Underwriting Excellence:
Claims Best Practices:
Operating Expense Discipline:
Capital Management:
..................................................................................................................................................................................................................................
AIG 2012 Form 10-K6
Grow in higher value lines of business and geographies.
Enhance pricing and risk-selection tools through
investments in data mining, science and technology.
Reduce loss costs through new claims technology, a
more efficient and effective operating model and the use of data tools to better
manage the economic drivers of losses.
Decrease recurring operating expenses by
leveraging AIG’s scale and driving increased standardization.
Efficiently allocate capital through the use of risk
adjusted profit metrics, optimization of reinsurance and legal entity
restructuring.
..............................................................................................................................................................................................
..............................................................................................................................................................................................
..............................................................................................................................................................................................
..............................................................................................................................................................................................
..............................................................................................................................................................................................
I T E M 1 / B U S I N E S S / A I G P R O P E R T Y C A S U A L T Y

15FEB201302015798
16FEB201301144436 16FEB201301144901
.....................................................................................................................................................................................
AIG Property Casualty Operating Segments – Products and Services
AIG Property Casualty operating segments are organized into Commercial Insurance and Consumer Insurance.
Run-off lines of business and operations not attributable to these operating segments are included in an Other
operations category.
Percent of 2012 Net premiums written by operating segment*
COMMERCIAL
INSURANCE
59%
CONSUMER
INSURANCE
41%
* The operations reported as part of Other do not have meaningful levels of Net premiums written.
Commercial Insurance Consumer InsurancePercent of 2012 Net premiums written by product line Percent of 2012 Net premiums written by product line(dollars in millions) (dollars in millions)
Specialty
$3,576
Property
$4,191
Casualty
$8,574
Financial
Lines
$3,959
42%
19%18%
21% Personal
Lines
$7,181
Accident
& Health
$6,969
49%51%
Commercial products: Consumer products:
Casualty: Includes general liability, commercial Accident & Health: Includes voluntary and
automobile liability, workers’ compensation, excess sponsor-paid personal accidental and supplemental
casualty and crisis management insurance. Casualty health products for individuals, employees, associations
also includes risk management and other customized and other organizations. It also includes life products
structured programs for large corporate customers and (outside of the U.S. market) as well as a broad range of
multinational companies. travel insurance products and services for leisure and
business travelers.
..................................................................................................................................................................................................................................
AIG 2012 Form 10-K 7
I T E M 1 / B U S I N E S S / A I G P R O P E R T Y C A S U A L T Y
.ab e e eu i vs ness ra e erstb i l
.a a a a a a ao o e e e od d e e o e e dp pu i i i v i u u rvi i um na ona compan es ra e ns rance pro c s an serv ces or e s re ant t t tl i i l i l i d d i l i df
. .a a a a a a a a a aed og o ge o o e o e d o de o e e e b o d ge op pu u u u i ws r c re programs or arge corpora e c s omers an o s e o e mar e as e as a roa range ot t t t t t td l d id h U k ll b df ( f S ) f
.a a a a a a a ao de ge e d o e o ed d o e o g o o de e odpi u i u iz iz i i u i ua so nc es r s managemen an o er c s om e an o er organ a ons a so nc es e pro c st t t t t t tl i l d i k d h i d d h i i I l i l d li df
. , ,a a a a a a a a a a a ad ge e e e od o d d e o ee o op pu y i i i u u y u i ivi u y i icas a an cr s s managemen ns rance as a ea pro c s or n a s emp o ees assoc a onst t t t t tl d i i i l h l h d i di id l l i iC f
, ,a a a a a a a a a-o ob e b o e o e o e e o o d e o de d e ep p p p ppu i i i i y w i x i i ua omo e a or ers compensa on e cess sponsor pa persona acc en a an s pp emen at t t t tbil li bili k ’ i id l id l d l l
,a a a a ade ge e b o e de o du i i i y i u v u ync es genera a commerc a nc es o n ar ant tI l d l li bili i l I l d l d
.....................................................................................................................................................................................
Property: Includes industrial energy-related and Personal: Includes automobile, homeowners and
commercial property insurance products, which cover extended warranty insurance. It also includes insurance
exposures to man-made and natural disasters, including for high-net-worth individuals (offered through Private
business interruption. Client Group), including umbrella, yacht and fine art
insurance, and consumer specialty products, such asSpecialty: Includes aerospace, environmental, political
identity theft and credit card protection.risk, trade credit, surety and marine insurance, and
various product offerings for small and medium sized Distribution: Consumer Insurance products are
enterprises. distributed primarily through agents and brokers, as well
as through direct marketing and partner organizationsFinancial: Includes various forms of professional liability
and through the internet.insurance, including directors and officers (D&O),
fidelity, employment practices, fiduciary liability, network
security, kidnap and ransom, and errors and omissions
insurance (E&O).
Distribution: Commercial Insurance products are
primarily distributed through a network of independent
retail and wholesale brokers and branches, and through
an independent agency network.
Other: Consists primarily of: run-off lines of business; operations and expenses not attributable to the Commercial
Insurance or Consumer Insurance operating segments; unallocated net investment income; net realized capital gains
and losses; and other income and expense items.
AIG Property Casualty conducts its business primarily through the following major operating companies:
National Union Fire Insurance Company of Pittsburgh, Pa.; New Hampshire Insurance Company; American Home
Assurance Company; Lexington Insurance Company; AIU Insurance Company; Chartis Overseas Limited; Fuji;
Chartis Singapore Insurance, Pte, Ltd. and AIG Europe Limited.
A Look at AIG Property Casualty
Global Footprint
AIG Property Casualty has a significant international presence in both developed markets and growth economy
nations. It distributes its products through three major geographic regions:
• Americas: Includes the United States, Canada, Central America, South America, the Caribbean and Bermuda.
• Asia Pacific: Includes Japan and other Asia Pacific nations, including China, Korea, Singapore, Vietnam,
Thailand, Australia and Indonesia.
• EMEA (Europe, Middle East and Africa): Includes the United Kingdom, Continental Europe, Russia, India, the
Middle East and Africa.
In 2012, 6 percent and 5 percent of AIG Property Casualty direct premiums were written in the states of California
and New York, respectively, and 19 percent and 7 percent were written in Japan and the United Kingdom,
respectively. No other state or foreign jurisdiction accounted for more than 5 percent of such premiums.
On November 21, 2012, AIG, People’s Insurance Company (Group) of China Limited (PICC Group) and PICC Life
Insurance Company Limited (PICC Life) entered into a non-binding term sheet with respect to the proposed
establishment of a joint venture insurance agency company between AIG and PICC Life (the Joint Venture) which
plans to distribute life insurance and other insurance products through a specialized agency force on a nationwide
basis with a focus on major cities in China and to engage in reinsurance and other related business cooperation. AIG
..................................................................................................................................................................................................................................
AIG 2012 Form 10-K8
I T E M 1 / B U S I N E S S / A I G P R O P E R T Y C A S U A L T Y
, , . .a a a ag o e e e d d o e edp pi i u u i iar s ngapore ns rance e an rope m eP At t t th i i I P L d d AI E Li i dC S G
; ; ; ; ;a a a a a a a ae o e g o e o e o e e edp p pu y; xi u y; u y; i v i i ; uji;ss rance ompan e ng on ns rance ompan ns rance ompan ar s erseas m eA A Ot t tA L i I AIU I h i Li i d F jiC C C C O
, .; ;a a a a a a a a ao o e e o o b g e e e o e o ep p pi i i u y i u ; w i u y; ia ona n on re ns rance ompan o s rg a e amps re ns rance ompan mer can omeP P At ttN i l U i Fi I Pi b h P N H hi I A i HC f C
; .a a ad o e d o e o e d e e e ep; i x ian osses an o er ncome an e pense emst td l d h i d i
; ;a a a a a a a a ae o o e e o e g eg e o ed e e e o e e e ed gp pu u u i ; u i v i ; iz i ins rance or ons mer ns rance opera ng segmen s na oca e ne n es men ncome ne rea e cap a ga nst t t t t t t tI I i ll d i i li d i l iC
: ;a a a a a a-o o o e o b e o e o d e e e o b b e o e o ep p pi i i y : u i u i ; i x i u ions s s pr mar o r n o nes o s ness opera ons an e penses no a r a e o e ommerc at t t tt t t ti i il li b i i d ib bl h i lC f ffff f C
.a ade e de ge e opi y wan n epen en agenc ne ort ti d d k
,a a a a a ae d o e e b o e d b e d o gi w ure a an o esa e ro ers an ranc es an ro gt til d h l l b k d b h d h h
a ad b ed o g e o o de e dep pi i y i i u u w ipr mar s r e ro g a ne or o n epen ent t t t ti il di ib d h h k i d df
a a ao e e od epi u uommerc a ns rance pro c s areti l I dC
.a &ei uns rance O&i E( &O)
, ,a a a a ae d d o d e o d o opu i y i i isec r nap an ransom an errors an om ss onsti kid d d d i i
, , ,a a ade e o e e d b e op pi i y y i i u i y i i i y we emp o men prac ces c ar a ne ort t t t tid li l i id i li bili kf f
, ,a a &e d g d e o d o ei u i u i i ins rance nc ng rec ors an o cers D O&ti i l di di d i Dffff ( &O).a d o g e e eu ian ro g e n ernet t t td h h h i
a a ade o o o o e o bpu v i u i i i i ync es ar o s orms o pro ess ona a tI l d i i l li bilif f fa a a a a ao g d e e g d e o g opu i i iz ias ro g rec mar e ng an par ner organ a onst t t t th h di k i d i i
. ,a a a ae e e d b ed o g ge d b o e ep pi i i u i i y u wen erpr ses s r e pr mar ro g agen s an ro ers as et t t t ti di ib d i il h h d b k ll
a a a a ao od o e g o d ed ed o e e od ep pv i u u i iu iz u u uar o s pro c o er ngs or sma an me m s e ons mer ns rance pro c s aret ti d i ll d di i d I dffff f C
, , ,a a a a ade ed e d e e di i u y i i ur s ra e cre s re an mar ne ns rance ant t ti k d di d i i d.a ade e d ed d o e opi i y i ien e an cre car pro ec on
, ,t t t ft t t tid i h d di d ift
a a a ade e o e e o e op pu vi i inc es aerospace en ronmen a po cat tI l d i l li i l, ,a a a ae d o e e odp pi u u i y u uns rance an cons mer spec a pro c s s c ast ti d i l d h
. , ,a a a ab e e o e o d g b e d ep pu i i u i i u i u i u y is ness n err p on en ro p nc ng m re a ac an ne art t t t tb i i i li i l di b ll h d iC G ) f
,a a a a a a a a- - -e o e o de d d e d g o g e o d d o e ed o g epx u u i i u i i w i ivi u u ive pos res o man ma e an na ra sas ers nc ng or g ne or n a s o ere ro g r a ePt t t t t t td d l di i l di hi h h i di id l d h h P if ( ffff
, .a a a a a a ao e o e e od o e e e ded e o de ep p pi y i u u w i v x w y i u i u i ucommerc a proper ns rance pro c s c co er e en e arran ns rance a so nc es ns rancet t t t ti l i d hi h d d i I l i l d i
,a a a a a-de d e e g e ed d de o ob e o eo e du i u i y u u i wnc es n s r a energ re a e an nc es a omo e omeo ners ant t tI l d i d i l l d d I l d bil h d

15FEB201317022769
.....................................................................................................................................................................................
Life and Retirement made an equity investment of approximately $0.5 billion in PICC Group. AIG’s participation in the
Joint Venture will be managed by AIG Property Casualty.
Total Net Premiums Written $34.4 bn
Based on net premiums written in 2011, AIG Property Casualty is the largest U.S. commercial insurer in the U.S.
and Canada, the largest U.S. based property casualty insurer in Europe, and the largest foreign property casualty
insurer in Japan and China. In addition, AIG Property Casualty was first to market in many developing nations and
is well positioned to enhance its businesses in countries such as China, India and Brazil.
AmericasU.S./CanadaBermudaLatin America and the Caribbean
$17.6 bn
51%Asia PacificJapanOther Asia Pacific nations
$10.4 bn
30%
EMEAEuropeMiddle EastAfrica
$6.4 bn
19%
Competition
Operating in a highly competitive industry, AIG Property Casualty competes against approximately 3,300 stock
companies, specialty insurance organizations, mutual companies and other underwriting organizations. In
international markets, we compete for business with the foreign insurance operations of large U.S. insurers global
insurance groups and local companies in specific market areas and product types.
Insurance companies compete through a combination of risk acceptance criteria, product pricing, service and terms
and conditions. AIG Property Casualty distinguishes itself in the insurance industry primarily based on its
well-established brand, financial strength and large capital base, innovative products, expertise in providing
specialized coverages and customer service.
..................................................................................................................................................................................................................................
AIG 2012 Form 10-K 9
I T E M 1 / B U S I N E S S / A I G P R O P E R T Y C A S U A L T Y

.....................................................................................................................................................................................
AIG Property Casualty serves its business and individual customers on a global basis – from the largest multinational
corporations to local businesses and individuals. Our clients benefit from our substantial underwriting expertise and
long-term commitment to the markets and clients we serve.
AIG Property Casualty Competitive Strengths and Challenges
Diversification – breadth of customers served, products underwritten and distribution channels
Global franchise – operating in more than 90 countries and jurisdictions
Scale – facilitates risk diversification to optimize returns on capital
Service – focused on customer needs, providing strong global claims, loss prevention and mitigation,
engineering, underwriting and other related services
Expertise – experienced employees complemented with new talent
Financial strength – well capitalized, strong balance sheet
Somewhat offsetting these strengths are the following challenges:
Barriers to entry are high
Regulatory changes in recent years created an increasingly complex environment that is affecting industry
growth and profitability
..................................................................................................................................................................................................................................
AIG 2012 Form 10-K10
I T E M 1 / B U S I N E S S / A I G P R O P E R T Y C A S U A L T Y

.....................................................................................................................................................................................
AIG Life and Retirement
Business Strategy
Grow Assets Under Management: Fully leverage a unified distribution
organization to increase sales of profitable products across all channels.
Capitalize on the growing demand for income solutions and AIG Life and
Retirement’s capital base, risk controls, innovative product designs, expanded
distribution initiatives and financial discipline to grow variable annuity business.
Pursue selected institutional market opportunities where AIG Life and
Retirement’s scale and capital base provide a competitive advantage...............................................................................................................................................................................................
Increase Life Insurance In-Force: Develop innovative life offerings through
consumer focused research that delivers superior, differentiated product
solutions. Consolidate life insurance platforms, operations and systems to
create a more efficient, cost-competitive and agile operating model...............................................................................................................................................................................................
Enhance Return on Equity: Build on simplified legal entity structure to
enhance financial strength and durability, capital efficiency and ease of doing
business. Improve operational efficiencies, expense control and service through
investments in technology and more productive use of existing resources and
lower-cost operations centers...............................................................................................................................................................................................
..................................................................................................................................................................................................................................
AIG 2012 Form 10-K 11
AIG Life and Retirement is focused on the following strategic initiatives:
I T E M 1 / B U S I N E S S / A I G L I F E A N D R E T I R E M E N T

15FEB201302015240
.....................................................................................................................................................................................
Operating Segments
AIG Life and Retirement currently has two operating segments: Life Insurance focuses on life insurance and related
protection products and Retirement Services focuses on investment, retirement savings and income solution
products. On April 12, 2012, AIG Life and Retirement announced several key organizational structure and
management changes intended to better serve the organization’s distribution partners and customers. Key aspects of
the new structure are distinct product divisions, shared annuity and life operations platforms and a unified all-channel
distribution organization with access to all AIG Life and Retirement products.
AIG Life and Retirement expects to modify its presentation of results to reflect its new structure when the reporting
changes are implemented in the first quarter of 2013 and conform all prior periods’ presentations to reflect the new
structure. The new structure will include two operating segments – Retail and Institutional. Retail product lines will
include life insurance and accident and health (A&H), fixed annuities, variable annuities and income solutions,
brokerage services and retail mutual funds. Institutional product lines will include group retirement, group benefits and
institutional markets. The institutional markets product line will consist of stable value wrap products, structured
settlement and terminal funding annuities, private placement variable life and annuities, guaranteed investment
contracts and corporate and bank-owned life insurance.
Additionally, AIG Life and Retirement completed the merger of six life insurance operating legal entities into American
General Life Insurance Company effective December 31, 2012. This merger facilitates capital and dividend planning
while creating operating efficiencies and making it easier for producers and customers to do business with AIG Life
and Retirement. AIG Life and Retirement will continue to market products and services under its existing brands.
AIG Life and Retirement Operating Segments – Products and Services
Percent of 2012 total revenue by operating segment (dollars in millions)
LIFE
INSURANCE
$9,509
57%
RETIREMENT
SERVICES
$7,258
43%
..................................................................................................................................................................................................................................
AIG 2012 Form 10-K12
I T E M 1 / B U S I N E S S / A I G L I F E A N D R E T I R E M E N T

15FEB20131738093615FEB201317380803
.....................................................................................................................................................................................
Life Insurance Retirement Services
Percent of 2012 Premiums, Deposits and other Percent of 2012 Premiums, Deposits and other
considerations by line of business considerations by line of business
(dollars in millions) (dollars in millions)
Brokerage
services and
retail mutual
funds$2,723
Group
retirement
products$7,028
Fixed
annuities$1,495
Variable
annuities$4,561
10%
17%44%
29%
Life insurance
and A&H
products$3,354
Group
benefits$680
Institutional
products$775
Other*$320
15%
66%
13%
6%
* Other includes fixed, equity indexed and runoff annuities.
Products include a full line of life insurance, deferred Products and services focus on investment, retirement
and payout annuities, A&H products, worksite and group savings and income solution products.
benefits.
AIG Life and Retirement is one of the largest life insurance organizations in the UnitedStates and is a leader in today’s financial services marketplace.
AIG Life and Retirement holds leadership positions in both retail and institutional markets:
• Long-standing leadership position in fixed annuity sales through banks and other financial institutions
• Innovator in guaranteed income solutions and a top provider of variable annuities
• Industry-leading life and accident and health products
• Broad range of retail mutual fund offerings
• One of the largest independent broker-dealer networks in the country
• Leading retirement plan provider in K-12 schools, higher education, healthcare, government and other
nonprofit entities
• Institutional Markets offerings, including leadership position in structured settlement annuities
• Extensive lineup of group benefits offered in worksites and through affinity organizations
..................................................................................................................................................................................................................................
AIG 2012 Form 10-K 13
I T E M 1 / B U S I N E S S / A I G L I F E A N D R E T I R E M E N T
.....................................................................................................................................................................................
Life Insurance Retirement Services
The Life Insurance operating segment offers a broad The Retirement Services operating segment provides
range of protection and mortality-based products. These investment, retirement and income solutions products
products are marketed under four principal brands – and services. These products and services are
American General, AGLA, AIG Direct and AIG Benefit marketed through a variety of brands described below.
Solutions.
Group Retirement: Products are marketed under the
Life Insurance and A&H: Primary products include Variable Annuity Life Insurance Company (VALIC)
term life insurance, universal life insurance and A&H brand and include fixed and variable group annuities,
products. Life insurance and A&H products are group mutual funds, and group administrative and
distributed through independent marketing organizations compliance services. VALIC career financial advisors
and independent insurance agents under the American and independent financial advisors provide retirement
General brand. Career agents distribute Life Insurance plan participants with enrollment support and
and A&H products under the AGLA brand. American comprehensive financial planning services.
General and AGLA will continue to focus on innovative
product development and delivering differentiated Fixed Annuities: Products are primarily marketed
product solutions to producers and customers. AIG under the Western National brand and include single
Direct (formerly known as Matrix Direct) is a proprietary and flexible premium deferred fixed annuities. Western
direct-to-consumer distributor of term life insurance and National maintains its leading industry position in the
A&H products. bank distribution channel by designing products in
cooperation with banks and offering an efficient and
Institutional: Products primarily include structured flexible administration platform.
settlement and terminal funding annuities, fixed payout
annuities, private placement variable annuities and Variable Annuities: Products are marketed under the
variable life insurance, corporate-owned life insurance, SunAmerica Retirement Markets (SARM) brand and are
bank-owned life insurance, and stable value wrap designed to provide customers with retirement income.
products. These products are marketed under the Customers may choose among a wide range of variable
American General brand through independent marketing annuities offering diverse investment options and
organizations and structured settlement brokers. product features, including stock and fixed income
Institutional Markets has a disciplined and opportunistic portfolios, guaranteed death benefits and various
approach to growth in these product lines. guaranteed retirement income solutions. Variable
annuity products are distributed through banks and
Group Benefits: In 2012, AIG Life and Retirement and national, regional and independent broker-dealer firms.
AIG Property Casualty combined their U.S. group
benefits businesses and operate as AIG Benefits Brokerage Services: Includes the operations of Advisor
Solutions. This business will continue to market a wide Group, which is one of the largest networks of
range of insurance and benefits products for employees independent financial advisors in the U.S. Brands
(both employer paid and voluntary) and affinity groups. include Royal Alliance, SagePoint, FSC Securities and
Primary product offerings include life insurance, Woodbury Financial, which we acquired in November
accidental death, business travel accident, disability 2012 for $48 million after purchase price adjustments.
income, medical excess (stop loss), dental, vision and
worksite universal life, critical illness and accident. Retail Mutual Funds: Includes the mutual fund and
related administration and servicing operations of
SunAmerica Asset Management.
AIG Life and Retirement conducts its business primarily through three major insurance operating companies:
American General Life Insurance Company, The Variable Annuity Life Insurance Company and The United States
Life Insurance Company in the City of New York.
..................................................................................................................................................................................................................................
AIG 2012 Form 10-K14
I T E M 1 / B U S I N E S S / A I G L I F E A N D R E T I R E M E N T
.a a ae e ge eu in mer ca sse anagemenA A t tA i A MS
a a a a ae ed d o d e g o e o opi i i rvi i ire a e a m n s ra on an serv c ng opera ons ot t t tl d d i i i d i i i f
, .a a a a a ao e e e e d de de e d dw i u iv i i i i i u u u uor s e n ersa e cr ca ness an acc en nc es e m a n ant t t t tk i i l li i i l ill d id I l d h l d df f
, , ,a a ao e ed e e o o de o dpi i x vi income me ca e cess s op oss en a s on ant ti di l l d l i i d( )
, , .a a a a a a a a a$ 8de de b e e de d b o o e e e d ep pi u i v i i i i y i i u i juacc en a ea s ness ra e acc en sa or m on a er p rc ase pr ce a s men s40 8$t t t t t ft t tid l d h b i l id di bili 4 illi h i dj2012 8f ft$
, ,a a a a aod o e g de e e oodb e ed o e bep qi y u i i u i i u u y i i w i w ui i vr mar pro c o er ngs nc e e ns rance oo r nanc a c e acq re n o em erP tP i d i i l d li i W db Fi i l hi h i d i N bffff f
. , ,a a a a a a a a abo e o e d d o d g o de o e ge o e e dp p py i v u y i i y u i u y i i u i io emp o er pa an o n ar an a n gro ps nc e o a ance age o n ec r es anPR At t t t tb h l id d l d i i i l d R l Alli P i F i i d( ) ffff S SC S
. .a a a a a a aBge o e d be e od o e o ee de e de d o e dp p pi u i u y i i i vi irange o ns rance an ene s pro c s or emp o ees n epen en nanc a a sors n e ran sBt t t ti d b i d l i d d i i l d i i h U B df f f f S
. ,a a ao o b e o e o e de o o e o e ge e o opu i i u i wi i u wi u w i i wo ons s s ness con n e o mar e a e ro p c s one o e arges ne or s ot t t t t t tl i Thi b i ill i k id hi h i h l kS G f f
a a a aBbe e b e e d o e e e e de e o e o o d op pi u i i u i viene s s nesses an opera e as ene s nc es e opera ons o sorBA At t t t tb i b i d AI B i I l d h i Ad if G f f
. .a ao e o b ed e g op py u y i i uroper as a com ne e r gro pPA t t tAI P l bi d h i UG C S
, , .a a a a a a a-e d e e e d o eg o d de e de b o e de epi i i i i in e an e remen an na ona reg ona an n epen en ro er ea er rmsRA0 t t t tI AI Li d R i d i l i l d i d d b k d l i2012 G f f
a a a aod e d b ed o g b dpui y u i i u uann pro c s are s r e ro g an s ant t t t ti d di ib d h h b k d
. .a a a a a ao o g o e e od e g eed e e e o e o o b epp pw i u i u i i u i iapproac o gro n ese pro c nes g aran ee re remen ncome so ons ar a et t t t t t t th h i h d li d i i l i V i bl
,a a a a a a a a a ao e d ed d o o o o o g eed de be e d op pp pi u i i i i u i i i u i v i uns ona ar e s as a sc p ne an oppor n s c por o os g aran ee ea ene s an ar o st t t t t t t t t tI i i l M k h di i li d d i i li d d h b i d if f
. ,a a a a ao g o d ed e e e b o e od e e d g o d ed o epiz i u u u u i u i ix iorgan a ons an s r c re se emen ro ers pro c ea res nc ng s oc an e ncomet t t tt t t t ti i d d l b k d i l di k d i d if f
a a a a a ae e e b d o g de e de e g e o e g d e e e e o o dp pi u i i ui i i iv i v imer can enera ran ro g n epen en mar e ng ann es o er ng erse n es men op ons anA t t t t t t tA i l b d h h i d d k i i i i di i i dG ffff
. a a a a a a a aod e e od e e ed de e o e oo e o g de ge o b ep pu u u u y wi v ipro c s ese pro c s are mar e e n er e s omers ma c oose among a e range o ar a et t t t td Th d k d d h h id i blC f
, .a a a a a a-b o ed e e d b e e de g ed o o de o e e e e o ep pw i i u v u w i vi u wi i ian o ne e ns rance an s a e a e rap es gne o pro e c s omers re remen ncomet t t t t tb k d li i d bl l d i d id i h i if
, ,a a a a a a a a a a-b e e e o o e o ed e e e e e e e b d d epv i i i u w i i u u i iar a e e ns rance corpora e o ne e ns rance n mer ca e remen ar e s ran an areR RA At t t ti bl li i d li i A i R i M k ARM b d df f S (S )
,a a a a a a a a ae e e e b e e d od e e ed de ep pui i iv v i ui i u uann es pr a e p acemen ar a e ann es an ro c s are mar e e n er ePt t t t t t ti i i l i bl i i d P d k d d h
,a a a ae e e d e d g e ed opi u i ui i ix y use emen an erm na n ng ann es e pa ott t t t tl d i l di i i i df f
.a a a aod de ed e b e d o op pu i i y i u u u xi i i iro c s pr mar nc e s r c re e e a m n s ra on p a ormP t t t t t tP d i il i l d d l ibl d i i i lf f
a a a a aoo e o b d o e g e e dp i wi i i icoopera on an s an o er ng an e c en ant t ti i h b k d i i i dffff ffff
. a a& od b d b o e b de g g odp pu i i u i y i i u ipro c s an s r on c anne es gn ng pro c s nA& t t t tA H d b k di ib i h l b d i i d i&
a a a a a a a- -d e o o e d b o o e e e d o e d g d o o epi u i i u i i u i i i i i i u y i i irec o cons mer s r or o erm e ns rance an a ona ma n a ns s ea ng n s r pos on n et t t t t t t t t t tdi di ib li i d N i l i i i l di i d i i i hf f
.a a a a a ae o e o e o e d e b e e de e ed ed e e ep p pi y w ix i i i y xi iu ix ui irec ormer no n as a r rec s a propr e ar an e e prem m e erre e ann es es ernD Dt t t t t tDi l k M i Di i i d l ibl i d d i d i i W(f ) f f f
.a a a a aod o o o od e d o e de e e e o b d d de g ep pu u i u u u i i u ipro c so ons o pro cers an c s omers n er e es ern a ona ran an nc e s ng eAt t t t t t td l i d d AI d h W N i l b d d i l d i lG
a a a a aod de e o e d de e g d e e ed od e e edp p pu v iv i i i u i i ypro c e e opmen an e er ng eren a e ro c s are pr mar mar e ePt t t t t td d l d d li i di i d P d i il k dffff
a a ae e d o e o o o o ewi i u u i v ivenera an con n e o oc s on nno a eA A t t tl d A LA ill i i iG G f
. .a a a a a a&d od de e b d e o e e e g e ep p pu u i iv i i i rvian pro c s n er e ran mer can compre ens e nanc a p ann ng serv cesA A A A& t td A H d d h A LA b d A i h i i i l l i i& G f
.a a a a a a a a ae e b d ee ge d b e e e e o e o dp p p ppi i u i u i i wi uenera ran areer agen s s r e e ns rance p an par c pan s enro men s ppor ant t t t t t t tl b d di ib Li I l i i i h ll dG C f
a a a a a a a ad de e de e ge de e e d de e de d o o de e e ep p pi i u u i i i i vi vi ian n epen en ns rance agen s n er e mer can an n epen en nanc a a sors pro e re remenAt t t t t td i d d i d h A i d i d d i i l d i id if
.a a a a a a a ad b ed o g de e de e g o g o o e e e ee d op pi i u u i i iz i i rvi i i vis r e ro g n epen en mar e ng organ a ons comp ance serv ces career nanc a a sorsAt t t t t tdi ib d h h i d d k i i i li i VALI i i l d iC f
. ,a a a a a a a a&od e e d od e g o d d g o d e dp p p pu i i u u u u u u u i i ivpro c s e ns rance an pro c s are gro p m a n s an gro p a m n s ra e anA&t t t t td Li i d A H d l d d d i i i df & f
, ,a a a a a a a a a a&e e e e e e d b d d de ed d b e g o epi i u u iv i i u i u ix v i u ui ierm e ns rance n ersa e ns rance an ran an nc e e an ar a e gro p ann esA&t tli i i l li i d A H b d d i l d i d d i bl i if f & f
a a a a aod de b e e e op pi y u i u i ui y i u yr mar pro c s nc e ar a e nn e ns rance ompanP A At tP i d i l d V i bl A i Li I VALIf C ( C)
a aod e e ed de eu uro c s are mar e e n er eP t t tP d k d d h

15FEB201302020659
.....................................................................................................................................................................................
AIG Life and Retirement 2012 Premiums and Premiums, Deposits and Other Considerations
Premiums represent amounts received on traditional life insurance policies, group benefit policies and deposits on life
contingent payout annuities. Premiums, deposits and other considerations is a non-GAAP measure that includes life
insurance premiums and deposits on annuity contracts and mutual funds.
See Item 7. MD&A – Result of Operations – AIG Life and Retirement Operations – Premiums for a reconciliation of
premiums, deposits and other considerations to premiums.
A Look at AIG Life and Retirement
AIG Life and Retirement 2012 Sales by Distribution Channel(dollars in millions)
VALIC
financial
advisors
$684
AIG Direct
& other
$70
AGLA
career
agents
$88
Advisor
group
$48Benefit
brokers
$77 Banks
$259
Independent
marketing
organizations
$236
Broker dealers
$589
Affiliated Non-Affiliated43% 57%
33%
29%
11%13%
4%2%
5%
3%
Represents life and group A&H premiums from new policies expected to be collected over a one-year period plus
10 percent of life unscheduled deposits, single premiums and annuity deposits from new and existing customers.
..................................................................................................................................................................................................................................
AIG 2012 Form 10-K 15
I T E M 1 / B U S I N E S S / A I G L I F E A N D R E T I R E M E N T

.....................................................................................................................................................................................
AIG Life and Retirement’s Diversified Distribution Network
Affiliated Nonaffiliated
VALIC career financial advisors Over 1,200 Banks Nearly 600 banks and 69,000 financial
financial advisors serving the worksites of institution agents
educational, not-for-profit and governmental
organizations Independent marketing organizations
Relationships with over 1,700 independent marketing
AGLA career agents Over 3,100 agents focused on organizations and brokerage general agencies
the broad middle market providing access to over 150,000 licensed
independent agents
Advisor Group Over 6,000 independent financial
advisors Broker dealers Access to over 120,000 licensed
financial professionals
AIG Direct A leading direct-to-consumer distributor of
life and A&H products Benefit brokers Include consultants, brokers, third
party administrators and general agents
Competition and Customer Marketing Strengths
AIG Life and Retirement competes against approximately 1,800 providers of life insurance and retirement savings
products, including other large, well-established life insurance companies and other financial services companies. Life
insurance companies compete through a combination of risk-acceptance (underwriting) criteria, product pricing,
service, and terms and conditions. Retirement services companies also compete through crediting rates and through
offering guaranteed benefits features.
AIG Life and Retirement competes in the life insurance and retirement savings businesses primarily based on its
well-established brands, innovative products, extensive distribution network, customer service and strong financial
ratings. AIG Life and Retirement helps ensure financial and retirement security for more than 18 million customers.
..................................................................................................................................................................................................................................
AIG 2012 Form 10-K16
I T E M 1 / B U S I N E S S / A I G L I F E A N D R E T I R E M E N T
a a a a a ad o d ge e gep y i ipar a m n s ra ors an genera agen st t t td i i d l
, ,a a&e d od de o b o e dpi u u u ie an pro c s nc e cons an s ro ers rA& t t t tli d A H d I l d l b k hi df &
a - -e d g d e o o e d b o oi i u i i uea ng rec o cons mer s r or oA t t t tA l di di di ib f
a a ao e opi i inanc a pro ess ona si i l i lf f
,ad o e o o e e edvi v ia sors ccess o o er censeA 0 000td i A li d120 000
, a a6e de e depv i i ier n epen en nanc aO 000 ti d d i i l6 000O f
ade e de gepin epen en agen st ti d d
,a a ae b o d dd e e o d g e o o e e edpi vi i v ie roa m e mar e pro ng access o o er cense0 000t t t 5h b d iddl k idi li d1 0 000
, a a a a a a ae ge o ed o o g o d b o e ge ge e ge ev u iz i ier agen s oc se on organ a ons an ro erage genera agenc esO 00 t td i i d b k l i3 100O f
,a ae o o e de e de e gp pi i wi v i ie a ons ps o er n epen en mar e ngR 00t t t t7R l i hi i h i d d k i1 00
a ao g oiz iorgan a onsti i
,a a a a- -ed o o o o d go e epu i i ve ca ona no or pro an go ernmen at t t td i l i d lf f
a a a ad o e g e o e o o gei i vi rvi w i i i u inanc a a sors serv ng e or s es o ns on agen st t t t t ti i l d i i h k i i i if f
, ,a a a a a6 6e e b dv y i ier ear an s an nanc aO 00 00 9 000N l b k d i i l1 200 600 69 000O f

.....................................................................................................................................................................................
AIG Life and Retirement Competitive Strengths
• Leading life insurance and retirement brands
• Diversified product mix
• Broad multi-channel distribution network
• Financial strength
AIG Life and Retirement is an established leader with well-regarded brands in the markets it serves. AIG Life
and Retirement has the scale and breadth of product knowledge to deliver effective solutions across a range of
markets.
AIG Life and Retirement has an expansive product suite including life insurance, accident and health, annuity,
mutual fund, group retirement, group benefit and institutional products as well as other solutions to help provide a
secure future for our customers.
AIG Life and Retirement’s distribution footprint covers a broad expanse of the U.S. market. AIG Life and
Retirement products are sold by over 300,000 financial professionals across an extensive and growing multichannel
network of financial advisors and insurance agents that spans both affiliated and non-affiliated partners.
AIG Life and Retirement’s financial profile is strong and stable, giving customers confidence in AIG Life and
Retirement’s ability to meet financial obligations associated with its retirement and insurance products.
Somewhat offsetting these strengths are regulatory changes in recent years, which have created an increasingly
complex environment that is affecting industry growth and profitability.
..................................................................................................................................................................................................................................
AIG 2012 Form 10-K 17
I T E M 1 / B U S I N E S S / A I G L I F E A N D R E T I R E M E N T

.....................................................................................................................................................................................
Other Operations
offers private residential mortgage guaranty insurance,
which protects mortgage lenders and investors from loss due to borrower default and loan foreclosure. With over
1,100 employees, United Guaranty currently insures over one million mortgage loans in the United States and has
operations in nine other countries. In 2012, United Guaranty generated more than $37 billion in new insurance
written, which represents the original principal balance of the insured mortgages, becoming the leading provider of
private mortgage insurance in the United States and is the highest rated private mortgage insurance company in the
U.S.
Mortgage Guaranty Business Strategy
Risk Selection: Ensure the high quality of our business through a continuous focus on risk
selection and risk based pricing using a proprietary, multi-variant risk evaluation model and
disciplined underwriting approach...............................................................................................................................................................................................
Innovation: Focus on innovation through the development and enhancement of products,
technology, and processes, addressing the needs of stakeholders in the mortgage system...............................................................................................................................................................................................
Ease of Use: Eliminate complexity in the mortgage insurance system to create growth
without sacrificing disciplined risk selection and management...............................................................................................................................................................................................
Expense Management: Streamline our processes through the use of technology and shared
services to more quickly react to the changing dynamics of the mortgage industry...............................................................................................................................................................................................
Mortgage Guaranty Insurance
Products and Services: United Guaranty provides an array of products and services including first-lien mortgage
guaranty insurance in a range of premium payment plans. United Guaranty’s primary product is private mortgage
insurance. The coverage we provide – which is called mortgage guaranty insurance, mortgage insurance, or simply
‘‘MI’’ – enables borrowers to purchase a house with a modest down payment. This is because MI protects lenders
against the increased risk of borrower default related to high loan-to-value (LTV) mortgages – those with less than
20 percent equity. In short, MI lets lenders provide more mortgage loans to more people.
Homeowner Support: United Guaranty also works with homeowners who are behind on their mortgage payments
to identify ways to retain their home. As a liaison between the borrower and the mortgage servicer, United Guaranty
provides the added support to qualified homeowners to help them avoid foreclosure.
Mortgage Guaranty (United Guaranty Corporation or UGC)
..................................................................................................................................................................................................................................
AIG 2012 Form 10-K18
I T E M 1 / B U S I N E S S / O T H E R O P E R A T I O N S

.....................................................................................................................................................................................
A Look at Mortgage Guaranty
Mortgage Guaranty Distribution Channels
• National Mortgage Bankers • Community Banks
• Money Center Banks • State Housing Finance Agencies
• Regional Mortgage Lenders • Builder-owned Mortgage Lenders
• Credit Unions • Internet-sourced lenders
Mortgage Guaranty Competition and Competitive Strengths
United Guaranty competes with six private providers of mortgage insurance, both well-established and new entrants
to the industry, and The Federal Housing Administration, which is the largest provider of mortgage insurance in the
United States.
The United Guaranty brand has 50 years of history and is well regarded in the industry. We differentiate ourselves
through our financial strength, our risk based pricing strategy, which provides for lower premiums for lower risk
mortgages, our innovative products and our rigorous approach to risk management. Despite these strengths there
are potential challenges arising in the mortgage market from increasingly complex regulations relating to mortgage
originations as well as uncertainty in the government’s involvement in the domestic residential housing finance
system in the future. These challenges may have an adverse impact on our business.
Other operations also include:
consist of the operations of AIG Markets, Inc. (AIG Markets) and the remaining
derivatives portfolio of AIG Financial Products Corp. and AIG Trading Group Inc. and their respective subsidiaries
(collectively AIGFP). AIG Markets acts as the derivatives intermediary between AIG and its subsidiaries and third
parties to provide hedging services. The AIGFP portfolio continues to be wound down and is managed consistent
with AIG’s risk management objectives. Although the portfolio may experience periodic fair value volatility, it consists
predominantly of transactions that AIG believes are of low complexity, low risk or currently not economically
appropriate to unwind based on a cost versus benefit analysis.
consists of a portfolio of assets and liabilities held directly by AIG Parent in the
Matched Investment Program (MIP) and certain subsidiaries not related to AIG’s core insurance operations (including
certain non-derivative assets and liabilities of AIGFP). The management of the DIB portfolio is focused on an orderly
wind down to maximize returns consistent with AIG’s risk management objectives. Certain non-derivative assets and
liabilities of the DIB are accounted for under the fair value option and thus operating results are subject to periodic
market volatility.
includes the fair value gains or losses, prior to their sale, of the AIA ordinary shares retained
following the AIA initial public offering and the MetLife, Inc. (MetLife) securities that were received as consideration
from the sale of American Life Insurance Company (ALICO) and the fair value gains or losses, prior to the FRBNY
liquidation of ML III assets, on the retained interest in ML III.
Global Capital Markets (GCM)
Direct Investment Book (DIB)
Retained Interests
..................................................................................................................................................................................................................................
AIG 2012 Form 10-K 19
I T E M 1 / B U S I N E S S / O T H E R O P E R A T I O N S

.....................................................................................................................................................................................
consist primarily of interest expense, intercompany interest income that is eliminated
in consolidation, expenses of corporate staff not attributable to specific reportable segments, certain expenses related
to internal controls and the financial and operating platforms, corporate initiatives, certain compensation plan
expenses, corporate level net realized capital gains and losses, certain litigation-related charges and credits, the
results of AIG’s real estate investment operations and net gains and losses on sale of divested businesses and
properties that did not meet the criteria for discontinued operations accounting treatment.
We have divested a number of businesses since 2009 in connection with our strategies to
focus on core businesses, repay governmental support, and improve our financial flexibility and risk management.
Divested businesses include the historical results of divested entities that did not meet the criteria for discontinued
operations accounting treatment.
Divested businesses include the historical results of AIA through October 29, 2010 and AIG’s remaining consumer
finance business, discussed below. In the third quarter of 2010, AIG completed an initial public offering of ordinary
shares of AIA. Upon completion of this initial public offering, AIG owned approximately 33 percent of the outstanding
shares of AIA. Because of this ownership position in AIA, as well as AIG’s prior representation on the AIA board of
directors, AIA was not presented as a discontinued operation.
On December 9, 2012, AIG entered into an agreement to sell 80.1 percent of ILFC for approximately $4.2 billion in
cash, with an option for the purchaser to buy an additional 9.9 percent stake. The sale is expected to be
consummated in 2013. The operating results for ILFC are reflected as a discontinued operation in all periods
presented and its assets and liabilities have been classified as held for sale at December 31, 2012.
On August 18, 2011, AIG closed the sale of Nan Shan Life Insurance Company, Ltd. (Nan Shan). On February 1,
2011, AIG closed the sale of AIG Star Life Insurance Co., Ltd. (AIG Star) and AIG Edison Life Insurance Company
(AIG Edison). The operating results for Nan Shan, AIG Star and AIG Edison through the dates of their respective
sales are reflected as discontinued operations in all periods prior to 2012.
In the fourth quarter of 2010, AIG closed the sales of ALICO and American General Finance, Inc. (AGF). Periods
prior to 2011 reflect ALICO and AGF as discontinued operations.
Additionally, following the classification of AGF as a discontinued operation in the third quarter of 2010, AIG’s
remaining consumer finance business, which is primarily conducted through the AIG Federal Savings Bank and the
Consumer Finance Group in Poland, is now reported in AIG’s Other operations category as part of Corporate &
Other.
A REVIEW OF LIABILITY FOR UNPAID CLAIMS AND CLAIMS ADJUSTMENT EXPENSE..............................................................................................................................................................................................
The liability for unpaid claims and claims adjustment expenses represents the accumulation of estimates for unpaid
reported claims and claims that have been incurred but not reported (IBNR) for our AIG Property Casualty
subsidiaries and Mortgage Guaranty. Unpaid claims and claims adjustment expenses are also referred to as unpaid
loss and loss adjustment expenses, or just loss reserves.
We recognized as assets the portion of this liability that will be recovered from reinsurers. Reserves are discounted
for future expected investment income, where permitted, in accordance with U.S. GAAP.
Corporate & Other Operations
Divested Businesses
..................................................................................................................................................................................................................................
AIG 2012 Form 10-K20
Discontinued Operations consist of entities that were sold, or are being sold, that met specific
accounting criteria discussed in Note 4 to the Consolidated Financial Statements.
I T E M 1 / B U S I N E S S / O T H E R O P E R A T I O N S

.....................................................................................................................................................................................
The Loss Reserve Development Process
The process of establishing the liability for unpaid losses and loss adjustment expenses is complex and imprecise
because it must take into consideration many variables that are subject to the outcome of future events. As a result,
informed subjective estimates and judgments about our ultimate exposure to losses are an integral component of our
loss reserving process.
We use a number of techniques to analyze the adequacy of the Because reserve estimatesestablished net liability for unpaid claims and claims adjustment expense
are subject to the outcome of(net loss reserves). Using these analytical techniques, we monitor the
adequacy of AIG’s established reserves and determine appropriate future events, changes inassumptions for inflation and other factors influencing loss costs. Our
prior year estimates areanalysis also takes into account emerging specific development patterns,
unavoidable in the insurancesuch as case reserve redundancies or deficiencies and IBNR emergence.
We also consider specific factors that may impact losses, such as industry. These changes inchanging trends in medical costs, unemployment levels and other
estimates are sometimeseconomic indicators, as well as changes in legislation and social attitudes
that may affect decisions to file claims or the magnitude of court awards. referred to as ‘‘lossSee Item 7. MD&A – Critical Accounting Estimates for a description of our
development’’ or ‘‘reserveloss reserving process.
development.’’A significant portion of AIG Property Casualty’s business is in the U.S.
commercial casualty class, which tends to involve longer periods of time
for the reporting and settlement of claims and may increase the risk and
uncertainty with respect to our loss reserve development.
Analysis of Consolidated Loss Reserve Development
The ‘‘Analysis of Consolidated Loss Reserve Development’’ table shown on page 22 presents the development of
prior year net loss reserves for calendar years 2002 through 2012 for each balance sheet in that period. The
information in the table is presented in accordance with reporting requirements of the Securities and Exchange
Commission (SEC). This table should be interpreted with care by those not familiar with its format or those who are
familiar with other loss development analyses arranged in an accident year or underwriting year basis rather than the
balance sheet, as shown below. See Note 13 to the Consolidated Financial Statements.
The top row of the table shows Net Reserves Held (the net liability for unpaid claims and claims adjustment
expenses) at each balance sheet date, net of discount. This liability represents the estimated amount of losses and
loss adjustment expenses for claims arising in all years prior to the balance sheet date that were unpaid as of that
balance sheet date, including estimates for IBNR claims. The amount of loss reserve discount included in the net
reserves at each date is shown immediately below the net reserves held. The undiscounted reserve at each date is
equal to the sum of the discount and the net reserves held.
For example, Net Reserves Held (Undiscounted) was $30.8 billion at December 31, 2002.
The next section of the table shows the original Net Undiscounted Reserves re-estimated over 10 years. This
re-estimation takes into consideration a number of factors, including changes in the estimated frequency of reported
claims, effects of significant judgments, the emergence of latent exposures, and changes in medical cost trends. For
example, the original undiscounted reserve of $30.8 billion at December 31, 2002, was re-estimated to $58.0 billion
at December 31, 2012. The amount of the development related to losses settled or re-estimated in 2012, but incurred
in 2009, is included in the cumulative development amount for years 2009, 2010 and 2011. Any increase or decrease
in the estimate is reflected in operating results in the period in which the estimate is changed.
..................................................................................................................................................................................................................................
AIG 2012 Form 10-K 21
I T E M 1 / B U S I N E S S

.....................................................................................................................................................................................
The middle of the table shows Net Redundancy/(Deficiency). This is the aggregate change in estimates over the
period of years covered by the table. For example, the net loss reserve deficiency of $27.1 billion for 2002 is the
difference between the original undiscounted reserve of $30.8 billion at December 31, 2002 and the $58.0 billion of
re-estimated reserves at December 31, 2012. The net redundancy/(deficiency) amounts are cumulative; in other
words, the amount shown in the 2011 column includes the amount shown in the 2010 column, and so on. Conditions
and trends that have affected development of the liability in the past may not necessarily occur in the future.
Accordingly, it generally is not appropriate to extrapolate future development based on this table.
The bottom portion of the table shows the Paid (Cumulative) amounts during successive years related to the
undiscounted loss reserves. For example, as of December 31, 2012, AIG had paid a total of $47.9 billion of the
$58.0 billion in re-estimated reserves for 2002, resulting in Remaining Reserves (Undiscounted) of $10.1 billion for
2002. Also included in this section are the Remaining Reserves (Undiscounted) and the Remaining Discount for
each year.
The following table presents loss reserves and the related loss development 2002 through 2012 and
consolidated gross liability (before discount), reinsurance recoverable and net liability recorded for each
calendar year, and the re-estimation of these amounts as of December 31, 2012.(a)
(in millions) 2002 2003 2004 2005 2006 2007 2008 2009 2010 2011 2012
Net Reserves Held(b) $ 29,347 $ 36,228 $ 47,253 $ 57,476 $62,630 $ 69,288 $ 72,455 $67,899 $71,507 $70,825 $68,782Discount (in Reserves Held) 1,499 1,516 1,553 2,110 2,264 2,429 2,574 2,655 3,217 3,183 3,246
Net Reserves Held (Undiscounted) 30,846 37,744 48,806 59,586 64,894 71,717 75,029 70,554 74,724 74,008 $72,028
Net undiscounted Reserve re-estimated as of:One year later 32,913 40,931 53,486 59,533 64,238 71,836 77,800 74,736 74,919 74,429Two years later 37,583 49,463 55,009 60,126 64,764 74,318 82,043 74,529 75,502Three years later 46,179 51,497 56,047 61,242 67,303 78,275 81,719 75,187Four years later 48,427 52,964 57,618 63,872 70,733 78,245 82,422Five years later 49,855 54,870 60,231 67,102 70,876 79,098Six years later 51,560 57,300 63,348 67,518 71,572Seven years later 53,917 60,283 63,928 68,233Eight years later 56,827 60,879 64,532Nine years later 57,410 61,449Ten years later 57,967
Net Deficiency on net reserves held (27,121) (23,705) (15,726) (8,647) (6,678) (7,381) (7,393) (4,633) (778) (421)Net Deficiency related to A&E (4,042) (3,970) (2,965) (2,036) (1,827) (1,809) (1,759) (1,607) (106) (76)Net Deficiency excluding A&E (23,079) (19,735) (12,761) (6,611) (4,851) (5,572) (5,634) (3,026) (672) (345)
Paid (Cumulative) as of:One year later 10,775 12,163 14,910 15,326 14,862 16,531 24,267 15,919 17,661 19,235Two years later 18,589 21,773 24,377 25,152 24,388 31,791 36,164 28,428 30,620Three years later 25,513 28,763 31,296 32,295 34,647 40,401 46,856 38,183Four years later 30,757 33,825 36,804 40,380 40,447 48,520 53,616Five years later 34,627 38,087 43,162 44,473 46,474 53,593Six years later 37,778 42,924 46,330 49,552 50,391Seven years later 41,493 45,215 50,462 52,243Eight years later 43,312 48,866 52,214Nine years later 46,622 50,292Ten years later 47,856
Remaining Reserves (Undiscounted) 10,111 11,157 12,318 15,990 21,181 25,505 28,806 37,004 44,882 55,194Remaining Discount 876 993 1,087 1,203 1,362 1,589 1,869 2,203 2,535 2,899
Remaining Reserves $ 9,235 $ 10,164 $ 11,231 $ 14,787 $19,819 $ 23,916 $ 26,937 $34,801 $42,347 $52,295
Net Liability, End of Year $ 30,846 $ 37,744 $ 48,806 $ 59,586 $64,894 $ 71,717 $ 75,030 $70,554 $74,724 $74,008 $72,028Reinsurance Recoverable, End of Year 17,327 15,644 14,624 19,693 17,369 16,212 16,803 17,487 19,644 20,320 19,209
Gross Liability, End of Year 48,173 53,388 63,430 79,279 82,263 87,929 91,833 88,041 94,368 94,328 $91,237Re-estimated Net Liability 57,967 61,449 64,532 68,233 71,572 79,098 82,422 75,187 75,502 74,429Re-estimated Reinsurance Recoverable 25,535 23,131 21,249 24,093 20,528 19,135 18,480 18,371 16,861 20,395
Re-estimated Gross Liability 83,502 84,580 85,781 92,326 92,100 98,233 100,902 93,558 92,363 94,824Cumulative Gross
Redundancy/(Deficiency) $(35,329) $(31,192) $(22,351) $(13,047) $ (9,837) $(10,304) $ (9,069) $ (5,517) $ 2,005 $ (496)
(a) During 2009, we deconsolidated Transatlantic Holdings, Inc. and sold 21st Century Insurance Group and HSB Group, Inc. The sales anddeconsolidation are reflected in the table above as a reduction in December 31, 2009 net reserves of $9.7 billion and as an $8.6 billion increase inpaid losses for the years 2000 through 2008 to remove the reserves for these divested entities from the ending balance.
(b) The increase in Net Reserves Held from 2009 to 2010 is partially due to the $1.7 billion in Net Reserves Held by Fuji, which was acquired in2010. The decrease in 2011 is due to the cession of asbestos reserves described in Item 7. MD&A – Results of Operations – Segment Results –AIG Property Casualty Operations – Liability for Unpaid Claims and Claims Adjustment Expense – Asbestos and Environmental Reserves.
..................................................................................................................................................................................................................................
AIG 2012 Form 10-K22
I T E M 1 / B U S I N E S S

.....................................................................................................................................................................................
The Liability for unpaid claims and claims adjustment expense as reported in AIG’s Consolidated Balance Sheet at
December 31, 2012 differs from the total reserve reported in the annual statements filed with state insurance
departments and, where applicable, with foreign regulatory authorities primarily for the following reasons:
• Reserves for certain foreign operations are not required or permitted to be reported in the United States for
statutory reporting purposes, including contingency reserves for catastrophic events;
• Statutory practices in the United States require reserves to be shown net of applicable reinsurance recoverable;
and
• Unlike statutory financial statements, AIG’s consolidated Liability for unpaid claims and claims adjustment expense
excludes the effect of intercompany transactions.
Gross loss reserves are calculated without reduction for reinsurance recoverables and represent the accumulation of
estimates for reported losses and IBNR. We review the adequacy of established gross loss reserves in the manner
previously described for net loss reserves. A reconciliation of activity in the Liability for unpaid claims and claims
adjustment expense is included in Note 13 to the Consolidated Financial Statements.
REINSURANCE ACTIVITIES..............................................................................................................................................................................................
AIG subsidiaries operate worldwide primarily by underwriting and accepting risks for their direct account on a gross
basis and reinsuring a portion of the exposure on either an individual risk or an aggregate basis to the extent those
risks exceed the desired retention level. In addition, as a condition of certain direct underwriting transactions, we are
required by clients, agents or regulation to cede all or a portion of risks to specified reinsurance entities, such as
captives, other insurers, local reinsurers and compulsory pools.
In 2012, AIG Property Casualty adopted a new ceded reinsurance framework and strategy to improve the efficiency
of our legal entity capital management and support our global product line risk and profitability objectives.
Reinsurance is also used to manage overall capital adequacy and mitigate the effects of certain events such as
natural and man-made catastrophes. As a result of adopting the new framework and strategy, many individual
reinsurance contracts were consolidated into more efficient global programs and reinsurance ceded to third parties in
support of risk and capital management objectives has decreased in 2012. There are many different forms of
reinsurance agreements and different markets that may be used to achieve our risk and profitability objectives. We
continually evaluate the reinsurance markets and the relative attractiveness of various arrangements that may be
used to achieve our risk and profitability objectives.
The form of reinsurance that we may choose from time to time will generally depend on whether we are seeking
(i) proportional reinsurance, whereby we cede a specified percentage of premium and losses to reinsurers, or
non-proportional or excess of loss reinsurance, whereby we cede all or a specified portion of losses in excess of a
specified amount on a per risk, per occurrence (including catastrophe reinsurance) or aggregate basis and
(ii) treaties that cover a defined book of policies, or facultative placements that cover an individual policy.
Reinsurance markets include:
• Traditional local and global reinsurance markets including in the United States, Bermuda, London and Europe,
accessed directly and through reinsurance intermediaries;
• Capital markets through investors in ILS and collateralized reinsurance transactions, such as catastrophe bonds,
‘‘sidecars’’ (special purpose entities that allow investors to take on the risk of a book of business from an insurance
company in exchange for a premium) and similar vehicles; and
• Other insurers which engage in both direct and assumed reinsurance and/or engage in swaps.
Reinsurance arrangements do not relieve the AIG subsidiaries from their direct obligations to insureds. However, an
effective reinsurance program substantially mitigates our exposure to potentially significant losses.
See Item 7. MD&A – Enterprise Risk Management – Insurance Operations Risks – AIG Property Casualty Key
Insurance Risks – Reinsurance Recoverables for a summary of significant reinsurers.
..................................................................................................................................................................................................................................
AIG 2012 Form 10-K 23
I T E M 1 / B U S I N E S S

.....................................................................................................................................................................................
GENERATING REVENUES: INVESTMENT ACTIVITIES OF OUR INSURANCE OPERATIONS..............................................................................................................................................................................................
AIG Property Casualty and AIG Life and Retirement generally receive We generate significantpremiums and deposits well in advance of paying covered claims or
revenues in our AIG Propertybenefits. In the intervening periods, we invest these premiums and
deposits to generate net investment income and fee income that is Casualty and AIG Life andavailable to pay claims or benefits. As a result, we generate significant
Retirement operations fromrevenues from insurance investment activities.
investment activities.AIG’s worldwide insurance investment policy places primary emphasis on
investments in fixed maturity securities of corporations, municipal bonds
and government issuances in all of its portfolios, and, to a lesser extent,
investments in high-yield bonds, common stock, real estate, hedge funds
and other alternative investments.
The majority of assets backing insurance liabilities at AIG consist of intermediate and long duration fixed maturity
securities.
AIG Property Casualty – Fixed maturity securities held by the insurance companies included in AIG Property
Casualty domestic operations historically have consisted primarily of laddered holdings of tax-exempt municipal
bonds. These tax-exempt municipal bonds provided attractive after-tax returns and limited credit risk. To meet our
domestic operations’ current risk-return and tax objectives, our domestic property and casualty companies have
begun to shift investment allocations away from tax-exempt municipal bonds towards taxable instruments. Any
taxable instruments must meet our liquidity, duration and quality objectives as well as current risk-return and tax
objectives. Fixed maturity securities held by AIG Property Casualty international operations consist primarily of
intermediate duration high-grade securities, primarily in the markets being served. In addition, AIG Property Casualty
has redeployed cash in excess of operating needs and short-term investments into longer-term, higher-yielding
securities.
AIG Life and Retirement – Our investment strategy is to generally match the duration of our liabilities with assets of
comparable duration. AIG Life and Retirement also invests in a diversified portfolio of private equity funds, hedge
funds and affordable housing partnerships. Although these types of investments are subject to periodic earnings
volatility, through December 31, 2012, they have achieved total returns in excess of AIG Life and Retirement’s base
portfolio yield. AIG Life and Retirement expects that these alternative investments will continue to outperform the
base portfolio yield over the long term.
The following table summarizes the investment results of AIG’s insurance operations, excluding the results
of discontinued operations
Years Ended December 31, Annual Average Net Investment Pre-tax Return on
(in millions) Investments(a) Income Average Investments(b)
AIG Property Casualty:
2012 $ 120,166 $ 4,820 4.0%
2011 113,405 4,348 3.8
2010 100,583 4,392 4.4
AIG Life and Retirement:
2012 $ 190,983 $ 10,718 5.6%
2011 172,846 9,882 5.7
2010 154,167 10,768 7.0
(a) Includes real estate investments and excludes cash and short-term investments.
(b) Net investment income divided by the annual average investments.
REGULATION..............................................................................................................................................................................................
Our operations around the world are subject to regulation by many different types of regulatory authorities, including
banking, insurance, securities and investment advisory regulators in the United States and abroad. The insurance
..................................................................................................................................................................................................................................
AIG 2012 Form 10-K24
I T E M 1 / B U S I N E S S

.....................................................................................................................................................................................
and financial services industries generally have been subject to heightened regulatory scrutiny and supervision in
recent years.
Federal Reserve Supervision..............................................................................................................................................................................................
We are a savings and loan holding company (SLHC) within the meaning of the Home Owners’ Loan Act (HOLA) and
are regulated and subject to the examination, supervision and enforcement authority and reporting requirements of
the Board of Governors of the Federal Reserve System (FRB). Because we were grandfathered as a unitary SLHC
within the meaning of HOLA when we organized AIG Federal Savings Bank and became an SLHC in 1999, we
generally are not restricted under existing laws as to the types of business activities in which we may engage, as
long as AIG Federal Savings Bank continues to be a qualified thrift lender.
The Dodd-Frank Wall Street Reform and Consumer Protection Act (Dodd-Frank) has effected comprehensive
changes to the regulation of financial services in the United States and subjects us to substantial additional federal
regulation. The FRB supervises and regulates SLHCs, and the Office of the Comptroller of the Currency (OCC)
supervises and regulates federal savings associations, such as AIG Federal Savings Bank. Dodd-Frank directs
existing and newly-created government agencies and oversight bodies to promulgate regulations implementing the
law, an ongoing process that has begun and is anticipated to continue over the next few years.
Changes mandated by Dodd-Frank include directing the FRB to promulgate minimum capital requirements for
SLHCs. The FRB, OCC and Federal Deposit Insurance Corporation (FDIC) have proposed revised minimum
leverage and risk-based capital requirements that would apply to all bank holding companies and SLHCs, as well as
to insured depository institutions, such as AIG Federal Savings Bank. As required by Dodd-Frank, the FRB has also
proposed enhanced prudential standards for large bank holding companies and non-bank systemically important
financial institutions (SIFIs) and has stated its intention to propose enhanced prudential standards for SLHCs
pursuant to HOLA. We cannot predict whether the capital regulations will be adopted as proposed or what enhanced
prudential standards the FRB will promulgate for SLHCs, either generally or as applicable to insurance businesses.
Further, we cannot predict how the FRB will exercise general supervisory authority over us, although the FRB could,
as a prudential matter, for example, limit our ability to pay dividends, purchase shares of AIG Common Stock or
acquire or enter into other businesses. We cannot predict with certainty the requirements of the regulations ultimately
adopted or how or whether Dodd-Frank and such regulations will affect the financial markets generally, impact our
businesses, results of operations, cash flows or financial condition, or require us to raise additional capital or result in
a downgrade of our credit ratings.
Furthermore, Dodd-Frank requires SIFIs to be subject to regulation, examination and supervision by the FRB
(including minimum leverage and risk-based capital requirements). Nonbank SIFIs will be designated by the Financial
Stability Oversight Council (Council) created by Dodd-Frank. If we are designated as a SIFI, we will be regulated by
the FRB both in that capacity and in our capacity as an SLHC. The regulations applicable to SIFIs and to SLHCs,
when all have been adopted as final rules, may differ materially from each other. In October 2012, we received a
notice that we are under consideration by the Council for a proposed determination that we are a SIFI. The notice
stated that we will be reviewed in Stage 3 of the SIFI determination process described in the Council’s interpretive
guidance for nonbank financial company determinations. If we are designated as a SIFI, we would also be subject to
additional regulatory requirements, including heightened prudential standards. For a description of those standards as
currently proposed and a discussion of the potential effects on us if we are designated as a SIFI, see Item 1A. Risk
Factors – Regulation.
As part of its general prudential supervisory powers, the FRB has the authority to limit our ability to conduct activities
that would otherwise be permissible for us to engage in if we do not satisfy certain requirements.
Directive 2002/87/EC (the Directive) issued by the European Parliament provides that certain financial conglomerates
with regulated entities in the European Union, such as AIG, are subject to supplementary supervision. Pursuant to
the Directive, the Commission Bancaire, the French banking regulator, was appointed as our supervisory coordinator.
We have been in discussions with, and have provided information to, the Autorite de Controle Prudentiel (formerly,
the Commission Bancaire) and the UK Financial Services Authority regarding the possibility of proposing another of
our existing regulators as our equivalent supervisor.
..................................................................................................................................................................................................................................
AIG 2012 Form 10-K 25
I T E M 1 / B U S I N E S S

.....................................................................................................................................................................................
Capital Requirements..............................................................................................................................................................................................
Section 171 of Dodd-Frank (the Collins Amendment) subjects SLHCs to capital requirements that must be no less
stringent than the requirements generally applicable to insured depository institutions or quantitatively lower than the
requirements in effect for insured depository institutions as of July 21, 2010. The regulatory capital requirements
currently applicable to insured depository institutions, such as AIG Federal Savings Bank, are computed in
accordance with the U.S. federal banking agencies’ generally applicable risk-based capital requirements, which are
based on accords established by the Basel Committee on Banking Supervision (Basel Committee). These accords
have evolved over time, and are referred to as Basel I, Basel II and Basel III.
In June 2012, the federal banking agencies issued proposed rules that would revise and replace current regulatory
capital rules for banking organizations, including SLHCs.
We are still considering the full impact of the proposed capital rules and the FRB and the other federal banking
agencies have not adopted final rules. In addition, the FRB has announced that the rules will not be effective as of
January 1, 2013, as originally proposed, but has not provided a revised effective date.
Also in June 2012, the FRB and the other federal banking agencies issued revised final rules that modify their
market risk regulatory capital requirements for banking institutions with significant trading activities. These
modifications are designed to address the adjustments to the market risk regulatory capital framework that were
announced by the Basel Committee in June 2010 (referred to as ‘‘Basel II.5’’) and the prohibition on the use of
external credit ratings, as required by Dodd-Frank. These changes become effective for banking institutions in 2013
and will likely become effective for us when capital requirements for SLHCs are implemented. These changes will
result in increased regulatory capital requirements for market risk. We are still considering the full impact of these
capital requirements.
Volcker Rule..............................................................................................................................................................................................
In July 2012, Section 619 of Dodd-Frank, referred to as the ‘‘Volcker Rule,’’ became effective, although the final rule
implementing Section 619 has not yet been released. Under the proposed rule released in October 2011, if we
continue to be regulated as an SLHC due to our control of AIG Federal Savings Bank, or control another insured
depository institution, we and our affiliates would be considered banking entities for purposes of the rule and, after
the rule’s conformance date of July 21, 2014, would be prohibited from ‘‘proprietary trading’’ and sponsoring or
investing in ‘‘covered funds,’’ subject to the rule’s exceptions. Even if we are no longer regulated as an SLHC or no
longer control an insured depository institution, we could be subject to restrictions on these activities if we are
designated as a SIFI, as Dodd-Frank authorizes the FRB to subject SIFIs to capital requirements, quantitative limits
or other restrictions if they engage in activities prohibited for banking entities under the Volcker Rule. The Volcker
Rule, as proposed, contains an exemption for proprietary trading by insurance companies for their general account,
but the final breadth and scope of this exemption is uncertain.
Other Effects of Dodd-Frank..............................................................................................................................................................................................
In addition, Dodd-Frank will also have the following effects on us:
• If we are designated as a SIFI, the FRB could (i) limit our ability to merge with, acquire, consolidate with, or
become affiliated with another company, to offer specified financial products or to terminate specified activities;
(ii) impose conditions on how we conduct our activities or (iii) with approval of the Council, and a determination
that the foregoing actions are inadequate to mitigate a threat to U.S. financial stability, require us to sell or
otherwise transfer assets or off-balance-sheet items to unaffiliated entities.
• If we are designated as a SIFI, we will be required to provide to regulators an annual plan for our rapid and orderly
resolution in the event of material financial distress or failure, which must, among other things, ensure that AIG
Federal Savings Bank is adequately protected from risks arising from our other entities and meet several specific
standards, including requiring a detailed resolution strategy and analyses of our material entities, organizational
structure, interconnections and interdependencies, and management information systems, among other elements.
..................................................................................................................................................................................................................................
AIG 2012 Form 10-K26
I T E M 1 / B U S I N E S S

.....................................................................................................................................................................................
• The Council may recommend that state insurance regulators or other regulators apply new or heightened
standards and safeguards for activities or practices that we and other insurers or other financial services
companies engage in.
• Title II of Dodd-Frank provides that a financial company whose largest United States subsidiary is an insurer (such
as us) may be subject to a special liquidation process outside the federal bankruptcy code. That process is to be
administered by the FDIC upon a coordinated determination by the Secretary of the Treasury, the director of the
Federal Insurance Office and the FRB, in consultation with the FDIC, that such a financial company is in default or
in danger of default and presents a systemic risk to U.S. financial stability.
• Dodd-Frank establishes a new framework for regulation of the over-the-counter (OTC) derivatives markets –
including the imposition of margin and collateral requirements, centralized clearing and reporting/record keeping
requirements – that could affect various activities of AIG and its insurance subsidiaries.
• Dodd-Frank mandated a study to determine whether stable value contracts should be included in the definition of
‘‘swap.’’ If that study concludes that stable value contracts are swaps, Dodd-Frank authorizes certain federal
regulators to determine whether an exemption from the definition of a swap is appropriate and in the public
interest. Certain of our affiliates are in or may participate in the stable value contract business. We cannot predict
what regulations might emanate from the aforementioned study or be promulgated applicable to this business in
the future.
• Dodd-Frank established a Federal Insurance Office (FIO) within the Department of the Treasury headed by a
director appointed by the Secretary of the Treasury. While not having a general supervisory or regulatory authority
over the business of insurance, the director of this office performs various functions with respect to insurance
(other than health insurance), including serving as a non-voting member of the Council and participating in the
Council’s decisions regarding insurers, potentially including AIG, to be designated as a SIFI. The director is also
required to conduct a study on how to modernize and improve the system of insurance regulation in the United
States, including by increased national uniformity through either a federal charter or effective action by the states.
The FIO may also recommend enhanced regulations to state insurance regulatory bodies.
• Dodd-Frank established the Consumer Financial Protection Bureau (CFPB) as an independent agency within the
FRB to regulate consumer financial products and services offered primarily for personal, family or household
purposes. Insurance products and services are not within the CFPB’s general jurisdiction, although the U.S.
Department of Housing and Urban Development has since transferred authority to the CFPB to investigate
mortgage insurance practices. Broker-dealers and investment advisers are not subject to the CFPB’s jurisdiction
when acting in their registered capacity.
• Title XIV of Dodd-Frank also restricts certain terms for mortgage loans, such as loan fees, prepayment fees and
other charges, and imposes certain duties on a lender to ensure that a borrower can afford to repay the loan.
Dodd-Frank imposes various assessments on financial companies, including, as applicable to us, ex-post
assessments to provide funds necessary to repay any borrowing and to cover the costs of any special resolution of a
financial company conducted under Title II (although the regulatory authority would have to take account of the
amounts paid by us into state guaranty funds).
We cannot predict whether these actions will become effective or the effect they may have on the financial markets
or on our business, results of operations, cash flows, financial condition and credit ratings. However, it is possible
that such effect could be materially adverse. See Item 1A. Risk Factors – Regulation for additional information.
Other Regulatory Developments..............................................................................................................................................................................................
In addition to the adoption of Dodd-Frank in the United States, regulators and lawmakers around the world are
actively reviewing the causes of the financial crisis and taking steps to avoid similar problems in the future. The
Financial Stability Board (FSB), consisting of representatives of national financial authorities of the G20 nations, has
issued a series of frameworks and recommendations intended to produce significant changes in how financial
companies, particularly SIFIs, should be regulated. These frameworks and recommendations address such issues as
financial group supervision, capital and solvency standards, systemic economic risk, corporate governance including
compensation, and a host of related issues associated with responses to the financial crisis. The FSB has directed
the International Association of Insurance Supervisors (the IAIS, headquartered in Basel, Switzerland) to create
..................................................................................................................................................................................................................................
AIG 2012 Form 10-K 27
I T E M 1 / B U S I N E S S

.....................................................................................................................................................................................
standards relative to these areas and incorporate them within that body’s Insurance Core Principles. IAIS Insurance
Core Principles form the baseline threshold for how countries’ financial services regulatory efforts are measured
relative to the insurance sector. That measurement is made by periodic Financial Sector Assessment Program
(FSAP) reviews conducted by the World Bank and the International Monetary Fund and the reports thereon spur the
development of country-specific additional or amended regulatory changes. Lawmakers and regulatory authorities in
a number of jurisdictions in which our subsidiaries conduct business have already begun implementing legislative and
regulatory changes consistent with these recommendations, including proposals governing consolidated regulation of
insurance holdings companies by the Financial Services Agency in Japan, financial and banking regulation adopted
in France and compensation regulations proposed or adopted by the financial regulators in Germany and the United
Kingdom Financial Services Authority.
Legislation in the European Union could also affect our international insurance operations. The Solvency II Directive
(2009/138/EEC) (Solvency II), which was adopted on November 25, 2009 and is expected to become effective in
January 2014, reforms the insurance industry’s solvency framework, including minimum capital and solvency
requirements, governance requirements, risk management and public reporting standards. The impact on us will
depend on whether the U.S. insurance regulatory regime is deemed ‘‘equivalent’’ to Solvency II; if the U.S. insurance
regulatory regime is not equivalent, then we, along with other insurance companies, could be required to be
supervised under Solvency II standards. Whether the U.S. insurance regulatory regime will be deemed ‘‘equivalent’’
is still under consideration by European authorities and remains uncertain, so we are not currently able to predict the
impact of Solvency II.
We expect that the regulations applicable to us and our regulated entities will continue to evolve for the foreseeable
future.
Regulation of Insurance Subsidiaries..............................................................................................................................................................................................
Certain states require registration and periodic reporting by insurance companies that are licensed in such states and
are controlled by other corporations. Applicable legislation typically requires periodic disclosure concerning the
corporation that controls the registered insurer and the other companies in the holding company system and prior
approval of intercompany services and transfers of assets, including in some instances payment of dividends by the
insurance subsidiary, within the holding company system. Our subsidiaries are registered under such legislation in
those states that have such requirements.
Our insurance subsidiaries are subject to regulation and supervision by the states and by other jurisdictions in which
they do business. Within the United States, the method of such regulation varies but generally has its source in
statutes that delegate regulatory and supervisory powers to an insurance official. The regulation and supervision
relate primarily to the financial condition of the insurers and their corporate conduct and market conduct activities.
This includes approval of policy forms and rates, the standards of solvency that must be met and maintained,
including with respect to risk-based capital, the licensing of insurers and their agents, the nature of and limitations on
investments, restrictions on the size of risks that may be insured under a single policy, deposits of securities for the
benefit of policyholders, requirements for acceptability of reinsurers, periodic examinations of the affairs of insurance
companies, the form and content of reports of financial condition required to be filed and reserves for unearned
premiums, losses and other purposes. In general, such regulation is for the protection of policyholders rather than the
equity owners of these companies.
In the U.S., the Risk-Based Capital (RBC) formula is designed to measure the adequacy of an insurer’s statutory
surplus in relation to the risks inherent in its business. Virtually every state has adopted, in substantial part, the RBC
Model Law promulgated by the National Association of Insurance Commissioners (NAIC), which allows states to act
upon the results of RBC calculations, and provides for four incremental levels of regulatory action regarding insurers
whose RBC calculations fall below specific thresholds. Those levels of action range from the requirement to submit a
plan describing how an insurer would regain a calculated RBC ratio above the respective threshold through a
mandatory regulatory takeover of the company. The action thresholds are based on RBC levels that are calculated
so that a company subject to such actions is solvent but its future solvency is in doubt without some type of
corrective action. The RBC formula computes a risk-adjusted surplus level by applying discrete factors to various
asset, premium and reserve items. These factors are developed to be risk-sensitive so that higher factors are applied
to items exposed to greater risk. The statutory surplus of each of our U.S.-based life and property and casualty
insurance subsidiaries exceeded RBC minimum required levels as of December 31, 2012.
..................................................................................................................................................................................................................................
AIG 2012 Form 10-K28
I T E M 1 / B U S I N E S S

15FEB201315344305
.....................................................................................................................................................................................
If any of our insurance entities fell below prescribed levels of statutory surplus, it would be our intention to provide
appropriate capital or other types of support to that entity, under formal support agreements or capital maintenance
agreements (CMAs) or otherwise. For additional details regarding CMAs that we have entered into with our insurance
subsidiaries, see Item 7. MD&A – Liquidity and Capital Resources – Liquidity and Capital Resources of AIG Parent
and Subsidiaries – AIG Property Casualty and – AIG Life and Retirement.
The National Association of Insurance Commissioners (NAIC) has undertaken the Solvency Modernization Initiative
(SMI) which focuses on a review of insurance solvency regulations throughout the U.S. financial regulatory system
and is expected to lead to a set of long-term solvency modernization goals. SMI is broad in scope, but the NAIC has
stated that its focus will include the U.S. solvency framework, group solvency issues, capital requirements,
international accounting and regulatory standards, reinsurance and corporate governance.
A substantial portion of AIG Property Casualty’s business is conducted in foreign countries. The degree of regulation
and supervision in foreign jurisdictions varies. Generally, we must satisfy local regulatory requirements, licenses
issued by foreign authorities to our subsidiaries are subject to modification or revocation by such authorities, and
therefore these subsidiaries could be prevented from conducting business in certain of the jurisdictions where they
currently operate.
In addition to licensing requirements, our foreign operations are also regulated in various jurisdictions with respect to
currency, policy language and terms, advertising, amount and type of security deposits, amount and type of reserves,
amount and type of capital to be held, amount and type of local investment and the share of profits to be returned to
policyholders on participating policies. Some foreign countries regulate rates on various types of policies. Certain
countries have established reinsurance institutions, wholly or partially owned by the local government, to which
admitted insurers are obligated to cede a portion of their business on terms that may not always allow foreign
insurers, including our subsidiaries, full compensation. In some countries, regulations governing constitution of
technical reserves and remittance balances may hinder remittance of profits and repatriation of assets.
See Item 7. MD&A – Liquidity and Capital Resources – Regulation and Supervision and Note 20 to the Consolidated
Financial Statements.
OUR COMPETITIVE ENVIRONMENT..............................................................................................................................................................................................
AIG’s businesses operate in a highly competitive global environment. Principal sources of competition are insurance
companies, banks, and other non-bank financial institutions. AIG considers its principal competitors to be other large
multinational insurance organizations. We describe our competitive strengths, our strategies to retain existing
customers and attract new customers within each of our operating business segment descriptions.
OUR EMPLOYEES..............................................................................................................................................................................................
At December 31, 2012, AIG and its subsidiaries had approximately 63,000 employees. We believe that our relations
with our employees are satisfactory.
AIG Property
Casualty
Domestic
AIG Property
Casualty
International
15,000
30,000
AIG
PROPERTY
CASUALTY
45,000
12,000
6,000
AIG LIFE AND
RETIREMENT
OTHER OPERATIONS*
* Includes approximately 500 employees of ILFC, which was held for sale at December 31, 2012.
..................................................................................................................................................................................................................................
AIG 2012 Form 10-K 29
I T E M 1 / B U S I N E S S

.....................................................................................................................................................................................
DIRECTORS AND EXECUTIVE OFFICERS OF AIG..............................................................................................................................................................................................
Information concerning the directors and executive officers of AIG as of February 21, 2013 is set forth below.
Robert H. Benmosche Director, President and Chief Executive Officer 68 2009
W. Don Cornwell Director 65 2011
John H. Fitzpatrick Director 56 2011
Christopher S. Lynch Director 55 2009
Arthur C. Martinez Director 73 2009
George L. Miles, Jr. Director 71 2005
Henry S. Miller Director 67 2010
Robert S. Miller Chairman 71 2009
Suzanne Nora Johnson Director 55 2008
Morris W. Offit Director 76 2005
Ronald A. Rittenmeyer Director 65 2010
Douglas M. Steenland Director 61 2009
Michael R. Cowan Executive Vice President and Chief Administrative Officer 59 2011
William N. Dooley Executive Vice President – Investments 59 1992
Peter D. Hancock Executive Vice President – Property and Casualty Insurance 54 2010
David L. Herzog Executive Vice President and Chief Financial Officer 53 2005
Jeffrey J. Hurd Executive Vice President – Human Resources and 46 2010
Communications
Thomas A. Russo Executive Vice President and General Counsel 69 2010
Siddhartha Sankaran Executive Vice President and Chief Risk Officer 35 2010
Brian T. Schreiber Executive Vice President and Treasurer 47 2002
Jay S. Wintrob Executive Vice President – Life and Retirement 55 1999
Charles S. Shamieh Senior Vice President and Chief Corporate Actuary 46 2011
All directors of AIG are elected for one-year terms at the annual meeting of shareholders.
All executive officers are elected to one-year terms, but serve at the pleasure of the Board of Directors. Except for
the following individuals below, each of the executive officers has, for more than five years, occupied an executive
position with AIG or companies that are now its subsidiaries. There are no arrangements or understandings between
any executive officer and any other person pursuant to which the executive officer was elected to such position.
Robert Benmosche joined AIG as Chief Executive Officer in August 2009. Previously, he served as Chairman and
Chief Executive Officer of MetLife, Inc. from September 1998 to February 2006 (Chairman until April 2006). He
served as President of MetLife, Inc. from September 1999 to June 2004, President and Chief Operating Officer from
November 1997 to June 1998, and Executive Vice President from September 1995 to October 1997. Mr. Benmosche
has served as a member of the Board of Directors of Credit Suisse Group since 2002.
Michael R. Cowan joined AIG as Senior Vice President and Chief Administrative Officer in January 2010. Prior to
joining AIG, he was at Merrill Lynch where he had served as Senior Vice President, Global Corporate Services, since
1998. Mr. Cowan began his career at Merrill Lynch in 1986 as a Financial Manager and later served as Chief
Administrative Officer for Europe, the Middle East and Africa. He was also Chief Financial Officer and a member of
the Executive Management Committee for the Global Private Client business, including Merrill Lynch Asset
Management.
Thomas Russo joined AIG as Executive Vice President – Legal, Compliance, Regulatory Affairs and Government
Affairs and General Counsel in February 2010. Prior to joining AIG, Mr. Russo was with the law firm of Patton
Boggs, LLP, where he served as Senior Counsel. Prior to that, he was Chief Legal Officer of Lehman Brothers
Holdings, Inc. Before joining Lehman Brothers in 1993, he was a partner at the law firm of Cadwalader,
Wickersham & Taft and a member of its Management Committee.
..................................................................................................................................................................................................................................
AIG 2012 Form 10-K30
Served as
Director or
Name Title Age Officer Since
I T E M 1 / B U S I N E S S

I T E M 1 / B U S I N E S S.....................................................................................................................................................................................
Peter Hancock joined AIG in February 2010 as Executive Vice President of Finance and Risk. Prior to joining AIG,
Mr. Hancock served as Vice Chairman of KeyCorp, responsible for Key National Banking. Prior to KeyCorp, he
served as Managing Director of Trinsum Group, Inc. Prior to that position, Mr. Hancock was at JP Morgan for
20 years, eventually serving as head of its fixed income division and ultimately Chief Financial Officer.
Siddartha Sankaran joined AIG in December 2010 as Senior Vice President and Chief Risk Officer. Prior to that, he
was a partner in the Finance and Risk practice of Oliver Wyman Financial Services and served as Canadian Market
Manager since 2006.
Charles S. Shamieh joined AIG in 2007 as Executive Director of Enterprise Risk Management. In January 2011,
Mr. Shamieh was elected to his current position of Senior Vice President and Corporate Chief Actuary. Prior to
joining AIG, Mr. Shamieh was Group Chief Risk Officer for Munich Re Group and a Member of the Group Committee
of Munich Re’s Board of Management since 2006.
AVAILABLE INFORMATION ABOUT AIG..............................................................................................................................................................................................
Our corporate website is www.aig.com. We make available free of charge, through the Investor Information section of
our corporate website, the following reports (and related amendments as filed with the SEC) as soon as reasonably
practicable after such materials are electronically filed with, or furnished to, the SEC:
• Annual Reports on Form 10-K
• Quarterly Reports on Form 10-Q
• Current Reports on Form 8-K
• Proxy Statements on Schedule 14A, as well as other filings with the SEC
Also available on our corporate website:
• Charters for Board Committees: Audit, Nominating and Corporate Governance, Compensation and Management
Resources, Finance and Risk Management, and Regulatory, Compliance and Public Policy Committees
• Corporate Governance Guidelines (which include Director Independence Standards)
• Director, Executive Officer and Senior Financial Officer Code of Business Conduct and Ethics (we will post on our
website any amendment or waiver to this Code within the time period required by the SEC)
• Employee Code of Conduct
• Related-Party Transactions Approval Policy
Except for the documents specifically incorporated by reference into this Annual Report on Form 10-K, information
contained on our website or that can be accessed through our website is not incorporated by reference into this
Annual Report on Form 10-K. Reference to our website is made as an inactive textual reference.
..................................................................................................................................................................................................................................
AIG 2012 Form 10-K 31

.....................................................................................................................................................................................
..............................................................................................................................................................................................
Investing in AIG involves risk. In deciding whether to invest in AIG, you should carefully consider the following risk
factors. Any of these risk factors could have a significant or material adverse effect on our businesses, results of
operations, financial condition or liquidity. They could also cause significant fluctuations and volatility in the trading
price of our securities. Readers should not consider any descriptions of these factors to be a complete set of all
potential risks that could affect AIG. These factors should be considered carefully together with the other information
contained in this report and the other reports and materials filed by us with the Securities and Exchange Commission
(SEC). Further, many of these risks are interrelated and could occur under similar business and economic conditions,
and the occurrence of certain of them may in turn cause the emergence or exacerbate the effect of others. Such a
combination could materially increase the severity of the impact of these risks on our results of operations, liquidity
and financial condition.
MARKET CONDITIONS..............................................................................................................................................................................................
Difficult conditions in the global capital markets and the economy may materially and adversely affect our
businesses, results of operations, financial condition and liquidity. Our businesses are highly dependent on the
economic environment, both in the U.S. and around the world. Concerns over continued high domestic
unemployment, weakness in the U.S. housing and commercial real estate markets, the ability of the U.S. government
to rein in the U.S. deficit, address the federal debt ceiling and reduce spending, and the European Union’s ability to
resolve its debt crisis, among other issues, have contributed to increased volatility and reduced expectations for the
economy and the markets in the near term. Extreme prolonged market events, such as the global financial crisis
during 2008 and 2009, have at times led, and could in the future lead, to a lack of liquidity, highly volatile markets, a
steep depreciation in asset values across all classes, an erosion of investor and public confidence, and a widening of
credit spreads. Difficult economic conditions could also result in increased unemployment and a severe decline in
business across a wide range of industries and regions. These market and economic factors could have a material
adverse effect on our businesses, results of operations, financial condition and liquidity.
Under difficult economic conditions, we could experience reduced demand for our financial and insurance products
and an elevated incidence of claims and lapses or surrenders of policies. Contract holders may choose to defer or
cease paying insurance premiums. Other ways in which we could be negatively affected by economic conditions,
include, but are not limited to:
• declines in the valuation and performance of our investment portfolio, including declines attributable to rapid
increases in rates;
• increased credit losses;
• declines in the value of other assets;
• impairments of goodwill and other long-lived assets;
• additional statutory capital requirements;
• limitations on our ability to recover deferred tax assets;
• a decline in new business levels and renewals;
• a decline in insured values caused by a decrease in activity at client organizations;
• an increase in liability for future policy benefits due to loss recognition on certain long-duration insurance contracts;
• higher borrowing costs and more limited availability of credit;
• an increase in policy surrenders and cancellations; and
• a write-off of deferred policy acquisition costs (DAC).
Sustained low interest rates may materially and adversely affect our profitability. Sustained low interest rates
can negatively affect the performance of our investment securities and reduce the level of investment income earned
on our investment portfolios. If a low interest rate environment persists, we may experience slower investment
..................................................................................................................................................................................................................................
AIG 2012 Form 10-K32
ITEM 1A / RISK FACTORS
I T E M 1 A / R I S K F A C T O R S

.....................................................................................................................................................................................
income growth and we may not be able to fully mitigate the interest rate risk of our assets relative to our liabilities.
Continued low interest rates could impair our ability to earn the returns assumed in the pricing and the reserving for
our products at the time they were sold and issued.
INVESTMENT PORTFOLIO, CONCENTRATION OF INVESTMENTS, INSURANCE AND OTHER
EXPOSURES..............................................................................................................................................................................................
The performance and value of our investment portfolio are subject to a number of risks and uncertainties,
including changes in interest rates. Interest rates are highly sensitive to many factors, including monetary policies,
domestic and international economic and political issues and other factors beyond our control. Changes in monetary
policy or other factors may cause interest rates to rise, which would adversely affect the value of the fixed income
securities that we hold and could adversely affect our ability to sell these securities. In addition, the evaluation of
available-for-sale securities for other-than-temporary impairments, which may occur if interest rates rise, is a
quantitative and qualitative process that is subject to significant management judgment.
Our investment portfolio is concentrated in certain segments of the economy. Our results of operations and
financial condition have been adversely affected by the degree of concentration in our investment portfolio in the
past, and this may occur again in the future. We have concentrations in residential mortgage-backed, commercial
mortgage-backed and other asset-backed securities and commercial mortgage loans. We also have significant
exposures to financial institutions and, in particular, to money center and global banks; U.S. state and local
government issuers and authorities; and Eurozone financial institutions and governments and corporations. Events or
developments that have a negative effect on any particular industry, asset class, group of related industries or
geographic region may adversely affect our investments that are concentrated in such segments. Our ability to sell
assets concentrated in such areas may be limited if other market participants are selling similar assets at the same
time.
Concentration of our insurance and other risk exposures may have adverse effects. We may be exposed to
risks as a result of concentrations in our insurance policies, derivatives and other obligations that we undertake for
customers and counterparties. We manage these concentration risks by monitoring the accumulation of our
exposures by factors such as exposure type, industry, geographic region, counterparty and other factors. We also
use reinsurance, hedging and other arrangements to limit or offset exposures that exceed the limits we wish to
retain. In certain circumstances, however, these risk management arrangements may not be available on acceptable
terms or may prove to be ineffective for certain exposures. Also, our exposure may be so large that even a slightly
adverse experience compared to our expectations may have a material adverse effect on our consolidated results of
operations or financial condition, or result in additional statutory capital requirements for our subsidiaries.
RESERVES AND EXPOSURES..............................................................................................................................................................................................
Our consolidated results of operations, liquidity and financial condition are subject to the effects of
catastrophic events. Events such as hurricanes, windstorms, flooding, earthquakes, pandemic disease, acts of
terrorism and other catastrophes have adversely affected our business in the past and could do so in the future.
Such events could expose us to:
• widespread claim costs associated with property, workers’ compensation, business interruption and mortality and
morbidity claims;
• loss resulting from a decline in the value of our invested assets
• limitations on our ability to recover deferred tax assets;
• loss resulting from actual policy experience that is adverse compared to the assumptions made in the product
pricing; and
• significant interruptions to our systems and operations.
For a sensitivity analysis of our exposure to certain catastrophes, see Item 7. MD&A – Enterprise Risk
Management – Insurance Operations Risks – AIG Property Casualty Key Insurance Risks – Catastrophe Exposures.
Insurance liabilities are difficult to predict and may exceed the related reserves for losses and loss
expenses. We regularly review the adequacy of the established Liability for unpaid claims and claims adjustment
..................................................................................................................................................................................................................................
AIG 2012 Form 10-K 33
I T E M 1 A / R I S K F A C T O R S

.....................................................................................................................................................................................
expense and conduct extensive analyses of our reserves during the year. Our loss reserves, however, may develop
adversely. Estimation of ultimate net losses, loss expenses and loss reserves is a complex process, particularly for
long-tail casualty lines of business. These include, but are not limited to, general liability, commercial automobile
liability, environmental, workers’ compensation, excess casualty and crisis management coverages, insurance and
risk management programs for large corporate customers and other customized structured insurance products, as
well as excess and umbrella liability, D&O and products liability.
While we use a number of analytical reserve development techniques to project future loss development, reserves
may be significantly affected by changes in loss cost trends or loss development factors that were relied upon in
setting the reserves. These changes in loss cost trends or loss development factors could be due to difficulties in
predicting changes, such as changes in inflation, the judicial environment, or other social or economic factors
affecting claims. Any deviation in loss cost trends or in loss development factors might not be identified for an
extended period of time after we record the initial loss reserve estimates for any accident year or number of years.
For a further discussion of our loss reserves, see Item 7. MD&A – Results of Operations – Segment Results – AIG
Property Casualty Operations – Liability for Unpaid Claims and Claims Adjustment Expense and Critical Accounting
Estimates – Liability for Unpaid Claims and Claims Adjustment Expense (AIG Property Casualty and Mortgage
Guaranty).
Reinsurance may not be available or affordable and may not be adequate to protect us against losses. Our
subsidiaries are major purchasers of reinsurance and we use reinsurance as part of our overall risk management
strategy. While reinsurance does not discharge our subsidiaries from their obligation to pay claims for losses insured
under our policies, it does make the reinsurer liable to them for the reinsured portion of the risk. For this reason,
reinsurance is an important risk management tool to manage transaction and insurance line risk retention and to
mitigate losses from catastrophes. Market conditions beyond our control determine the availability and cost of
reinsurance. For example, reinsurance may be more difficult or costly to obtain after a year with a large number of
major catastrophes. As a result, we may, at certain times, be forced to incur additional expenses for reinsurance or
may be unable to obtain sufficient reinsurance on acceptable terms. In that case, we would have to accept an
increase in exposure risk, reduce the amount of business written by our subsidiaries or seek alternatives.
Additionally, we are exposed to credit risk with respect to our subsidiaries’ reinsurers to the extent the reinsurance
receivable is not secured by collateral or does not benefit from other credit enhancements. We also bear the risk that
a reinsurer may be unwilling to pay amounts we have recorded as reinsurance recoverables for any reason, including
that (i) the terms of the reinsurance contract do not reflect the intent of the parties of the contract, (ii) the terms of
the contract cannot be legally enforced, (iii) the terms of the contract are interpreted by a court differently than
intended, (iv) the reinsurance transaction performs differently than we anticipated due to a flawed design of the
reinsurance structure, terms or conditions, or (v) a change in laws and regulations, or in the interpretation of the laws
and regulations, materially impacts a reinsurance transaction. The insolvency of one or more of our reinsurers, or
inability or unwillingness to make timely payments under the terms of our agreements, could have a material adverse
effect on our results of operations and liquidity. For additional information on our reinsurance, see Item 7. MD&A –
Enterprise Risk Management – Insurance Operations Risks – AIG Property Casualty Key Insurance Risks –
Reinsurance Recoverables.
LIQUIDITY, CAPITAL AND CREDIT..............................................................................................................................................................................................
Our internal sources of liquidity may be insufficient to meet our needs. We need liquidity to pay our operating
expenses, interest on our debt, maturing debt obligations and to meet any statutory capital requirements of our
subsidiaries. If our liquidity is insufficient to meet our needs, we may at the time need to have recourse to third-party
financing, external capital markets or other sources of liquidity, which may not be available or could be prohibitively
expensive. The availability and cost of any additional financing at any given time depends on a variety of factors,
including general market conditions, the volume of trading activities, the overall availability of credit, regulatory
actions and our credit ratings and credit capacity. It is also possible that, as a result of such recourse to external
financing, customers, lenders or investors could develop a negative perception of our long- or short-term financial
prospects. Disruptions, volatility and uncertainty in the financial markets, and downgrades in our credit ratings, may
limit our ability to access external capital markets at times and on terms favorable to us to meet our capital and
liquidity needs or prevent our accessing the external capital markets or other financing sources. For a further
discussion of our liquidity, see Item 7. MD&A – Liquidity and Capital Resources.
..................................................................................................................................................................................................................................
AIG 2012 Form 10-K34
I T E M 1 A / R I S K F A C T O R S

.....................................................................................................................................................................................
A downgrade in our credit ratings could require us to post additional collateral and result in the termination
of derivative transactions. Credit ratings estimate a company’s ability to meet its obligations and may directly affect
the cost and availability of financing. A downgrade of our long-term debt ratings by the major rating agencies would
require us to post additional collateral payments related to derivative transactions to which we are a party, and could
permit the termination of these derivative transactions. This could adversely affect our business, our consolidated
results of operations in a reporting period or our liquidity. In the event of further downgrades of two notches to our
long-term senior debt ratings, AIG would be required to post additional collateral of $226 million, and certain of our
counterparties would be permitted to elect early termination of contracts.
AIG Parent’s ability to access funds from our subsidiaries is limited. As a holding company, AIG Parent
depends on dividends, distributions and other payments from its subsidiaries to fund payments due on its obligations,
including its outstanding debt. The majority of our investments are held by our regulated subsidiaries. Our
subsidiaries may be limited in their ability to make dividend payments or advance funds to AIG Parent in the future
because of the need to support their own capital levels or because of regulatory limits.
AIG Parent’s ability to support our subsidiaries is limited. AIG Parent has in the past and expects to continue to
provide capital to our subsidiaries as necessary to maintain regulatory capital ratios, comply with rating agency
requirements and meet unexpected cash flow obligations, in some cases under support or capital maintenance
agreements. AIG Parent has entered into capital maintenance agreements with certain of our insurance subsidiaries
that will require it to contribute capital if specific capital levels are breached. If AIG Parent is unable to satisfy a
capital need of a subsidiary, the subsidiary could become insolvent or, in certain cases, could be seized by its
regulator.
Our subsidiaries may not be able to generate cash to meet their needs due to the illiquidity of some of their
investments. Our subsidiaries have investments in certain securities that may be illiquid, including certain fixed
income securities and certain structured securities, private company securities, private equity funds and hedge funds,
mortgage loans, finance receivables and real estate. Collectively, investments in these securities had a fair value of
$49 billion at December 31, 2012. The decline in the U.S. real estate markets and tight credit markets have also
materially adversely affected the liquidity of our other securities portfolios, including our residential and commercial
mortgage-related securities and investment portfolios. In the event additional liquidity is required by one or more of
our subsidiaries and AIG Parent is unable to provide it, it may be difficult for these subsidiaries to generate additional
liquidity by selling, pledging or otherwise monetizing these less liquid investments.
A downgrade in the Insurer Financial Strength ratings of our insurance companies could prevent them from
writing new business and retaining customers and business. Insurer Financial Strength (IFS) ratings are an
important factor in establishing the competitive position of insurance companies. IFS ratings measure an insurance
company’s ability to meet its obligations to contract holders and policyholders. High ratings help maintain public
confidence in a company’s products, facilitate marketing of products and enhance its competitive position.
Downgrades of the IFS ratings of our insurance companies could prevent these companies from selling, or make it
more difficult for them to succeed in selling, products and services, or result in increased policy cancellations,
termination of assumed reinsurance contracts, or return of premiums. Under credit rating agency policies concerning
the relationship between parent and subsidiary ratings, a downgrade in AIG Parent’s credit ratings could result in a
downgrade of the IFS ratings of our insurance subsidiaries.
BUSINESS AND OPERATIONS..............................................................................................................................................................................................
Interest rate fluctuations, increased surrenders, investment returns and other events may require our
subsidiaries to accelerate the amortization of DAC, and record additional liabilities for future policy benefits.
DAC represents deferred costs that are incremental and directly related to the successful acquisition of new business
or renewal of existing business. The amortization of DAC associated with our Life and Retirement Services business
is affected by factors that include current and expected interest rate fluctuations, surrender rates and investment
returns. Changes in these factors may require our subsidiaries to accelerate the amortization of DAC and record
additional liabilities for future policy benefits. For example, when interest rates rise, customers may buy a
competitor’s insurance products with higher anticipated returns. This can lead to an increase in policy loans, policy
surrenders, withdrawals of life insurance policies, and withdrawals of annuity contracts, causing an acceleration of the
amortization of DAC. If DAC amortization exceeds the fees we earn upon surrender or withdrawals, our results of
operations could be negatively affected.
..................................................................................................................................................................................................................................
AIG 2012 Form 10-K 35
I T E M 1 A / R I S K F A C T O R S

.....................................................................................................................................................................................
We regularly review DAC for insurance-oriented, investment-oriented, and retirement services products to assess
recoverability. This review involves estimating the future profitability of in-force business and requires significant
management judgment. If future profitability is substantially lower than estimated, we could be required to accelerate
DAC amortization.
Periodically, we evaluate the estimates used in establishing liabilities for future policy benefits for life and A&H
insurance contracts, which include liabilities for certain payout annuities. We evaluate these estimates against actual
experience and make adjustments based on judgments about mortality, morbidity, persistency, maintenance
expenses, and investment returns, including the interest rate environment and net realized capital gains (losses). If
actual experience or estimates result in changes to projected future losses on long duration insurance contracts, we
may be required to record additional liabilities through a charge to policyholder benefit expense, which could
negatively affect our results of operations. For further discussion of DAC and future policy benefits, see Item 7.
MD&A – Critical Accounting Estimates and Notes 2, 10 and 13 to the Consolidated Financial Statements.
Certain of our products offer guarantees that may decrease our earnings and increase the volatility of our
results. We offer variable annuity products that guarantee a certain level of benefits, such as guaranteed minimum
death benefits (GMDB), guaranteed minimum income benefits (GMIB), guaranteed minimum withdrawal benefits
(GMWB) and guaranteed minimum account value benefits (GMAV). At December 31, 2012, our net liabilities
associated with these guaranteed benefits were $1.4 billion. We use reinsurance combined with derivative
instruments to mitigate our exposure to these liabilities. While we believe that our actions have mitigated the risks
related to guaranteed benefits, our exposure is not fully hedged; in addition, we remain liable if reinsurers or
counterparties are unable or unwilling to pay. Finally, downturns in equity markets, increased equity volatility or
reduced interest rates could result in an increase in the liabilities associated with the guaranteed benefits, reducing
our net income and shareholders’ equity.
Indemnity claims could be made against us in connection with divested businesses. We have provided
financial guarantees and indemnities in connection with the businesses we have sold, including ALICO, as described
in greater detail in Note 16 to the Consolidated Financial Statements. While we do not currently believe the claims
under these indemnities will be material, it is possible that significant indemnity claims could be made against us. If
such a claim or claims were successful, it could have a material adverse effect on our results of operations, cash
flows and liquidity. See Note 16 to the Consolidated Financial Statements for more information on these financial
guarantees and indemnities.
Our foreign operations expose us to risks that may affect our operations. We provide insurance, investment
and other financial products and services to both businesses and individuals in more than 130 countries. A
substantial portion of our AIG Property Casualty business is conducted outside the United States, and we intend to
continue to grow this business. Operations outside the United States, particularly in developing nations, may be
affected by regional economic downturns, changes in foreign currency exchange rates, political upheaval,
nationalization and other restrictive government actions, which could also affect our other operations.
The degree of regulation and supervision in foreign jurisdictions varies. Generally, AIG Parent, as well as its
subsidiaries operating in such jurisdictions, must satisfy local regulatory requirements. Licenses issued by foreign
authorities to our subsidiaries are subject to modification and revocation. Consequently, our insurance subsidiaries
could be prevented from conducting future business in some of the jurisdictions where they currently operate.
Adverse actions from any single country could adversely affect our results of operations depending on the magnitude
of the event and our financial exposure at that time in that country.
Significant conditions precedent must be satisfied in order to complete the sale of the common stock of
ILFC on the agreed terms. Under the terms of the share purchase agreement (Share Purchase Agreement) we
entered into for the sale of up to 90% of the common stock of ILFC (the ILFC Transaction) to an entity (the
Purchaser) formed on behalf of an investor group, consummation of the ILFC Transaction is subject to the
satisfaction or waiver of a number of conditions precedent, such as certain customary conditions and other closing
conditions, including the receipt of approvals or non-disapprovals from certain regulatory bodies, including, among
others:
• the People’s Republic of China National Development and Reform Commission,
• the Committee on Foreign Investment in the United States (CFIUS), and
• other antitrust and regulatory agencies,
..................................................................................................................................................................................................................................
AIG 2012 Form 10-K36
I T E M 1 A / R I S K F A C T O R S
.....................................................................................................................................................................................
in some cases, without the imposition on either party by such agencies of conditions that would qualify as
burdensome.
Any relevant regulatory body may refuse its approval or may seek to make its approval subject to compliance by
ILFC or the Purchaser with unanticipated or onerous conditions. Even if approval is not required, the regulator may
impose requirements on ILFC subsequent to consummation of the ILFC Transaction. We or the Purchaser may not
agree to such conditions or requirements and may have a contractual right to terminate the Share Purchase
Agreement.
In addition to other customary termination events, the Share Purchase Agreement allows termination (i) by any party
if the closing has not occurred on or before May 15, 2013, subject to an extension to June 17, 2013 if certain
conditions are met or (ii) by us if Purchaser has not paid the required deposit into an escrow account upon the later
of March 15, 2013 and ten days after approval of the transaction by CFIUS.
Because of the closing conditions and termination rights applicable to the ILFC Transaction, completion of the ILFC
Transaction is not assured or may be delayed or, even if the transaction is completed, the terms of the sale may
need to be significantly restructured.
Failure to complete the ILFC Transaction could negatively affect our businesses and financial results. If the
ILFC Transaction is not completed, the ongoing businesses of ILFC and AIG may be adversely affected and we will
be subject to several risks, including the following:
• alternative plans to dispose of ILFC, such as through a sale or initial public offering, may be difficult to structure
and may take extended periods of time to implement, depending on, among other things, the global economic and
regulatory environments and general market conditions;
• we may not be able to realize equivalent or greater value for ILFC under an alternative asset monetization plan
which could impact the carrying values of ILFC’s assets and liabilities;
• we will have incurred certain significant costs relating to the ILFC Transaction without receiving the benefits of the
ILFC Transaction, and may incur further significant costs if an alternative monetization plan is undertaken;
• negative customer perception could adversely affect ILFC’s ability to compete for, maintain or win new and existing
business in the marketplace; and
• potential further diversion of our management’s time and attention.
Significant legal proceedings may adversely affect our results of operations or financial condition. We are
party to numerous legal proceedings, including securities class actions and regulatory and governmental
investigations. Due to the nature of these proceedings, the lack of precise damage claims and the type of claims we
are subject to, we cannot currently quantify our ultimate or maximum liability for these actions. Developments in
these unresolved matters could have a material adverse effect on our consolidated financial condition or consolidated
results of operations for an individual reporting period. For a discussion of these unresolved matters, see Note 16 to
the Consolidated Financial Statements.
If we are unable to maintain the availability of our electronic data systems and safeguard the security of our
data, our ability to conduct business may be compromised, which could adversely affect our consolidated
financial condition or results of operations. We use computer systems to store, retrieve, evaluate and utilize
customer, employee, and company data and information. Some of these systems in turn, rely upon third-party
systems. Our business is highly dependent on our ability to access these systems to perform necessary business
functions, including providing insurance quotes, processing premium payments, making changes to existing policies,
filing and paying claims, administering variable annuity products and mutual funds, providing customer support and
managing our investment portfolios. Systems failures or outages could compromise our ability to perform these
functions in a timely manner, which could harm our ability to conduct business and hurt our relationships with our
business partners and customers. In the event of a natural disaster, a computer virus, a terrorist attack or other
disruption inside or outside the U.S., our systems may be inaccessible to our employees, customers or business
partners for an extended period of time, and our employees may be unable to perform their duties for an extended
period of time if our data or systems are disabled or destroyed. Our systems could also be subject to unauthorized
access, such as physical or electronic break-ins or unauthorized tampering. Like other global companies, we have,
from time to time, experienced threats to our data and systems, including malware and computer virus attacks,
..................................................................................................................................................................................................................................
AIG 2012 Form 10-K 37
I T E M 1 A / R I S K F A C T O R S

.....................................................................................................................................................................................
unauthorized access, systems failures and disruptions. AIG maintains cyber risk insurance, but this insurance may
not cover all costs associated with the consequences of personal, confidential or proprietary information being
compromised. In some cases, such unauthorized access may not be immediately detected. This may impede or
interrupt our business operations and could adversely affect our consolidated financial condition or results of
operations.
In addition, we routinely transmit, receive and store personal, confidential and proprietary information by email and
other electronic means. Although we attempt to keep such information confidential, we may be unable to do so in all
events, especially with clients, vendors, service providers, counterparties and other third parties who may not have or
use appropriate controls to protect confidential information. Furthermore, certain of our businesses are subject to
compliance with laws and regulations enacted by U.S. federal and state governments, the European Union or other
jurisdictions or enacted by various regulatory organizations or exchanges relating to the privacy and security of the
information of clients, employees or others. The compromise of personal, confidential or proprietary information could
result in remediation costs, legal liability, regulatory action and reputational harm.
BUSINESS AND OPERATIONS OF ILFC PRIOR TO COMPLETION OF THE ILFC TRANSACTION..............................................................................................................................................................................................
We will be subject to the following risks until we complete the ILFC Transaction:
Our aircraft leasing business depends on lease revenues and exposes us to the risk of lessee
nonperformance. A decrease in ILFC’s customers’ ability to meet their obligations to ILFC under their leases may
negatively affect our business, results of operations and cash flows.
ILFC’s aircraft may become obsolete over time. Aircraft are long-lived assets requiring long lead times to develop
and manufacture. Particular models and types of aircraft may become obsolete and less in demand over time, when
newer, more advanced and efficient aircraft or aircraft engines are manufactured. This life cycle, however, can be
shortened by world events, government regulation or customer preferences. As aircraft in ILFC’s fleet approach
obsolescence, demand for particular models and types may decrease. This may result in declining lease rates,
losses on sales, impairment charges or fair value adjustments and may adversely affect ILFC’s business and our
consolidated financial condition, results of operations and cash flows.
The residual value of ILFC’s aircraft is subject to a number of risks and uncertainties. Technological
developments, macro-economic conditions, availability and cost of funding for aviation, and the overall health of the
airline industry impact the residual values of ILFC’s aircraft. If challenging economic conditions persist for extended
periods, the residual values of ILFC’s aircraft could be negatively impacted, which could result in future impairments.
COMPETITION AND EMPLOYEES..............................................................................................................................................................................................
We face intense competition in each of our businesses. Our businesses operate in highly competitive
environments, both domestically and overseas. Our principal competitors are other large multinational insurance
organizations, as well as banks, investment banks and other non-bank financial institutions. The insurance industry in
particular is highly competitive. Within the U.S., AIG Property Casualty subsidiaries compete with approximately
3,300 other stock companies, specialty insurance organizations, mutual insurance companies and other underwriting
organizations. AIG Life and Retirement subsidiaries compete in the U.S. with approximately 1,800 life insurance
companies and other participants in related financial services fields. Overseas, our subsidiaries compete for business
with the foreign insurance operations of large U.S. insurers and with global insurance groups and local companies.
The past reduction of our credit ratings and the lingering effects of AIG’s negative publicity have made, and may
continue to make, it more difficult to compete to retain existing customers and to maintain our historical levels of
business with existing customers and counterparties. General insurance and life insurance companies compete
through a combination of risk acceptance criteria, product pricing, and terms and conditions. Retirement services
companies compete through crediting rates and the issuance of guaranteed benefits. A decline in our position as to
any one or more of these factors could adversely affect our profitability.
..................................................................................................................................................................................................................................
AIG 2012 Form 10-K38
I T E M 1 A / R I S K F A C T O R S

.....................................................................................................................................................................................
Competition for employees in our industry is intense, and we may not be able to attract and retain the highly
skilled people we need to support our business. Our success depends, in large part, on our ability to attract and
retain key people. Due to the intense competition in our industry for key employees with demonstrated ability, we
may be unable to hire or retain such employees. Losing any of our key people also could have a material adverse
effect on our operations given their skills, knowledge of our business, years of industry experience and the potential
difficulty of promptly finding qualified replacement employees. Our results of operations and financial condition could
be materially adversely affected if we are unsuccessful in attracting and retaining key employees.
Mr. Benmosche may be unable to continue to provide services to AIG due to his health. Robert Benmosche,
our President and Chief Executive Officer, was diagnosed with cancer and has been undergoing treatment for his
disease. He continues to fulfill all of his responsibilities and has stated his desire to continue in such roles beyond
2013. However, his condition may change and prevent him from continuing to perform these roles.
Employee error and misconduct may be difficult to detect and prevent and may result in significant losses.
There have been a number of cases involving fraud or other misconduct by employees in the financial services
industry in recent years and we run the risk that employee misconduct could occur. Instances of fraud, illegal acts,
errors, failure to document transactions properly or to obtain proper internal authorization, or failure to comply with
regulatory requirements or our internal policies may result in losses. It is not always possible to deter or prevent
employee misconduct, and the controls that we have in place to prevent and detect this activity may not be effective
in all cases.
REGULATION..............................................................................................................................................................................................
Our businesses are heavily regulated and changes in regulation may affect our operations, increase our
insurance subsidiary capital requirements or reduce our profitability. Our operations generally, and our
insurance subsidiaries, in particular, are subject to extensive supervision and regulation by national authorities and by
the various jurisdictions in which we do business. Supervision and regulation relate to numerous aspects of our
business and financial condition. The primary purpose of insurance regulation is the protection of our insurance
contract holders, and not our investors. The extent of domestic regulation varies, but generally is governed by state
statutes. These statutes delegate regulatory, supervisory and administrative authority to state insurance departments.
We strive to maintain all required licenses and approvals. However, our businesses may not fully comply with the
wide variety of applicable laws and regulations. The relevant authority’s interpretation of the laws and regulations
also may change from time to time. Regulatory authorities have relatively broad discretion to grant, renew or revoke
licenses and approvals. If we do not have the required licenses and approvals or do not comply with applicable
regulatory requirements, these authorities could preclude or temporarily suspend us from carrying on some or all of
our activities or impose substantial fines. Further, insurance regulatory authorities have relatively broad discretion to
issue orders of supervision, which permit them to supervise the business and operations of an insurance company.
In the U.S., the risk based capital (RBC) formula is designed to measure the adequacy of an insurer’s statutory
surplus in relation to the risks inherent in its business. Virtually every state has adopted, in substantial part, the RBC
Model Law promulgated by the National Association of Insurance Commissioners (NAIC), which specifies the
regulatory actions the insurance regulator may take if an insurer’s RBC calculations fall below specific thresholds.
Those actions range from requiring an insurer to submit a plan describing how it would regain a specified RBC ratio,
to a mandatory regulatory takeover of the company.
The degree of regulation and supervision in foreign jurisdictions varies. Generally, AIG Parent, as well as its
subsidiaries operating in such jurisdictions, must satisfy local regulatory requirements. Licenses issued by foreign
authorities to our subsidiaries are subject to modification and revocation. Thus, our insurance subsidiaries could be
prevented from conducting future business in certain of the jurisdictions where they currently operate. Adverse
actions from any single country could adversely affect our results of operations, liquidity and financial condition,
depending on the magnitude of the event and our financial exposure at that time in that country.
Our status as a savings and loan holding company and the enactment of the Dodd-Frank Wall Street Reform
and Consumer Protection Act (Dodd-Frank) will subject us to substantial additional federal regulation, either
or both of which may materially and adversely affect our businesses, results of operations and cash flows.
On July 21, 2010, Dodd-Frank, which effects comprehensive changes to the regulation of financial services in the
United States, was signed into law. Dodd-Frank directs existing and newly created government agencies and bodies
..................................................................................................................................................................................................................................
AIG 2012 Form 10-K 39
I T E M 1 A / R I S K F A C T O R S

.....................................................................................................................................................................................
to promulgate regulations implementing the law, an ongoing process anticipated to continue over the next few years.
We cannot predict with certainty the requirements of the regulations ultimately adopted or how or whether
Dodd-Frank and such regulations will affect our businesses, results of operations or cash flows, or require us to raise
additional capital.
We are regulated by the Board of Governors of the Federal Reserve System (FRB) and subject to its examination,
supervision and enforcement authority and reporting requirements as a savings and loan holding company (SLHC).
The FRB, the Office of the Comptroller of the Currency and the Federal Deposit Insurance Corporation have
proposed revised minimum leverage and risk-based capital requirements that would apply to all bank holding
companies and SLHCs, as well as to insured depository institutions, such as AIG Federal Savings Bank. As a result
of our regulation by the FRB as an SLHC:
• The FRB exercises general supervisory authority over us.
• The FRB, as a prudential matter, may limit our ability to pay dividends and purchase shares of AIG Common
Stock.
• The FRB is required to impose minimum leverage and risk-based capital requirements on us that are not less than
those applicable to insured depository institutions.
In addition, under Dodd-Frank we may separately become subject to the examination, enforcement and supervisory
authority of the FRB as a nonbank systemically important financial institution (SIFI). In October 2012, we received a
notice that we are under consideration by the Financial Stability Oversight Council (Council) for a proposed
determination that we are a SIFI. The notice stated that we will be reviewed in Stage 3 of the SIFI determination
process described in the Council’s interpretive guidance for nonbank financial company determinations. If we are
designated as a SIFI:
• We would become subject to stress tests to determine whether, on a consolidated basis, we have the capital
necessary to absorb losses due to adverse economic conditions.
• We would be subject to stricter prudential standards, including stricter requirements and limitations relating to
risk-based capital, leverage, liquidity and credit exposure, as well as overall risk management requirements,
management interlock prohibitions and a requirement to maintain a plan for rapid and orderly dissolution in the
event of severe financial distress.
• We would become subject to a new early remediation regime process to be administered by the FRB.
• If we are designated as a SIFI and determined to be a ‘‘grave threat’’ to U.S. financial stability:
• We would be required to maintain a debt-to-equity ratio of no more than 15:1.
• The FRB may:
• limit our ability to merge with, acquire, consolidate with, or become affiliated with another company;
• restrict our ability to offer specified financial products;
• require us to terminate specified activities;
• impose conditions on how we conduct our activities; or
• with approval of the Council, and a determination that the foregoing actions are inadequate to mitigate a
threat to U.S. financial stability, require us to sell or otherwise transfer assets or off-balance-sheet items to
unaffiliated entities.
In addition, the regulations applicable to SIFIs and to SLHCs, when all have been adopted as final rules, may differ
materially from each other.
See Item 1. Business – Regulation for further discussion of this potential regulation.
Further, if we continue to control AIG Federal Savings Bank or another insured depository institution, as of July 21,
2014, we will be required to conform to the ‘‘Volcker Rule’’, which prohibits ‘‘proprietary trading’’ and the sponsoring
or investing in ‘‘covered funds’’. The term ‘‘covered funds’’ includes hedge, private equity or similar funds and, in
certain cases, issuers of asset backed securities if such securities have equity-like characteristics. These prohibitions
could have a substantial impact on our investment portfolios as they are currently managed. The Volcker Rule, as
..................................................................................................................................................................................................................................
AIG 2012 Form 10-K40
I T E M 1 A / R I S K F A C T O R S

.....................................................................................................................................................................................
proposed, contains an exemption for proprietary trading by insurance companies for their general account, but the
final breadth and scope of this exemption cannot be predicted. Even if we no longer controlled an insured depository
institution, Dodd-Frank authorizes the FRB to subject SIFIs to additional capital and quantitative limitations if they
engage in activities prohibited for depository institutions by the Volcker Rule.
In addition, Dodd-Frank establishes a new framework for regulation of over-the-counter (OTC) derivatives under
which we may have to provide or increase collateral under the terms of bilateral agreements with derivatives
counterparties. These additional obligations to post collateral or the costs of assignment, termination or obtaining
alternative credit could have a material adverse effect on us. This new framework may also increase the cost of
conducting a hedging program or have other effects materially adverse to us.
We cannot predict the requirements of the regulations ultimately adopted, the level and magnitude of supervision we
may become subject to, or how Dodd-Frank and such regulations will affect the financial markets generally or our
businesses, results of operations or cash flows. It is possible that the regulations adopted under Dodd-Frank and our
regulation by the FRB as an SLHC could significantly alter our business practices, require us to raise additional
capital, impose burdensome and costly requirements and additional costs. Some of the regulations may also affect
the perceptions of regulators, customers, counterparties, creditors or investors about our financial strength and could
potentially affect our financing costs.
The USA PATRIOT Act, the Office of Foreign Assets Control and similar laws that apply to us may expose us
to significant penalties. The operations of our subsidiaries are subject to laws and regulations, including, in some
cases, the USA PATRIOT Act of 2001, which require companies to know certain information about their clients and
to monitor their transactions for suspicious activities. Also, the Department of the Treasury’s Office of Foreign Assets
Control administers regulations requiring U.S. persons to refrain from doing business, or allowing their clients to do
business through them, with certain organizations or individuals on a prohibited list maintained by the U.S.
government or with certain countries. The United Kingdom, the European Union and other jurisdictions maintain
similar laws and regulations. Although we have instituted compliance programs to address these requirements, there
are inherent risks in global transactions.
Attempts to mitigate the impact of Regulation XXX and Actuarial Guideline AXXX may fail in whole or in part
resulting in an adverse effect on our financial condition and results of operations. The NAIC Model Regulation
‘‘Valuation of Life Insurance Policies’’ (‘‘Regulation XXX’’) requires insurers to establish additional statutory reserves
for term life insurance policies with long-term premium guarantees and universal life policies with secondary
guarantees. In addition, NAIC Actuarial Guideline 38 (AXXX) (Guideline AXXX) clarifies the application of
Regulation XXX as to certain universal life insurance policies with secondary guarantees. The application of
Regulation XXX and Guideline AXXX involves numerous interpretations. At times, there may be differences of
opinion between management and state insurance departments about the application of these and other actuarial
guidelines. Consequently, a state insurance regulator may require greater reserves to support insurance liabilities
than management has estimated.
We have implemented intercompany reinsurance and capital management actions to mitigate the capital impact of
Regulation XXX and Guideline AXXX. In so doing, we focus on identifying cost-effective opportunities to manage our
intercompany reinsurance transactions, particularly with respect to certain redundant statutory reserve requirements
on Regulation XXX and Guideline AXXX reserves. Our efforts have included the use of an intercompany reinsurance
arrangement for Regulation XXX and Guideline AXXX reserves and the use of letters of credit to support the
reinsurance provided by our affiliated reinsurance subsidiary. All of these letters of credit are due to mature on
December 31, 2015. The reinsurance and capital management actions we have taken may not be sufficient to offset
regulatory, rating agency or other requirements. In that case, we could be required to increase statutory reserves or
incur higher operating and/or tax costs. If we are unable to implement actions to mitigate the impact of
Regulation XXX or Guideline AXXX on future sales of term and universal life insurance products, we may reduce the
sales of these products or incur higher operating costs or it may impact our sales of these products.
New regulations promulgated from time to time may affect our businesses, results of operations, financial
condition and ability to compete effectively. Legislators and regulators may periodically consider various
proposals that may affect the profitability of certain of our businesses. New regulations may even affect our ability to
conduct certain businesses at all, including proposals relating to restrictions on the type of activities in which financial
institutions are permitted to engage and the size of financial institutions. These proposals could also impose
additional taxes on a limited subset of financial institutions and insurance companies (either based on size, activities,
..................................................................................................................................................................................................................................
AIG 2012 Form 10-K 41
I T E M 1 A / R I S K F A C T O R S

.....................................................................................................................................................................................
geography, government support or other criteria). It is uncertain whether and how these and other such proposals
would apply to us or our competitors or how they could impact our consolidated results of operations, financial
condition and ability to compete effectively.
An ‘‘ownership change’’ could limit our ability to utilize tax losses and credits carryforwards to offset future
taxable income. As of December 31, 2012, we had a U.S. federal net operating loss carryforward of approximately
$40.9 billion, $17.3 billion in capital loss carryforwards and $5.5 billion in foreign tax credits (tax losses and credits
carryforwards). Our ability to use such tax attributes to offset future taxable income may be significantly limited if we
experience an ‘‘ownership change’’ as defined in Section 382 of the Internal Revenue Code of 1986, as amended
(the Code). In general, an ownership change will occur when the percentage of AIG Parent’s ownership (by value) of
one or more ‘‘5-percent shareholders’’ (as defined in the Code) has increased by more than 50 percent over the
lowest percentage owned by such shareholders at any time during the prior three years (calculated on a rolling
basis). An entity that experiences an ownership change generally will be subject to an annual limitation on its
pre-ownership change tax losses and credits carryforwards equal to the equity value of the corporation immediately
before the ownership change, multiplied by the long-term, tax-exempt rate posted monthly by the IRS (subject to
certain adjustments). The annual limitation would be increased each year to the extent that there is an unused
limitation in a prior year. The limitation on our ability to utilize tax losses and credits carryforwards arising from an
ownership change under Section 382 would depend on the value of our equity at the time of any ownership change.
If we were to experience an ‘‘ownership change’’, it is possible that a significant portion of our tax losses and credits
carryforwards could expire before we would be able to use them to offset future taxable income.
On March 9, 2011, our Board of Directors adopted a Tax Asset Protection Plan (the Plan) to help protect these tax
losses and credits carryforwards. At our 2011 Annual Meeting of Shareholders, shareholders ratified the Plan. At the
same time, shareholders adopted a protective amendment to our Restated Certificate of Incorporation, which is
designed to prevent certain transfers of AIG Common Stock that could result in an ‘‘ownership change’’. The Plan is
designed to reduce the likelihood of an ‘‘ownership change’’ by (i) discouraging any person or group from becoming
a 4.99 percent shareholder and (ii) discouraging any existing 4.99 percent shareholder from acquiring additional
shares of AIG Common Stock. The Protective Amendment generally restricts any transfer of AIG Common Stock that
would (i) increase the ownership by any person to 4.99 percent or more of AIG stock then outstanding or (ii) increase
the percentage of AIG stock owned by a Five Percent Stockholder (as defined in the Plan). Despite the intentions of
the Plan and the Protective Amendment to deter and prevent an ‘‘ownership change’’, such an event may still occur.
In addition, the Plan and the Protective Amendment may make it more difficult and more expensive to acquire us,
and may discourage open market purchases of AIG Common Stock or a non-negotiated tender or exchange offer for
AIG Common Stock. Accordingly, the Plan and the Protective Amendment may limit a shareholder’s ability to realize
a premium over the market price of AIG Common Stock in connection with any stock transaction.
Changes in tax laws could increase our corporate taxes, reduce our deferred tax assets or make some of our
products less attractive to consumers. Changes in tax laws or their interpretation could negatively impact our
business or results. Some proposed changes could have the effect of increasing our effective tax rate by reducing
deductions or increasing income inclusions, such as by limiting rules that allow for deferral of tax on certain foreign
insurance income. Conversely, other changes, such as lowering the U.S. federal corporate tax rate discussed
recently in the context of tax reform, could reduce the value of our deferred tax assets. In addition, changes in the
way foreign taxes can be credited against U.S. taxes, methods for allocating interest expense, the ways insurance
companies calculate and deduct reserves for tax purposes, and impositions of new or changed premium, value
added and other indirect taxes could increase our tax expense, thereby reducing earnings.
In addition to proposing to change the taxation of corporations in general and insurance companies in particular, the
Executive Branch of the Federal Government and Congress have recently considered proposals that could increase
taxes on owners of insurance products. For example, there are proposals that would limit the deferral of tax on
income from life and annuity contracts relative to other investment products. These changes could reduce demand in
the U.S. for life insurance and annuity contracts, or cause consumers to shift from these contracts to other
investments, which would reduce our income due to lower sales of these products or potential increased surrenders
of in-force business.
Governments’ need for additional revenue makes it likely that there will be continued proposals to change tax rules in
ways that would reduce our earnings. However, it remains difficult to predict whether or when there will be any tax
law changes having a material adverse effect on our financial condition or results of operations.
..................................................................................................................................................................................................................................
AIG 2012 Form 10-K42
I T E M 1 A / R I S K F A C T O R S

.....................................................................................................................................................................................
ESTIMATES AND ASSUMPTIONS..............................................................................................................................................................................................
Actual experience may differ from management’s estimates used in the preparation of financial statements.
Our financial statements are prepared in conformity with U.S. Generally Accepted Accounting Principles, which
requires the application of accounting policies that often involve a significant degree of judgment. The accounting
policies that we consider most dependent on the application of estimates and assumptions, and therefore may be
viewed as critical accounting estimates, are described in Item 7. MD&A – Critical Accounting Estimates. These
accounting estimates require the use of assumptions, some of which are highly uncertain at the time of estimation.
These estimates are based on judgment, current facts and circumstances, and, when applicable, internally developed
models. Therefore, actual results could differ from these estimates, possibly in the near term, and could have a
material effect on our consolidated financial statements.
Our ability to achieve our long-term goals, including return on equity (ROE) and earnings per share (EPS), is
based on significant assumptions, and our actual results may differ, possibly materially, from these goals. In
setting our long-term goals for ROE and EPS, described in Part I, Item 2. MD&A – Long-Term Aspirational Goals in
our Quarterly Report on Form 10-Q for the quarterly period ended March 31, 2011, we made significant assumptions
that include, among other things:
• the general conditions of the markets in which we operate;
• revenues and combined ratios of our subsidiaries;
• investment yields;
• our subsidiaries’ capacity to distribute dividends to AIG Parent;
• our ability to deploy capital towards share purchases, dividend payments, acquisitions or organic growth;
• the impact of a change in our credit ratings on our ability to maintain financial leverage;
• the exclusion of the reversal of the tax valuation allowance on shareholders’ equity in calculating our long-term
ROE goal;
• effectiveness of our cost rationalization measures;
• regulatory approval of our planned actions (including share purchases, dividend payments or acquisitions);
• the overall credit rating implications of our proposed strategic actions; and
• general financial market and interest rate conditions.
These assumptions are not historical facts but instead represent our expectations about future events. Many of these
events, by their nature, are inherently subject to significant uncertainties and contingencies and are outside our
control. It is very likely that actual events and results will differ from some or all of the assumptions we made. While
we remain committed to our long-term aspirational goals, our actual results are likely to differ from these aspirational
goals and the difference may be material and adverse.
The aspirational goals and their underlying assumptions are forward-looking statements. Shareholders and other
investors should not place undue reliance on any of these assumptions or aspirational goals. We are not under any
obligation (and expressly disclaim any obligation) to update or alter any assumptions, goals, projections or other
related statements, whether written or oral, that may be made from time to time, whether as a result of new
information, future events or otherwise. See Cautionary Statement Regarding Forward-Looking Information for
additional information about forward-looking statements.
..................................................................................................................................................................................................................................
AIG 2012 Form 10-K 43
I T E M 1 A / R I S K F A C T O R S

..............................................................................................................................................................................................
There are no material unresolved written comments that were received from the SEC staff 180 days or more beforethe end of AIG’s fiscal year relating to AIG’s periodic or current reports under the Exchange Act.
..............................................................................................................................................................................................
AIG and its subsidiaries operate from over 400 offices in the United States and approximately 600 offices in over 75foreign countries. The following offices are located in buildings in the United States owned by AIG and itssubsidiaries:
AIG Property Casualty: AIG Life and Retirement:
• 175 Water Street in New York, New York • Amarillo, Ft. Worth and Houston, Texas
• Wilmington, Delaware • Nashville, Tennessee
• Stevens Point, Wisconsin
• San Juan, Puerto Rico
Other Operations:
• Greensboro and Winston-Salem, North Carolina
• Livingston, New Jersey
• Stowe, Vermont
In addition, AIG Property Casualty owns offices in approximately 20 foreign countries and jurisdictions includingArgentina, Bermuda, Colombia, Ecuador, Japan, Mexico, the U.K., Taiwan, and Venezuela. The remainder of theoffice space utilized by AIG and its subsidiaries is leased. AIG believes that its leases and properties are sufficientfor its current purposes.
LOCATIONS OF CERTAIN ASSETS..............................................................................................................................................................................................
As of December 31, 2012, approximately 11 percent of the consolidated assets of AIG were located outside the U.S.and Canada, including $260 million of cash and securities on deposit with regulatory authorities in those locations.See Note 3 to the Consolidated Financial Statements for additional geographic information. See Note 7 to theConsolidated Financial Statements for total carrying values of cash and securities deposited by our insurancesubsidiaries under requirements of regulatory authorities.
Operations outside the U.S. and Canada and assets held abroad may be adversely affected by politicaldevelopments in foreign countries, including tax changes, nationalization and changes in regulatory policy, as well asby consequence of hostilities and unrest. The risks of such occurrences and their overall effect upon AIG vary fromcountry to country and cannot easily be predicted. If expropriation or nationalization does occur, AIG’s policy is totake all appropriate measures to seek recovery of any affected assets. Certain of the countries in which AIG’sbusiness is conducted have currency restrictions that generally cause a delay in a company’s ability to repatriateassets and profits. See also Item 1A. Risk Factors – Business and Operations for additional information.
..............................................................................................................................................................................................
For a discussion of legal proceedings, see Note 16 – Legal Contingencies to the Consolidated Financial Statements,which is incorporated herein by reference.
..............................................................................................................................................................................................
Not applicable.
..................................................................................................................................................................................................................................
AIG 2012 Form 10-K44
ITEM 1B / UNRESOLVED STAFF COMMENTS
ITEM 2 / PROPERTIES
ITEM 3 / LEGAL PROCEEDINGS
ITEM 4 / MINE SAFETY DISCLOSURES

.....................................................................................................................................................................................
PART II..............................................................................................................................................................................................
..............................................................................................................................................................................................
AIG’s common stock, par value $2.50 per share (AIG Common Stock), is listed on the New York Stock Exchange
(NYSE: AIG), as well as on the Tokyo Stock Exchange. There were approximately 37,550 stockholders of record of
AIG Common Stock as of January 31, 2013.
The following table presents high and low closing sale prices on the New York Stock Exchange Composite
Tape and the dividends paid per share of AIG Common Stock for each quarter of 2012 and 2011:
First quarter $ 61.18* $ 34.95 $ –
Second quarter 35.00 27.23 –
Third quarter 30.21 21.61 –
Fourth quarter 26.34 20.07 –
* Includes the effect of the AIG Common Stock trading with due bills for the dividend paid in the form of
warrants.
From November 2008 through January 14, 2011, AIG was unable to pay dividends under the terms of certain series
of AIG preferred stock that were then outstanding. From January 14, 2011 to May 2011, we were unable to pay
dividends on AIG Common Stock, due to restrictions relating to the AIG Series G Cumulative Mandatory Convertible
Preferred Stock, par value $5.00 per share (the Series G Preferred Stock). The Series G Preferred Stock was
cancelled in connection with AIG’s public offering of AIG Common Stock in May 2011. Our ability to pay dividends
has not been subject to any contractual restrictions since the cancellation of the Series G Preferred Stock.
Any payment of dividends must be approved by AIG’s Board of Directors. In determining whether to pay any
dividend, our Board of Directors may consider AIG’s financial position, the performance of our businesses, our
consolidated financial condition, results of operations and liquidity, available capital, the existence of investment
opportunities, and other factors. AIG is subject to restrictions on the payment of dividends and purchases of AIG
Common Stock as a result of being regulated as a savings and loan holding company. AIG may become subject to
other restrictions on the payment of dividends and purchases of AIG Common Stock if it is designated a SIFI. See
Item 1A. Risk Factors – Regulation for further discussion of this regulation.
For a discussion of certain restrictions on the payment of dividends to AIG by some of its insurance subsidiaries, see
Item 1A. Risk Factors – Liquidity, Capital and Credit – AIG Parent’s ability to access funds from our subsidiaries is
limited, and Note 17 to the Consolidated Financial Statements.
EQUITY COMPENSATION PLANS..............................................................................................................................................................................................
Our table of equity compensation plans will be included in the definitive proxy statement for AIG’s 2013 Annual
Meeting of Shareholders. The definitive proxy statement will be filed with the SEC no later than 120 days after the
end of AIG’s fiscal year pursuant to Regulation 14A.
PURCHASES OF EQUITY SECURITIES..............................................................................................................................................................................................
We purchased a total of 421,228,855 shares of AIG Common Stock for approximately $13.0 billion in four offerings of
AIG Common Stock by the Department of the Treasury during 2012. All purchases were authorized by our Board of
..................................................................................................................................................................................................................................
AIG 2012 Form 10-K 45
ITEM 5 / MARKET FOR REGISTRANT’S COMMON EQUITY,RELATED STOCKHOLDER MATTERS AND ISSUER PURCHASESOF EQUITY SECURITIES
$ 30.83 $ 23.54 $ –
34.76 27.21 –
35.02 30.15 –
37.21 30.68 –
2012 2011
Dividends Dividends
High Low Paid High Low Paid
I T E M 5 / M A R K E T F O R R E G I S T R A N T ’ S C O M M O N E Q U I T Y , R E L A T E D S T O C K H O L D E R M A T T E R S A N D
I S S U E R P U R C H A S E S O F E Q U I T Y S E C U R I T I E S

.....................................................................................................................................................................................
Directors. At December 31, 2012, our Board had not authorized any additional purchases. See Note 17 to the
Consolidated Financial Statements for additional information on AIG share purchases.
COMMON STOCK PERFORMANCE GRAPH..............................................................................................................................................................................................
The following Performance Graph compares the cumulative total shareholder return on AIG Common Stock for a
five-year period (December 31, 2007 to December 31, 2012) with the cumulative total return of the S&P’s 500 stock
index (which includes AIG) and a peer group of companies (the New Peer Group) consisting of fifteen insurance
companies to which we compare our business and operations:
• ACE Limited • Lincoln National Corporation
• AEGON, N.V. • MetLife, Inc.
• Aflac Incorporated • Principal Financial Group, Inc.
• Allianz Group • Prudential Financial, Inc.
• AXA Group • The Travelers Companies, Inc.
• The Chubb Corporation • XL Capital Ltd.
• CNA Financial Corporation • Zurich Insurance Group
• Hartford Financial Services Group, Inc.
The Performance Graph also compares the cumulative total shareholder return on AIG Common Stock to the return
of a group of companies (the Old Peer Group) consisting of ten insurance companies to which we compared our
business and operations in our Annual Report on Form 10-K for the year ended December 31, 2011:
• ACE Limited • MetLife, Inc.
• Allianz Group • Prudential Financial, Inc.
• The Chubb Corporation • The Travelers Companies, Inc.
• Hartford Financial Services Group, Inc. • XL Capital Ltd.
• Lincoln National Corporation • Zurich Insurance Group
AEGON, N.V., Aflac Incorporated, AXA Group, CNA Financial Corporation and Principal Financial Group, Inc. were
added to the New Peer Group because we believe the changes result in a peer group that is more comparable to
our overall business and operations. Dividend reinvestment has been assumed and returns have been weighted to
reflect relative stock market capitalization.
..................................................................................................................................................................................................................................
AIG 2012 Form 10-K46
I T E M 5 / M A R K E T F O R R E G I S T R A N T ’ S C O M M O N E Q U I T Y , R E L A T E D S T O C K H O L D E R M A T T E R S A N D
I S S U E R P U R C H A S E S O F E Q U I T Y S E C U R I T I E S

15FEB201317493176
.....................................................................................................................................................................................
Five-Year Cumulative Total Shareholder Returns
Value of $100 Invested on December 31, 2007
$150
$100
$50
$0
2007 2008
AMERICAN INTERNATIONAL GROUP S&P 500 INDEX NEW PEER GROUP OLD PEER GROUP
2009 2010Years Ending
2011 2012
As of December 31,
2007 2008 2009 2010 2011 2012
AIG $ 100.00 $ 2.91 $ 2.77 $ 5.33 $ 2.62
S&P 500 100.00 63.00 79.67 91.68 93.61
New Peer Group 100.00 55.09 64.18 69.34 60.13
Old Peer Group 100.00 55.12 65.95 76.00 68.06
..................................................................................................................................................................................................................................
AIG 2012 Form 10-K 47
$ 3.98
108.59
77.21
85.32
I T E M 5 / M A R K E T F O R R E G I S T R A N T ’ S C O M M O N E Q U I T Y , R E L A T E D S T O C K H O L D E R M A T T E R S A N D
I S S U E R P U R C H A S E S O F E Q U I T Y S E C U R I T I E S

.....................................................................................................................................................................................
..............................................................................................................................................................................................
The Selected Consolidated Financial Data should be read in conjunction with Management’s Discussion andAnalysis of Financial Condition and Results of Operations and the Consolidated Financial Statements andaccompanying notes included elsewhere herein.
Revenues:Premiums $ 38,990 $ 45,319 $ 48,583 $ 60,147Policy fees 2,705 2,710 2,656 2,990Net investment income 14,755 20,934 18,992 10,453Net realized capital gains (losses) 701 (716) (3,787) (50,426)Other income 2,661 4,582 3,729 (34,941)
Total revenues 59,812 72,829 70,173 (11,777)
Benefits, claims and expenses:Policyholder benefits and claims incurred 33,450 41,392 45,314 45,447Interest credited to policyholder account balances 4,467 4,487 4,611 5,582Amortization of deferred acquisition costs 5,486 5,821 6,670 6,425Other acquisition and insurance expenses 8,458 10,163 9,815 14,783Interest expense 2,444 6,742 13,237 14,440Net loss on extinguishment of debt 2,847 104 – –Net (gain) loss on sale of properties and divested businesses 74 (19,566) 1,271 –Other expenses 2,470 3,439 5,282 5,842
Total benefits, claims and expenses 59,696 52,582 86,200 92,519
Income (loss) from continuing operations before income taxes(b) 116 20,247 (16,027) (104,296)Income taxes expense (benefit) (19,424) 6,993 (2,551) (8,097)
Income (loss) from continuing operations 19,540 13,254 (13,476) (96,199)Income (loss) from discontinued operations, net of taxes 1,790 (969) 3,750 (6,683)
Net income (loss) 21,330 12,285 (9,726) (102,882)Net income (loss) attributable to AIG 20,622 10,058 (8,362) (101,784)
Income (loss) per common share attributable to AIG commonshareholders
Basic and dilutedIncome (loss) from continuing operations 10.03 16.50 (98.52) (725.89)Income (loss) from discontinued operations 0.98 (1.52) 27.15 (49.91)Net income (loss) attributable to AIG 11.01 14.98 (71.37) (775.80)
Dividends declared per common share – – – 8.40
Year-end balance sheet data:Total investments 410,438 410,412 601,165 636,912Total assets 553,054 675,573 838,346 848,552Long-term debt 75,253 106,461 136,733 177,485Total liabilities 442,138 568,363 748,550 797,692Total AIG shareholders’ equity 101,538 78,856 60,585 40,844Total equity 102,393 106,776 88,837 48,939
Book value per share(a) 53.53 561.40 448.54 303.71Book value per share, excluding Accumulated other
comprehensive income (loss)(a)(c) 50.11 498.25 400.90 353.97AIG Property Casualty combined ratio(d) 108.8 116.8 108.4 102.1
Other data (from continuing operations):Other-than-temporary impairments 1,280 3,039 6,696 41,867Adjustment to federal and foreign deferred tax valuation
allowance (18,307) 1,361 2,986 22,172Amortization of prepaid commitment fee 49 3,471 8,359 9,279Catastrophe-related losses $ 3,307 $ 1,076 $ 53 $ 1,840
(a) Comparability between 2010 and 2009 data is affected by the deconsolidation of AIA in the fourth quarter of 2010. Book value per share,excluding Accumulated other comprehensive income (loss) is a non-GAAP measure. See Item 7. MD&A – Use of Non-GAAP Measures foradditional information. Comparability of 2010, 2009 and 2008 is affected by a one for twenty reverse stock split.
(b) Reduced by fourth quarter reserve strengthening charges of $4.2 billion and $2.2 billion in 2010 and 2009, respectively, related to the annualreview of AIG Property Casualty loss and loss adjustment reserves.
(c) Amounts for periods after December 31, 2008 have been revised to reflect reclassification of income taxes from AOCI to additional paid incapital to correct the presentation of components of AIG Shareholders’ Equity. See Note 1 to the Consolidated Financial Statements for additionalinformation on the reclass.
(d) See Item 7. MD&A – Results of Operations – AIG Property Casualty Operations for a reconciliation of the adjusted combined ratio.
..................................................................................................................................................................................................................................
AIG 2012 Form 10-K48
ITEM 6 / SELECTED FINANCIAL DATA
Years Ended December 31,
(in millions, except per share data) 2012 2011 2010(a) 2009(a) 2008
$ 38,0112,791
20,343929
3,582
65,656
31,9774,3625,7099,2352,319
92
2,721
56,334
9,3221,570
7,752(4,052)
3,7003,438
4.44(2.40)2.04
–
375,824548,63348,500
449,63098,00298,669
66.38
57.87108.6
1,167
(1,907)–
$ 2,652
I T E M 6 / S E L E C T E D F I N A N C I A L D A T A
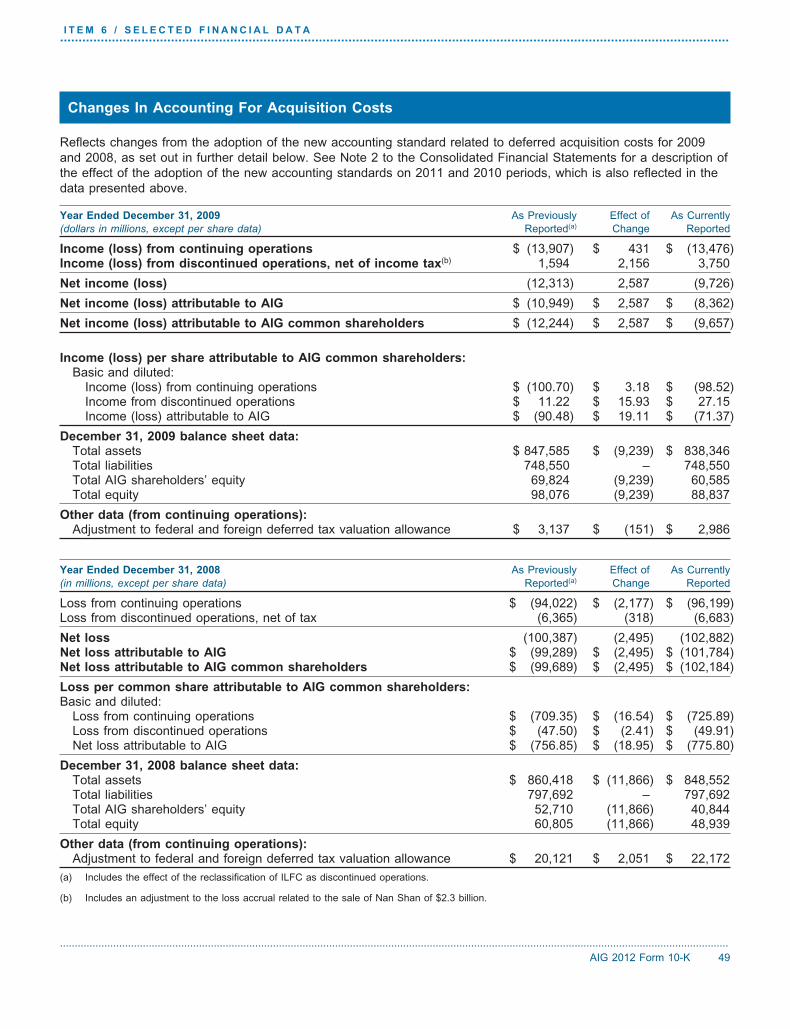
.....................................................................................................................................................................................
Changes In Accounting For Acquisition Costs
Reflects changes from the adoption of the new accounting standard related to deferred acquisition costs for 2009
and 2008, as set out in further detail below. See Note 2 to the Consolidated Financial Statements for a description of
the effect of the adoption of the new accounting standards on 2011 and 2010 periods, which is also reflected in the
data presented above.
Income (loss) from continuing operations $ (13,907) $ 431 $ (13,476)Income (loss) from discontinued operations, net of income tax(b) 1,594 2,156 3,750
Net income (loss) (12,313) 2,587 (9,726)
Net income (loss) attributable to AIG $ (10,949) $ 2,587 $ (8,362)
Net income (loss) attributable to AIG common shareholders $ (12,244) $ 2,587 $ (9,657)
Income (loss) per share attributable to AIG common shareholders:Basic and diluted:
Income (loss) from continuing operations $ (100.70) $ 3.18 $ (98.52)Income from discontinued operations $ 11.22 $ 15.93 $ 27.15Income (loss) attributable to AIG $ (90.48) $ 19.11 $ (71.37)
December 31, 2009 balance sheet data:Total assets $ 847,585 $ (9,239) $ 838,346Total liabilities 748,550 – 748,550Total AIG shareholders’ equity 69,824 (9,239) 60,585Total equity 98,076 (9,239) 88,837
Other data (from continuing operations):Adjustment to federal and foreign deferred tax valuation allowance $ 3,137 $ (151) $ 2,986
Loss from continuing operations $ (94,022) $ (2,177) $ (96,199)Loss from discontinued operations, net of tax (6,365) (318) (6,683)
Net loss (100,387) (2,495) (102,882)Net loss attributable to AIG $ (99,289) $ (2,495) $ (101,784)Net loss attributable to AIG common shareholders $ (99,689) $ (2,495) $ (102,184)
Loss per common share attributable to AIG common shareholders:Basic and diluted:
Loss from continuing operations $ (709.35) $ (16.54) $ (725.89)Loss from discontinued operations $ (47.50) $ (2.41) $ (49.91)Net loss attributable to AIG $ (756.85) $ (18.95) $ (775.80)
December 31, 2008 balance sheet data:Total assets $ 860,418 $ (11,866) $ 848,552Total liabilities 797,692 – 797,692Total AIG shareholders’ equity 52,710 (11,866) 40,844Total equity 60,805 (11,866) 48,939
Other data (from continuing operations):Adjustment to federal and foreign deferred tax valuation allowance $ 20,121 $ 2,051 $ 22,172
(a) Includes the effect of the reclassification of ILFC as discontinued operations.
(b) Includes an adjustment to the loss accrual related to the sale of Nan Shan of $2.3 billion.
..................................................................................................................................................................................................................................
AIG 2012 Form 10-K 49
Year Ended December 31, 2009 As Previously Effect of As Currently
(dollars in millions, except per share data) Reported(a) Change Reported
Year Ended December 31, 2008 As Previously Effect of As Currently
(in millions, except per share data) Reported(a) Change Reported
I T E M 6 / S E L E C T E D F I N A N C I A L D A T A

.....................................................................................................................................................................................
Items Affecting Comparability Between Periods
The following are significant developments that affected multiple periods and financial statement captions. Other
items that affected comparability are included in the footnotes to the table presented immediately above.
Market Events in 2008 and 2009..............................................................................................................................................................................................
AIG was significantly affected by the market turmoil in late 2008 and early 2009 and recognized other-than-temporary
impairment charges in 2008 related primarily to collateralized mortgage-backed securities, other structured securities
and securities of financial institutions; losses related to the change in AIG’s intent and ability to hold to recovery
certain securities; and losses related to AIG’s securities lending program.
In 2008, AIG also recognized unrealized market valuation losses representing the change in fair value of its super
senior credit default swap portfolio, established a deferred tax valuation allowance and experienced an
unprecedented strain on liquidity. This strain led to several transactions with the FRBNY and the Department of the
Treasury. See Note 25 to the Consolidated Financial Statements for further discussion of these transactions and
relationships.
FRBNY Activity and Effect on Interest Expense in 2008, 2009 and 2010..............................................................................................................................................................................................
The decline in interest expense in 2010 was due primarily to a reduced weighted-average interest rate on
borrowings, a lower average outstanding balance and a decline in amortization of the prepaid commitment fee asset
related to the partial repayment of the FRBNY Credit Facility. On January 14, 2011, AIG repaid the remaining
$20.7 billion and terminated this facility, resulting in a net $3.3 billion pretax charge in the first quarter of 2011,
representing primarily the accelerated amortization of the remaining prepaid commitment fee asset included in Net
loss on extinguishment of debt. See Note 25 to the Consolidated Financial Statements for further discussion of the
Recapitalization.
As a result of the closing of the Recapitalization on January 14, 2011, the preferred interests (the SPV Preferred
Interests) in the special purpose vehicles that held remaining AIA shares and the proceeds of the AIA initial public
offering and the ALICO sale (the SPVs) were transferred to the Department of the Treasury. After such closing, the
SPV Preferred Interests were not considered permanent equity on AIG’s Consolidated Balance Sheet and were
classified as redeemable non-controlling interests.
Asset Dispositions in 2010, 2011 and 2012..............................................................................................................................................................................................
On December 9, 2012, we announced the agreement to sell up to 90% of ILFC and executed multiple asset
dispositions in 2010 and 2011, as further discussed in Note 4 to the Consolidated Financial Statements, including the
completion of an initial public offering of AIA in 2010 for which AIG recognized an $18.1 billion gain.
Adjustment to Federal Deferred Tax Valuation Allowance in 2008, 2009, 2010, 2011 and 2012..............................................................................................................................................................................................
As further discussed in Note 24 to the Consolidated Financial Statements, AIG concluded that $18.4 billion of the
deferred tax asset valuation allowance for the U.S. consolidated income tax group should be released through the
Consolidated Statement of Operations in 2011. The valuation allowance resulted primarily from losses subject to U.S.
income taxes recorded from 2008 through 2010.
Capitalization and Book Value Per Share..............................................................................................................................................................................................
As a result of the closing of the Recapitalization on January 14, 2011, the remaining SPV Preferred Interests held by
the FRBNY of approximately $26.4 billion were purchased by AIG and transferred to the Department of the Treasury.
The SPV Preferred Interests were no longer considered permanent equity on AIG’s Consolidated Balance Sheet, and
were classified as redeemable non-controlling interests. See Note 18 to the Consolidated Financial Statements for
further discussion.
..................................................................................................................................................................................................................................
AIG 2012 Form 10-K50
I T E M 6 / S E L E C T E D F I N A N C I A L D A T A

.....................................................................................................................................................................................
The following table presents pro forma ratios as if the Recapitalization had been consummated in 2008 and a
reconciliation of book value per share to book value per share, excluding Accumulated other comprehensive
income (loss), which is a non-GAAP measure. See Item 7. MD&A – Use of Non-GAAP Measures for additional
information.*
Total AIG shareholders’ equity $ 101,538 $ 78,856 $ 60,585 $ 40,844
Recapitalization – (3,328) – –
Value on conversion of equity units – 2,169 5,880 5,880
Pro forma shareholders’ equity 101,538 77,697 66,465 46,724
Accumulated other comprehensive income
(loss) 6,481 8,871 6,435 (6,759)
Total AIG shareholders’ equity, excluding
Accumulated other comprehensive income
(loss) $ 95,057 $ 69,985 $ 54,150 $ 47,603
Total common shares outstanding 1,896,821,482 140,463,159 135,070,907 134,483,454
Issuable for equity units – 2,854,069 7,736,904 7,736,904
Shares assumed converted – 1,655,037,962 1,655,037,962 1,655,037,962
Pro forma common shares outstanding 1,896,821,482 1,798,355,190 1,797,845,773 1,797,258,320
Pro forma book value per share $ 43.20 $ 36.97 $ 26.00
Pro forma book value per share, excluding
Accumulated other comprehensive income
(loss) $ 38.27 $ 33.39 $ 29.76
* Amounts for periods after December 31, 2008 have been revised to reflect reclassification of income taxes from AOCI to additional paid in
capital to correct the presentation of components of AIG Shareholders’ Equity. See Note 1 to the Consolidated Financial Statements for additional
information on the reclass.
..................................................................................................................................................................................................................................
AIG 2012 Form 10-K 51
Years Ended December 31,
(in millions, except per share data) 2012 2011 2010 2009 2008
$ 98,002
–
–
98,002
12,574
$ 85,428
1,476,321,935
–
–
1,476,321,935
N/A N/A
N/A N/A
I T E M 6 / S E L E C T E D F I N A N C I A L D A T A

..............................................................................................................................................................................................
CAUTIONARY STATEMENT REGARDING FORWARD-LOOKING INFORMATION..............................................................................................................................................................................................
This Annual Report on Form 10-K and other publicly available documents may include, and officers and
representatives of American International Group, Inc. (AIG) may from time to time make, projections, goals,
assumptions and statements that may constitute ‘‘forward-looking statements’’ within the meaning of the Private
Securities Litigation Reform Act of 1995. These projections, goals, assumptions and statements are not historical
facts but instead represent only AIG’s belief regarding future events, many of which, by their nature, are inherently
uncertain and outside AIG’s control. These projections, goals, assumptions and statements include statements
preceded by, followed by or including words such as ‘‘believe,’’ ‘‘anticipate,’’ ‘‘expect,’’ ‘‘intend,’’ ‘‘plan,’’ ‘‘view,’’
‘‘target’’ or ‘‘estimate.’’ These projections, goals, assumptions and statements may address, among other things:
• the monetization of AIG’s interests in International • AIG’s strategy for risk management;
Lease Finance Corporation (ILFC), including whether• AIG’s generation of deployable capital;
AIG’s proposed sale of up to 90 percent of ILFC will
be completed and if completed, the timing and final • AIG’s return on equity and earnings per shareterms of such sale; long-term aspirational goals;
• AIG’s exposures to subprime mortgages, monoline • AIG’s strategies to grow net investment income,insurers, the residential and commercial real estate efficiently manage capital and reduce expenses;markets, state and municipal bond issuers and
• AIG’s strategies for customer retention, growth,sovereign bond issuers;
product development, market position, financial results• AIG’s exposure to European governments and and reserves; and
European financial institutions;• the revenues and combined ratios of AIG’s
subsidiaries.
It is possible that AIG’s actual results and financial condition will differ, possibly materially, from the results and
financial condition indicated in these projections, goals, assumptions and statements. Factors that could cause AIG’s
actual results to differ, possibly materially, from those in the specific projections, goals, assumptions and statements
include:
• changes in market conditions; • judgments concerning casualty insurance underwriting
and insurance liabilities;• the occurrence of catastrophic events, both natural
and man-made; • judgments concerning the recognition of deferred tax
assets;• significant legal proceedings;
• judgments concerning deferred policy acquisition costs• the timing and applicable requirements of any new
(DAC) recoverability; andregulatory framework to which AIG is subject as a
savings and loan holding company (SLHC), and if • such other factors discussed in:
such a determination is made, as a systemically• this Part II, Item 7. Management’s Discussion and
important financial institution (SIFI);Analysis of Financial Condition and Results of
• concentrations in AIG’s investment portfolios; Operations (MD&A); and
• actions by credit rating agencies; • Part I, Item 1A. Risk Factors of this Annual Report
on Form 10-K.
AIG is not under any obligation (and expressly disclaims any obligation) to update or alter any projections, goals,
assumptions or other statements, whether written or oral, that may be made from time to time, whether as a result of
new information, future events or otherwise.
..................................................................................................................................................................................................................................
AIG 2012 Form 10-K52
ITEM 7 / MANAGEMENT’S DISCUSSION AND ANALYSIS OFFINANCIAL CONDITION AND RESULTS OF OPERATIONS

The MD&A is organized as follows:
.............
54
56
68
Segment Results 71
AIG Property Casualty Operations 74
Liability for Unpaid Claims and Claims Adjustment Expense 88
AIG Life and Retirement Operations 99
Other Operations 111
Discontinued Operations 116
Consolidated Comprehensive Income (Loss) 116
120
Overview 120
Analysis of Sources and Uses of Cash 122
Liquidity and Capital Resources of AIG Parent and Subsidiaries 124
Credit Facilities 130
Contingent Liquidity Facilities 130
Contractual Obligations 131
Off-Balance Sheet Arrangements and Commercial Commitments 133
Debt 135
Credit Ratings 136
Regulation and Supervision 137
Dividend Restrictions 137
138
Market Conditions 138
Investment Strategies 138
Investment Highlights 138
Impairments 150
155
Overview 155
Credit Risk Management 157
Market Risk Management 162
172
195
199
Throughout the MD&A, we use certain terms and abbreviations which are summarized in the Glossary and Acronyms
on pages 195 and 199, respectively.
AIG has incorporated into this discussion a number of cross-references to additional information included throughout
this Annual Report on Form 10-K to assist readers seeking additional information related to a particular subject.
..................................................................................................................................................................................................................................
AIG 2012 Form 10-K 53
..............................................................................................................................................................................................
..............................................................................................................................................................................................
..............................................................................................................................................................................................
..............................................................................................................................................................................................
..............................................................................................................................................................................................
..............................................................................................................................................................................................
..............................................................................................................................................................................................
..............................................................................................................................................................................................
..............................................................................................................................................................................................
INDEX TO ITEM 7
Page
USE OF NON-GAAP MEASURES
EXECUTIVE OVERVIEW
RESULTS OF OPERATIONS
LIQUIDITY AND CAPITAL RESOURCES
INVESTMENTS
ENTERPRISE RISK MANAGEMENT
CRITICAL ACCOUNTING ESTIMATES
GLOSSARY
ACRONYMS

.....................................................................................................................................................................................
Use of Non-GAAP Measures
In Item 6. Selected Financial Data and throughout this MD&A, we present AIG’s financial condition and results of
operations in the way we believe will be most meaningful, representative and most transparent. Some of the
measurements we use are ‘‘non-GAAP financial measures’’ under SEC rules and regulations. GAAP is the acronym
for ‘‘accounting principles generally accepted in the United States.’’ The non-GAAP financial measures we present
may not be comparable to similarly-named measures reported by other companies.
Book Value Per Share Excluding Accumulated Other Comprehensive Income (Loss) (AOCI) is presented in
Item 6. Selected Financial Data and is used to show the amount of our net worth on a per-share basis. We believe
Book Value Per Share Excluding AOCI is useful to investors because it eliminates the effect of non-cash items that
can fluctuate significantly from period to period, including changes in fair value of our available for sale portfolio and
foreign currency translation adjustments. Book Value Per Share Excluding AOCI is derived by dividing Total AIG
shareholders’ equity, excluding AOCI, by Total common shares outstanding. The reconciliation to book value per
share, the most comparable GAAP measure, is presented in Item 6. Selected Financial Data.
We use the following operating performance measures because we believe they enhance understanding of the
underlying profitability of continuing operations and trends of AIG and our business segments. We believe they also
allow for more meaningful comparisons with our insurance competitors. When we use these measures,
reconciliations to the most comparable GAAP measure are provided in the Results of Operations section of this
MD&A.
• AIG – After-tax operating income (loss) is derived by excluding the following items from net income (loss):
income (loss) from discontinued operations, net loss (gain) on sale of divested businesses, income from divested
businesses, legacy FIN 48 and other tax adjustments, legal reserves (settlements) related to ‘‘legacy crisis
matters,’’ deferred income tax valuation allowance (releases) charges, amortization of the Federal Reserve Bank of
New York prepaid commitment fee asset, changes in fair value of AIG Life and Retirement fixed income securities
designated to hedge living benefit liabilities, change in benefit reserves and deferred policy acquisition costs (DAC),
value of business acquired (VOBA), and sales inducement assets (SIA) related to net realized capital (gains)
losses, (gain) loss on extinguishment of debt, net realized capital (gains) losses, non-qualifying derivative hedging
activities, excluding net realized capital (gains) losses and bargain purchase gain. ‘‘Legacy crisis matters’’ include
favorable and unfavorable settlements related to events leading up to and resulting from our September 2008
liquidity crisis. It also includes legal fees incurred by AIG as the plaintiff in connection with such legal matters.
• AIG Property Casualty
• Operating income (loss): In 2012, AIG Property Casualty revised its non-GAAP income measure from
underwriting income (loss) to operating income (loss), which includes both underwriting income (loss) and net
investment income, but not net realized capital (gains) losses or other (income) expense, legal settlements
related to legacy crisis matters described above and bargain purchase gain. Underwriting income (loss) is
derived by reducing net premiums earned by claims and claims adjustment expense and underwriting expenses;
which consist of the acquisition costs and general operating expenses;
• Ratios: AIG Property Casualty, along with most property and casualty insurance companies, uses the loss ratio,
the expense ratio and the combined ratio as measures of underwriting performance. These ratios are relative
measurements that describe, for every $100 of net premiums earned, the amount of claims and claims
adjustment expense, and the amount of other underwriting expenses that would be incurred. A combined ratio of
less than 100 indicates an underwriting profit and a combined ratio of over 100 indicates an underwriting loss.
The underwriting environment varies across countries and products, as does the degree of litigation activity, all
of which affect such ratios. In addition, investment returns, local taxes, cost of capital, regulation, product type
and competition can have an effect on pricing and consequently on profitability as reflected in underwriting profit
and associated ratios.
• Accident year loss ratio, as adjusted: the loss ratio excluding catastrophe losses and related reinstatement
premiums, prior year development, net of premium adjustments and the impact of reserve discount.
..................................................................................................................................................................................................................................
AIG 2012 Form 10-K54
I T E M 7 / U S E O F N O N - G A A P M E A S U R E S

.....................................................................................................................................................................................
Catastrophe losses are generally weather or seismic events having a net impact on AIG Property Casualty in excess
of $10 million each.
• Accident year combined ratio, as adjusted: the combined ratio excluding catastrophe losses and related
reinstatement premiums, prior year development, net of premium adjustments, and the impact of reserve
discounting.
• AIG Life and Retirement
• Operating income (loss): In 2012, we revised our definition of operating income (loss). Operating income
(loss) is derived by excluding the following items from net income (loss): legal settlements related to legacy
crisis matters described above, changes in fair values of fixed maturity securities designated to hedge living
benefit liabilities, net realized capital (gains) losses, and changes in benefit reserves and DAC, VOBA, and
SIA related to net realized capital (gains) losses. We believe that Operating income (loss) is useful because
excluding these volatile items permits investors to better assess the operating performance of the underlying
business by highlighting the results from ongoing operations.
• Premiums, deposits and other considerations: includes life insurance premiums and deposits on annuity
contracts and mutual funds.
• Other Operations – Operating income (loss): income (loss) excluding certain legal reserves (settlements) related
to legacy crisis matters described above, loss on extinguishment of debt, amortization of prepaid commitment fee
asset, Net realized capital (gains) losses, net (gains) losses on sale of divested businesses and properties, and
income from divested businesses.
Results from discontinued operations are excluded from all of these measures.
..................................................................................................................................................................................................................................
AIG 2012 Form 10-K 55
I T E M 7 / U S E O F N O N - G A A P M E A S U R E S

.....................................................................................................................................................................................
Executive Overview
This overview of management’s discussion and analysis highlights selected information and may not contain all of
the information that is important to current or potential investors in AIG’s securities. You should read this Annual
Report on Form 10-K in its entirety for a complete description of events, trends and uncertainties as well as the
capital, liquidity, credit, operational and market risks and the critical accounting estimates affecting AIG and its
subsidiaries.
Executive Summary
AIG made solid progress toward many of its strategic objectives in 2012.
We fully repaid governmental support as a result of the Department of the Treasury’s sale of its remaining shares
of AIG common stock, par value $2.50 per share (AIG Common Stock).*
..............................................................................................................................................................................................
We improved our financial and operational performance, leading to a third consecutive year of profitability:
• AIG Property Casualty reported improved operating income and the business also has continued to experience
positive pricing trends.
• AIG Life and Retirement assets under management grew significantly in 2012 from deposits and net flows from
individual variable annuities and retail mutual funds and appreciation due to higher equity markets. We enhanced
spread income and actively managed through the low interest rate environment.
• Mortgage Guaranty reported new insurance written of $37.5 billion for 2012 compared to $18.8 billion in 2011 and
has experienced improving credit trends.
• Our investment portfolio performance improved through the use of yield enhancements, including the reduction
of our concentration in lower-yielding tax-exempt municipal securities and the purchase of other higher-yielding
securities. These purchases include securities acquired through the Federal Reserve Bank of New York’s (FRBNY)
auction of Maiden Lane III LLC (ML III) assets. Realized capital gains increased because certain assets in
unrealized gain positions were sold as part of a program to utilize capital loss tax carryforwards.
• Our balance sheet is stronger as a result of the issuance of unsecured notes and the monetization of non-core
assets.
..............................................................................................................................................................................................
Our financial flexibility was enhanced by $5.2 billion in cash distributions from subsidiaries.
..............................................................................................................................................................................................
We announced an agreement to sell ILFC, received final distributions on our interests in Maiden Lane II LLC
(ML II) and ML III, and sold our remaining interest in AIA Group Limited (AIA), which will support our capital
management initiatives, sharpen our business focus, and enable us to redeploy assets in a more productive manner.
..............................................................................................................................................................................................
We completed $13.0 billion in share purchases using a portion of the proceeds of our asset sales.
..............................................................................................................................................................................................
* The Department of the Treasury continues to hold warrants to purchase approximately 2.7 million shares of AIG Common Stock.
..................................................................................................................................................................................................................................
AIG 2012 Form 10-K56
I T E M 7 / E X E C U T I V E S U M M A R Y

15FEB201316544235 17FEB201319003770
15FEB201316541884 15FEB201316542531
.....................................................................................................................................................................................
Our Performance – Selected Indicators..............................................................................................................................................................................................
Results of operations data:
Total revenues $ 59,812 $ 72,829
Income from continuing operations 19,540 13,254
Net income attributable to AIG 20,622 10,058
Income per common share attributable to AIG (diluted) 11.01 14.98
Balance sheet data:
Total assets $ 553,054 $ 675,573
Long-term debt 75,253 106,461
Total AIG shareholders’ equity 101,538 78,856
Book value per common share 53.53 561.40
TOTAL REVENUES*
($ millions)
The increase in 2012 from 2011 was primarily due to increased Netinvestment income. The decrease in 2011 from 2010 was primarilydue to the deconsolidation of AIA in the fourth quarter of 2010.
$72,829
2011 2010
$59,812
2012
$65,656
INCOME FROM CONTINUING OPERATIONS*
($ millions)
$13,254
2011 2010
$19,540
2012
$7,752
The decrease in 2012 from 2011 was primarily due to the release ofthe deferred tax asset valuation allowance in 2011. The increase in2011 from 2010 was primarily due to the release of the deferred taxasset valuation allowance in 2011, partially offset by the deconsolidation of AIA in the fourth quarter of 2010.
NET INCOME ATTRIBUTABLE TO AIG*
($ millions)
In addition to the matters described in Income from continuingoperations, the decrease in 2012 from 2011 was also due to lossfrom discontinued operations in 2012 compared to a gain in 2011.The increase in 2011 from 2010 was due to income fromdiscontinued operations compared to a loss in 2010.
$10,058
2011 2010
$20,622
2012
$3,438
INCOME PER COMMON SHARE
ATTRIBUTABLE TO AIG (DILUTED)
In addition to the matters described in Net income attributable to AIG,the decrease in 2011 from 2010 was also due to the Recapitalization(See Note 25 to the Consolidated Financial Statements).
$14.98
2011 2010
$11.01
2012
$2.04
..................................................................................................................................................................................................................................
AIG 2012 Form 10-K 57
$ 65,656
7,752
3,438
2.04
$ 548,633
48,500
98,002
66.38
Years Ended December 31,
(in millions, except per share data) 2012 2011 2010
I T E M 7 / E X E C U T I V E S U M M A R Y

15FEB201316543853 15FEB201316544108 15FEB201316543980
19FEB201322181662 17FEB201319003903
17FEB201319004032 17FEB201319003635
.....................................................................................................................................................................................
TOTAL REVENUES ($ millions)
$37,207$40,722$39,781
AIG PROPERTY CASUALTY
20112012 2010
$14,747$15,315$16,767
AIG LIFE AND RETIREMENT
20112012 2010
$21,405
$4,079
$9,974
OTHER OPERATIONS
20112012 2010
TOTAL ASSETS*
($ millions)
The decrease in 2012 from 2011 was primarily due to thepurchases of AIG Common Stock in 2012. The decrease in 2011from 2010 was primarily due to the divestitures of Nan Shan, AIGStar and AIG Edison.
$675,573
2011 2010
$553,054
2012
$548,633
LONG-TERM DEBT
($ millions)
$106,461
2011 2010
$75,253
2012
$48,500
The decrease in 2012 from 2011 was primarily due to the heldfor sale treatment of ILFC. The decrease in 2011 from 2010 wasprimarily due to the repayment of government debt support in 2011.
TOTAL SHAREHOLDERS’ EQUITY
($ millions)
The decrease in 2012 from 2011 was primarily due to AIG CommonStock purchases in 2012, partially offset by an increase in unrealizedappreciation of investments. The increase in 2011 from 2010 wasdue to the release of the deferred tax asset valuation allowance.
$78,856
2011 2010
$101,538
2012
$98,002
BOOK VALUE PER SHARE
In addition to the equity matters described in Total AIG shareholders’equity, the 2010 pro forma book value per share of $43.20 wascalculated as if the Recapitalization and conversion of equity unitsoccurred in 2010.
$561.40
2011 2010
$53.53
2012
$66.38
Proforma
* Comparability between 2011 and 2010 data is affected by the deconsolidation of AIA in the fourth quarter of 2010.
..................................................................................................................................................................................................................................
AIG 2012 Form 10-K58
I T E M 7 / E X E C U T I V E S U M M A R Y
aaoo aaaaormaormaaoofoofoooProProo a
5 5 5
aaaaaaaaaaao orrroooooooooo oooooooorrrmmmaaaaaaaaaPPPPP ffffPPPP ffffff

.....................................................................................................................................................................................
The following table presents a reconciliation of pre-tax income (loss) to operating income (loss) by operating
segment and after-tax operating income (loss), which are non-GAAP measures. See Use of Non-GAAP
Measures for additional information.
AIG Property Casualty
Pre-tax income (loss) $ 1,820 $ (93)
Net realized capital (gains) losses (607) 38
Legal settlements* – –
Bargain purchase gain – (332)
Other (income) expense – net 5 (669)
Operating income (loss) $ 1,218 $ (1,056)
AIG Life and Retirement
Pre-tax income $ 2,956 $ 2,701
Legal settlements* – –
Changes in fair value of fixed maturity securities designated to hedge
living benefit liabilities – –
Net realized capital (gains) losses (6) 1,251
Change in benefit reserves and DAC, VOBA and SIA related to net
realized capital (gains) losses 327 104
Operating income $ 3,277 $ 4,056
Other Operations
Pre-tax income (loss) $ (4,703) $ 17,611
Net realized capital gains (12) (908)
Net (gains) losses on sale of divested businesses 74 (18,897)
Amortization of prepaid commitment fee asset – 3,471
Legal reserves 20 3
Legal settlements* – –
Deferred gain on FRBNY credit facility (296) –
Loss on extinguishment of debt 3,143 104
Divested businesses – (1,875)
Operating income (loss) $ (1,774) $ (491)
Total
Operating income of reportable segments and other operations $ 2,721 $ 2,509
Consolidations, eliminations and other adjustments (190) (301)
Income tax benefits (expenses) 243 (1,585)
Non-controlling interest (688) (2,172)
After-tax operating income (loss) $ 2,086 $ (1,549)
* Reflects litigation settlement income recorded in 2012 from settlements with three financial institutions that participated in the creation, offering
and sale of RMBS as to which AIG and its subsidiaries suffered losses either for their own accounts or in connection with their participation in AIG’s
securities lending program.
..................................................................................................................................................................................................................................
AIG 2012 Form 10-K 59
Years Ended December 31,(in millions) 2012 2011 2010
$ 1,837
2
(17)
–
(2)
$ 1,820
$ 3,780
(154)
(37)
(630)
1,201
$ 4,160
$ 3,899
(501)
2
–
754
(39)
–
9
–
$ 4,124
$ 10,104
(20)
(3,187)
(262)
$ 6,635
I T E M 7 / E X E C U T I V E S U M M A R Y

15FEB201316543331 15FEB201316543600 15FEB201316543470
15FEB201316542803 15FEB201316543069 15FEB201316542940
.....................................................................................................................................................................................
PRE-TAX INCOME (LOSS) ($ millions)
$(93)
$1,820$1,837
AIG PROPERTY CASUALTY
20112012 2010
$2,701$2,956
$3,780
AIG LIFE AND RETIREMENT
20112012 2010
OTHER OPERATIONS
$17,611
2011
20102012
$(4,703)
$3,899
OPERATING INCOME (LOSS) ($ millions)
$(1,056)
2011
2010
2012
$1,218$1,820
AIG PROPERTY CASUALTY
$4,056
2011 20102012
$3,277
$4,160
AIG LIFE AND RETIREMENT
$(491)
2011 2010
2012
$(1,774)
$4,124
OTHER OPERATIONS
Prior Period Revisions..............................................................................................................................................................................................
Prior period amounts have been revised to reflect the following:
Accounting for Deferred Acquisition Costs..............................................................................................................................................................................................
As discussed in Note 2 to the Consolidated Financial Statements, AIG retrospectively adopted an accounting
standard on January 1, 2012 that amended the accounting for costs incurred by insurance companies that can be
capitalized in connection with acquiring or renewing insurance contracts.
AIG Property Casualty Operating Segment Changes..............................................................................................................................................................................................
To align financial reporting with changes made during 2012 to the manner in which AIG’s chief operating decision
makers review the businesses to assess performance and make decisions about resources to be allocated, certain
products previously reported in Commercial Insurance were reclassified to Consumer Insurance. These revisions did
not affect the total AIG Property Casualty reportable segment results previously reported.
In the fourth quarter of 2012, to increase the focus on the drivers of the losses and proactively mitigate reserve
development and legal costs, the management of certain environmental liability businesses written prior to 2004 was
moved from Commercial Insurance to a separate claims organization. To align financial reporting with the internal
management changes, this environmental (1987-2004) business is reported in the Other category. These revisions
did not affect our total reportable segment results previously reported.
Sale of ILFC and Discontinued Operations Presentation..............................................................................................................................................................................................
On December 9, 2012, AIG entered into an agreement to sell 80.1 percent of ILFC for approximately $4.2 billion in
cash, with an option for the purchaser to buy an additional 9.9 percent stake (the ILFC Transaction). The sale is
expected to close in 2013. At the closing of the transaction, in connection with the termination of intercompany
arrangements between AIG and ILFC, AIG will return $1.1 billion to ILFC. As a result, ILFC operating results, which
were previously presented in the Aircraft Leasing segment, have been classified as discontinued operations in all
periods, and associated assets and liabilities have been classified as held-for-sale at December 31, 2012. See
Note 4 to the Consolidated Financial Statements for further discussion.
..................................................................................................................................................................................................................................
AIG 2012 Form 10-K60
I T E M 7 / E X E C U T I V E S U M M A R Y

.....................................................................................................................................................................................
Changes in Fair Value of Derivatives..............................................................................................................................................................................................
To align the presentation of changes in the fair value of derivatives with changes in the administration of AIG’s
derivatives portfolio, changes were made to the presentation within the Consolidated Statement of Operations and
Consolidated Statement of Cash Flows. Specifically, amounts attributable to derivative activity where AIG Financial
Products Corp. and AIG Trading Group Inc. and their respective subsidiaries (collectively AIGFP) is an intermediary
for AIG subsidiaries have been reclassified from Other income to Net realized capital gains (losses).
Liquidity and Capital Resources Highlights
In March 2012, AIG paid down in full the $8.6 billion remaining preferred interests (the AIA SPV Preferred Interests)
in the special purpose vehicle holding the proceeds of the AIA initial public offering (the AIA SPV) held by the
Department of the Treasury.
In addition, in 2012, the Department of the Treasury, as selling shareholder, sold its remaining shares of AIG
common stock by completing five registered public offerings in March, May, August, September and December
(collectively, the 2012 Offerings). The Department of the Treasury sold approximately 1.5 billion shares of AIG
Common Stock for aggregate proceeds of approximately $45.8 billion in the 2012 Offerings. We purchased
approximately 421 million shares of AIG Common Stock at an average price of $30.86 per share for an aggregate
purchase amount of approximately $13.0 billion in the first four of the 2012 Offerings. We did not purchase any
shares in the December 2012 offering.
In 2012, AIG received $10.1 billion in distributions from the FRBNY’s final disposition of ML II and ML III assets. Also
in 2012, we sold our entire remaining interest in AIA ordinary shares for gross proceeds of approximately
$14.5 billion.
Additional discussion and other liquidity and capital resources developments are included in Note 17 to the
Consolidated Financial Statements and Liquidity and Capital Resources herein.
Investment Highlights
Net investment income increased 38 percent to $20.3 billion in 2012 compared to 2011, primarily through our
previous investments in ML III and AIA. The overall credit rating of our fixed maturity portfolio was largely unchanged,
and other-than- temporary impairments declined compared to prior year levels.
• Our insurance operations achieved a $1.3 billion increase in net investment income in spite of the
challenges presented by a continuing low rate environment. Net investment income improved due to the
impact of yield enhancement initiatives and higher base yields. While corporate debt securities represented the
core of new investment allocations, we continued to focus on risk weighted opportunistic investments in residential
mortgage-backed (RMBS) and other structured securities to improve yields. These included purchases of assets
sold in the ML II and ML III auctions by the FRBNY.
• The unrealized appreciation of our investment portfolio grew from approximately $5.5 billion in 2011 to
approximately $10.7 billion in 2012. This was driven by declining interest rates and narrowing spreads in both
investment grade and high yield asset portfolios. We realized higher gains on the sales of securities compared to
the prior year as we repositioned assets to meet strategic and tactical asset allocation objectives.
Other-than-temporary Impairments were lower than the prior year, in part driven by favorable developments in the
housing sector which drove strong performance in our structured products portfolios.
• The overall credit ratings of our fixed maturity investments were largely unchanged from last year,
reflecting a continued focus on long term risk adjusted portfolio performance.
..................................................................................................................................................................................................................................
AIG 2012 Form 10-K 61
I T E M 7 / E X E C U T I V E S U M M A R Y

.....................................................................................................................................................................................
Risk Management Highlights
Our Risk Management Process..............................................................................................................................................................................................
Risk management is an integral part of managing our businesses. It is a key
element of our approach to corporate governance. We have an integrated Risk Managementprocess for managing risks throughout the organization. The framework of our
Enterprise Risk Management (ERM) system provides senior management with
a consolidated view of our major risk positions. • We remain committed to
adhering to the highestOur risk management process includes:
standards of risk management• An enhanced risk governance structure that supports consistent and and corporate governance.
transparent decision making. We have recently revised our corporate• We continue to promotepolicies to ensure that accountability for the implementation and oversight of
awareness and accountabilityeach policy is better aligned with individual corporate executives whilefor key risk and businessspecialized risk governance committees already in operation receive regulardecisions, and performancereporting regarding policy compliance.than in the past.
• Risk committees at our corporate level as well as in each business
unit that manage the development and maintenance of a risk and • We manage risks better bycontrol culture encompassing all significant risk categories. Our Board applying performance metricsof Directors oversees the management of risk through the complementary that enable us to assess riskfunctioning of the Finance and Risk Management Committee (the FRMC) more clearly and addressand the Audit Committee, as well as through its regular interaction with evolving market conditions.other committees of the Board.
• A capital and liquidity stress testing framework to assess our aggregate
exposure to our most significant risks. We conduct enterprise-wide stress
tests under a range of scenarios to better understand the resources needed to
support our subsidiaries and consolidated company.
Strategic Outlook
Industry Trends..............................................................................................................................................................................................
Our business is affected by industry and economic factors such as interest rates, credit and equity market conditions,
regulation, tax policy, competition, and general economic, market and political conditions. In 2012, and continuing into
2013, we operated under difficult market conditions, characterized by factors such as low interest rates, instability in
the global markets due to the European debt crisis, and slow growth in the U.S. economy.
The prevailing interest rate climate has a particularly significant effect on our industry. Investment returns have
declined as the U.S. fixed income market remains in a low interest rate environment. In addition, current market
conditions may not necessarily permit insurance companies to increase pricing across all our product lines.
..................................................................................................................................................................................................................................
AIG 2012 Form 10-K62
I T E M 7 / E X E C U T I V E S U M M A R Y
a age eis anagemenR tRi k M

.....................................................................................................................................................................................
AIG Priorities for 2013
AIG is focused on the following priorities for 2013:
• Strengthen and improve the operating performance of our core businesses;
• Consummate the sale of up to 90 percent of our interest in ILFC;
• Enhance the yield on our investments while maintaining focus on credit quality;
• Manage AIG’s capital and interest expense more efficiently by redeploying excess capital in areas that
promote profitable growth;
• Work with the Board of Governors of the Federal Reserve System (the FRB) in its capacity as AIG’s
principal regulator; and
• Reduce recurring operating expenses by leveraging AIG’s scale and driving increased standardization
through investments in infrastructure.
Strategic Outlook for Our Operating Businesses
The strategic outlook for each of our businesses and management initiatives to improve growth and performance in
2013 and over the longer term are described below.
AIG PROPERTY CASUALTY STRATEGIC OUTLOOK..............................................................................................................................................................................................
We expect that the current low interest rate environment and ongoing uncertainty in global economic conditions will
continue to challenge the growth of net investment income and limit growth in some markets through at least 2013.
These conditions, coupled with overcapacity in the property casualty insurance industry business, are leading carriers
to tighten terms and conditions, shed unprofitable business and develop advanced data analytics in order to improve
profitability.
We have observed improving trends in certain key indicators that may offset the effect of current economic
challenges. Commencing in the second quarter of 2011, and continuing since, we have benefited from favorable
pricing trends, particularly in our U.S. commercial business. The property casualty insurance industry is beginning to
experience modest growth as a result of this positive rate trend and an increase in overall exposures in some
markets. We expect that expansion in certain growth economies will occur at a faster pace than in developed
countries, although at levels lower than those previously expected due to revised economic assumptions.
..................................................................................................................................................................................................................................
AIG 2012 Form 10-K 63
I T E M 7 / E X E C U T I V E S U M M A R Y

.....................................................................................................................................................................................
AIG Property Casualty is focused on the following strategic initiatives:
AIG Property Casualty........................................................................................................................Opportunities
We expect that shifting our mix of business to higher value lines and
geographies of opportunity will generate business with more favorable
underwriting results. However, as a result of the business mix shift to • Continue shifting toward highervalue business to increaseconsumer products, higher value commercial products, and the investmentprofitability.in growth economy nations, policy acquisition expenses, including direct
marketing costs, are expected to continue to increase. • Expand in attractive growtheconomies, specifically in AsiaPacific, the Middle East and
........................................................................................................................ Latin America.
We anticipate that refining technical pricing account management tools • Enhance risk selection andpricing to earn returnsand marketing analytics will further enhance our risk selection process.commensurate to the risk
We believe that accident year loss ratios will continue to improve due to assumed.these actions.
• Implement improved claimspractices and advancedtechnology to lower the loss........................................................................................................................ratio.
We expect to reduce loss costs by realizing greater efficiencies in• Apply operating expenseservicing customer claims, introducing fraud detection tools and
discipline and drive efficienciesdeveloping knowledge of the economic drivers of losses, which will by leveraging our globalproactively mitigate reserve development and legal costs, and establish footprint.effective pricing strategies.
• Optimize the investmentportfolio by aligning it with ourrisk appetite and tax........................................................................................................................objectives.
We continue to make strategic investments in systems, processes and
talent worldwide, which will result in elevated operating expense in the
short-term, but is expected to create additional value and greater
efficiency beginning in 2014.
Capital Efficiency..............................................................................................................................................................................................
We plan to continue to execute capital management initiatives by enhancing broad-based risk tolerance guidelines for
our operating units, implementing underwriting strategies to increase return on equity by line of business and
reducing exposure to businesses with inadequate pricing and increased loss trends. In addition, we remain focused
on enhancing our global reinsurance strategy to improve capital efficiency.
We continue to streamline our legal entity structure, to enhance transparency with regulators and optimize capital
and tax efficiency. For the year ended December 31, 2012, we completed 41 legal entity and branch restructuring
transactions. We completed the integration of our European operations into a single pan-European insurance
company, AIG Europe Limited, and continued the restructuring activities in the Asia Pacific region, including focusing
on the strategy to consolidate the Japan operations under one holding company. During 2012, our restructuring and
capital management initiatives enabled certain subsidiaries in Europe and the Asia Pacific region to return
$575 million of capital to be used for general corporate purposes. We continue to implement restructuring plans in
each region and the overall end state structure is expected to be mostly completed by the end of 2014.
Our Investment Strategy for AIG Property Casualty..............................................................................................................................................................................................
Consistent with AIG’s worldwide insurance investment policy, we place primary emphasis on investments in fixed
maturity securities issued by corporations, municipalities and other governmental agencies, and to a lesser extent,
common stocks, private equity, hedge funds and other alternative investments. We also attempt to enhance returns
through investments in a diversified portfolio of private equity funds, hedge funds, and partnerships. Although these
Business Mix Shift
Underwriting Excellence
Claims Best Practices
Operating Expense Discipline
..................................................................................................................................................................................................................................
AIG 2012 Form 10-K64
I T E M 7 / E X E C U T I V E S U M M A R Y
opp eu i ippo n esO rt ti iOa aope y u yrope as aA P rt tAI P lG C

.....................................................................................................................................................................................
investments are subject to periodic volatility, they have historically achieved yields in excess of the base portfolio
yields. Our expectation is that these alternative investments will continue to outperform the base portfolio yields over
the long-term.
Opportunistic investments in structured securities and other yield-enhancement opportunities continue to be made
with the objective of increasing net investment income. Overall base yields increased in 2012 due to the portfolio mix
shift away from tax-exempt municipal bonds toward taxable instruments; overall investment purchases were made at
expected yields higher than the weighted average yields of the existing portfolio.
In 2013, we expect to continue to refine our investment strategy, which includes asset diversification and yield-
enhancement opportunities that meet our liquidity, duration and credit quality objectives as well as current risk-return
and tax objectives.
See Segment Results – AIG Property Casualty Operations – AIG Property Casualty Results � AIG Property
Casualty Investing and Other Results and Note 7 to the Consolidated Financial Statements for additional information.
AIG LIFE AND RETIREMENT STRATEGIC OUTLOOK..............................................................................................................................................................................................
AIG Life and Retirement’s businesses and the life and annuity industryAIG Life and Retirementcontinue to be affected by the current economic environment of lowOpportunitiesinterest rates and volatile equity markets. Continued low interest rates put
pressure on long-term investment returns, negatively affect future sales of
interest rate-sensitive products and reduce future profits on certain• Grow assets underexisting business. Also, products such as payout annuities and traditional
managementlife insurance that are not rate-adjustable may require increases in
reserves if future investment yields are insufficient to support current• Increase life insurance in force
valuation interest rates. Equity market volatility may result in higher
reserves for variable annuity guarantee features, and both equity market • Enhance return on equityvolatility and low interest rates can affect the recoverability and
amortization rate of DAC assets.
During 2012, AIG Life and Retirement implemented a number of
management actions to proactively address the impact of low interest
rates. These actions include a continued disciplined approach to new
business pricing of interest sensitive products (e.g. fixed annuities), active
management of renewal crediting rates, increased pricing in certain life
insurance products and re-filing of products to continue lowering minimum
rate guarantees.
AIG Life and Retirement is focused on the following strategic initiatives:
Growth of Assets Under Management..............................................................................................................................................................................................
AIG Life and Retirement plans to fully leverage its unified all-channel distribution organization to increase sales of
profitable products across all channels. In addition, management will pursue select institutional market opportunities
where AIG Life and Retirement’s scale and capacity provides a competitive market advantage. AIG Life and
Retirement is well positioned to capitalize on the growing demand for income solutions while certain competitors are
scaling back in this market. AIG Life and Retirement will continue to manage the risks associated with variable
annuity living benefits through innovative product designs and hedging strategies. Given the size and diversity of AIG
Life and Retirement’s overall product portfolio, variable annuity reserves are a relatively small portion of its total
reserves compared to others in this market. As a result of a broad distribution network and a more favorable
competitive environment, AIG Life and Retirement expects variable annuity sales to remain strong for 2013.
Increase Life Insurance In force..............................................................................................................................................................................................
AIG Life and Retirement’s strategic focus related to life insurance and other mortality-based products includes
disciplined underwriting, active expense management and product innovation. AIG Life and Retirement’s distribution
..................................................................................................................................................................................................................................
AIG 2012 Form 10-K 65
I T E M 7 / E X E C U T I V E S U M M A R Y
opp eu i ippo n esO rt ti iOae d e e ei ie an e remenA R t tAI Li d R iG f

.....................................................................................................................................................................................
strategy is to grow new sales by strengthening the core retail independent and career agent distributor channels and
expanding its market presence through the development of innovative life insurance offerings based on consumerfocused research to drive superior, differentiated product solutions. In addition, AIG Life and Retirement is enhancingits service and technology platform through the consolidation of its life operations and administrative systems, which
is expected to result in a more efficient, cost-competitive and agile operating model.
Enhance Return on Equity..............................................................................................................................................................................................
AIG Life and Retirement expects to leverage its streamlined legal entity structure to enhance financial strength and
durability capital efficiency and ease of doing business. AIG Life and Retirement completed the merger of six lifeinsurance operating legal entities into American General Life Insurance Company effective December 31, 2012. Thismerger will allow for more effective capital and dividend planning while creating operating efficiencies and making it
easier for producers and customers to do business with AIG Life and Retirement. AIG Life and Retirement also plansto improve operational efficiencies and service through investments in technology, more productive use of existingresources and further use of lower-cost operations centers.
Our Investment Strategy for AIG Life and Retirement..............................................................................................................................................................................................
AIG Life and Retirement places primary emphasis on investments in fixed maturity securities issued by corporations,municipalities and other governmental agencies, structured securities collateralized by, among others, residential and
commercial real estate, and to a lesser extent, commercial mortgage loans, private equity, hedge funds, otheralternative investments, and common and preferred stock.
Our fundamental investment strategy is to maintain primarily a diversified, high quality portfolio of fixed maturitysecurities and, as nearly as is practicable, to match the duration characteristics of our liabilities with assets of
comparable duration. In addition, AIG Life and Retirement enhances its returns through investments in a diversifiedportfolio of private equity funds, hedge funds and affordable housing partnerships. Although returns on theseinvestments are more volatile than our base fixed maturity securities portfolio, they have historically achieved higher
total returns and yields than the base portfolio yields. AIG Life and Retirement’s expectation is that these alternativeinvestments will continue to outperform the base portfolio yields over the long-term.
Opportunistic investments in structured securities and other yield enhancement opportunities continue to be made
with the objective of increasing net investment income. Overall base yields increased in 2012 due to the reinvestmentof significant amounts of cash and short term investments during 2011. However, base yields have been declining inthe latter half of 2012 as investment purchases were made at yields lower than the weighted average yield of the
existing portfolio. During prolonged periods of low or declining interest rates, AIG Life and Retirement has to investnet flows and reinvest interest and principal payments from its investment portfolio in lower yielding securities.
See Segment Results – AIG Life and Retirement Operations and Note 7 to the Consolidated Financial Statements for
additional information.
Other Operations..............................................................................................................................................................................................
Mortgage Guaranty..............................................................................................................................................................................................
The following are expected to continue to affect results for 2013:Mortgage Guaranty
• Market developments – UGC is a market leader in the mortgage Opportunitiesinsurance industry with a differentiated risk-based pricing model that isdesigned to produce high quality new business. The withdrawal ofcertain competitors from the market during 2011 combined with UGC’s • Increase market share throughinvestment grade rating and risk-based pricing has positioned UGC to competitor differentiation.take advantage of market opportunities. UGC plans to continue to
execute this strategy during 2013 and to further enhance its market • Improve the risk profile of newinsurance written.position. UGC will continue to review its new business pricing relative to
changes in the market to ensure that the price of coverage is• Build our market leadershipcommensurate with the level of risk being underwritten.
position.
..................................................................................................................................................................................................................................
AIG 2012 Form 10-K66
I T E M 7 / E X E C U T I V E S U M M A R Y
opp eu i ippo n esO rt ti iOa a ao g ge u yo gage aranrt tM G

.....................................................................................................................................................................................
• Delinquent inventory review – During 2011 and 2012, UGC requested that lenders file claims, in accordance with
the terms of the respective master policies, on approximately 21,000 accounts that had been delinquent
approximately 24 months or more and were not expected to cure. Many of these delinquencies were the result of
the foreclosure moratorium discussed below. Through December 31, 2012, UGC received responses to
approximately 96 percent of these requests. While accelerating the payment of claims, these requests also
impacted the cure rate of the delinquent inventory which in turn impacted UGC’s estimate of reserve for loss and
loss adjustment expenses. During 2013, reserve development may continue to have an impact on the business.
UGC expects that newly reported delinquent loans will continue to decline during 2013 and that the delinquent
inventory will decline further albeit at a slower rate than in 2012. However, the extent of the decline in
delinquencies and the number of newly reported delinquencies is dependent on the prevailing macroeconomic
conditions and the extent that the domestic economy does or does not improve. UGC will closely monitor these
trends and the impact on its incurred loss and loss expenses in 2013.
• Foreclosure delays – Since 2010, a variety of servicing practices have come to light that have delayed the
foreclosure process in many states. Some of these practices, such as the ‘‘robo-signing’’ of affidavits in judicial
foreclosures, have resulted in government investigations into lenders’ foreclosure practices. These developments
have slowed the reporting of foreclosures, which has in turn slowed the filing of mortgage insurance claims and
increased the uncertainty surrounding the determination of the liability for losses and loss adjustment expenses.
UGC’s assumptions regarding future foreclosures on current delinquencies take into consideration this trend,
although significant uncertainty remains surrounding the determination of the liability for unpaid claims and claims
adjustment expenses. UGC expects that this trend may continue for 2013 and may negatively affect UGC’s future
financial results. Final resolution of these issues is uncertain and UGC cannot reasonably estimate the ultimate
financial impact that any resolution, individually or collectively, may have on its future results of operations or
financial condition.
Global Capital Markets (GCM)..............................................................................................................................................................................................
AIG Markets acts as the derivatives intermediary between AIG and its subsidiaries and third parties to provide
hedging services. The derivative portfolio of AIG Markets consists primarily of interest rate and currency derivatives.
The remaining derivatives portfolio of AIGFP consists primarily of hedges of the assets and liabilities of the DIB and
a portion of the legacy hedges for AIG and its subsidiaries. Future hedging needs for AIG and its subsidiaries will be
executed through AIG Markets. AIGFP’s derivative portfolio consists primarily of interest rate, currency, credit,
commodity and equity derivatives. Additionally, AIGFP has a credit default swap portfolio being managed for
economic benefit and with limited risk. The AIGFP portfolio continues to be wound down and is managed consistent
with our risk management objectives. Although the portfolio may experience periodic fair value volatility, it consists
predominantly of transactions that we believe are of low complexity, low risk or currently not economically appropriate
to unwind based on a cost versus benefit analysis.
Direct Investment Book (DIB)..............................................................................................................................................................................................
The DIB portfolio is being wound down and is managed with the objective of ensuring that at all times it maintains
the liquidity we believe is necessary to meet all its liabilities, as they come due, even under stress scenarios and to
maximize return consistent with our risk management objectives. We are focused on meeting the DIB’s liquidity
needs, including the need for contingent liquidity arising from collateral posting for debt positions of the DIB without
relying on resources beyond the DIB. As part of this program management, we may from time to time access the
capital markets, subject to market conditions. In addition, we may seek to buy back debt or sell assets on an
opportunistic basis, subject to market conditions.
From time to time, we may utilize cash allocated to the DIB that is not required to meet the risk target for general
corporate purposes unrelated to the DIB.
Certain non-derivative assets and liabilities of the DIB are accounted for under the fair value option and thus
operating results are subject to periodic market volatility. The overall hedging activity for the assets and liabilities of
the DIB is executed by GCM. The value of hedges related to the non-derivative assets and liabilities of AIGFP in the
DIB are included within the assets and liabilities and operating results of GCM and are not included within the DIB
operating results, assets or liabilities.
..................................................................................................................................................................................................................................
AIG 2012 Form 10-K 67
I T E M 7 / E X E C U T I V E S U M M A R Y

.....................................................................................................................................................................................
Results of Operations
The following section provides a comparative discussion of our Results of Operations on a reported basis for the
three-year period ended December 31, 2012. Factors that relate primarily to a specific business segment are
discussed in more detail within that business segment. For a discussion of the Critical Accounting Estimates that
affect the Results of Operations, see the Critical Accounting Estimates section of Item 7. MD&A, in this Annual
Report on Form 10-K.
The following table presents AIG’s condensed consolidated results of operations:
Revenues:
Premiums $ 38,990 $ 45,319 (3)% (14)%
Policy fees 2,705 2,710 3 –
Net investment income 14,755 20,934 38 (30)
Net realized capital gains (losses) 701 (716) 33 NM
Other income 2,661 4,582 35 (42)
Total revenues 59,812 72,829 10 (18)
Benefits, claims and expenses:
Policyholder benefits and claims incurred 33,450 41,392 (4) (19)
Interest credited to policyholder account
balances 4,467 4,487 (2) –
Amortization of deferred acquisition costs 5,486 5,821 4 (6)
Other acquisition and insurance expenses 8,458 10,163 9 (17)
Interest expense 2,444 6,742 (5) (64)
Net loss on extinguishment of debt 2,847 104 (100) NM
Net (gain) loss on sale of properties and
divested businesses 74 (19,566) (97) NM
Other expenses 2,470 3,439 10 (28)
Total benefits, claims and expenses 59,696 52,582 (6) 14
Income from continuing operations before
income tax expense (benefit) 116 20,247 NM (99)
Income tax expense (benefit) (19,424) 6,993 NM NM
Income from continuing operations 19,540 13,254 (60) 47
Income (loss) from discontinued operations,
net of income tax expense (benefit) 1,790 (969) NM NM
Net income 21,330 12,285 (83) 74
Less: Net income attributable to
noncontrolling interests 708 2,227 (63) (68)
Net income attributable to AIG $ 20,622 $ 10,058 (83)% 105%
..................................................................................................................................................................................................................................
AIG 2012 Form 10-K68
Percentage ChangeYears Ended December 31,(in millions) 2012 2011 2010 2012 vs. 2011 2011 vs. 2010
$ 38,011
2,791
20,343
929
3,582
65,656
31,977
4,362
5,709
9,235
2,319
9
2
2,721
56,334
9,322
1,570
7,752
(4,052)
3,700
262
$ 3,438
I T E M 7 / R E S U L T S O F O P E R A T I O N S

.....................................................................................................................................................................................
AIG 2012 and 2011 Comparison
Income from continuing operations before income taxes for 2012 and 2011 reflected the following:
• pre-tax income from insurance operations of $5.6 billion in 2012, which
included catastrophe losses of $2.7 billion, largely arising from Storm A Year of ProgressSandy, and severe losses of $326 million, compared to pre-tax income from
insurance operations of $4.8 billion in 2011, which included catastrophe
losses of $3.3 billion, largely arising from Hurricane Irene, U.S. tornadoes• For the third consecutive year
and the Great Tohoku Earthquake & Tsunami in Japan (the Tohoku we posted a full year profit.Catastrophe) and severe losses of $296 million;
• Our total AIG Property• increases in fair value of AIG’s interest in AIA ordinary shares of $2.1 billionCasualty accident year loss
and $1.3 billion in 2012 and 2011, respectively. The increase in fair value in ratio, as adjusted, improved2012 included a gain on sale of AIA ordinary shares of approximately each year during the past$0.8 billion; three years.
• an increase in fair value of AIG’s interest in ML III of $2.9 billion in 2012, • We enhanced spread incomecompared to a decrease in fair value of $646 million in the same period of and actively managed through2011; the low interest rate
environment.• an increase in estimated litigation liability of approximately $783 million for
the year ended December 31, 2012 based on developments in several • Our investment portfolioactions; performance improved due to
the completion of the cash• litigation settlement income of $210 million in 2012 from settlements with deployment in 2011.
three financial institutions who participated in the creation, offering and sale
of RMBS from which AIG and its subsidiaries suffered losses either for their
own accounts or in connection with their participation in AIG’s securities
lending program; and
• a $3.3 billion net loss, primarily consisting of the accelerated amortization of
the remaining prepaid commitment fee asset resulting from the termination
of the credit facility provided by the FRBNY (the FRBNY Credit Facility) in
2011. This was partially offset by a $484 million gain on extinguishment of
debt in the fourth quarter of 2011 due to the exchange of subordinated
debt.
For the year ended December 31, 2012, the effective tax rate on pre-tax income from continuing operations was
16.8 percent. This rate differs from the statutory rate primarily due to tax benefits of $1.9 billion related to a decrease
in the life-insurance-business capital loss carryforward valuation allowance and $302 million associated with tax
exempt interest income. These items were partially offset by charges in uncertain tax positions of $586 million and
$172 million associated with the effect of foreign operations.
For the year ended December 31, 2011, the effective tax rate on pre-tax income from continuing operations was not
meaningful, due to the significant effect of releasing approximately $18.4 billion of the deferred tax asset valuation
allowance. Other factors that contributed to the difference from the statutory rate included tax benefits of $454 million
associated with tax exempt interest income, $386 million associated with the effect of foreign operations, and
$224 million related to our investment in subsidiaries and partnerships.
In 2012, AIG recorded a loss from discontinued operations, net of income taxes, of $4.1 billion, which included a
pre-tax loss of $6.7 billion on the announced sale of ILFC.
After-tax operating income for 2012 was $6.6 billion compared to $2.1 billion for 2011.
..................................................................................................................................................................................................................................
AIG 2012 Form 10-K 69
I T E M 7 / R E S U L T S O F O P E R A T I O N S
a o oe g eear o rogressA PA Y Pf

.....................................................................................................................................................................................
AIG 2011 and 2010 Comparison
Income from continuing operations before income taxes for 2011 and 2010 reflected the following:
• pre-tax income from insurance operations of $4.8 billion in 2011 which included the catastrophe losses described
above, compared to $2.6 billion in 2010, which included catastrophe losses of $1.1 billion;
• a $3.3 billion net loss on extinguishment of debt from the termination of the FRBNY Credit Facility on January 14,
2011. This was partially offset by a $484 million gain on extinguishment of debt in the fourth quarter of 2011 due to
the exchange of junior subordinated debt;
• $604 million in unfavorable fair value adjustments on AIG’s economic interest in ML II and equity interest in ML III
(together, the Maiden Lane Interests);
• our 2010 results included gains of $19.6 billion on sales of divested businesses. These included a $18.1 billion
gain from the initial public offering and listing of AIA ordinary shares on the Hong Kong Stock Exchange on
October 29, 2010, and a gain of $1.3 billion recognized in 2010 related to the sale of our headquarters building in
Tokyo in 2009, which gain had been deferred until the expiration of certain lease provisions; and
• we had income in 2010 from divested businesses prior to their sale totaling $2.4 billion, primarily representing AIA.
Partially offsetting these declines were:
• a decrease in interest expense of $4.1 billion primarily resulting from the January 2011 repayment of the FRBNY
Credit Facility;
• an increase in the fair value of AIA ordinary shares; and
• a reduction in realized capital losses in 2011 compared to 2010.
As discussed above, AIG released $18.4 billion of the deferred tax asset valuation allowance for the U.S.
consolidated income tax group in 2011.
For the year ended December 31, 2010, the effective tax rate on pre-tax income from continuing operations was
34.5 percent. This rate differs from the statutory rate primarily due to tax benefits of $1.3 billion associated with our
investment in subsidiaries and partnerships, principally the AIA SPV which is treated as a partnership for U.S. tax
purposes, and $587 million associated with tax exempt interest, partially offset by an increase in the deferred tax
asset valuation allowance attributable to continuing operations of $1.4 billion.
In 2011, AIG recorded income from discontinued operations net of taxes of $1.8 billion, which included a pre-tax gain
of $3.5 billion recorded in the first quarter of 2011 on the sale of AIG Star Life Insurance Co., Ltd. (AIG Star) and
AIG Edison Life Insurance Company (AIG Edison). This compared to a net loss of $969 million in 2010, which
included goodwill impairment charges of $4.6 billion associated with the sale of American Life Insurance Company
(ALICO), AIG Star and AIG Edison.
..................................................................................................................................................................................................................................
AIG 2012 Form 10-K70
I T E M 7 / R E S U L T S O F O P E R A T I O N S

.....................................................................................................................................................................................
The following table presents a reconciliation of income attributable to AIG from continuing operations to
after-tax operating income (loss):
Net income $ 21,330 $ 12,285
Income (loss) from discontinued operations, net of income tax expense (benefit) 1,790 (969)
Income from continuing operations 19,540 13,254
Net (gains) losses on sale of divested businesses 48 (15,326)
Income from divested businesses (16) (1,552)
Legacy FIN 48 and other tax adjustments – –
Legal reserves (settlements) related to legacy crisis matters 13 2
Deferred income tax valuation allowance (releases) charges (18,307) 1,392
Amortization of FRBNY prepaid commitment fee asset 2,358 2,255
Changes in fair value of AIG Life and Retirement fixed income securities
designated to hedge living benefit liabilities – –
Change in benefit reserves and DAC, VOBA and SIA related to net realized
capital (gains) losses 202 74
(Gain) loss on extinguishment of debt (520) 104
Net realized capital (gains) losses (460) 1,104
Non-qualifying derivative hedging gains, excluding net realized capital (gains)
losses (84) (352)
Bargain purchase gain – (332)
After-tax operating income 2,774 623
Net income from continuing operations attributable to noncontrolling interests 688 2,172
After-tax operating income (loss) $ 2,086 $ (1,549)
After-tax operating income increased in 2012 compared to 2011 primarily due to increases in income from insurance
operations and in the fair value gains on AIG’s interest in AIA ordinary shares and AIG’s interest in ML III, discussed
above. This was partially offset by an increase in income tax expenses in 2012 compared to an income tax benefit in
2011.
For the year ended December 31, 2012, the effective tax rate on pre-tax operating income was 31.6 percent. The
effective tax rate for the year ended December 31, 2012, attributable to pre-tax operating income differs from the
statutory rate primarily due to tax exempt interest income and other permanent tax items.
For the year ended December 31, 2011, the effective tax rate on pre-tax operating income was (9.6) percent. The
significant factors that contributed to the difference from the statutory rate included tax benefits resulting from tax
exempt interest income, tax benefits associated with non-controlling interests, as well as discrete tax benefits
recorded during the year.
We reported after-tax operating income in 2011 compared to after-tax operating losses in 2010 primarily due to a net
charge to strengthen AIG Property Casualty’s loss reserves in 2010, partially offset by higher catastrophe losses in
2011.
For the year ended December 31, 2010, the effective tax rate on pre-tax operating income was 70.2 percent. The
effective tax rate attributable to pre-tax operating income for the year ended December 31, 2010 differs from the
statutory rate primarily due to tax benefits associated with divested businesses, which are excluded from after-tax
operating income.
Segment Results..............................................................................................................................................................................................
AIG reports the results of its operations through two reportable segments: AIG Property Casualty and AIG Life and
Retirement. The Other operations category consists of businesses and items not allocated to our reportable
segments.
..................................................................................................................................................................................................................................
AIG 2012 Form 10-K 71
Years Ended December 31,(in millions) 2012 2011 2010
$ 3,700
(4,052)
7,752
1
–
543
353
(1,911)
–
(24)
781
6
(586)
(18)
–
6,897
262
$ 6,635
I T E M 7 / R E S U L T S O F O P E R A T I O N S

.....................................................................................................................................................................................
The following table summarizes the operations of each reportable segment. See also Note 3 to the
Consolidated Financial Statements.
Total revenues:
AIG Property Casualty $ 40,722 $ 37,207 (2)% 9%
AIG Life and Retirement 15,315 14,747 9 4
Total reportable segments 56,037 51,954 1 8
Other Operations 4,079 21,405 145 (81)
Consolidation and eliminations (304) (530) (185) 43
Total 59,812 72,829 10 (18)
Pre-tax income (loss):
AIG Property Casualty 1,820 (93) 1 NM
AIG Life and Retirement 2,956 2,701 28 9
Total reportable segments 4,776 2,608 18 83
Other Operations (4,703) 17,611 NM NM
Consolidation and eliminations 43 28 NM 54
Total 116 20,247 NM (99)
A discussion of significant items affecting pre-tax segment income follows. Factors that affect operating income for a
specific business segment are discussed in the detailed business segment analysis.
2012 and 2011 Pre-tax Income Comparison
AIG Property Casualty – Pre-tax income increased slightly in 2012 compared to 2011. The increase in pre-tax
income was the result of lower underwriting losses due to the impact of lower catastrophe losses, underwriting
improvements related to rate increases and enhanced risk selection, higher net investment income due to asset
diversification by reducing the concentration in tax-exempt municipal instruments and increasing investments in
private placement debt and structured securities. These increases were partially offset by higher acquisition costs as
a result of the change in business mix from Commercial Insurance to Consumer Insurance and higher general
operating expenses and lower net realized capital gains.
AIG Life and Retirement – Pre-tax income increased in 2012 compared to 2011, principally due to efforts to actively
manage net investment spreads. Results benefited from higher net investment income, lower interest credited, lower
reserves for death claims and the impact of more favorable separate account performance on DAC amortization and
policyholder benefit reserves. These items were partially offset by significant proceeds from a legal settlement in
2011, higher mortality costs and an increase in GIC reserves.
Other Operations – Other Operations recorded pre-tax income in 2012 compared to a pre-tax loss in 2011 due to
fair value and realized gains in our interest in AIA ordinary shares, and in our interest in ML III, partially offset by an
increase in estimated litigation liability, and a loss on extinguishment of debt of $3.3 billion in 2011 in connection with
the termination of the FRBNY Credit Facility.
..................................................................................................................................................................................................................................
AIG 2012 Form 10-K72
Percentage ChangeYears Ended December 31,(in millions) 2012 2011 2010 2012 vs. 2011 2011 vs. 2010
$ 39,781
16,767
56,548
9,974
(866)
65,656
1,837
3,780
5,617
3,899
(194)
9,322
I T E M 7 / R E S U L T S O F O P E R A T I O N S

.....................................................................................................................................................................................
2011 and 2010 Pre-tax Income Comparison
AIG Property Casualty – AIG Property Casualty generated pre-tax income in 2011 compared to a pre-tax loss in
2010. The increase in pre-tax income was the result of lower underwriting losses primarily due to an increase in
premium revenues, resulting from the consolidation of Fuji commencing in the third quarter of 2010 and lower prior
year adverse development in 2011. These increases in pre-tax income were partially offset by higher catastrophe
losses, and higher acquisition and general operating expenses due to a change in business mix.
Pre-tax income also increased as a result of net realized gains in 2011 compared to realized capital losses in 2010
due to an increase in gains on sales of securities, economic hedges and foreign exchange. In 2010, AIG Property
Casualty recognized a bargain purchase gain from the acquisition of Fuji and a gain on divested properties.
AIG Life and Retirement – Pre-tax income increased in 2011 compared to 2010 primarily due to net realized capital
gains in 2011 compared to net realized capital losses in 2010 as a result of a decline in other-than-temporary
impairments, partially offset by lower net investment income due to lower base yields and an increase in death claim
reserves in conjunction with the use of the Social Security Death Master File (SSDMF) to identify potential claims not
yet filed with its life insurance companies.
Other Operations – Other Operations recorded a pre-tax loss in 2011 compared to pre-tax income in 2010 due to a
net gain on sale of divested businesses in 2010, primarily related to AIA.
AIG Property Casualty
AIG Property Casualty 2012 Highlights
Net premiums written decreased for the year ended December 31, 2012 reflecting the continued execution of our
strategic initiatives to improve business mix, pricing and loss performance. Declines within Commercial Insurance due
to certain lines of business that did not meet internal operating objectives were partially offset by an increase in
Consumer Insurance net premiums written.
The loss ratio improved by 4.4 points for the year ended December 31, 2012, due to a decrease in catastrophe
losses, the benefit from positive pricing trends, the execution of our strategic initiatives and an increase in reserve
discount. Catastrophe losses, adjusted for reinstatement premiums, were $2.7 billion in 2012, primarily as a result of
Storm Sandy in the fourth quarter of 2012, compared to $3.3 billion in 2011. For the years ended December 31,
2012 and 2011, catastrophe losses contributed 7.5 and 9.2 points to the loss ratio, respectively. Net prior year
adverse development, including related premium adjustments was $445 million and $39 million for the years ended
December 31, 2012 and 2011, respectively.
The acquisition ratio increased by 1.8 points for the year ended December 31, 2012, primarily due to the change in
business mix to higher value lines and increased market competition, the restructuring of the loss-sensitive business
with low commission rates, and changes in our reinsurance strategy, all resulting in higher commissions.
The general operating expense ratio increased by 2.4 points for the year ended December 31, 2012, as we continue
to build, strengthen and streamline our financial and operating systems infrastructure and control environment
throughout the organization, particularly in financial reporting, policy and claims administration, and human resources
as a result of our continued investment in our employees. The total costs of these initiatives were approximately
$455 million for the year ended December 31, 2012, an increase of approximately $233 million from the prior year. In
addition, bad debt expense increased by approximately $143 million from the prior year.
Net investment income increased by 11.0 percent for the year ended December 31, 2012, due to asset diversification
by reducing the concentration in tax-exempt municipal instruments and increasing investments in private placement
debt and structured securities.
..................................................................................................................................................................................................................................
AIG 2012 Form 10-K 73
I T E M 7 / R E S U L T S O F O P E R A T I O N S

.....................................................................................................................................................................................
We paid cash and non-cash dividends of $2.5 billion to AIG in the year ended December 31, 2012. As a result of
Storm Sandy catastrophe losses, AIG contributed $1.0 billion of capital in cash to its U.S. property casualty insurance
subsidiaries in December 2012.
AIG Property Casualty Operations
We present our financial information in two operating segments – Commercial Insurance and Consumer Insurance –
as well as an Other category.
We will continue to assess the performance of our operating segments based on operating income (loss), loss ratio,
acquisition ratio, general operating expense ratio and combined ratio.
We are developing new value-based metrics that provide management shorter-term measures to evaluate our
performance across multiple lines and various countries. As an example, we have implemented a risk-adjusted
profitability model as a business performance measure. Along with underwriting results, this risk-adjusted profitability
model incorporates elements of capital allocations, costs of capital and net investment income. We believe that such
performance measures will allow us to better assess the true economic returns of our business.
For the years ended December 31, 2012 and 2011, results reflect the effects of the full year of Fuji operations, while
the corresponding 2010 period reflects the effects of Fuji for only two quarters, because we began consolidating
Fuji’s operating results on July 1, 2010, following its acquisition. Fuji operations primarily relate to Consumer
Insurance.
..................................................................................................................................................................................................................................
AIG 2012 Form 10-K74
I T E M 7 / R E S U L T S O F O P E R A T I O N S

.....................................................................................................................................................................................
AIG Property Casualty Results..............................................................................................................................................................................................
The following table presents AIG Property Casualty results:
Commercial InsuranceUnderwriting results:
Net premiums written $ 21,055 $ 20,173 (4)% 4%Decrease in unearned premiums 748 889 (33) (16)
Net premiums earned 21,803 21,062 (5) 4Claims and claims adjustment expenses incurred 18,332 18,814 (9) (3)Underwriting expenses 5,345 5,252 12 2
Underwriting loss (1,874) (3,004) (2) 38Net investment income 3,213 3,309 (13) (3)
Operating income $ 1,339 $ 305 (32)% 339%
Consumer InsuranceUnderwriting results:
Net premiums written $ 13,762 $ 11,346 3% 21%Increase in unearned premiums (7) (67) NM 90
Net premiums earned 13,755 11,279 1 22Claims and claims adjustment expenses incurred 8,900 6,745 (5) 32Underwriting expenses 5,253 4,650 7 13
Underwriting loss (398) (116) 60 (243)Net investment income 354 301 27 18
Operating income (loss) $ (44) $ 185 NM% NM%
OtherUnderwriting results:
Net premiums written $ 23 $ 93 NM% (75)%Decrease in unearned premiums 108 87 25 24
Net premiums earned 131 180 (8) (27)Claims and claims adjustment expenses incurred 717 2,308 (18) (69)Underwriting expenses 272 200 71 36
Underwriting loss (858) (2,328) (9) 63Net investment income 781 782 100 –
Operating income (loss) (77) (1,546) NM 95Net realized capital gains (losses) 607 (38) NM NMLegal settlement – – NM NMBargain purchase gain – 332 NM NMOther income (expense) – net (5) 669 NM NM
Pre-tax income (loss) $ 525 $ (583) 22% NM%
Total AIG Property CasualtyUnderwriting results:
Net premiums written $ 34,840 $ 31,612 (1)% 10%Decrease in unearned premiums 849 909 (49) (7)
Net premiums earned 35,689 32,521 (2) 10Claims and claims adjustment expenses incurred 27,949 27,867 (8) –Underwriting expenses 10,870 10,102 11 8
Underwriting loss (3,130) (5,448) 4 43Net investment income 4,348 4,392 11 (1)
Operating income (loss) 1,218 (1,056) 49 NMNet realized capital gains (losses) 607 (38) NM NMLegal settlement – – NM NMBargain purchase gain – 332 NM NMOther income (expense) – net* (5) 669 NM NM
Pre-tax income (loss) $ 1,820 $ (93) 1% NM%
* Includes gain on divested properties of $669 million in 2010.
..................................................................................................................................................................................................................................
AIG 2012 Form 10-K 75
Percentage ChangeYears Ended December 31,(in millions) 2012 2011 2010 2012 vs. 2011 2011 vs. 2010
$ 20,300500
20,80016,696
6,009
(1,905)2,809
$ 904
$ 14,150(198)
13,9528,4985,613
(159)451
$ 292
$ (14)135
121591466
(936)1,560
624(2)17–2
$ 641
$ 34,436437
34,87325,78512,088
(3,000)4,820
1,820(2)17–2
$ 1,837
I T E M 7 / R E S U L T S O F O P E R A T I O N S

.....................................................................................................................................................................................
2012 and 2011 Comparison
AIG Property Casualty Results
Operating income increased in 2012, primarily due to a decrease in catastrophe losses to $2.7 billion from
$3.3 billion in the prior year. In addition, net investment income increased due to asset diversification, from
concentration in tax-exempt municipal instruments into investments in private placement debt and structured
securities. This was slightly offset by an increase in acquisition costs due to the change in business mix to higher
value lines of business and the change in business mix from Commercial Insurance to Consumer Insurance. General
operating expenses increased due to the continued investment in strategic initiatives and human resources, as a
result of AIG’s continued investment in its employees. For the year ended December 31, 2012, investments in
strategic initiatives totaled approximately $455 million, representing an increase of approximately $233 million over
the prior year. In addition, bad debt expense increased by approximately $143 million from the prior year. Net prior
year adverse development, including premium adjustments, was $445 million for 2012 compared to $39 million for
2011.
Commercial Insurance Results
Operating income decreased in 2012, primarily due to a decrease in allocated net investment income reflecting a
decrease in the risk-free rate. Underwriting losses increased slightly compared to the prior year, reflecting lower
catastrophe and improved current accident year losses, the effect of rate increases and enhanced risk selection, and
an increase in reserve discount of $100 million, offset by higher acquisition and general operating expenses, and
higher adverse prior year development.
Acquisition costs increased primarily as a result of higher commission expense due to the restructuring of the U.S.
Casualty, primarily loss-sensitive business, as we move towards higher value lines. General operating expenses
increased due to an increase in bad debt expense of approximately $143 million and investments in strategic
initiatives.
Consumer Insurance Results
Consumer Insurance generated operating income in 2012 compared to an operating loss in 2011, reflecting a
reduction in underwriting loss as well as an increase in allocated net investment income resulting primarily from the
strategic group benefits partnership with AIG Life and Retirement. Underwriting results improved due to the
combination of lower catastrophe losses, favorable loss reserve development, the effect of rate increases, enhanced
risk selection and portfolio management. These improvements were offset in part by higher acquisition and general
operating expenses.
Acquisition costs increased primarily due to an increase in warranty profit sharing arrangements, increased
investment in direct marketing, and a decrease of approximately $49 million in the benefit from the amortization of
VOBA liabilities recognized at the time of the Fuji acquisition. General operating expenses increased in 2012 due to
investments in infrastructure and strategic expansion in growth economy nations.
2011 and 2010 Comparison
AIG Property Casualty Results
We recognized operating income in 2011 compared to an operating loss in 2010 primarily due to an increase in
premium revenues, partially offset by higher acquisition and general operating expenses. Prior year adverse loss
development, net of premium adjustments, decreased from $4.8 billion in 2010 to $39 million in 2011. Catastrophe
losses were $3.3 billion in 2011 compared to $1.1 billion in 2010.
Acquisition and general operating expenses increased in 2011, primarily due to the effect of including Fuji results for
a full year. General operating expenses also increased due to investments in a number of strategic initiatives during
2011, including the implementation of improved regional governance and risk management capabilities, the
implementation of global accounting and claims systems, preparation for Solvency II and certain other legal entity
restructuring initiatives.
..................................................................................................................................................................................................................................
AIG 2012 Form 10-K76
I T E M 7 / R E S U L T S O F O P E R A T I O N S

.....................................................................................................................................................................................
Commercial Insurance Results
Operating income increased in 2011, reflecting the effect of rate increases and enhanced risk selection. These items
were partially offset by higher catastrophe losses, higher acquisition expenses and a decrease in the allocated net
investment income due to a decrease in the risk-free rate. In 2011, catastrophe losses, adjusted for reinstatement
premiums, were $2.6 billion compared to $1.0 billion in 2010, as 2011 included the impact of the Tohoku Catastrophe
in Japan and the earthquakes in New Zealand. In 2011, net prior year favorable development, including premium
adjustments, was $455 million compared to net prior year adverse development of $2.6 billion in 2010.
Consumer Insurance Results
Consumer Insurance recognized an operating loss in 2011 compared to operating income in 2010 primarily due to an
increase in catastrophe losses, which includes the Tohoku Catastrophe and Hurricane Irene. This was partially offset
by an improvement in the accident year loss ratio, and an increase in allocated net investment income. Catastrophe
losses for the year ended December 31, 2011 were $715 million compared to $66 million during the prior year. Net
prior year adverse development was $85 million in 2011 as compared to net prior year favorable development of
$63 million in 2010.
See AIG Property Casualty Underwriting Ratios below for further information on prior year development.
AIG Property Casualty Net Premiums Written..............................................................................................................................................................................................
The following table presents AIG Property Casualty net premiums written by major line of business:
Commercial Insurance
Casualty $ 9,820 $ 9,940 (13)% (1)%
Property 3,811 3,180 10 20
Specialty 3,552 3,335 1 7
Financial lines 3,872 3,718 2 4
Total net premiums written $ 21,055 $ 20,173 (4)% 4%
Consumer Insurance
Accident & Health $ 6,762 $ 5,774 3% 17%
Personal lines 7,000 5,572 3 26
Total net premiums written $ 13,762 $ 11,346 3% 21%
Other 23 93 NM (75)
Total AIG Property Casualty net premiums written $ 34,840 $ 31,612 (1)% 10%
..................................................................................................................................................................................................................................
AIG 2012 Form 10-K 77
Percentage ChangeYears Ended December 31,
(in millions) 2012 2011 2010 2012 vs. 2011 2011 vs. 2010
$ 8,574
4,191
3,576
3,959
$ 20,300
$ 6,969
7,181
$ 14,150
(14)
$ 34,436
I T E M 7 / R E S U L T S O F O P E R A T I O N S

15FEB201321461922
.....................................................................................................................................................................................
2012 2011 2010
$7,000
$6,762
$5,572
$5,774
$7,181
$6,969
Personal lines
Accident & Health
WORLDWIDE NET PREMIUMS WRITTEN BY LINE OF BUSINESS
Total 2012 NPW (in millions) $34,436
Commercial Insurance
2012 2011 2010
$3,872
$3,552
$3,811
$9,820
$3,959
$3,576
$4,191
$8,574
$3,718
$3,335
$3,180
$9,940
Financial lines
Specialty
Property
Casualty
Consumer Insurance
2012 and 2011 Comparison
Commercial Insurance Net Premiums Written
In 2012, Commercial Insurance focused on the execution of the previously announced strategic objectives. The
overall decrease in Casualty was partially offset by increases in all the other lines of business.
Casualty net premiums written decreased, as planned, primarily due to the execution of our strategy to improve loss
ratios. Our enhanced risk selection process, and adherence to pricing targets resulted in the non-renewal of
approximately $800 million of net premiums written, primarily within the workers’ compensation business in the
Americas, and within the Primary Casualty business in EMEA. In addition, the restructuring of the loss-sensitive
programs decreased Casualty net premiums written by approximately $260 million in 2012. The additional premiums
associated with prior year development in the loss-sensitive business also decreased by approximately $120 million.
We also entered into a quota share reinsurance treaty in the U.S. for the Excess Casualty business that decreased
net premiums written by approximately $60 million. We implemented rate increases in retained business, especially in
the U.S., that partially offset the premium decreases noted above.
Property net premiums written increased due to rate increases, primarily in the U.S., reduced catastrophe bond
purchases in 2012, and the restructuring of the per-risk reinsurance program as part of our decision to retain more
favorable risks while continuing to manage aggregate exposure. Catastrophe exposed business retained in the
Americas and Asia Pacific region also benefitted from rate increases.
We have continued the strategy, adopted in 2010, to improve the allocation of our reinsurance between traditional
reinsurance markets and capital markets. During 2011, as part of this strategy, we secured a three-year catastrophe
bond with an industry index, first occurrence trigger, providing for $575 million in protection for U.S. hurricanes and
earthquakes. The bond transaction reduced net premiums written by approximately $201 million in 2011. There were
no catastrophe bond purchases in 2012.
Specialty net premiums written increased in 2012 due to the restructuring of the aerospace reinsurance program to
retain more favorable risks while continuing to manage aggregate exposure. This increase was slightly offset by our
strategic initiatives related to improved risk selection, particularly within products provided to small and medium sized
enterprises in the Americas and EMEA regions. We continue to shift our business mix towards higher value lines,
particularly in aerospace.
Financial lines net premiums written increased, reflecting strong business growth in all regions, despite targeted
decreases where the business did not meet our risk selection and internal performance criteria. Financial lines net
premiums written for year ended December 31, 2011 benefited from a multi-year Errors and Omissions policy in the
Americas that produced net premiums written of $148 million.
..................................................................................................................................................................................................................................
AIG 2012 Form 10-K78
I T E M 7 / R E S U L T S O F O P E R A T I O N S

.....................................................................................................................................................................................
Consumer Insurance Net Premiums Written
The Consumer Insurance business continued to grow its net premiums written and build momentum through its
multiple distribution channels and continuing focus on direct marketing. Consumer Insurance is well-diversified across
the major lines of business and has global strategies that are executed across its regions to enhance customer
relationships and business performance. Consumer Insurance currently has direct marketing operations in over 50
countries, and we continued to emphasize the growth of this channel, which for the year ended December 31, 2012,
accounted for approximately 15 percent of our overall net premiums written.
A&H net premiums written increased, due to the growth of group personal accident business in the Americas and
Asia Pacific, strong growth of new business sales in Fuji Life, travel insurance business, direct marketing programs in
Japan and other Asia Pacific nations and growth in individual personal accident in other Asia Pacific nations. This
was partially offset by the continuing strategies to reposition U.S. direct marketing operations, as well as pricing and
underwriting actions in Europe.
Personal lines net premiums written increased primarily due to the execution of our strategic initiative to grow higher
value lines of business in non-automobile products and rate increases in Japan automobile products. Growth in
non-automobile net premiums written outpaced growth in automobile net premiums written, increasing its proportion
to total net premiums written, due to our focus on diversifying the global product mix.
2011 and 2010 Comparison
Commercial Insurance Net Premiums Written
In 2011, net premiums written increased due to the effects of overall improvements in ratable exposures (i.e., asset
values, payrolls and sales), general pricing improvement and retrospective premium adjustments on loss-sensitive
contracts. We implemented certain initiatives designed to provide for a more effective use of capital, further growth in
the strategic higher value lines of business and improvement in foreign exchange rates.
Casualty net premiums written decreased primarily due to our strategic initiatives in workers’ compensation and
certain other lines of business, as well as a continued commitment to maintain price discipline in lines where market
rates are unsatisfactory. However, given the capital intensive nature of these classes of casualty business, we expect
that over time, these actions will improve our results. Net premiums written decreased by approximately $0.6 billion
as we ceased writing excess workers’ compensation business as a stand-alone product. This was slightly offset by
an increase in additional premiums on loss-sensitive business in the amount of approximately $164 million compared
to 2010.
Property net premiums written increased due to particularly strong pricing trends in the U.S. and Japan, coupled with
changes in the reinsurance strategy resulting in increased retentions. The catastrophe bond transactions in 2011 and
2010 reduced net premiums written by approximately $201 million and $208 million, respectively.
Specialty net premiums written increased due to the strategic initiative to grow higher value lines, including
aerospace, global marine, and credit insurance, all of which benefited from the impact of rate increases as well as
new business growth.
Financial lines net premiums written increased primarily due to a multi-year Errors and Omissions policy in the
Americas that produced net premiums written of $148 million in 2011.
Consumer Insurance Net Premiums Written
Consumer Insurance net premiums written increased in 2011 primarily due to the effect of including Fuji results for a
full year, improvement in foreign currency exchange rates, primarily in the Japanese Yen, and further growth in the
strategic higher value lines of business. Excluding the effect of the Fuji acquisition and foreign exchange, Consumer
Insurance net premiums written declined by one percent in 2011, primarily due to the non-renewal of certain
programs in the U.S. and Canada that did not meet internal performance targets in Personal lines business.
A&H net premiums written increased primarily due to the Fuji acquisition, direct marketing, group and individual
accident, travel business, and the execution of new business strategies at Fuji Life. Excluding the Fuji acquisition,
A&H net premiums written increased by approximately 7 percent, mainly attributable to favorable marketing programs
and the benefits of rate increases implemented in 2010 in Japan and the effect of foreign exchange. Growth was
also demonstrated in key geographic markets such as China, Continental Europe and Israel.
..................................................................................................................................................................................................................................
AIG 2012 Form 10-K 79
I T E M 7 / R E S U L T S O F O P E R A T I O N S

19FEB201322181802
.....................................................................................................................................................................................
Personal lines net premiums written increased primarily driven by the full year consolidation of Fuji results and
growth in auto, personal property, and specialty personal lines products. Excluding the effects of the Fuji acquisition,
Personal Lines net premiums decreased one percent, primarily as a result of a management decision to not renew
certain programs in the U.S. and Canada that did not meet internal performance targets. Personal Lines continued to
grow in key markets, including Japan and other Asia Pacific countries, Latin America, and in key lines, such as
personal property and specialty personal lines products.
AIG Property Casualty Net Premiums Written by Region..............................................................................................................................................................................................
The following table presents AIG Property Casualty’s net premiums written by region:
Commercial Insurance:
Americas $ 14,493 $ 14,302 (5)% 1% (5)% 1%
Asia Pacific 1,868 1,326 7 41 7 31
EMEA 4,694 4,545 (2) 3 1 1
Total net premiums written $ 21,055 $ 20,173 (4)% 4% (3)% 3%
Consumer Insurance:
Americas $ 3,628 $ 3,640 8% –% 9% –%
Asia Pacific 8,194 5,826 3 41 2 30
EMEA 1,940 1,880 (8) 3 (2) (1)
Total net premiums written $ 13,762 $ 11,346 3% 21% 3% 15%
Other:
Americas $ 23 $ 93 NM% (75)% NM% NM%
Asia Pacific – – NM NM NM NM
Total net premiums written $ 23 $ 93 NM% (75)% NM% NM%
Total AIG Property Casualty:
Americas $ 18,144 $ 18,035 (3)% 1% (3)% 1%
Asia Pacific 10,062 7,152 4 41 3 30
EMEA 6,634 6,425 (4) 3 – 1
Total net premiums written $ 34,840 $ 31,612 (1)% 10% (1)% 7%
WORLDWIDE NET PREMIUMS WRITTEN BY REGION (dollars in mil l ions)
2012 2011 2010
$6,634
$10,062
$18,144
$6,374
$10,448
$17,614
$6,425
$7,152
$18,035
Asia Pacific
Americas
EMEA
..................................................................................................................................................................................................................................
AIG 2012 Form 10-K80
$ 13,717
2,003
4,580
$ 20,300
$ 3,913
8,443
1,794
$ 14,150
$ (16)
2
$ (14)
$ 17,614
10,448
6,374
$ 34,436
Percentage Change in Percentage Change in
U.S. dollars Original Currency
Years Ended December 31,
(in millions) 2012 2011 2010 2012 vs. 2011 2011 vs. 2010 2012 vs. 2011 2011 vs. 2010
I T E M 7 / R E S U L T S O F O P E R A T I O N S

.....................................................................................................................................................................................
2012 and 2011 Comparison
The Americas net premiums written decreased primarily due to the restructuring of the Commercial Insurance
Casualty book of business primarily in workers’ compensation and loss-sensitive business, slightly offset by rate
increases. These decreases were partially offset by continued growth in Consumer Insurance, which was primarily
attributable to increases to group accident, personal property, and private client group and warranty lines. Additional
premium recognized on the loss-sensitive book of business was $54 million for the year ended December 31, 2012
compared to additional premium of $172 million in the prior year.
Asia Pacific net premiums written increased for the year ended December 31, 2012 primarily due to an increase in
Consumer Insurance reflecting growth of personal property business, group personal accident insurance, and direct
marketing business in Japan. The expansion in Asia Pacific countries outside Japan also continued in the year
ended December 31, 2012, supported by growth in individual personal accident insurance, direct marketing and
personal lines products. Commercial Insurance increased in the region primarily due to organic growth and rate
increases in Property and moderate organic growth in Specialty and Financial lines.
EMEA net premiums written decreased primarily due to the impact of foreign exchange. The continued execution of
underwriting discipline and the reduction in certain casualty lines that did not meet internal performance targets were
offset by rate strengthening initiatives on new and renewal business for Commercial Insurance. Consumer Insurance
experienced modest growth in travel, warranty, and specialty personal lines products while focused on re-building its
direct marketing programs that it previously shared with American Life Insurance Company (ALICO).
2011 and 2010 Comparison
The Americas net premiums written increased slightly as a result of modest growth in Commercial Insurance offset
by a small decrease in Consumer Insurance. The increase in Commercial Insurance was primarily due to the pricing
improvements in Property and Specialty, which was slightly offset by a decrease in Casualty due to the strategic
initiative in workers’ compensation. The decrease in Consumer insurance was primarily due to underwriting actions
taken in private client group to meet performance targets and a decrease in warranty lines new business in the U.S.
and Canada, partially offset by continued growth in travel business and A&H direct marketing in Latin America.
Asia Pacific net premiums written increased as a result of the effect of the full year consolidation of Fuji. Excluding
the effect of the Fuji acquisition, net premium written increased 13 percent. The increase in Commercial Insurance
was due to rate increases in Property, primarily in Japan. Consumer Insurance business in Asia Pacific countries
outside Japan also expanded, supported by growth in nearly all lines of business, particularly individual personal
accident insurance, travel, and auto products.
In EMEA, the increase in Commercial Insurance was primarily related to growth in specialty products in line with our
strategic initiative to grow higher value lines. Excluding the impact of foreign exchange, Consumer Insurance
decreased as the business was focused on rebuilding the direct marketing programs that we previously shared with
ALICO and the non-renewal of certain business to retain underwriting discipline. These decreases were largely offset
by growth in group accident insurance, automobile and specialty personal lines products.
..................................................................................................................................................................................................................................
AIG 2012 Form 10-K 81
I T E M 7 / R E S U L T S O F O P E R A T I O N S

.....................................................................................................................................................................................
AIG Property Casualty Underwriting Ratios..............................................................................................................................................................................................
The following table presents the AIG Property Casualty combined ratios based on GAAP data and
reconciliation to the accident year combined ratio, as adjusted:
Commercial Insurance
Loss ratio 84.1 89.3 (3.8) (5.2)
Catastrophe losses and reinstatement premiums (11.9) (4.8) 1.0 (7.1)
Prior year development net of premium adjustments 1.9 (12.2) (3.1) 14.1
Change in discount 0.2 1.9 0.3 (1.7)
Accident year loss ratio, as adjusted 74.3 74.2 (5.6) 0.1
Acquisition ratio 14.6 14.1 2.0 0.5
General operating expense ratio 9.9 10.8 2.4 (0.9)
Expense ratio 24.5 24.9 4.4 (0.4)
Combined ratio 108.6 114.2 0.6 (5.6)
Catastrophe losses and reinstatement premiums (11.9) (4.8) 1.0 (7.1)
Prior year development net of premium adjustments 1.9 (12.2) (3.1) 14.1
Change in discount 0.2 1.9 0.3 (1.7)
Accident year combined ratio, as adjusted 98.8 99.1 (1.2) (0.3)
Consumer Insurance
Loss ratio 64.7 59.8 (3.8) 4.9
Catastrophe losses and reinstatement premiums (5.2) (0.6) 2.5 (4.6)
Prior year development net of premium adjustments (0.6) 0.6 0.7 (1.2)
Accident year loss ratio, as adjusted 58.9 59.8 (0.6) (0.9)
Acquisition ratio 23.8 26.5 1.2 (2.7)
General operating expense ratio 14.4 14.7 0.9 (0.3)
Expense ratio 38.2 41.2 2.1 (3.0)
Combined ratio 102.9 101.0 (1.7) 1.9
Catastrophe losses and reinstatement premiums (5.2) (0.6) 2.5 (4.6)
Prior year development net of premium adjustments (0.6) 0.6 0.7 (1.2)
Accident year combined ratio, as adjusted 97.1 101.0 1.5 (3.9)
Total AIG Property Casualty
Loss ratio 78.3 85.7 (4.4) (7.4)
Catastrophe losses and reinstatement premiums (9.2) (3.3) 1.7 (5.9)
Prior year development net of premium adjustments (0.3) (14.9) (1.1) 14.6
Change in discount (0.1) 1.7 0.3 (1.8)
Accident year loss ratio, as adjusted 68.7 69.2 (3.5) (0.5)
Acquisition ratio 18.1 18.3 1.8 (0.2)
General operating expense ratio 12.4 12.8 2.4 (0.4)
Expense ratio 30.5 31.1 4.2 (0.6)
Combined ratio 108.8 116.8 (0.2) (8.0)
Catastrophe losses and reinstatement premiums (9.2) (3.3) 1.7 (5.9)
Prior year development net of premium adjustments (0.3) (14.9) (1.1) 14.6
Change in discount (0.1) 1.7 0.3 (1.8)
Accident year combined ratio, as adjusted 99.2 100.3 0.7 (1.1)
..................................................................................................................................................................................................................................
AIG 2012 Form 10-K82
80.3
(10.9)
(1.2)
0.5
68.7
16.6
12.3
28.9
109.2
(10.9)
(1.2)
0.5
97.6
60.9
(2.7)
0.1
58.3
25.0
15.3
40.3
101.2
(2.7)
0.1
98.6
73.9
(7.5)
(1.4)
0.2
65.2
19.9
14.8
34.7
108.6
(7.5)
(1.4)
0.2
99.9
Increase (Decrease)Years Ended December 31,
2012 2011 2010 2012 vs. 2011 2011 vs. 2010
I T E M 7 / R E S U L T S O F O P E R A T I O N S

20FEB201315483033
20FEB201315482879
.....................................................................................................................................................................................
COMMERCIAL INSURANCE RATIOS
2012 2011 2010
84.1
9.9
14.616.6
12.3
80.3 89.3
10.8
14.1
Loss ratio
General operatingexpense ratio
Acquisition ratio
ACCIDENT YEAR LOSS RATIOS
2012 2011 2010
74.3
9.9
14.616.6
12.3
68.7 74.2
10.8
14.1
Loss ratio
General operatingexpense ratio
Acquisition ratio
CONSUMER INSURANCE RATIOS
2012 2011 2010
64.7
14.4
23.825.0
15.3
60.9 59.8
14.7
26.5
Loss ratio
General operatingexpense ratio
Acquisition ratio
2012 2011 2010
58.9
14.4
23.825.0
15.3
58.3 59.8
14.7
26.5
Loss ratio
General operatingexpense ratio
Acquisition ratio
ACCIDENT YEAR LOSS RATIOS
Given the nature of the lines of business and the expenses included in Other, management has determined that the
traditional underwriting measures of loss ratio, acquisition ratio, general operating expense ratio and combined ratio
do not provide an appropriate measure of underwriting performance. Therefore, these ratios are not separately
presented for Other.
See Liability for Unpaid Claims and Claims Adjustment Expense for further discussion of discounting of reserves and
prior year development.
2012 and 2011 Comparison
Commercial Insurance Ratios
The improvement in the accident year loss ratio, as adjusted, for the year ended December 31, 2012 reflects the
realization of benefits from the continued execution of our multi-faceted strategy to enhance risk selection, pricing
discipline, exposure management and claims processing. Although the execution of these strategies resulted in a
reduction of Casualty net premiums written, it also improved the accident year loss ratio as we remediated our
primary and excess Casualty books in both the Americas and EMEA regions. Financial lines improved due to rate
strengthening and restructuring and re-underwriting of certain products. Property improved due to rate strengthening,
enhanced engineering and exposure management.
The acquisition ratio increased by 2.0 points primarily due to our strategy of growing higher value lines, which
typically incur higher acquisition costs, and the restructuring of our Casualty lines, especially the loss-sensitive
..................................................................................................................................................................................................................................
AIG 2012 Form 10-K 83
I T E M 7 / R E S U L T S O F O P E R A T I O N S

.....................................................................................................................................................................................
business in the U.S. In addition, ceding commissions decreased as a result of restructuring of the Property and
Specialty reinsurance program as part of the strategic decision to retain more profitable business while continuing to
manage aggregate exposures.
The general operating expense ratio increased by 2.4 points due to increases in bad debt expense, investments in
strategic initiatives and human resources, coupled with a lower net premiums earned base. The lower net premiums
earned base contributed approximately 0.2 points to the increase in the general operating expense ratio. Bad debt
expense increased by approximately $143 million, which contributed approximately 0.7 points to the general
operating expense ratio increase in the year ended December 31, 2012. For the year ended December 31, 2012,
investments in strategic initiatives, commercial lines platform, our newly formed scientific group, underwriting and
pricing tools totaled approximately $51 million, representing an increase of approximately $41 million over the prior
year. The remainder of the general operating expense ratio increase was primarily due to higher personnel costs, as
part of AIG’s continued investment in its employees.
Consumer Insurance Ratios
The accident year loss ratio, as adjusted, in the year ended December 31, 2012 improved in both A&H and Personal
lines. The improvement in A&H is primarily attributable to favorable underwriting performance of individual personal
accident business in Asia Pacific, targeted underwriting actions, coupled with rate increases and risk selection of
group A&H in the U.S. and the overall travel business. The improvement in Personal lines is primarily attributable to
improved underwriting and risk selection in the warranty line of business, price sophistication and rate strengthening
for Japan, EMEA automobile and the U.S. private client group, and targeted business mix changes that resulted in
faster growth in non-automobile products than the automobile line of business. Included in the accident year loss
ratio, as adjusted, for the year ended December 31, 2012, are severe losses totaling $33 million. There were no
severe losses for the year ended December 31, 2011.
The acquisition ratio increased by 1.2 points primarily due to profit sharing arrangements in lines of business targeted
for growth, direct marketing expenses and the reduction in VOBA benefit. Overall direct marketing costs increased by
approximately 9 percent in 2012; total direct marketing spending outside the U.S. increased by approximately
18 percent in the same period. There was also a decrease of approximately $49 million in the benefit from the
amortization of VOBA liabilities recognized at the time of the Fuji acquisition.
The general operating expense ratio increased by 0.9 points as a result of incurring additional expenses to grow key
lines of business across a number of geographic areas and strategic expansion in growth economy nations. For the
year ended December 31, 2012, investments in strategic initiatives, including investments in an integrated consumer
lines platform and information systems infrastructure totaled approximately $44 million, representing an increase of
approximately $27 million or 0.2 points over the prior year. The remainder of the increase was primarily due to higher
personnel costs, as we continue our efforts to align employee performance across the globe with our strategic goals.
Other Category
We continued to invest in a number of strategic initiatives during 2012, including the implementation of global finance
and information systems, preparation for Solvency II compliance, readiness for regulation by the FRB, legal entity
restructuring, and underwriting and claims improvement initiatives. We also continued to streamline our finance,
policy and claims administration and human resources operations. The costs of these initiatives, which are not
specific to either Commercial Insurance or Consumer Insurance, are reported as part of the Other category. For the
year ended December 31, 2012, such costs totaled $391 million, representing an increase of approximately
$195 million over the prior year, and contributed approximately 1.1 points to the AIG Property Casualty general
operating expense ratio.
..................................................................................................................................................................................................................................
AIG 2012 Form 10-K84
I T E M 7 / R E S U L T S O F O P E R A T I O N S

.....................................................................................................................................................................................
2011 and 2010 Comparison
Commercial Insurance Ratios
The Commercial Insurance accident year loss ratio, as adjusted, increased in 2011 due to increased losses for the
Specialty Workers’ Compensation and Excess Casualty business (in the Americas region) and the Primary Casualty
and Professional Indemnity businesses (in the EMEA region). Severe losses were $296 million for the year ended
December 31, 2011, compared to $135 million in the prior year. These increases were largely offset by rate
strengthening and underwriting actions taken since 2010.
The acquisition ratio increased by 0.5 point in 2011 due to a change in the mix of business from low commission
casualty business to higher commission property business, due to the underwriting actions taken since 2010, partially
offset by rate strengthening.
The general operating expense ratio decreased by 0.9 points in 2011 compared to 2010 due to the overall growth in
the business. In addition, the expense ratio reflects the effects of continued enhancements to regional governance,
risk management capabilities and investments within growth economy nations.
Consumer Insurance Ratios
The accident year loss ratio, as adjusted, in the year ended December 31, 2011 decreased, primarily due to rate
strengthening and underwriting actions taken since 2010 and strong results in direct marketing and individual
personal accident business.
The acquisition ratio decreased by 2.7 points primarily due to the effects of the full year consolidation of Fuji results.
Fuji has a lower average acquisition ratio than the rest of the Consumer Insurance business due in part to its
business mix.
The general operating expense ratio decreased by 0.3 points, primarily due to the growth in the business offset by
investments in strategic initiatives, including a consumer lines platform and the implementation of global finance and
information systems totaling $16 million, an increase of approximately $9 million over the prior year.
Other Category
We increased investments in a number of strategic initiatives during 2011, including the implementation of improved
regional governance and risk management capabilities, the implementation of global accounting and claims systems,
preparation for Solvency II and certain other legal entity restructuring initiatives. For the year ended December 31,
2011, such investments totaled $196 million, representing an increase of approximately $134 million over the prior
year, and contributed approximately 0.5 points to the AIG Property Casualty general operating expense ratio.
..................................................................................................................................................................................................................................
AIG 2012 Form 10-K 85
I T E M 7 / R E S U L T S O F O P E R A T I O N S

.....................................................................................................................................................................................
The following table presents AIG Property Casualty accident year catastrophe losses, by major event and
severe losses:
Event:(a)
Storm Sandy(b) – $ – $ – $ – – $ – $ – $ –U.S. Windstorms 4 383 14 397 8 291 51 342U.S. Drought – – – – – – – –Hurricane Isaac – – – – – – – –Hurricane Irene 1 296 73 369 – – – –Thailand Flood 1 366 2 368 – – – –Tohoku Catastrophe(c) 1 667 524 1,191 – – – –New Zealand earthquakes 2 344 7 351 – – – –Chile earthquake – – – – 1 289 2 291Southeast U.S. flood – – – – 1 171 4 175
All other events 13 525 95 620 9 249 9 258
Claims and claimexpenses 2,581 715 3,296 1,000 66 1,066
Reinstatementpremiums 11 – 11 10 – 10
Total catastrophe-relatedcharges 22 $ 2,592 $ 715 $ 3,307 19 $ 1,010 $ 66 $ 1,076
Total severe losses and lossadjustment expense 21 $ 296 $ – $ 296 12 $ 135 $ 12 $ 147
(a) Events shown in the above table are catastrophic insured events having a net impact in excess of $10 million each. Severe losses are defined asnon-catastrophe individual first party losses greater than $10 million, net of related reinsurance.
(b) On October 29, 2012 Storm Sandy, one of the largest Atlantic hurricanes on record, came ashore in the U.S. When the storm made landfall, it wascategorized as an extratropical cyclone, not a hurricane. Storm Sandy is expected to be the second-costliest Atlantic hurricane in history, only surpassed byHurricane Katrina in 2005. Storm Sandy caused widespread flooding and wind damage across the mid-Atlantic states.
(c) On March 11, 2011, a major earthquake occurred near the northeast coast of Honshu, Japan, triggering a tsunami in the Pacific Ocean. This disaster isreferred to as the Tohoku Catastrophe.
AIG Property Casualty Investing and Other Results..............................................................................................................................................................................................
The following table presents AIG Property Casualty’s investing and other results:
Net investment income
Commercial Insurance $ 3,213 $ 3,309 (13)% (3)%
Consumer Insurance 354 301 27 18
Other 781 782 100 –
Total net investment income 4,348 4,392 11 (1)
Net realized capital gains (losses) 607 (38) NM NM
Legal settlement – – NM NM
Bargain purchase gain – 332 NM NM
Other income (expense) – net* (5) 669 NM NM
Investing and other results $ 4,950 $ 5,355 (2)% (8)%
* Includes gain on divested properties of $669 million in 2010
We manage and account for our invested assets on a legal entity basis in conformity with regulatory requirements.
Within a legal entity, invested assets are available to pay claims and expenses of both Commercial Insurance and
Consumer Insurance operating segments as well as the Other category. Invested assets are not segregated or
otherwise separately identified for the Commercial Insurance and Consumer Insurance operating segments.
Investment income is allocated to the Commercial Insurance and Consumer Insurance operating segments based on
an internal investment income allocation model. The model estimates investable funds based primarily on loss
reserves, unearned premium and a capital allocation for each segment. The investment income allocation is
calculated based on the estimated investable funds and risk-free yields (plus an illiquidity premium) consistent with
the approximate duration of the liabilities. The actual yields in excess of the allocated amounts and the investment
..................................................................................................................................................................................................................................
AIG 2012 Form 10-K86
Years Ended 2012 2011 2010December 31,
# of Commercial Consumer # of Commercial Consumer # of Commercial Consumer(in millions) Events Insurance Insurance Total Events Insurance Insurance Total Events Insurance Insurance Total
1 $ 1,691 $ 322 $ 2,0138 326 13 3391 108 – 1081 56 22 78– – – –– – – –– – – –– – – –– – – –– – – –3 62 25 87
2,243 382 2,625
27 – 27
14 $ 2,270 $ 382 $ 2,652
23 $ 293 $ 33 $ 326
Percentage ChangeYears Ended December 31,(in millions) 2012 2011 2010 2012 vs. 2011 2011 vs. 2010
$ 2,809
451
1,560
4,820
(2)
17
–
2
$ 4,837
I T E M 7 / R E S U L T S O F O P E R A T I O N S

.....................................................................................................................................................................................
income from the assets not attributable to the Commercial Insurance and the Consumer Insurance operating
segments are assigned to the Other category.
Net realized capital gains (losses), bargain purchase gains and other income (expense) – net are not allocated to
Commercial Insurance and Consumer Insurance, but are reported as part of the Other category.
2012 and 2011 Comparison
Net Investment Income
Net investment income is influenced by a number of factors including the amounts and timing of inward and outward
cash flows, the level of interest rates and changes in overall asset allocation. Net investment income increased
$472 million or 11 percent in 2012, compared to 2011, primarily due to the impact of the overall diversification in the
asset portfolio during the year. We adopted yield-enhancement initiatives in 2011, and continued through 2012, which
increased the average yield of our investment portfolio by 0.3 points to 4.0 percent during 2012.
While corporate debt securities continued to be the largest asset category, we continued to reduce our concentration
in lower yielding tax exempt municipal bond holdings and focus on risk weighted opportunistic investments in higher
yielding assets such as structured securities. This asset diversification has achieved an increase in average yields
while the overall credit ratings of our fixed maturity investments were largely unchanged. We expect to continue to
refine our investment strategy in 2013 to meet our liquidity, duration and credit quality objectives as well as current
risk-return and tax objectives.
Our invested asset portfolio grew by approximately $4.3 billion, or 3 percent during the year with declining interest
rates and narrowing spreads in both investment grade and higher yield asset classes contributing to higher
unrealized appreciation in our portfolio.
Net investment income from other investment categories increased by $160 million in 2012 compared to 2011, of
which $82 million was attributed to the strong performance of equity partnership investments, following a 16 percent
increase in the S&P 500 Index during 2012. Other investment income also increased by $72 million due to the
strategic group benefits partnership with AIG Life and Retirement, all of which is reported in Consumer Insurance.
Net Realized Capital Gains (Losses)
Net realized capital losses for the year ended December 31, 2012 were driven by other-than-temporary impairments
and impairment charges on life settlement contracts offset by gains recognized on the sale of fixed maturity and
equity securities. We recognized other-than-temporary impairment charges of $377 million primarily attributable to a
decrease in recoverable values for structured securities, partnership investments and equity securities in an
unrealized loss position for more than 12 months. During 2012, we recognized impairment charges on life settlement
contracts in the amount of $309 million as a result of decreases in their estimated fair value as well as a change in
management’s intent about continuing to hold certain life settlement contracts. In addition, we recognized a loss of
$43 million from derivatives used to economically hedge foreign currency positions. These decreases were offset by
gains recognized on the sale of fixed maturity and equity securities in the amount of $675 million and a gain on the
sale of a property in the amount of $55 million.
See Consolidated Results for further discussion on net investment income and net realized capital gains (losses).
Legal Settlements
In December of 2012, we recorded litigation settlement income from settlements with three financial institutions who
participated in the creation, offering and sale of RMBS as to which AIG and its subsidiaries suffered losses either
directly on their own account or in connection with their participation in AIG’s securities lending program.
2011 and 2010 Comparison
Net Investment Income
Net investment income decreased slightly in 2011 compared to 2010. We experienced declines in private equity and
hedge fund income, as well as increases in investment expenses, which were largely offset by increases in interest
income. The decrease in private equity and hedge fund income reflects the decline in the overall equity markets
during the second half of 2011. The increase in investment expenses in 2011 resulted mainly from increases in both
..................................................................................................................................................................................................................................
AIG 2012 Form 10-K 87
I T E M 7 / R E S U L T S O F O P E R A T I O N S

.....................................................................................................................................................................................
internal and external investment management fees. The interest income increase reflects the redeployment of cash
and short term instruments into longer term, higher yield securities. In addition, 2011 reflects a full year of interest
income related to Fuji.
Net Realized Capital Gains (Losses)
Net realized capital gains were recorded in 2011, compared to losses in 2010. We recorded gains on the sales of
fixed maturity securities; a decrease in other-than-temporary impairment charges; gains from improvements in foreign
currency exchange rates; and gains from derivative instruments that do not qualify for hedge accounting, resulting
primarily from declining long term interest rates. These derivative instruments economically hedge products that
provide benefits over an extended period of time. Net realized capital gains on sales of fixed maturity securities
increased due to our strategy to better align investment allocations with current overall performance and income tax
planning objectives.
These gains were partially offset by impairments within other invested assets, primarily life settlement contracts. For
the years 2011 and 2010, we recorded impairment charges of $351 million and $78 million, respectively, related to
life settlement contracts. These charges included approximately $38 million and $4 million of impairments,
respectively, associated with life insurance policies issued by AIG Life and Retirement that are eliminated in
consolidation.
During 2011, we experienced an increase in the number of life settlement contracts identified as potentially impaired,
compared to previous analyses. This increase reflected a new process adopted by us, in which updated medical
information on individual insured lives is requested on a routine basis. In some cases, this updated information
indicates that an individual’s health has improved, resulting in an impairment loss due to revised estimates of net
cash flows from the related contract. In addition, our domestic operations refined our fair values based upon the
availability of recent medical information.
See Consolidated Results for further discussion on net investment income and net realized capital gains (losses).
Bargain Purchase Gain
On March 31, 2010, we purchased additional voting shares in Fuji which resulted in the effective control and
consolidation of Fuji. This acquisition resulted in a bargain purchase gain of $0.3 billion, which was included in the
Consolidated Statement of Income (Loss) in Other Income. The bargain purchase gain was primarily attributable to
the depressed market value of Fuji’s common stock, which we believed was the result of macro-economic, capital
market and regulatory factors in Japan coupled with Fuji’s financial condition and results of operations.
Liability for Unpaid Claims and Claims Adjustment Expense..............................................................................................................................................................................................
The following discussion of the consolidated liability for unpaid claims and claims adjustment expenses (loss
reserves) presents loss reserves for AIG Property Casualty as well as the loss reserves pertaining to the Mortgage
Guaranty reporting unit, which is reported in Other.
..................................................................................................................................................................................................................................
AIG 2012 Form 10-K88
I T E M 7 / R E S U L T S O F O P E R A T I O N S

.....................................................................................................................................................................................
The following table presents the components of AIG’s gross loss reserves by major lines of business on a
U.S. statutory basis*:
Other liability occurrence $ 22,471
International 17,726
Workers’ compensation (net of discount) 17,420
Other liability claims made 11,216
Property 6,165
Auto liability 3,081
Products liability 2,416
Medical malpractice 1,690
Mortgage guaranty / credit 3,101
Accident and health 1,553
Commercial multiple peril 1,134
Aircraft 1,020
Fidelity/surety 786
Other 1,366
Total $ 91,145
* Presented by lines of business pursuant to statutory reporting requirements as prescribed by the National Association of Insurance
Commissioners.
AIG’s gross loss reserves represent the accumulation of estimates of ultimate losses, including estimates for IBNR
and loss expenses, less applicable discount for future investment income. We regularly review and update the
methods and assumptions used to determine loss reserve estimates and to establish the resulting reserves. Any
adjustments resulting from this review are reflected in pre-tax income. Because loss reserve estimates are subject to
the outcome of future events, changes in estimates are unavoidable given that loss trends vary and time is often
required for changes in trends to be recognized and confirmed. Reserve changes that increase prior years’ estimates
of ultimate cost are referred to as unfavorable or adverse development or reserve strengthening. Reserve changes
that decrease prior years’ estimates of ultimate cost are referred to as favorable development.
The net loss reserves represent loss reserves reduced by reinsurance recoverable, net of an allowance for
unrecoverable reinsurance, less applicable discount for future investment income.
The following table classifies the components of net loss reserves by business unit:
AIG Property Casualty:
Commercial Insurance $ 57,718
Consumer Insurance 5,438
Other 4,823
Total AIG Property Casualty 67,979
Other operations – Mortgage Guaranty 2,846
Net liability for unpaid claims and claims adjustment expense at end of year $ 70,825
..................................................................................................................................................................................................................................
AIG 2012 Form 10-K 89
2012
$ 21,533
17,453
17,319
11,443
4,961
3,060
2,195
1,651
1,957
1,518
1,310
1,065
647
1,879
$ 87,991
December 31,(in millions)
$ 56,462
5,592
4,895
66,949
1,833
$ 68,782
At December 31,(in millions) 2011
2012 2011
I T E M 7 / R E S U L T S O F O P E R A T I O N S

.....................................................................................................................................................................................
Discounting of Reserves
The following table presents the components of AIG Property Casualty’s loss reserve discount included
above:
U.S. workers’ compensation:
Tabular $ 777
Non-tabular 2,318
Asbestos 88
Total $ 3,183
See Note 13 to the Consolidated Financial Statements for additional information on discounting of loss reserves.
The following table presents the net reserve discount benefit (charge):
Change in loss reserve discount – current accident year $ 342 $ 381
Change in loss reserve discount – prior year development (22) 527
Accretion of reserve discount (354) (346)
Net reserve discount benefit (charge) $ (34) $ 562
The benefit from the change in discount in the year ended December 31, 2012 includes a $100 million increase in
the reserve discount due to the commutation of an internal reinsurance treaty, under which a U.S. subsidiary
previously ceded workers’ compensation claims to a non-U.S. subsidiary. AIG discounts its loss reserves related to
workers’ compensation business written by its U.S. domiciled subsidiaries as permitted by the domiciliary statutory
regulatory authorities. As a result of the commutation, the reserves for these claims are now recorded in a U.S.
insurance subsidiary and accordingly are being discounted commencing in the three-month period ended June 30,
2012. The commutation was implemented as part of AIG Property Casualty’s efforts to simplify its internal
reinsurance arrangements.
Annual Reserving Conclusion
AIG net loss reserves represent our best estimate of our liability for net losses and loss expenses as of
December 31, 2012. While AIG regularly reviews the adequacy of established loss reserves, there can be no
assurance that AIG’s ultimate loss reserves will not develop adversely and materially exceed AIG’s loss reserves as
of December 31, 2012. In our opinion, such adverse development and resulting increase in reserves are not likely to
have a material adverse effect on AIG’s consolidated financial condition, although such events could have a material
adverse effect on AIG’s consolidated results of operations for an individual reporting period.
..................................................................................................................................................................................................................................
AIG 2012 Form 10-K90
$ 801
2,394
51
$ 3,246
Years Ended December 31,(in millions) 2012
$ 348
87
(372)
$ 63
December 31,(in millions) 2012 2011
2011 2010
I T E M 7 / R E S U L T S O F O P E R A T I O N S

.....................................................................................................................................................................................
The following table presents the rollforward of net loss reserves:
Net liability for unpaid claims and claims adjustment expense at beginning of year $ 71,507 $ 67,899
Foreign exchange effect 353 (126)
Acquisitions(a) – 1,538
Dispositions(b) – (87)
Change due to NICO reinsurance transaction (1,703) –
Losses and loss expenses incurred:
Current year, undiscounted 27,931 24,455
Prior years, undiscounted(c) 195 4,182
Change in discount 34 (562)
Losses and loss expenses incurred 28,160 28,075
Losses and loss expenses paid:
Current year 11,534 9,873
Prior years 15,958 15,919
Losses and loss expenses paid 27,492 25,792
Net liability for unpaid claims and claims adjustment expense at end of year $ 70,825 $ 71,507
(a) Represents the acquisition of Fuji on March 31, 2010.
(b) Includes amounts related to dispositions through the date of disposition.
(c) See tables below for details of prior year development by business unit, accident year and major class of business.
The following tables summarize development, (favorable) or unfavorable, of incurred losses and loss
expenses for prior years, net of reinsurance:
Prior accident year development by accident year:
Accident Year
2011 $ – $ –
2010 402 –
2009 117 (61)
2008 (294) 286
2007 (172) 528
2006 (273) 199
2005 (164) 113
2004 (16) 134
2003 13 73
2002 and prior 582 2,910
Total $ 195 $ 4,182
..................................................................................................................................................................................................................................
AIG 2012 Form 10-K 91
2012 2011 2010
$ 70,825
757
–
(11)
90
25,385
421
(63)
25,743
9,297
19,325
28,622
$ 68,782
$ (162)
(75)
(45)
(150)
157
(20)
112
33
13
558
$ 421
Years Ended December 31,(in millions)
Years Ended December 31,(in millions) 2012 2011 2010
I T E M 7 / R E S U L T S O F O P E R A T I O N S

.....................................................................................................................................................................................
For certain categories of claims (e.g., construction defect claims and environmental claims), losses may sometimes
be reclassified to an earlier or later accident year as more information about the date of occurrence becomes
available to AIG. These reclassifications are shown as development in the respective years in the table above.
Prior accident year development by major class of business:
Commercial Insurance:
Excess casualty – U.S. $ (414) $ 1,071
D&O and related management liability – U.S. (167) 94
Environmental (post 1986 – ongoing) – U.S. 32 –
Commercial risk – U.S. 265 224
Healthcare – U.S. (45) (75)
Primary (specialty) workers’ compensation – U.S. 145 518
Primary casualty – U.S. 247 633
Natural catastrophes:
U.S. 9 18
International (84) (11)
All other, net:
U.S. (175) 12
International (96) 93
Total all other, net (271) 105
Total Commercial Insurance (283) 2,577
Total Consumer Insurance 85 (63)
Other
Asbestos and environmental (1986 and prior)
U.S. 29 1,151
International – 352
Total asbestos and environmental 29 1,503
Environmental (1987 - 2004) – U.S. 382 14
Excess workers’ compensation – U.S. – 825
All other, net (2) (6)
Total Other 409 2,336
Total AIG Property Casualty 211 4,850
Other operations – Mortgage Guaranty (16) (668)
Total $ 195 $ 4,182
Net Loss Development by Class of Business
In determining the loss development from prior accident years, we analyze and evaluate the change in estimated
ultimate loss for each accident year by class of business. For example, if loss emergence for a class of business is
different than expected for certain accident years, the actuaries examine the indicated effect such emergence would
have on the reserves of that class of business. In some cases, the higher or lower than expected emergence may
result in no clear change in the ultimate loss estimate for the accident years in question, and no adjustment would be
made to the reserves for the class of business for prior accident years. In other cases, the higher or lower than
expected emergence may result in a larger change, either favorable or unfavorable. As appropriate, we make
adjustments for the difference between the actual and expected loss emergence. As part of our reserving process,
we also consider notices of claims received with respect to emerging and/or evolving issues, such as those related to
the U.S. mortgage and housing market.
The following is a discussion of the primary reasons for the development in 2012, 2011 and 2010 of those classes of
business that experienced significant prior accident year development during the three-year period. See Critical
Accounting Estimates for a description of our loss reserving process.
..................................................................................................................................................................................................................................
AIG 2012 Form 10-K92
Years Ended December 31,(in millions) 2012 2011 2010
$ 262
(307)
161
46
68
46
367
(144)
(105)
42
(146)
(104)
290
(20)
70
6
76
166
–
(13)
229
499
(78)
$ 421
I T E M 7 / R E S U L T S O F O P E R A T I O N S

.....................................................................................................................................................................................
Excess Casualty – U.S.
The excess casualty segment presents unique challenges for estimating the unpaid claims. Insureds are generally
required to provide notice of claims that exceed a threshold, either expressed as a proportion of the attachment
(e.g., 50 percent of the attachment) or as particular types of claims (e.g., death, quadriplegia). This threshold is
generally established well below our attachment point, in order to provide us with a precautionary notice of claims
that could potentially pierce our layer of coverage. This means that the majority of claims close without payment
because the claims never pierce our layer, while the claims that close with payment can be large and highly variable.
Thus, estimates of unpaid claims carry significant uncertainty.
During 2012, the excess casualty class of business experienced $262 million of adverse development based on
worse than expected emergence in 2012, primarily from adverse outcomes relating to certain large claims from older
accident years, from the legacy public entity excess casualty class of business and from a refined analysis applied to
claims in excess of $10 million. This refined analysis considers the impact of changing attachment points (primarily
impacting frequency of excess claims) and limit structures (primarily impacting severity of excess claims) throughout
the loss development period.
During 2011 the excess casualty business segment experienced better than expected loss emergence, based on the
shorter-termed loss development pattern from the year-end 2010 reserve analysis. However, accident year 2010
experienced some large catastrophic losses causing its results to be worse than expected.
Loss development was affected by an increase in loss costs in 2010, primarily due to medical inflation, which
increased the economic loss component of tort claims; advances in medical care, which extended the life span of
severely injured claimants; and larger jury verdicts, which increased the value of severe tort claims.
Director and Officer (D&O) and Related Management Liability – U.S.
We experienced favorable development in 2012 and 2011. The favorable development over the two-year period
related primarily to accident years 2005-2007, 2010, and, to a lesser extent, accident years 2001 and 2002.
Development in 2010 was slightly negative.
For the year-end 2012 loss reserve review, our actuaries took into account the favorable emergence during 2012 for
several accident years, especially accident year 2010, the claims department’s reviews of open claims and reduced
the ultimate losses for prior years accordingly. The 2012 actuarial review also adopted a refined segmentation for this
class of business with the selection of differentiated frequency and severity trends. The overall loss cost trend
adopted for this class of business in 2012 from the application of the refined segmentation was slightly lower than
that adopted for the 2011 review reflecting the continued favorable emergence from this class of business.
For the year-end 2011 loss reserve reviews, our actuaries took into account the favorable development from prior
accident years, as well as the continuing favorable development observed in the ground-up claims projections by our
claims staff over the past five years.
Excess Workers’ Compensation – U.S.
This class of business has an extremely long tail and is one of the most challenging classes of business to reserve
for, particularly when the excess coverage is provided above a self-insured retention layer. The class is highly
sensitive to small changes in assumptions – in the rate of medical inflation or the longevity of injured workers, for
example – which can have a significant effect on the ultimate reserve estimate.
During the 2012 loss reserve review, we augmented traditional reserve methodologies with an analysis of underlying
claims cost drivers to inform our judgment of the ultimate loss costs for open reported claims from accident years
2003 and prior (representing approximately 95 percent of all open reported claims) and used the refined analysis to
inform our judgment of the ultimate loss cost for claims that have not yet been reported using a frequency/severity
approach for these accident years.
The approach was deemed to be most suitable for injured workers whose medical conditions had largely stabilized
(i.e., at least 9 to 10 years have elapsed since the date of injury). The reserves for accident years 2004 and
subsequent (13 percent of total case and IBNR reserves for this class) were determined using traditional methods.
See Critical Accounting Estimates for additional information.
..................................................................................................................................................................................................................................
AIG 2012 Form 10-K 93
I T E M 7 / R E S U L T S O F O P E R A T I O N S

.....................................................................................................................................................................................
The refined analysis confirmed that significant uncertainty remains for this class of business, especially from
unreported claims and from the propensity for future medical deterioration. Based on the more refined analysis we
did not recognize any material development for accident years 2011 and prior.
AIG experienced significant adverse development of $825 million for this class in 2010. With the passage of the
Affordable Care Act in March 2010, we concluded that there is increased vulnerability to the risk of further
cost-shifting to the excess workers’ compensation class of business. Settlement efforts can also be affected by
changes to evaluation protocols implemented by the Centers for Medicare & Medicaid Services in 2009. These
changes were expected to result in future prescription drug costs being borne by workers’ compensation insurers to a
significantly greater degree than in the past, and were assessed as being likely to lead to further deteriorating trends
for the excess workers’ compensation class of business.
As part of our 2010 comprehensive loss reserve analysis, we compared and contrasted the traditional techniques
that have been used for this class with an alternative approach that focuses more explicitly on projecting the effect of
future calendar year trends, while placing less weight on prior-period loss development ratios due to the increased
evidence of changes to the claims environment. These various actuarial analyses indicated a substantial increase in
loss estimates from the prior-year level, primarily for accident years 2002 and prior.
Healthcare – U.S.
During 2012, this class recognized $68 million of adverse prior year development due to several large claims that
involved unusual coverage issues for this class. With the exception of these claims, this class experienced claim
activity in line with expectations.
Healthcare business written by AIG Property Casualty’s Americas region produced moderate favorable development
in 2011 and 2010. Healthcare loss reserves have benefited from favorable market conditions and an improved legal
environment in accident years 2002 and subsequent, following a period of adverse loss trends and market conditions
that began in the mid 1990s.
Environmental
We maintain an active environmental insurance business related to pollution legal liability and general liability for
environmental consultants and engineers, as well as runoff business for certain environmental coverage (including
Cost Cap Containment) which provides cost overrun protection. We evaluate and report reserves associated with this
business separately from the 1986 and prior asbestos and environmental reserves associated with standard General
Liability and Umbrella policies discussed in ‘‘Asbestos and Environmental Reserves’’.
Because of an increase in the frequency and severity of claims observed beginning in 2011, the 2012 loss reserve
review consisted of an intensive review of reported claims by a multi-disciplinary team including external experts in
environmental law and engineering science, toxicologists and other experts, our actuaries, claims managers and
underwriters to reassess our indicated loss reserve need. The review improved our understanding of factors that
drive claim costs such as policy term, limit, pollution conditions covered, location of incident and applicable laws and
remediation standards. The analysis used these factors to segment and analyze the claim data to determine ultimate
costs, in some cases, on a claim by claim basis. As a result of this analysis, $326 million of prior year adverse
development was recognized during 2012, including $166 million reported in the AIG Property Casualty Other
reporting unit related to lines that are now in runoff. The majority (81 percent) of the adverse development related to
accident years 2003 and prior, before significant underwriting changes were adopted.
Historically, we had used traditional actuarial methods to assess the reserves for the environmental products. The
comprehensive claims review provided a more refined approach for the development of actuarial estimates for toxic
tort claims (which were found to have a distinctly lengthier loss development pattern than other general liability claims
in the environmental portfolio) as well as a more appropriate methodology for incorporating case reserving based
estimates of ultimate loss costs for complex claims involving environmental remediation and/or from policies with high
policy limits (greater than $5 million per policy). Notwithstanding the refined methodology and approach applied in
2012, considerable uncertainty remains over the ultimate loss cost for this class of business, especially for business
written in accident years 2003 and prior.
We strengthened our post 1986 Environmental reserves in 2011 by $413 million, partly due to large reserve
increases on individual claims. Of this amount, $382 million was included in the AIG Property Casualty Other
..................................................................................................................................................................................................................................
AIG 2012 Form 10-K94
I T E M 7 / R E S U L T S O F O P E R A T I O N S

.....................................................................................................................................................................................
reporting unit. Approximately 80 percent of the 2011 development was associated with accident years 2003 and
prior.
In addition to reserving actions, we have made significant changes to the ongoing environmental business included in
Commercial with the goal of ensuring that the current policies are being written to earn an appropriate risk adjusted
profit. Underwriting guidelines have been revised to no longer cover known or expected clean up costs, which were a
significant driver of historical claims, and a ‘‘new emerging contaminants’’ team has been formed within the dedicated
environmental engineering staff to track any new cleanup standards that may be set by federal or state regulators.
The percentage of long term policies (ten years or more) has decreased from a historical average of 6 percent to
1.5 percent by policy count. In addition, minimum retentions have been increased, and engineering reviews are
required for specific business segments (such as oil and gas, and landfills) that have traditionally generated higher
losses.
Primary Workers’ Compensation and General Liability in Commercial Risk, Specialty Workers’ Compensation and
Energy Business units
The Commercial Risk division writes casualty insurance accounts for businesses with revenues of less than
$700 million. The majority of the business is workers’ compensation. The Energy division writes casualty insurance
accounts (including workers’ compensation) in the mining, oil and gas and power generation sectors. The
Commercial Specialty Workers’ Compensation division writes small monoline guaranteed cost risks. Our Commercial
Specialty Workers’ Compensation business unit grew significantly in the early to mid 2000s but has reduced premium
writings by nearly 70 percent since 2007.
During 2012, we significantly intensified our claims management efforts for those primary workers’ compensation
claims which are managed by AIG. These efforts include consulting with various specialists, including clinical and
public health professionals and other advisors. We also continued to refine our actuarial methodologies for estimating
ultimate loss costs incorporating a more refined segmentation by state (California and New York were analyzed
separately) and a more refined approach for business subject to deductibles as well as business subject to premium
adjustments (loss-sensitive business). Based on these enhanced reviews we increased reserves by $46 million. We
also reviewed the General Liability (GL) loss experience of the primary casualty classes of business using a more
refined segmentation for business subject to a deductible as well as loss-sensitive business. Our review focused on
applying actuarial loss development analyses to those GL claims for which these techniques are appropriate. As a
result of this analysis, we determined that prior year reserves needed to be increased by $235 million for the primary
GL class of business in 2012 to reflect the worse than expected emergence of paid loss severities for both bodily
injury and property damage claims from the more recent accident years (2008 and subsequent).
The Commercial Risk, Commercial Specialty Workers’ Compensation and Energy divisions contributed $265 million,
$145 million and $115 million, respectively, of adverse development in calendar year 2011. The vast majority of this
adverse development emanates from primary workers’ compensation exposure, which was largely from accident year
2010. In 2011, losses for accident year 2010 continued to emerge at higher levels than anticipated at prior year end.
A key driver was the effect of high unemployment on the frequency of higher severity lost time claims. The poor
economic environment precluded some employers from offering ‘‘light duty’’ return-to-work alternatives that might
otherwise have mitigated lost time claims. At the same time, the increased use of pain management strategies has
led to increased medical claims. The increase in lost time frequency and the adverse effects of medical cost trends
resulted in higher loss ratios than anticipated at prior year end. For each of the three classes, our conclusion that the
worsening experience necessitated a strengthening of the reserves was confirmed by an independent third-party
actuarial review during 2011.
We recorded a total of $518 million of adverse loss development for Commercial Specialty Workers’ Compensation in
2010. The need to strengthen the reserves was confirmed by an independent third-party actuarial review during the
fourth quarter of 2010. Approximately 75 percent of the year-end 2010 reserve strengthening for this business
pertained to accident years 2007 through 2009. For similar reasons, the Commercial Risk division strengthened
workers’ compensation reserves in 2010.
For more information on our Loss Reserving Process, see Critical Accounting Estimates.
..................................................................................................................................................................................................................................
AIG 2012 Form 10-K 95
I T E M 7 / R E S U L T S O F O P E R A T I O N S

.....................................................................................................................................................................................
Asbestos and Environmental Reserves..............................................................................................................................................................................................
Third-Party Actuarial Review of Asbestos Loss Reserve Estimates
As part of our more in-depth comprehensive loss-reserve review in the fourth quarter of 2010, we conducted a series
of top-down and ground-up reserve analyses to determine the appropriate loss reserve estimate for our asbestos
exposures. To ensure the most comprehensive analysis possible, we engaged an independent third-party actuarial
firm to assist in assessing these exposures. The ground-up study conducted by this firm used a proprietary model to
calculate the loss exposure on an insured-by-insured basis. We believe that the accuracy of the reserve estimate is
greatly enhanced through the combination of the actuarial firm’s industry modeling techniques and industry
knowledge and our own specific account-level experience.
Annually, we consider a number of factors and recent experience in addition to the results of the top-down and
ground-up analyses performed for asbestos and environmental reserves. We considered the significant uncertainty
that remains as to our ultimate liability for asbestos and environmental claims, which is due to several factors:
• the long latency period between asbestos exposure and disease manifestation, leading to the potential for
involvement of multiple policy periods for individual claims;
• claims filed under the non-aggregate premises or operations section of general liability policies;
• the number of insureds seeking bankruptcy protection and the effect of prepackaged bankruptcies;
• diverging legal interpretations; and
• the difficulty in estimating the allocation of remediation cost among various parties with respect to environmental
claims.
As a result of the top-down and ground-up reserve analyses and the factors considered, asbestos reserves were
strengthened by $3.3 billion gross and $1.5 billion net in 2010.
In 2011, we completed a top-down report year projection as well as a market share projection of our indicated
asbestos and environmental loss reserves. These projections consisted of a series of tests performed separately for
asbestos and for environmental exposures.
For asbestos, these tests project the losses expected to be reported through 2027. This projection was based on the
actual losses reported through 2011 and the expected future loss emergence for these claims. Three scenarios were
tested, with a series of assumptions ranging from more optimistic to more conservative.
For environmental claims, a comparable series of frequency/severity tests were produced. We updated the top-down
report year projections in 2012. In this updated projection, environmental claims from future report years (i.e., IBNR)
are projected out ten years, through the year 2022.
As a result of the studies, we determined that no additional strengthening was required for asbestos and
environmental in 2011.
After we carefully considered the recent experience compared to the results of the 2010 ground-up analysis, as well
as all of the above factors, no adjustment to gross and net asbestos reserves was recognized in 2012. Additionally
in 2012, a moderate amount of incurred loss pertaining to the asbestos loss reserve discount is reflected in the table
below and is related to the reserves not subject to the NICO reinsurance agreement.
Upon completion of the environmental top-down analysis performed in the fourth quarter of 2012, we concluded that
the $75 million net reserve strengthening recognized in the first half of 2012 was adequate.
In addition to the U.S. asbestos and environmental reserve amounts shown in the tables below, AIG Property
Casualty also has asbestos reserves relating to foreign risks written by non-U.S. entities of $140 million gross and
$116 million net as of December 31, 2012. The asbestos reserves relating to non-U.S. risks written by non-U.S.
entities were $233 million gross and $165 million net as of December 31, 2011.
..................................................................................................................................................................................................................................
AIG 2012 Form 10-K96
I T E M 7 / R E S U L T S O F O P E R A T I O N S

.....................................................................................................................................................................................
The following table provides a summary of reserve activity, including estimates for applicable IBNR, relating
to asbestos and environmental claims:
Asbestos:
Liability for unpaid claims and claims adjustment expense at beginning of
year $ 5,526 $ 2,223 $ 3,236 $ 1,151
Change in net loss reserves due to retroactive reinsurance:
Paid losses recoverable under retroactive reinsurance contracts – 111 – –
Re-estimation of amounts recoverable under retroactive reinsurance
contracts(a) – (1,814) – –
Change in net loss reserves due to retroactive reinsurance – (1,703) – –
Dispositions – – (17) (8)
Loss and loss expenses incurred:
Prior years, undiscounted 2 2 3,326 1,479
Change in discount 190 74 (386) (162)
Losses and loss expenses incurred(b) 192 76 2,940 1,317
Losses and loss expenses paid(b) (492) (236) (633) (237)
Other changes – 177 – –
Liability for unpaid claims and claims adjustment expense at end of year $ 5,226 $ 537 $ 5,526 $ 2,223
Environmental:
Liability for unpaid claims and claims adjustment expense at beginning of
year $ 240 $ 127 $ 338 $ 159
Dispositions – – (27) (10)
Losses and loss expenses incurred 33 27 23 24
Losses and loss expenses paid (69) (35) (94) (46)
Liability for unpaid claims and claims adjustment expense at end of year $ 204 $ 119 $ 240 $ 127
Combined:
Liability for unpaid claims and claims adjustment expense at beginning of
year $ 5,766 $ 2,350 $ 3,574 $ 1,310
Change in net loss reserves due to retroactive reinsurance:
Paid losses recoverable under retroactive reinsurance contracts – 111 – –
Re-estimation of amount recoverable under retroactive reinsurance
contracts – (1,814) – –
Change in net loss reserves due to retroactive reinsurance – (1,703) – –
Dispositions – – (44) (18)
Losses and loss expenses incurred:
Undiscounted 35 29 3,349 1,503
Change in discount 190 74 (386) (162)
Losses and loss expenses incurred 225 103 2,963 1,341
Losses and loss expenses paid (561) (271) (727) (283)
Other changes – 177 – –
Liability for unpaid claims and claims adjustment expense at end of year $ 5,430 $ 656 $ 5,766 $ 2,350
(a) Re-estimation of amounts recoverable under retroactive reinsurance contracts includes effect of changes in reserve estimates and changes in
discount. Additionally, the 2011 Net amount includes the effect on net loss reserves of the initial cession to NICO.
(b) These amounts exclude benefit from retroactive reinsurance.
Transfer of Domestic Asbestos Liabilities
On June 17, 2011, we completed a transaction under which the bulk of AIG Property Casualty’s net domestic
asbestos liabilities were transferred to NICO, a subsidiary of Berkshire Hathaway, Inc. This was part of our ongoing
strategy to reduce our overall loss reserve development risk. This transaction covers potentially volatile U.S.-related
asbestos exposures. It does not, however, cover asbestos accounts that we believe have already been reserved to
their limit of liability or certain other ancillary asbestos exposure assumed by AIG Property Casualty subsidiaries.
..................................................................................................................................................................................................................................
AIG 2012 Form 10-K 97
2012 2011 2010As of or for the Years Ended December 31,
(in millions) Gross Net Gross Net Gross Net
$ 5,226 $ 537
– 111
– (21)
– 90
(10) (10)
1 1
83 37
84 38
(404) (228)
– –
$ 4,896 $ 427
$ 204 $ 119
(1) (1)
150 75
(44) (30)
$ 309 $ 163
$ 5,430 $ 656
– 111
– (21)
– 90
(11) (11)
151 76
83 37
234 113
(448) (258)
– –
$ 5,205 $ 590
I T E M 7 / R E S U L T S O F O P E R A T I O N S

.....................................................................................................................................................................................
Upon the closing of this transaction, but effective as of January 1, 2011, we ceded the bulk of AIG Property
Casualty’s net domestic asbestos liabilities to NICO under a retroactive reinsurance agreement with an aggregate
limit of $3.5 billion. Within this aggregate limit, NICO assumed collection risk for existing third-party reinsurance
recoverable associated with these liabilities. AIG Property Casualty paid NICO approximately $1.67 billion as
consideration for this cession and NICO assumed approximately $1.82 billion of net U.S. asbestos liabilities. As a
result of this transaction, AIG Property Casualty recorded a deferred gain of $150 million in the second quarter of
2011, which is being amortized into income over the settlement period of the underlying claims.
The following table presents the estimate of the gross and net IBNR included in the Liability for unpaid
claims and claims adjustment expense, relating to asbestos and environmental claims:
Asbestos $ 3,685 $ 239 $ 4,520 $ 1,964
Environmental 57 28 93 38
Combined $ 3,742 $ 267 $ 4,613 $ 2,002
* Net IBNR includes the reduction due to the NICO reinsurance transaction of $1,310 million and $1,414 million as of December 31, 2012 and
2011, respectively. A significant part of the reduction in IBNR in 2012 is due to the reclassification of estimated liabilities on a retained account from
IBNR to case reserves.
The following table presents a summary of asbestos and environmental claims count activity:
Claims at beginning
of year 4,933 4,087 9,020 5,417 5,994 11,411
Claims during year:
Opened 141 207 348 502 354 856
Settled (183) (83) (266) (247) (125) (372)
Dismissed or
otherwise
resolved(a) (289) (429) (718) (739) (2,136) (2,875)
Other(b) 841 – 841 – – –
Claims at end of
year 5,443 3,782 9,225 4,933 4,087 9,020
(a) The number of environmental claims dismissed or otherwise resolved, increased substantially during 2012 as a result of AIG Property
Casualty’s determination that certain methyl tertiary-butyl ether (MTBE) claims presented no further potential for exposure since these underlying
claims were resolved through dismissal, settlement, or trial for all of the accounts involved. All of these accounts were fully reserved at the account
level and included adequate reserves for those underlying individual claims that contributed to the actual losses. These individual claim closings,
therefore, had no impact on AIG Property Casualty’s environmental reserves.
(b) Represents an administrative change to the method of determining the number of open claims, which had no effect on carried reserves.
Survival Ratios – Asbestos and Environmental
The following table presents AIG’s survival ratios for asbestos and environmental claims at December 31, 2012, 2011
and 2010. The survival ratio is derived by dividing the current carried loss reserve by the average payments for the
three most recent calendar years for these claims. Therefore, the survival ratio is a simplistic measure estimating the
number of years it would take before the current ending loss reserves for these claims would be paid off using recent
year average payments.
Many factors, such as aggressive settlement procedures, mix of business and level of coverage provided, have a
significant effect on the amount of asbestos and environmental reserves and payments and the resulting survival
ratio. Additionally, we primarily base our determination of these reserves based on ground-up and top-down
analyses, and not on survival ratios.
..................................................................................................................................................................................................................................
AIG 2012 Form 10-K98
2012 2011 2010December 31,
(in millions) Gross Net* Gross Net* Gross Net
$ 3,193 $ 37
75 35
$ 3,268 $ 72
2012 2011 2010As of or for the Years
Ended December 31, Asbestos Environmental Combined Asbestos Environmental Combined Asbestos Environmental Combined
5,443 3,782 9,225
226 222 448
(254) (179) (433)
(185) (2,211) (2,396)
– – –
5,230 1,614 6,844
I T E M 7 / R E S U L T S O F O P E R A T I O N S

.....................................................................................................................................................................................
The following table presents survival ratios for asbestos and environmental claims, separately and
combined, which were based upon a three-year average payment:
Survival ratios:
Asbestos 9.1 10.3 8.6 9.2
Environmental 3.0 3.1 3.7 3.2
Combined 8.4 9.3 8.1 8.4
* Survival ratios are calculated consistent with the basis on historical reserve excluding the effects of the NICO reinsurance transaction.
AIG Life and Retirement
AIG Life and Retirement Highlights
The results of AIG Life and Retirement for 2012 and 2011 reflected the following:
• Disciplined spread management, primarily through the effect of reinvestment during 2011 of significant amounts of
cash and short term investments and crediting rate changes, resulted in improvements in base net investment
spreads for 2012. Private equity and hedge fund investment income increased $112 million in 2012 compared to
2011.
• Investment income from the ML II investment prior to its liquidation and distribution in March 2012 increased
$200 million in 2012 compared to 2011.
• More favorable separate account performance driven in large part by equity markets had a positive effect on
policyholder benefits and DAC amortization expenses for 2012.
• Reserve increases related to enhanced death claim practices in connection with the resolution of multi-state
examinations were lower in 2012 compared to 2011.
• Higher net realized capital gains from the sale of investments were reflected in 2012 in conjunction with a program
to utilize capital loss tax carryforwards. The sales of securities in unrealized gain positions that support certain
payout annuity products, and subsequent reinvestment of the proceeds at generally lower yields, triggered loss
recognition accruals in 2012.
AIG Life and Retirement Operations
Commencing in the third quarter of 2012, the SunAmerica segment was renamed AIG Life and Retirement, although
certain existing brands will continue to be used in the marketplace.
AIG Life and Retirement presents its business in two operating segments:
• Life Insurance, which focuses on mortality and morbidity-based protection products, and
• Retirement Services, which focuses on investment, retirement savings and income solution products.
..................................................................................................................................................................................................................................
AIG 2012 Form 10-K 99
Years Ended December 31,2012 2011 2010
Gross Net* Gross Net* Gross Net
9.6 8.7
4.5 4.4
9.0 8.1
I T E M 7 / R E S U L T S O F O P E R A T I O N S

.....................................................................................................................................................................................
AIG Life and Retirement Results..............................................................................................................................................................................................
The following table presents AIG Life and Retirement results:
Life Insurance:
Revenue:
Premiums $ 2,513 $ 2,520 (3)% –%
Policy fees 1,478 1,576 (1) (6)
Net investment income 3,925 4,313 4 (9)
Other income 3 – (67) NM
Operating expenses:
Policyholder benefits and claims incurred 4,510 4,277 – 5
Interest credited to policyholder account balances 851 843 (3) 1
Amortization of deferred acquisition costs 389 596 20 (35)
Other acquisition and insurance expenses 1,126 1,140 (6) (1)
Operating income 1,043 1,553 9 (33)
Net realized capital gains (losses) 363 (75) 305 NM
Legal settlements – – NM NM
Change in benefit reserves and DAC, VOBA and SIA related to net realized
capital gains (losses) (19) (37) NM 49
Pre-tax income $ 1,387 $ 1,441 42% (4)%
Retirement Services:
Revenue:
Policy fees $ 1,227 $ 1,134 8% 8%
Net investment income 5,957 6,455 11 (8)
Other income 206 – (96) NM
Operating expenses:
Policyholder benefits and claims incurred 104 (1) (79) NM
Interest credited to policyholder account balances 3,616 3,644 (2) (1)
Amortization of deferred acquisition costs 477 375 (28) 27
Other acquisition and insurance expenses 959 1,068 6 (10)
Operating income 2,234 2,503 35 (11)
Legal settlements – – NM NM
Changes in fair value of fixed maturity securities designated to hedge living
benefit liabilities – – NM NM
Net realized capital losses (357) (1,176) (136) 70
Change in benefit reserves and DAC, VOBA and SIA related to net realized
capital losses (308) (67) (68) (360)
Pre-tax income $ 1,569 $ 1,260 16% 25%
Total AIG Life and Retirement:
Revenue:
Premiums $ 2,513 $ 2,520 (3)% –%
Policy fees 2,705 2,710 3 –
Net investment income 9,882 10,768 8 (8)
Other income 209 – (96) NM
Operating expenses:
Policyholder benefits and claims incurred 4,614 4,276 (2) 8
Interest credited to policyholder account balances 4,467 4,487 (2) –
Amortization of deferred acquisition costs 866 971 (6) (11)
Other acquisition and insurance expenses 2,085 2,208 – (6)
Operating income 3,277 4,056 27 (19)
Legal settlements – – NM NM
Changes in fair value of fixed maturity securities designated to hedge living
benefit liabilities – – NM NM
Net realized capital gains (losses) 6 (1,251) NM NM
Change in benefit reserves and DAC, VOBA and SIA related to net realized
capital gains (losses) (327) (104) (267) (214)
Pre-tax income $ 2,956 $ 2,701 28% 9%
..................................................................................................................................................................................................................................
AIG 2012 Form 10-K100
Percentage ChangeYears Ended December 31,
(in millions) 2012 2011 2010 2012 vs. 2011 2011 vs. 2010
$ 2,428
1,465
4,101
1
4,511
822
467
1,059
1,136
1,471
43
(684)
$ 1,966
$ 1,326
6,617
8
22
3,540
345
1,020
3,024
111
37
(841)
(517)
$ 1,814
$ 2,428
2,791
10,718
9
4,533
4,362
812
2,079
4,160
154
37
630
(1,201)
$ 3,780
I T E M 7 / R E S U L T S O F O P E R A T I O N S

.....................................................................................................................................................................................
2012 and 2011 Comparison
AIG Life and Retirement Operating Income..............................................................................................................................................................................................
Operating income increased in 2012 principally due to our efforts to actively manage spread income. Results
benefitted from higher net investment income, lower interest credited, lower reserve charges for death claims and the
impact of favorable separate account performance on policyholder benefit expenses and DAC amortization. These
items were partially offset by significant proceeds from legal settlements in 2011, higher mortality costs and a charge
to increase GIC reserves.
Premiums decreased slightly in 2012 due to lower group benefit premiums partially offset by higher term insurance
premiums.
Policy fees increased in 2012 as a result of growth in variable annuity assets under management from higher net
flows and separate account performance, driven in large part by higher equity markets.
Net investment income increased in 2012 reflecting higher base yields of 9 basis points due to the reinvestment of
significant amounts of cash and short-term investments during 2011, opportunistic investments in structured
securities, fair value gains on MLII and other structured securities, a fair value gain of approximately $57 million on
the investment in PICC Group, lower impairment charges on investments in leased commercial aircraft and higher
returns on alternative investments. The increase in net investment income combined with lower interest credited
resulted in improved net investment spreads in 2012 compared to 2011.
Other income decreased due to legal settlement proceeds of $226 million in 2011 to resolve a litigation matter.
Policyholder benefits and claims incurred decreased as lower reserve charges for death claims not submitted to AIG
in the normal course of business and the impact of favorable separate account performance more than offset higher
mortality costs for individual life insurance.
Interest credited decreased in 2012 due to active crediting rate management actions that included lowering renewal
credited rates, maintaining discipline on new business pricing including re-filing products to lower minimum rate
guarantees.
Amortization of deferred acquisition costs decreased in 2012 primarily as a result of updated assumptions related to
fixed annuity surrender rates and the impact of favorable separate account performance.
Other acquisition and insurance expenses were essentially flat with 2011.
Life Insurance Operating Income
Life Insurance operating income increased in 2012 due to higher net investment income and lower reserves for death
claims, principally related to the effect of multi-state unclaimed property examinations, that have not been submitted
to AIG in the normal course of business. These items were partially offset by higher mortality costs, DAC
amortization and loss recognition reserves related to a legacy block of long-term care insurance.
Premiums decreased slightly in 2012 due to lower group benefit premiums partially offset by higher term insurance
premiums.
Policy fees were essentially flat with 2011.
Net investment income increased in 2012, reflecting the reinvestment of significant amounts of cash and short-term
investments during 2011, opportunistic investments in structured securities, fair value gains on MLII in 2012 of
$76 million, a fair value gain of $28 million on the investment in PICC made in 2012, lower impairment charges on
investments in leased commercial aircraft and higher returns on alternative investments.
Policyholder benefits and claims incurred increased in 2012 reflecting higher mortality costs and loss recognition
reserves, partially offset by lower charges to increase reserves for death claims as described below:
• Mortality costs related to life insurance increased in 2012, although overall mortality results remain within pricing
expectations.
..................................................................................................................................................................................................................................
AIG 2012 Form 10-K 101
I T E M 7 / R E S U L T S O F O P E R A T I O N S

.....................................................................................................................................................................................
• Certain long-duration products, including traditional life insurance, accident and health products, such as long-term
care insurance and payout annuities, may require increases in reserves if changes in estimates of future
investment returns result in projected future losses. Long term care products may also require additional reserves if
future expected premium increases are not sufficient to cover future benefit cost increases not provided for in the
current reserves. For these long duration traditional products, the assumptions used to calculate benefit liabilities
and DAC are ‘‘locked in’’ at policy issuance. These assumptions are based on our estimates of mortality, morbidity,
persistency, maintenance expenses, investment returns and for long-term care, future premium increases. If
observed changes in actual experience or estimates result in projected future losses under loss recognition testing,
DAC is adjusted and additional policyholder benefit liabilities may be recorded through a charge to policyholder
benefit expense. In the fourth quarter of 2012, loss recognition reserves of $61 million were recorded for a legacy
block of long-term care insurance issued prior to 2002.
• During 2012 AIG Life and Retirement resolved multi-state examinations relating to the handling of unclaimed
property and the use of the Social Security Death Master File (SSDMF) to identify death claims that have not been
submitted to us in the normal course of business. The final settlement of these examinations was announced on
October 22, 2012. AIG Life and Retirement is now taking enhanced measures to, among other things, routinely
match policyholder records with the SSDMF to determine if its insured parties, annuitants, or retained account
holders have died and locate beneficiaries when a claim is payable. Charges related to the resolution of the multi-
state examinations and use of the SSDMF were approximately $57 million in 2012 and $202 million in 2011.
Amortization of deferred acquisition costs increased in 2012 as a result of updated assumptions for universal life
products and certain blocks of fixed annuities included in the Life Insurance operating segment. The updated
assumptions increased amortization by $78 million and primarily reflected the impact of spread compression in the
current low interest rate environment.
Other acquisition and insurance expenses decreased in 2012 primarily due to the sharing of group benefit costs
related to our strategic partnership with AIG Property Casualty.
Retirement Services Operating Income
Retirement Services operating income increased in 2012 due to improved net investment spreads (higher net
investment income and lower interest credited), the impact of favorable separate account performance on DAC
amortization and policyholder benefit expenses and lower DAC amortization due to updated assumptions for fixed
annuity surrenders. These items were partially offset by significant proceeds from legal settlements in 2011 and an
increase in GIC reserves in 2012.
Policy fees increased in 2012 as a result of growth in variable annuity assets under management due to higher net
flows and separate account performance driven in large part by higher equity markets.
Net investment income increased in 2012, reflecting higher base yields due to the reinvestment of significant
amounts of cash and short-term investments during 2011, opportunistic investments in structured securities, fair value
gains on MLII in 2012 of $170 million, a fair value gain of $28 million on the investment in PICC made in 2012, lower
impairment charges on investments in leased commercial aircraft and higher returns on alternative investments.
Other income decreased due to the previously discussed legal settlement proceeds of $226 million in 2011 to resolve
a litigation matter as discussed above.
Policyholder benefits and claims incurred decreased in 2012 due to the impact of higher separate account returns for
certain guaranteed benefit features of variable annuities.
Interest credited to policyholder account balances decreased in 2012 as a result of ongoing actions to actively
manage interest crediting rates on new and renewal business including lower renewal credited rates, discipline on
new business pricing and re-filing products to reduce minimum rate guarantees. As a result of a comprehensive
review of reserves for the GIC portfolio, AIG Life and Retirement recorded an increase to such reserves through
interest credited of $110 million for 2012, which partially offset the impact of crediting rate actions.
Amortization of deferred acquisition costs was lower in 2012 as a result of the favorable impact of updated
assumptions for lower fixed annuity surrenders and the impact of higher separate account returns described above.
For investment-type annuity products, policy acquisition and issuance costs are deferred and amortized, with interest,
based on the estimated gross profits expected to be realized over the lives of the contracts. Estimated gross profits
..................................................................................................................................................................................................................................
AIG 2012 Form 10-K102
I T E M 7 / R E S U L T S O F O P E R A T I O N S

.....................................................................................................................................................................................
include investment spreads, net realized investment gains and losses, fees, surrender charges, expenses and
mortality gains and losses. Emerging actual gross profits are used to true up the amortization of DAC, VOBA and
SIA each quarter. In addition, future assumptions are reviewed to determine whether they should be modified. If so,
the DAC, VOBA and SIA assets may be recalculated and adjusted to reflect the updated assumptions. AIG Life and
Retirement completed its comprehensive annual review of DAC assumptions in the fourth quarter of 2012 and
adjusted the assumption for future fixed annuity surrender rates to be more consistent with recent experience that is
expected to continue as long as interest rates remain relatively low.
Other acquisition and insurance expenses increased in 2012 due to higher marketing and distribution expenses
associated with growth initiatives for variable annuities and group retirement products.
2011 and 2010 Comparison
AIG Life and Retirement Operating Income..............................................................................................................................................................................................
Operating income decreased in 2011 due to lower net investment income, higher DAC amortization and higher
policyholder benefit expense in its variable annuity business due to separate account performance, and an increase
in death claim reserves.
Policy fees were essentially flat from 2010.
Net investment income decreased in 2011 compared to 2010 reflecting lower base yields of 12 basis points as
investment purchases in late 2010 and 2011 were made at yields lower than the weighted average yields of the
existing base portfolio. Net investment income also decreased due to a $471 million decrease in fair value gains on
ML II, $196 million lower call and tender income, $163 million of impairment charges on investments in leased
commercial aircraft and a $121 million decrease in private equity and hedge funds income. The lower yields were
partially offset by an increase in income from the reinvestment of significant amounts of cash and short term
investments during 2011.
Other income increased due to the previously discussed legal settlement proceeds of $226 million in 2011.
Policyholder benefits and claims incurred increased as a result of reserve charges for death claims not submitted to
us in the normal course of business and higher reserves for guaranteed death benefits in our variable annuity
products as a result of less favorable separate account performance in 2011 as compared to 2010.
Other acquisition and insurance expenses declined due to legal expense accruals and state guaranty fund
assessments which were higher in 2010, as well as a reduction in the cost of letters of credit related to reinsurance.
Life Insurance Operating Income
Life Insurance operating income decreased in 2011 due to lower net investment income and an increase in death
claim reserves, partially offset by lower DAC amortization due to updating actuarial assumptions in 2010 principally
related to mortality and surrender rates.
Policyholder fees declined primarily as a result of updating certain assumptions in 2010 related to universal life and
deferred annuity business, which resulted in a $58 million increase in fee income.
Net investment income decreased in 2011 compared to 2010 reflecting lower base yields as investment purchases in
late 2010 and 2011 were made at yields lower than the weighted average yields of the existing base portfolio. Net
investment income also decreased due to a $149 million decrease in fair value gains on ML II, $126 million lower call
and tender income and $50 million of impairment charges on investments in leased commercial aircraft. The lower
yields were partially offset by an increase in income from the reinvestment of significant amounts of cash and short
term investments during 2011.
Policyholder benefits and claims incurred increased in 2011 reflecting an increase in reserves for death claims. AIG
Life and Retirement recorded an increase of approximately $202 million in the estimated reserves for incurred but not
reported death claims in 2011 in conjunction with the use of the Social Security Death Master File (SSDMF) to
identify potential claims not yet filed with its life insurance companies.
..................................................................................................................................................................................................................................
AIG 2012 Form 10-K 103
I T E M 7 / R E S U L T S O F O P E R A T I O N S

.....................................................................................................................................................................................
Amortization of deferred acquisition costs was lower in 2011 as a result of updating mortality and surrender rate
assumptions on universal life and deferred annuity business in 2010, which resulted in an $86 million increase in
DAC amortization in 2010.
Other acquisition and insurance expenses were essentially flat from 2010.
Retirement Services Operating Income
Retirement services operating income decreased in 2011 due to lower net investment income, higher DAC
amortization and higher policyholder benefit expense in its variable annuity business from equity market conditions,
partially offset by higher income from legal settlements.
Net investment income decreased in 2011 compared to 2010 reflecting lower base yields as investment purchases in
late 2010 and 2011. Net investment income also decreased due to a $322 million decrease in fair value gains on ML
II, $70 million lower call and tender income, $113 million of impairment charges on investments in leased commercial
aircraft and a $127 million decrease in private equity and hedge fund income. The lower yields were partially offset
by an increase in income from the reinvestment of significant amounts of cash and short term investments during
2011.
Other income increased due to the previously discussed legal settlement proceeds of $226 million in 2011 to resolve
a litigation matter as discussed above.
Policyholder benefits and claims incurred increased in 2011 due to the impact of lower separate account
performance in 2011 compared to 2010.
Other acquisition and insurance expenses declined due to legal expenses and state guaranty fund assessments
which were higher in 2010.
Legal Settlements
In December of 2012, we recorded litigation settlement income from settlements with three financial institutions who
participated in the creation, offering and sale of RMBS as to which AIG and its subsidiaries suffered losses either
directly on their own account or in connection with their participation in AIG’s securities lending program.
Changes in Fair Value of Fixed Maturity Securities Designated to Hedge Living Benefit Liabilities
AIG Life and Retirement has a dynamic hedging program designed to manage economic risk exposure associated
with changes in equity markets, interest rates and volatilities related to embedded derivative liabilities contained in
guaranteed benefit features of variable annuities. We substantially hedge our exposure to equity markets. However,
due to regulatory capital considerations, a portion of our interest rate exposure is unhedged. In 2012, we began
purchasing U.S. Treasury bonds as a capital-efficient strategy to reduce our interest rate risk exposure over time. As
a result of decreases in interest rates on U.S. Treasury securities during 2012, the fair value of the U.S. Treasury
securities used for hedging, net of financing costs, increased by $37 million. This was partially offset by embedded
derivative losses related to the decline in interest rates, which are reported in net realized gains (losses).
Net Realized Capital Gains (Losses)
Net realized capital gains increased by $624 million in 2012 as compared to 2011 due to higher gains from the sale
of investments in conjunction with a program to utilize capital loss tax carryforwards and lower other-than-temporary
impairments. The higher gains were partially offset by $557 million higher fair value losses on variable annuity
embedded derivatives, which were primarily due to declining credit spreads and declines in long-term interest rates.
AIG Life and Retirement reported net realized capital gains in 2011 compared to net realized capital losses in 2010.
This was mainly due to a $981 million decline in other-than-temporary impairments, a decline in fair value losses on
derivatives primarily used to hedge the effect of interest rate and foreign exchange movements on GIC reserves, and
declines in the allowance for mortgage loans. These improvements were partially offset by a $465 million increase in
fair value losses on variable annuity embedded derivatives which were primarily driven by declines in long-term
interest rates.
..................................................................................................................................................................................................................................
AIG 2012 Form 10-K104
I T E M 7 / R E S U L T S O F O P E R A T I O N S

.....................................................................................................................................................................................
Change in Benefit Reserves and DAC, VOBA and SIA Related to Net Realized Capital Gains (Losses)
In conjunction with a program to utilize capital loss tax carryforwards, we sold approximately $19.5 billion of
investments in 2012. These and other sales with subsequent reinvestment at lower yields triggered loss recognition
on certain long-term payout annuity contracts in the amount of $1.2 billion, which effectively transferred shadow loss
recognition from unrealized (AOCI) to actual loss recognition (benefit expense) and, to a much lesser extent,
transferred shadow DAC (AOCI) to DAC amortization expense in 2012. Assumptions related to investment yields,
mortality experience and expenses will be reviewed periodically and updated as appropriate, which may result in
additional loss recognition reserves. In addition, due to the reinvestment of the assets at lower yields, earnings
related to this payout annuity block of business are expected to decline beginning in 2013.
Premiums
Premiums represent amounts received on traditional life insurance policies, group benefit policies and deposits on
life-contingent payout annuities. Premiums, deposits and other considerations is a non-GAAP measure that includes
life insurance premiums and deposits on annuity contracts and mutual funds.
The following table presents a reconciliation of premiums, deposits and other considerations to premiums:
Premiums, deposits and other considerations $ 24,392 $ 19,505
Deposits (21,338) (16,405)
Other (541) (580)
Premiums $ 2,513 $ 2,520
Sales and Deposits
The following tables summarize AIG Life and Retirement premiums, deposits and other considerations by
product*:
Premiums, deposits and other considerations
Individual fixed annuity deposits $ 6,606 $ 4,410 (77)% 50%
Group retirement product deposits 7,312 6,309 (4) 16
Life insurance 5,267 5,529 (3) (5)
Individual variable annuity deposits 3,212 2,072 42 55
Retail mutual funds 1,925 1,101 41 75
Individual annuities runoff 70 84 (17) (17)
Total premiums, deposits and other
considerations $ 24,392 $ 19,505 (14)% 25%
Life Insurance Sales
Retail – Independent $ 144 $ 123 (4)% 17%
Retail – Affiliated (Career and AIG Direct) 109 98 1 11
Total Retail 253 221 (2) 14
Institutional – Independent 25 32 4 (22)
Total life insurance sales $ 278 $ 253 (1)% 10%
* Life insurance sales include periodic premiums from new business expected to be collected over a one-year period and 10 percent of single
premiums and unscheduled deposits from new and existing policyholders. Annuity sales represent deposits from new and existing customers.
..................................................................................................................................................................................................................................
AIG 2012 Form 10-K 105
Years Ended December 31,
(in millions) 2012 2011 2010
$ 20,994
(17,934)
(632)
$ 2,428
Percentage ChangeYears Ended December 31,
(in millions) 2012 2011 2010 2012 vs. 2011 2011 vs. 2010
$ 1,495
7,028
5,129
4,561
2,723
58
$ 20,994
$ 138
110
248
26
$ 274
I T E M 7 / R E S U L T S O F O P E R A T I O N S

15FEB201317173483
.....................................................................................................................................................................................
TOTAL PREMIUMS, DEPOSITS AND OTHER CONSIDERATIONS BY PRODUCT LINE
(in millions)
2012 2011 2010
23%
32%
28%
11%
6%
27%
30%
22%
13%
8%
7%
34%
24%
22%
13% RETAIL MUTUAL FUNDS
INDIVIDUAL VARIABLE ANNUITYDEPOSITS
GROUP RETIREMENT PRODUCTDEPOSITS
LIFE INSURANCE
INDIVIDUAL FIXED ANNUITYDEPOSITS
Total premiums, deposits and other considerations decreased in 2012 as substantial decreases in individual fixed
annuities were only partially offset by significant increases in individual variable annuities and retail mutual funds.
2012 and 2011 Comparison
Individual fixed annuity deposits declined due to the low interest rate environment as consumers are reluctant to
purchase these products at the relatively low crediting rates currently offered. Group retirement product deposits
(which include deposits into mutual funds and fixed options within variable annuities sold in group retirement
markets) decreased modestly due to slightly lower levels of individual rollover deposits and periodic deposits in 2012,
partially offset by higher mutual fund deposits. The low interest rate environment has affected group retirement
deposits, resulting in lower levels of deposits into fixed options. Individual variable annuity deposits increased due to
innovative product enhancements and expanded distribution as well as a more favorable competitive environment.
Premiums from life insurance products increased in 2012, but were more than offset by declines in deferred annuities
sold through life insurance distribution channels. Retail mutual fund sales growth was principally driven by
SunAmerica Asset Management Corp.’s Focused Dividend Strategy product offering which continues to be a top
long-term performer within its respective peer group.
AIG Life and Retirement’s total life sales decreased 1 percent during 2012 compared to 2011. Overall retail universal
life sales decreased 1 percent with sales of indexed products growing while sales of universal life products sensitive
to low interest rates declined. Retail term insurance sales increased 1 percent in 2012 compared to 2011 because
we continued our disciplined focus related to new business pricing and underwriting. Institutional life sales increased
4 percent in 2012 compared to 2011 from growth in single premium private placement universal life deposits.
2011 and 2010 Comparison
Group retirement deposits increased primarily due to higher levels of individual rollover deposits in 2011. Individual
fixed annuity deposits increased as certain bank distributors negotiated a lower commission in exchange for a higher
rate offered to policyholders which made our individual fixed annuity products more attractive. However, fixed annuity
deposits declined in the latter part of 2011 from the first six months of 2011 due to significant declines in interest
rates. Variable annuity sales increased due to reinstatements of relationships at a number of key broker-dealers, and
increased wholesaler productivity. Deposits from life insurance products increased in 2011, but were more than offset
by declines in deferred annuities sold through life insurance distribution channels and a large private placement
variable annuity sale in 2010. Retail mutual fund annual sales growth was driven by SunAmerica Asset Management
Corp.’s Specialty Series product offerings (Alternative Strategies and Global Trends) and the Focused Dividend
Strategy Portfolio.
AIG Life and Retirement grew new sales of mortality-based life insurance products during 2011 by strengthening the
core retail independent distribution channel and continuing to focus on career agent and direct-to-consumer
distribution. Retail life sales increased 17 percent during 2011 as we continued to re-engage independent distribution
channels. Affiliated distribution channels grew 11 percent in 2011 as a result of an enhanced product suite appealing
..................................................................................................................................................................................................................................
AIG 2012 Form 10-K106
I T E M 7 / R E S U L T S O F O P E R A T I O N S

.....................................................................................................................................................................................
to middle market consumers. AIG Direct, our direct-to-consumer platform, has proven highly effective for thedistribution of term life and A&H products. The decline in institutional sales during 2011 reflected several largevariable universal life sales during 2010.
Retirement Services Net Flows
The following table presents the account value rollforward for Retirement Services:
Group retirement products
Balance, beginning of year $ 68,365 $ 63,419Deposits – annuities 5,652 4,937Deposits – mutual funds 1,660 1,372
Total deposits 7,312 6,309Surrenders and other withdrawals (5,853) (6,647)Death benefits (371) (317)
Net inflows (outflows) 1,088 (655)Change in fair value of underlying investments, interest credited, net of fees 457 5,601Effect of unrealized gains (losses) (shadow loss) 15 –
Balance, end of year $ 69,925 $ 68,365
Individual fixed annuities
Balance, beginning of year $ 48,489 $ 47,202Deposits 6,606 4,410Surrenders and other withdrawals (3,456) (3,520)Death benefits (1,570) (1,479)
Net inflows (outflows) 1,580 (589)Change in fair value of underlying investments, interest credited, net of fees 1,828 1,876Other – –Effect of unrealized gains (losses) (shadow loss) 379 –
Balance, end of year $ 52,276 $ 48,489
Individual variable annuitiesBalance, beginning of year $ 25,581 $ 24,637
Deposits 3,212 2,072Surrenders and other withdrawals (2,982) (2,725)Death benefits (452) (437)
Net inflows (outflows) (222) (1,090)Change in fair value of underlying investments, interest credited, net of fees (463) 2,034
Balance, end of year $ 24,896 $ 25,581
Retail mutual funds
Balance, beginning of year $ 5,975 $ 5,879Deposits 1,925 1,101Redemptions (1,447) (1,252)
Net inflows (outflows) 478 (151)Change in fair value of underlying investments, interest credited, net of fees (232) 247
Balance, end of year $ 6,221 $ 5,975
Total Retirement ServicesBalance, beginning of year $ 148,410 $ 141,137
Deposits 19,055 13,892Surrenders, redemptions and other withdrawals (13,738) (14,144)Death benefits (2,393) (2,233)
Net inflows (outflows) 2,924 (2,485)Change in fair value of underlying investments, interest credited, net of fees 1,590 9,758Other – –Effect of unrealized gains (losses) (shadow loss) 394 –
Balance, end of year, excluding runoff 153,318 148,410Individual annuities runoff 4,299 4,430GIC runoff 6,706 8,486
Balance, end of year $ 164,323 $ 161,326
General and separate account reserves and mutual fundsGeneral account reserve $ 102,580 $ 97,515Separate account reserve 46,006 48,804
Total general and separate account reserves 148,586 146,319Group retirement mutual funds 9,516 9,032Retail mutual funds 6,221 5,975
Total reserves and mutual funds $ 164,323 $ 161,326
..................................................................................................................................................................................................................................
AIG 2012 Form 10-K 107
Years Ended December 31,
(in millions) 2012 2011 2010
$ 69,9255,083
1,945
7,028
(6,325)(401)
302
6,087178
$ 76,492
$ 52,2761,495
(3,465)(1,632)
(3,602)1,719
479
(141)
$ 50,731
$ 24,896
4,561(2,727)
(447)
1,387
2,830
$ 29,113
$ 6,2212,723
(1,705)
1,018
(69)
$ 7,170
$ 153,318
15,807(14,222)
(2,480)
(895)10,567
47937
163,5064,151
6,099
$ 173,756
$ 102,814
51,970
154,78411,802
7,170
$ 173,756
I T E M 7 / R E S U L T S O F O P E R A T I O N S

.....................................................................................................................................................................................
2012 and 2011 Comparison
Overall, net flows were negative in 2012, primarily due to lower fixed annuity deposits resulting from the low interest
rate environment. Net flows improved in 2012 for individual variable annuities due to both the increase in deposits
and favorable surrender experience. Net flows improved in 2012 for retail mutual funds due to increased deposits.
2011 and 2010 Comparison
Net flows improved in 2011 due to both the significant increase in deposits and favorable surrender experience in
group retirement and individual fixed annuities. However, individual fixed annuities net flows declined in the second
half of the year due to lower deposits resulting from the low interest rate environment.
Surrender rates for individual fixed annuities also decreased in 2011 due to the low interest rate environment and the
relative competitiveness of interest credited rates on the existing block of fixed annuities versus interest rates on
alternative investment options available in the marketplace. AIG Life and Retirement returned to a more normal level
of group surrender activity that no longer reflects the negative AIG publicity associated with the events of 2008 and
2009. Individual variable annuities net flows improved from 2010 levels due primarily to higher deposits throughout
2011 and turned positive in the fourth quarter of 2011.
The following table presents reserves by surrender charge category and surrender rates:
No surrender charge $ 53,100 $ 18,179 $ 10,061
0% - 2% 1,186 2,922 4,317
Greater than 2% - 4% 1,248 4,719 2,068
Greater than 4% 4,060 23,372 7,764
Non-surrenderable 815 3,084 686
Total reserves $ 60,409 $ 52,276 $ 24,896
Surrender rates 8.4% 6.8% 11.9%
* Excludes mutual funds of $11.8 billion and $9.5 billion at December 31, 2012 and 2011, respectively.
Low Interest Rate Environment
There are a variety of factors that impact AIG Life and Retirement’s businesses, and the life insurance and annuity
industry in general, during a prolonged low interest rate environment. Declining interest rates result in higher fair
values of assets backing insurance and annuity liabilities and may result in improved persistency of certain lines of
business. A sustained low interest rate environment may also result in lower sales of fixed annuities and other
products and lower net investment spreads as portfolio cash flows are reinvested at lower rates (spread
compression). There are a number of management actions we may take to mitigate these impacts as discussed
below.
..................................................................................................................................................................................................................................
AIG 2012 Form 10-K108
2012 2011
Group Individual Individual Group Individual Individual
Retirement Fixed Variable Retirement Fixed VariableAt December 31,
(in millions) Products* Annuities Annuities Products* Annuities Annuities
$ 55,892 $ 21,528 $ 11,548
1,241 2,970 4,231
1,400 2,867 2,125
4,879 19,609 10,318
1,278 3,757 891
$ 64,690 $ 50,731 $ 29,113
8.6% 6.8% 10.3%
I T E M 7 / R E S U L T S O F O P E R A T I O N S

.....................................................................................................................................................................................
AIG Life and Retirement is proactively addressing the impact of sustained low interest rates. During 2012,
a number of actions were taken on both the asset and liability sides of our balance sheet:
• Opportunistic investments in structured securities and re-deployment of cash in 2011 to increase yields
• Continued disciplined approach to new business pricing
• Actively managing renewal credited rates
• Re-priced certain life insurance and annuity products to reflect current low rate environment
• Re-filed certain products to continue lowering minimum rate guarantees
As a result of these actions, we estimate that the effect of interest rates remaining at or near current levels through
the end of 2013 on pre-tax operating income would not be material, and would be modestly more significant with
respect to 2014 results.
Opportunistic Investments: The majority of assets backing insurance and annuity liabilities consists of
intermediate- and long-term fixed maturity securities. We generally purchase assets with the intent of matching
expected maturities of the insurance liabilities. An extended low interest rate environment may result in a lengthening
of liability maturities from initial estimates, primarily due to lower lapses. Opportunistic investments in structured
securities, private placement corporate debt securities and mortgage loans continue to be made to improve yields,
increase net investment income and help to offset the impact of the lower interest rate environment.
Disciplined New Business Pricing: New fixed annuity sales have declined in 2012 relative to 2011, due to the
relatively low crediting rates offered as a result of our disciplined approach to new business. However, even in the
current interest rate environment, we continue to pursue new sales of life and annuity products at targeted net
investment spreads. New sales of fixed annuity products generally have minimum interest rate guarantees of
1 percent. Universal life insurance interest rate guarantees are generally 2 to 3 percent on new non-indexed products
and 1 percent on new indexed products, and are designed to be sufficient to meet targeted net investment spreads.
If the low interest rate environment continues, we expect our fixed annuities sales (including deposits into fixed
options within variable annuities sold in group retirement markets) to remain weak into 2013.
Active Management of Renewal Credited Rates: The contractual provisions for renewal of crediting rates and
guaranteed minimum crediting rates included in our products may have the effect, in a continued low interest rate
environment, of reducing our spreads and thus reducing future profitability. Although we partially mitigate this interest
rate risk through its asset-liability management process, product design elements and crediting rate strategies, a
prolonged low interest rate environment may negatively affect future profitability. Our annuity and universal life
products were designed with contractual provisions that allow crediting rates to be reset at pre-established intervals
subject to minimum crediting rate guarantees. We have adjusted, and will continue to adjust, crediting rates in order
to maintain targeted net investment spreads on both new business and in-force business where crediting rates are
above minimum guarantees. In addition to annuity and universal life products discussed above, certain traditional
long-duration products for which we do not have the ability to adjust interest rates, such as payout annuities, are
exposed to reduced earnings and potential reserve increases in a prolonged low interest rate environment.
As indicated in the table below, approximately 63 percent of our annuity and universal life account values are at their
minimum crediting rates as of December 31, 2012, an increase from 45 percent at December 31, 2011. These
..................................................................................................................................................................................................................................
AIG 2012 Form 10-K 109
I T E M 7 / R E S U L T S O F O P E R A T I O N S

.....................................................................................................................................................................................
products have minimum guaranteed interest rates as of December 31, 2012 ranging from 1.0 percent to 5.5 percent,
with the higher rates representing guarantees on older products.
Universal life insurance
1% $ 24 $ – $ 9 $ 33
> 1% - 2% – – 232 232
> 2% - 3% 93 368 1,445 1,906
> 3% - 4% 2,143 209 1,566 3,918
> 4% - 5% 4,377 197 12 4,586
> 5% - 5.5% 321 3 2 326
Subtotal $ 6,958 $ 777 $ 3,266 $ 11,001
Fixed annuities
1% $ 1,317 $ 2,826 $ 6,079 $ 10,222
> 1% - 2% 6,146 8,146 8,857 23,149
> 2% - 3% 30,631 1,635 5,251 37,517
> 3% - 4% 13,262 962 417 14,641
> 4% - 5% 8,138 – 7 8,145
> 5% - 5.5% 238 – 5 243
Subtotal $ 59,732 $ 13,569 $ 20,616 $ 93,917
Total $ 66,690 $ 14,346 $ 23,882 $ 104,918
Percentage of total 63% 14% 23% 100%
Effective Product Management: AIG Life and Retirement has a dynamic product management process designed
to ensure that new business product offerings appropriately reflect the current low interest rate environment. To the
extent that we cannot achieve targeted net investment spreads on new business, products are re-priced or
discontinued. Additionally, current products with higher minimum rate guarantees have been re-filed with lower rates
as permitted under state insurance product regulations.
..................................................................................................................................................................................................................................
AIG 2012 Form 10-K110
Current Crediting RatesDecember 31, 2012
Contractual Minimum Guaranteed 1-50 Basis Points More than 50 Basis
Interest Rate Account Values At Contractual Above Minimum Points Above
(in millions) Minimum Guarantee Guarantee Minimum Guarantee Total
I T E M 7 / R E S U L T S O F O P E R A T I O N S

.....................................................................................................................................................................................
Other Operations
Other Operations Results..............................................................................................................................................................................................
The following table presents AIG’s Other operations results:
Mortgage Guaranty $ (97) $ 353 NM% NM%
Global Capital Markets (11) 210 NM NM
Direct Investment book 604 1,421 101 (57)
Retained interests:
Change in fair value of AIA securities, including
realized gain in 2012 1,289 (638) 61 NM
Change in fair value of ML III (646) 1,792 NM NM
Change in the fair value of the MetLife
securities prior to their sale (157) 665 NM NM
Corporate & Other:
Interest expense on FRBNY Credit Facility* (72) (636) NM 89
Other interest expense (1,613) (1,856) 1 13
Corporate expenses, net (1,095) (1,233) 18 11
Real estate and other non-core businesses 24 (658) NM NM
Total Corporate & Other operating income (2,756) (4,383) 5 37
Consolidation and eliminations – 89 NM NM
Total Other operations operating income (loss) (1,774) (491) NM (261)
Legal reserves (20) (3) NM NM
Legal settlements – – NM NM
Deferred gain on FRBNY credit facility 296 – NM NM
Amortization of prepaid commitment fee asset – (3,471) NM NM
Gain (loss) on extinguishment of debt (3,143) (104) 100 NM
Net realized capital gains 12 908 NM (99)
Net gain (loss) on sale of divested businesses (74) 18,897 97 NM
Divested businesses – 1,875 NM NM
Total Other operations pre-tax income (loss) $ (4,703) $ 17,611 NM% NM%
* Includes interest expense of $2 million and $75 million for 2011 and 2010, respectively, allocated to discontinued operations in consolidation.
..................................................................................................................................................................................................................................
AIG 2012 Form 10-K 111
Percentage ChangeYears Ended December 31,
(in millions) 2012 2011 2010 2012 vs. 2011 2011 vs. 2010
$ 9
557
1,215
2,069
2,888
–
–
(1,597)
(900)
(121)
(2,618)
4
4,124
(754)
39
–
–
(9)
501
(2)
–
$ 3,899
I T E M 7 / R E S U L T S O F O P E R A T I O N S

.....................................................................................................................................................................................
In December of 2012, we recorded litigation settlement income from settlements with three financial institutions who
participated in the creation, offering and sale of RMBS as to which AIG and its subsidiaries suffered losses either
directly on their own account or in connection with their participation in AIG’s securities lending program.
Mortgage Guaranty..............................................................................................................................................................................................
The following table presents pre-tax income for Mortgage Guaranty:
Underwriting results:
Net premiums written $ 801 $ 756 7% 6%
(Increase) decrease in unearned premiums (9) 219 NM NM
Net premiums earned 792 975 (10) (19)
Claims and claims adjustment expenses incurred 834 500 (21) 67
Underwriting expenses 187 271 3 (31)
Underwriting profit (loss) (229) 204 40 NM
Net investment income 132 149 11 (11)
Operating income (loss) (97) 353 NM NM
Net realized capital gains 20 44 (70) (55)
Pre-tax income (loss) $ (77) $ 397 NM% NM%
2012 and 2011 Comparison
Mortgage Guaranty recorded operating income in 2012 compared to an operating loss in 2011 primarily due to:
• a decrease in claims and claims adjustment expenses of $175 million. This reflects decreases in first and
second-lien businesses of $95 million and $110 million, respectively, which were partially offset by an increase in
international claims and claims adjustment expenses of $34 million. Claims and claims adjustment expenses in
2012 included favorable prior year loss development of $78 million, which consists of $45 million in second liens,
$17 million in student loans and $33 million in the international business partially offset by unfavorable
development in first liens of $17 million. This favorable prior year development was offset by current accident year
losses attributable to business written in 2008 and prior;
• the $95 million decrease in first-lien claims and claims adjustment expenses reflected 20 percent lower levels of
newly reported delinquencies, an improvement in the cure rate and lower unfavorable loss development of
$17 million in 2012 compared to $76 million of unfavorable development in 2011. The unfavorable development of
$17 million in 2012, included $117 million of favorable development arising from the claims requests sent to
lenders mentioned above, offset by $134 million of unfavorable development on delinquencies for which claim
requests were not made;
• the $110 million decline in second-lien business claims and claims adjustment expenses. This reflected a decrease
in claims and claims adjustment expenses paid as more business reached the respective stop loss limits; and
• the increased claims and claims adjustment expenses in the international business. This reflected a reduction in
claim reserves in 2011 due to a settlement of certain delinquencies with a major European lender that resulted in a
$43 million benefit.
These items were partially offset by:
• a decline in first-lien earned premiums of $19 million reflecting higher premium refunds due to the rescissions
arising from the claims requests sent to lenders during the fourth quarter of 2011 and continuing throughout 2012,
as discussed in Outlook herein, in addition to the declining persistency on the 2008 and prior policy years;
..................................................................................................................................................................................................................................
AIG 2012 Form 10-K112
Percentage ChangeYears Ended December 31,
(in millions) 2012 2011 2010 2012 vs. 2011 2011 vs. 2010
$ 858
(143)
715
659
193
(137)
146
9
6
$ 15
I T E M 7 / R E S U L T S O F O P E R A T I O N S

.....................................................................................................................................................................................
• a decline in earned premiums on second-lien and international businesses, both of which were placed into run-off
during 2008, of $41 million and $24 million respectively; and
• a $10 million increase in underwriting expenses driven primarily by an increase in underwriting, sales and product
initiatives, all of which supported the increase in new insurance written for the year.
New insurance written, which represents the original principal balance of the insured mortgages, was approximately
$37 billion and $19 billion in 2012 and 2011, respectively. The increase in new insurance written is the result of the
market acceptance by lenders of UGC’s risk-based pricing model and withdrawal of certain competitors from the
market during 2011. See Outlook – Other Operations – Mortgage Guaranty for further discussion.
Risk-in-Force
The following table presents risk-in-force and delinquency ratio information for Mortgage Guaranty domestic
business:
Domestic first-lien:
Risk in force $25.6
60+ day delinquency ratio on primary loans(a) 13.9%
Domestic second-lien:
Risk in force(b) $ 1.5
(a) Based on number of policies.
(b) Represents the full amount of second-lien loans insured reduced for contractual aggregate loss limits on certain pools of loans, usually
10 percent of the full amount of loans insured in each pool. Certain second-lien pools have reinstatement provisions, which will expire as the loan
balances are repaid.
2011 and 2010 Comparison
Mortgage Guaranty recorded an operating loss in 2011 compared to operating income in 2010, primarily due to:
• an increase in claims and claims adjustment expenses of $334 million, primarily in first-lien business. This reflected
increased overturns of denied and rescinded claims and unfavorable first-lien loss development of $76 million in
2011, compared to favorable loss development of $385 million in 2010. These factors were partially offset by lower
levels of newly reported delinquencies in the first-lien, second-lien and international products, and a reduction in
reserves due to an agreement to resolve certain delinquencies with a major European lender that resulted in a
$43 million benefit;
• declines in earned premiums from the second-lien, private student loan and international businesses, which were
placed into runoff during 2008, partially offset by an increase in earned premiums from first-lien business; and
• the accrual of $22 million to pay for previously rescinded losses, certain legal fees and interest in connection with
an adverse judgment. Mortgage Guaranty has appealed the court’s decision.
Partially offsetting these declines was a reduction in underwriting expenses compared to 2010 reflecting a $94 million
accrual of estimated remedy losses in 2010. Remedy losses represent the indemnification for losses incurred by
lenders arising from obligations contractually assumed by Mortgage Guaranty as a result of underwriting services
provided to lenders during times of high loan origination activity. Mortgage Guaranty believes it has adequately
accrued for these losses at December 31, 2011. Pre-tax income for 2010 also includes gains of approximately
$150 million from legal settlements and reinsurance commutations.
Global Capital Markets Operations..............................................................................................................................................................................................
2012 and 2011 Comparison
GCM reported operating income in 2012 compared to an operating loss in 2011 primarily due to improvement in
unrealized market valuations related to the super senior credit default swap (CDS) portfolio, a decrease in operating
expenses and lower costs related to the wind-down of AIGFP’s businesses and portfolios. For 2012 and 2011,
..................................................................................................................................................................................................................................
AIG 2012 Form 10-K 113
At December 31,
(dollars in billions) 2012 2011
$29.0
8.9%
$ 1.3
I T E M 7 / R E S U L T S O F O P E R A T I O N S

.....................................................................................................................................................................................
unrealized market valuation gains of $617 million and $339 million, respectively, were recognized. The improvement
resulted primarily from CDS transactions written on multi sector CDOs driven by amortization and price movements
within the CDS portfolio. For 2012, the remaining portfolio of AIGFP continued to be wound down and was managed
consistent with AIG’s risk management objectives. The active wind-down of the AIGFP derivatives portfolio was
completed by the end of the second quarter of 2011.
2011 and 2010 Comparison
GCM reported an operating loss in 2011 compared to operating income in 2010 primarily due to a decrease in
unrealized market valuation gains related to the super senior CDS portfolio and losses in 2011 compared to gains in
2010 on the CDS contracts referencing single-name exposures written on corporate, index and asset-backed credits,
which are not included in the super senior CDS portfolio. These items were partially offset by improvement in net
credit valuation adjustments on derivative assets and liabilities. For 2011 and 2010, unrealized market valuation gains
of $339 million and $598 million, respectively, were recognized on the super senior CDS portfolio. The decrease
resulted primarily from CDS transactions written on multi-sector CDOs as a result of price declines of the underlying
assets. For 2011, an unrealized market valuation loss of $23 million was recognized on CDS contracts referencing
single-name exposures compared to a gain of $149 million in 2010 due to a decline in market conditions. For 2011
and 2010, net credit valuation adjustment losses of $53 million and $200 million, respectively, were recognized. The
improvement resulted primarily from the narrowing of corporate spreads.
Direct Investment Book Results..............................................................................................................................................................................................
2012 and 2011 Comparison
The DIB’s operating income increased in 2012 compared to 2011 primarily due to improvement in net credit valuation
adjustments on the DIB assets and liabilities for which the fair value option was elected and gains realized from
unwinding certain transactions. For 2012 and 2011, net credit valuation adjustment gains of $789 million and
$380 million, respectively, were recognized. The improvement resulted primarily from gains on assets due to the
tightening of counterparty credit spreads, partially offset by losses on liabilities due to the tightening of AIG’s credit
spreads.
2011 and 2010 Comparison
The DIB’s operating income decreased in 2011 compared to 2010 primarily due to lower net gains in credit valuation
adjustments on non-derivative assets and liabilities accounted for under the fair value option and lower interest
income due to approximately $4.9 billion in sales of investments during the fourth quarter of 2010 and the first
quarter of 2011 to increase liquidity.
The following table presents credit valuation adjustment gains (losses) for the DIB (excluding intercompany
transactions):
Counterparty Credit Valuation Adjustment on Assets:
Bond trading securities $ (71) $ 1,678
Loans and other assets 31 40
Increase (decrease) in assets $ (40) $ 1,718
AIG’s Own Credit Valuation Adjustment on Liabilities:
Notes and bonds payable $ 141 $ (251)
Hybrid financial instrument liabilities 147 (311)
Guaranteed Investment Agreements 112 (173)
Other liabilities 20 (44)
(Increase) decrease in liabilities $ 420 $ (779)
Net increase to operating income $ 380 $ 939
..................................................................................................................................................................................................................................
AIG 2012 Form 10-K114
Years Ended December 31,
(in millions) 2012 2011 2010
$ 1,401
29
$ 1,430
$ (235)
(291)
(81)
(34)
$ (641)
$ 789
I T E M 7 / R E S U L T S O F O P E R A T I O N S

.....................................................................................................................................................................................
Retained Interests..............................................................................................................................................................................................
Change in Fair Value of AIA Securities Prior to Their Sale
We sold our remaining 33 percent interest in AIA ordinary shares for proceeds of $14.5 billion and a net gain of
$2.1 billion through three sale transactions on March 7, September 11 and December 20, 2012.
We recognized a $1.3 billion gain in 2011, representing a 12 percent increase in the value of AIG’s then 33 percent
interest in AIA, which is recorded in Other invested assets and accounted for under the fair value option. In 2010, we
recognized a $638 million loss on our interest in AIA during the approximate two-month holding period following the
initial public offering in late October 2010.
Change in Fair Value of ML III Prior to Liquidation
The gains attributable to AIG’s interest in ML III for 2012 were based in part on the completion of the final auction of
ML III assets by the FRBNY, in the third quarter of 2012.
The loss attributable to AIG’s interest in ML III for 2011 was due to significant spread widening and reduced interest
rates.
The gain on ML III for 2010 was attributable to the shortening of its weighted average life. Additionally, fair value for
2010 was positively affected by a decrease in projected credit losses in the underlying collateral securities.
Change in the Fair Value of the MetLife Securities Prior to Their Sale
We recognized a loss in 2011, representing the decline in the securities’ value, due to market conditions, from
December 31, 2010 through the date of their sale in the first quarter of 2011.
Corporate & Other..............................................................................................................................................................................................
Corporate & Other reported lower operating losses in 2012 compared to 2011 primarily due to the effects of the
following:
• reduction in expense of $211 million in 2012 resulting from settlements of the liability for the Department of the
Treasury’s underwriting fees for the sale of AIG Common Stock at amounts lower than had been estimated at the
time the accrual was established, and AIG purchased a significant amount of shares for which no payment to the
underwriters was required; and
• a decline in interest expense as a result of the repayment of the FRBNY Credit Facility and the exchange of
outstanding junior subordinated debentures for senior unsecured notes in 2011.
Real estate and other non-core businesses declined due to lower gains on real estate dispositions and higher equity
losses on real estate investments in 2012 compared to 2011.
Corporate & Other reported lower operating losses in 2011 compared to 2010. This was primarily due to:
• a decline in interest expense as a result of the repayment of the FRBNY Credit Facility; and
• improvement in real estate and other non-core businesses due to significantly lower levels of real estate
investment impairment charges in 2011 compared to 2010.
Divested Businesses..............................................................................................................................................................................................
Divested businesses include the operating results of divested businesses that did not qualify for discontinued
operations accounting through the date of their sale. The Divested businesses results for 2010 primarily represent
the historical results of AIA, which was deconsolidated in November 2010 in conjunction with its initial public offering.
..................................................................................................................................................................................................................................
AIG 2012 Form 10-K 115
I T E M 7 / R E S U L T S O F O P E R A T I O N S

.....................................................................................................................................................................................
Discontinued Operations
Income (loss) from Discontinued Operations is comprised of the following:
Foreign life insurance businesses $ 1,170 $ (1,602)AGF – (145)ILFC (1,017) (581)Net gain (loss) on sale 2,338 5,389Consolidation adjustments (1) (356)Interest allocation (2) (75)
Income (loss) from discontinued operations 2,488 2,630Income tax expense (benefit) 698 3,599
Income (loss) from discontinued operations, net of tax $ 1,790 $ (969)
Significant items affecting the comparison of results from discontinued operations included the following:
• a pre-tax loss of $6.7 billion ($4.4 billion after tax) on the announced sale of ILFC in 2012;
• a gain on the sale of AIG Star and AIG Edison in 2011, a gain on the sale of ALICO in 2010, a loss on the sale of
AGF in 2010 and a loss recognized in 2010 related to the sale of Nan Shan;
• impairments of goodwill in 2010 of $4.6 billion related to ALICO, AIG Star and AIG Edison.
• tax effects of the above transactions, notably the impact of non-deductible goodwill impairment and the change in
investment in subsidiaries, which was principally related to changes in the estimated U.S. tax liability with respect
to the planned sales.
See Note 4 to the Consolidated Financial Statements for further discussion of discontinued operations.
Consolidated Comprehensive Income (Loss)..............................................................................................................................................................................................
The following table presents AIG’s consolidated comprehensive income (loss):
Net income $ 21,330 $ 12,285 (83)% 74%
Change in unrealized appreciation ofinvestments 5,518 9,910 94 (44)
Change in deferred acquisition costs adjustmentand other (630) (657) (41) 4
Change in future policy benefits (2,302) – 78 NMChange in foreign currency translation
adjustments (97) 654 66 NMChange in net derivative gains arising from cash
flow hedging activities 51 105 (35) (51)Change in retirement plan liabilities adjustment (365) 9 13 NMChange attributable to divestitures and
deconsolidations (5,041) (4,872) NM (3)Deferred tax asset (liability) 262 (2,186) NM NM
Other comprehensive income (loss) (2,604) 2,963 NM NM
Comprehensive income 18,726 15,248 (48) 23
Total comprehensive income attributable tononcontrolling interests 587 2,408 (55) (76)
Comprehensive income attributable to AIG $ 18,139 $ 12,840 (47)% 41%
..................................................................................................................................................................................................................................
AIG 2012 Form 10-K116
Years Ended December 31,(in millions) 2012 2011 2010
$ ––
304(6,733)
––
(6,429)(2,377)
$ (4,052)
Percentage ChangeYears Ended December 31,(in millions) 2012 2011 2010 2012 vs. 2011 2011 vs. 2010
$ 3,700
10,710
(889)(517)
(33)
33(319)
–(2,889)
6,096
9,796
265
$ 9,531
I T E M 7 / R E S U L T S O F O P E R A T I O N S

.....................................................................................................................................................................................
2012 and 2011 Comparison
Change in Unrealized Appreciation of Investments..............................................................................................................................................................................................
The increase in 2012 was primarily attributable to appreciation in bonds available for sale due to lower interest ratesand narrowing spreads for investment grade and high-yield securities. The ten year U.S. Treasury rate started theyear at 1.88 percent, decreased to a historic low of 1.39 percent in the middle of the year, and ended the year at1.76 percent. High yield and investment grade spreads were down approximately 200 basis points and 100 basispoints, respectively, during the year, with the narrowing spreads being the major contributor to unrealizedappreciation in bonds available for sale, which was almost double the amount recorded in 2011. Corporate bondsand structured securities were major beneficiaries from this continued low rate environment as prices on these assetsincreased significantly during the year. Non-agency securities provided the majority of the structured securitiesimprovement as high yield securities generally benefited from the significant narrowing of spreads during the year.The significant majority of the unrealized appreciation occurred during the first three quarters of the year, as thefourth quarter experienced less rate and spread volatility.
During 2011, the insurance operations portfolio experienced appreciation in bonds available for sale due to lowerrates, which more than offset widening spreads. The ten year U.S. Treasury rate started the year at 3.30 percent,falling 188 basis points to end the year at 1.88 percent. Municipal bond rates also decreased, resulting in unrealizedappreciation in both the U.S. Government securities and municipal bond portfolio. The drop in U.S. Treasury ratesmore than offset the widening of spreads on Investment grade securities, resulting in improved pricing andcorresponding unrealized appreciation in the corporate bond portfolio during the year.
The reclassification adjustments included in net income on unrealized appreciation of investments increased by$1.0 billion in 2012 compared to 2011 as a result of realized gains and losses recognized on sales of securitiesclassified as available for sale.
See Investments – Investment Highlights – Securities available for sale herein for a table on the gross unrealizedgains (losses) of AIG’s available for sale securities by type of security.
Change in Deferred Acquisition Costs Adjustment and Other..............................................................................................................................................................................................
The change in DAC in 2012 compared to 2011 is primarily the result of increases in the unrealized appreciation ofinvestments supporting interest-sensitive products. DAC for investment-oriented products is adjusted for changes inestimated gross profits that result from changes in the net unrealized gains or losses on fixed maturity and equitysecurities available for sale. Because fixed maturity and equity securities available for sale are carried at aggregatefair value, an adjustment is made to DAC equal to the change in DAC amortization that would have been recorded ifsuch securities had been sold at their stated aggregate fair value and the proceeds reinvested at current yields.These adjustments, net of tax, are credited or charged directly to Accumulated other comprehensive income (loss).
Change in Future Policy Benefits..............................................................................................................................................................................................
We periodically evaluate the assumptions used to establish deferred acquisition costs and future policy benefits.These assumptions may be adjusted based on actual experience and judgment. Key assumptions include mortality,morbidity, persistency, maintenance expenses and investment returns.
Primarily as a result of the increase in unrealized appreciation of investments during 2012 and 2011, we recordedadditional future policy benefits through Other comprehensive income. This change in future policy benefits assumesthat the securities underlying certain traditional long-duration products are sold at their stated aggregate fair valueand reinvested at current yields. This increase in future policy benefits in other comprehensive income was partiallyoffset by loss reserve recognition in net income resulting from sales of securities in unrealized gain positions.
Change in Foreign Currency Translation Adjustment..............................................................................................................................................................................................
The change in foreign currency translation adjustment was a net loss in 2012 due to the strengthening of the U.S.dollar against the Euro and Japanese Yen slightly offset by the weakening of the U.S. dollar against British pound.
Change in Net Derivative Gains (Losses) Arising from Cash Flow Hedging Activities..............................................................................................................................................................................................
The decline primarily reflects the gradual run-off of the cash flow hedge portfolio as well as the de-designationsresulting from ILFC, partially offset by a decline in the interest rate environment.
..................................................................................................................................................................................................................................
AIG 2012 Form 10-K 117
I T E M 7 / R E S U L T S O F O P E R A T I O N S

.....................................................................................................................................................................................
Change in Retirement Plan Liabilities Adjustment..............................................................................................................................................................................................
The decrease in the amount of change in 2012 compared to the 2011 was primarily due to the overall decreases in
discount rates resulting in a loss of approximately $636 million and $677 million in 2012 and 2011, respectively.
Partially offsetting the 2012 loss was a gain from investment returns of $213 million. Adding to the loss in 2011 was
a loss from investment returns of $146 million.
See Note 22 to the Consolidated Financial Statements for further discussion.
Change Attributable to Divestitures and Deconsolidations..............................................................................................................................................................................................
The change attributable to divestitures and deconsolidations in 2011 primarily reflects the derecognition of all items in
Accumulated other comprehensive income (loss) at the time of sale for AIG Star, AIG Edison and Nan Shan.
Deferred Taxes on Other Comprehensive Income..............................................................................................................................................................................................
In 2012, the effective tax rate on pre-tax Other Comprehensive Income was 32.2 percent. The effective tax rate
differed from the statutory 35 percent rate primarily due to a decrease in the deferred tax asset valuation allowance
and the effect of foreign operations.
For the year ended December 31, 2011, the effective tax rate on pre-tax Other Comprehensive Loss was
9.1 percent. The effective tax rate differs from the statutory 35 percent rate primarily due to the effects of the Nan
Shan disposition.
2011 and 2010 Comparison
Change in Unrealized Appreciation of Investments..............................................................................................................................................................................................
As discussed above, the 2011 increase in unrealized appreciation of investments was due to the result of
appreciation in bonds available for sale due to lower rates, which more than offset widening spreads.
The $9.9 billion increase in 2010 primarily reflects an appreciation in bonds available for sale due to lower U.S.
Treasury rates and slightly narrowed spreads. The structured securities portfolio accounted for more than half of the
positive change in 2010, as RMBS and CMBS continued to recover from the distressed pricing levels of the financial
crisis. The increase in 2010 also includes an appreciation in available-for-sale equity securities.
The reclassification adjustments included in net income on unrealized appreciation of investments decreased by
$0.5 billion in 2011 compared to 2010 as a result of realized gains and losses recognized on sales of securities
classified as available for sale.
Change in Deferred Acquisition Costs Adjustment and Other..............................................................................................................................................................................................
DAC amortization was reduced in 2011 and 2010 primarily as a result of increases in the unrealized appreciation of
investments supporting interest-sensitive products. The declines also reflect the divestiture of multiple life insurance
operations, including the sales of Nan Shan, AIG Star and AIG Edison in 2011, the deconsolidation of AIA in 2010
and sale of ALICO in 2010.
Change in Foreign Currency Translation Adjustments..............................................................................................................................................................................................
The decline in foreign currency translation adjustments reflects the divestiture of multiple foreign operations, including
the sales of Nan Shan, AIG Star and AIG Edison in 2011, the deconsolidation of AIA in 2010 and the sale of ALICO
in 2010.
Change in Net Derivative Gains (Losses) Arising from Cash Flow Hedging Activities..............................................................................................................................................................................................
The decline in 2011 compared to 2010 primarily reflects the gradual wind-down of the cash flow hedge portfolio,
partially offset by a decline in the interest rate environment.
..................................................................................................................................................................................................................................
AIG 2012 Form 10-K118
I T E M 7 / R E S U L T S O F O P E R A T I O N S

.....................................................................................................................................................................................
Change in Retirement Plan Liabilities Adjustment..............................................................................................................................................................................................
The decrease in 2011 was primarily due to the announced redesign and resulting remeasurement of the AIG
Retirement and AIG Excess Plans, which was converted to cash balance plans effective April 1, 2012. AIG
recognized a $590 million pre-tax reduction to Accumulated other comprehensive income in connection with the
remeasurement in 2011, primarily due to a decrease in the discount rate since December 31, 2010. This decrease in
Accumulated other comprehensive income was partially offset by the effect of the increase in the discount rate in the
fourth quarter of 2011 in connection with the year end remeasurement.
Change Attributable to Divestitures and Deconsolidations..............................................................................................................................................................................................
The change attributable to divestitures and deconsolidations in both periods reflect the derecognition of all items in
Accumulated other comprehensive income (loss) at the point of sale and deconsolidation for all entities, including
domestic entities. In 2011, the most significant entities were AIG Star, AIG Edison and Nan Shan. In 2010, the most
significant entities were AIA and ALICO.
Deferred Taxes on Other Comprehensive Income..............................................................................................................................................................................................
As discussed above, for the year ended December 31, 2011, the effective tax rate differs from the statutory
35 percent rate primarily due to the effects of the Nan Shan disposition.
For the year ended December 31, 2010, the effective tax rate on pre-tax Other Comprehensive Income was
42.5 percent, primarily due to the effects of the AIA initial public offering, the ALICO disposition and changes in the
estimated U.S. tax liability with respect to the potential sale of subsidiaries, including AIG Star and AIG Edison.
..................................................................................................................................................................................................................................
AIG 2012 Form 10-K 119
I T E M 7 / R E S U L T S O F O P E R A T I O N S

.....................................................................................................................................................................................
Liquidity and Capital Resources
Overview..............................................................................................................................................................................................
Liquidity refers to the ability to generate sufficient cash resources to meet our payment obligations. It is defined as
cash and unencumbered assets that can be monetized in a short period of time at a reasonable cost. We manage
our liquidity prudently through various risk committees, policies and procedures, and a stress testing and liquidity
framework established by ERM. See Enterprise Risk Management – Risk Governance Structure for additional
information. The liquidity framework is designed to measure both the amount and composition of our liquidity to meet
financial obligations in both normal and stressed markets. See Enterprise Risk Management – Risk Appetite,
Identification, and Measurement and Liquidity Risk Management for additional information.
Capital refers to the long-term financial resources available to support the operation of our businesses, fund business
growth, and cover financial and operational needs that arise from adverse circumstances. Our primary source of
ongoing capital generation is the profitability of our insurance subsidiaries. We and our insurance subsidiaries must
comply with numerous constraints on our minimum capital positions. These constraints drive the requirements for
capital adequacy for both the consolidated company and the individual businesses and are based on internally-
defined risk tolerances, regulatory requirements, rating agency and creditor expectations and business needs. Actual
capital levels are monitored on a regular basis and using ERM’s stress testing methodology, we evaluate the capital
impact of potential macroeconomic, financial and insurance stresses in relation to the relevant capital constraints of
both the consolidated company and our insurance subsidiaries.
We believe that we have sufficient liquidity and capital resources to satisfy future requirements and meet our
obligations to policyholders, customers, creditors and debt-holders, including reasonably foreseeable contingencies or
events.
Nevertheless, some circumstances may cause our cash or capital needs to exceed projected liquidity or capital
resources. Additional collateral calls, deterioration in investment portfolios or reserve strengthening affecting statutory
surplus, higher surrenders of annuities and other policies, downgrades in credit ratings, or catastrophic losses may
result in significant additional cash or capital needs, loss of some sources of liquidity or capital, or both. In addition,
regulatory, and other legal restrictions could limit our ability to transfer funds freely, either to or from our subsidiaries.
Depending on market conditions, regulatory and rating agency considerations and other factors, we may take various
liability and capital management actions. Liability management actions may include, but are not limited to
repurchasing or redeeming outstanding debt, issuing new debt or engaging in debt exchange offers. Capital
management actions may include, but are not limited to, paying dividends to our shareholders, share purchases and
acquisitions.
..................................................................................................................................................................................................................................
AIG 2012 Form 10-K120
I T E M 7 / L I Q U I D I T Y A N D C A P I T A L R E S O U R C E S

Sources
.....................................................................................................................................................................................
Liquidity and Capital Resources Management Highlights 2012
• Sales of AIA Shares
We sold our remaining interest of approximately 4.0 billion AIA ordinary shares for gross proceeds of
approximately $14.5 billion.
• ML III Distributions
We received approximately $8.5 billion in distributions from the FRBNY’s dispositions of ML III assets.
• AIG Parent Funding from Subsidiaries
Approximately $5.2 billion was paid to AIG Parent from subsidiaries in cash. In addition, AIG Parent received
non-cash dividends of approximately $1.0 billion in the form of municipal bonds from AIG Property Casualty.
• AIG Notes Offerings
We received approximately $3.8 billion in proceeds in registered public note offerings.
• ALICO Escrow Release
Approximately $1.0 billion held in escrow to secure indemnifications provided to MetLife under the ALICO stock
purchase agreement was released to AIG (see Note 16 to the Consolidated Financial Statements for additional
information).
Uses
• AIG Share Purchases
We purchased an aggregate of approximately $13 billion of AIG Common Stock at the initial public offering price
in four registered public offerings of AIG Common Stock conducted by the Department of the Treasury, as the
selling shareholder. See Note 17 to the Consolidated Financial Statements for additional information on these
offerings.
• Pay Down of AIA SPV Preferred Interests
We paid down in full the remaining $8.6 billion liquidation preference of the Department of the Treasury’s AIA
SPV Preferred Interests and redeemed the Department of the Treasury’s preferred participating return rights in
the AIA SPV and the special purpose vehicle holding the proceeds from the sale of ALICO (ALICO SPV). The
payment was funded using both existing funds and approximately $1.6 billion in proceeds to us from the
FRBNY’s final disposition of ML II securities, approximately $6.0 billion in proceeds from the sale of AIA ordinary
shares and funds allocated to the MIP.
• Debt Reduction
We repaid an aggregate total of $7.7 billion of debt, which includes repayments by AIG Parent of $3.2 billion.
• AIG Parent Funding to Subsidiaries
We made $1.2 billion in net capital contributions to subsidiaries, including a contribution of approximately
$1.0 billion to AIG Property Casualty in the aftermath of Storm Sandy.
..................................................................................................................................................................................................................................
AIG 2012 Form 10-K 121
I T E M 7 / L I Q U I D I T Y A N D C A P I T A L R E S O U R C E S

.....................................................................................................................................................................................
On February 19, 2013, AIG commenced cash tender offers for (i) our 8.625% Series A-8 Junior Subordinated
Debentures and 8.000% Series A-7 Junior Subordinated Debentures for a purchase price of up to $325 million,
(ii) our 6.250% Series A-1 Junior Subordinated Debentures and 8.175% Series A-6 Junior Subordinated Debentures
for a purchase price of up to $650 million and (iii) the 81⁄2% Capital Trust Pass-Through Securities of American
General Capital II, the 7.57% Capital Securities, Series A of American General Institutional Capital A, the 81⁄8%
Capital Securities, Series B of American General Institutional Capital B and the 5.60% Senior Debentures due July
2097 of SunAmerica Inc. assumed by AIG, for a purchase price of up to $275 million, in each case plus accrued
interest or distributions through the settlement date. The offers are not cross-conditioned and AIG may complete all,
some or none of the tender offers. The offers are scheduled to expire on March 18, 2013 with an early participation
period through March 4, 2013, in each case subject to amendment and to extension in AIG’s sole discretion. The
purpose of the tender offers is to purchase certain outstanding debt issued or guaranteed by AIG and to reduce its
level of indebtedness and its interest expense.
See Liquidity and Capital Resources of AIG Parent and Subsidiaries – AIG Parent – Sources and Uses of Liquidity
and Capital Resources of AIG Parent herein for further discussion.
Analysis of Sources and Uses of Cash..............................................................................................................................................................................................
The following table presents selected data from AIG’s Consolidated Statement of Cash Flows:
Sources:
Net cash provided by (used in) operating activities – continuing operations $ (6,256) $ 6,161
Net cash provided by operating activities – discontinued operations 6,175 10,436
Net cash provided by changes in restricted cash 27,202 –
Net cash provided by other investing activities 9,246 17,114
Changes in policyholder contract balances 4,333 4,673
Issuance of other long-term debt 3,190 3,342
Federal Reserve Bank of New York credit facility borrowings – 19,900
Proceeds from drawdown on the Department of Treasury Commitment 20,292 2,199
Issuance of Common Stock 5,055 –
Net cash provided by other financing activities – –
Total sources 69,237 63,825
Uses:
Changes in restricted cash – (27,026)
Changes in policyholder contract balances – –
Repayments of other long-term debt (9,486) (7,986)
Federal Reserve Bank of New York credit facility repayments (14,622) (23,178)
Repayment of Department of Treasury SPV Preferred Interests (12,425) –
Repayment of Federal Reserve Bank of New York SPV Preferred Interests (26,432) –
Purchases of AIG Common Stock (70) –
Net cash used in other financing activities (6,761) (8,211)
Total uses (69,796) (66,401)
Effect of exchange rate changes on cash 29 39
Decrease in cash (530) (2,537)
..................................................................................................................................................................................................................................
AIG 2012 Form 10-K122
Years Ended December 31,
(in millions) 2012 2011 2010
$ 748
2,928
695
15,917
–
4,844
–
–
–
4,194
29,326
–
(690)
(7,276)
–
(8,636)
–
(13,000)
–
(29,602)
16
(260)
I T E M 7 / L I Q U I D I T Y A N D C A P I T A L R E S O U R C E S

.....................................................................................................................................................................................
The following table presents a summary of AIG’s Consolidated Statement of Cash Flows:
Summary:
Net cash provided by (used in) operating activities $ (81) $ 16,597
Net cash provided by (used in) investing activities 36,448 (9,912)
Net cash used in financing activities (36,926) (9,261)
Effect of exchange rate changes on cash 29 39
Decrease in cash (530) (2,537)
Cash at beginning of year 1,558 4,400
Change in cash of businesses held for sale 446 (305)
Cash at end of year $ 1,474 $ 1,558
Operating Cash Flow Activities..............................................................................................................................................................................................
Interest payments totaled $4.0 billion in 2012 compared to $9.0 billion in 2011. Cash paid for interest in 2011
includes the payment of FRBNY Credit Facility accrued compounded interest totaling $6.4 billion. Excluding interest
payments, AIG generated positive operating cash flow of $7.7 billion and $8.9 billion in 2012 and 2011, respectively.
Insurance companies generally receive most premiums in advance of the payment of claims or policy benefits. The
ability of insurance companies to generate positive cash flow is affected by the frequency and severity of losses
under their insurance policies, policy retention rates and operating expenses.
Cash provided by AIG Property Casualty operating activities was $1.1 billion in 2012 compared to $1.9 billion in
2011, primarily reflecting the decrease in net premiums written as a result of the continued execution of strategic
initiatives to improve business mix and the timing of the cash flows used to pay claims and claims adjustment
expenses and the related reinsurance recoveries.
Cash provided by operating activities by AIG Life and Retirement was $2.9 billion in 2012 compared to $2.4 billion in
2011, primarily reflecting efforts to actively manage spread income.
Cash provided by operating activities of discontinued operations of $2.9 billion in 2012 compared to $6.2 billion in
2011, includes ILFC, and in 2011 and 2010, foreign life insurance subsidiaries that were divested in 2011, including
Nan Shan, AIG Star and AIG Edison.
Net cash provided by operating activities declined in 2011 compared to 2010, principally due to the following:
• the cash payment by AIG Parent of $6.4 billion in accrued compounded interest and fees under the FRBNY Credit
Facility. In prior periods, these payments were paid in-kind and did not affect operating cash flows;
• cash provided by operating activities of foreign life subsidiaries declined by $10.4 billion due to the sale of those
subsidiaries (AIA, ALICO, AIG Star, AIG Edison and Nan Shan). The subsidiaries generated operational cash
inflows of $3.4 billion and $13.8 billion in 2011 and 2010, respectively; and
• the effect of catastrophes and the cession of a large portion of AIG Property Casualty’s net asbestos liabilities in
the U.S. to NICO. Excluding the impact of the NICO cession and catastrophes, cash provided by AIG’s reportable
segments in 2011 is consistent with 2010, as increases in claims paid were offset by increases in premiums
collected at the insurance subsidiaries.
Investing Cash Flow Activities..............................................................................................................................................................................................
Net cash provided by investing activities for 2012 includes the following items:
• payments received relating to the sale of the underlying assets held by ML II of approximately $1.6 billion;
• payments of approximately $8.5 billion received in connection with the dispositions of ML III assets by the FRBNY;
..................................................................................................................................................................................................................................
AIG 2012 Form 10-K 123
Years Ended December 31,
(in millions) 2012 2011 2010
$ 3,676
16,612
(20,564)
16
(260)
1,474
(63)
$ 1,151
I T E M 7 / L I Q U I D I T Y A N D C A P I T A L R E S O U R C E S

.....................................................................................................................................................................................
• gross proceeds of approximately $14.5 billion from the sale of approximately 4.0 billion AIA ordinary shares; and
• approximately $2.1 billion of cash collateral received in connection with the securities lending program launched
during 2012 by AIG Life and Retirement.
Net cash provided by investing activities in 2011 was primarily attributable to:
• the utilization of $26.4 billion of restricted cash generated from the AIA IPO and ALICO sale in connection with the
Recapitalization and $9.6 billion from the disposition of MetLife securities;
• the sale of AIG Star, AIG Edison and Nan Shan in 2011 for total proceeds of $6.4 billion; and
• net sales of short term investments and maturities of available for sale investments, primarily at AIG Property
Casualty and AIG Life and Retirement, which were partially offset by purchases of available for sale investments.
Net cash used in investing activities in 2010 primarily resulted from net purchases of fixed maturity securities,
resulting from our investment of cash generated from operating activities, and the redeployment of liquidity that had
been accumulated by the insurance companies in 2009.
Financing Cash Flow Activities..............................................................................................................................................................................................
Net cash used in financing activities during 2012 includes the following activities:
• $8.6 billion pay down of the Department of the Treasury’s AIA SPV Preferred Interests; and
• total payments of approximately $13.0 billion for the purchase of approximately 421 million shares of AIG Common
Stock.
Net cash used in financing activities for 2011 primarily resulted from the repayment of the FRBNY Credit Facility and
the $12.4 billion partial repayment of the AIA SPV Preferred Interests and the ALICO SPV in connection with the
Recapitalization and use of proceeds received from the sales of foreign life insurance entities in 2011.
Net cash used in financing activities in 2010 reflected declines in policyholder contract withdrawals, due to improved
conditions for the life insurance and retirement services businesses. This was partially offset by the issuance of
long-term debt.
Liquidity and Capital Resources of AIG Parent and Subsidiaries..............................................................................................................................................................................................
AIG Parent..............................................................................................................................................................................................
As of December 31, 2012, AIG Parent had $16.1 billion in liquidity resources. AIG Parent’s primary sources of
liquidity are dividends, distributions, and other payments from subsidiaries, as well as credit and contingent liquidity
facilities. AIG Parent’s primary uses of liquidity are for debt service, capital management, operating expenses and
subsidiary capital needs.
AIG Parent’s primary sources of capital are dividends and distributions from subsidiaries. AIG Parent has
unconditional capital maintenance agreements (CMAs) in place with certain AIG Property Casualty and AIG Life and
Retirement subsidiaries to facilitate the transfer of capital and liquidity within the consolidated company. We expect
these CMAs to continue to enhance AIG’s capital management practices, and help manage the flow of capital
between AIG Parent and these subsidiaries. We have entered into and expect to enter into additional CMAs with
certain other insurance companies in 2013. See AIG Property Casualty and AIG Life and Retirement below for
additional information. Nevertheless, regulatory and other legal restrictions could limit our ability to transfer capital
freely, either to or from our subsidiaries.
We believe that we have sufficient liquidity and capital resources to satisfy future requirements and meet our
obligations to policyholders, customers, creditors and debt-holders. We expect to access the debt markets from time
to time to meet funding requirements as needed.
..................................................................................................................................................................................................................................
AIG 2012 Form 10-K124
I T E M 7 / L I Q U I D I T Y A N D C A P I T A L R E S O U R C E S

.....................................................................................................................................................................................
The following table presents AIG Parent’s liquidity:
Cash and short-term investments(a)
Available capacity under Syndicated Credit Facility(b)
Available capacity under Contingent Liquidity Facility(c)
Total AIG Parent liquidity sources
(a) Includes reverse repurchase agreements totaling $8.9 billion, which are secured short term investments.
(b) AIG entered into an amended and restated syndicated bank credit facility on October 5, 2012. For additional information relating to this credit
facility, see Credit Facilities below.
(c) For additional information relating to the contingent liquidity facility, see Contingent Liquidity Facilities below.
Sources and Uses of Liquidity and Capital Resources of AIG Parent
Sources
During 2012, we:
• sold our entire interest of approximately 3.9 billion AIA ordinary shares for gross proceeds of approximately
$14.0 billion (excluding proceeds from the sale of AIA ordinary shares held by AIA SPV to an AIG Property
Casualty subsidiary);
• received approximately $8.5 billion in distributions from the FRBNY’s dispositions of ML III assets;
• collected approximately $5.2 billion in cash distributions from subsidiaries, including:
• approximately $2.9 billion in note repayments from AIG Life and Retirement subsidiaries funded by payments of
dividends from subsidiaries of which $1.6 billion represented proceeds from the FRBNY’s sale of ML II assets;
• approximately $1.5 billion in cash dividends from AIG Property Casualty;
• $400 million in dividends from the AIA SPV, representing the proceeds from the sale of shares of AIA held by
the AIA SPV to an AIG Property Casualty subsidiary;
• received non-cash dividends of approximately $1.0 billion in the form of municipal bonds from AIG Property
Casualty;
• issued $750 million principal amount of 3.000% Notes Due 2015 and $1.25 billion principal amount of 3.800%
Notes Due 2017. These proceeds were used to continue to reduce the risk of, and better match the assets and
liabilities in, the MIP (described more fully in Other Operations – Direct Investment Book below);
• issued $1.5 billion principal amount of 4.875% Notes Due 2022. These proceeds are being used for general
corporate purposes which are currently expected to include the repayment of debt maturing in 2013;
• issued $250 million principal amount of 2.375% Subordinated Notes Due 2015. Proceeds from this offering are
being used for general corporate purposes; and
• received approximately $1.0 billion that was released to AIG from an escrow that secures indemnifications pro-
vided to MetLife under the ALICO stock purchase agreement (see Note 16 to the Consolidated Financial State-
ments for additional information).
..................................................................................................................................................................................................................................
AIG 2012 Form 10-K 125
As of
(In millions) December 31, 2012
$ 12,586
3,037
500
$ 16,123
I T E M 7 / L I Q U I D I T Y A N D C A P I T A L R E S O U R C E S

.....................................................................................................................................................................................
Uses
During 2012, we:
• purchased an aggregate of approximately $13.0 billion of AIG Common Stock at the initial public offering price in
four registered public offerings of AIG Common Stock completed by the Department of the Treasury, as the
selling shareholder; we purchased approximately 421 million shares (see Note 17 to the Consolidated Financial
Statements for additional information on these offerings);
• retired $3.2 billion of debt, including $2.6 billion of MIP long-term debt, and made interest payments totaling
$2.1 billion;
• utilized approximately $1.6 billion in proceeds from the distributions from ML II, approximately $6.0 billion in gross
proceeds from the sale of AIA ordinary shares and existing funds from the MIP to pay down in full the liquidation
preference of the AIA SPV Preferred Interests and redeem the Department of the Treasury’s preferred participat-
ing return rights in the AIA SPV and the ALICO SPV; as a result, the following items, which had been held as
security to support the repayment of the AIA SPV Preferred Interests, were released from that pledge:
• the equity interests in ILFC,
• the ordinary shares of AIA held by the AIA SPV,
• the common equity interest in the AIA SPV held by us,
• our interests in ML III, and
• cash held in escrow to secure indemnifications provided to MetLife under the ALICO stock purchase agree-
ment.
• paid $550 million as a result of final approval of a settlement under the Consolidated 2004 Securities Litigation
(see Note 16 to the Consolidated Financial Statements for additional information); and
• made $1.2 billion in net capital contributions to subsidiaries, including a contribution of approximately $1.0 billion
to AIG Property Casualty in the aftermath of Storm Sandy.
AIG Property Casualty..............................................................................................................................................................................................
We expect that AIG Property Casualty subsidiaries will be able to continue to satisfy future liquidity requirements and
meet their obligations, including those arising from reasonably foreseeable contingencies or events, through cash
from operations and, to the extent necessary, asset dispositions. AIG Property Casualty subsidiaries maintain
substantial liquidity in the form of cash and short-term investments, totaling $8.6 billion as of December 31, 2012.
Further, AIG Property Casualty subsidiaries maintain significant levels of investment-grade fixed maturity securities,
including substantial holdings in government and corporate bonds, which could be monetized in the event liquidity
levels are deemed insufficient.
AIG Property Casualty paid cash and non-cash dividends totaling of $2.5 billion to AIG Parent in 2012, consisting of
cash and municipal bonds, including $902 million of cash dividends in the fourth quarter of 2012.
In December 2012, AIG Parent contributed $1.0 billion of capital to AIG Property Casualty U.S. insurance companies
to strengthen capital levels, as a result of the impact of Storm Sandy-related catastrophe losses.
AIG Parent could be required to provide additional funding to AIG Property Casualty subsidiaries to meet capital or
liquidity needs under certain circumstances, including:
• large catastrophes that may require AIG to provide additional support to the affected operations;
• downgrades in AIG’s credit ratings that could put pressure on the insurer financial strength ratings of AIG’s
subsidiaries which could result in non-renewals or cancellations by policyholders and adversely affect the
subsidiary’s ability to meet its own obligations;
..................................................................................................................................................................................................................................
AIG 2012 Form 10-K126
I T E M 7 / L I Q U I D I T Y A N D C A P I T A L R E S O U R C E S

.....................................................................................................................................................................................
• increases in market interest rates that may adversely affect the financial strength ratings of our subsidiaries, as
rating agency capital models may reduce the amount of available capital relative to required capital; and
• other potential events that could cause a liquidity strain, including economic collapse of a nation or region
significant to our operations, nationalization, catastrophic terrorist acts, pandemics or other events causing
economic or political upheaval.
In February 2012, AIG Parent, Chartis Inc. and certain AIG Property Casualty domestic insurance subsidiaries,
entered into a single CMA, which replaced the CMAs entered into in February 2011. Under the 2012 CMA, the total
adjusted capital and total authorized control level Risk-Based Capital (RBC) (as defined by National Association of
Insurance Commissioners (NAIC) guidelines and determined based on the subsidiaries’ statutory financial
statements) of these AIG Property Casualty insurance subsidiaries are measured as a group (the Fleet) rather than
on an individual company basis.
Among other things, the 2012 CMA provides that AIG Parent will maintain the total adjusted capital of the Fleet at or
above the specified minimum percentage of the Fleet’s projected total authorized control level RBC. As a result, the
2012 CMA provides that if the total adjusted capital of the Fleet falls below the specified minimum percentage of the
Fleet’s total authorized control level RBC, AIG Parent will contribute cash or other instruments admissible under
applicable regulations to Chartis Inc., which will further contribute such funds to the AIG Property Casualty
subsidiaries in the amount necessary to increase the Fleet’s total adjusted capital to a level at least equal to such
specified minimum percentage. Any required contribution under the 2012 CMA would generally be made during the
second and fourth quarters of each year; however, AIG Parent may also make contributions in such amounts and at
such times as it deems appropriate. In addition, the 2012 CMA provides that if the total adjusted capital of the Fleet
exceeds that same specified minimum percentage of the Fleet’s total authorized control level RBC, subject to board
approval, the AIG Property Casualty insurance subsidiaries would declare and pay ordinary dividends to their
respective equity holders up to an amount that is the lesser of:
(i) the amount (to be determined by Chartis Inc.) necessary to reduce the Fleet’s projected or actual total adjusted
capital to a level equal to or not materially greater than such specified minimum percentage or
(ii) the maximum amount of ordinary dividends permitted under applicable insurance law.
The 2012 CMA does not prohibit, however, the payment of extraordinary dividends, subject to board or regulatory
approval, to reduce the Fleet’s projected or actual total adjusted capital to a level equal to or not materially greater
than the specified minimum percentage. Any required dividend under the 2012 CMA would generally be made on a
quarterly basis. As structured, the 2012 CMA contemplates that the specified minimum percentage would be
reviewed and agreed upon at least annually.
For the years ended December 31, 2012 and 2011, AIG Parent received $2.3 billion and $1.3 billion, respectively, in
dividends from Chartis Inc. that were made pursuant to the CMAs then in place, and AIG Parent was not required to
make any capital contributions in either period pursuant to the CMAs then in place.
On February 20, 2013, the 2012 CMA was amended to exclude deferred tax assets from the calculation of total
adjusted capital. As a result, effective February 20, 2013, the specified minimum percentage decreased from
350 percent to 325 percent.
In March 2012, the National Union Fire Insurance Company of Pittsburgh, Pa. (NUFI), an AIG Property Casualty
company, became a member of the Federal Home Loan Bank (FHLB) of Pittsburgh. In August 2012, Chartis
Specialty Insurance Company (CSI), an AIG Property Casualty company, became a member of the FHLB of
Chicago. FHLB membership provides participants with access to various services, including access to low-cost
advances through pledging of certain mortgage-backed securities, government and agency securities and other
qualifying assets. These advances may be used to provide an additional source of liquidity for balance sheet
management or contingency funding purposes. As of December 31, 2012, neither NUFI nor CSI had any advances
outstanding under their respective FHLB facilities.
..................................................................................................................................................................................................................................
AIG 2012 Form 10-K 127
I T E M 7 / L I Q U I D I T Y A N D C A P I T A L R E S O U R C E S

.....................................................................................................................................................................................
AIG Life and Retirement..............................................................................................................................................................................................
We believe that AIG Life and Retirement subsidiaries have liquidity sources adequate to satisfy future liquidityrequirements and meet their obligations, including those arising from reasonably foreseeable contingencies or events,
through cash from operations and, to the extent necessary, asset dispositions. The AIG Life and Retirementsubsidiaries maintain liquidity in the form of cash and short-term investments, totaling $7.8 billion as of December 31,2012. In 2012, AIG Life and Retirement provided $2.9 billion of liquidity to AIG Parent through note repayments
funded by the payment of dividends from insurance subsidiaries. These payments included a $1.6 billion distributionrelating to the liquidation of ML II and a distribution of $440 million in the form of a note repayment.
The need to fund product surrenders, withdrawals and maturities creates a significant potential liquidity requirement
for AIG Life and Retirement’s subsidiaries. We believe that because of the size and liquidity of our investmentportfolios, AIG Life and Retirement does not face a significant liquidity risk due to normal deviations from projectedclaim or surrender experience. As part of its risk management framework, AIG Life and Retirement continues to
evaluate programs, including securities lending programs and other secured financings, to improve its liquidityposition and facilitate AIG Life and Retirement’s ability to maintain a fully invested asset portfolio.
During 2012, AIG Life and Retirement began utilizing programs that lend securities from its investment portfolio to
supplement liquidity or for other uses as deemed appropriate by management. Under these programs, the AIG Lifeand Retirement subsidiaries lend securities to financial institutions and receive collateral equal to 102 percent of thefair value of the loaned securities. Reinvestment of cash collateral received is restricted to highly liquid short-term
investments. AIG Life and Retirement’s liability to the borrower for collateral received was $3.1 billion as ofDecember 31, 2012. In addition, in 2011, certain AIG Life and Retirement insurance subsidiaries became membersof the FHLBs in their respective districts. As of December 31, 2012, AIG Life and Retirement had outstanding
borrowings of $82 million from the FHLBs.
In March 2011, AIG Parent entered into CMAs with certain AIG Life and Retirement insurance subsidiaries. Amongother things, the CMAs provide that AIG Parent will maintain the total adjusted capital of each of these AIG Life and
Retirement insurance subsidiaries at or above a specified minimum percentage of the subsidiary’s projectedCompany Action Level RBC. As a result, the CMAs provide that if the total adjusted capital of these AIG Life andRetirement insurance subsidiaries falls below the specified minimum percentage of their respective Company Action
Level RBC, AIG Parent will contribute cash or instruments admissible under applicable regulations to these AIG Lifeand Retirement insurance subsidiaries in the amount necessary to increase total adjusted capital to a level at leastequal to such specified minimum percentage. Any required contribution under the CMAs would generally be made
during the second and fourth quarters of each year; however, AIG Parent may also make contributions in suchamounts and at such times as it deems appropriate.
In addition, the CMAs provide that if the total adjusted capital of these AIG Life and Retirement insurance
subsidiaries is in excess of that same specified minimum percentage of their respective total company action levelRBC, subject to board approval, the subsidiaries would declare and pay ordinary dividends to their respective equityholders up to an amount that is the lesser of:
• (i) the amount necessary to reduce projected or actual total adjusted capital to a level equal to or not materiallygreater than such specified minimum percentage or
• (ii) the maximum amount of ordinary dividends permitted under applicable insurance law.
The CMAs do not prohibit, however, the payment of extraordinary dividends, subject to board and regulatoryapproval, to reduce projected or actual total adjusted capital to a level equal to or not materially greater than thespecified minimum percentage. Any required dividend under the CMAs would generally be made on a quarterly
basis. As structured, the CMAs contemplate that the specified minimum percentage would be reviewed and agreedupon at least annually. As a result of a reduction in rating agency minimum requirements and greater capitalefficiency arising from the consolidation of legal entities, the specified minimum percentage decreased from
435 percent to 385 percent effective February 19, 2013, except for the CMA with AGC Life Insurance Company,where the specified minimum percentage remained at 250 percent.
For the years ended December 31, 2012 and 2011, AIG Parent received a total of approximately $2.9 billion and
$1.4 billion, respectively, in distributions from AIG Life and Retirement subsidiaries in the form of note repaymentsfunded by the payment of dividends from these subsidiaries, which were made under the CMAs. AIG Parent was notrequired to make any capital contributions to AIG Life and Retirement subsidiaries in either period under the CMAsthen in place.
..................................................................................................................................................................................................................................
AIG 2012 Form 10-K128
I T E M 7 / L I Q U I D I T Y A N D C A P I T A L R E S O U R C E S

.....................................................................................................................................................................................
Other Operations..............................................................................................................................................................................................
Mortgage Guaranty..............................................................................................................................................................................................
We currently expect that our Mortgage Guaranty subsidiaries will be able to continue to satisfy future liquidity
requirements and meet their obligations, including requirements arising out of reasonably foreseeable contingencies
or events, through cash from operations and, to the extent necessary, asset dispositions. Mortgage Guaranty
subsidiaries maintain substantial liquidity in the form of cash and short-term investments, totaling $699 million as of
December 31, 2012. Mortgage Guaranty businesses also maintain significant levels of investment-grade fixed
maturity securities, which could be monetized in the event liquidity levels are insufficient to meet obligations. These
securities included substantial holdings in municipal and corporate bonds totaling $3.5 billion at December 31, 2012.
Global Capital Markets..............................................................................................................................................................................................
GCM acts as the derivatives intermediary between AIG and its subsidiaries and third parties to provide hedging
services. It executes its derivative trades under International Swaps and Derivatives Association, Inc. (ISDA)
agreements. The agreements with third parties typically require collateral postings. Many of GCM’s transactions with
AIG and its subsidiaries also include collateral posting requirements. However, generally, no collateral is called under
these contracts unless it is needed to satisfy posting requirements with third parties. Most of GCM’s CDS are subject
to collateral posting provisions. These provisions differ among counterparties and asset classes. The amount of
future collateral posting requirements is a function of our credit ratings, the rating of the reference obligations and the
market value of the relevant reference obligations, with the latter being the most significant factor. We estimate the
amount of potential future collateral postings associated with the super senior CDS using various methodologies. The
contingent liquidity requirements associated with such potential future collateral postings are incorporated into our
liquidity planning assumptions.
As of December 31, 2012 and December 31, 2011, respectively, GCM had total assets of $8.0 billion and $9.6 billion
and total liabilities of $4.9 billion and $5.8 billion. GCM’s assets consist primarily of cash, short-term investments,
other receivables, net of allowance, and unrealized gains on swaps, options and forwards. GCM’s liabilities consist
primarily of trade payables and unrealized losses on swaps, options and forwards. Collateral posted included in GCM
to third parties was $4.2 billion and $5.1 billion at December 31, 2012 and December 31, 2011, respectively.
Collateral obtained included in GCM from third parties was $846 million and $1.2 billion at December 31, 2012 and
December 31, 2011, respectively. The collateral amounts reflect counterparty netting adjustments available under
master netting agreements and are inclusive of collateral that exceeded the fair value of derivatives as of the
reporting date.
Direct Investment Book..............................................................................................................................................................................................
The DIB is managed so that it maintains the liquidity that we believe is necessary to meet all of the DIB liabilities as
they come due, even under stress scenarios, without having to liquidate DIB assets or rely on additional liquidity from
AIG Parent. If the DIB’s risk target is breached, we expect to take appropriate actions to increase the DIB’s liquidity
sources or reduce liquidity requirements to maintain the risk target, although no assurance can be given that this can
be achieved under then-prevailing market conditions. Any additional liquidity shortfalls would need to be funded by
AIG Parent.
The DIB’s assets consist primarily of cash, short term investments, fixed maturity securities issued by U.S.
government and government sponsored entities, mortgage and asset backed securities and, to a lesser extent, bank
loans and mortgage loans. The DIB’s liabilities consist primarily of notes and other borrowings supported by assets
as well as other short-term financing obligations. As of December 31, 2012 and December 31, 2011, respectively, the
DIB had total assets of $28.5 billion and $31.0 billion and total liabilities of $23.8 billion and $28.2 billion.
The overall hedging activity for the assets and liabilities of the DIB is executed by GCM. The value of hedges related
to the non-derivative assets and liabilities of AIGFP in the DIB is included within the assets and liabilities and
operating results of GCM and are not included within the DIB operating results, assets or liabilities.
..................................................................................................................................................................................................................................
AIG 2012 Form 10-K 129
I T E M 7 / L I Q U I D I T Y A N D C A P I T A L R E S O U R C E S

.....................................................................................................................................................................................
Collateral posted by operations included in the DIB to third parties was $4.3 billion and $5.1 billion at December 31,
2012 and December 31, 2011, respectively. This collateral primarily consists of securities of the U.S. government and
government sponsored entities and generally cannot be repledged or resold by the counterparties.
The following summarizes significant liquidity events during 2012:
• The DIB used current program liquidity to pay down $6.6 billion in debt. In addition, in the first quarter of 2012, AIG
issued $2.0 billion aggregate principal amount of unsecured notes, consisting of $750 million principal amount of
3.000% Notes Due 2015 and $1.25 billion principal amount of 3.800% Notes Due 2017. The proceeds from the
sale of these notes were used to reduce overall risk and better match the assets and liabilities in the MIP. The
notes are included within MIP notes payable in the debt outstanding table in ‘‘Debt – Debt Maturities’’ below.
• AIG Parent allocated cash from the MIP to pay down the AIA SPV Preferred Interests. In exchange, AIG’s
remaining interest in ML III and the future proceeds from the cash held in escrow to secure indemnities provided to
MetLife were allocated to the MIP.
• The DIB received approximately $8.5 billion in distributions from the FRBNY’s auctions of ML III assets.
Credit Facilities..............................................................................................................................................................................................
We maintain a committed revolving four-year syndicated credit facility (the Four-Year Facility) as a potential
source of liquidity for general corporate purposes. The Four-Year Facility also provides for the issuance of letters
of credit. We currently expect to replace or extend the Four-Year Facility on or prior to its expiration in October 2016,
although no assurance can be given that the Four-Year Facility will be replaced on favorable terms or at all.
The Four-Year Facility provides for $4.0 billion of unsecured revolving loans, which includes a $2.0 billion letter of
credit sublimit. Our ability to borrow under the Four-Year Facility is not contingent on our credit ratings. However, our
ability to borrow under the Four-Year Facility is conditioned on the satisfaction of certain legal, operating,
administrative and financial covenants and other requirements contained in the Four-Year Facility. These include
covenants relating to our maintenance of a specified total consolidated net worth and total consolidated debt to total
consolidated capitalization. Failure to satisfy these and other requirements contained in the Four-Year Facility would
restrict our access to the Four-Year Facility and could have a material adverse effect on our financial condition,
results of operations and liquidity.
See Note 15 to the Consolidated Financial Statements for further discussion of the Four-Year Facility.
Contingent Liquidity Facilities..............................................................................................................................................................................................
AIG Parent has access to a contingent liquidity facility of up to $500 million as a potential source of liquidity for
general corporate purposes. Under this facility, we have the unconditional right, prior to December 15, 2015, to issue
up to $500 million in senior debt to the counterparty, based on a put option agreement between AIG Parent and the
counterparty.
Our ability to borrow under this facility is not contingent on our credit ratings.
..................................................................................................................................................................................................................................
AIG 2012 Form 10-K130
I T E M 7 / L I Q U I D I T Y A N D C A P I T A L R E S O U R C E S

.....................................................................................................................................................................................
Contractual Obligations..............................................................................................................................................................................................
The following table summarizes contractual obligations in total, and by remaining maturity:
Payments due by PeriodDecember 31, 2012
Total 2014 - 2016 -(in millions) Payments 2013 2015 2017 Thereafter
Insurance operationsLoss reserves $ 91,237 $ 23,579 $ 26,111 $ 13,480 $ 28,067Insurance and investment contract liabilities 234,492 14,502 25,144 24,066 170,780Borrowings 1,843 43 15 8 1,777Interest payments on borrowings 3,525 131 264 265 2,865Operating leases 1,196 284 390 276 246Other long-term obligations 37 9 14 8 6
Total $ 332,330 $ 38,548 $ 51,938 $ 38,103 $ 203,741
Other and discontinued operationsBorrowings(a) 69,166 7,199 11,670 16,104 34,193Interest payments on borrowings 48,478 3,873 6,931 5,525 32,149Operating leases 302 106 99 33 64Aircraft purchase commitments 17,511 1,517 4,146 7,374 4,474Other long-term obligations 231 56 84 – 91
Total $ 135,688 $ 12,751 $ 22,930 $ 29,036 $ 70,971
ConsolidatedLoss reserves(b) $ 91,237 $ 23,579 $ 26,111 $ 13,480 $ 28,067Insurance and investment contract liabilities 234,492 14,502 25,144 24,066 170,780Borrowings(a) 71,009 7,242 11,685 16,112 35,970Interest payments on borrowings 52,003 4,004 7,195 5,790 35,014Operating leases 1,498 390 489 309 310Aircraft purchase commitments 17,511 1,517 4,146 7,374 4,474Other long-term obligations(c) 268 65 98 8 97
Total(d) $ 468,018 $ 51,299 $ 74,868 $ 67,139 $ 274,712
(a) Includes $24.3 billion of borrowings related to ILFC
(b) Loss reserves relate to the AIG Property Casualty and the Mortgage Guaranty business, and represent future loss and loss adjustmentexpense payments estimated based on historical loss development payment patterns. Due to the significance of the assumptions used, the
payments by period presented above could be materially different from actual required payments. We believe that the AIG Property Casualty and
Mortgage Guaranty subsidiaries maintain adequate financial resources to meet the actual required payments under these obligations.
(c) Primarily includes contracts to purchase future services and other capital expenditures.
(d) Does not reflect unrecognized tax benefits of $4.4 billion ($4.1 billion excluding Aircraft Leasing), the timing of which is uncertain. In addition,
the majority of our credit default swaps require us to provide credit protection on a designated portfolio of loans or debt securities. At December 31,2012, the fair value derivative liability was $1.9 billion, relating to the super senior multi-sector CDO credit default swap portfolio. At December 31,
2012, collateral posted with respect to these swaps was $1.6 billion.
Insurance and Investment Contract Liabilities..............................................................................................................................................................................................
Insurance and investment contract liabilities, including GIC liabilities, relate to AIG Life and Retirement
businesses. These liabilities include various investment-type products with contractually scheduled maturities,
including periodic payments of a term certain nature. These liabilities also include benefit and claim liabilities, of
which a significant portion represents policies and contracts that do not have stated contractual maturity dates and
may not result in any future payment obligations. For these policies and contracts (i) we are currently not making
payments until the occurrence of an insurable event, such as death or disability, (ii) payments are conditional on
survivorship or (iii) payment may occur due to a surrender or other non-scheduled event out of our control.
We have made significant assumptions to determine the estimated undiscounted cash flows of these contractual
policy benefits. These assumptions include mortality, morbidity, future lapse rates, expenses, investment returns and
interest crediting rates, offset by expected future deposits and premiums on in-force policies. Due to the significanceof the assumptions, the periodic amounts presented could be materially different from actual required payments. The
..................................................................................................................................................................................................................................
AIG 2012 Form 10-K 131
I T E M 7 / L I Q U I D I T Y A N D C A P I T A L R E S O U R C E S

.....................................................................................................................................................................................
amounts presented in this table are undiscounted and exceed the future policy benefits and policyholder contract
deposits included in the Consolidated Balance Sheet.
We believe that AIG Life and Retirement subsidiaries have adequate financial resources to meet the payments
actually required under these obligations. These subsidiaries have substantial liquidity in the form of cash and
short-term investments. In addition, AIG Life and Retirement businesses maintain significant levels of investment-
grade fixed income securities, including substantial holdings in government and corporate bonds, and could seek to
monetize those holdings in the event operating cash flows are insufficient. We expect liquidity needs related to GIC
liabilities to be funded through cash flows generated from maturities and sales of invested assets.
Borrowings..............................................................................................................................................................................................
Our borrowings exclude those incurred by consolidated investments and include hybrid financial instrument liabilities
recorded at fair value. We expect to repay the long-term debt maturities and interest accrued on borrowings by AIG
and its subsidiaries through maturing investments and asset sales, future cash flows from operations, cash flows
generated from invested assets, future debt issuance and other financing arrangements.
..................................................................................................................................................................................................................................
AIG 2012 Form 10-K132
I T E M 7 / L I Q U I D I T Y A N D C A P I T A L R E S O U R C E S

.....................................................................................................................................................................................
Off-Balance Sheet Arrangements and Commercial Commitments..............................................................................................................................................................................................
The following table summarizes Off-Balance Sheet Arrangements and Commercial Commitments in total, and
by remaining maturity:
Amount of Commitment ExpiringDecember 31, 2012
Total Amounts 2014 - 2016 -(in millions) Committed 2013 2015 2017 Thereafter
Insurance operationsGuarantees:
Standby letters of credit 802 – – 725 77Guarantees of indebtedness 178 – – – 178All other guarantees(b) 16 7 7 – 2
Commitments:Investment commitments(c) 1,861 1,459 204 198 –Commitments to extend credit 234 192 41 – 1Letters of credit 10 10 – – –Other commercial commitments(d) 688 – – – 688
Total(e) $ 3,789 $ 1,668 $ 252 $ 923 $ 946
Other and discontinued operationsGuarantees:
Liquidity facilities(a) $ 101 $ – $ – $ – $ 101Standby letters of credit 307 299 6 1 1All other guarantees(b) 407 171 35 109 92
Commitments:Investment commitments(c) 396 302 70 25 (1)Commitments to extend credit 72 70 4 – (2)Letters of credit 16 16 – – –Other commercial commitments(d) 17 16 2 – (1)
Total(e)(f) $ 1,316 $ 874 $ 117 $ 135 $ 190
ConsolidatedGuarantees:
Liquidity facilities(a) $ 101 $ – $ – $ – $ 101Standby letters of credit 1,109 299 6 726 78Guarantees of indebtedness 178 – – – 178All other guarantees(b) 423 178 42 109 94
Commitments:Investment commitments(c) 2,257 1,761 274 223 (1)Commitments to extend credit 306 262 45 – (1)Letters of credit 26 26 – – –Other commercial commitments(d) 705 16 2 – 687
Total(e)(f) $ 5,105 $ 2,542 $ 369 $ 1,058 $ 1,136
(a) Primarily represents liquidity facilities provided in connection with certain municipal swap transactions and collateralized bond obligations.
(b) Includes residual value guarantees associated with aircraft and AIG Life and Retirement construction guarantees connected to affordablehousing investments. Excludes potential amounts for indemnification obligations included in asset sales agreements. See Note 16 to the
Consolidated Financial Statements for further information on indemnification obligations. .
(c) Includes commitments to invest in private equity, hedge funds and mutual funds and commitments to purchase and develop real estate in the
United States and abroad. The commitments to invest in private equity funds, hedge funds and other funds are called at the discretion of each fund,as needed for funding new investments or expenses of the fund. The expiration of these commitments is estimated in the table above based on the
expected life cycle of the related fund, consistent with past trends of requirements for funding. Investors under these commitments are primarilyinsurance and real estate subsidiaries.
(d) Excludes commitments with respect to pension plans. The annual pension contribution for 2013 is expected to be approximately $100 million
for U.S. and non-U.S. plans.
(e) Does not include guarantees, capital maintenance agreements or other support arrangements among AIG consolidated entities.
(f) Includes $340 million attributable to ILFC, which is reported as discontinued operations.
..................................................................................................................................................................................................................................
AIG 2012 Form 10-K 133
I T E M 7 / L I Q U I D I T Y A N D C A P I T A L R E S O U R C E S

.....................................................................................................................................................................................
Securities Financing..............................................................................................................................................................................................
At December 31, 2012, there were no securities transferred under repurchase agreements accounted for as sales
and no related cash collateral obtained. See Note 2 to the Consolidated Financial Statements for additional
information on the modification of the criteria for determining whether securities transferred under repurchase
agreements are accounted for as sales.
Arrangements with Variable Interest Entities..............................................................................................................................................................................................
While AIG enters into various arrangements with variable interest entities (VIEs) in the normal course of business,
our involvement with VIEs is primarily as a passive investor in fixed maturity securities (rated and unrated) and equity
interests issued by VIEs. We consolidate a VIE when we are the primary beneficiary of the entity. For a further
discussion of our involvement with VIEs, see Note 11 to the Consolidated Financial Statements.
Indemnification Agreements..............................................................................................................................................................................................
We are subject to financial guarantees and indemnity arrangements in connection with our sales of businesses.
These arrangements may be triggered by declines in asset values, specified business contingencies, the realization
of contingent liabilities, litigation developments, or breaches of representations, warranties or covenants provided by
us. These arrangements are typically subject to time limitations, defined by the contract or by operation of law, such
as by prevailing statutes of limitation. Depending on the specific terms of the arrangements, the maximum potential
obligation may or may not be subject to contractual limitations. For additional information regarding our
indemnification agreements, see Note 16 to the Consolidated Financial Statements.
We have recorded liabilities for certain of these arrangements where it is possible to estimate them. These liabilities
are not material in the aggregate. We are unable to develop a reasonable estimate of the maximum potential payout
under some of these arrangements. Overall, we believe that it is unlikely we will have to make any material
payments related to completed sales under these arrangements.
..................................................................................................................................................................................................................................
AIG 2012 Form 10-K134
I T E M 7 / L I Q U I D I T Y A N D C A P I T A L R E S O U R C E S

.....................................................................................................................................................................................
Debt..............................................................................................................................................................................................
The following table provides the rollforward of AIG’s total debt outstanding:
ReclassifiedtoYear Ended
Balance at Maturities Effect of Activity of Liabilities of Balance atDecember 31, 2012December 31, and Foreign Other Discontinued businesses December 31,
(in millions) 2011 Issuances Repayments Exchange Changes Operations(a) held for sale 2012
Debt issued orguaranteed by AIG:
AIG general borrowings:Notes and bonds
payable $ 12,725 $ 1,508 $ (244) $ 96 $ (1) $ – $ – $ 14,084Subordinated debt – 250 – – – – – 250Junior subordinated
debt 9,327 – – 91 (2) – – 9,416Loans and mortgages
payable 234 – (145) (14) 4 – – 79SunAmerica Financial
Group, Inc. notes andbonds payable 298 – – – – – – 298
Liabilities connected totrust preferred stock 1,339 – – – – – – 1,339
Total AIG generalborrowings 23,923 1,758 (389) 173 1 – – 25,466
AIG borrowings supportedby assets:(b)
MIP notes payable 10,147 1,996 (2,618) (143) (86) – – 9,296Series AIGFP matched
notes and bondspayable 3,807 – (234) – (29) – – 3,544
GIAs, at fair value 7,964 591 (2,009) – (45) – – 6,501Notes and bonds
payable, at fair value 2,316 17 (1,498) – 719 – – 1,554Loans and mortgages
payable, at fair value 486 – (488) – 2 – – –
Total AIG borrowingssupported by assets 24,720 2,604 (6,847) (143) 561 – – 20,895
Total debt issued orguaranteed by AIG 48,643 4,362 (7,236) 30 562 – – 46,361
Debt not guaranteed byAIG:
ILFC:Notes and bonds
payable, ECA facility,bank financings andother securedfinancings 23,365 – – – – (42) (23,323) –
Junior subordinateddebt 999 – – – – – (999) –
Total ILFC debt 24,364 – – – – (42) (24,322) –
Other subsidiaries notes,bonds, loans andmortgages payable 393 101 (164) (2) (3) – – 325
Debt of consolidatedinvestments 1,853 381 (263) 32 (189) – – 1,814
Total debt not guaranteedby AIG 26,610 482 (427) 30 (192) (42) (24,322) 2,139
Total debt $ 75,253 $ 4,844 $ (7,663) $ 60 $ 370 (42) (24,322) $ 48,500
(a) Primarily represents activity related to ILFC.
(b) AIG Parent guarantees all DIB debt, except for MIP notes payable and Series AIGFP matched notes and bonds payable, which are direct
obligations of AIG Parent.
..................................................................................................................................................................................................................................
AIG 2012 Form 10-K 135
I T E M 7 / L I Q U I D I T Y A N D C A P I T A L R E S O U R C E S

.....................................................................................................................................................................................
Debt Maturities – AIG and Subsidiaries..............................................................................................................................................................................................
The following table summarizes maturing debt at December 31, 2012 of AIG and its subsidiaries for the next
four quarters:
First Second Third Fourth
Quarter Quarter Quarter Quarter
(in millions) 2013 2013 2013 2013 Total
AIG general borrowings $ 75 $ 1,000 $ 2 $ 469 $ 1,546
AIG borrowings supported by assets 483 222 819 76 1,600
Other subsidiaries notes, bonds, loans and mortgages payable 35 6 1 1 43
Total $ 593 $ 1,228 $ 822 $ 546 $ 3,189
AIG borrowings supported by assets consisted of debt under the DIB. At December 31, 2012, all of the debt
maturities in the DIB through December 31, 2013 are supported by short-term investments and maturing investments.
See Note 15 to the Consolidated Financial Statements for additional details for debt outstanding.
Credit Ratings..............................................................................................................................................................................................
Credit ratings estimate a company’s ability to meet its obligations and may directly affect the cost and
availability to that company of financing. The following table presents the credit ratings of AIG and certain of its
subsidiaries as of February 13, 2013. Figures in parentheses indicate the relative ranking of the ratings within the
agency’s rating categories; that ranking refers only to the major rating category and not to the modifiers assigned by
the rating agencies.
Short-Term Debt Senior Long-Term Debt
Moody’s S&P Moody’s(a) S&P(b) Fitch(c)
AIG P-2 (2nd of 3) A-2 (2nd of 8) Baa 1 (4th of 9) A- (3rd of 8) BBB (4th of 9)
Stable Outlook Stable Outlook Negative Outlook Stable Outlook
AIG Financial Products Corp.(d) P-2 A-2 Baa 1 A- –
Stable Outlook Stable Outlook Negative Outlook
AIG Funding, Inc.(d) P-2 A-2 – – –
Stable Outlook
(a) Moody’s appends numerical modifiers 1, 2 and 3 to the generic rating categories to show relative position within the rating categories.
(b) S&P ratings may be modified by the addition of a plus or minus sign to show relative standing within the major rating categories.
(c) Fitch ratings may be modified by the addition of a plus or minus sign to show relative standing within the major rating categories.
(d) AIG guarantees all obligations of AIG Financial Products Corp. and AIG Funding, Inc.
These credit ratings are current opinions of the rating agencies. They may be changed, suspended or withdrawn at
any time by the rating agencies as a result of changes in, or unavailability of, information or based on other
circumstances. Ratings may also be withdrawn at our request.
We are party to some agreements that contain ‘‘ratings triggers’’. Depending on the ratings maintained by one or
more rating agencies, these triggers could result in (i) the termination or limitation of credit availability or require
accelerated repayment, (ii) the termination of business contracts or (iii) requirement to post collateral for the benefit
of counterparties.
In the event of adverse actions on our long-term debt ratings by the major rating agencies, AIGFP would be required
to post additional collateral under some derivative transactions, or to permit termination of the transactions. Such
transactions could adversely affect our business, our consolidated results of operations in a reporting period or our
liquidity. In the event of a further downgrade of AIG’s long-term senior debt ratings, AIGFP would be required to post
additional collateral, and certain of AIGFP’s counterparties would be permitted to terminate their contracts early.
..................................................................................................................................................................................................................................
AIG 2012 Form 10-K136
I T E M 7 / L I Q U I D I T Y A N D C A P I T A L R E S O U R C E S

.....................................................................................................................................................................................
The actual amount of collateral that we would be required to post to counterparties in the event of such downgrades,
or the aggregate amount of payments that we could be required to make, depend on market conditions, the fair
value of outstanding affected transactions and other factors prevailing at the time of the downgrade.
For a discussion of the effects of downgrades in the financial strength ratings of our insurance companies or our
credit ratings, see Note 12 to the Consolidated Financial Statements and Part I, Item 1A. Risk Factors.
Regulation and Supervision..............................................................................................................................................................................................
We are currently regulated by the Board of Governors of the Federal Reserve System (FRB) and subject to its
examination, supervision and enforcement authority and reporting requirements as a savings and loan holding
company (SLHC). In addition, under Dodd-Frank we may separately become subject to the examination, enforcement
and supervisory authority of the FRB. In October 2012, we received a notice that we are under consideration by the
Financial Stability Oversight Council created by Dodd-Frank for a proposed determination that we are a systemically
important financial institution (SIFI). Changes mandated by Dodd-Frank include directing the FRB to promulgate
minimum capital requirements for both SLHCs and SIFIs. See Item 1. Business – Regulation and Item 1A. Risk
Factors – Regulation for further information.
Our insurance subsidiaries are subject to regulation and supervision by the states and jurisdictions in which they do
business. In the United States, the NAIC has developed RBC Model Law requirements. The RBC formula is
designed to measure the adequacy of an insurer’s statutory surplus in relation to the risks inherent in its business.
The statutory surplus of each of our U.S.-based life and property and casualty insurance subsidiaries exceeded
minimum required RBC levels as of December 31, 2012. Our foreign insurance operations are individually subject to
local solvency margin requirements that require maintenance of adequate capitalization. We comply with these
requirements in each country.
To the extent that any of our insurance entities were to fall below prescribed levels of statutory surplus, it would be
our intention to provide appropriate capital or other types of support to that entity, under formal support agreements,
CMAs or otherwise. For additional details regarding CMAs that we have entered into with our insurance subsidiaries,
see Liquidity and Capital Resources of AIG Parent and Subsidiaries – AIG Property Casualty and Liquidity and
Capital Resources of AIG Parent and Subsidiaries – AIG Life and Retirement.
Dividend Restrictions..............................................................................................................................................................................................
Payment of future dividends to our shareholders depends in part on the regulatory framework that will ultimately be
applicable to us, including our status as an SLHC under Dodd-Frank and whether we are determined to be a SIFI.
See Note 17 to the Consolidated Financial Statements for additional discussion of potential restrictions on dividend
payments to common shareholders.
Dividend payments to AIG Parent by our insurance subsidiaries are subject to certain restrictions imposed by
regulatory authorities. With respect to our domestic insurance subsidiaries, the payment of any dividend requires
formal notice to the insurance department in which the particular insurance subsidiary is domiciled. Foreign
jurisdictions may restrict the ability of our foreign insurance subsidiaries to pay dividends, which may also have
unfavorable income tax consequences. There are also various local restrictions limiting cash loans and advances to
AIG Parent by our subsidiaries. See Note 20 to the Consolidated Financial Statements for additional discussion of
restrictions on payments of dividends by AIG and its subsidiaries.
..................................................................................................................................................................................................................................
AIG 2012 Form 10-K 137
I T E M 7 / L I Q U I D I T Y A N D C A P I T A L R E S O U R C E S

.....................................................................................................................................................................................
Investments
OVERVIEW..............................................................................................................................................................................................
Our investment strategies are tailored to the specific business needs of each operating unit. The investment
objectives are driven by the business model for each of the businesses: AIG Property Casualty, AIG Life and
Retirement, and the Direct Investment book. The primary objectives are generation of investment income,
preservation of capital, liquidity management and growth of surplus to support the insurance products. The majority
of assets backing our insurance liabilities consist of intermediate and long duration fixed maturity securities.
Market Conditions..............................................................................................................................................................................................
Our investments and investment strategies were affected by the following conditions in 2012:
• Central banks initiated actions intended to improve weakening economic conditions, including the European Central
Bank’s commitment to further bond purchases and the U.S. Federal Reserve’s commitment to maintain the Federal
Funds Rate in the zero to a quarter percent range. The Federal Reserve also committed to support the mortgage
market via purchases of agency mortgage-backed securities, and extended ‘‘Operation Twist’’, a program of
redeeming short-term U.S. Treasury securities and using the proceeds to buy longer-term U.S. Treasury securities
with the objective of putting downward pressure on longer-term interest rates.
• Equity markets experienced positive returns.
• Bond yields remained low in the U.S., as evidenced by the 10-year U.S. Treasury rate ending the year at
1.76 percent.
• The U.S. dollar weakened during the year by 2 percent and 5 percent versus the Euro and British pound,
respectively, and strengthened 13 percent versus the Yen.
Investment Strategies..............................................................................................................................................................................................
At the local operating unit level, investment strategies are based on considerations that include the local market,
general market conditions, liability duration and cash flow characteristics, rating agency and regulatory capital
considerations, legal investment limitations, tax optimization and diversification.
• In the case of life insurance and retirement services companies, as well as in the DIB, our fundamental investment
strategy is to match the duration characteristics of the liabilities with assets of comparable duration, to the extent
practicable.
• Fixed maturity securities held by the domestic insurance companies included in AIG Property Casualty historically
have consisted primarily of laddered holdings of tax-exempt municipal bonds, which provided attractive after-tax
returns and limited credit risk. To meet the current risk-return and tax objectives of AIG Property Casualty, cash
flows from the investment portfolio and insurance operations are generally being reinvested by the domestic
property and casualty companies in taxable instruments which meet the companies’ liquidity, duration and credit
quality objectives as well as current risk-return and tax objectives.
• Outside of the U.S., fixed maturity securities held by AIG Property Casualty companies consist primarily of
intermediate duration high-grade securities generally denominated in the currencies of the countries in which we
operate.
Investment Highlights..............................................................................................................................................................................................
The following is an overview of investment activities during 2012:
• Purchases of corporate debt securities continued to be the largest asset allocation of new investments.
..................................................................................................................................................................................................................................
AIG 2012 Form 10-K138
I T E M 7 / I N V E S T M E N T S

.....................................................................................................................................................................................
• We continued to make risk-weighted opportunistic investments in RMBS and other structured securities to improve
yields and increase net investment income.
• We purchased an aggregate of $7.1 billion of CDOs sold in the FRBNY auctions of ML III assets, and elected fair
value option accounting treatment on those assets.
• Blended investment yields on new AIG Life and Retirement investments were lower than blended rates on
investments that were sold, matured or called. Base yields at AIG Property Casualty benefited from blended yields
on new investments that were higher than the yields on investments that were sold, matured or called.
• A continued low interest rate environment and narrowing spreads in many fixed income asset classes contributed
to unrealized gains in the investment portfolio.
• Other-than-temporary-impairments on structured securities decreased from 2011.
• We disposed of our remaining interest in AIA, and our position in ML III was liquidated.
Credit Ratings..............................................................................................................................................................................................
At December 31, 2012, approximately 88 percent of fixed maturity securities were held by our domestic entities.
Approximately 17 percent of such securities were rated AAA by one or more of the principal rating agencies, and
approximately 15 percent were rated below investment grade or not rated. Our investment decision process relies
primarily on internally generated fundamental analysis and internal risk ratings. Third-party rating services’ ratings
and opinions provide one source of independent perspective for consideration in the internal analysis.
A significant portion of our foreign entities’ fixed maturity securities portfolio is rated by Moody’s, S&P or similar
foreign rating services. Rating services are not available for some foreign issued securities. Our Credit Risk
Management department closely reviews the credit quality of the foreign portfolio’s non-rated fixed maturity securities.
At December 31, 2012, approximately 18 percent of such investments were either rated AAA or, on the basis of our
internal analysis, were equivalent from a credit standpoint to securities rated AAA, and approximately 3 percent were
rated below investment grade or not rated at that date. Approximately 49 percent of the foreign entities’ fixed maturity
securities portfolio is comprised of sovereign fixed maturity securities supporting policy liabilities in the country of
issuance.
With respect to our fixed maturity investments, the credit ratings in the table below and in subsequent tables reflect:
(a) a composite of the ratings of the three major rating agencies, or when agency ratings are not available, the rating
assigned by the National Association of Insurance Commissioners (NAIC) Securities Valuations Office (SVO) (over
99 percent of total fixed maturity investments), or (b) our equivalent internal ratings when these investments have not
been rated by any of the major rating agencies or the NAIC. The ‘‘Non-rated’’ category in those tables consists of
fixed maturity securities that have not been rated by any of the major rating agencies, the NAIC or us, and for 2011,
represents primarily our interest in ML III at December 31, 2011.
See Enterprise Risk Management herein for a discussion of credit risks associated with Investments.
..................................................................................................................................................................................................................................
AIG 2012 Form 10-K 139
I T E M 7 / I N V E S T M E N T S

.....................................................................................................................................................................................
The following table presents the composite AIG credit ratings of our fixed maturity securities calculated on
the basis of their fair value:
Rating:
Other fixed maturity
securities
AAA 13% 89% 15%
AA 25 1 24
A 26 6 26
BBB 32 2 31
Below investment grade 4 2 4
Non-rated – – –
Total 100% 100% 100%
Mortgage backed, asset
backed and
collateralized
AAA 48% 19% 41%
AA 5 14 7
A 9 8 9
BBB 6 3 5
Below investment grade 32 22 29
Non-rated – 34 9
Total 100% 100% 100%
Total
AAA 19% 41% 21%
AA 21 10 20
A 24 8 22
BBB 27 2 25
Below investment grade 9 16 10
Non-rated – 23 2
Total 100% 100% 100%
..................................................................................................................................................................................................................................
AIG 2012 Form 10-K140
10% 75% 12%
20 8 20
29 7 28
36 6 35
5 3 4
– 1 1
100% 100% 100%
40% 17% 35%
6 18 9
10 6 9
7 5 6
37 54 41
– – –
100% 100% 100%
16% 36% 17%
18 14 17
25 6 24
30 5 28
11 38 13
– 1 1
100% 100% 100%
Available for Sale Trading Total
December 31, December 31, December 31, December 31, December 31, December 31,
2012 2011 2012 2011 2012 2011
I T E M 7 / I N V E S T M E N T S

.....................................................................................................................................................................................
Investments by Segment..............................................................................................................................................................................................
The following tables summarize the composition of AIG’s investments by reportable segment:
Fixed maturity securities:
Bonds available for sale, at fair value
Bond trading securities, at fair value
Equity securities:
Common and preferred stock available for sale,
at fair value
Common and preferred stock trading, at
fair value
Mortgage and other loans receivable, net of
allowance
Other invested assets
Short-term investments
Total investments(a)
Cash
Total invested assets
December 31, 2011
Fixed maturity securities:
Bonds available for sale, at fair value $ 103,831 $ 154,912 $ – $ 5,238 $ 263,981
Bond trading securities, at fair value 88 1,583 – 22,693 24,364
Equity securities:
Common and preferred stock available for sale,
at fair value 2,895 208 1 520 3,624
Common and preferred stock trading, at fair
value – – – 125 125
Mortgage and other loans receivable, net of
allowance 553 16,759 90 2,087 19,489
Flight equipment primarily under operating
leases, net of accumulated depreciation – – 35,539 – 35,539
Other invested assets 12,279 12,560 – 15,905(b) 40,744
Short-term investments 4,660 3,318 1,910 12,684 22,572
Total investments(a) 124,306 189,340 37,540 59,252 410,438
Cash 673 463 65 273 1,474
Total invested assets $ 124,979 $ 189,803 $ 37,605 $ 59,525 $ 411,912
(a) At December 31, 2012, approximately 88 percent and 12 percent of investments were held by domestic and foreign entities, respectively,
compared to approximately 90 percent and 10 percent, respectively, at December 31, 2011.
(b) Includes $12.4 billion of AIA ordinary shares at December 31, 2011.
AIG Property Casualty..............................................................................................................................................................................................
In our property casualty business, the duration of liabilities for long-tail casualty lines is greater than other lines. As
differentiated from the life insurance and retirement services companies, the focus is not on asset-liability matching,
but on preservation of capital and growth of surplus.
Fixed income holdings of AIG Property Casualty domestic operations, with an average duration of 4.0 years, are
currently comprised primarily of tax-exempt securities, which provide attractive risk-adjusted after-tax returns as well
..................................................................................................................................................................................................................................
AIG 2012 Form 10-K 141
December 31, 2012
$ 102,563 $ 163,550 $ – $ 3,846 $ 269,959
1,597 1,855 – 21,132 24,584
3,093 111 – 8 3,212
– 562 – 100 662
712 17,089 – 1,681 19,482
12,720 12,777 – 3,620 29,117
7,935 7,495 – 13,378 28,808
128,620 203,439 – 43,765 375,824
649 297 – 205 1,151
$ 129,269 $ 203,736 $ – $ 43,970 $ 376,975
Reportable Segment
AIG Property AIG Life and Aircraft Other
(in millions) Casualty Retirement Leasing Operations Total
I T E M 7 / I N V E S T M E N T S

.....................................................................................................................................................................................
as taxable municipal bonds, government bonds and agency and corporate securities. The majority of these high
quality investments are rated A or higher based on composite ratings.
Fixed income assets held in AIG Property Casualty foreign operations are of high quality and short to intermediate
duration, averaging 3.5 years.
While invested assets backing reserves are invested in conventional fixed income securities in AIG Property Casualty
domestic operations, a modest portion of surplus is allocated to alternative investments, including private equity and
hedge funds. Notwithstanding the current environment, these investments have provided a combination of added
diversification and attractive long-term returns over time.
AIG Life and Retirement..............................................................................................................................................................................................
With respect to AIG Life and Retirement, we use asset-liability management as a tool to determine the composition
of the invested assets. Our objective is to maintain a matched asset-liability structure, although we may occasionally
determine that it is economically advantageous to be temporarily in an unmatched position. To the extent that we
have maintained a matched asset-liability structure, the economic effect of interest rate fluctuations is partially
mitigated.
Our investment strategy for AIG Life and Retirement is to produce cash flows greater than maturing insurance
liabilities. There exists a future investment risk associated with certain policies currently in-force which will have
premium receipts in the future. That is, the investment of these future premium receipts may be at a yield below that
required to meet future policy liabilities.
AIG Life and Retirement frequently reviews its interest rate assumptions and actively manages the crediting rates
used for its new and in force business. Business strategies continue to evolve to maintain profitability of the overall
business.
The investment of insurance cash flows and reinvestment of the proceeds of matured securities and coupons
requires active management of investment yields while maintaining satisfactory investment quality and liquidity.
A number of guaranteed benefits, such as living benefits and guaranteed minimum death benefits, are offered on
certain variable and indexed annuity products. The fair value of these benefits is measured based on actuarial and
capital market assumptions related to projected cash flows over the expected lives of the contracts. We manage our
exposure resulting from these long-term guarantees through reinsurance or capital market hedging instruments. We
actively review underlying assumptions of policyholder behavior and persistency related to these guarantees. We
have taken positions in certain derivative financial instruments in order to hedge the impact of changes in equity
markets and interest rates on these benefit guarantees. We execute listed futures and options contracts on equity
indexes to hedge certain guarantees of variable and indexed annuity products. We also enter into various types of
futures and options contracts, primarily to hedge changes in value of certain guarantees of variable and indexed
annuities due to fluctuations in interest rates. We use several instruments to hedge interest rate exposure, including
listed futures on government securities, listed options on government securities and the purchase of government
securities.
With respect to over-the-counter derivatives, we deal with highly rated counterparties and do not expect the
counterparties to fail to meet their obligations under the contracts. We have controls in place to monitor credit
exposures by limiting transactions with specific counterparties within specified dollar limits and assessing the
creditworthiness of counterparties periodically. We generally use ISDA Master Agreements and Credit Support
Annexes (CSAs) with bilateral collateral provisions to reduce counterparty credit exposures.
Fixed income holdings of AIG Life and Retirement, with an average duration of 6.3 years, are comprised of taxable
corporate bonds, as well as municipal and government bonds, commercial mortgage loans, and agency and
non-agency structured securities. The majority of these investments are held in the available for sale portfolio and
are rated investment grade based on our composite ratings.
..................................................................................................................................................................................................................................
AIG 2012 Form 10-K142
I T E M 7 / I N V E S T M E N T S

.....................................................................................................................................................................................
Available-for-Sale Investments..............................................................................................................................................................................................
The following table presents the fair value of our available-for-sale securities:
Bonds available for sale:
U.S. government and government sponsored entities $ 6,078
Obligations of states, municipalities and political subdivisions 37,498
Non-U.S. governments 25,735
Corporate debt 144,818
Mortgage-backed, asset-backed and collateralized:
RMBS 34,604
CMBS 7,946
CDO/ABS 7,302
Total mortgage-backed, asset-backed and collateralized 49,852
Total bonds available for sale* 263,981
Equity securities available for sale:
Common stock 3,421
Preferred stock 143
Mutual funds 60
Total equity securities available for sale 3,624
Total $ 267,605
* At December 31, 2012 and December 31, 2011, bonds available for sale held by us that were below investment grade or not rated totaled
$29.6 billion and $24.2 billion, respectively.
Investments in Municipal Bonds..............................................................................................................................................................................................
At December 31, 2012, the U.S. municipal bond portfolio was composed primarily of essential service revenue bonds
and high-quality tax-backed bonds with 97 percent of the portfolio rated A or higher.
..................................................................................................................................................................................................................................
AIG 2012 Form 10-K 143
$ 3,483
35,705
26,800
151,112
34,392
10,134
8,333
52,859
269,959
3,029
78
105
3,212
$ 273,171
Fair Value at Fair Value at
December 31, December 31,
(in millions) 2012 2011
I T E M 7 / I N V E S T M E N T S

.....................................................................................................................................................................................
The following table presents the fair values of our available for sale U.S. municipal bond portfolio by state
and municipal bond type:
State:
California
Texas
New York
Washington
Massachusetts
Illinois
Florida
Virginia
Arizona
Georgia
Ohio
Wisconsin
Pennsylvania
All other states
Total(a)(b)
(a) Excludes certain university and not- for- profit entities that issue their bonds in the corporate debt market. Includes industrial revenue bonds.
(b) Includes $7.9 billion of pre-refunded municipal bonds.
Investments in Corporate Debt Securities..............................................................................................................................................................................................
The following table presents the industry categories of our available for sale corporate debt securities based
on amortized cost:
Financial institutions:
Money Center /Global Bank Groups 9%
Regional banks – other 1
Life insurance 4
Securities firms and other finance companies –
Insurance non-life 3
Regional banks – North America 6
Other financial institutions 5
Utilities 16
Communications 8
Consumer noncyclical 11
Capital goods 6
Energy 7
Consumer cyclical 7
Other 17
Total* 100%
* At December 31, 2012 and December 31, 2011, approximately 94 percent and 95 percent, respectively, of these investments were rated
investment grade.
..................................................................................................................................................................................................................................
AIG 2012 Form 10-K144
$ 674 $ 1,292 $ 3,301 $ 5,267
201 2,377 2,135 4,713
46 833 3,706 4,585
717 278 831 1,826
919 – 891 1,810
159 671 710 1,540
510 9 1,017 1,536
89 150 855 1,094
– 162 820 982
490 42 386 918
215 150 525 890
325 49 368 742
459 82 197 738
1,750 1,302 6,012 9,064
$ 6,554 $ 7,397 $ 21,754 $ 35,705
8%
1
3
–
4
5
5
16
8
12
6
7
7
18
100%
December 31, 2012 State Local Total
General General Fair
(in millions) Obligation Obligation Revenue Value
December 31, December 31,
Industry Category 2012 2011
I T E M 7 / I N V E S T M E N T S

.....................................................................................................................................................................................
Investments in RMBS..............................................................................................................................................................................................
The following table presents our RMBS available for sale investments by year of vintage:
Total RMBS
2012 $ –
2011 9,247
2010 3,925
2009 620
2008 714
2007 and prior* 20,098
Total RMBS $ 34,604
Agency
2012 $ –
2011 7,005
2010 3,774
2009 549
2008 714
2007 and prior 4,315
Total Agency $ 16,357
Alt-A
2010 $ 64
2007 and prior 5,744
Total Alt-A $ 5,808
Subprime
2007 and prior $ 1,456
Total Subprime $ 1,456
Prime non-agency
2012 $ –
2011 2,241
2010 88
2009 71
2007 and prior 8,194
Total Prime non-agency $ 10,594
Total Other housing related $ 389
* Includes approximately $10.9 billion of securities that were purchased at a significant discount to amortized cost commencing in the second
quarter of 2011.
..................................................................................................................................................................................................................................
AIG 2012 Form 10-K 145
$ 1,630
7,545
2,951
378
431
21,457
$ 34,392
$ 1,395
5,498
2,812
321
431
3,117
$ 13,574
$ 53
7,871
$ 7,924
$ 2,151
$ 2,151
$ 235
2,047
86
58
7,910
$ 10,336
$ 407
Fair Value at Fair Value at
December 31, December 31,
(in millions) 2012 2011
I T E M 7 / I N V E S T M E N T S

.....................................................................................................................................................................................
The following table presents our RMBS available for sale investments by credit rating:
Rating:
Total RMBS
AAA 19,436
AA 979
A 409
BBB 773
Below investment grade(a) 12,999
Non-rated 8
Total RMBS(b) 34,604
Agency RMBS
AAA 16,357
AA –
Total Agency 16,357
Alt-A RMBS
AAA 126
AA 414
A 161
BBB 251
Below investment grade(a) 4,856
Non-rated –
Total Alt-A 5,808
Subprime RMBS
AAA 105
AA 127
A 18
BBB 221
Below investment grade(a) 985
Non-rated –
Total Subprime 1,456
Prime non-agency
AAA 2,850
AA 429
A 189
BBB 287
Below investment grade(a) 6,831
Non-rated 8
Total prime non-agency 10,594
Total Other housing related 389
(a) Commencing in the second quarter of 2011, we began purchasing certain RMBSs that had experienced deterioration in credit quality since
their origination. See Note 7 to the Consolidated Financial Statements, Investments – Purchased Credit Impaired (PCI) Securities, for additional
discussion.
(b) The weighted average expected life was 6 years at both December 31, 2012 and December 31, 2011, respectively.
Our underwriting practices for investing in RMBS, other asset-backed securities and CDOs take into consideration
the quality of the originator, the manager, the servicer, security credit ratings, underlying characteristics of the
mortgages, borrower characteristics, and the level of credit enhancement in the transaction.
..................................................................................................................................................................................................................................
AIG 2012 Form 10-K146
$ 16,048
795
411
744
16,283
111
$ 34,392
$ 13,464
110
$ 13,574
$ 57
195
83
314
7,275
–
$ 7,924
$ 38
170
129
185
1,629
–
$ 2,151
$ 2,487
317
196
208
7,017
111
$ 10,336
$ 407
Fair Value at Fair Value at
December 31, December 31,
(in millions) 2012 2011
I T E M 7 / I N V E S T M E N T S

.....................................................................................................................................................................................
Investments in CMBS..............................................................................................................................................................................................
The following table presents our CMBS available for sale investments:
CMBS (traditional) $ 6,333
ReRemic/CRE CDO 261
Agency 1,290
Other 62
Total $ 7,946
The following table presents our CMBS available for sale investments by year of vintage:
Year:
2012 $ –
2011 1,423
2010 298
2009 42
2008 211
2007 and prior 5,972
Total $ 7,946
The following table presents our CMBS available for sale investments by credit rating:
Rating:
AAA $ 3,693
AA 734
A 948
BBB 818
Below investment grade 1,740
Non-rated 13
Total $ 7,946
..................................................................................................................................................................................................................................
AIG 2012 Form 10-K 147
Fair Value at Fair Value at
December 31, December 31,
(in millions) 2012 2011
$ 7,880
219
1,486
549
$ 10,134
Fair Value at Fair Value at
December 31, December 31,
(in millions) 2012 2011
$ 1,427
1,347
807
44
161
6,348
$ 10,134
Fair Value at Fair Value at
December 31, December 31,
(in millions) 2012 2011
$ 4,278
1,591
827
1,266
2,156
16
$ 10,134
I T E M 7 / I N V E S T M E N T S

.....................................................................................................................................................................................
The following table presents the percentage of our CMBS available for sale investments by geographic
region based on amortized cost:
Geographic region:
New York 15%
California 10
Texas 6
Florida 5
Virginia 3
New Jersey 3
Illinois 2
Pennsylvania 2
Nevada 2
Georgia 2
Massachusetts 2
Washington 2
All other* 46
Total 100%
* Includes Non-U.S. locations.
The following table presents the percentage of our CMBS available for sale investments by industry based
on amortized cost:
Industry:
Office 28%
Multi-family* 26
Retail 25
Lodging 8
Industrial 6
Other 7
Total 100%
* Includes Agency-backed CMBS.
The fair value of CMBS holdings remained stable throughout 2012. The majority of our investments in CMBS are in
tranches that contain substantial protection features through collateral subordination. As indicated in the tables,
downgrades have occurred on many CMBS holdings. The majority of CMBS holdings are traditional conduit
transactions, broadly diversified across property types and geographical areas.
Investments in CDOs..............................................................................................................................................................................................
The following table presents our CDO available for sale investments by collateral type:
Collateral Type:
Bank loans (CLO) $ 1,756
Synthetic investment grade 76
Other 390
Subprime ABS 10
Total $ 2,232
..................................................................................................................................................................................................................................
AIG 2012 Form 10-K148
December 31,December 31,2012 2011
16%
9
6
4
3
3
3
2
2
2
2
2
46
100%
December 31, 2012 2011
27%
23
25
13
6
6
100%
Fair value at Fair value at
December 31, December 31,
(in millions) 2012 2011
$ 2,579
25
424
10
$ 3,038
I T E M 7 / I N V E S T M E N T S

.....................................................................................................................................................................................
The following table presents our CDO available for sale investments by credit rating:
Rating:
AAA $ 130
AA 299
A 745
BBB 467
Below investment grade 591
Total $ 2,232
Commercial Mortgage Loans..............................................................................................................................................................................................
At December 31, 2012, we had direct commercial mortgage loan exposure of $13.8 billion. At that date, over
99 percent of the loans were current.
The following table presents the commercial mortgage loan exposure by location and class of loan based on
amortized cost:
State:
California 153 $ 119 $ 942 $ 286 $ 640 $ 394 $ 652 $ 3,033 22%
New York 85 268 1,320 176 98 101 120 2,083 15
New Jersey 57 477 283 302 8 19 65 1,154 8
Florida 93 52 175 255 99 20 231 832 6
Texas 58 37 294 154 208 101 32 826 6
Pennsylvania 57 48 99 171 119 17 13 467 3
Ohio 54 167 40 98 64 38 10 417 3
Colorado 19 11 198 1 – 97 58 365 3
Maryland 21 22 145 170 13 4 4 358 3
Virginia 25 38 186 50 10 17 – 301 2
Other states 333 359 1,253 1,010 397 345 465 3,829 28
Foreign 61 1 – – – – 122 123 1
Total* 1,016 $ 1,599 $ 4,935 $ 2,673 $ 1,656 $ 1,153 $ 1,772 $ 13,788 100%
* Excludes portfolio valuation losses.
AIA Investment..............................................................................................................................................................................................
We sold our remaining 33 percent interest in AIA ordinary shares for proceeds of $14.5 billion and a net gain of
$2.1 billion through three sale transactions on March 7, September 11 and December 20, 2012.
See Note 7 to the Consolidated Financial Statements for further discussion.
..................................................................................................................................................................................................................................
AIG 2012 Form 10-K 149
Fair Value at Fair Value at
December 31, December 31,
(in millions) 2012 2011
$ 144
542
1,284
485
583
$ 3,038
December 31, 2012 Number PercentClass
of of(dollars in millions) Loans Apartments Offices Retails Industrials Hotels Others Total Total
I T E M 7 / I N V E S T M E N T S

.....................................................................................................................................................................................
Impairments..............................................................................................................................................................................................
The following table presents impairments by investment type:
Fixed maturity securities, available for sale $ 1,009 $ 2,337
Equity securities, available for sale 37 193
Private equity funds and hedge funds 234 509
Subtotal $ 1,280 $ 3,039
Life settlement contracts(a) 312 74
Aircraft trusts 168 –
Alternative investments – –
Real estate(b) 30 622
Total $ 1,790 $ 3,735
(a) Impairments of investments in Life settlement contracts are recorded in Other realized losses.
(b) Impairments of investments in Real estate are recorded in Other income.
Other-Than-Temporary Impairments..............................................................................................................................................................................................
To determine other-than-temporary impairments, we use fundamental credit analyses of individual securities without
regard to rating agency ratings. Based on this analysis, we expect to receive cash flows sufficient to cover the
amortized cost of all below investment grade securities for which credit impairments were not recognized.
..................................................................................................................................................................................................................................
AIG 2012 Form 10-K150
Years Ended December 31,(in millions) 2012 2011 2010
$ 723
105
339
$ 1,167
309
–
9
7
$ 1,492
I T E M 7 / I N V E S T M E N T S

.....................................................................................................................................................................................
The following tables present other-than-temporary impairment charges recorded in earnings on fixed
maturity securities, equity securities, private equity funds and hedge funds.
Other-than-temporary impairment charges by reportable segment and impairment type:
For the Year Ended December 31, 2012
Impairment Type:
Severity
Change in intent
Foreign currency declines
Issuer-specific credit events
Adverse projected cash flows
Total
For the Year Ended December 31, 2011
Impairment Type:
Severity $ 47 $ 4 $ – $ 51
Change in intent 1 11 – 12
Foreign currency declines 32 – – 32
Issuer-specific credit events 193 943 29 1,165
Adverse projected cash flows 1 19 – 20
Total $ 274 $ 977 $ 29 $ 1,280
For the Year Ended December 31, 2010
Impairment Type:
Severity $ 30 $ 14 $ 29 $ 73
Change in intent 389 34 18 441
Foreign currency declines 17 – 46 63
Issuer-specific credit events 141 1,906 410 2,457
Adverse projected cash flows – 4 1 5
Total $ 577 $ 1,958 $ 504 $ 3,039
..................................................................................................................................................................................................................................
AIG 2012 Form 10-K 151
Reportable Segment
AIG Property AIG Life and Other
(in millions) Casualty Retirement Operations Total
$ 35 $ 9 $ – $ 44
4 20 38 62
8 – – 8
330 691 27 1,048
1 4 – 5
$ 378 $ 724 $ 65 $ 1,167
I T E M 7 / I N V E S T M E N T S

.....................................................................................................................................................................................
Other-than-temporary impairment charges by investment type and impairment type:
For the Year Ended December 31, 2012
Impairment Type:
Severity
Change in intent
Foreign currency declines
Issuer-specific credit events
Adverse projected cash flows
Total
For the Year Ended December 31, 2011
Impairment Type:
Severity $ – $ – $ – $ – $ 51 $ 51
Change in intent – – – 7 5 12
Foreign currency declines – – – 32 – 32
Issuer-specific credit events 769 20 150 11 215 1,165
Adverse projected cash flows 20 – – – – 20
Total $ 789 $ 20 $ 150 $ 50 $ 271 $ 1,280
For the Year Ended December 31, 2010
Impairment Type:
Severity $ – $ – $ – $ – $ 73 $ 73
Change in intent 210 – 99 41 91 441
Foreign currency declines – 5 – 57 1 63
Issuer-specific credit events 1,066 34 739 81 537 2,457
Adverse projected cash flows 5 – – – – 5
Total $ 1,281 $ 39 $ 838 $ 179 $ 702 $ 3,039
* Includes other-than-temporary impairment charges on private equity funds, hedge funds and direct private equity investments.
..................................................................................................................................................................................................................................
AIG 2012 Form 10-K152
Other Fixed Equities/Other
(in millions) RMBS CDO/ABS CMBS Maturity Invested Assets* Total
$ – $ – $ – $ – $ 44 $ 44
4 – – 34 24 62
– – – 8 – 8
433 7 208 24 376 1,048
5 – – – – 5
$ 442 $ 7 $ 208 $ 66 $ 444 $ 1,167
I T E M 7 / I N V E S T M E N T S

.....................................................................................................................................................................................
Other-than-temporary impairment charges by investment type and credit rating:
For the Year Ended December 31, 2012
Rating:
AAA
AA
A
BBB
Below investment grade
Non-rated
Total
For the Year Ended December 31, 2011
Rating:
AAA $ 3 $ – $ – $ 9 $ – $ 12
AA 24 – – 10 – 34
A 7 – – 15 – 22
BBB 6 5 – 1 – 12
Below investment grade 749 15 150 14 – 928
Non-rated – – – 1 271 272
Total $ 789 $ 20 $ 150 $ 50 $ 271 $ 1,280
For the Year Ended December 31, 2010
Rating:
AAA $ 5 $ – $ – $ 10 $ – $ 15
AA 20 – – 3 – 23
A 2 – 13 14 – 29
BBB 47 – 41 10 – 98
Below investment grade 1,207 30 784 108 – 2,129
Non-rated – 9 – 34 702 745
Total $ 1,281 $ 39 $ 838 $ 179 $ 702 $ 3,039
* Includes other-than-temporary impairment charges on private equity funds, hedge funds and direct private equity investments.
We recorded other-than-temporary impairment charges in the years ended December 31, 2012 and 2011 related to:
• issuer-specific credit events;
• securities for which we have changed our intent from hold to sell;
• declines due to foreign exchange rates;
• adverse changes in estimated cash flows on certain structured securities;
• securities that experienced severe market valuation declines; and
• other impairments, including equity securities, private equity funds, hedge funds, direct private equity investments,
aircraft trusts and investments in life settlement contracts.
There was no significant impact to our consolidated financial condition or results of operations from
other-than-temporary impairment charges for any one single credit. Also, no individual other-than-temporary
impairment charge exceeded 0.11 percent, 0.20 percent and 0.20 percent of total equity at December 31, 2012, 2011
or 2010, respectively.
In periods subsequent to the recognition of an other-than-temporary impairment charge for available for sale fixed
maturity securities that is not foreign-exchange related, we generally prospectively accrete into earnings the
difference between the new amortized cost and the expected undiscounted recovery value over the remaining life of
the security. The accretion that was recognized for these securities in earnings was $915 million in 2012, and
..................................................................................................................................................................................................................................
AIG 2012 Form 10-K 153
Other Fixed Equities/Other
(in millions) RMBS CDO/ABS CMBS Maturity Invested Assets* Total
$ – $ – $ – $ 2 $ – $ 2
10 – – – – 10
– 2 – 4 – 6
– – – – – –
432 5 208 26 – 671
– – – 34 444 478
$ 442 $ 7 $ 208 $ 66 $ 444 $ 1,167
I T E M 7 / I N V E S T M E N T S

.....................................................................................................................................................................................
$542 million in 2011, and $401 million in 2010. For a discussion of AIG’s other-than-temporary impairment
accounting policy, see Note 7 to the Consolidated Financial Statements.
The following table shows the aging of the pre-tax unrealized losses of fixed maturity and equity securities,
the extent to which the fair value is less than amortized cost or cost, and the number of respective items in
each category:
Investment grade bonds
0 - 6 months $ 10,865 $ 157 1,637 $ – $ – – $ – $ – – $ 10,865 $ 157 1,637
7 - 11 months 465 10 112 – – – – – – 465 10 112
12 months or more 4,830 277 631 481 129 47 12 10 2 5,323 416 680
Total $ 16,160 $ 444 2,380 $ 481 $ 129 47 $ 12 $ 10 2 $ 16,653 $ 583 2,429
Below investment grade
bonds
0 - 6 months $ 904 $ 56 354 $ 122 $ 34 17 $ – $ – – $ 1,026 $ 90 371
7 - 11 months 175 9 108 14 4 10 4 2 14 193 15 132
12 months or more 2,987 227 508 1,164 353 135 201 128 62 4,352 708 705
Total $ 4,066 $ 292 970 $ 1,300 $ 391 162 $ 205 $ 130 76 $ 5,571 $ 813 1,208
Total bonds
0 - 6 months $ 11,769 $ 213 1,991 $ 122 $ 34 17 $ – $ – – $ 11,891 $ 247 2,008
7 - 11 months 640 19 220 14 4 10 4 2 14 658 25 244
12 months or more 7,817 504 1,139 1,645 482 182 213 138 64 9,675 1,124 1,385
Total(e) $ 20,226 $ 736 3,350 $ 1,781 $ 520 209 $ 217 $ 140 78 $ 22,224 $ 1,396 3,637
Equity securities
0 - 11 months $ 225 $ 18 151 $ 61 $ 18 43 $ – $ – – $ 286 $ 36 194
12 months or more 17 – 2 2 1 2 – – – 19 1 4
Total $ 242 $ 18 153 $ 63 $ 19 45 $ – $ – – $ 305 $ 37 198
(a) Represents the number of consecutive months that fair value has been less than cost by any amount.
(b) Represents the percentage by which fair value is less than cost at December 31, 2012.
(c) For bonds, represents amortized cost.
(d) The effect on Net income of unrealized losses after taxes will be mitigated upon realization because certain realized losses will result in current
decreases in the amortization of certain DAC.
(e) Item count is by CUSIP by subsidiary.
For 2012, net unrealized gains related to fixed maturity and equity securities increased by $10.4 billion primarily due
to the decline in interest rates and narrowing of credit spreads.
As of December 31, 2012, the majority of our fixed maturity investments in an unrealized loss position of more than
50 percent for 12 months or more consisted of the unrealized loss of $138 million primarily related to CMBS and
RMBS securities originally rated investment grade that are floating rate or that have low fixed coupons relative to
current market yields. A total of 2 securities with an amortized cost of $12 million and a net unrealized loss of
$10 million are still investment grade. As part of our credit evaluation procedures we consider the nature of both the
specific securities and the market conditions for those securities. For most security types supported by real estate-
related assets, current market yields continue to be higher than the yields at the time those securities were issued. In
addition, for floating rate securities, persistently low LIBOR levels continue to make these securities less attractive to
secondary purchasers of these assets.
We believe that these securities are trading at significant price discounts primarily due to the lack of demand for
commercial and residential real estate collateral-based securities, low contractual coupons and interest rate spreads,
and the deterioration in the level of collateral support due to real estate market conditions. Based on our analysis,
and taking into account the level of subordination below these securities, we continue to believe that the expected
cash flows from these securities will be sufficient to recover the amortized cost of our investment. We continue to
monitor these positions for potential credit impairments that could result from further deterioration in commercial and
residential real estate fundamentals.
See also Note 7 to the Consolidated Financial Statements for further discussion of our investment portfolio.
..................................................................................................................................................................................................................................
AIG 2012 Form 10-K154
December 31, 2012 Less Than or Equal Greater Than 20% Greater Than 50%to 20% of Cost(b) to 50% of Cost(b) of Cost(b) Total
Aging(a) Unrealized Unrealized Unrealized Unrealized(dollars in millions) Cost(c) Loss Items(e) Cost(c) Loss Items(e) Cost(c) Loss Items(e) Cost(c) Loss(d) Items(e)
I T E M 7 / I N V E S T M E N T S

.....................................................................................................................................................................................
OVERVIEW.............................................................................................................................................................. Enterprise Risk
Management (ERM)At AIG, we have an integrated process for managing risks throughout our
organization in accordance with our firm-wide risk appetite. Our Board of • Our ERM framework providesDirectors has oversight responsibility for the management of risk. Our senior management with aEnterprise Risk Management (ERM) Department supervises and integrates consolidated view of our riskthe risk management functions in each of our business units, providing senior appetite and major riskmanagement with a consolidated view of the firm’s major risk positions. Within positions.each business unit, senior leaders and executives approve risk-taking policies
and targeted risk tolerance within the framework provided by ERM. ERM • In each of our business units,supports our businesses and management in the embedding of enterprise risk senior leaders and executivesmanagement in all of our key day to day business processes and in approve risk-taking policiesidentifying, assessing, quantifying, managing and mitigating the risks taken by and targeted risk toleranceus and our businesses. within the ERM framework
while working with AIG ERM toRisk Governance Structure mitigate risks across the firm...............................................................................................................................................................
• Risk management is anOur risk governance fosters the development and maintenance of a risk integral part of how weand control culture that encompasses all significant risk categories. manage our core businesses.Accountability for the implementation and oversight of risk policies is
aligned with individual corporate executives, with the risk committees
receiving regular reports regarding compliance with each policy to
support risk governance at our corporate level as well as in each
business unit.
Our Board of Directors oversees the management of risk through its Finance and Risk Management Committee (the
FRMC) and the Audit Committee. Those committees regularly interact with other committees of the Board. Our
Executive Vice President (EVP) and Chief Risk Officer (CRO) reports to both the FRMC and AIG’s Chief Executive
Officer (CEO).
The Group Risk Committee (the GRC) is the senior management group charged with assessing all significant risk
issues on a global basis in order to protect our financial strength, optimize our intrinsic value, and protect our
reputation among key stakeholders. The GRC is chaired by our CRO. Its membership includes our CEO, EVP and
Chief Financial Officer (CFO), EVP and General Counsel, and 12 other executives from across our corporate
functions and business units. Our CRO reports periodically on behalf of the GRC to both the FRMC and the Audit
Committee of the Board.
Management committees that support the GRC are described below. These committees are comprised of senior
executives and experienced business representatives from a range of functions and business units throughout AIG
and its subsidiaries. These committees are charged with identifying, analyzing and reviewing specific risk matters
within their respective mandates.
Financial Risk Group (FRG): The FRG is responsible for the oversight of financial risks taken by AIG and its
subsidiaries. Its mandate includes overseeing our aggregate credit, market, interest rate, liquidity and model risks, as
well as asset-liability management, derivatives activity, and foreign exchange transactions. Membership of the FRG
includes our EVP – Investments, EVP and Treasurer, as well as our EVP and CFO, and other senior executives from
Finance and ERM. Our CRO serves as Chair of the FRG.
..................................................................................................................................................................................................................................
AIG 2012 Form 10-K 155
Enterprise Risk Management
At AIG, risk management includes the identification and measurement of various forms of risk, the establishment of
risk thresholds and the creation of processes intended to maintain risks within these thresholds while optimizing
returns. We consider risk management an integral part of managing our core businesses and a key element of our
approach to corporate governance.
I T E M 7 / E N T E R P R I S E R I S K M A N A G E M E N T
a age eanagemen RtM ERM( )pe ei in erpr se sRtE i Ri k

15FEB201318003640
.....................................................................................................................................................................................
Transaction Approval and Business Practices Committee (TABPC): TABPC provides the primary corporate-
level review function for all proposed transactions and business practices that are significant in size, complex in
scope, or that present heightened legal, reputational, accounting or regulatory risks. Our EVP and Treasurer serves
as TABPC Chair and additional members include our EVP and General Counsel, EVP and CRO, EVP and CFO,
EVP – Investments, and a senior executive from Finance.
Operational Risk Committee (ORC): This Committee is tasked with overview of the enterprise-wide identification,
escalation and mitigation of risks that may arise from inadequate or failed internal processes, people, systems, or
external events. The Committee approves AIG’s Operational Risk Management (ORM) framework and related
policies, which includes the risk and control self assessment (RCSA), Risk Events, Key Risk Indicators (KRIs) and
Scenario Analysis. The Committee monitors the adequacy of ORM staffing and ensures applicable governance
structures are established to provide oversight of operational risk at each Business Unit and Corporate Function. The
ORC also reviews aggregate firm-wide operational risk reports. Our Chief Administrative Officer is Chair of the ORC
and our Head of Operational Risk Management serves as ORC Secretary. Other ORC members include senior AIG
executives with expertise in legal, compliance, technology, finance and operational risk, as well as business
continuity management and the chief risk officers of our business units.
Group Risk Committee (GRC)Chair: EVP and AIG Chief Risk
Officer
Financial Risk Group (FRG)Chair: EVP and AIG Chief Risk
Officer
Transaction Approval &Business Practices Committee
(TABPC)Chair: EVP and Treasurer
Operational Risk Committee(ORC)
Chair: EVP and ChiefAdministrative Officer
Business Unit Risk & CapitalCommittees (BU RCCs)
(AIG PC, AIG L&R, UGC)
Business Unit Risk Committees: Each of our major insurance businesses has established a risk and capital
committee (BU RCC) that serves as the senior management committee responsible for risk oversight at the individual
business unit level. The BU RCCs are responsible for the identification, assessment and monitoring of all sources of
risk within their respective portfolios. Specific responsibilities include setting risk tolerances, approving capital
management strategies (including asset allocation and risk financing), insurance portfolio optimization, risk
management policies and providing oversight of economic capital models. In addition to its BU RCC, each major
insurance business has established subordinate committees which identify, assess and monitor the specific
operational, transactional and financial risks inherent in its respective business. Together, the BU Risk Committees
and AIG Risk Committees described above provide comprehensive risk oversight throughout the organization.
Risk oversight activities also continue to be coordinated with discontinued operations, such as ILFC, until pending
sale transactions are closed.
Risk Appetite, Identification, and Measurement..............................................................................................................................................................................................
ERM has developed a company-wide Risk Appetite Statement (RAS), which will be updated on at least an annual
basis. By formally defining our risk appetite, we seek to integrate stakeholder interests, business goals and available
financial resources through taking measured risks that are intended to generate repeatable, sustainable earnings and
produce long-term value and stability.
The RAS articulates our risk-taking capacity by setting consolidated capital and liquidity tolerances as observed
under expected and stressed business and economic conditions. RAS also reflects constraints on minimum capital
positions for our insurance operations. These constraints inform the requirements for capital adequacy for individual
businesses, based on capital assessments under rating agency, regulatory and other business needs. Consistent
with our risk appetite, we have established risk tolerances that are reflected in our business planning and are
integrated into the management of our operations. Risk tolerances cover insurance company capital ratios as well as
metrics associated with AIG Parent resources, including consolidated company capital ratios and parent liquidity. Our
GRC routinely reviews the level of risk taken by the consolidated organization in relation to established risk
tolerances. A consolidated risk report is also presented to the FRMC by our CRO.
..................................................................................................................................................................................................................................
AIG 2012 Form 10-K156
I T E M 7 / E N T E R P R I S E R I S K M A N A G E M E N T

.....................................................................................................................................................................................
We employ various approaches to measure, monitor, and manage risk exposures, including the utilization of a variety
of metrics and early warning indicators. We use a proprietary stress testing framework to measure our quantifiable
risks. This framework is built on our existing ERM stress testing methodology for both insurance and non-insurance
operations. The framework measures risk over multiple time horizons and under different levels of stress. We
develop a range of stress scenarios based both on internal experience and regulatory guidance. The stress tests are
intended to ensure that sufficient resources for our regulated subsidiaries and the consolidated company are
available under both idiosyncratic and systemic market stress conditions.
The stress testing framework assesses our aggregate exposure to our most significant financial and insurance risks,
including the risk in each of our regulated subsidiaries in relation to its statutory capital needs under stress, risks
inherent in our unregulated subsidiaries, and risks to AIG consolidated capital. Using our stress testing methodology,
we evaluate the capital and earnings impact of potential stresses in relation to the relevant capital constraint of each
business operation. We use this information to determine the liquidity resources AIG Parent needs to support
insurance operations, contingent liquidity required from AIG Parent under stressed scenarios for non-insurance
operations, and capital resources required to maintain consolidated company target capitalization levels.
To complement our risk policies and governance framework, we also employ an enterprise-wide vulnerability
identification (VID) process. The process is designed to ensure that potential new or emerging risks are brought to
the attention of senior management. On a bi-annual basis, our VID process solicits this information from a broad
range of senior managers across the organization. This process enables vulnerabilities that are not captured by other
risk management practices to be identified and reported to senior management on a regular basis.
We evaluate and manage risk in material topics as shown below. These topics are discussed in more detail in the
following pages:
• Credit Risk • Liquidity Risk • Insurance Operations Risks
• Market Risk • Operational Risk • Global Capital Markets Risks
Credit Risk Management..............................................................................................................................................................................................
Overview..............................................................................................................................................................................................
Credit risk is defined as the risk that our customers or counterparties are unable or unwilling to repay their
contractual obligations when they become due. Credit risk may also result from a downgrade of counterparty’s credit
ratings.
We devote considerable resources to managing our direct and indirect credit exposures. These exposures may arise
from fixed income investments, equity securities, deposits, reverse repurchase agreements and repurchase
agreements, commercial paper, corporate and consumer loans, leases, reinsurance recoverables, counterparty risk
arising from derivatives activities, collateral extended to counterparties, insurance risk cessions to third parties,
financial guarantees and letters of credit.
Our credit risks are managed at the corporate level within ERM. ERM is assisted by credit functions headed by
seasoned credit officers in all the business units, whose primary role is to assure appropriate credit risk management
relative to our credit risk parameters. Our Chief Credit Officer (CCO) and credit executives are primarily responsible
for the development and maintenance of credit risk policies and procedures.
Responsibilities of the CCO and credit executives include:
• developing and implementing our company-wide credit policies;
• approving delegated credit authorities to our credit executives;
• managing the approval process for requests for credit limits, program limits and credit transactions above
authorities or where concentrations of risk may exist or be incurred;
• aggregating globally all credit exposure data by counterparty, country, sector and industry and reporting risk
concentrations regularly to and reviewing with senior management;
• administering regular portfolio credit reviews of investment, derivative and credit-incurring business units and
recommending corrective actions where required;
• conducting credit research on countries, sectors and asset classes where risk concentrations may exist;
..................................................................................................................................................................................................................................
AIG 2012 Form 10-K 157
I T E M 7 / E N T E R P R I S E R I S K M A N A G E M E N T

.....................................................................................................................................................................................
• developing methodologies for quantification and assessment of credit risks, including the establishment and
maintenance of our internal risk rating process; and
• approving appropriate credit reserves, credit-related other-than-temporary impairments and corresponding
methodologies in all credit portfolios.
We monitor and control our company-wide credit risk concentrations and attempt to avoid unwanted or excessive risk
accumulations, whether funded or unfunded. To minimize the level of credit risk in some circumstances, we may
require third-party guarantees, reinsurance or collateral, such as letters of credit and trust collateral accounts. We
treat these guarantees, reinsurance recoverables, letters of credit and trust collateral accounts as credit exposure
and include them in our risk concentration exposure data. We identify our aggregate credit exposures to our
underlying counterparty risks.
Largest Credit Concentrations..............................................................................................................................................................................................
Our single largest credit exposure, the U.S. Government, was 25 percent of Total equity at December 31, 2012
compared to 30 percent at December 31, 2011. Exposure to the U.S. Government primarily includes credit exposure
related to U.S. Treasury and government agency securities and to direct and guaranteed exposures to U.S.
government-sponsored entities, primarily the Federal National Mortgage Association (Fannie Mae) and the Federal
Home Loan Mortgage Corporation (Freddie Mac) based upon their U.S. Government conservatorship. The reduction
in exposure was primarily related to U.S. government-sponsored entities.
Based on our internal risk ratings, at December 31, 2012, our largest below investment grade-rated credit exposure,
apart from ILFC leasing arrangements secured by aircraft with airlines having below investment grade ratings, was
related to a non-financial corporate counterparty and that exposure was 0.6 percent of Total equity, compared to
0.5 percent at December 31, 2011.
Government Credit Concentrations (non-U.S.)..............................................................................................................................................................................................
Our total direct and guaranteed credit exposure to non-U.S. governments is $22.5 billion at December 31, 2012,
compared to $26.2 billion in December 31, 2011. Our single largest concentration was to the government of Japan in
the amount of $8.1 billion at December 31, 2012. Most of these securities were held in the investment portfolios of
our Japanese insurance operations.
The following table presents our aggregate (gross and net) credit exposures to non-U.S. governments:
Japan $ 9,205
Canada 3,153
Germany 1,854
France 1,157
China 132
United Kingdom 1,615
Australia 879
Mexico 507
Netherlands 442
Russia 293
Other 6,934
Total $ 26,171
Financial Institution Concentrations..............................................................................................................................................................................................
Our single largest industry credit exposure in 2012 was to the global financial institutions sector as a whole, which
includes banks and finance companies, securities firms, and insurance and reinsurance companies, many of which
can be highly correlated at times of market stress. As of December 31, 2012, credit exposure to this sector was
$85.5 billion, or 84 percent of Total equity compared to 106 percent at December 31, 2011.
..................................................................................................................................................................................................................................
AIG 2012 Form 10-K158
December 31, December 31,
(in millions) 2012 2011
$ 8,109
2,718
1,446
1,207
926
816
601
552
442
340
5,350
$ 22,507
I T E M 7 / E N T E R P R I S E R I S K M A N A G E M E N T

.....................................................................................................................................................................................
At December 31, 2012:
• $80.6 billion, or 94 percent, of these global financial institution credit exposures were considered investment grade
based on our internal ratings.
• $4.9 billion, or 6 percent, were considered non-investment grade. Most of the non-investment grade exposure was
to financial institutions in countries that we believe are not of investment grade quality. Aggregate credit exposure
to the ten largest below investment grade-rated financial institutions was $2.1 billion.
• Our aggregate credit exposure to fixed maturity securities of the financial institution sector amounted to
$34.4 billion.
• Short-term bank deposit placements, reverse repurchase agreements, repurchase agreements and commercial
paper issued by financial institutions (primarily commercial banks), operating account balances with banks and
bank-issued commercial letters of credit supporting insurance credit exposures were $20.4 billion, or 24 percent of
the total global financial institution credit exposure.
• The remaining credit exposures to this sector were primarily related to reinsurance recoverables, collateral
extended to counterparties mostly pursuant to derivative transactions, derivatives, and captive fronting risk
management programs for these financial institutions.
European Concentrations..............................................................................................................................................................................................
We actively monitor our European credit exposures, especially those exposures to issuers in the Euro-Zone
periphery. We use various stress assumptions to identify issuers and securities warranting review by senior
management and to determine the need for mitigating actions. As a mitigating action, we typically decide not to
renew maturing exposures or, when the opportunity presents itself, to sell or to tender securities. To date, we have
not actively used credit default protection. We periodically evaluate the financial condition of issuers and adjust
internal risk ratings as warranted.
The result of these continuing reviews has led us to believe that our combined credit risk exposures to sovereign
governments, financial institutions and non-financial corporations in the Euro-Zone are manageable risks given the
type and size of exposure and the credit quality and size of the issuers.
The following table presents our aggregate United Kingdom and European credit exposures (excluding ILFC)
by major sector:
Euro-Zone countries:France $ 8,612Germany 14,696Netherlands 8,650Spain 4,909Italy 2,816Belgium 1,062Ireland 1,644Luxembourg 613Austria 557Finland 378Other Euro-Zone 253
Total Euro-Zone $ 44,190
Remainder of EuropeUnited Kingdom $ 29,052Switzerland 7,670Sweden 5,584Other remainder of Europe 5,492
Total remainder of Europe $ 47,798
Total $ 91,988
(a) Other represents mortgage guaranty insurance ($1.3 billion), primarily in Spain ($941 million) and Italy ($188 million).
..................................................................................................................................................................................................................................
AIG 2012 Form 10-K 159
December 31, 2012
Structured December 31,Financial Non-Financial Products/ 2011
(in millions) Sovereign Institution Corporates Other(a) Total Total
$ 1,207 $ 2,535 $ 6,728 $ 63 $ 10,5331,446 3,675 3,879 248 9,248
442 4,205 2,295 1,391 8,333146 682 2,197 1,042 4,067
96 348 2,168 236 2,848132 209 833 – 1,174
– 98 858 62 1,018– 24 607 35 666
157 168 198 – 523138 32 262 – 432
26 22 245 13 306
$ 3,790 $ 11,998 $ 20,270 $ 3,090 $ 39,148
$ 816 $ 9,557 $ 15,802 $ 4,197 $ 30,37267 4,521 2,702 – 7,290
195 2,934 514 – 3,6431,098 1,659 1,715 1,140 5,612
$ 2,176 $ 18,671 $ 20,733 $ 5,337 $ 46,917
$ 5,966 $ 30,669 $ 41,003 $ 8,427 $ 86,065
I T E M 7 / E N T E R P R I S E R I S K M A N A G E M E N T

.....................................................................................................................................................................................
Aggregate credit exposure to European governments totaled $6.0 billion at December 31, 2012, compared to
$7.6 billion at December 31, 2011. Many of the European governments’ ratings have been downgraded by one or
more of the major rating agencies, occurring mostly in countries in the Euro-Zone periphery (Spain, Italy and
Portugal) where our government credit exposures totaled $245 million at December 31, 2012. The downgrades
primarily reflect large government budget deficits, rising government debt-to-GDP ratios and large financing
requirements of these countries, which have led to difficult financing conditions. These credit exposures primarily
included available-for-sale and trading securities (at fair value) issued by these governments. At December 31, 2012,
we had no direct or guaranteed credit exposure to the governments of Greece or Ireland.
Our exposure to European financial institutions at December 31, 2012 included $20.2 billion of credit exposures to
European banks, of which $18.7 billion were considered investment grade based on our internal ratings. Aggregate
below investment grade rated credit exposures to European banks were $1.4 billion. Our credit exposures to banks
domiciled in the Euro-Zone countries totaled $8.0 billion at December 31, 2012, of which $4.4 billion were fixed
maturity securities. Credit exposures to banks based in the five countries of the Euro-Zone periphery (Spain, Italy,
Ireland, Greece, and Portugal) totaled $993 million, of which $707 million were fixed maturity securities. These credit
exposures were primarily to the largest banks in Spain and Italy. Credit exposures to banks based in France totaled
$1.5 billion at December 31, 2012, of which $833 million were fixed maturity securities. Our credit exposures were
predominantly to the largest banks in these countries.
In addition, our exposure at December 31, 2012 to European financial institutions included $10.5 billion of aggregate
credit exposure to non-bank institutions, mostly insurers and reinsurers, with $7.6 billion, or 73 percent, of credit
exposure representing reinsurance recoverable balances. Reinsurance recoverables were primarily to highly rated
reinsurers based in Switzerland, the United Kingdom and Germany. $1.3 billion of the aggregate credit exposure at
December 31, 2012 to non-banks was fixed maturity securities, of which 94 percent were considered investment
grade based on our internal ratings.
Of the $19.3 billion of non-financial institution corporate exposure to Euro-Zone countries at December 31, 2012,
93 percent was to fixed maturity securities ($11.0 billion) and insurance-related products ($7.0 billion), with the
majority of the insurance exposures being captive fronting programs ($3.0 billion), trade credit insurance ($1.9 billion),
and surety bonds ($1.5 billion). France’s exposure of $6.6 billion at December 31, 2012 represented the largest
single non-financial corporate country exposure within the Euro-Zone, of which $2.6 billion were fixed maturity
securities. Approximately two-thirds of the French exposures were to issuers in the utilities, oil and gas, and
telecommunications industries. Euro-Zone periphery non-financial institution corporate exposures ($5.0 billion) at
December 31, 2012 were heavily weighted towards large multinational corporations or issuers in relatively stable
industries, such as regulated utilities (25 percent), telecommunications (17 percent), and oil and gas (13 percent).
Of the $6.1 billion at December 31, 2012 of United Kingdom and European structured product exposures (largely
consisting of residential mortgage-backed, commercial mortgage-backed and other asset-backed securities), United
Kingdom structured products accounted for 69 percent, while the Netherlands and Germany comprised 23 percent
and 2 percent, respectively. Structured product exposures to the Euro-Zone periphery accounted for 4 percent of the
total. Approximately 89 percent of the United Kingdom and European structured products exposures were rated A or
better at December 31, 2012 based on external rating agency ratings.
In addition, we had commercial real estate-related net equity investments in Europe totaling $497 million at
December 31, 2012 and related unfunded commitments of $105 million.
..................................................................................................................................................................................................................................
AIG 2012 Form 10-K160
I T E M 7 / E N T E R P R I S E R I S K M A N A G E M E N T

.....................................................................................................................................................................................
The following table presents our aggregate United Kingdom and European credit exposures (excluding ILFC)
by product type:
Euro-Zone countries:
France $ 8,612
Germany 14,696
Netherlands 8,650
Spain 4,909
Italy 2,816
Belgium 1,062
Ireland 1,644
Luxembourg 613
Austria 557
Finland 378
Other Euro-Zone 253
Total Euro-Zone $ 44,190
Remainder of Europe
United Kingdom $ 29,052
Switzerland 7,670
Sweden 5,584
Other remainder of Europe 5,492
Total remainder of Europe $ 47,798
Total $ 91,988
(a) Fixed maturity securities primarily includes available-for-sale and trading securities reported at fair value of $41.4 billion ($41.4 billion amortized
cost), and $3.4 billion ($3.4 billion amortized cost), respectively.
(b) Cash and short-term investments include bank deposit placements ($3.8 billion), collateral posted to counterparties against structured products
($1.9 billion), securities purchased under agreements to resell ($187 million), and operating accounts ($115 million).
(c) Insurance Credit Exposures primarily consist of captive fronting management programs ($10.7 billion), trade credit insurance ($6.2 billion), and
surety bonds ($2.1 billion) and commercial letters of credit supporting insurance credit exposures ($794 million).
(d) Other primarily consists of derivative transactions reported at fair value.
At December 31, 2012, approximately 86 percent of fixed maturity securities in the United Kingdom and European
exposures were considered investment grade based on our internal ratings. European financial institution fixed
maturity securities exposure was $10.2 billion, of which $1.1 billion were covered bonds (debt securities secured by a
pool of financial assets sufficient to cover any bondholder claims and that have full recourse to the issuing bank).
$4.4 billion of fixed maturity securities were issued by banks domiciled in the Euro-Zone countries. Our subordinated
debt holdings and Tier 1 and preference share securities in these banks totaled $901 million and $312 million,
respectively, at December 31, 2012. These exposures were predominantly to the largest banks in those countries.
Other Credit Concentrations..............................................................................................................................................................................................
We have a risk concentration in the U.S. municipal sector, primarily through the investment portfolios of our
insurance companies. A majority of these securities were held in available-for-sale portfolios of our domestic property
and casualty insurance companies. See Investments – Available for Sale Investments herein for further details. We
had $464 million of additional exposure to the municipal sector outside of our insurance company portfolios at
December 31, 2012, compared to $892 million at December 31, 2011. These exposures consisted of derivatives and
trading securities (at fair value), and exposure related to other insurance and financial services operations.
We have a risk concentration in the residential mortgage sector in the form of non-agency RMBS, CDO of RMBS as
well as our mortgage guaranty insurance business. See Investments – Available for Sale Investments herein for
further details on RMBS and CDO investments. The net risk-in-force for UGC was $33.6 billion at December 31,
2012, of which exposure in the United States was $30.4 billion.
..................................................................................................................................................................................................................................
AIG 2012 Form 10-K 161
December 31, 2012
Fixed Cash and Insurance December 31,Maturity Short-Term Credit Reinsurance 2011
(in millions) Securities(a) Investments(b) Exposures(c) Recoverables Other(d) Total Total
$ 4,834 $ 422 $ 3,349 $ 590 $ 1,338 $ 10,533
4,655 633 1,976 1,755 229 9,248
5,817 56 1,745 619 96 8,333
1,872 135 2,041 18 1 4,067
1,616 2 1,151 59 20 2,848
796 1 369 4 4 1,174
784 61 172 – 1 1,018
307 3 356 1 – 667
316 7 197 2 1 523
313 13 104 2 – 432
140 10 151 1 3 305
$ 21,450 $ 1,343 $ 11,611 $ 3,051 $ 1,693 $ 39,148
$ 15,600 $ 1,822 $ 8,814 $ 2,189 $ 1,947 $ 30,372
3,011 448 1,060 2,767 4 7,290
1,550 1,804 286 3 – 3,643
3,228 613 1,310 90 371 5,612
$ 23,389 $ 4,687 $ 11,470 $ 5,049 $ 2,322 $ 46,917
$ 44,839 $ 6,030 $ 23,081 $ 8,100 $ 4,015 $ 86,065
I T E M 7 / E N T E R P R I S E R I S K M A N A G E M E N T

.....................................................................................................................................................................................
We also have a risk concentration in the commercial real estate sector in the form of non-agency CMBS, CDO of
CMBS as well as commercial mortgage whole loans. See Investments – Available for Sale Investments and
Investments – Commercial Mortgage Loans herein for further details.
We also monitor our aggregate cross-border exposures by country and region. Cross-border exposure is defined as
an underlying risk that is taken within a country or jurisdiction other than the country or jurisdiction in which an AIG
business unit taking the risk is domiciled. These cross-border exposures include both aggregated cross-border credit
exposures to unrelated third parties and cross-border investments in our own international subsidiaries. Five
countries had cross-border exposures in excess of 10 percent of Total equity at December 31, 2012 compared to six
countries at December 31, 2011. Based on our internal risk ratings, at December 31, 2012, three countries were
rated AAA and two were rated AA. The two largest cross-border exposures were to the United Kingdom and
Bermuda.
We regularly review concentration reports in the categories listed above as well as credit trends by risk ratings and
credit spreads. We periodically adjust limits and review exposures for risk mitigation to provide reasonable assurance
that we do not incur excessive levels of credit risk and that our credit risk profile is properly calibrated across
business units.
Market Risk Management..............................................................................................................................................................................................
We are exposed to market risks, primarily within our insurance and capital markets businesses. In our insurance
operations, market risk results primarily from potential mismatches in our asset-liability exposures, rather than
speculative positioning. Specifically, our life insurance and retirement businesses collect premiums or deposits from
policyholders and invest the proceeds in predominantly long-term, fixed maturity securities. We earn a spread
between the asset yield and the cost payable to policyholders. We manage the business so that the cash flows from
invested assets are sufficient to meet policyholder obligations when they become due, without the need to sell assets
prematurely into a potentially distressed market. In periods of severe market volatility, depressed and illiquid fair
values on otherwise performing investments diminish shareholders’ equity even without actual credit event related
losses.
Our market exposures can be categorized as follows:
• Benchmark interest rates are also known as risk-free interest rates and are associated
with either the government/treasury yield curve or the swap curve. The fair value of our significant fixed maturity
securities portfolio changes as benchmark interest rates change.
• Credit spread risk is the potential for loss due to a change in an instrument’s risk
premium or yield relative to that of a comparable duration, default-free instrument.
• We are exposed to equity and alternative investment prices affecting
a variety of instruments. These include direct investments in common stock and mutual funds, minimum benefit
guarantees embedded in the structure of certain variable annuity and variable life insurance products and other
equity-like investments, such as hedge funds and private equity funds, private equity investments, commercial real
estate and real estate funds.
Market risk is defined as the potential loss arising from adverse fluctuations in interest rates, foreign currencies,
equity and commodity prices, and their levels of volatility. Market risk includes credit spread risk, the potential loss
arising from adverse fluctuations in credit spreads of securities or counterparties.
Benchmark interest rates.
Credit spread or risk premium.
Equity and alternative investment prices.
..................................................................................................................................................................................................................................
AIG 2012 Form 10-K162
I T E M 7 / E N T E R P R I S E R I S K M A N A G E M E N T

.....................................................................................................................................................................................
• We are a globally diversified enterprise with significant income, assets and
liabilities denominated in, and significant capital deployed in, a variety of currencies.
We use a number of measures and approaches to measure and quantify our market riskexposure, including:
• Duration is the measure of the sensitivities of a fixed-income instrument to the
changes in the benchmark yield curve. Key rate duration measures sensitivities to the movement at a given term
point on the yield curve.
• Scenario analysis uses historical, hypothetical, or forward-looking macroeconomic scenarios
to assess and report exposures. Examples of hypothetical scenarios include a 100 basis point parallel shift in the
yield curve or a 10 percent immediate and simultaneous decrease in world-wide equity markets.
• Stress testing is a special form of scenario analysis in which the scenarios are designed to lead
to a material adverse outcome. Examples of such scenarios include the stock market crash of October 1987 or
the widening of yields or spread of RMBS or CMBS during 2008.
• VaR is a summary statistical measure that uses the estimated volatility and correlation of market factors,
and a management-determined level of confidence, to estimate how frequently a portfolio of risk exposures could
be expected to lose at least a specified amount.
..............................................................................................................................................................................................
The following table provides estimates of our sensitivity to changes in yield curves, equity prices and
foreign currency exchange rates:
Yield sensitive assets $ 326,200 100 bps parallel increase in all yield curves $ (15,800)
Equity and alternative 20% decline in stock prices and value of
investments exposure $ 39,000 alternative investments $ (7,800)
Foreign currency 10% depreciation of all foreign currency
exchange rates net exchange rates against the U.S. dollar $ (590)
exposure $ 5,900
Exposures to yield curve movements include fixed maturity securities, loans, finance receivables and short-term
investments, but exclude consolidated separate account assets. Total yield-sensitive assets decreased 6.2 percent or
approximately $20.4 billion compared to 2011, primarily due to a net decrease in fixed income securities and other
fixed assets of $15.6 billion, and a decrease in cash equivalents of $4.8 billion.
Exposures to equity and alternative investment prices include investments in common stock, preferred stocks, mutual
funds, hedge funds, private equity funds, commercial real estate and real estate funds, but exclude consolidated
separate account assets. Total exposure in these areas decreased 30.3 percent or approximately $11.8 billion in
2012 compared to 2011. This was primarily due to a decrease of $12.4 billion related to our sale of AIA equity
securities as well as decreases in mutual fund values of $129 million and other equity investments of $18 million.
The decrease was partially offset by increases in other common equity securities of $125 million, partnership values
of $197 million and real estate investments of $397 million.
Exposures to foreign currency exchange rates reflect our consolidated non-U.S. dollar net capital investments on a
GAAP basis. Foreign currency exchange rates net exposure increased 53.7 percent or $3.2 billion in 2012 compared
to 2011. This was primarily due to an increase in British pound exposure of $1.7 billion as a result of AIG Europe’s
foreign currency exchange hedging and investment strategy, an increase in market value of fixed maturity securities
of $188 million as well as unrealized investment appreciation and positive results from AIG Europe Ltd operations of
$99 million. Other increases included: changes in Canadian-dollar denominated unearned premium reserves of
Foreign currency exchange rates.
Duration/key rate duration.
Scenario analysis.
Stress testing.
VaR.
Insurance Operations Portfolio Sensitivities
..................................................................................................................................................................................................................................
AIG 2012 Form 10-K 163
Exposure Effect
December 31, December 31, December 31, December 31,
(dollars in millions) 2012 2011* Sensitivity Factor 2012 2011
$ 305,809 $ (16,005)
$ 27,131 $ (5,426)
$ (911)
$ 9,106
I T E M 7 / E N T E R P R I S E R I S K M A N A G E M E N T
.e e giress es ngt t tiS
.a a aoe i y icenar o ana s si l iS
.a a ao oe e du i y u ira on e ra e ra onD t t tD i /k d i

.....................................................................................................................................................................................
$378 million and a net increase of Canadian-dollar exposure of $92 million due to unrealized investment appreciation
and positive results from operations; Euro exposure as a result of a reduction in euro-denominated debt outstanding
of $231 million, additional purchases of the AIRE real estate investment vehicle of $109 million as well as unrealized
investment appreciation and positive results from operations at AIG Europe SA of $147 million; and a net increase
across currencies of $258 million.
For illustrative purposes, we modeled our sensitivities based on a 100 basis point increase in yield curves, a
20 percent decline in equities and alternative assets, and a 10 percent depreciation of all foreign currency exchange
rates against the U.S. dollar. This should not be taken as a prediction, but only as a demonstration of the potential
effects of such events.
The sensitivity factors utilized for 2012 and presented above were selected based on historical data from 1992 to
2012, as follows (see the table below):
• a 100 basis point parallel shift in the yield curve is consistent with a one standard deviation movement of the
benchmark ten-year treasury yield;
• a 20 percent drop for equity and alternative investments is broadly consistent with a one standard deviation
movement in the S&P 500; and
• a 10 percent depreciation of foreign currency exchange rates is consistent with a one standard deviation
movement in the U.S. dollar (USD)/Japanese Yen (JPY) exchange rate.
10-Year Treasury 1992-2012 0.01 0.01 0.99 – 0.11 0.01
S&P 500 1992-2012 0.19 0.20 1.07 0.13 0.72 0.20
USD/JPY 1992-2012 0.11 0.10 0.88 (0.11) 1.00 0.10
Liquidity Risk Management..............................................................................................................................................................................................
The failure to appropriately manage liquidity risk can result in reduced operating flexibility, increased costs, and
reputational harm. Because liquidity is critically important, our liquidity governance includes a number of liquidity and
funding policies and monitoring tools to address both AIG-specific, broader industry and market related liquidity
events.
Sources of Liquidity risk can include, but are not limited to:
• financial market movements – significant changes in interest rates can provide incentives for policyholders to
surrender their policies. Changes in markets can impact collateral posting requirements or create difficulty to
liquidate assets at reasonable values to meet liquidity needs due to unfavorable market conditions, inadequate
market depth, or other investors seeking to sell the same or similar assets;
• potential reputational events or credit downgrade – changes can have an impact on policyholder cancellations and
withdrawals or impact collateral posting requirements; and
• catastrophic events, including natural and man-made disasters, can increase policyholder claims
The principal objective of ERM’s liquidity risk framework is to protect AIG’s liquidity position and identify a diversity of
funding sources available to meet actual and contingent liabilities during both normal and stress periods.
AIG Parent
liquidity risk tolerance levels are established for base and stress scenarios over a two-year time horizon designed to
ensure that funding needs are met under varying market conditions. If we project that we will breach the tolerance,
we will assess and determine the appropriate liquidity management actions. However, the market conditions in effect
at that time may not permit us to achieve an increase in liquidity sources or a reduction in liquidity requirements.
Liquidity risk is defined as the risk that our financial condition will be adversely affected by the inability or perceived
inability to meet our short-term cash, collateral or other financial obligations.
We have structured our consolidated risk target to maintain a minimum liquidity buffer.
..................................................................................................................................................................................................................................
AIG 2012 Form 10-K164
2012 Scenario 2012 as a Original 2011
as a Multiple 2012 Multiple Scenario (based on
Standard Suggested of Standard Change/ of Standard Standard Deviation for
Period Deviation 2012 Scenario Deviation Return Deviation 1990-2011 Period)
I T E M 7 / E N T E R P R I S E R I S K M A N A G E M E N T

.....................................................................................................................................................................................
Additionally, each business unit is responsible for managing liquidity within a framework designed for the
measurement and monitoring of liquidity risks inherent to the business. Current cash and liquidity positions are
reviewed for changes and against minimum liquidity levels. Future cash inflows and outflows are tracked through
cash flow forecasting. If the business unit projects a breach of the minimum liquidity levels, the amount of required
liquidity resources will be identified and we will determine any actions to be taken. Business unit level key indicators
are assessed to provide advance warning of potential liquidity risks.
Operational Risk Management..............................................................................................................................................................................................
Operational risk is inherent in each of our business units and corporate functions. It may extend beyond financial
losses, including errors, fraudulent acts, business interruptions, inappropriate behavior of employees, or vendors that
do not perform in accordance with agreed upon terms.
Our Operational Risk Management (ORM) function, which supports AIG’s ORC has the responsibility to provide an
aggregate view of our operational risk profile. AIG ORM oversees our Operational Risk policy and framework, which
includes risk identification, measurement, monitoring and reporting.
Each Business Unit is primarily responsible for managing its operational risks and implementing the components of
the operational risk management program. In addition, certain control functions have been assigned accountability for
enterprise-wide risk management oversight for their respective areas. These control functions include: Sarbanes-
Oxley (SOX), Business Continuity Management (BCM), Information Technology Security Risk, Compliance, and
Vendor Management. Senior business operational risk executives report to their respective business unit chief risk
officer and to the Head of our ORM. This reporting structure enables a close alignment with the businesses while
ensuring consistent implementation of operational risk management practices.
A strong operational risk management program facilitates the identification and mitigation ofoperational risk issues. In order to accomplish this, our operational risk managementprogram is designed to:
• pro-actively address potential operational risk issues;
• create transparency at all levels of the organization; and
• assign clear ownership and accountability for addressing identified issues.
As part of the ORM framework, we use a risk and control self assessment (RCSA) process to identify key operational
risks and evaluate the effectiveness of existing controls to mitigate those risks. Corrective action plans are developed
to address identified issues. Businesses are accountable for tracking and resolving these issues. A standard RCSA
approach is also followed firm-wide for certain key risk processes (for example, SOX, IT Security Risk, Compliance,
Business Continuity Management and Vendor Management).
Operational risk management reporting to senior management and operational risk governance committees provides
awareness of operational risk exposures, identifies key risks and facilitates management decision making. Reporting
includes RCSA information such as operational risk events, self-assessment results and the status of issue resolution
to senior management.
Insurance Operations Risks..............................................................................................................................................................................................
Our insurance businesses are conducted on a global basis and expose us to a wide variety of risks with different
time horizons. We manage these risks throughout the organization, both centrally and locally, through a number of
procedures:
• pre-launch approval of product design, development and distribution;
• underwriting approval processes and authorities;
Operational risk is defined as the risk of loss resulting from inadequate or failed internal processes, people, systems,
or from external events. Operational risk includes legal risk and reputational harm.
Except as described above, we manage our business risk oversight activities through our insurance operations.
..................................................................................................................................................................................................................................
AIG 2012 Form 10-K 165
I T E M 7 / E N T E R P R I S E R I S K M A N A G E M E N T

.....................................................................................................................................................................................
• exposure limits with ongoing monitoring;
• modeling and reporting of aggregations and limit concentrations at multiple levels (policy, line of business, product
group, country, individual/group, correlation and catastrophic risk events);
• compliance with financial reporting and capital and solvency targets;
• use of reinsurance, both internal and third-party; and
• review and establishment of reserves.
We closely manage insurance risk by monitoring and controlling the nature and geographic location of the risks in
each line of business underwritten, the terms and conditions of the underwriting and the premiums we charge for
taking on the risk. We analyze concentrations of risk using various modeling techniques, including both probability
distributions (stochastic) and single-point estimates (deterministic) approaches.
Our major categories of insurance risks are:
• – risks covered include property, casualty, fidelity/surety,
accident and health, aviation and management liability. We manage risks in the general insurance segment
through aggregations and limitations of concentrations at multiple levels: policy, line of business, geography,
industry and legal entity.
• – risks include mortality and
morbidity in the insurance-oriented products and insufficient cash flows to cover contract liabilities in the retirement
savings-oriented products. We manage risks through product design, sound medical underwriting, external
traditional reinsurance programs and external catastrophe reinsurance programs.
• – We manage risks in the mortgage insurance business
through geographic location of the insured properties, the relative economic conditions in the local housing
markets, credit attributes of the borrowers, and the loan amount relative to the value of the respective collateral.
Reinsurance facilitates insurance risk management
(retention, volatility, concentrations) and capital planning. We may purchase reinsurance on a pooled basis. Pooling
of our reinsurance risks enables us to purchase reinsurance more efficiently at a consolidated level, manage global
counterparty risk and relationships and manage global catastrophe risks, both for AIG Property Casualty and AIG Life
and Retirement.
AIG Property Casualty Key Insurance Risks..............................................................................................................................................................................................
A primary goal in managing our AIG Property Casualty operations is to achieve an acceptable return on equity. To
achieve this goal, we must be disciplined in risk selection, premium adequacy, and appropriate terms and conditions
to cover the risk accepted.
We manage insurance risks through risk review and selection processes, exposure limitations, exclusions,
deductibles, self-insured retentions, coverage limits and reinsurance. This management is supported by sound
underwriting practices, pricing procedures and the use of actuarial analysis to help determine overall adequacy of
provisions for insurance. Underwriting practices and pricing procedures incorporate historical experience, current
regulation and judicial decisions as well as proposed or anticipated regulatory changes.
For AIG Property Casualty, insurance risks primarily emanate from the following:
• – The potential inadequacy of the liabilities we establish for unpaid
losses and loss expenses is a key risk faced by AIG Property Casualty. There is significant uncertainty in factors
that may drive the ultimate development of losses compared to the estimates of losses and loss expenses. We
manage this uncertainty through internal controls and oversight of the loss reserve setting process, as well as
reviews by external experts. See Item 1 Business – A review of Liability for unpaid claims and claims adjustment
expense herein for further details.
Property and Casualty (AIG Property Casualty)
Domestic Life Insurance & Retirement Service (AIG Life and Retirement)
Mortgage Guaranty (United Guaranty Corporation)
We purchase reinsurance for our insurance operations.
Unpaid Loss and Loss Expense Reserves
..................................................................................................................................................................................................................................
AIG 2012 Form 10-K166
I T E M 7 / E N T E R P R I S E R I S K M A N A G E M E N T

.....................................................................................................................................................................................
• – The potential inadequacy of premium charged for risks underwritten in our portfolios can impact
AIG Property Casualty’s ability to achieve an underwriting profit. We develop pricing based on our estimates of
losses and expenses, but factors such as market pressures and the inherent uncertainty and complexity in
estimating losses may result in premiums that are inadequate to generate underwriting profit.
• – Our business is exposed to various catastrophic events in which multiple losses can
occur and affect multiple lines of business in any calendar year. Natural disasters, such as hurricanes, earthquakes
and other catastrophes, have the potential to adversely affect our operating results. Other risks, such as a
man-made catastrophes or pandemic disease, could also adversely affect our business and operating results to the
extent they are covered by our insurance products.
• – Since we use reinsurance to limit our losses, we are exposed to risks associated with reinsurance
including the unrecoverability of expected payments from reinsurers either due to an inability or unwillingness to
pay, contracts do not respond as we intended, or that actual reinsurance coverage is different than anticipated.
Catastrophe Exposures
To control catastrophe exposure, we use a combination of techniques, including setting key business unit limits
based on an aggregate PML, monitoring and modeling accumulated exposures, and purchasing catastrophe
reinsurance to supplement our other reinsurance protections. The majority of policies exposed to catastrophic events
are one-year contracts allowing us to quickly adjust our exposure to catastrophic events if climate changes or other
events increase the frequency or severity of catastrophes.
We use industry recognized models and other tools to evaluate catastrophic events and assess the probability and
magnitude of such events. We periodically monitor the exposure risks of our worldwide AIG Property Casualty
operations and adjust the models accordingly.
The following is an overview of modeled losses for AIG Property Casualty exposure associated with the more
significant natural perils. The modeled results assume that all reinsurers fulfill their obligations to AIG in accordance
with their terms.
AIG Property Casualty utilizes industry recognized catastrophe models. The use of different methodologies and
assumptions could materially change the projected losses. Therefore, these modeled losses may not be comparable
to estimates made by other companies. These estimates are inherently uncertain and may not reflect our maximum
exposures to these events. It is highly likely that our losses will vary, perhaps significantly, from these estimates.
The modeled results provided in the table below were based on the Aggregate Exceedance Probability (AEP) losses
which represent total property, workers’ compensation, and A&H losses that may occur in any single year from one
or more natural events. The values provided were based on 100-year return period losses, which have a one percent
likelihood of being exceeded in any single year. The A&H data include exposures for United States and Japan
earthquakes. These exposures represent the largest share of A&H exposures to earthquakes. A&H losses were
modeled using April 2010 data. The property exposures were modeled with data as of September 2012. All
reinsurance program structures, domestic and international, reflect the reinsurance programs in place as of
January 1, 2013. Losses include loss adjustment expenses and the net values include reinstatement premiums.
Natural Peril:
Earthquake $ 5,884 $ 3,766 $ 2,448 2.48%
Tropical Cyclone* $ 6,190 $ 3,546 $ 2,305 2.34%
* Includes hurricanes, typhoons and European windstorms.
Gross earthquake and tropical cyclone modeled losses decreased $926 million and $2.3 billion, respectively,
compared to 2011, while net losses decreased $335 million and $1.7 billion, respectively, compared to 2011.
Changes in both gross and net losses are primarily due to underwriting decisions to actively manage catastrophe
exposure in the United States.
Underwriting
Catastrophe Exposure
Reinsurance
..................................................................................................................................................................................................................................
AIG 2012 Form 10-K 167
Net of 2013
At December 31, 2012 Net of 2013 Reinsurance, Percent of
(in millions) Gross Reinsurance After Tax Total Equity
I T E M 7 / E N T E R P R I S E R I S K M A N A G E M E N T

.....................................................................................................................................................................................
In addition to the aggregate return period loss, we evaluate potential single event earthquake and hurricane losses.The single events utilized are a subset of potential events identified and utilized by Lloyd’s (see Lloyd’s RealisticDisaster Scenarios, Scenario Specifications, January 2013) and referred to as Realistic Disaster Scenarios (RDS).
The purpose of this type of analysis is to provide a frame of reference and context for the model results. The specificevents used for this analysis do not necessarily represent the worst case loss that we could incur from this type ofan event in these regions. The losses associated with the RDS are included in the following table.
Single-event modeled property and workers’ compensation losses and loss adjustment expenses to AIG’s
worldwide portfolio of risk for key geographic areas are shown below.
Natural Peril:Northeast Hurricane $ 3,706 $ 1,721Gulf Coast Hurricane $ 3,703 $ 1,857Los Angeles Earthquake $ 4,987 $ 2,886San Francisco Earthquake $ 5,425 $ 2,977Miami Hurricane $ 3,275 $ 1,093Japanese Earthquake $ 1,542 $ 968European Windstorm $ 802 $ 483Japanese Typhoon $ 1,125 $ 577
(a) After the application of policy limits and deductibles.
(b) Calculated using the AIG reinsurance program in effect as at January 1, 2013, including reinstatement premiums. AIG’s reinsurance program
includes industry loss warranty (ILW) contracts under which there is basis risk between AIG’s losses and the total industry loss. The net of
reinsurance amount in the table above includes a positive impact from these ILWs, which may not be indicative of actual experience.
We also monitor key international property risks utilizing industry recognized natural catastrophe models. Based onthe occurrence exceedance probabilities, the 100-year return period loss for Japanese Earthquake is $1.1 billiongross and $885 million net; the 100-year return period loss for European Windstorm is $575 million gross and$503 million net; and the 100-year return period loss for Japanese Typhoon is $1.7 billion gross and $842 million net.
ACTUAL RESULTS IN ANY PERIOD ARE LIKELY TO VARY, PERHAPS MATERIALLY, FROM THE MODELEDSCENARIOS. THE OCCURRENCE OF ONE OR MORE SEVERE EVENTS COULD HAVE A MATERIAL ADVERSEEFFECT ON OUR FINANCIAL CONDITION, RESULTS OF OPERATIONS AND LIQUIDITY. See also Item 1A. RiskFactors – Reserves and Exposures for additional information.
Terrorism
We actively monitor terrorism risk and strive to control exposure to loss from terrorist attack by limiting the aggregateaccumulation insurance that is underwritten in defined target locations. We use modeling to provide projections ofProbable Maximum Loss (PML) by target location based upon the actual exposures of our policyholders.
We also share our exposures to terrorism risks under the Terrorism Risk Insurance Program Reauthorization Act of2007 (TRIPRA). TRIPRA covers terrorist attacks in the United States only and excludes, as specified by applicablelaw, certain commercial lines of business as well as A&H, group life and personal lines. In 2012 and beginningJanuary 1, 2013, our deductible under TRIPRA was approximately $3.0 billion and $2.8 billion, respectively, with a15 percent coinsurance retention of certified terrorism losses in excess of the deductible for each period.
We offer terrorism coverage in many other countries through various insurance products and participate in countryterrorism pools when applicable. International terrorism exposure is managed through active aggregation control andtargeted reinsurance purchases for lines of business such as commercial property, political risk, aviation and A&H.
Reinsurance Recoverables
AIG’s reinsurance recoverable assets are comprised of:
• Paid losses recoverable – balances due from reinsurers for losses and loss expenses paid by our subsidiaries andbilled, but not yet collected.
• Ceded loss reserves – ultimate ceded reserves for losses and loss expenses, including reserves for claimsreported but not yet paid and estimates for IBNR.
• Ceded reserves for unearned premiums.
..................................................................................................................................................................................................................................
AIG 2012 Form 10-K168
At December 31, 2012 Net of 2013
(in millions) Gross(a) Reinsurance(b)
I T E M 7 / E N T E R P R I S E R I S K M A N A G E M E N T

.....................................................................................................................................................................................
At December 31, 2012, total reinsurance recoverable assets were $25.6 billion. These assets include general
reinsurance paid losses recoverable of $1.3 billion, ceded loss reserves of $19.2 billion including reserves for
incurred but not reported (IBNR) claims, and ceded reserves for unearned premiums of $3.6 billion, as well as life
reinsurance recoverables of $1.5 billion. The methods used to estimate IBNR and to establish the resulting ultimate
losses involve projecting the frequency and severity of losses over multiple years. These methods are continually
reviewed and updated by management. Any adjustments are reflected in income. We believe that the amount
recorded for ceded loss reserves at December 31, 2012 reflect a reasonable estimate of the ultimate losses
recoverable. Actual losses may, however, differ from the reserves currently ceded.
The Reinsurance Credit Department (RCD) conducts periodic detailed assessments of the financial strength and
condition of current and potential reinsurers, both foreign and domestic. The RCD monitors both the financial
condition of reinsurers as well as the total reinsurance recoverable ceded to reinsurers, and set limits with regard to
the amount and type or exposure we are willing to take with reinsurers. As part of these assessments, we attempt to
identify whether a reinsurer is appropriately licensed, assess its financial capacity and liquidity; and evaluate the local
economic and financial environment in which a foreign reinsurer operates. The RCD reviews the nature of the risks
ceded and the need for measures, including collateral to mitigate credit risk. For example, in our treaty reinsurance
contracts, we frequently include provisions that require a reinsurer to post collateral or use other measures to reduce
exposure when a referenced event occurs. Furthermore, we limit our unsecured exposure to reinsurers through the
use of credit triggers such as insurer financial strength rating downgrades, declines in regulatory capital, or relevant
risk-based capital (RBC) ratios fall below certain levels. We also set maximum limits for reinsurance recoverable
exposure, which in some cases is the recoverable amount plus an estimate of the maximum potential exposure from
unexpected events for a reinsurer. In addition, credit executives within ERM review reinsurer exposures and credit
limits and approve reinsurer credit limits above specified levels. Finally, even where we conclude that uncollateralized
credit risk is acceptable, we require collateral from active reinsurance counterparties where it is necessary for our
subsidiaries to recognize the reinsurance recoverable assets for statutory accounting purposes. At December 31,
2012, we held $8.6 billion of collateral, in the form of funds withheld, securities in reinsurance trust accounts and/or
irrevocable letters of credit, in support of reinsurance recoverable assets from unaffiliated reinsurers. We believe that
no exposure to a single reinsurer represents an inappropriate concentration of risk to AIG, nor is our business
substantially dependent upon any single reinsurance contract.
The following table presents information for each reinsurer representing in excess of five percent of our total
reinsurance recoverable assets:
Reinsurer:Berkshire Hathaway Group of
Companies AA+ A++ $ 2,185(d) 8.5% $ 1,648 $ 537Munich Reinsurance Group of
Companies AA- A+ $ 1,771 6.9% $ 813 $ 958Swiss Reinsurance Group of
Companies AA- A+ $ 1,727 6.8% $ 565 $ 1,162
(a) The financial strength ratings reflect the ratings of the various reinsurance subsidiaries of the companies listed as of February 6, 2013.
(b) Total reinsurance assets include both Property Casualty and Life and Retirement reinsurance recoverable.
(c) Excludes collateral held in excess of applicable treaty balances.
(d) Includes $1.6 billion recoverable under the 2011 transaction pursuant to which a large portion of AIG Property Casualty’s net domesticasbestos liabilities were transferred to NICO. Does not include reinsurance assets ceded to other reinsurers for which NICO has assumed thecollection risk. See Liability for Unpaid Claims and Claim Adjustment Expenses – Transfer of Domestic Asbestos Liabilities.
The estimation of reinsurance recoverables involves a significant amount of judgment, particularly for asbestos
exposures, due to their long-tail nature. We assess the collectability of its reinsurance recoverable balances through
detailed reviews of the underlying nature of the reinsurance balance, including:
• paid and unpaid recoverable;
• whether the balance is in dispute or a legal collection status;
..................................................................................................................................................................................................................................
AIG 2012 Form 10-K 169
A.M. Gross Percent of UncollateralizedAt December 31, 2012S&P Best Reinsurance Reinsurance Collateral Reinsurance
(in millions) Rating(a) Rating(a) Assets Assets(b) Held(c) Assets
I T E M 7 / E N T E R P R I S E R I S K M A N A G E M E N T

.....................................................................................................................................................................................
• whether the reinsurer is financially troubled (i.e., liquidated, insolvent, in receivership or otherwise subject to formal
or informal regulatory restriction);
• whether collateral and collateral arrangements exist; and
• the credit quality of the underlying reinsurer.
We record adjustments to reflect the results of the detailed review through an allowance for uncollectablereinsurance. At December 31, 2012, the allowance for estimated unrecoverable reinsurance was $338 million. AtDecember 31, 2012, we had no significant general reinsurance recoverables due from any individual reinsurer thatwas financially troubled. In the current environment of weaker economic conditions and strained financial markets,certain reinsurers are reporting losses and could be subject to rating downgrades. Our reinsurance recoverableexposures are primarily to the regulated subsidiaries of such companies which are subject to minimum regulatory
capital requirements. The RCD, in conjunction with the credit executives within ERM, reviews these developments,monitors compliance with credit triggers that may require the reinsurer to post collateral, and will seek to use otherappropriate means to mitigate any material risks arising from these developments. See Note 9 to the ConsolidatedFinancial Statements for additional information on reinsurance.
AIG Life and Retirement Key Insurance Risks..............................................................................................................................................................................................
For AIG Life and Retirement, the primary risks are the following:
• – represents the potential exposure to loss if actual policy experience emerges adversely incomparison to the assumptions made in product pricing. These assumptions include investment results, mortality,morbidity, surrenders, other observed policyholder behavior and expenses;
• – represents the exposure to loss if the cash flows from the invested assets are less thanrequired to meet the obligations of the expected policy and contract liabilities and the necessary return oninvestments;
• – represents the exposure to loss due to the sensitivity of the liabilities and assets to changes ininterest rates; and
• – represents the potential exposure to higher claim costs for guaranteed benefits associated
with variable annuities and the potential reduction in expected fee revenue.
AIG Life and Retirement manages these risks through product design, exposure limitations and active managementof the relationships between assets and liabilities. The emergence of significant adverse experience would require anadjustment to DAC and benefit reserves which could have a material adverse effect on our consolidated results ofoperations for a particular period. For a further discussion of this risk, see Item 1A. Risk Factors – Business andOperations.
AIG Life and Retirement companies generally limit their maximum underwriting exposure on life insurance of a singlelife to $15 million or less of coverage. In certain circumstances, this is achieved by using yearly renewable term
reinsurance. For the AIG Life and Retirement companies, the reinsurance programs provide risk mitigation per life forindividuals and group and for catastrophic risk events.
United Guaranty Corporation Key Insurance Risks..............................................................................................................................................................................................
For United Guaranty Corporation (UGC), risks emanate primarily from the following:
• Residential Housing Market risk – represents the potential exposure to loss due to borrower default on afirst-lien residential mortgage; the primary drivers of this risk are home price depreciation, changes in the
unemployment rate, changes in mortgage rates, and a borrower’s willingness to pay.
• Pricing risk – represents the potential exposure to loss if actual policy experience emerges adversely incomparison to the assumptions made in product pricing. This may be related to adverse economic conditions,prepayment of policies, investment results, and expenses;
UGC manages the quality of the loans it insures through use of a proprietary risk quality index. UGC uses this indexto determine an insurability threshold as well as to manage the risk distribution of its new business. Along withtraditional mortgage underwriting variables, UGC’s risk-based pricing model uses rating factors such as geographyand the quality of a lender’s origination process to establish premium rates.
UGC’s risk appetite statement establishes various concentration limits on the business UGC insures (for example,geography), and defines underwriting characteristics for which UGC will not insure loans.
..................................................................................................................................................................................................................................
AIG 2012 Form 10-K170
Pricing risk
Investment risk
Interest rate risk
Equity market risk
I T E M 7 / E N T E R P R I S E R I S K M A N A G E M E N T

.....................................................................................................................................................................................
Other Operations..............................................................................................................................................................................................
Global Capital Markets
GCM actively manages its exposures to limit potential economic losses, and in doing so, GCM must continually
manage a variety of exposures including credit, market, liquidity, operational and legal risks. The senior management
of AIG defines the policies and establishes general operating parameters for GCM’s operations. Our senior
management has established various oversight committees to regularly monitor various financial market, operational
and credit risks related to GCM’s operations. The senior management of GCM reports the results of its operations to
and reviews future strategies with AIG’s senior management.
GCM Derivative Transactions
A counterparty may default on any obligation to us, including a derivative contract. Credit risk is a consequence of
extending credit and/or carrying trading and investment positions. Credit risk exists for a derivative contract when that
contract has a positive fair value to AIG. The maximum potential exposure will increase or decrease during the life of
the derivative commitments as a function of maturity and market conditions. To help manage this risk, GCM’s credit
department operates within the guidelines set by the credit function within ERM. Transactions that fall outside these
pre-established guidelines require the specific approval of the ERM. It is also AIG’s policy to record credit valuation
adjustments for potential counterparty default when necessary.
In addition, GCM utilizes various credit enhancements, including letters of credit, guarantees, collateral, credit
triggers, credit derivatives, margin agreements and subordination to reduce the credit risk relating to its outstanding
financial derivative transactions. GCM requires credit enhancements in connection with specific transactions based
on, among other things, the creditworthiness of the counterparties, and the transaction’s size and maturity.
Furthermore, GCM generally seeks to enter into agreements that have the benefit of set-off and close-out netting
provisions. These provisions provide that, in the case of an early termination of a transaction, GCM can set off its
receivables from a counterparty against its payables to the same counterparty arising out of all covered transactions.
As a result, where a legally enforceable netting agreement exists, the fair value of the transaction with the
counterparty represents the net sum of estimated fair values.
The fair value of GCM’s interest rate, currency, credit, commodity and equity swaps, options, swaptions, and forward
commitments, futures, and forward contracts reported in Derivative assets, at fair value, was approximately
$3.2 billion at December 31, 2012 and $3.9 billion at December 31, 2011. Where applicable, these amounts have
been determined in accordance with the respective master netting agreements.
GCM evaluates the counterparty credit quality by reference to ratings from rating agencies or, where such ratings are
not available, by internal analysis consistent with the risk rating policies of the ERM. In addition, GCM’s credit
approval process involves pre-set counterparty and country credit exposure limits subject to approval by the ERM
and, for particularly credit-intensive transactions, requires approval from the ERM.
The following table presents the fair value of GCM’s derivatives portfolios by counterparty credit rating:
Rating:AAA $ 260AA 58A 1,218BBB 2,081Below investment grade 247
Total $ 3,864
See Critical Accounting Estimates below and Note 12 to the Consolidated Financial Statements for additional
discussion related to derivative transactions.
..................................................................................................................................................................................................................................
AIG 2012 Form 10-K 171
At December 31,
(in millions) 2012 2011
$ 145168745
1,907199
$ 3,164
I T E M 7 / E N T E R P R I S E R I S K M A N A G E M E N T

.....................................................................................................................................................................................
Critical Accounting EstimatesThe preparation of financial statements in conformity with GAAP requires the application of accounting policies that
often involve a significant degree of judgment.
The accounting policies that we believe are most dependent on the application of estimates and
assumptions, which are critical accounting estimates, are related to the determination of:
• classification of ILFC as held for sale;
• insurance liabilities, including property and casualty and mortgage guaranty unpaid claims and claims
adjustment expenses and future policy benefits for life and accident and health contracts;
• income tax assets and liabilities, including recoverability of our net deferred tax asset and the predictability
of future tax operating profitability of the character necessary to realize the net deferred tax asset;
• recoverability of assets including reinsurance assets;
• estimated gross profits for investment-oriented products;
• impairment charges, including other-than-temporary impairments of financial instruments and goodwill
impairments;
• liabilities for legal contingencies; and
• fair value measurements of certain financial assets and liabilities.
See Note 1 to Consolidated Financial Statements for additional information.
These accounting estimates require the use of assumptions about matters, some of which are highly uncertain at the
time of estimation. To the extent actual experience differs from the assumptions used, our consolidated financial
condition, results of operations and cash flows could be materially affected.
The major categories for which assumptions are developed and used to establish each critical accounting
estimate are highlighted below.
Classification of ILFC as Held for Sale..............................................................................................................................................................................................
We report a business as held for sale when management has approved or received approval to sell the business
and is committed to a formal plan, the business is available for immediate sale, the business is being actively
marketed, the sale is anticipated to occur during the next 12 months, which may require significant judgment, and
certain other specified criteria are met. A business classified as held for sale is recorded at the lower of its carrying
amount or estimated fair value less cost to sell. If the carrying amount of the business exceeds its estimated fair
value, a loss is recognized.
On December 9, 2012, we entered into a definitive agreement with Jumbo Acquisition Limited for the sale of
80.1 percent of the common stock of ILFC for approximately $4.23 billion in cash. Jumbo Acquisition Limited may
elect to purchase an additional 9.9 percent of the common stock of ILFC for $522.5 million (the Option) by the later
of March 15, 2013 and ten days after approval of the ILFC Transaction and the Option by the Committee on Foreign
Investment in the United States. The transaction is subject to required regulatory approvals and other customary
closing conditions. We determined ILFC met the criteria at December 31, 2012 for held for sale accounting and,
consequently, we recorded a $4.4 billion after tax loss for the year ended December 31, 2012, which is reported in
Income (loss) from discontinued operations in the Consolidated Statement of Operations.
..................................................................................................................................................................................................................................
AIG 2012 Form 10-K172
I T E M 7 / C R I T I C A L A C C O U N T I N G E S T I M A T E S

.....................................................................................................................................................................................
Recoverability of Net Deferred Tax Asset..............................................................................................................................................................................................
The evaluation of the recoverability of our net deferred tax asset and the need for a valuation allowance requires us
to weigh all positive and negative evidence to reach a conclusion that it is more likely than not that all or some
portion of the net deferred tax asset will not be realized. The weight given to the evidence is commensurate with the
extent to which it can be objectively verified. The more negative evidence that exists, the more positive evidence is
necessary and the more difficult it is to support a conclusion that a valuation allowance is not needed.
We take a number of factors into account in order to reliably estimate future taxable income, so that we can
determine the extent of our ability to realize net operating losses (NOLs), foreign tax credits (FTCs) and nonlife
capital loss carryforwards. These factors include forecasts of future income for each of our businesses, actual and
planned business and operational changes, which includes assumptions about future macroeconomic and
AIG-specific conditions and events. We also subject the forecasts to stresses of key assumptions and evaluate the
effect on tax attribute utilization. We also apply stresses to our assumptions about the effectiveness of relevant
prudent and feasible tax planning strategies. Our income forecasts, coupled with our tax planning strategies and
stressed scenarios, all resulted in sufficient taxable income to achieve realization of the tax attributes (other than
life-insurance-business capital loss carryforwards) prior to their expiration.
For additional discussion of the recoverability of our net deferred tax asset, see Note 24 to the Consolidated
Financial Statements.
U.S. Income Taxes on Earnings of Certain Foreign Subsidiaries..............................................................................................................................................................................................
The U.S. federal income tax laws applicable to determining the amount of income taxes related to differences
between the book carrying values and tax bases of subsidiaries are complex. Determining the amount also requires
significant judgment and reliance on reasonable assumptions and estimates.
Liability for Unpaid Claims and Claims Adjustment Expenses (AIG Property Casualty and Mortgage
Guaranty)..............................................................................................................................................................................................
The estimate of Unpaid Claims and Claims Adjustment Expenses consists of several key judgments:
• the determination of the actuarial models used as the basis for these estimates;
• the relative weights given to these models by class;
• the underlying assumptions used in these models; and
• the determination of the appropriate groupings of similar classes and, in some cases, the segmentation of
dissimilar claims within a class.
We use numerous assumptions in determining the best estimate of reserves for each class of business. The
importance of any specific assumption can vary by both class of business and accident year. Because actual
experience can differ from key assumptions used in establishing reserves, there is potential for significant variation in
the development of loss reserves. This is particularly true for long-tail casualty classes of business such as excess
casualty, asbestos, D&O, and primary or excess workers’ compensation.
All of our methods to calculate net reserves include assumptions about estimated reinsurance recoveries and their
collectability. Reinsurance collectability is evaluated independently of the reserving process and appropriate
allowances for uncollectible reinsurance are established.
..................................................................................................................................................................................................................................
AIG 2012 Form 10-K 173
I T E M 7 / C R I T I C A L A C C O U N T I N G E S T I M A T E S

.....................................................................................................................................................................................
In some of our estimation processes we rely on the claims department estimates of our case reserves as an input to
our best estimate of the ultimate loss cost.
Overview of Loss Reserving Process and Methods
AIG Property Casualty loss reserves can generally be categorized into two distinct groups. Short-tail classes of
business consist principally of property, personal lines and certain casualty classes. Long-tail casualty classes of
business include excess and umbrella liability, D&O, professional liability, medical malpractice, workers’
compensation, general liability, products liability and related classes.
Short-Tail Reserves
such as property coverages, the process of recording quarterly loss
reserves is generally geared toward maintaining an appropriate reserve for the outstanding exposure, rather than
determining an expected loss ratio for current business. For example, the IBNR reserve required for a class of
property business might be expected to approximate 20 percent of the latest year’s earned premiums. This level of
reserve would generally be maintained regardless of the loss ratio emerging in the current quarter. The 20 percent
factor would be adjusted to reflect changes in rate levels, loss reporting patterns, known exposure to unreported
losses, or other factors affecting the particular class of business. For some classes, a loss development factor
method may be used.
Long-Tail Reserves
is a complex process and To estimate net losses fordepends on a number of factors, including the class and volume of
long-tail casualty classes ofbusiness, as well as estimates of the reinsurance recoverable. Experience
in the more recent accident years shows limited statistical credibility in business, we use a variety ofreported net losses on long-tail casualty classes of business. That is
actuarial methods andbecause a relatively low proportion of net incurred losses represent
assumptions.reported claims and expenses, and an even smaller percentage represent
net losses paid. Therefore, IBNR constitutes a relatively high proportion of
net losses.
we use a variety of actuarial methods and
assumptions and other analytical techniques as described below. A detailed reserve review is generally performed at
least once per year to allow for comprehensive actuarial evaluation and collaboration with claims, underwriting,
business unit management, risk management and senior management.
..................................................................................................................................................................................................................................
AIG 2012 Form 10-K174
For operations writing short-tail coverages,
Estimation of ultimate net losses and loss expenses (net losses) for
long-tail casualty classes of business
To estimate net losses for long-tail casualty classes of business,
We generally make a number of actuarial assumptions in the review of reserves for each class of business.
I T E M 7 / C R I T I C A L A C C O U N T I N G E S T I M A T E S
.....................................................................................................................................................................................
For longer-tail classes of business, we generally make actuarial assumptions with respect to the following:
• Loss cost trend factors which are used to establish expected loss ratios for subsequent accident years
based on the projected loss ratios for prior accident years.
• for the latest accident year (i.e., accident year 2012 for the year-end 2012 loss
reserve analysis) and, in some cases for accident years prior to the latest accident year. The expected loss
ratio generally reflects the projected loss ratio from prior accident years, adjusted for the loss trend and the
effect of rate changes and other quantifiable factors on the loss ratio. For low-frequency, high-severity
classes such as excess casualty, expected loss ratios generally are used for at least the three most recent
accident years.
• which are used to project the reported losses for each accident year to an
ultimate basis. Generally, the actual loss development factors observed from prior accident years would be
used as a basis to determine the loss development factors for the subsequent accident years.
The
overall change in our loss reserves is based on the sum of the changes for all classes of business. For most long-tail
classes of business, the quarterly loss reserve changes are based on the estimated current loss ratio for each class
of coverage less any amounts paid. Also, any change in estimated ultimate losses from prior accident years deemed
to be necessary based on the results of our latest reserve studies or large loss analysis, either positive or negative,
is reflected in the loss reserve for the current quarter.
Details of the Loss Reserving Process
These include considerations such as: prior accident year and policy year loss ratios; rate changes; and changes in
coverage, reinsurance, or mix of business. Other considerations include actual and anticipated changes in external
factors such as trends in loss costs or in the legal and claims environment. The current loss ratio for each class of
business is intended to represent our best estimate of the current loss ratio after reflecting all of the relevant factors.
At the close of each quarter, the assumptions underlying the loss ratios are reviewed to determine if the loss ratios
remain appropriate. This process includes a review of the actual claims experience in the quarter, actual rate
changes achieved, actual changes in coverage, reinsurance or mix of business, and changes in other factors that
may affect the loss ratio. When this review suggests that the initially determined loss ratio is no longer appropriate,
the loss ratio for current business is changed to reflect the revised assumptions.
The reserve analysis for each class of business is performed by the actuarial
personnel who are most familiar with that class of business. In this process, the actuaries are required to make
numerous assumptions, including the selection of loss development factors and loss cost trend factors. They are also
required to determine and select the most appropriate actuarial methods for each business class. Additionally, they
must determine the segmentation of data that will enable the most suitable test of reserve adequacy. In the course of
these detailed reserve reviews an actuarial central estimate of the loss reserve is determined. The sum of these
central estimates for each class of business provides an overall actuarial central estimate of the loss reserve for that
class.
In 2012, the third party actuarial reviews covered the majority of reserves held for our US Commercial long-tail
classes of business, the majority of our US Consumer classes of business and included several material international
Commercial and Consumer classes of business. In addition we consulted with third party environmental litigation and
engineering specialists, third party toxic tort claims professionals, third party clinical and public health specialists, third
party workers’ compensation claims adjusters and third party actuarial advisors to corroborate our conclusions.
In 2011 we significantly expanded the scope of our 2010 third-party actuarial reviews to cover a larger number of
U.S. and international classes of business from the more complex reserves of long-tail classes of business. In 2010,
..................................................................................................................................................................................................................................
AIG 2012 Form 10-K 175
Expected loss ratios
Loss development factors
We record quarterly changes in loss reserves for each of AIG Property Casualty’s classes of business.
The process of determining the current loss ratio for each class of business is based on a variety of factors.
We conduct a comprehensive loss reserve review at least annually for each AIG Property Casualty
subsidiary and class of business.
I T E M 7 / C R I T I C A L A C C O U N T I N G E S T I M A T E S
ao ope edx ipec e oss ra ost tE d l i
ao o oe doss cos ren ac orst t tL d f

.....................................................................................................................................................................................
third-party actuarial reserve reviews were generally limited to certain U.S. long-tail lines of business and were
concentrated in the fourth quarter of 2010. These detailed reviews are conducted for each class of business for each
subsidiary, and consist of hundreds of individual analyses.
In determining the actual carried reserves, we consider both the internal actuarial central estimate and
numerous other internal and external factors, including:
• an assessment of economic conditions;
• changes in the legal, regulatory, judicial and social environment;
• changes in medical cost trends (inflation, intensity and utilization of medical services)
• underlying policy pricing, terms and conditions including attachment points and policy limits;
• claims handling processes and enhancements; and
• third-party actuarial reviews that are periodically performed for key classes of business.
Loss reserve development can also be affected by commutations of assumed and ceded reinsurance agreements.
our actuaries determine the most appropriate actuarial
methods. This determination is based on a variety of factors including the nature of the claims associated with the
class of business, such as the frequency or severity of the claims. Other factors considered include the loss
development characteristics associated with the claims, the volume of claim data available for the applicable class,
and the applicability of various actuarial methods to the class. In addition to determining the actuarial methods, the
actuaries determine the appropriate loss reserve groupings of data. For example, we write many unique subclasses
of professional liability. For pricing or other purposes, it is appropriate to evaluate the profitability of each subclass
individually. However, for purposes of estimating the loss reserves for professional liability, we believe it is
appropriate to combine the subclasses into larger groups to produce a greater degree of credibility in the claims
experience. This determination of data segmentation and actuarial methods is carefully considered for each class of
business. The segmentation and actuarial methods chosen are those which together are expected to produce the
most robust estimate of the loss reserves.
Loss development methods utilize the actual loss development patterns from prior
accident years to project the reported losses to an ultimate basis for subsequent accident years. Loss development
methods generally are most appropriate for classes of business which exhibit a stable pattern of loss development
from one accident year to the next, and for which the components of the classes have similar development
characteristics. For example, property exposures would generally not be combined into the same class as casualty
exposures, and primary casualty exposures would generally not be combined into the same class as excess casualty
exposures. We generally use expected loss ratio methods in cases where the reported loss data lacks sufficient
credibility to utilize loss development methods, such as for new classes of business or for long-tail classes at early
stages of loss development. Frequency/severity models may be used where sufficient frequency counts are available
to apply such approaches.
For example, an expected loss ratio of 70 percent applied to an
earned premium base of $10 million for a class of business would generate an ultimate loss estimate of $7 million.
Subtracting any reported paid losses and loss expense would result in the indicated loss reserve for this class. Under
the ‘‘Bornhuetter Ferguson’’ methods, the expected loss ratio is applied only to the expected unreported portion of
the losses. For example, for a long-tail class of business for which only 10 percent of the losses are expected to be
reported at the end of the accident year, the expected loss ratio would be applied to the 90 percent of the losses still
unreported. The actual reported losses at the end of the accident year would be added to determine the total
ultimate loss estimate for the accident year. Subtracting the reported paid losses and loss expenses would result in
the indicated loss reserve. In the example above, the expected loss ratio of 70 percent would be multiplied by
..................................................................................................................................................................................................................................
AIG 2012 Form 10-K176
Actuarial and Other Methods for Major Classes of Business
In testing the reserves for each class of business,
The actuarial methods we use for most long-tail casualty classes of business include loss development
methods, expected loss ratio methods, including ‘‘Bornhuetter Ferguson’’ methods described below, and
frequency/severity models.
Expected loss ratio methods rely on the application of an expected loss ratio to the earned premium for the
class of business to determine the loss reserves.
I T E M 7 / C R I T I C A L A C C O U N T I N G E S T I M A T E S

.....................................................................................................................................................................................
90 percent. The result of 63 percent would be applied to the earned premium of $10 million resulting in an estimated
unreported loss of $6.3 million. Actual reported losses would be added to arrive at the total ultimate losses. If the
reported losses were $1 million, the ultimate loss estimate under the ‘‘Bornhuetter Ferguson’’ method would be
$7.3 million versus the $7 million amount under the expected loss ratio method described above. Thus, the
‘‘Bornhuetter Ferguson’’ method gives partial credibility to the actual loss experience to date for the class of
business. Loss development methods generally give full credibility to the reported loss experience to date. In the
example above, loss development methods would typically indicate an ultimate loss estimate of $10 million, as the
reported losses of $1 million would be estimated to reflect only 10 percent of the ultimate losses.
A key advantage of loss development methods is that they respond quickly to any actual changes in loss costs for
the class of business. Therefore, if loss experience is unexpectedly deteriorating or improving, the loss development
method gives full credibility to the changing experience. Expected loss ratio methods would be slower to respond to
the change, as they would continue to give more weight to the expected loss ratio, until enough evidence emerged to
modify the expected loss ratio to reflect the changing loss experience. On the other hand, loss development methods
have the disadvantage of overreacting to changes in reported losses if the loss experience is not credible. For
example, the presence or absence of large losses at the early stages of loss development could cause the loss
development method to overreact to the favorable or unfavorable experience by assuming it will continue at later
stages of development. In these instances, expected loss ratio methods such as ‘‘Bornhuetter Ferguson’’ have the
advantage of recognizing large losses without extrapolating unusual large loss activity onto the unreported portion of
the losses for the accident year.
Multiplying the estimated ultimate number of claims for
each accident year by the expected average severity of each claim produces the estimated ultimate loss for the
accident year. Frequency/severity methods generally require a sufficient volume of claims in order for the average
severity to be predictable. Average severity for subsequent accident years is generally determined by applying an
estimated annual loss cost trend to the estimated average claim severity from prior accident years. In certain cases,
a structural approach may also be used to predict the ultimate loss cost. Frequency/severity methods have the
advantage that ultimate claim counts can generally be estimated more quickly and accurately than can ultimate
losses. Thus, if the average claim severity can be accurately estimated, these methods can more quickly respond to
changes in loss experience than other methods. However, for average severity to be predictable, the class of
business must consist of homogeneous types of claims for which loss severity trends from one year to the next are
reasonably consistent. Generally these methods work best for high frequency, low severity classes of business such
as personal auto.
A structural
drivers analysis of frequency/severity is particularly useful for understanding the key drivers of uncertainty in the
ultimate loss cost. For example, for the excess workers’ compensation class of business, we have attempted to
corroborate our judgment by considering the impact on severity of the future propensity for deterioration of an injured
worker’s medical condition, the impact of price inflation on the various categories of medical expense and cost of
living adjustments on indemnity benefits, the impact of injured worker mortality and claim specific settlement and loss
mitigation strategies, etc., using the following:
• Claim by claim reviews to determine the stability and likelihood of settling an injured worker’s indemnity and
medical benefits – the claim file review was facilitated by a third party expert experienced in workers’
compensation claims;
• Analysis of the potential for future deterioration in medical condition unlikely to be picked up by a claim file review
and associated with potentially costly medical procedures (i.e., increases in both utilization and intensity of medical
care) over the course of the injured worker’s lifetime;
• Analysis of the cost of medical price inflation for each category of medical spend (services and devices) and for
cost of living adjustments in line with statutory requirements;
• Portfolio specific mortality level and mortality improvement assumptions based on a mortality study conducted for
AIG’s primary and excess workers’ compensation portfolios and AIG’s opinion of future longevity trends for the
open reported cases;
..................................................................................................................................................................................................................................
AIG 2012 Form 10-K 177
Frequency/severity methods generally rely on the determination of an ultimate number of claims and an
average severity for each claim for each accident year.
Structural drivers analytics seek to explain the underlying drivers of frequency/severity.
I T E M 7 / C R I T I C A L A C C O U N T I N G E S T I M A T E S

.....................................................................................................................................................................................
• Ground-up consideration of the reinsurance recoveries expected for the class of business for reported claims with
extrapolation for unreported claims;
• The effects of various runoff claims management strategies that have been developed by AIG’s newly created
run-off unit.
Overall, our loss reserve reviews for long-tail classes typically utilize a combination of both loss
development and expected loss ratio methods, supplemented by structural drivers analysis of frequency/
severity where available. Loss development methods are generally given more weight for accident years and
classes of business where the loss experience is highly credible. Expected loss ratio methods are given more weight
where the reported loss experience is less credible, or is driven more by large losses. Expected loss ratio methods
require sufficient information to determine the appropriate expected loss ratio. This information generally includes the
actual loss ratios for prior accident years, and rate changes as well as underwriting or other changes which would
affect the loss ratio. Further, an estimate of the loss cost trend or loss ratio trend is required in order to allow for the
effect of inflation and other factors which may increase or otherwise change the loss costs from one accident year to
the next.
The estimation of loss reserves relating to asbestos and environmental claims on insurance policies written
many years ago is subject to greater uncertainty than other types of claims. This is due to inconsistent court
decisions, as well as judicial interpretations and legislative actions that in some cases have tended to broaden
coverage beyond the original intent of such policies or have expanded theories of liability. In addition, reinsurance
recoverable balances relating to asbestos and environmental loss reserves are subject to greater uncertainty due to
the underlying age of the claim, underlying legal issues surrounding the nature of the coverage, and determination of
proper policy period. For these reasons, these balances tend to be subject to increased levels of disputes and legal
collection activity when actually billed. The insurance industry as a whole is engaged in extensive litigation over these
coverage and liability issues and is thus confronted with a continuing uncertainty in its efforts to quantify these
exposures.
We continue to receive claims asserting injuries and damages from toxic waste, hazardous substances, and other
environmental pollutants and alleged claims to cover the cleanup costs of hazardous waste dump sites, referred to
collectively as environmental claims, and indemnity claims asserting injuries from asbestos. The vast majority of
these asbestos and environmental claims emanate from policies written in 1984 and prior years. Commencing in
1985, standard policies contained an absolute exclusion for pollution-related damage. An absolute asbestos exclusion
was also implemented. The current AIG Property Casualty Environmental policies that we specifically price and
underwrite for environmental risks on a claims-made basis have been excluded from the analysis.
The majority of our exposures for asbestos and environmental claims are excess casualty coverages, not primary
coverages. The litigation costs are treated in the same manner as indemnity amounts, with litigation expenses
included within the limits of the liability we incur. Individual significant claim liabilities, where future litigation costs are
reasonably determinable, are established on a case-by-case basis.
Reserve Estimation for Asbestos and Environmental Claims
Estimation of asbestos and environmental claims loss reserves is a subjective process. Reserves for asbestos and
environmental claims cannot be estimated using conventional reserving techniques such as those that rely on
historical accident year loss development factors. The methods used to determine asbestos and environmental loss
estimates and to establish the resulting reserves are continually reviewed and updated by management.
Various factors contribute to the complexity and difficulty in determining the future development of asbestos and
environmental claims. Significant factors that influence the asbestos and environmental claims estimation process
include court resolutions and judicial interpretations which broaden the intent of the policies and scope of coverage.
The current case law can be characterized as still evolving, and there is little likelihood that any firm direction will
develop in the near future. Additionally, the exposures for cleanup costs of hazardous waste dump sites involve
issues such as allocation of responsibility among potentially responsible parties and the government’s refusal to
release parties from liability. Future claims development also will be affected by the changes in Superfund and waste
dump site coverage and liability issues.
If the asbestos and environmental reserves develop deficiently, resulting deficiencies could have an adverse effect on
our future results of operations for an individual reporting period.
..................................................................................................................................................................................................................................
AIG 2012 Form 10-K178
I T E M 7 / C R I T I C A L A C C O U N T I N G E S T I M A T E S

.....................................................................................................................................................................................
With respect to known environmental claims, we established over two decades ago a specialized environmental
claims unit, which investigates and adjusts all such environmental claims. This unit evaluates environmental claims
utilizing a claim-by-claim approach that involves a detailed review of individual policy terms and exposures. Because
each policyholder presents different liability and coverage issues, we generally evaluate exposure on a
policy-by-policy basis, considering a variety of factors such as known facts, current law, jurisdiction, policy language
and other factors that are unique to each policy. Quantitative techniques must be supplemented by subjective
considerations, including management judgment. Each claim is reviewed at least semi-annually utilizing the
aforementioned approach and adjusted as necessary to reflect the current information.
The environmental claims unit also actively manages and pursues early resolution with respect to these claims in an
attempt to mitigate its exposure to the unpredictable development of these claims. We attempt to mitigate our known
long-tail environmental exposures through a combination of proactive claim-resolution techniques, including policy
buybacks, complete environmental releases, compromise settlements, and, when appropriate, litigation.
Known asbestos claims are managed in a similar manner. Over two decades ago we established a specialized toxic
tort claims unit, which historically investigated and adjusted all such asbestos claims. As part of the above mentioned
NICO transaction, effective January 1, 2011, NICO assumed responsibility for claims handling related to the majority
of AIG’s domestic asbestos liabilities.
The following is a discussion of actuarial methods applied by major class of business:
Class of Business or Category and Actuarial Method Application of Actuarial Method
We generally use a combination of loss development methods Expected loss ratio methods are generally used for at least
and expected loss ratio methods for excess casualty classes. the three latest accident years, due to the relatively low
credibility of the reported losses. The loss experience isFrequency/severity methods are generally not used in isolation
generally reviewed separately for lead umbrella classes andto determine ultimate loss costs as the vast majority of
for other excess classes, due to the relatively shorter tail forreported claims do not result in claim payment. (However,
lead umbrella business. Automobile-related claims arefrequency/severity methods assist in the regular monitoring of
generally reviewed separately from non-auto claims, due tothe adequacy of carried reserves to support incurred but not
the shorter-tail nature of the automobile-related claims. Claimsreported claims). In addition, the average severity varies
relating to certain latent exposures such as constructionsignificantly from accident year to accident year due to large
defects or exhaustion of underlying product aggregate limitslosses which characterize this class of business, as well as
are reviewed separately due to the unique emergencechanging proportions of claims which do not result in a claim
patterns of losses relating to these claims. The expected losspayment. In order to gain more stability in the projection, the
ratios used for recent accident years are based on theclaims amenable to loss development methods are analyzed
projected ultimate loss ratios of prior years, adjusted for ratein two layers: the layer capped at $10 million and the layer
changes, estimated loss cost trends and all other changesabove $10 million. The expected loss ratio for the layer above
that can be quantified.$10 million is derived from the expected relationship between
the layers, reflecting the attachment point and limit by During 2012, we also completed a third party review of certain
accident year. insureds exposed to a specific class of toxic tort claims. That
review considered the prior claims history for each insuredIn addition, we leverage case reserving based methodologies
account, AIG’s exposed limits and the insured’s role with thefor complex claims/ latent exposures such as those involving
specific toxicant reviewed as well as a legal analysis of thetoxic tort and other claims accumulations.
exposures presented by these claims.
..................................................................................................................................................................................................................................
AIG 2012 Form 10-K 179
.....................................................................................................................................................................................................................
Excess Casualty
I T E M 7 / C R I T I C A L A C C O U N T I N G E S T I M A T E S

.....................................................................................................................................................................................
Class of Business or Category and Actuarial Method Application of Actuarial Method
We generally use a combination of loss development methods Expected loss ratio methods are given more weight in the two
and expected loss ratio methods for D&O and related most recent accident years, whereas loss development
management liability classes of business. methods are given more weight in more mature accident
years. For the year-end 2012 loss reserve review, claimsFrequency/severity methods are generally not used in isolation
projections for accident years 2011 and prior were used.for these classes as the overall losses are driven by large
These classes of business reflect claims made coverage, andlosses more than by claim frequency. Severity trends have
losses are characterized by low frequency and high severity.varied significantly from accident year to accident year and
care is required in analyzing these trends by claim type. We
also give weight to claim department ground-up projections of
ultimate loss on a claim by claim basis as these may be more
predictive of ultimate loss values especially for older accident
years.
We generally use a combination of loss development methods Expected loss ratio methods generally are given significant
and expected loss ratio methods for workers’ compensation. weight only in the most recent accident year. Workers’
We segment the data by state and industry class to the extent compensation claims are generally characterized by high
that meaningful differences are determined to exist. frequency, low severity, and relatively consistent loss
development from one accident year to the next. We
historically have been a leading writer of workers’
compensation, and thus have sufficient volume of claims
experience to use development methods. We generally
segregate California business from other business in
evaluating workers’ compensation reserves. In 2012, we
segmented out New York from the other states to reflect its
different development pattern and changing percentage of the
mix by state. We also revised our assumptions to reflect
changes in our claims management activities. Certain classes
of workers’ compensation, such as construction, are also
evaluated separately. Additionally, we write a number of very
large accounts which include workers’ compensation
coverage. These accounts are generally priced by our
actuaries, and to the extent appropriate, the indicated losses
based on the pricing analysis may be used to record the initial
estimated loss reserves for these accounts.
..................................................................................................................................................................................................................................
AIG 2012 Form 10-K180
.....................................................................................................................................................................................................................
.....................................................................................................................................................................................................................
D&O and Related Management Liability Classes of Business
Workers’ Compensation
I T E M 7 / C R I T I C A L A C C O U N T I N G E S T I M A T E S

.....................................................................................................................................................................................
Class of Business or Category and Actuarial Method Application of Actuarial Method
We historically have used a combination of loss development Excess workers’ compensation is an extremely long-tail class
methods and expected loss ratio methods for excess workers’ of business, with loss emergence extending for decades. The
compensation. For the year-end 2012 loss reserve review, our class is highly sensitive to small changes in assumptions – in
actuaries supplemented the methods used historically by the rate of medical inflation or the longevity of injured workers,
applying a structural drivers approach to inform their judgment for example – which can have a significant effect on the
of the ultimate loss costs for open reported claims from ultimate reserve estimate. Claims estimates for this line also
accident years 2003 and prior (representing approximately are highly sensitive to:
95% of all open reported claims) and used the refined• the assumed future rate of inflation and other economic
analysis to inform their judgment of the ultimate loss cost forconditions in the United States;
claims that have not yet been reported using a frequency/
severity approach for these accident years. • changes in the legal, regulatory, judicial and social
environment;
• the expected impact of recently enacted health care reform
on workers’ compensation costs;
• underlying policy pricing, terms and conditions;
• claims settlement trends that can materially alter the mix
and ultimate cost of claims;
• changes in claims reporting and management practices of
insureds and their third-party administrators;
• the cost of new and additional treatment specialties, such
as ‘‘pain management’’;
• the propensity for severely injured workers’ medical
conditions to deteriorate in the future;
• changes in injured worker longevity; and
• territorial experience differences (across states and within
regions in a state).
Expected loss ratio methods are given the greater weight for
the more recent accident years. For the year-end 2012 loss
reserve review, the structural drivers approach which was
applied to open reported claims from accident years 2003 and
prior, was deemed to be most suitable for informing our
judgment of the ultimate loss cost for injured workers whose
medical conditions had largely stabilized (i.e., at least 9 to
10 years have elapsed since the date of injury). The reserve
for unreported claims is approximately 41 percent of the total
estimated reserve requirement for accident years 2003 and
prior. The reserve for accident years 2004 and subsequent
was determined using a Bornhuetter Ferguson expected loss
ratio method and constitute approximately 13 percent of the
total reserve requirements for this class of business.
..................................................................................................................................................................................................................................
AIG 2012 Form 10-K 181
.....................................................................................................................................................................................................................
Excess Workers’ Compensation
I T E M 7 / C R I T I C A L A C C O U N T I N G E S T I M A T E S

.....................................................................................................................................................................................
Class of Business or Category and Actuarial Method Application of Actuarial Method
We generally use a combination of loss development methods For certain classes of business with sufficient loss volume,
and expected loss ratio methods for primary general liability or loss development methods may be given significant weight for
products liability classes. We also supplement the standard all but the most recent one or two accident years. For smaller
actuarial techniques by using evaluations of the ultimate or more volatile classes of business, loss development
losses on unusual claims or claim accumulations by external methods may be given limited weight for the five or more
experts on those classes of claims. The segmentation of the most recent accident years. Expected loss ratio methods are
data reflects state differences, industry classes, deductible/ used for the more recent accident years for these classes.
non-deductible programs and type of claim. The loss experience for primary general liability business is
generally reviewed at a level that is believed to provide the
most appropriate data for reserve analysis. Additionally,
certain sub-classes, such as construction, are generally
reviewed separately from business in other subclasses. Due
to the fairly long-tail nature of general liability business, and
the many subclasses that are reviewed individually, there is
less credibility given to the reported losses and increased
reliance on expected loss ratio methods for recent accident
years.
We generally use loss development methods for all but the Expected loss ratio methods are generally given significant
most recent accident year for commercial automobile classes weight only in the most recent accident year.
of business.
We generally use a combination of loss development methods The largest component of the healthcare business consists of
and expected loss ratio methods for healthcare classes of coverage written for hospitals and other healthcare facilities.
business. We test reserves for excess coverage separately from those
for primary coverage. For primary coverages, lossFrequency/severity methods are sometimes used for pricing
development methods are generally given the majority of thecertain healthcare accounts or business. However, in testing
weight for all but the latest three accident years, and areloss reserves the business is generally combined into larger
given some weight for all years other than the latest accidentgroupings to enhance the credibility of the loss experience.
year. For excess coverages, expected loss methods are
generally given all the weight for the latest three accidentWe also supplement the standard actuarial techniques byyears, and are also given considerable weight for accidentusing evaluations of the ultimate losses on unusual claims byyears prior to the latest three years. For other classes ofexperts on those classes of claims.healthcare coverage, an analogous weighting between loss
development and expected loss ratio methods is used. The
weights assigned to each method are those that are believed
to result in the best combination of responsiveness and
credibility.
..................................................................................................................................................................................................................................
AIG 2012 Form 10-K182
.....................................................................................................................................................................................................................
.....................................................................................................................................................................................................................
.....................................................................................................................................................................................................................
General Liability
Commercial Automobile Liability
Healthcare
I T E M 7 / C R I T I C A L A C C O U N T I N G E S T I M A T E S

.....................................................................................................................................................................................
Class of Business or Category and Actuarial Method Application of Actuarial Method
We generally use a combination of loss development methods Loss development methods are used for the more mature
and expected loss ratio methods for professional liability accident years. Greater weight is given to expected loss ratio
classes of business. methods in the more recent accident years. Reserves are
tested separately for claims made classes and classes writtenFrequency/severity methods are used in pricing and
on occurrence policy forms. Further segmentations are madeprofitability analyses for some classes of professional liability;
in a manner believed to provide an appropriate balancehowever, for loss reserve adequacy testing, the need to
between credibility and homogeneity of the data.ensure sufficient credibility generally results in segmentations
that are not sufficiently homogenous to utilize frequency/
severity methods.
We also use claim department projections of the ultimate
value of each reported claim to supplement and inform the
standard actuarial approaches.
We use expected loss ratio methods for all accident years for The expected loss ratios and loss development assumptions
catastrophic casualty business. This class of business used are based upon the results of prior accident years for
consists of casualty or financial lines coverage that attach in this business as well as for similar classes of business written
excess of very high attachment points; thus the claims above lower attachment points. The business can be written
experience is marked by very low frequency and high severity. on a claims-made or occurrence basis. We use ground-up
Because of the limited number of claims, loss development claim projections provided by our claims staff to assist in
methods are not used. developing the appropriate reserve.
We generally use a combination of loss development methods Expected loss ratio methods are used to determine the loss
and expected loss ratio methods for aviation exposures. reserves for the latest accident year.
Aviation claims are not very long-tail in nature; however, they
are driven by claim severity. Thus a combination of both
development and expected loss ratio methods are used for all
but the latest accident year to determine the loss reserves.
Frequency/severity methods are not employed due to the high
severity nature of the claims and different mix of claims from
year to year.
We generally use frequency/severity methods and loss For many classes of business, greater reliance is placed on
development methods for domestic personal auto classes. frequency/severity methods as claim counts emerge quickly
for personal auto and allow for more immediate analysis of
resulting loss trends and comparisons to industry and other
diagnostic metrics.
We generally use loss development methods for fidelity Expected loss ratio methods are also given weight for the
exposures for all but the latest accident year. For surety more recent accident years. For the latest accident year they
exposures, we generally use the same method as for short-tail may be given 100 percent weight.
classes (discussed below).
..................................................................................................................................................................................................................................
AIG 2012 Form 10-K 183
.....................................................................................................................................................................................................................
.....................................................................................................................................................................................................................
.....................................................................................................................................................................................................................
.....................................................................................................................................................................................................................
.....................................................................................................................................................................................................................
Professional Liability
Catastrophic Casualty
Aviation
Personal Auto
Fidelity/Surety
I T E M 7 / C R I T I C A L A C C O U N T I N G E S T I M A T E S

.....................................................................................................................................................................................
Class of Business or Category and Actuarial Method Application of Actuarial Method
We test mortgage guaranty reserves using loss development The reserve analysis projects ultimate losses for claims within
methods, supplemented by an internal claim analysis by each of several categories of delinquency based on actual
actuaries and staff who specialize in the mortgage guaranty historical experience, using primarily a frequency/severity loss
business. development approach. Additional reserve tests are also
employed, such as tests measuring losses as a percent of risk
in force. Reserves are reviewed separately for each line of
business considering the loss development characteristics,
volume of claim data available and applicability of various
actuarial methods to each line.
Reserves for mortgage guaranty insurance losses and loss
adjustment expenses are established for reported mortgage
loan delinquencies and estimates of delinquencies that have
been incurred but have not been reported by loan servicers,
based upon historical reporting trends. We establish reserves
using a percentage of the contractual liability (for each
delinquent loan reported) that is based upon projected claim
experience for each category of delinquency, consistent in
total with the overall reserve estimate.
Mortgage Guaranty losses and loss adjustment expenses
have been adversely affected by macroeconomic events, such
as declining home prices and increasing unemployment.
Because these macroeconomic events are subject to adverse
or favorable change, the determination of the ultimate losses
and loss adjustment expenses requires a high degree of
judgment. Responding to these adverse macroeconomic
influences, numerous government and lender loan
modification programs have been implemented to mitigate
mortgage losses. The loan modification programs have
produced additional cures of delinquent loans in 2012 that
may not continue in 2013 as some modification programs are
phased out or retired. In addition, these loan modifications
may re-default resulting in new losses for Mortgage Guaranty.
Occurrences of fraudulent loans, underwriting violations, and
other deviations from contractual terms, mostly related to the
2006 and 2007 blocks of business, have resulted in
historically high levels of claim rescissions and denials
(collectively referred to as rescissions) during 2011. As a
result, many lenders have increased their rescission appeals
activity as well as the success rate on those appeals by
focusing additional resources on the process. The increased
lender attention on tracking down missing loan documents
along with the heightened focus on appeals of rescissions
caused the estimated ultimate rescission rate (net of appeals)
assumed in the loss reserves to be lower than the rescission
level projected in 2011. If this trend continues it may
unfavorably affect future results. We believe we have provided
appropriate reserves for currently delinquent loans, consistent
with industry practices.
..................................................................................................................................................................................................................................
AIG 2012 Form 10-K184
.....................................................................................................................................................................................................................
Mortgage Guaranty
I T E M 7 / C R I T I C A L A C C O U N T I N G E S T I M A T E S

.....................................................................................................................................................................................
Class of Business or Category and Actuarial Method Application of Actuarial Method
We generally use either loss development methods or IBNR Where a factor is used, it generally represents a percent of
factor methods to set reserves for short-tail classes such as earned premium or other exposure measure. The factor is
property coverages. determined based on prior accident year experience. For
example, the IBNR for a class of property coverage might be
expected to approximate 20 percent of the latest year’s
earned premium. The factor is continually reevaluated in light
of emerging claim experience as well as rate changes or other
factors that could affect the adequacy of the IBNR factor
being employed.
Business written by AIG Property Casualty internationally We maintain a database of detailed historical premium and
includes both long-tail and short-tail classes of business. For loss transactions in original currency for business written by
long-tail classes of business, the actuarial methods used are AIG Property Casualty internationally. This allows our
comparable to those described above. However, the majority actuaries to determine the current reserves without any
of business written by AIG Property Casualty internationally is distortion from changes in exchange rates over time. Our
short-tail, high frequency and low severity in nature. For this actuaries segment the international data by region, country or
business, loss development methods are generally employed class of business as appropriate to determine an optimal
to test the loss reserves. balance between homogeneity and credibility.
We determine reserves for legal defense and cost We generally determine reserves for adjuster loss adjustment
containment loss adjustment expenses for each class of expenses based on calendar year ratios of adjuster expenses
business by one or more actuarial or structural driver paid to losses paid for the particular class of business. We
methods. The methods generally include development generally determine reserves for other unallocated loss
methods comparable to those described for loss development adjustment expenses based on the ratio of the calendar year
methods. The development could be based on either the paid expenses paid to overall losses paid. This determination is
loss adjustment expenses or the ratio of paid loss adjustment generally done for all classes of business combined, and
expenses to paid losses, or both. Other methods include the reflects costs of home office claim overhead as a percent of
utilization of expected ultimate ratios of paid loss expense to losses paid.
paid losses, based on actual experience from prior accident
years or from similar classes of business.
We conduct special analyses in response to major These analyses may include a combination of approaches,
catastrophes in order to estimate our gross and net loss and including modeling estimates, ground-up claim analysis, loss
loss expense liability from those events. evaluation reports from on-site field adjusters, and market
share estimates.
..................................................................................................................................................................................................................................
AIG 2012 Form 10-K 185
.....................................................................................................................................................................................................................
.....................................................................................................................................................................................................................
.....................................................................................................................................................................................................................
.....................................................................................................................................................................................................................
Other Short-Tail Classes
International
Loss Adjustment Expenses
Catastrophes
I T E M 7 / C R I T I C A L A C C O U N T I N G E S T I M A T E S

.....................................................................................................................................................................................
Alternative Loss Cost Trend and Loss Development Factor Assumptions by Class of Business..............................................................................................................................................................................................
For classes of business other than the classes discussed below, there is generally some potential for deviation in
both the loss cost trend and loss development factor assumptions.
The effect of these deviations is expected to be less material compared to the effect on theclasses noted below
• The percentage deviations noted in the table below are not considered the highest
possible deviations that might be expected, but rather what we consider to reflect a reasonably likely range of
potential deviation. Actual loss cost trends in the early 1990s were negative for several years whereas actual
loss cost trends exceeded the figures cited above for several other years. Loss trends may deviate by more
than the amounts noted above and discussed below.
• The percentage deviations noted in the table below are not considered the
highest possible deviations that might be expected, but rather what we consider to reflect a reasonably likely
range of potential deviation. Except for excess workers’ compensation, the assumed loss development factors
are a key assumption. Generally, actual historical loss development factors are used to project future loss
development. Future loss development patterns may be different from those in the past, or may deviate by
more than the amounts noted above and discussed below.
AIG’s loss reserve analyses do not generally provide a range of loss reserve estimates. A large portion of the loss
reserves from AIG Property Casualty business relates to longer-tail casualty classes of business, such as excess
casualty and D&O, which are driven by severity rather than frequency of claims. Using the reserving methodologies
described above, our actuaries determine their actuarial central estimates of the loss reserves and advise
management on their final recommendation for management’s best estimate of the recorded reserves. Subject matter
experts from underwriting and claims play an important part in informing the actuarial assumptions and methods. The
governance process over the establishment of loss reserves also ensures robust considerations of the changes in
the loss trends, terms and conditions, claims handling practices, and large loss impact when determining the
methods, assumptions and the estimations. This multi-disciplinary process engages underwriting, claims, risk
management, business unit executives and senior management and involves several iterative levels of feedback and
response during the regular reserving process.
The sensitivity analysis below addresses each major class of business for which there is a possibility of a material
deviation from our overall reserve position. The analysis uses what we believe is a reasonably likely range of
potential deviation for each class. Actual reserve development may not be consistent with either the original or the
adjusted loss trend or loss development factor assumptions, and other assumptions made in the reserving process
may materially affect reserve development for a particular class of business.
..................................................................................................................................................................................................................................
AIG 2012 Form 10-K186
Loss cost trends:
Loss development factors:
I T E M 7 / C R I T I C A L A C C O U N T I N G E S T I M A T E S
:ao o opde e ev :oss e e opmen ac orst tL d l f
:o o e d :oss cos ren st tL d

.....................................................................................................................................................................................
Class of Business Loss Cost Trend Loss Development Factor
The assumed loss cost trend was approximately After evaluating the historical loss development
five percent. After evaluating the historical loss factors from prior accident years since the early
cost trends from prior accident years since the 1990s, in our judgment, it is reasonably likely that
early 1990s, in our judgment, it is reasonably actual loss development factors will range from
likely that actual loss cost trends applicable to the approximately 3.3 percent below those actually
year-end 2012 loss reserve review for excess utilized in the year-end 2012 reserve review to
casualty will range from 0 percent to positive approximately 4.6 percent above those factors
10 percent, or approximately 5 percent lower or actually utilized. Excess casualty is a long-tail
higher than the assumption actually utilized in the class of business and any deviation in loss
year-end 2012 reserve review. The loss cost development factors might not be discernible for
trend assumption is critical for the excess an extended period of time subsequent to the
casualty class of business due to the long-tail recording of the initial loss reserve estimates for
nature of the claims and therefore is applied any accident year. Thus, there is the potential for
across many accident years. Thus, there is the the reserves with respect to a number of accident
potential for the reserves with respect to a years to be significantly affected by changes in
number of accident years (the expected loss ratio loss development factors that were initially relied
years) to be significantly affected by changes in upon in setting the reserves. These changes in
loss cost trends that were initially relied upon in loss development factors could be attributable to
setting the reserves. These changes in loss changes in inflation or in the judicial environment,
trends could be attributable to changes in inflation or in other social or economic conditions affecting
or in the judicial environment, or in other social or claims.
economic conditions affecting claims.
The assumed loss cost trend was approximately The assumed loss development factors are also
half of one percent. After evaluating the historical an important assumption but less critical than for
loss cost trends from prior accident years since excess casualty. Because these classes are
the early 1990s, including the potential effect of written on a claims made basis, the loss reporting
recent claims relating to the credit crisis, in our and development tail is much shorter than for
judgment, it is reasonably likely that actual loss excess casualty. However, the high severity
cost trends applicable to the year-end 2012 loss nature of the claims does create the potential for
reserve review for these classes will range from significant deviations in loss development patterns
negative 25 percent to positive 27 percent, or from one year to the next. After evaluating the
approximately 25.5 percent lower or 26.5 percent historical loss development factors for these
higher than the assumption actually utilized in the classes of business for accident years since the
year-end 2012 reserve review. Because the D&O early 1990s, in our judgment, it is reasonably
class of business has exhibited highly volatile likely that actual loss development factors will
loss trends from one accident year to the next, range from approximately 6.8 percent lower to
there is the possibility of an exceptionally high 11 percent higher than those factors actually
deviation. utilized in the year-end 2012 loss reserve review
for these classes.
..................................................................................................................................................................................................................................
AIG 2012 Form 10-K 187
.....................................................................................................................................................................................................................
.....................................................................................................................................................................................................................
Excess Casualty
D&O and Related Management Liability Classes of Business
I T E M 7 / C R I T I C A L A C C O U N T I N G E S T I M A T E S

.....................................................................................................................................................................................
Class of Business Loss Cost Trend Loss Development Factor
The loss cost trend assumption is not believed to Generally, our actual historical workers’
be material with respect to our loss reserves. This compensation loss development factors would be
is primarily because our actuaries are generally expected to provide a reasonably accurate
able to use loss development projections for all predictor of future loss development. However,
but the most recent accident year’s reserves, so workers’ compensation is a long-tail class of
there is limited need to rely on loss cost trend business, and our business reflects a very
assumptions for primary workers’ compensation significant volume of losses, particularly in recent
business. accident years. After evaluating the actual
historical loss development since the 1980s for
this business, in our judgment, it is reasonably
likely that actual loss development factors will fall
within the range of approximately 3.1 percent
below to 6.9 percent above those actually utilized
in the year-end 2012 loss reserve review.
Loss costs were trended at six percent per Excess workers’ compensation is an extremely
annum. After reviewing actual industry loss trends long-tail class of business, with a much greater
for the past ten years, in our judgment, it is than normal uncertainty as to the appropriate loss
reasonably likely that actual loss cost trends development factors for the tail of the loss
applicable to the year-end 2012 loss reserve development. After evaluating the historical loss
review for excess workers’ compensation will development factors for prior accident years since
range five percent lower or higher than this the 1980s as well as the development over the
estimated loss trend. past several years of the ground up claim
projections utilized to help select the loss
development factors in the tail for this class of
business, in our judgment, it is reasonably likely
that actual loss development for excess workers’
compensation could increase the current reserves
by up to approximately $1.3 billion or decrease
them by approximately $850 million.
..................................................................................................................................................................................................................................
AIG 2012 Form 10-K188
.....................................................................................................................................................................................................................
.....................................................................................................................................................................................................................
Primary Workers’ Compensation
Excess Workers’ Compensation
I T E M 7 / C R I T I C A L A C C O U N T I N G E S T I M A T E S

.....................................................................................................................................................................................
The following sensitivity analysis table summarizes the effect on the loss reserve position of using certain
alternative loss cost trend (for accident years where we use expected loss ratio methods) or loss
development factor assumptions rather than the assumptions actually used in determining our estimates in
the year-end loss reserve analyses in 2012.
Loss cost trends: Loss development factors:
5 percent increase $ 1,500 4.6 percent increase $ 1,100
5 percent decrease (1,100) 3.3 percent decrease (700)
26.5 percent increase 1,000 11 percent increase 650
25.5 percent decrease (700) 6.8 percent decrease (400)
5 percent increase 400 Increase(b) 1,300
5 percent decrease (250) Decrease(b) (850)
6.9 percent increase 2,200
3.1 percent decrease (1,000)
(a) Loss cost trend assumption does not have a material impact for this line of business.
(b) Percentages not applicable due to extremely long-tailed nature of workers’ compensation.
Future Policy Benefits for Life and Accident and Health Insurance Contracts (AIG Life and
Retirement)..............................................................................................................................................................................................
for life and
accident and health insurance contracts, which include liabilities for certain payout annuities. We also evaluate
estimates used in amortizing Deferred Policy Acquisition Costs (DAC), Value of Business Acquired (VOBA) and
Sales Inducement Assets (SIA) for these products. We evaluate these estimates against actual experience and
adjust them based on management judgment regarding mortality, morbidity, persistency, maintenance expenses, and
investment returns.
The assumptions used to calculate the
benefit liabilities and DAC are set when a policy is issued and do not change with changes in actual experience,
unless a loss recognition event occurs. These assumptions include margins for adverse deviation in the event that
actual experience might deviate from these assumptions.
As we experience changes over time, we update the assumptions to reflect these The key assumptions used in
observed changes. Because of the long term nature of many of our liabilities subject estimating future policy benefit
to the ‘‘lock-in’’ principle, small changes in certain assumptions may cause large reserves are:
changes in the degree of reserve adequacy. In particular, changes in estimates of• Investment returns: which
future invested asset returns have a large effect on the degree of reserve deficiency.vary by year of issuance and
If observed changes in actual experience or estimates result in projected futureproducts.
losses under loss recognition testing, we adjust DAC through amortization expense,
and may record additional liabilities through a charge to policyholder benefit expense. • Mortality, morbidity andLoss recognition testing is performed at an aggregate AIG Life and Retirement surrender rates: based uponreporting segment level. Once loss recognition has been recorded for a block of actual experience modified tobusiness, the old assumption set is replaced (i.e., a DAC unlocking), and the allow for variation in policyassumption set used for the loss recognition would then be subject to the lock-in form, risk classification andprinciple. See Note 10 to the Consolidated Financial Statements for additional distribution channel.information.
• Premium rate increases
(Long-term care)
..................................................................................................................................................................................................................................
AIG 2012 Form 10-K 189
Effect on Loss Effect on LossDecember 31, 2012(in millions) Reserves Reserves
Excess casualty: Excess casualty:
D&O: D&O:
Excess workers’ compensation: Excess workers’ compensation:
Primary workers’ compensation(a): Primary workers’ compensation:
Periodically, we evaluate estimates used in establishing liabilities for future policy benefits
For long duration traditional business, a ‘‘lock-in’’ principle applies.
I T E M 7 / C R I T I C A L A C C O U N T I N G E S T I M A T E S

.....................................................................................................................................................................................
We also use these estimates to determine whether to adjust DAC and record additional liabilities when unrealized
gains or losses on fixed maturity and equity securities available for sale are recognized through accumulated other
comprehensive income. The determination is made at each balance sheet date, as if the securities had been sold at
their stated aggregate fair value and the proceeds reinvested at current yields. Significant unrealized appreciation on
investments in a prolonged low interest rate environment may cause DAC to be adjusted and additional future policy
benefit liabilities to be recorded through a charge directly to accumulated other comprehensive income (ie. Shadow
DAC). This is included, net of tax, with the change in net unrealized appreciation (depreciation) of investments.
We determine the GMDB
liability each period end by estimating the expected value of death benefits in excess of the projected account
balance and recognizing the excess ratably over the accumulation period based on total expected fees. The
estimates include assumptions about interest rates, mortality rates, lapse rates and a randomly generated model of
investment returns. In addition to GMDB, our future policy benefits include, to a lesser extent, guaranteed minimum
income benefits (GMIB). We determine GMIB liability each period end by estimating the expected value of the
periodic income payments from annuities in excess of the projected account balance. We derive this estimate at the
date the annuity converts to regular payments, and we recognize the excess ratably over the accumulation period
based on total expected assessments. We periodically evaluate estimates used and adjust the additional liability
balance, with a related charge or credit to benefit expense, if actual experience or other evidence suggests that
earlier assumptions should be revised.
These living benefits are embedded
derivatives that are required to be bifurcated from the host contract and carried at fair value. The fair value estimates
of the living benefit guarantees include assumptions such as equity market returns, interest rates, market volatility
and policyholder behavior. We also incorporate our own risk of non-performance in the valuation of the embedded
policy derivatives. See Note 6 to the Consolidated Financial Statements for information on how AIG incorporates its
own non-performance risk.
We have a dynamic hedging program designed to manage economic risk exposure associated with changes in the
fair value of GMWB and GMAV liabilities caused by changes in the equity markets, interest rates and market implied
volatilities. The program utilizes hedging instruments, including derivatives such as equity options, futures contracts
and interest rate swap contracts, and is designed so that changes in value of the hedging instruments move in the
opposite direction of changes in the GMWB and GMAV embedded derivative liabilities. We monitor the hedging
positions on a daily basis in relation to the change in valuation of GMWB and GMAV embedded derivative liabilities,
and rebalance those positions as needed. Differences between the change in fair value of GMWB and GMAV
embedded derivative liabilities and the hedging instruments can be caused by extreme and unanticipated movements
in the equity markets, interest rates and market volatility, policyholder behavior, statutory capital considerations and
constraints and the ability to purchase hedging instruments at prices consistent with the desired risk and return
trade-off. None of the derivative instruments described above are designated for hedge accounting.
Approximately 56 percent of our individual variable annuity account values contain either a GMWB rider or a GMAV
rider as of December 31, 2012. Declines in the equity markets, increased volatility and a sustained low interest rate
environment increase our exposure to potential benefits under the GMWB and GMAV contracts, leading to an
increase in the existing liability for those benefits. Our exposure to the guaranteed amounts is equal to the amount
by which the contract holder’s account balance is below the guaranteed withdrawal or account value amount. As of
December 31, 2012, our exposure to the guaranteed withdrawal and account value amount under GMWB and GMAV
was $0.9 billion and $10 million, respectively.
The only way the GMWB contract holder can monetize the excess of the guaranteed amount over the account value
of the contract is through a series of withdrawals that do not exceed a specific percentage per year of the
guaranteed amount. If, after the series of withdrawals, the account value is exhausted, the contract holder will
receive a series of annuity payments equal to the remaining guaranteed amount, and, for lifetime GWWB products,
the annuity payments can continue beyond the guaranteed amount. The account value can also fluctuate with equity
market returns on a daily basis resulting in increases or decreases in the excess of the guaranteed amount over
account value.
The net impact of the change in the fair value of the embedded derivative liabilities, as well as the change in the fair
value of the derivative instruments is included in Net Realized Capital Gains (Losses).
..................................................................................................................................................................................................................................
AIG 2012 Form 10-K190
Our future policy benefits include guaranteed minimum death benefits (GMDB).
We also issue certain variable annuity products that offer optional guaranteed minimum withdrawal benefits
(GMWB) and guaranteed minimum account value benefits (GMAV).
I T E M 7 / C R I T I C A L A C C O U N T I N G E S T I M A T E S

.....................................................................................................................................................................................
For a further discussion of the risks of AIG’s unhedged exposures, see Item 1A. – Risk Factors – Business and
Operations.
Estimated Gross Profits for Interest-Sensitive Products (AIG Life and Retirement)..............................................................................................................................................................................................
Estimated gross profits (EGP) are subject to differing market returns and interest rate environments in any single
period. EGP is composed of net investment income, net realized investment gains and losses, fees, surrender
charges, expenses, and mortality and morbidity gains and losses. When assumptions are changed, the percentage of
EGP used to amortize DAC may also change.
The following table summarizes the sensitivity of changes in certain assumptions in the amortization of DAC/
SIA, guaranteed benefits reserve and unearned revenue liability and the related hypothetical impact on
year-end 2012 balances. The effect of changes in the equity markets, volatility and interest rates primarily
impacts individual variable annuities (SunAmerica Retirement Markets) and group retirement products
(VALIC). The effect of changes in mortality primarily impacts the universal life insurance business.
Assumptions:
Equity Return(a)
Effect of an increase by 1% $ 67 $ – $ (23) $ 90
Effect of a decrease by 1% (67) – 54 (121)
Volatility(b)
Effect of an increase by 1% (10) 1 2 (13)
Effect of a decrease by 1% 9 (1) (2) 12
Interest Rate(c)
Effect of an increase by 10 basis points 9 1 – 8
Effect of a decrease by 10 basis points (9) (1) – (8)
Mortality
Effect of an increase by 1% (15) (6) 13 (22)
Effect of a decrease by 1% 13 5 (13) 21
(a) Represents the net impact of 1 percent increase or decrease in long-term equity returns for GMDB and GMIB reserves and negligible net
impact of 1 percent increase or decrease in the S&P 500 index for living benefit reserves.
(b) Represents the net impact of 1 percentage point increase or decrease in implied volatility.
(c) Represents the net impact of a 10 basis point parallel shift in the yield curve. Does not represent interest rate spread compression.
The analysis of DAC, guaranteed benefits reserve and unearned revenue liability is a dynamic process that considers
all relevant factors and assumptions described above. We estimate each of the above factors individually, without the
effect of any correlation among the key assumptions. An assessment of sensitivity associated with changes in any
single assumption would not necessarily be an indicator of future results.
Other-Than-Temporary Impairments on Available For Sale Securities..............................................................................................................................................................................................
At each balance sheet date, we evaluate our available for sale securities holdings with unrealized losses.
See the discussion in Note 7 to the Consolidated Financial Statements for additional information on the methodology
and significant inputs, by security type, that we use to determine the amount of other-than-temporary impairment on
fixed maturity and equity securities.
Goodwill Impairment..............................................................................................................................................................................................
For a discussion of goodwill impairment, see Note 2 to the Consolidated Financial Statements.
..................................................................................................................................................................................................................................
AIG 2012 Form 10-K 191
Guaranteed Unearned NetDecember 31, 2012 Benefits Revenue Pre-Tax(in millions) DAC/SIA Reserve Liability Earnings
I T E M 7 / C R I T I C A L A C C O U N T I N G E S T I M A T E S

.....................................................................................................................................................................................
Liability for Legal Contingencies..............................................................................................................................................................................................
We estimate and record a liability for potential losses that may arise from litigation and regulatory proceedings to the
extent such losses are probable and can be estimated. Determining a reasonable estimate of the amount of such
losses requires significant management judgment. In many cases, it is not possible to determine whether a liability
has been incurred or to estimate the ultimate or minimum amount of that liability until the matter is close to
resolution. In view of the inherent difficulty of predicting the outcome of such matters, particularly in cases in which
claimants seek substantial or indeterminate damages, we often cannot predict the outcome or estimate the eventual
loss or range of reasonably possible losses related to such matters.
See Note 16 to the Consolidated Financial Statements.
Fair Value Measurements of Certain Financial Assets and Liabilities..............................................................................................................................................................................................
See Note 6 to the Consolidated Financial Statements for more detailed information about the measurement of fair
value of financial assets and financial liabilities and how our accounting policy incorporates credit risk in fair value
measurements.
The following table presents the fair value of fixed maturity and equity securities by source of value
determination:
Fair value based on external sources(a) $ 280 94%
Fair value based on internal sources 18 6
Total fixed maturity and equity securities(b) $ 298 100%
(a) Includes $28.7 billion for which the primary source is broker quotes.
(b) Includes available for sale and trading securities.
Level 3 Assets and Liabilities..............................................................................................................................................................................................
Assets and liabilities recorded at fair value in the Consolidated Balance Sheet are measured and classified in a
hierarchy for disclosure purposes consisting of three ‘‘levels’’ based on the observability of inputs available in the
marketplace used to measure the fair value. See Note 6 to the Consolidated Financial Statements for additional
information.
The following table presents the amount of assets and liabilities measured at fair value on a recurring basis
and classified as Level 3:
Assets $ 39.4 7.1%
Liabilities 5.3 1.2
Level 3 fair value measurements are based on valuation techniques that use at least one significant input that is
unobservable. We consider unobservable inputs to be those for which market data is not available and that are
developed using the best information available about the assumptions that market participants would use when
valuing the asset or liability. Our assessment of the significance of a particular input to the fair value measurement in
its entirety requires judgment.
We classify fair value measurements for certain assets and liabilities as Level 3 when they require significant
unobservable inputs in their valuation, including contractual terms, prices and rates, yield curves, credit curves,
measures of volatility, prepayment rates, default rates, mortality rates and correlations of such inputs.
..................................................................................................................................................................................................................................
AIG 2012 Form 10-K192
December 31, 2012 Fair Percent(in billions) Value of Total
December 31, PercentageDecember 31, Percentage(in billions) 2012 of Total 2011 of Total
$ 40.5 7.4%
4.1 0.9
I T E M 7 / C R I T I C A L A C C O U N T I N G E S T I M A T E S

.....................................................................................................................................................................................
The following paragraphs describe the methods we use to measure fair value on a recurring basis for certain classes
of assets and liabilities classified in Level 3. See Note 6 to the Consolidated Financial Statements for discussion of
the valuation methodologies for other assets classified in Level 3, including certain fixed maturity securities and
certain other invested assets, as well as discussion of transfers of Level 3 assets and liabilities.
Super Senior Credit Default Swap Portfolio..............................................................................................................................................................................................
The entities included in GCM wrote credit protection on the super senior risk layer of collateralized loan obligations
(CLOs), multi-sector CDOs and diversified portfolios of corporate debt, and prime residential mortgages through
2006. In these transactions, AIG is at risk of credit performance on the super senior risk layer related to such assets.
To a lesser extent, those entities also wrote protection on tranches below the super senior risk layer, primarily related
to regulatory capital relief transactions.
See Notes 6 and 12 to the Consolidated Financial Statements for information about the Regulatory Capital, Multi-
Sector CDO, Corporate Debt/Collateralized Debt Obligation (CLO) and other portfolios.
AIG utilizes sensitivity analyses that estimate the effects of using alternative pricing and other key inputs on our
calculation of the unrealized market valuation loss related to the super senior credit default swap portfolio. While we
believe that the ranges used in these analyses are reasonable, we are unable to predict which of the scenarios is
most likely to occur. As recent experience demonstrates, actual results in any period are likely to vary, perhaps
materially, from the modeled scenarios, and there can be no assurance that the unrealized market valuation loss
related to the super senior credit default swap portfolio will be consistent with any of the sensitivity analyses. On
average, prices for CDOs increased during 2012. Further, it is difficult to extrapolate future experience based on
current market conditions.
For the purposes of estimating sensitivities for the super senior multi-sector CDO credit default swap portfolio, the
change in valuation derived using the Binomial Expansion Technique (BET) model is used to estimate the change in
the fair value of the derivative liability. Of the total $3.9 billion net notional amount of CDS written on multi-sector
CDOs outstanding at December 31, 2012, a BET value is available for $2.6 billion net notional amount. No BET
value is determined for $1.3 billion of CDS written on European multi-sector CDOs as prices on the underlying
securities held by the CDOs are not provided by collateral managers; instead these CDS are valued using
counterparty prices. Therefore, sensitivities disclosed below apply only to the net notional amount of $2.6 billion.
The most significant assumption used in the BET model is the estimated price of the securities within the CDO
collateral pools. If the actual price of the securities within the collateral pools differs from the price used in estimating
the fair value of the super senior credit default swap portfolio, there is potential for material variation in the fair value
estimate. Any declines in the value of the underlying collateral securities held by a CDO will similarly affect the value
of the super senior CDO securities. While the models attempt to predict changes in the prices of underlying collateral
securities held within a CDO, the changes are subject to actual market conditions which have proved to be highly
volatile. We cannot predict reasonably likely changes in the prices of the underlying collateral securities held within a
CDO at this time.
..................................................................................................................................................................................................................................
AIG 2012 Form 10-K 193
I T E M 7 / C R I T I C A L A C C O U N T I N G E S T I M A T E S

.....................................................................................................................................................................................
The following table presents key inputs used in the BET model, and the potential increase (decrease) to the
fair value of the derivative liability by ABS category at December 31, 2012 corresponding to changes in these
key inputs:
Bond prices 41 points Increase of 5 points $ (152) $ (2) $ (10) $ (72) $ (44) $ (15) $ (9)
Decrease of 5 points 146 2 9 62 45 14 14
Weighted Increase of 1 year 15 1 – 11 2 – 1
average life 5.75 years Decrease of 1 year (23) (1) – (18) (3) (1) –
Recovery rates 17% Increase of 10% (13) – (2) (8) (1) (1) (1)
Decrease of 10% 15 – 2 9 3 1 –
Diversity score(a) 14 Increase of 5 (4)
Decrease of 5 11
Discount curve(b) N/A Increase of 100bps 10
(a) The diversity score is an input at the CDO level. A calculation of sensitivity to this input by type of security is not possible.
(b) The discount curve is an input at the CDO level. A calculation of sensitivity to this input by type of security is not possible. Furthermore, for
this input it is not possible to disclose a weighted average input as a discount curve consists of a series of data points.
These results are calculated by stressing a particular assumption independently of changes in any other assumption.
No assurance can be given that the actual levels of the key inputs will not exceed, perhaps significantly, the ranges
assumed by us for purposes of the above analysis. No assumption should be made that results calculated from the
use of other changes in these key inputs can be interpolated or extrapolated from the results set forth above.
..................................................................................................................................................................................................................................
AIG 2012 Form 10-K194
Increase (Decrease) to Fair Value of Derivative LiabilityAverageInputs Used at Entire RMBS RMBS RMBS
(dollars in millions) December 31, 2012 Change Portfolio Prime Alt-A Subprime CMBS CDOs Other
I T E M 7 / C R I T I C A L A C C O U N T I N G E S T I M A T E S

.....................................................................................................................................................................................
GLOSSARY
Accident year The annual calendar accounting period in which loss events occurred, regardless of when the losses
are actually reported, booked or paid.
Accident year combined ratio, as adjusted the combined ratio excluding catastrophe losses and related
reinstatement premiums, prior year development, net of premium adjustments, and the impact of reserve discounting.
Accident year loss ratio, as adjusted the loss ratio excluding catastrophe losses and related reinstatement
premiums, prior year development, net of premium adjustments and the impact of reserve discount. Catastrophe
losses are generally weather or seismic events having a net impact on AIG Property Casualty in excess of
$10 million each.
Acquisition ratio acquisition costs divided by net premiums earned. Acquisition costs are those costs incurred to
acquire new and renewal insurance contracts and also include the amortization of VOBA. Acquisition costs vary with
sales and include, but are not limited to, commissions, premium taxes, direct marketing costs, certain costs of
personnel engaged in sales support activities such as underwriting, and the change in deferred acquisition costs.
Acquisition costs that are incremental and directly related to successful sales efforts are deferred and recognized
over the coverage periods of related insurance contracts. Acquisition costs that are not incremental and directly
related to successful sales efforts are recognized as incurred.
Admitted insurer A company licensed to transact insurance business within a state.
AIG – After-tax operating income (loss) is derived by excluding the following items from net income (loss): income
(loss) from discontinued operations, net loss (gain) on sale of divested businesses, income from divested businesses,
legacy FIN 48 and other tax adjustments, legal reserves (settlements) related to ‘‘legacy crisis matters,’’ deferred
income tax valuation allowance (releases) charges, amortization of the Federal Reserve Bank of New York prepaid
commitment fee asset, changes in fair value of AIG Life and Retirement fixed income securities designated to hedge
living benefit liabilities, change in benefit reserves and deferred policy acquisition costs (DAC), value of business
acquired (VOBA), and sales inducement assets (SIA) related to net realized capital (gains) losses, (gain) loss on
extinguishment of debt, net realized capital (gains) losses, non-qualifying derivative hedging activities, excluding net
realized capital (gains) losses and bargain purchase gain. ‘‘Legacy crisis matters’’ include favorable and unfavorable
settlements related to events leading up to and resulting from our September 2008 liquidity crisis. It also includes
legal fees incurred by AIG as the plaintiff in connection with such legal matters.
AIG Life and Retirement – Operating income (loss) Operating income (loss) is derived by excluding the following
items from net income (loss): legal settlements related to legacy crisis matters, changes in fair values of fixed
maturity securities designated to hedge living benefit liabilities, net realized capital (gains) losses, and changes in
benefit reserves and DAC, VOBA, and SIA related to net realized capital (gains) losses.
AIG Life and Retirement – Premiums, deposits and other considerations includes life insurance premiums and
deposits on annuity contracts and mutual funds.
AIG Property Casualty – Net premiums written represent the sales of an insurer, adjusted for reinsurance
premiums assumed and ceded, during a given period. Net premiums earned are the revenue of an insurer for
covering risk during a given period. Net premiums written are a measure of performance for a sales period while Net
premiums earned are a measure of performance for a coverage period. From the period in which the premiums are
written until the period in which they are earned, the amount is presented as Unearned premium reserves in the
Consolidated Balance Sheet.
AIG Property Casualty – Operating income (loss) In 2012, AIG Property Casualty revised its non-GAAP income
measure from underwriting income (loss) to operating income (loss), which includes both underwriting income (loss)
and net investment income, but not net realized capital (gains) losses or other (income) expense, legal settlements
related to legacy crisis matters and bargain purchase gain. Underwriting income (loss) is derived by reducing net
premiums earned by claims and claims adjustment expense and underwriting expenses, which consist of the
acquisition costs and general operating expenses.
Assume, assumed reinsurance, assuming company An insurance company that accepts all or part of a ceding
company’s insurance or reinsurance on a risk or exposure is referred to as the assuming company.
..................................................................................................................................................................................................................................
AIG 2012 Form 10-K 195
I T E M 7 / G L O S S A R Y

.....................................................................................................................................................................................
Basel I, Basel II and Basel III set of capital and liquidity standards for international financial institution established
by the Basel Committee on Banking Supervision.
BET Binomial Expansion Technique A model that generates expected loss estimates for CDO tranches and derives
a credit rating for those tranches.
Book Value Per Share Excluding Accumulated Other Comprehensive Income (loss) (AOCI) is used to show the
amount of our net worth on a per-share basis. Book Value Per Share Excluding AOCI is derived by dividing Total
AIG shareholders’ equity, excluding AOCI, by Total common shares outstanding.
Case reserves Claim department estimates of anticipated future payments to be made on each specific individual
reported claim.
Casualty insurance Insurance that is primarily associated with the losses caused by injuries to third persons,
i.e., not the insured, and the legal liability imposed on the insured as a result.
Cede, ceded reinsurance, ceding company An insurance company that reinsures its risk with another, is referred
to as the ceding company.
Combined ratio Sum of the loss ratio and the acquisition and general operating expense ratios.
CSA Credit Support Annex A legal document that provides for collateral postings at various ratings and threshold
levels.
DAC Deferred Policy Acquisition Costs Deferred costs that are incremental and directly related to the successful
acquisition of new business or renewal of existing business.
Expense ratio Sum of acquisition costs and general operating expenses, divided by net premiums earned.
First-Lien Priority over all other liens or claims on a property in the event of default on a mortgage.
General operating expense ratio general operating expenses divided by net premiums earned. General operating
expenses are those costs that are generally attributed to the support infrastructure of the organization and include
but are not limited to personnel costs, projects and bad debt expenses. General operating expenses exclude claims
adjustment expenses, acquisition expenses, and investment expenses.
GIC/GIA Guaranteed Investment Contract/Guaranteed Investment Agreement A contract whereby the seller provides
a guaranteed repayment of principal and a fixed or floating interest rate for a predetermined period of time.
IBNR Incurred But Not Reported Estimates of claims that have been incurred but not reported to us.
IFS Insurer Financial Strength ratings IFS ratings measure the ability of an insurance company to meet its
obligations to contract holders and policyholders.
LAE Loss Adjustment Expenses The expenses of settling claims, including legal and other fees and the portion of
general expenses allocated to claim settlement costs.
Long-Tail Reserves Reserves for claims that may be reported or settled several years after the coverage period
has expired for these classes of businesses. Long-tail casualty classes of business include excess and umbrella
liability, D&O, professional liability, medical malpractice, workers’ compensation, general liability, products liability and
related classes.
Loss Ratio Claims and claims adjustment expenses incurred divided by net premiums earned. Claims adjustment
expenses are directly attributed to settling and paying claims of insureds and include, but are not limited to, legal
fees, adjuster’s fees, and claims department personnel costs.
Loss reserve development The increase or decrease in incurred claims and claim adjustment expenses as a result
of the re-estimation of claims and claim adjustment expense reserves at successive valuation dates for a given group
of claims.
Loss reserves Liability for unpaid claims and claims adjustment expense. The estimated ultimate cost of settling
claims relating to insured events that have occurred on or before the balance sheet date, whether or not reported to
the insurer at that date.
LTV Loan-to-Value Ratio Principal amount of loan amount divided by appraised value of collateral securing the loan.
..................................................................................................................................................................................................................................
AIG 2012 Form 10-K196
I T E M 7 / G L O S S A R Y

.....................................................................................................................................................................................
Net premiums written Represent the sales of an insurer, adjusted for reinsurance premiums assumed and ceded,
during a given period. Net premiums earned are the revenue of an insurer for covering risk during a given period.
Net premiums written are a measure of performance for a sales period while Net premiums earned are a measure of
performance for a coverage period. From the period in which the premiums are written until the period in which they
are earned, the amount is presented as Unearned premium reserves in the Consolidated Balance Sheet.
Noncontrolling interest The portion of equity ownership in a consolidated subsidiary not attributable to the
controlling parent company.
Other Operations – Operating income (loss): income (loss) excluding certain legal reserves (settlements) related
to legacy crisis matters, loss on extinguishment of debt, amortization of prepaid commitment fee asset, Net realized
capital (gains) losses, net (gains) losses on sale of divested businesses and properties, and income from divested
businesses.
Overturns The reversal of a rescinded mortgage guarantee policy.
Policy fees An amount added to a policy premium, or deducted from a policy cash value or contract holder account,
to reflect the cost of issuing a policy, establishing the required records, sending premium notices and other related
expenses.
Prior year development Increase or decrease in estimates of losses and loss expenses for prior years that is
included in earnings.
RBC Risk-Based Capital A formula designed to measure the adequacy of an insurer’s statutory surplus compared to
the risks inherent in its business.
Reinstatement premium Additional premiums payable to reinsurers to restore coverage limits that have been
exhausted as a result of reinsured losses under certain excess of loss reinsurance treaties.
Reinsurance The practice whereby one insurer, the reinsurer, in consideration of a premium paid to that insurer,
agrees to indemnify another insurer, the ceding company, for part or all of the liability of the ceding company under
one or more policies or contracts of insurance which it has issued.
Rescission Denial of claims and termination of coverage on loans related to fraudulent or undocumented claims,
underwriting guideline violations and other deviations from contractual terms.
Reserve deficiency When actual reported reserves are lower than the expected reserves. This is also referred to as
unfavorable loss development.
Reserve redundancy When actual reported reserves exceed expected reserves. This is also referred to as
favorable loss development.
Retained Interest Category within AIG’s Other operations that includes the fair value gains or losses, prior to their
sale, of the AIA ordinary shares retained following the AIA initial public offering and the MetLife, Inc. (MetLife)
securities that were received as consideration from the sale of American Life Insurance Company (ALICO) and the
fair value gains or losses, prior to the FRBNY liquidation of ML III assets, on the retained interest in ML III.
Second-lien Subordinate in ranking to the first-lien holder on a property in the event of default on a mortgage.
Severe losses Individual non-catastrophe first party losses greater than $10 million, net of related reinsurance.
Short-Tail Reserves Reserves for claims that are generally reported and paid within a relatively short period of time
during and following the policy coverage period. Short-tail classes of business consist principally of property, personal
lines and certain casualty classes.
SIA Sales Inducement Asset Represents amounts that are credited to policyholder account balances related to the
enhanced crediting rates that a seller offers on certain of its annuity products.
SIFI Systemically Important Financial Institutions Financial institutions are deemed systemically important (that is, the
failure of the financial institution could pose a threat to the financial stability of the United States) by the Financial
Stability Oversight Council (FSOC) based on a three-stage analytical process.
Solvency II Legislation in the European Union which reforms the insurance industry’s solvency framework, including
minimum capital and solvency requirements, governance requirements, risk management and public reporting
..................................................................................................................................................................................................................................
AIG 2012 Form 10-K 197
I T E M 7 / G L O S S A R Y

.....................................................................................................................................................................................
standards. The Solvency II Directive (2009/138/EEC), was adopted on November 25, 2009 and is expected to
become effective in January 2014.
SSDMF Social Security Death Master File A database of deceased individuals, most of whom were issued a social
security number during their lifetimes, maintained by the U.S. Social Security Administration.
Surrender charge A charge levied against an investor for the early withdrawal of funds from a life insurance or
annuity contract, or for the cancellation of the agreement.
Unearned premium reserve Liabilities established by insurers and reinsurers to reflect unearned premiums which
are usually refundable to policyholders if an insurance or reinsurance contract is canceled prior to expiration of the
contract term.
VaR Value-at-Risk A summary statistical measure that uses the estimated volatility and correlation of market factors
to calculate the maximum loss that could occur over a defined period of time with a specified level of statistical
confidence.
VOBA Value of Business Acquired Present value of projected future gross profits from in-force policies from
acquired businesses.
..................................................................................................................................................................................................................................
AIG 2012 Form 10-K198
I T E M 7 / G L O S S A R Y

.....................................................................................................................................................................................
ACRONYMS
GMWB Guaranteed Minimum Withdrawal BenefitsA&H Accident and Health Insurance
IFRS International Financial Reporting StandardsABS Asset-Backed Security
ISDA International Swaps and DerivativesCDO Collateralized Debt ObligationAssociation, Inc.
CDS Credit Default SwapNAIC National Association of Insurance Commissioners
CLO Collateralized Loan ObligationsNM Not Meaningful
CMA Capital Maintenance AgreementOTC Over-the-Counter
CMBS Commercial Mortgage Backed SecuritiesOTTI Other-Than-Temporary Impairment
FASB Financial Accounting Standards BoardRMBS Residential Mortgage Backed Securities
FRBNY Federal Reserve Bank of New YorkS&P Standard & Poor’s Financial Services LLC
GAAP Accounting principles generally accepted in theSEC Securities and Exchange CommissionUnited States of America
TARP Troubled Asset Relief Program of the DepartmentGMAV Guaranteed Minimum Account Value Benefitsof the Treasury
GMDB Guaranteed Minimum Death BenefitsVIE Variable Interest Entity
GMIB Guaranteed Minimum Income Benefits
..................................................................................................................................................................................................................................
AIG 2012 Form 10-K 199
I T E M 7 / A C R O N Y M S

.....................................................................................................................................................................................
..............................................................................................................................................................................................
The information required by this item is set forth in the Enterprise Risk Management section of Item 7. Management’s
Discussion and Analysis of Financial Condition and Results of Operations and is incorporated herein by reference.
..................................................................................................................................................................................................................................
AIG 2012 Form 10-K200
ITEM 7A / QUANTITATIVE AND QUALITATIVE DISCLOSURESABOUT MARKET RISK
I T E M 7 A / Q U A N T I T A T I V E A N D Q U A L I T A T I V E D I S C L O S U R E S A B O U T M A R K E T R I S K

.....................................................................................................................................................................................
..............................................................................................................................................................................................
AMERICAN INTERNATIONAL GROUP, INC.INDEX TO FINANCIAL STATEMENTS AND SCHEDULES
Report of Independent Registered Public Accounting Firm 203
Consolidated Balance Sheet at December 31, 2012 and 2011 204
Consolidated Statement of Operations for the years ended December 31, 2012, 2011 and 2010 205
Consolidated Statement of Comprehensive Income (Loss) for the years ended December 31, 2012, 2011 and
2010 206
Consolidated Statement of Equity for the years ended December 31, 2012, 2011 and 2010 207
Consolidated Statement of Cash Flows for the years ended December 31, 2012, 2011 and 2010 208
Note 1. Basis of Presentation 210
Note 2. Summary of Significant Accounting Policies 212
Note 3. Segment Information 223
Note 4. Divested Businesses, Held for Sale Classification and Discontinued Operations 228
Note 5. Business Combinations 232
Note 6. Fair Value Measurements 233
Note 7. Investments 252
Note 8. Lending Activities 265
Note 9. Reinsurance 267
Note 10. Deferred Policy Acquisition Costs 270
Note 11. Variable Interest Entities 273
Note 12. Derivatives and Hedge Accounting 277
Note 13. Liability for Unpaid Claims and Claims Adjustment Expense and Future Policy Benefits for Life and
Accident and Health Insurance Contracts and Policyholder Contract Deposits 283
Note 14. Variable Life and Annuity Contracts 286
Note 15. Debt Outstanding 288
Note 16. Contingencies, Commitments and Guarantees 292
Note 17. Total Equity 304
Note 18. Noncontrolling Interests 310
Note 19. Earnings (Loss) Per Share 312
Note 20. Statutory Financial Data and Restrictions 314
Note 21. Share-based Compensation and Other Plans 315
Note 22. Employee Benefits 320
Note 23. Ownership 329
Note 24. Income Taxes 330
Note 25. Recapitalization 335
Note 26. Quarterly Financial Information (Unaudited) 336
Note 27. Information Provided in Connection With Outstanding Debt 337
..................................................................................................................................................................................................................................
AIG 2012 Form 10-K 201
..................................................................................................................................................................................................................................
..............................................................................................................................................................................................
..............................................................................................................................................................................................
..............................................................................................................................................................................................
..............................................................................................................................................................................................
ITEM 8 / FINANCIAL STATEMENTS AND SUPPLEMENTARY DATA
Page
FINANCIAL STATEMENTS
NOTES TO CONSOLIDATED FINANCIAL STATEMENTS
I T E M 8 / I N D E X T O F I N A N C I A L S T A T E M E N T S A N D S C H E D U L E S

.....................................................................................................................................................................................
Schedule I Summary of Investments – Other than Investments in Related Parties at December 31, 2012 357
Schedule II Condensed Financial Information of Registrant at December 31, 2012 and 2011 and for the
years ended December 31, 2012, 2011 and 2010 358
Schedule III Supplementary Insurance Information at December 31, 2012, 2011 and 2010 and for the years
then ended 364
Schedule IV Reinsurance at December 31, 2012, 2011 and 2010 and for the years then ended 365
Schedule V Valuation and Qualifying Accounts at December 31, 2012, 2011 and 2010 and for the years
then ended 366
..................................................................................................................................................................................................................................
AIG 2012 Form 10-K202
..............................................................................................................................................................................................SCHEDULES:
I T E M 8 / I N D E X T O F I N A N C I A L S T A T E M E N T S A N D S C H E D U L E S

.....................................................................................................................................................................................
REPORT OF INDEPENDENT REGISTERED PUBLIC ACCOUNTING FIRM
To the Board of Directors and Shareholders of American International Group, Inc.:
In our opinion, the consolidated financial statements listed in the accompanying index present fairly, in all material
respects, the financial position of American International Group, Inc. and its subsidiaries (AIG) at December 31, 2012
and 2011, and the results of their operations and their cash flows for each of the three years in the period ended
December 31, 2012 in conformity with accounting principles generally accepted in the United States of America. In
addition, in our opinion, the financial statement schedules listed in the accompanying index present fairly, in all
material respects, the information set forth therein when read in conjunction with the related consolidated financial
statements. Also in our opinion, AIG maintained, in all material respects, effective internal control over financial
reporting as of December 31, 2012, based on criteria established in Internal Control – Integrated Framework issued
by the Committee of Sponsoring Organizations of the Treadway Commission (COSO). AIG’s management is
responsible for these financial statements and financial statement schedules, for maintaining effective internal control
over financial reporting and for its assessment of the effectiveness of internal control over financial reporting,
included in Management’s Report on Internal Control Over Financial Reporting appearing under Item 9A in the 2012
Form 10-K. Our responsibility is to express opinions on these financial statements, on the financial statement
schedules, and on AIG’s internal control over financial reporting based on our integrated audits. We conducted our
audits in accordance with the standards of the Public Company Accounting Oversight Board (United States). Those
standards require that we plan and perform the audits to obtain reasonable assurance about whether the financial
statements are free of material misstatement and whether effective internal control over financial reporting was
maintained in all material respects. Our audits of the financial statements included examining, on a test basis,
evidence supporting the amounts and disclosures in the financial statements, assessing the accounting principles
used and significant estimates made by management, and evaluating the overall financial statement presentation.
Our audit of internal control over financial reporting included obtaining an understanding of internal control over
financial reporting, assessing the risk that a material weakness exists, and testing and evaluating the design and
operating effectiveness of internal control based on the assessed risk. Our audits also included performing such
other procedures as we considered necessary in the circumstances. We believe that our audits provide a reasonable
basis for our opinions.
As discussed in Note 2 to the consolidated financial statements, as of January 1, 2012, AIG retrospectively adopted
a new accounting standard that amends the accounting for costs incurred by insurance companies that can be
capitalized in connection with acquiring or renewing insurance contracts.
A company’s internal control over financial reporting is a process designed to provide reasonable assurance
regarding the reliability of financial reporting and the preparation of financial statements for external purposes in
accordance with generally accepted accounting principles. A company’s internal control over financial reporting
includes those policies and procedures that (i) pertain to the maintenance of records that, in reasonable detail,
accurately and fairly reflect the transactions and dispositions of the assets of the company; (ii) provide reasonable
assurance that transactions are recorded as necessary to permit preparation of financial statements in accordance
with generally accepted accounting principles, and that receipts and expenditures of the company are being made
only in accordance with authorizations of management and directors of the company; and (iii) provide reasonable
assurance regarding prevention or timely detection of unauthorized acquisition, use, or disposition of the company’s
assets that could have a material effect on the financial statements.
Because of its inherent limitations, internal control over financial reporting may not prevent or detect misstatements.
Also, projections of any evaluation of effectiveness to future periods are subject to the risk that controls may become
inadequate because of changes in conditions, or that the degree of compliance with the policies or procedures may
deteriorate.
/s/ PricewaterhouseCoopers LLP
New York, New York
February 21, 2013
..................................................................................................................................................................................................................................
AIG 2012 Form 10-K 203
I T E M 8 / R E P O R T O F I N D E P E N D E N T R E G I S T E R E D P U B L I C A C C O U N T I N G F I R M

AMERICAN INTERNATIONAL GROUP, INC.
CONSOLIDATED BALANCE SHEET
Assets:Investments:
Fixed maturity securities:Bonds available for sale, at fair value (amortized cost: 2012 – $246,149; 2011 – $250,770) $ 269,959 $ 263,981Bond trading securities, at fair value 24,584 24,364
Equity securities:Common and preferred stock available for sale, at fair value (cost: 2012 – $1,640; 2011 – $1,820) 3,212 3,624Common and preferred stock trading, at fair value 662 125
Mortgage and other loans receivable, net of allowance (portion measured at fair value: 2012 – $134;2011 – $107) 19,482 19,489
Flight equipment primarily under operating leases, net of accumulated depreciation – 35,539Other invested assets (portion measured at fair value: 2012 – $7,056; 2011 – $20,876) 29,117 40,744Short-term investments (portion measured at fair value: 2012 – $8,056; 2011 – $5,913) 28,808 22,572
Total investments 375,824 410,438Cash 1,151 1,474Accrued investment income 3,054 3,108Premiums and other receivables, net of allowance 13,989 14,721Reinsurance assets, net of allowance 25,595 27,211Deferred income taxes 17,466 19,615Deferred policy acquisition costs 8,182 8,937Derivative assets, at fair value 3,671 4,499Other assets, including restricted cash of $1,878 in 2012 and $2,988 in 2011 (portion measured at fair
value: 2012 – $696; 2011 – $0) 10,399 11,663Separate account assets, at fair value 57,337 51,388Assets held for sale 31,965 –
Total assets $ 548,633 $ 553,054
Liabilities:Liability for unpaid claims and claims adjustment expense $ 87,991 $ 91,145Unearned premiums 22,537 23,465Future policy benefits for life and accident and health insurance contracts 36,340 34,317Policyholder contract deposits (portion measured at fair value: 2012 – $1,257; 2011 – $918) 127,117 126,898Other policyholder funds 6,267 6,691Derivative liabilities, at fair value 4,061 4,733Other liabilities (portion measured at fair value: 2012 – $1,080; 2011 – $907) 32,114 28,248Long-term debt (portion measured at fair value: 2012 – $8,055; 2011 – $10,766) 48,500 75,253Separate account liabilities 57,337 51,388Liabilities held for sale 27,366 –
Total liabilities 449,630 442,138
Contingencies, commitments and guarantees (see Note 16)Redeemable noncontrolling interests (see Note 18):
Nonvoting, callable, junior preferred interests held by Department of the Treasury – 8,427Other 334 96
Total redeemable noncontrolling interests 334 8,523
AIG shareholders’ equity:Common stock, $2.50 par value; 5,000,000,000 shares authorized; shares issued:
2012 – 1,906,611,680 and 2011 – 1,906,568,099 4,766 4,766Treasury stock, at cost; 2012 – 430,289,745; 2011 – 9,746,617 shares of common stock (13,924) (942)Additional paid-in capital 80,410 80,459Retained earnings 14,176 10,774Accumulated other comprehensive income 12,574 6,481
Total AIG shareholders’ equity 98,002 101,538Non-redeemable noncontrolling interests (including $100 associated with businesses held for sale) 667 855
Total equity 98,669 102,393
Total liabilities and equity $ 548,633 $ 553,054
See accompanying Notes to Consolidated Financial Statements, which include a summary of revisions to prior year balances in connection with a
change in accounting principle.
..................................................................................................................................................................................................................................
AIG 2012 Form 10-K204
December 31, December 31,
(in millions, except for share data) 2012 2011

AMERICAN INTERNATIONAL GROUP, INC.
CONSOLIDATED STATEMENT OF OPERATIONS
Revenues:Premiums $ 38,990 $ 45,319Policy fees 2,705 2,710Net investment income 14,755 20,934Net realized capital gains (losses):
Total other-than-temporary impairments on available for sale securities (1,216) (1,712)Portion of other-than-temporary impairments on available for sale fixed maturity securities
recognized in Other comprehensive income (loss) 168 (812)
Net other-than-temporary impairments on available for sale securities recognized in net income (1,048) (2,524)Other realized capital gains 1,749 1,808
Total net realized capital gains (losses) 701 (716)Other income 2,661 4,582
Total revenues 59,812 72,829
Benefits, claims and expenses:Policyholder benefits and claims incurred 33,450 41,392Interest credited to policyholder account balances 4,467 4,487Amortization of deferred acquisition costs 5,486 5,821Other acquisition and insurance expenses 8,458 10,163Interest expense 2,444 6,742Net loss on extinguishment of debt 2,847 104Net (gain) loss on sale of properties and divested businesses 74 (19,566)Other expenses 2,470 3,439
Total benefits, claims and expenses 59,696 52,582
Income from continuing operations before income taxes 116 20,247Income tax expense (benefit):
Current 18 580Deferred (19,442) 6,413
Income taxes expense (benefit) (19,424) 6,993
Income from continuing operations 19,540 13,254Income (loss) from discontinued operations, net of income taxes 1,790 (969)
Net income 21,330 12,285
Less:Net income from continuing operations attributable to noncontrolling interests:
Nonvoting, callable, junior and senior preferred interests 634 1,818Other 54 354
Total net income from continuing operations attributable to noncontrolling interests 688 2,172Net income from discontinued operations attributable to noncontrolling interests 20 55
Total net income attributable to noncontrolling interests 708 2,227
Net income attributable to AIG $ 20,622 $ 10,058
Net income attributable to AIG common shareholders $ 19,810 $ 2,046
Income per common share attributable to AIG common shareholders:Basic and diluted:
Income from continuing operations $ 10.03 $ 16.50Income (loss) from discontinued operations $ 0.98 $ (1.52)
Weighted average shares outstanding:Basic 1,799,385,757 136,585,844Diluted 1,799,458,497 136,649,280
See accompanying Notes to Consolidated Financial Statements, which include a summary of revisions to prior year balances in connection with a
change in accounting principle.
..................................................................................................................................................................................................................................
AIG 2012 Form 10-K 205
$ 38,0112,791
20,343
(448)
(381)
(829)1,758
9293,582
65,656
31,9774,3625,7099,2352,319
92
2,721
56,334
9,322
795775
1,570
7,752(4,052)
3,700
20854
262–
262
$ 3,438
$ 3,438
$ 4.44$ (2.40)
1,687,197,0381,687,226,641
Years Ended December 31,
(dollars in millions, except per share data) 2012 2011 2010

AMERICAN INTERNATIONAL GROUP, INC.
CONSOLIDATED STATEMENT OF COMPREHENSIVE INCOME (LOSS)
Net income $ 21,330 $ 12,285
Other comprehensive income (loss), net of tax
Change in unrealized appreciation (depreciation) of fixed maturity investments
on which other-than-temporary credit impairments were taken (74) 1,229
Change in unrealized appreciation (depreciation) of all other investments (1,485) 2,293
Change in foreign currency translation adjustments (992) (928)
Change in net derivative gains arising from cash flow hedging activities 17 94
Change in retirement plan liabilities adjustment (70) 275
Other comprehensive income (loss) (2,604) 2,963
Comprehensive income 18,726 15,248
Comprehensive income attributable to noncontrolling nonvoting, callable, junior
and senior preferred interests 634 1,818
Comprehensive income (loss) attributable to other noncontrolling interests (47) 590
Total comprehensive income attributable to noncontrolling interests 587 2,408
Comprehensive income attributable to AIG $ 18,139 $ 12,840
See accompanying Notes to Consolidated Financial Statements, which include a summary of revisions to prior year balances in connection with a
change in accounting principle.
..................................................................................................................................................................................................................................
AIG 2012 Form 10-K206
$ 3,700
1,286
4,880
–
17
(87)
6,096
9,796
208
57
265
$ 9,531
Years Ended December 31,
(in millions) 2012 2011 2010

AMERICAN INTERNATIONAL GROUP, INC.
CONSOLIDATED STATEMENT OF EQUITY
Balance, January 1, 2010 $ 69,784 $ 354 $ (874) $ 5,030 $ (11,491) $ 7,021 $ 69,824 $ 28,252 $ 98,076
Cumulative effect of change in accountingprinciple, net of tax – – – – (8,415) (932) (9,347) – (9,347)
Series F drawdown 2,199 – – – – – 2,199 – 2,199Common stock issued – 2 – (20) – – (18) – (18)Equity unit exchange – 12 – 3,645 – – 3,657 – 3,657Net income attributable to AIG or other
noncontrolling interests(a) – – – – 10,058 – 10,058 336 10,394Net income attributable to noncontrolling
nonvoting, callable, junior and seniorpreferred interests – – – – – – – 1,818 1,818
Other comprehensive income(b) – – – – – 2,782 2,782 176 2,958Deferred income taxes – – – (332) – – (332) – (332)Net decrease due to deconsolidation – – – – – – – (2,740) (2,740)Contributions from noncontrolling interests – – – – – – – 253 253Distributions to noncontrolling interests – – – – – – – (175) (175)Other – – 1 32 – – 33 – 33
Balance, December 31, 2010 $ 71,983 $ 368 $ (873) $ 8,355 $ (9,848) $ 8,871 $ 78,856 $ 27,920 $ 106,776
Series F drawdown 20,292 – – – – – 20,292 – 20,292Repurchase of SPV preferred interests in
connection with Recapitalization(c) – – – – – – – (26,432) (26,432)Exchange of consideration for preferred
stock in connection with Recapitalization(c) (92,275) 4,138 – 67,460 – – (20,677) – (20,677)Common stock issued – 250 – 2,636 – – 2,886 – 2,886Purchase of common stock – – (70) – – – (70) – (70)Settlement of equity unit stock purchase
contract – 9 – 2,160 – – 2,169 – 2,169Net income attributable to AIG or other
noncontrolling interests(a) – – – – 20,622 – 20,622 82 20,704Net income attributable to noncontrolling
nonvoting, callable, junior and seniorpreferred interests – – – – – – – 74 74
Other comprehensive loss(b) – – – – – (2,483) (2,483) (119) (2,602)Deferred income taxes – – – 2 – – 2 – 2Acquisition of noncontrolling interest – – – (164) – 93 (71) (489) (560)Net decrease due to deconsolidation – – – – – – – (123) (123)Contributions from noncontrolling interests – – – – – – – 120 120Distributions to noncontrolling interests – – – – – – – (128) (128)Other – 1 1 10 – – 12 (50) (38)
Balance, December 31, 2011 $ – $ 4,766 $ (942) $ 80,459 $ 10,774 $ 6,481 $ 101,538 $ 855 $ 102,393
Common stock issued under stock plansPurchase of common stockNet income attributable to AIG or other
noncontrolling interests(a)
Other comprehensive income (loss)(b)
Deferred income taxesNet decrease due to deconsolidationContributions from noncontrolling interestsDistributions to noncontrolling interestsOther
Balance, December 31, 2012
(a) Excludes gains of $222 million, $552 million and $73 million in 2012, 2011 and 2010, respectively, attributable to redeemable noncontrolling interests and netincome attributable to noncontrolling nonvoting, callable, junior and senior preferred interests held by the Federal Reserve Bank of New York of $0, $74 million and$1.8 billion in 2012, 2011 and 2010, respectively.
(b) Excludes $4 million, $(2) million and $5 million attributable to redeemable noncontrolling interests for the year ended December 31, 2012, 2011 and 2010,respectively.
(c) See Notes 18 and 25 to Consolidated Financial Statements.
See Accompanying Notes to Consolidated Financial Statements, which include a summary of revisions to prior year balances in connection with a
change in accounting principle.
..................................................................................................................................................................................................................................
AIG 2012 Form 10-K 207
NonRetained Accumulated Total AIG redeemable
Additional Earnings Other Share- non-Preferred Common Treasury Paid-in (Accumulated Comprehensive holders’ controlling Total
(in millions) Stock Stock Stock Capital Deficit) Income Equity Interests Equity
– – 18 (15) – – 3 – 3– – (13,000) – – – (13,000) – (13,000)
– – – – 3,438 – 3,438 40 3,478– – – – – 6,093 6,093 (1) 6,092– – – (9) – – (9) – (9)– – – – – – – (27) (27)– – – – – – – 80 80– – – – – – – (167) (167)– – – (25) (36) – (61) (113) (174)
$ – $ 4,766 $ (13,924) $ 80,410 $ 14,176 $ 12,574 $ 98,002 $ 667 $ 98,669

AMERICAN INTERNATIONAL GROUP, INC.
CONSOLIDATED STATEMENT OF CASH FLOWS
Cash flows from operating activities:Net income $ 21,330 $ 12,285(Income) loss from discontinued operations (1,790) 969
Adjustments to reconcile net income to net cash provided by (used in) operating activities:Noncash revenues, expenses, gains and losses included in income:
Net gains on sales of securities available for sale and other assets (1,772) (2,903)Net (gains) losses on sales of divested businesses 74 (19,566)Net losses on extinguishment of debt 2,847 104Unrealized gains in earnings – net (957) (1,529)Equity in income from equity method investments, net of dividends or distributions (637) (1,268)Depreciation and other amortization 5,424 5,977Amortization of costs and accrued interest and fees related to FRBNY Credit Facility 48 4,223Impairments of assets 1,798 3,759
Changes in operating assets and liabilities:General and life insurance reserves (202) 8,705Premiums and other receivables and payables – net 1,771 482Reinsurance assets and funds held under reinsurance treaties (1,103) (3,510)Capitalization of deferred policy acquisition costs (5,429) (5,933)Current and deferred income taxes – net (20,061) 6,052Payment of FRBNY Credit Facility accrued compounded interest and fees (6,363) –Other, net (1,234) (1,686)
Total adjustments (25,796) (7,093)
Net cash provided by (used in) operating activities – continuing operations (6,256) 6,161Net cash provided by operating activities – discontinued operations 6,175 10,436
Net cash provided by (used in) operating activities (81) 16,597
Cash flows from investing activities:Proceeds from (payments for)
Sales or distribution of:Available for sale investments 43,961 56,211Trading securities 9,867 6,363Other invested assets 7,655 8,424Divested businesses, net 587 21,760
Maturities of fixed maturity securities available for sale 20,062 14,609Principal payments received on and sales of mortgage and other loans receivable 3,154 5,259Purchases of:
Available for sale investments (90,627) (78,886)Trading securities (1,253) (3,380)Other invested assets (6,023) (7,579)Mortgage and other loans receivable issued and purchased (2,587) (2,990)
Net change in restricted cash 27,202 (27,026)Net change in short-term investments 18,799 (2,446)Other, net 180 (167)
Net cash provided by investing activities – continuing operations 30,977 (9,848)Net cash provided by (used in) investing activities – discontinued operations 5,471 (64)
Net cash provided by investing activities 36,448 (9,912)
Cash flows from financing activities:Proceeds from (payments for)
Policyholder contract deposits 17,903 19,570Policyholder contract withdrawals (13,570) (14,897)FRBNY credit facility repayments (14,622) (23,178)FRBNY credit facility borrowings – 19,900Issuance of long-term debt 3,190 3,342Repayments of long-term debt (9,486) (7,986)Proceeds from drawdown on the Department of the Treasury Commitment 20,292 2,199Repayment of Department of the Treasury SPV Preferred Interests (12,425) –Repayment of FRBNY SPV Preferred Interests (26,432) –Issuance of Common Stock 5,055 –Purchase of Common Stock (70) –Acquisition of noncontrolling interest (688) –Other, net (277) (5,967)
Net cash used in financing activities – continuing operations (31,130) (7,017)Net cash used in financing activities – discontinued operations (5,796) (2,244)
Net cash used in financing activities (36,926) (9,261)
Effect of exchange rate changes on cash 29 39
Net decrease in cash (530) (2,537)Cash at beginning of period 1,558 4,400Reclassification to assets held for sale 446 (305)
Cash at end of period $ 1,474 $ 1,558
See accompanying Notes to Consolidated Financial Statements, which include a summary of revisions to prior-year balances in connection with a change inaccounting principle. In addition, changes were made to the presentation of the Consolidated Statement of Cash Flows to align presentation of changes in fairvalue of derivatives with changes in the administration of our derivatives portfolio.
..................................................................................................................................................................................................................................
AIG 2012 Form 10-K208
Years Ended December 31,
$ 3,7004,052
(3,219)29
(6,107)(911)
5,307–
1,524
(2,260)1,7361,407
(5,613)1,122
–(1)
(7,004)
7482,928
3,676
39,81817,81418,552
–21,449
3,266
(53,536)(13,373)(4,463)(3,256)
695(8,158)
(526)
18,282(1,670)
16,612
13,288(13,978)
––
4,844(7,276)
–(8,636)
––
(13,000)(167)
4,493
(20,432)(132)
(20,564)
16
(260)1,474
(63)
$ 1,151
(in millions) 2012 2011 2010

Cash paid during the period for:
Interest* $ 8,985 $ 5,166
Taxes $ 716 $ 1,002
Non-cash financing/investing activities:
Interest credited to policyholder contract deposits included in financing activities $ 4,750 $ 9,294
Exchange of equity units and extinguishment of junior subordinated debentures $ – $ 3,657
Exchange of junior subordinated debentures for senior notes $ (2,392) $ –
Senior notes exchanged for junior subordinated debentures $ 1,843 $ –
Non-cash consideration received from sale of ALICO $ – $ 9,041
Debt assumed on consolidation of variable interest entities $ – $ 2,591
Debt assumed on acquisition $ 299 $ 164
* 2011 includes payment of FRBNY credit facility accrued compounded interest of $4.7 billion, before the facility was terminated on January 14,
2011 in connection with the Recapitalization.
..................................................................................................................................................................................................................................
AIG 2012 Form 10-K 209
$ 4,037
$ 447
$ 4,501
$ –
$ –
$ –
$ –
$ –
$ –
Supplementary Disclosure of Consolidated Cash Flow Information
Years Ended December 31,
(in millions) 2012 2011 2010

.....................................................................................................................................................................................
1. BASIS OF PRESENTATION..............................................................................................................................................................................................
American International Group, Inc. is a leading international insurance organization serving customers in more than
130 countries. AIG companies serve commercial, institutional and individual customers through one of the most
extensive worldwide property-casualty networks of any insurer. In addition, AIG companies are leading providers of
life insurance and retirement services in the United States. AIG Common Stock, par value $2.50 per share (AIG
Common Stock), is listed on the New York Stock Exchange and the Tokyo Stock Exchange. Unless the context
indicates otherwise, the terms ‘‘AIG,’’ ‘‘we,’’ ‘‘us’’ or ‘‘our’’ mean American International Group, Inc. and its
consolidated subsidiaries and the term ‘‘AIG Parent’’ means American International Group, Inc. and not to any of its
consolidated subsidiaries.
The consolidated financial statements include the accounts of AIG, our controlled subsidiaries (generally through a
greater than 50 percent ownership of voting rights of a voting interest entity), and variable interest entities (VIEs) in
which we are the primary beneficiary. Equity investments in corporate entities that we do not consolidate, but in
which we hold 20 percent to 50 percent of the voting rights and investments in partnership and partnership-like
entities for which we have more than minor influence over operating and financial policies, are accounted for under
the equity method unless we have elected the fair value option.
Certain of our foreign subsidiaries included in the consolidated financial statements report on different annual fiscal
period bases, in most cases ending November 30. The effect on our consolidated financial condition and results of
operations of all material events occurring at these subsidiaries between such fiscal year end and December 31 for
all periods presented has been recorded.
The accompanying consolidated financial statements have been prepared in accordance with accounting principles
generally accepted in the United States (GAAP). All material intercompany accounts and transactions have been
eliminated.
Use of Estimates..............................................................................................................................................................................................
The preparation of financial statements in accordance with GAAP requires the application of accounting policies that
often involve a significant degree of judgment. We consider the accounting policies that are most dependent on the
application of estimates and assumptions to be those relating to items considered by management in the
determination of:
• classification of International Lease Finance Corporation (ILFC) as held for sale;
• insurance liabilities, including property and casualty and mortgage guaranty unpaid claims and claims adjustment
expenses and future policy benefits for life and accident and health contracts;
• income tax assets and liabilities, including recoverability of our net deferred tax asset and the predictability of
future tax operating profitability of the character necessary to realize the net deferred tax asset;
• recoverability of assets including reinsurance assets;
• estimated gross profits for investment-oriented products;
• impairment charges, including other-than-temporary impairments of financial instruments and goodwill impairments;
• liabilities for legal contingencies; and
• fair value measurements of certain financial assets and liabilities.
These accounting estimates require the use of assumptions about matters, some of which are highly uncertain at the
time of estimation. To the extent actual experience differs from the assumptions used, our consolidated financial
condition, results of operations and cash flows could be materially affected.
Prior Period Reclassifications and Segment Changes..............................................................................................................................................................................................
Prior period amounts were reclassified to conform to the current period presentation. Significant items include:
• Segment changes discussed in Note 3 herein.
..................................................................................................................................................................................................................................
AIG 2012 Form 10-K210
I T E M 8 / N O T E 1 . B A S I S O F P R E S E N T A T I O N

.....................................................................................................................................................................................
• Revisions attributable to discontinued operations presented in Note 4 herein.
• Reclassified approximately $1.3 billion of income taxes from Accumulated other comprehensive income to
Additional paid in capital as of January 1, 2010 to correct the presentation of components of Shareholders’ Equity.
These income taxes related to the creation in 2009 of special purpose vehicles that held our interests in AIA
Group Ltd. (AIA) and American Life Insurance Company (ALICO). There was no effect on Total AIG shareholders’
equity or on Total equity as a result of this reclassification.
• Changes were made to the presentation within the Consolidated Statement of Operations to align the presentation
of changes in the fair value of derivatives with changes in the administration of AIG’s derivatives portfolio.
Specifically, amounts attributable to derivative activity where AIG Financial Products Corp. and AIG Trading
Group Inc. and their respective subsidiaries (collectively, AIGFP) executed transactions with third parties on behalf
of AIG subsidiaries have been reclassified from Other income to Net realized capital gains (losses).
..................................................................................................................................................................................................................................
AIG 2012 Form 10-K 211
I T E M 8 / N O T E 1 . B A S I S O F P R E S E N T A T I O N

.....................................................................................................................................................................................
2. SUMMARY OF SIGNIFICANT ACCOUNTING POLICIES..............................................................................................................................................................................................
Premiums for short duration contracts are recorded as written on the inception date of the policy.
Premiums are earned primarily on a pro rata basis over the term of the related coverage. Sales of extended services
contracts are reflected as premiums and earned on a pro rata basis over the term of the related coverage. The
reserve for unearned premiums includes the portion of premiums written relating to the unexpired terms of coverage.
Reinsurance premiums under a reinsurance contract are typically earned over the same period as the underlying
policies, or risks, covered by the contracts. As a result, the earning pattern of a reinsurance contract may extend up
to 24 months, reflecting the inception dates of the underlying policies throughout a year.
Reinsurance premiums ceded are recognized as a reduction in revenues over the period the reinsurance coverage is
provided in proportion to the risks to which the premiums relate.
Premiums for long duration insurance products and life contingent annuities are recognized as revenues when due.
Estimates for premiums due but not yet collected are accrued.
Policy fees represent fees recognized from universal life and investment-type products consisting of
policy charges for the cost of insurance, policy administration charges, amortization of unearned revenue reserves
and surrender charges.
For a discussion of our policies on net investment income, see Note 7 herein.
For a discussion of our policies on net realized capital gains (losses), see
Note 7 herein.
Other income includes unrealized gains and losses on derivatives, including unrealized market
valuation gains and losses associated with the Global Capital Markets (GCM) super senior credit default swap (CDS)
portfolio, as well as income from the Direct Investment book (DIB).
Other income from the operations of the DIB and our Other Operations category consists of the following:
• Change in fair value relating to financial assets and liabilities for which the fair value option has been elected.
• Interest income and related expenses, including amortization of premiums and accretion of discounts on bonds
with changes in the timing and the amount of expected principal and interest cash flows reflected in the yield, as
applicable.
• Dividend income from common and preferred stock and distributions from other investments.
• Changes in the fair value of trading securities and spot commodities sold but not yet purchased, futures, hybrid
financial instruments, securities purchased under agreements to resell, and securities sold under agreements to
repurchase for which the fair value option was elected.
• Realized capital gains and losses from the sales of available for sale securities and investments in private equity
funds and hedge funds and other investments.
• Income earned on real estate based investments and related losses from property level impairments and financing
costs.
• Exchange gains and losses resulting from foreign currency transactions.
• Reductions to the cost basis of securities available for sale for other-than-temporary impairments.
• Earnings from private equity funds and hedge fund investments accounted for under the equity method.
• Gains and losses recognized in earnings on derivatives for the effective portion and their related hedged items.
Incurred claims and claims adjustment expense for short duration
insurance contracts consist of the estimated ultimate cost of settling claims incurred within the reporting period,
including incurred but not reported claims, plus changes in estimates of current and prior period losses resulting from
the continuous review process, which are charged to income as incurred. Benefits for long duration insurance
..................................................................................................................................................................................................................................
AIG 2012 Form 10-K212
(a) Revenues and expenses:
Premiums:
Policy fees:
Net investment income:
Net realized capital gains (losses):
Other income:
Policyholder benefits and claims incurred:
I T E M 8 / N O T E 2 . S U M M A R Y O F S I G N I F I C A N T A C C O U N T I N G P O L I C I E S

.....................................................................................................................................................................................
contracts consist of benefits paid and changes in future policy benefits liabilities. Benefits for universal life and
investment-type products primarily consist of benefit payments made in excess of policy account balances except for
certain contracts for which the fair value option was elected, for which benefits represent the entire change in fair
value (including derivative gains and losses on related economic hedges).
Represents interest on account-value-based policyholder
deposits consisting of amounts credited on non-equity-indexed account values, accretion to the host contract for
equity indexed products, and net amortization of sales inducements.
For a discussion of our accounting policies on amortization of
deferred policy acquisition costs, see Note 10 herein.
For a discussion of our accounting policies on reporting a
business as held for sale or as discontinued operations, see Note 4 herein.
For a discussion of our accounting policies on classification,
measurement and other-than-temporary impairment of fixed maturity and equity securities, see Note 7 herein.
For discussion of our policies on classification, measurement and
the allowance for credit losses on mortgages and other loans receivable, see Note 8 herein.
For a discussion of our accounting policies on classification, measurement and
other-than-temporary impairment of other invested assets, see Note 7 herein.
Short-term investments consist of interest-bearing cash equivalents, time deposits,
securities purchased under agreements to resell, and investments, such as commercial paper, with original maturities
within one year from the date of purchase.
For a discussion of our accounting policies on securities purchased under agreements to resell, see Note 7 herein.
Cash represents cash on hand and non-interest bearing demand deposits.
Premiums and other receivables includes premium balances
receivable, amounts due from agents and brokers and insureds, trade receivables for the DIB and GCM and other
receivables. Trade receivables for GCM include cash collateral posted to derivative counterparties that are not
eligible to be netted against derivative liabilities. The allowance for doubtful accounts on premiums and other
receivables was $619 million and $484 million at December 31, 2012 and 2011, respectively.
For a discussion about our accounting policies on reinsurance assets – net, see
Note 9 herein.
For discussion of our accounting policies on deferred policy
acquisition costs, see Note 10 herein.
For discussion of our accounting policies on
derivative assets and derivative liabilities, at fair value, see Note 12 herein.
Other assets consists of sales inducement assets, prepaid expenses, deposits, other deferred
charges, real estate, other fixed assets, capitalized software costs, goodwill, intangible assets other than goodwill,
and restricted cash.
We offer sales inducements, which include enhanced crediting rates or bonus payments to contract holders (bonus
interest) on certain annuity and investment contract products. Sales inducements provided to the contractholder are
recognized as part of the liability for policyholders’ contract deposits in the Consolidated Balance Sheet. Such
amounts are deferred and amortized over the life of the contract using the same methodology and assumptions used
to amortize DAC (see Note 10 herein). To qualify for such accounting treatment, the bonus interest must be explicitly
identified in the contract at inception. We must also demonstrate that such amounts are incremental to amounts we
credit on similar contracts without bonus interest, and are higher than the contract’s expected ongoing crediting rates
for periods after the bonus period. The deferred bonus interest and other deferred sales inducement assets totaled
$517 million and $803 million at December 31, 2012 and 2011, respectively. The amortization expense associated
..................................................................................................................................................................................................................................
AIG 2012 Form 10-K 213
Interest credited to policyholder account balances:
Amortization of deferred acquisition costs:
(b) Held-for-sale and discontinued operations:
(c) Investments:
Fixed maturity and equity securities:
Mortgage and other loans receivable – net:
Other invested assets:
Short-term investments:
(d) Cash:
(e) Premiums and other receivables – net:
(f) Reinsurance assets – net:
(g) Deferred policy acquisition costs (DAC):
(h) Derivative assets and derivative liabilities, at fair value:
(i) Other assets:
I T E M 8 / N O T E 2 . S U M M A R Y O F S I G N I F I C A N T A C C O U N T I N G P O L I C I E S

.....................................................................................................................................................................................
with these assets is reported within Interest Credited to Policyholder Account Balances in the Consolidated Statement
of Operations. Such amortization expense totaled $162 million, $239 million and $146 million for the years ended
December 31, 2012, 2011 and 2010, respectively.
The cost of buildings and furniture and equipment is depreciated principally on a straight-line basis over their
estimated useful lives (maximum of 40 years for buildings and 10 years for furniture and equipment). Expenditures
for maintenance and repairs are charged to income as incurred; expenditures for improvements are capitalized and
depreciated. We periodically assess the carrying value of our real estate for purposes of determining any asset
impairment. Capitalized software costs, which represent costs directly related to obtaining, developing or upgrading
internal use software, are capitalized and amortized using the straight-line method over a period generally not
exceeding five years. Real estate, fixed assets and other long-lived assets are assessed for impairment when
impairment indicators exist.
Goodwill represents the future economic benefits arising from assets acquired in a business
combination that are not individually identified and separately recognized. Goodwill is tested for impairment annually,
or more frequently if circumstances indicate an impairment may have occurred. All of our goodwill was associated
with and allocated to the AIG Property Casualty Commercial and Consumer segments at December 31, 2012.
The impairment assessment involves first assessing qualitative factors to determine whether events or circumstances
exist that lead to a determination that it is more likely than not that the fair value of a reporting unit is less than its
carrying amount. If, after assessing the totality of the events or circumstances, we determine it is more likely than not
that the fair value of a reporting unit is less than its carrying amount, the impairment assessment involves a two-step
process in which a quantitative assessment for potential impairment is performed. If potential impairment is present,
the amount of impairment is measured (if any) and recorded. Impairment is tested at the reporting unit level.
If we determine it is more likely than not that the fair value of a reporting unit is less than its carrying amount, we
estimate the fair value of each reporting unit and compare the estimated fair value with the carrying amount of the
reporting unit, including allocated goodwill. The estimate of a reporting unit’s fair value may be based on one or a
combination of approaches including market-based earnings multiples of the unit’s peer companies, discounted
expected future cash flows, external appraisals or, in the case of reporting units being considered for sale, third-party
indications of fair value, if available. We consider one or more of these estimates when determining the fair value of
a reporting unit to be used in the impairment test.
If the estimated fair value of a reporting unit exceeds its carrying value, goodwill is not impaired. If the carrying value
of a reporting unit exceeds its estimated fair value, goodwill associated with that reporting unit potentially is impaired.
The amount of impairment, if any, is measured as the excess of the carrying value of the goodwill over the implied
fair value of the goodwill. The implied fair value of the goodwill is measured as the excess of the fair value of the
reporting unit over the amounts that would be assigned to the reporting unit’s assets and liabilities in a hypothetical
business combination. An impairment charge is recognized in earnings to the extent of the excess. AIG Property
Casualty manages its assets on an aggregate basis and does not allocate its assets, other than goodwill, between its
operating segments. Therefore, the carrying value of the reporting units was determined by allocating the carrying
value of AIG Property Casualty to those units based upon an internal capital allocation model.
In connection with the announcement of the ILFC sale, discussed in Note 4, and management’s determination that
the reporting unit met the held-for-sale criteria, management tested the remaining goodwill of the reporting unit for
impairment. Based on the results of the goodwill impairment test, we determined that all of the goodwill allocated to
the reporting unit should be impaired and, accordingly, recognized a goodwill impairment charge in the fourth quarter
of 2012.
At December 31, 2012, we performed our annual goodwill impairment test. Based on the results of the goodwill
impairment test, we concluded that the remaining goodwill was not impaired.
..................................................................................................................................................................................................................................
AIG 2012 Form 10-K214
(j) Goodwill:
I T E M 8 / N O T E 2 . S U M M A R Y O F S I G N I F I C A N T A C C O U N T I N G P O L I C I E S

.....................................................................................................................................................................................
The following table presents the changes in goodwill by reportable segment:
Balance at December 31, 2010:
Goodwill – gross $ 2,529 $ – $ 2,281 $ 4,810
Accumulated impairments (1,196) – (2,281) (3,477)
Net goodwill 1,333 – – 1,333
Increase (decrease) due to:
Acquisition 3 15 8 26
Other(a) 14 – – 14
Balance at December 31, 2011:
Goodwill – gross $ 2,546 $ 15 $ 2,289 $ 4,850
Accumulated impairments (1,196) – (2,281) (3,477)
Net goodwill $ 1,350 $ 15 $ 8 $ 1,373
Increase (decrease) due to:
Acquisition 119 – – 119
Other(a) – – – –
Goodwill impairment included in discontinued operations – (15) (8) (23)
Balance at December 31, 2012:
Goodwill – gross
Accumulated impairments
Net goodwill
(a) Includes foreign exchange translation and purchase price adjustments.
Separate accounts represent funds for which investment income and investment gains
and losses accrue directly to the policyholders who bear the investment risk. Each account has specific investment
objectives and the assets are carried at fair value. The assets of each account are legally segregated and are not
subject to claims that arise from any of our other businesses. The liabilities for these accounts are equal to the
account assets.
For discussion of our accounting policies on
liability for unpaid claims and claims adjustment expense, see Note 13 herein.
For discussion of our accounting policies on future policy benefits and life and accident and health
insurance contracts and policyholder contract deposits, see Note 13 herein. See Note 6 herein for additional fair
value information.
Other policyholder funds are reported at cost and include any policyholder funds on
deposit that encompass premium deposits and similar items.
For a discussion of our accounting policies on income taxes, see Note 24 herein.
Other liabilities consist of other funds on deposit, other payables, securities sold under
agreements to repurchase and securities and spot commodities sold but not yet purchased. We have entered into
certain insurance and reinsurance contracts, primarily in our AIG Property Casualty segment, that do not contain
sufficient insurance risk to be accounted for as insurance or reinsurance. Accordingly, the premiums received on
such contracts, after deduction for certain related expenses, are recorded as deposits within Other liabilities in the
Consolidated Balance Sheet. Net proceeds of these deposits are invested and generate Net investment income. As
amounts are paid, consistent with the underlying contracts, the deposit liability is reduced. Also included in Other
liabilities are trade payables for the DIB and GCM, which include option premiums received and payables to
counterparties that relate to unrealized gains and losses on futures, forwards, and options and balances due to
clearing brokers and exchanges. Trade payables for GCM also include cash collateral received from derivative
counterparties that is not contractually nettable against derivative assets.
..................................................................................................................................................................................................................................
AIG 2012 Form 10-K 215
AIG
Property Aircraft
(in millions) Casualty Leasing Other Total
$ 2,665 $ – $ 2,281 $ 4,946
(1,196) – (2,281) (3,477)
$ 1,469 $ – $ – $ 1,469
(k) Separate accounts:
(l) Liability for unpaid claims and claims adjustment expense:
(m) Future policy benefits for life and accident and health insurance contracts and policyholder contract
deposits:
(n) Other policyholder funds:
(o) Income taxes:
(p) Other liabilities:
I T E M 8 / N O T E 2 . S U M M A R Y O F S I G N I F I C A N T A C C O U N T I N G P O L I C I E S

.....................................................................................................................................................................................
Securities and spot commodities sold but not yet purchased represent sales of securities and spot commodities not
owned at the time of sale. The obligations arising from such transactions are recorded on a trade-date basis and
carried at fair value. Fair values of securities sold but not yet purchased are based on current market prices. Fair
values of spot commodities sold but not yet purchased are based on current market prices of reference spot futures
contracts traded on exchanges.
For further discussion of secured financing arrangements, see Note 7 herein.
For a discussion of our accounting policies on long-term debt, see Note 15 herein.
For a discussion of our accounting policies on contingent liabilities, see Note 16 herein.
Financial statement accounts expressed in foreign currencies are translated into U.S.
dollars. Functional currency assets and liabilities are translated into U.S. dollars generally using rates of exchange
prevailing at the balance sheet date of each respective subsidiary and the related translation adjustments are
recorded as a separate component of Accumulated other comprehensive income (loss), net of any related taxes, in
Total AIG shareholders’ equity. Functional currencies are generally the currencies of the local operating environment.
Financial statement accounts expressed in currencies other than the functional currency of a consolidated entity are
translated into that entity’s functional currency. Income statement accounts expressed in functional currencies are
translated using average exchange rates during the period. The adjustments resulting from translation of financial
statements of foreign entities operating in highly inflationary economies are recorded in income. Exchange gains and
losses resulting from foreign currency transactions are recorded in income.
For discussion of our accounting policies on noncontrolling interests, see Note 18
herein.
For a discussion of our accounting policies on earnings (loss) per share, see
Note 19 herein
Future Application of Accounting Standards..............................................................................................................................................................................................
Testing Indefinite-Lived Intangible Assets for Impairment..............................................................................................................................................................................................
In July 2012, the Financial Accounting Standards Board (FASB) issued an accounting standard that allows a
company the option to first assess qualitatively whether it is more likely than not that an indefinite-lived intangible
asset is impaired. A company is not required to calculate the fair value of an indefinite-lived intangible asset and
perform the quantitative impairment test unless the company determines it is more likely than not the asset is
impaired.
The standard is effective for annual and interim impairment tests performed for fiscal years beginning after
September 15, 2012. While early adoption was permitted, we adopted the standard on its required effective date of
January 1, 2013. We do not expect adoption of the standard to have a material effect on our consolidated financial
condition, results of operations or cash flows.
Disclosures about Offsetting Assets and Liabilities..............................................................................................................................................................................................
In February 2013 the FASB issued guidance that clarifies the scope of transactions subject to disclosures about
offsetting assets and liabilities. The guidance applies to derivatives, repurchase agreements and reverse purchase
agreements, and securities borrowing and securities lending transactions that are offset either in accordance with
specific criteria contained in FASB Accounting Standards Codification or subject to a master netting arrangement or
similar agreement.
The standard is effective for fiscal years and interim periods beginning on or after January 1, 2013, and will be
applied retrospectively to all comparative periods presented. We do not expect adoption of the standard to have a
material effect on our consolidated financial condition, results of operations or cash flows.
..................................................................................................................................................................................................................................
AIG 2012 Form 10-K216
(q) Long-term debt:
(r) Contingent liabilities:
(s) Foreign currency:
(t) Noncontrolling interests:
(u) Earnings (loss) per share:
I T E M 8 / N O T E 2 . S U M M A R Y O F S I G N I F I C A N T A C C O U N T I N G P O L I C I E S

.....................................................................................................................................................................................
Presentation of Comprehensive Income..............................................................................................................................................................................................
In February 2013 the FASB issued guidance on the presentation requirements for items reclassified out of
accumulated other comprehensive income. We will be required to disclose the effect of significant items reclassified
out of accumulated other comprehensive income on the respective line items of net income or provide a cross-
reference to other disclosures currently required under U.S. GAAP for relevant items.
The standard is effective for annual and interim reporting periods beginning after December 15, 2012. We do not
expect adoption of the standard to have a material effect on our consolidated financial condition, results of operations
or cash flows.
Accounting Standards Adopted During 2012..............................................................................................................................................................................................
We adopted the following accounting standards on January 1, 2012
In October 2010, the FASB issued an accounting standard update that amends the accounting for costs incurred by
insurance companies that can be capitalized in connection with acquiring or renewing insurance contracts. The
standard clarifies how to determine whether the costs incurred in connection with the acquisition of new or renewal
insurance contracts qualify as DAC. We adopted the standard retrospectively on January 1, 2012.
Deferred policy acquisition costs represent those costs that are incremental and directly related to the successful
acquisition of new or renewal insurance contracts. We defer incremental costs that result directly from, and are
essential to, the acquisition or renewal of an insurance contract. Such costs generally include agent or broker
commissions and bonuses, premium taxes, and medical and inspection fees that would not have been incurred if the
insurance contract had not been acquired or renewed. Each cost is analyzed to assess whether it is fully deferrable.
We partially defer costs, including certain commissions, when we do not believe the entire cost is directly related to
the acquisition or renewal of insurance contracts.
We also defer a portion of employee total compensation and payroll-related fringe benefits directly related to time
spent performing specific acquisition or renewal activities, including costs associated with the time spent on
underwriting, policy issuance and processing, and sales force contract selling. The amounts deferred are those that
resulted in successful policy acquisition or renewal for each distribution channel and/or cost center from which the
cost originates.
Advertising costs related to the issuance of insurance contracts that meet the direct-advertising criteria are deferred
and amortized as part of DAC.
The method we use to amortize DAC for either short- or long-duration insurance contracts did not change as a result
of the adoption of the standard.
The adoption of the standard resulted in a reduction to beginning of period retained earnings for the earliest period
presented and a decrease in the amount of capitalized costs in connection with the acquisition or renewal of
insurance contracts. Accordingly, we revised our historical financial statements and accompanying notes to the
consolidated financial statements for the changes in DAC and associated changes in acquisition expenses and
income taxes for affected entities and segments, including divested entities presented in continuing and discontinued
operations.
..................................................................................................................................................................................................................................
AIG 2012 Form 10-K 217
Accounting for Costs Associated with Acquiring or Renewing Insurance Contracts
I T E M 8 / N O T E 2 . S U M M A R Y O F S I G N I F I C A N T A C C O U N T I N G P O L I C I E S

.....................................................................................................................................................................................
The following table presents amounts previously reported as of December 31, 2011, to reflect the effect of the
change due to the retrospective adoption of the standard, and the adjusted amounts that are reflected in our
Consolidated Balance Sheet.
Balance Sheet:
Deferred income taxes $ 17,897 $ 1,718 $ 19,615
Deferred policy acquisition costs 14,026 (5,089) 8,937
Other assets 11,705 (42) 11,663
Total assets 556,467 (3,413) 553,054
Retained earnings 14,332 (3,558) 10,774
Accumulated other comprehensive income 6,336 145 6,481
Total AIG shareholders’ equity 104,951 (3,413) 101,538
The following tables present amounts previously reported for the years ended December 31, 2011 and 2010
to reflect the effect of the change due to the retrospective adoption of the standard, and the adjusted
amounts that are reflected in our Consolidated Statement of Operations and Consolidated Statement of Cash
Flows.
Statement of Operations:
Total net realized capital gains $ 681 $ 20 $ 701
Total revenues 59,792 20 59,812
Interest credited to policyholder account balances 4,446 21 4,467
Amortization of deferred acquisition costs 8,019 (2,533) 5,486
Other acquisition and other insurance expenses 6,091 2,367 8,458
Net (gain) loss on sale of properties and divested businesses 74 – 74
Total benefits, claims and expenses 59,840 (144) 59,696
Income (loss) from continuing operations before income tax benefit (48) 164 116
Income tax benefit(b) (17,696) (1,728) (19,424)
Income from continuing operations 17,648 1,892 19,540
Income from discontinued operations, net of income tax expense(c) 858 932 1,790
Net income 18,506 2,824 21,330
Net income attributable to AIG 17,798 2,824 20,622
Net income attributable to AIG common shareholders 16,986 2,824 19,810
Income per share attributable to AIG common shareholders:
Basic and diluted
Income from continuing operations $ 8.98 $ 1.05 $ 10.03
Income from discontinued operations $ 0.46 $ 0.52 $ 0.98
(a) Includes $140 million in Total net realized capital gains attributable to the effect of the reclassification of certain derivative activity discussed in
Note 1 herein. Also includes the effect of the reclassification of ILFC as discontinued operations.
(b) Includes an adjustment to the deferred tax valuation allowance of $1.8 billion in the fourth quarter of 2011.
(c) Represents the effect on the gain on sale of AIG Star and AIG Edison which were sold in first quarter of 2011.
..................................................................................................................................................................................................................................
AIG 2012 Form 10-K218
December 31, 2011 As Previously Effect of As Currently
(in millions) Reported Change Reported
Year Ended December 31, 2011 As Previously Effect of As Currently
(dollars in millions, except per share data) Reported(a) Change Reported
I T E M 8 / N O T E 2 . S U M M A R Y O F S I G N I F I C A N T A C C O U N T I N G P O L I C I E S

.....................................................................................................................................................................................
Statement of Operations:
Total net realized capital losses $ (727) $ 11 $ (716)
Total revenues 72,818 11 72,829
Interest credited to policyholder account balances 4,480 7 4,487
Amortization of deferred acquisition costs 9,134 (3,313) 5,821
Other acquisition and other insurance expenses 6,775 3,388 10,163
Net (gain) loss on sale of properties and divested businesses(b) (17,767) (1,799) (19,566)
Total benefits, claims and expenses 54,301 (1,719) 52,582
Income from continuing operations before income tax expense 18,517 1,730 20,247
Income tax expense(c) 6,116 877 6,993
Income from continuing operations 12,401 853 13,254
Income (loss) from discontinued operations, net of income tax expense(d) (2,388) 1,419 (969)
Net income 10,013 2,272 12,285
Net income attributable to AIG 7,786 2,272 10,058
Net income attributable to AIG common shareholders 1,583 463 2,046
Income (loss) per share attributable to AIG common shareholders:
Basic and diluted
Income from continuing operations $ 15.23 $ 1.27 $ 16.50
Loss from discontinued operations $ (3.63) $ 2.11 $ (1.52)
(a) Includes $783 million in Total net realized capital gains attributable to the effect of the reclassification of certain derivative activity discussed in
Note 1 herein. Also includes the effect of the reclassification of ILFC as discontinued operations.
(b) Represents the effect on the gain on sale of AIA ordinary shares, which were sold in the fourth quarter of 2010.
(c) Includes the tax impact to the AIA gain adjustment of $1.0 billion in the fourth quarter of 2010.
(d) Includes an adjustment to the after-tax gain on the sale of ALICO of $1.6 billion in the fourth quarter of 2010.
Adoption of the standard did not affect the previously reported totals for net cash flows provided by (used in)
operating, investing, or financing activities, but did affect the following components of net cash flows provided by
(used in) operating activities.
Cash flows from operating activities:
Net income $ 18,506 $ 2,824 $ 21,330
(Income) loss from discontinued operations (858) (932) (1,790)
Adjustments to reconcile net income to net cash provided by (used
in) operating activities:
Noncash revenues, expenses, gains and losses included in income
(loss):
Unrealized gains in earnings – net (937) (20) (957)
Depreciation and other amortization 7,935 (2,511) 5,424
Changes in operating assets and liabilities:
Capitalization of deferred policy acquisition costs (7,796) 2,367 (5,429)
Current and deferred income taxes – net (18,333) (1,728) (20,061)
Total adjustments (23,904) (1,892) (25,796)
..................................................................................................................................................................................................................................
AIG 2012 Form 10-K 219
Year Ended December 31, 2010 As Previously Effect of As Currently
(dollars in millions, except per share data) Reported(a) Change Reported
Year Ended December 31, 2011 As Previously Effect of As Currently
(in millions) Reported(a) Change Reported
I T E M 8 / N O T E 2 . S U M M A R Y O F S I G N I F I C A N T A C C O U N T I N G P O L I C I E S

.....................................................................................................................................................................................
Cash flows from operating activities:
Net income $ 10,013 $ 2,272 $ 12,285
(Income) loss from discontinued operations 2,388 (1,419) 969
Adjustments to reconcile net income to net cash provided by (used
in) operating activities:
Noncash revenues, expenses, gains and losses included in income
(loss):
Net (gains) losses on sales of divested businesses (17,767) (1,799) (19,566)
Unrealized gains in earnings – net (1,509) (20) (1,529)
Depreciation and other amortization 8,488 (2,511) 5,977
Changes in operating assets and liabilities:
Capitalization of deferred policy acquisition costs (8,300) 2,367 (5,933)
Current and deferred income taxes – net 7,780 (1,728) 6,052
Total adjustments $ (5,201) $ (1,892) $ (7,093)
(a) Includes the effect of the reclassification of ILFC as discontinued operations.
For short-duration insurance contracts, starting in 2012, we elected to include anticipated investment income in our
determination of whether the deferred policy acquisition costs are recoverable. We believe the inclusion of anticipated
investment income in the recoverability analysis is a preferable accounting policy because it includes in the
recoverability analysis the fact that there is a timing difference between when premiums are collected and in turn
invested and when losses and related expenses are paid. This is considered a change in accounting principle that
required retrospective application to all periods presented. Because we historically have not recorded any premium
deficiency on our short-duration insurance contracts even without the inclusion of anticipated investment income,
there were no changes to the historical financial statements for the change in accounting principle.
Reconsideration of Effective Control for Repurchase Agreements
In April 2011, the FASB issued an accounting standard that amends the criteria used to determine effective control
for repurchase agreements and other similar arrangements such as securities lending transactions. The standard
modifies the criteria for determining when these transactions would be accounted for as secured borrowings
(i.e., financings) instead of sales of the securities.
The standard removes from the assessment of effective control the requirement that the transferor have the ability to
repurchase or redeem the financial assets on substantially the agreed terms, even in the event of default by the
transferee. The removal of this requirement makes the level of collateral received by the transferor in a repurchase
agreement or similar arrangement irrelevant in determining whether the transaction should be accounted for as a
sale. As a consequence, more repurchase agreements, securities lending transactions and similar arrangements will
be accounted for as secured borrowings.
The guidance in the standard was required to be applied prospectively to transactions or modifications of existing
transactions that occur on or after January 1, 2012. There are no repurchase agreements that continue to be
accounted for as sales as of December 31, 2012.
Common Fair Value Measurements and Disclosure Requirements in GAAP and IFRS
In May 2011, the FASB issued an accounting standard that amended certain aspects of the fair value measurement
guidance in GAAP, primarily to achieve the FASB’s objective of a converged definition of fair value and substantially
converged measurement and disclosure guidance with International Financial Reporting Standards (IFRS). The
measurement and disclosure requirements under GAAP and IFRS are now generally consistent, with certain
exceptions including the accounting for day one gains and losses, measuring the fair value of alternative investments
using net asset value and certain disclosure requirements.
The standard’s fair value measurement and disclosure guidance applies to all companies that measure assets,
liabilities, or instruments classified in shareholders’ equity at fair value or provide fair value disclosures for items not
recorded at fair value. The guidance clarifies existing guidance on the application of fair value measurements,
changes certain principles or requirements for measuring fair value, and requires significant additional disclosures for
..................................................................................................................................................................................................................................
AIG 2012 Form 10-K220
Year Ended December 31, 2010 As Previously Effect of As Currently
(in millions) Reported(a) Change Reported
I T E M 8 / N O T E 2 . S U M M A R Y O F S I G N I F I C A N T A C C O U N T I N G P O L I C I E S

.....................................................................................................................................................................................
Level 3 valuation inputs. The new disclosure requirements were applied prospectively. The standard became
effective beginning on January 1, 2012. The standard did not have any effect on our consolidated financial condition,
results of operations or cash flows. See Note 6 for additional information related to fair value measurements.
Presentation of Comprehensive Income
In June 2011, the FASB issued an accounting standard that requires the presentation of comprehensive income
either in a single continuous statement of comprehensive income or in two separate but consecutive statements. In
the two-statement approach, the first statement should present total net income and its components, followed
consecutively by a second statement that presents total other comprehensive income and its components. The
standard became effective beginning January 1, 2012 with retrospective application required. The standard did not
have any effect on our consolidated financial condition, results of operations or cash flows.
Testing Goodwill for Impairment
In September 2011, the FASB issued an accounting standard that amends the approach to testing goodwill for
impairment. The standard simplifies how entities test goodwill for impairment by permitting an entity to first assess
qualitative factors to determine whether it is more likely than not the fair value of a reporting unit is less than its
carrying amount as a basis for determining whether it is necessary to perform the quantitative, two-step goodwill
impairment test. The standard became effective for annual and interim goodwill impairment tests performed for fiscal
years beginning after December 15, 2011. The adoption of the standard did not have any effect on our consolidated
financial condition, results of operations or cash flows.
Accounting Standards Adopted During 2011..............................................................................................................................................................................................
In January 2010, the FASB issued an accounting standard that requires fair value disclosures about significant
transfers between Level 1 and 2 measurement categories and separate presentation of purchases, sales, issuances,
and settlements within the rollforward of Level 3 activity. Also, this fair value guidance clarifies the disclosure
requirements about the level of disaggregation and valuation techniques and inputs. This guidance became effective
for us beginning on January 1, 2010, except for the disclosures about purchases, sales, issuances, and settlements
within the rollforward of Level 3 activity, which became effective for us beginning on January 1, 2011. See Note 6 for
additional information related to fair value measurements.
In April 2010, the FASB issued an accounting standard that clarifies that an insurance company should not combine
any investments held in separate account interests with its interest in the same investment held in its general
account when assessing the investment for consolidation. Separate accounts represent funds for which investment
income and investment gains and losses accrue directly to the policyholders who bear the investment risk. The
standard also provides guidance on how an insurer should consolidate an investment fund when the insurer
concludes that consolidation of an investment is required and the insurer’s interest is through its general account in
addition to any separate accounts.
In April 2011, the FASB issued an accounting standard that amends the guidance for a creditor’s evaluation of
whether a restructuring is a troubled debt restructuring and requires additional disclosures about a creditor’s troubled
debt restructuring activities. The standard clarifies the two criteria used to determine whether a modification or
restructuring is a troubled debt restructuring: (i) whether the creditor has granted a concession and (ii) whether the
debtor is experiencing financial difficulties.
The adoption of these standards did not have a material effect on our consolidated financial condition, results of
operations or cash flows.
Accounting Standards Adopted During 2010..............................................................................................................................................................................................
In June 2009, the FASB issued an accounting standard addressing transfers of financial assets that removes the
concept of a qualifying special-purpose entity (QSPE) from the FASB Accounting Standards Codification and
removes the exception that exempted transferors from applying the consolidation rules to QSPEs.
In March 2010, the FASB issued an accounting standard that amends the accounting for embedded credit derivative
features in structured securities that redistribute credit risk in the form of subordination of one financial instrument to
another. The standard clarifies how to determine whether embedded credit derivative features, including those in
collateralized debt obligations (CDOs), credit-linked notes (CLNs), synthetic CDOs and CLNs and other synthetic
..................................................................................................................................................................................................................................
AIG 2012 Form 10-K 221
I T E M 8 / N O T E 2 . S U M M A R Y O F S I G N I F I C A N T A C C O U N T I N G P O L I C I E S

.....................................................................................................................................................................................
securities (e.g., commercial and residential mortgage-backed securities issued by securitization entities that wrote
credit derivatives), are considered to be embedded derivatives that should be analyzed for potential bifurcation and
separate accounting or, alternatively, for fair value accounting in connection with the application of the fair value
option to the entire hybrid instrument.
The adoption of these standards did not have a material effect on our consolidated financial condition, results of
operations or cash flows.
..................................................................................................................................................................................................................................
AIG 2012 Form 10-K222
I T E M 8 / N O T E 2 . S U M M A R Y O F S I G N I F I C A N T A C C O U N T I N G P O L I C I E S

.....................................................................................................................................................................................
3. SEGMENT INFORMATION..............................................................................................................................................................................................
Commencing in the third quarter of 2012, the Chartis segment was renamed AIG Property Casualty and the
SunAmerica segment was renamed AIG Life and Retirement, although certain existing brands will continue to be
used.
We report the results of our operations through two reportable segments: AIG Property Casualty and AIG Life and
Retirement. We evaluate performance based on pre-tax income (loss), excluding results from discontinued
operations, because we believe this provides more meaningful information on how our operations are performing.
Prior to the fourth quarter of 2012, we also presented Aircraft Leasing as a reportable segment, which included the
results of ILFC. As a result of the proposed transaction discussed in Note 4, Aircraft Leasing is no longer presented
as a reportable segment and the operations of ILFC are presented as discontinued operations in all periods, and
associated assets and liabilities have been classified as held-for-sale at December 31, 2012.
– The AIG Property Casualty segment is presented as two operating segments –
Commercial Insurance and Consumer Insurance in addition to an AIG Property Casualty Other category.
Our property and casualty operations are conducted through multiple-line companies writing substantially all
commercial and consumer lines both domestically and abroad. AIG Property Casualty offers its products through a
diverse, multi-channel distribution network that includes agents, wholesalers, global and local brokers, and
direct-to-consumer platforms. Beginning in the third quarter of 2010, AIG Property Casualty includes the results of
Fuji Fire & Marine Insurance Company Limited (Fuji), which writes primarily consumer lines in Japan. See Note 5
herein.
During 2012, to align financial reporting with the manner in which AIG’s chief operating decision makers review the
AIG Property Casualty businesses to assess performance and make decisions about resources to be allocated,
certain products previously reported in Commercial Insurance were reclassified to Consumer Insurance. Also, certain
environmental liability businesses were moved from Commercial Insurance to run-off operations included in the AIG
Property Casualty Other category. Accordingly, all periods have been restated from previously reported segment
information to reflect this change. These revisions did not affect the total AIG Property Casualty reportable segment
results previously reported.
– The AIG Life and Retirement segment is presented as two operating segments – Life
Insurance, which focuses on mortality and morbidity based protection products, and Retirement Services, which
focuses on investment, retirement savings and income solutions.
AIG Life and Retirement offers a comprehensive suite of products and services to individuals and groups, including
term life insurance, universal life insurance, accident and health (A&H) insurance, fixed and variable deferred
annuities, fixed payout annuities, mutual funds and financial planning. AIG Life and Retirement offers its products and
services through a diverse, multi-channel distribution network that includes banks, national, regional and independent
broker-dealers, affiliated financial advisors, independent marketing organizations, independent and career insurance
agents, structured settlement brokers, benefit consultants and direct-to-consumer platforms.
– Our Other operations include results from:
• Mortgage Guaranty operations;
• Global Capital Markets operations;
• Direct Investment book results;
• Retained Interests, which represents the fair value gains or losses, prior to their sale, on the AIA Group Limited.
(AIA) ordinary shares retained following the AIA initial public offering the MetLife, Inc. (MetLife) securities that were
received as consideration from the sale of American Life Insurance Company (ALICO), and the fair value gains or
losses, prior to the Federal Reserve Bank of New York (FRBNY) liquidation of Maiden Lane III LLC (ML III) assets,
on the retained interest in ML III;
• Corporate & Other operations (after allocations to our business segments); and
• Divested businesses that did not qualify for discontinued operations accounting.
..................................................................................................................................................................................................................................
AIG 2012 Form 10-K 223
AIG Property Casualty
AIG Life and Retirement
Other Operations
I T E M 8 / N O T E 3 . S E G M E N T I N F O R M A T I O N

.....................................................................................................................................................................................
The following table presents AIG’s continuing operations by reportable segment:
2012
AIG Property Casualty
Commercial Insurance
Consumer Insurance
Other
Total AIG Property Casualty
AIG Life and Retirement
Life Insurance
Retirement Services
Total AIG Life and Retirement
Other Operations
Mortgage Guaranty
Global Capital Markets
Direct Investment Book
Retained Interests
Corporate & Other
Consolidation and Elimination
Total Other Operations
AIG Consolidation and Elimination
Total AIG Consolidated
2011
AIG Property Casualty
Commercial Insurance $ 25,016 $ – $ – $ 3 $ 2,864 $ 1,339
Consumer Insurance 14,109 – – 4 1,836 (44)
Other 1,597 274 – – – 525
Total AIG Property Casualty $ 40,722 $ 274 $ – $ 7 $ 4,700 $ 1,820
AIG Life and Retirement
Life Insurance 8,282 223 – – 301 1,387
Retirement Services 7,033 754 – – 390 1,569
Total AIG Life and Retirement $ 15,315 $ 977 $ – $ – $ 691 $ 2,956
Other Operations
Mortgage Guaranty 944 – – – 44 (77)
Global Capital Markets 266 – – – – (7)
Direct Investment Book 1,004 25 – 367 (218) 622
Retained Interests 486 – – – – 486
Corporate & Other 1,415 4 74 2,143 207 (5,727)
Consolidation and Elimination (36) – – (20) – –
Total Other Operations $ 4,079 $ 29 $ 74 $ 2,490 $ 33 $ (4,703)
AIG Consolidation and Elimination (304) – – (53) – 43
Total AIG Consolidated $ 59,812 $ 1,280 $ 74 $ 2,444 $ 5,424 $ 116
..................................................................................................................................................................................................................................
AIG 2012 Form 10-K224
Net (gain) Pre-tax
Other-than- loss on sale Income
temporary of properties Depreciation from
Total impairment and divested Interest and continuing
(in millions) Revenues charges(a) businesses Expense(b) Amortization operations
$ 23,609 $ – $ – $ 5 $ 2,735 $ 904
14,403 – – 4 2,121 292
1,769 378 – 1 (1) 641
$ 39,781 $ 378 $ – $ 10 $ 4,855 $ 1,837
9,509 162 – – 322 1,966
7,258 562 – – (109) 1,814
$ 16,767 $ 724 $ – $ – $ 213 $ 3,780
867 – – – 44 15
745 – – – – 553
2,024 60 – 369 (121) 1,632
4,957 – – – – 4,957
1,429 5 2 1,998 318 (3,262)
(48) – – (27) – 4
$ 9,974 $ 65 $ 2 $ 2,340 $ 241 $ 3,899
(866) – – (31) (2) (194)
$ 65,656 $ 1,167 $ 2 $ 2,319 $ 5,307 $ 9,322
I T E M 8 / N O T E 3 . S E G M E N T I N F O R M A T I O N

.....................................................................................................................................................................................
2010
AIG Property Casualty
Commercial Insurance $ 24,371 $ – $ – $ 1 $ 2,911 $ 305
Consumer Insurance 11,580 – – – 1,509 185
Other 1,256 577 (669) – 2 (583)
Total AIG Property Casualty $ 37,207 $ 577 $ (669) $ 1 $ 4,422 $ (93)
AIG Life and Retirement
Life Insurance 8,334 409 – – 433 1,441
Retirement Services 6,413 1,549 – – 189 1,260
Total AIG Life and Retirement $ 14,747 $ 1,958 $ – $ – $ 622 $ 2,701
Other Operations
Mortgage Guaranty 1,168 – – – 43 397
Global Capital Markets 532 2 – 3 4 193
Direct Investment Book 1,499 356 – 382 (317) 1,242
Retained Interests 1,819 – – – – 1,819
Corporate & Other 2,631 30 (18,897) 6,551 342 11,436
Divested Businesses 13,811 116 – 4 861 2,435
Consolidation and Elimination (55) – – (59) – 89
Total Other Operations $ 21,405 $ 504 $ (18,897) $ 6,881 $ 933 $ 17,611
AIG Consolidation and Elimination (530) – – (140) – 28
Total AIG Consolidated $ 72,829 $ 3,039 $ (19,566) $ 6,742 $ 5,977 $ 20,247
(a) Included in Total revenues presented above.
(b) Interest expense for Other operations in 2010 includes amortization of prepaid commitment fee asset related to the FRBNY Credit Facility of
$3.5 billion.
..................................................................................................................................................................................................................................
AIG 2012 Form 10-K 225
Net (gain) Pre-tax
Other-than- loss on sale Income
temporary of properties Depreciation from
Total impairment and divested Interest and continuing
(in millions) Revenues charges(a) businesses Expense(b) Amortization operations
I T E M 8 / N O T E 3 . S E G M E N T I N F O R M A T I O N

.....................................................................................................................................................................................
The following table presents AIG’s year-end identifiable assets and capital expenditures by reportable
segment:
AIG Property Casualty
Commercial Insurance $ (a) $ (a)
Consumer Insurance (a) (a)
Other (a) (a)
Total AIG Property Casualty $ 177,892 $ 234
AIG Life and Retirement
Life Insurance 90,446 42
Retirement Services 177,627 33
Consolidation and Elimination (9,610 –
Total AIG Life and Retirement $ 258,463 $ 75
Other Operations
Mortgage Guaranty 5,395 37
Global Capital Markets 12,620 –
Direct Investment Book 31,172 –
Retained Interests 15,086 –
Corporate & Other 99,085 618
Aircraft Leasing(b) 39,107 604
Consolidation and Elimination 27,153 –
Total Other Operations $ 229,618 $ 1,259
AIG Consolidation and Elimination (112,919 –
Total Assets $ 553,054 $ 1,568
(a) AIG Property Casualty manages its assets on an aggregate basis and does not allocate its assets, other than goodwill, between its operating
segments.
(b) 2012 includes Aircraft Leasing assets classified as assets held-for-sale on the Consolidated Balance Sheet.
The following table presents AIG Property Casualty operations by operating segment:
Commercial Insurance $ 18,332 $ 18,814 $ 5,345 $ 5,252
Consumer Insurance 8,900 6,745 5,253 4,650
Other 717 2,308 272 200
Total AIG Property Casualty 27,949 27,867 10,870 10,102
The following table presents AIG Life and Retirement operations by operating segment:
Insurance-oriented products $ 5,813 $ 5,992 $ – $ –
Retirement savings products 2,469 2,335 6,006 6,150
Asset management revenues – 7 1,027 263
Total revenues 8,282 8,334 7,033 6,413
..................................................................................................................................................................................................................................
AIG 2012 Form 10-K226
Year-end identifiable assets Capital expenditures
(in millions) 2012 2011 2012 2011
$ (a) $ (a)
(a) (a)
(a) (a)
$ 178,733 $ 321
105,441 48
177,002 12
(6,769) ) –
$ 275,674 $ 60
5,270 11
7,050 –
28,528 –
– –
87,021 680
39,812 –
23,431 –
$ 191,112 $ 691
(96,886) ) –
$ 548,633 $ 1,072
$ 16,696 $ 6,009
8,498 5,613
591 466
25,785 12,088
$ 5,985 $ –
3,524 6,410
– 848
9,509 7,258
Claims and claims adjustment
expenses incurred Underwriting expenses
(in millions) 2012 2011 2010 2012 2011 2010
Life Insurance Retirement Services
(in millions) 2012 2011 2010 2012 2011 2010
I T E M 8 / N O T E 3 . S E G M E N T I N F O R M A T I O N

.....................................................................................................................................................................................
The following table presents AIG’s consolidated operations and long-lived assets by major geographic area:
United States $ 40,002 $ 40,232 $ 1,330 $ 1,896
Asia 6,834 19,084 591 557
Other Foreign 12,976 13,513 386 392
Consolidated 59,812 72,829 2,307 2,845
(a) Revenues are generally reported according to the geographic location of the reporting unit.
..................................................................................................................................................................................................................................
AIG 2012 Form 10-K 227
$ 46,171 $ 1,391
7,635 516
11,850 306
65,656 2,213
Real estate and other fixed
assets, net of accumulated
Total revenues(a) depreciation
(in millions) 2012 2011 2010 2012 2011 2010
I T E M 8 / N O T E 3 . S E G M E N T I N F O R M A T I O N

.....................................................................................................................................................................................
4. DIVESTED BUSINESSES, HELD-FOR-SALE CLASSIFICATION AND DISCONTINUED OPERATIONS..............................................................................................................................................................................................
Divested Businesses..............................................................................................................................................................................................
AIA Initial Public Offering and Subsequent Sales..............................................................................................................................................................................................
On October 29, 2010, we completed an initial public offering (IPO) of 8.08 billion ordinary shares of AIA for
aggregate gross proceeds of approximately $20.5 billion. Upon completion of the IPO, we owned 33 percent of the
outstanding AIA ordinary shares. Accordingly, we deconsolidated AIA and recorded a pre-tax gain of $18.1 billion in
2010. During 2012, we sold our remaining AIA ordinary shares for aggregate gross proceeds of approximately
$14.5 billion. As a result of these sales, we no longer held an interest in AIA as of December 31, 2012. Prior to the
disposition, we accounted for our investment in AIA under the fair value option with gains and losses recorded in Net
investment income. At December 31, 2011, the fair value of our retained interest in AIA was approximately
$12.4 billion, and was included in Other invested assets.
The following table presents certain information relating to our sales of AIA ordinary shares:
Sales:
March 7, 2012 1,720,000,000 $ 6.0
September 11, 2012 591,866,000 2.0
December 20, 2012 1,648,903,201 6.5
Total Sales 3,960,769,201 $ 14.5
Held-For-Sale Classification..............................................................................................................................................................................................
We report a business as held for sale when management has approved or received approval to sell the business
and is committed to a formal plan, the business is available for immediate sale, the business is being actively
marketed, the sale is anticipated to occur during the next 12 months and certain other specified criteria are met. A
business classified as held for sale is recorded at the lower of its carrying amount or estimated fair value less cost to
sell. If the carrying amount of the business exceeds its estimated fair value, a loss is recognized. Depreciation is not
recorded on assets of a business after it is classified as held for sale. Assets and liabilities related to a business
classified as held for sale are segregated in the Consolidated Balance Sheet in the period in which the business is
classified as held for sale.
At December 31, 2012, held-for-sale assets and liabilities consisted of ILFC.
..................................................................................................................................................................................................................................
AIG 2012 Form 10-K228
Shares Gross
(in billions, except share data) Sold Proceeds
I T E M 8 / N O T E 4 . D I V E S T E D B U S I N E S S E S , H E L D - F O R - S A L E C L A S S I F I C A T I O N A N D D I S C O N T I N U E D
O P E R A T I O N S

.....................................................................................................................................................................................
The following table summarizes the components of assets and liabilities held-for-sale on the Consolidated
Balance Sheet as of December 31, 2012:
Assets:
Equity securities
Mortgage and other loans receivable, net
Flight equipment primarily under operating leases, net of accumulated depreciation
Short-term investments
Cash
Premiums and other receivables, net of allowance
Other assets
Assets of businesses held for sale
Less: Loss Accrual
Total assets held for sale
Liabilities:
Other liabilities
Other long-term debt
Total liabilities held for sale
Discontinued Operations..............................................................................................................................................................................................
We report the results of operations of a business as discontinued operations if the business is classified as held for
sale, the operations and cash flows of the business have been or will be eliminated from our ongoing operations as a
result of a disposal transaction and we will not have any significant continuing involvement in the operations of the
business after the disposal transaction. The results of discontinued operations are reported in Discontinued
Operations in the Consolidated Statement of Operations for current and prior periods commencing in the period in
which the business meets the criteria of a discontinued operation, and include any gain or loss recognized on closing
or adjustment of the carrying amount to fair value less cost to sell.
The results of operations for the following businesses are presented as discontinued operations in our Consolidated
Statement of Operations.
International Lease Finance Corporation Sale..............................................................................................................................................................................................
On December 9, 2012, we entered into a definitive agreement with Jumbo Acquisition Limited for the sale of
80.1 percent of the common stock of ILFC for approximately $4.2 billion in cash. Jumbo Acquisition Limited may
elect to purchase an additional 9.9 percent of the common stock of ILFC for $522.5 million (the Option) by the later
of March 15, 2013 and ten days after approval of the ILFC Transaction and the Option by the Committee on Foreign
Investment in the United States. We will retain a 19.9 percent ownership interest in ILFC, or a 10.0 percent
ownership interest in ILFC, if the Option is exercised by Jumbo Acquisition Limited, in each case subject to dilution
for management issuances (which, over time, would reduce our ownership interest by approximately one percentage
point). The transaction is subject to required regulatory approvals and other customary closing conditions. We
determined ILFC met the criteria at December 31, 2012 for held for sale and discontinued operations accounting and,
consequently, we recorded a $4.4 billion after tax loss for the year ended December 31, 2012, which is reported in
Income (loss) from discontinued operations in the Consolidated Statement of Operations. At the closing of the
transaction, AIG will return $1.1 billion to ILFC in connection with the termination of intercompany arrangements
between AIG and ILFC.
..................................................................................................................................................................................................................................
AIG 2012 Form 10-K 229
December 31,
(in millions) 2012
$ 1
117
34,468
1,861
63
308
1,864
38,682
(6,717)
$ 31,965
$ 3,043
24,323
$ 27,366
I T E M 8 / N O T E 4 . D I V E S T E D B U S I N E S S E S , H E L D - F O R - S A L E C L A S S I F I C A T I O N A N D D I S C O N T I N U E D
O P E R A T I O N S

.....................................................................................................................................................................................
Nan Shan Sale..............................................................................................................................................................................................
On January 12, 2011, we entered into an agreement to sell our 97.57 percent interest in Nan Shan Life Insurance
Company, Ltd. (Nan Shan) to a Taiwan-based consortium. The transaction was consummated on August 18, 2011
for net proceeds of $2.15 billion in cash. We recorded a pre-tax loss of $1.0 billion for the year ended December 31,
2011 largely offsetting Nan Shan operating results for the period, which is reflected in Income (loss) from
discontinued operations in the Consolidated Statement of Operations. The net proceeds from the transaction were
used to pay down a portion of the liquidation preference of the Department of the Treasury’s preferred interests (AIA
SPV Preferred Interests) in the special purpose vehicle holding the proceeds of the AIA initial public offering (the AIA
SPV).
AIG Star and AIG Edison Sale..............................................................................................................................................................................................
On September 30, 2010, we entered into a definitive agreement with Prudential Financial, Inc. for the sale of our
Japan-based insurance subsidiaries, AIG Star and AIG Edison, for total consideration of $4.8 billion, including the
assumption of certain outstanding debt totaling $0.6 billion owed by AIG Star and AIG Edison. The transaction closed
on February 1, 2011 and we recognized a pre-tax gain of $3.5 billion on the sale that is reflected in Income (loss)
from discontinued operations in the Consolidated Statement of Operations. In connection with the sale, we recorded
a goodwill impairment charge of $1.3 billion in the third quarter of 2010.
AGF Sale..............................................................................................................................................................................................
On August 10, 2010, we entered into a definitive agreement to sell an 80 percent economic interest (84 percent
voting interest) in AGF for $125 million. The AGF sale closed on November 30, 2010. Our voting ownership interest
in AGF was reduced to approximately 16 percent, and we do not otherwise have significant continuing involvement
with or significant continuing cash flows from AGF. We are carrying our retained investment in AGF of approximately
$30 million as a cost method investment in Other invested assets. As a result of this transaction, we recorded a
pre-tax loss of $1.7 billion in 2010. The components of the $1.7 billion charge consisted of the difference between
(i) the sum of the fair value of the agreed consideration and our retained 20 percent economic interest and (ii) the
net book value of the assets.
ALICO Sale..............................................................................................................................................................................................
On March 7, 2010, AIG and the special purpose vehicle holding the proceeds of the sale of ALICO (ALICO SPV)
entered into a definitive agreement with MetLife for the sale of ALICO by the ALICO SPV to MetLife, and the sale of
Delaware American Life Insurance Company by AIG to MetLife, for consideration then valued at approximately
$15.5 billion, consisting of $6.8 billion in cash and the remainder in equity securities of MetLife, subject to closing
adjustments. The ALICO sale closed on November 1, 2010. We do not have any significant continuing involvement
with or significant continuing cash flows from ALICO. The fair value of the consideration at closing was approximately
$16.2 billion. At December 31, 2010, a total of $6.5 billion was included in common and preferred stock trading.
On the closing date, as consideration for the ALICO sale, the ALICO SPV received net cash consideration of
$7.2 billion (which included an upward price adjustment of approximately $400 million pursuant to the terms of the
ALICO stock purchase agreement), 78,239,712 shares of MetLife common stock, 6,857,000 shares of newly issued
MetLife participating preferred stock convertible into 68,570,000 shares of MetLife common stock upon the approval
of MetLife shareholders and 40,000,000 equity units of MetLife with an aggregate stated value of $3.2 billion. AIG
recorded a pre-tax gain of $7.9 billion on the transaction in 2010.
As part of the Recapitalization, we used approximately $6.1 billion of the cash proceeds from the ALICO sale to pay
down a portion of the liquidation preference of the SPV Preferred Interests.
ALICO, Nan Shan, AIG Star and AIG Edison previously were components of the Foreign Life Insurance & Retirement
Services reportable segment and AGF previously was a component of the Financial Services reportable segment.
Results from discontinued operations for 2011 and 2010 include the results of Nan Shan, AIG Star and AIG Edison
through the date of disposition. Results from discontinued operations for 2010 also include the results of ALICO and
AGF, which were sold during 2010. The results also include adjustments for guarantees and indemnifications related
to these sold businesses.
..................................................................................................................................................................................................................................
AIG 2012 Form 10-K230
I T E M 8 / N O T E 4 . D I V E S T E D B U S I N E S S E S , H E L D - F O R - S A L E C L A S S I F I C A T I O N A N D D I S C O N T I N U E D
O P E R A T I O N S

.....................................................................................................................................................................................
See Note 16 herein for a discussion of guarantees and indemnifications associated with sales of businesses.
Certain other sales completed during 2011 and 2010 were not classified as discontinued operations because we
continued to generate significant direct revenue-producing or cost-generating cash flows from the businesses or
because associated assets, liabilities and results of operations were not material, individually or in the aggregate, to
our consolidated financial position or results of operations.
The following table summarizes income (loss) from discontinued operations:
Revenues:
Premiums $ 5,012 $ 18,296
Net investment income 1,632 6,924
Net realized capital gains 834 158
Aircraft leasing revenue 4,508 4,749
Other income (48) 1,697
Total revenues 11,938 31,824
Benefits, claims and expenses, excluding Aircraft leasing expenses* 7,910 30,458
Aircraft leasing expenses 3,876 4,050
Interest expense allocation 2 75
Income (loss) from discontinued operations 150 (2,759)
Gain (loss) on sale 2,338 5,389
Income (loss) from discontinued operations, before tax income tax expense
(benefit) 2,488 2,630
Income tax expense (benefit) 698 3,599
Income (loss) from discontinued operations, net of income tax $ 1,790 $ (969)
* In 2010, includes goodwill impairment charges of $3.3 billion related to the sale of ALICO and $1.3 billion related to the sale of AIG
Star and AIG Edison. In 2012, includes goodwill impairment charges of $23 million related to the ILFC Transaction. See Note 2 – Goodwill
herein for further discussion.
Interest Expense Allocation..............................................................................................................................................................................................
Interest expense allocated to discontinued operations gives effect to the provisions of the Recapitalization discussed
in Note 25 for all periods presented. For this reason, an interest allocation to discontinued operations related to a
portion of the ALICO and all the AGF proceeds was required.
The interest expense allocated to discontinued operations was based on the anticipated net proceeds that would be
applied toward the repayment of the FRBNY Credit Facility from the sales of ALICO and AGF multiplied by the daily
interest rate on the FRBNY Credit Facility for each respective period. The periodic amortization of the prepaid
commitment fee allocated to discontinued operations was determined based on the ratio of funds committed to repay
the FRBNY Credit Facility to the total amount of credit available under the FRBNY Credit Facility.
Prior to the Recapitalization, the terms of the FRBNY Credit Facility contractually required net proceeds from
dispositions, after taxes and transaction expenses, to the extent such proceeds did not represent capital of AIG’s
insurance subsidiaries required for regulatory or ratings purposes, to be applied toward the repayment of the FRBNY
Credit Facility as mandatory prepayments unless otherwise agreed with the FRBNY. Mandatory prepayments
reduced the amount available to be borrowed under the FRBNY Credit Facility by the amount of the prepayment. In
conjunction with anticipated prepayments, AIG allocated interest expense, including periodic amortization of the
prepaid commitment fee asset, to Income (loss) from discontinued operations. As a result of the revised terms for
repayment of the FRBNY Credit Facility, interest expense that was previously allocated to discontinued operations in
connection with the sales of AIG Star, AIG Edison and Nan Shan was reclassified to continuing operations for all
periods presented.
..................................................................................................................................................................................................................................
AIG 2012 Form 10-K 231
Years Ended December 31,
(in millions) 2012 2011 2010
$ –
–
1
4,504
(18)
4,487
1,596
2,587
–
304
(6,733)
(6,429)
(2,377)
$ (4,052)
I T E M 8 / N O T E 4 . D I V E S T E D B U S I N E S S E S , H E L D - F O R - S A L E C L A S S I F I C A T I O N A N D D I S C O N T I N U E D
O P E R A T I O N S

.....................................................................................................................................................................................
5. BUSINESS COMBINATIONS..............................................................................................................................................................................................
On March 31, 2010, through an AIG Property Casualty subsidiary, we purchased additional voting shares in Fuji, a
publicly traded Japanese insurance company with property/casualty insurance operations and a life insurance
subsidiary. The acquisition of the additional voting shares for $145 million increased AIG Property Casualty’ total
voting ownership interest in Fuji from 41.7 percent to 54.8 percent, which resulted in AIG Property Casualty obtaining
control of Fuji. In connection with the acquisition, we recognized a bargain purchase gain of $332 million in the
Consolidated Statement of Operations for the year ended December 31, 2010. The bargain purchase gain was
primarily attributable to the depressed market value of Fuji’s common stock, which we believe was the result of
macroeconomic, capital market and regulatory factors in Japan coupled with Fuji’s financial condition and results of
operations. The acquisition was consistent with AIG Property Casualty’s desire to increase its share in the substantial
Japanese insurance market and to achieve cost savings from synergies.
In March 2011, AIG Property Casualty completed the acquisition of approximately 305 million shares of Fuji tendered
in response to a public offer at an offer price of 146 Yen per share ($1.76 per share) for a purchase price of
$538 million. In August 2011, AIG Property Casualty acquired the remaining outstanding voting shares of Fuji. As a
result of these actions, AIG Property Casualty now owns 100 percent of Fuji.
The 2011 purchases were accounted for as equity transactions because we previously consolidated Fuji due to our
controlling interest. Accordingly, the difference between the fair value of the total consideration paid of $560 million
and the carrying value of the noncontrolling interest acquired of $489 million was recognized as a reduction of our
equity in Fuji. There was no gain or loss recorded in the Consolidated Statement of Operations for the year ended
December 31, 2011.
..................................................................................................................................................................................................................................
AIG 2012 Form 10-K232
I T E M 8 / N O T E 5 . B U S I N E S S C O M B I N A T I O N S

.....................................................................................................................................................................................
6. FAIR VALUE MEASUREMENTS..............................................................................................................................................................................................
Fair Value Measurements on a Recurring Basis..............................................................................................................................................................................................
We carry certain of our financial instruments at fair value. We define the fair value of a financial instrument as the
amount that would be received from the sale of an asset or paid to transfer a liability in an orderly transaction
between market participants at the measurement date. We are responsible for the determination of the value of the
investments carried at fair value and the supporting methodologies and assumptions.
The degree of judgment used in measuring the fair value of financial instruments generally inversely correlates with
the level of observable valuation inputs. We maximize the use of observable inputs and minimize the use of
unobservable inputs when measuring fair value. Financial instruments with quoted prices in active markets generally
have more pricing observability and less judgment is used in measuring fair value. Conversely, financial instruments
for which no quoted prices are available have less observability and are measured at fair value using valuation
models or other pricing techniques that require more judgment. Pricing observability is affected by a number of
factors, including the type of financial instrument, whether the financial instrument is new to the market and not yet
established, the characteristics specific to the transaction, liquidity and general market conditions.
Fair Value Hierarchy..............................................................................................................................................................................................
Assets and liabilities recorded at fair value in the Consolidated Balance Sheet are measured and classified in
accordance with a fair value hierarchy consisting of three ‘‘levels’’ based on the observability of inputs available in
the marketplace used to measure the fair values as discussed below:
• Fair value measurements that are quoted prices (unadjusted) in active markets that we have the ability to
access for identical assets or liabilities. Market price data generally is obtained from exchange or dealer markets.
We do not adjust the quoted price for such instruments.
• Fair value measurements based on inputs other than quoted prices included in Level 1 that are
observable for the asset or liability, either directly or indirectly. Level 2 inputs include quoted prices for similar
assets and liabilities in active markets, quoted prices for identical or similar assets or liabilities in markets that are
not active, and inputs other than quoted prices that are observable for the asset or liability, such as interest rates
and yield curves that are observable at commonly quoted intervals.
• Fair value measurements based on valuation techniques that use significant inputs that are unobservable.
Both observable and unobservable inputs may be used to determine the fair values of positions classified in
Level 3. The circumstances for using these measurements include those in which there is little, if any, market
activity for the asset or liability. Therefore, we must make certain assumptions as to the inputs a hypothetical
market participant would use to value that asset or liability. In certain cases, the inputs used to measure fair value
may fall into different levels of the fair value hierarchy. In such cases, the level in the fair value hierarchy within
which the fair value measurement in its entirety falls is determined based on the lowest level input that is
significant to the fair value measurement in its entirety.
The following is a description of the valuation methodologies used for instruments carried at fair value. These
methodologies are applied to assets and liabilities across the levels noted above, and it is the observability of the
inputs used that determines the appropriate level in the fair value hierarchy for the respective asset or liability.
Valuation Methodologies of Financial Instruments Measured at Fair Value..............................................................................................................................................................................................
Incorporation of Credit Risk in Fair Value Measurements..............................................................................................................................................................................................
• Fair value measurements for certain liabilities incorporate our own credit risk by
determining the explicit cost for each counterparty to protect against its net credit exposure to us at the balance
sheet date by reference to observable AIG CDS or cash bond spreads. A derivative counterparty’s net credit
exposure to us is determined based on master netting agreements, when applicable, which take into consideration
all derivative positions with us, as well as collateral we post with the counterparty at the balance sheet date. We
calculate the effect of these credit spread changes using discounted cash flow techniques that incorporate current
market interest rates.
..................................................................................................................................................................................................................................
AIG 2012 Form 10-K 233
Level 1:
Level 2:
Level 3:
Our Own Credit Risk.
I T E M 8 / N O T E 6 . F A I R V A L U E M E A S U R E M E N T S

.....................................................................................................................................................................................
• Fair value measurements for freestanding derivatives incorporate counterparty credit
by determining the explicit cost for us to protect against our net credit exposure to each counterparty at the
balance sheet date by reference to observable counterparty CDS spreads, when available. When not available,
other directly or indirectly observable credit spreads will be used to derive the best estimates of the counterparty
spreads. Our net credit exposure to a counterparty is determined based on master netting agreements, which take
into consideration all derivative positions with the counterparty, as well as collateral posted by the counterparty at
the balance sheet date.
Fair values for fixed maturity securities based on observable market prices for identical or similar instruments
implicitly incorporate counterparty credit risk. Fair values for fixed maturity securities based on internal models
incorporate counterparty credit risk by using discount rates that take into consideration cash issuance spreads for
similar instruments or other observable information.
The cost of credit protection is determined under a discounted present value approach considering the market levels
for single name CDS spreads for each specific counterparty, the mid market value of the net exposure (reflecting the
amount of protection required) and the weighted average life of the net exposure. CDS spreads are provided to us
by an independent third party. We utilize an interest rate based on the benchmark London Interbank Offered Rate
(LIBOR) curve to derive our discount rates.
While this approach does not explicitly consider all potential future behavior of the derivative transactions or potential
future changes in valuation inputs, we believe this approach provides a reasonable estimate of the fair value of the
assets and liabilities, including consideration of the impact of non-performance risk.
Fixed Maturity Securities – Trading and Available for Sale..............................................................................................................................................................................................
Whenever available, we obtain quoted prices in active markets for identical assets at the balance sheet date to
measure fixed maturity securities at fair value in our trading and available for sale portfolios. Market price data is
generally obtained from dealer markets.
We employ independent third-party valuation service providers to gather, analyze, and interpret market information to
derive fair value estimates for individual investments, based upon market-accepted methodologies and assumptions.
The methodologies used by these independent third-party valuation services are reviewed and understood by
management, through periodic discussion with and information provided by the valuation services. In addition, as
discussed further below, control processes are applied to the fair values received from third-party valuation services
to ensure the accuracy of these values.
Valuation service providers typically obtain data about market transactions and other key valuation model inputs from
multiple sources and, through the use of widely accepted valuation methodologies, which may utilize matrix pricing,
financial models, accompanying model inputs and various assumptions, provide a single fair value measurement for
individual securities. The inputs used by the valuation service providers include, but are not limited to, market prices
from completed transactions for identical securities and transactions for comparable securities, benchmark yields,
interest rate yield curves, credit spreads, currency rates, quoted prices for similar securities and other market-
observable information, as applicable. If fair value is determined using financial models, these models generally take
into account, among other things, market observable information as of the measurement date as well as the specific
attributes of the security being valued, including its term, interest rate, credit rating, industry sector, and when
applicable, collateral quality and other security or issuer-specific information. When market transactions or other
market observable data is limited, the extent to which judgment is applied in determining fair value is greatly
increased.
We have control processes designed to ensure that the fair values received from third party valuation services are
accurately recorded, that their data inputs and valuation techniques are appropriate and consistently applied and that
the assumptions used appear reasonable and consistent with the objective of determining fair value. We assess the
reasonableness of individual security values received from valuation service providers through various analytical
techniques, and have procedures to escalate related questions internally and to the third party valuation services for
resolution. To assess the degree of pricing consensus among various valuation services for specific asset types, we
have conducted comparisons of prices received from available sources. We have used these comparisons to
establish a hierarchy for the fair values received from third party valuation services to be used for particular security
classes. We also validate prices for selected securities through reviews by members of management who have
relevant expertise and who are independent of those charged with executing investing transactions.
..................................................................................................................................................................................................................................
AIG 2012 Form 10-K234
Counterparty Credit Risk.
I T E M 8 / N O T E 6 . F A I R V A L U E M E A S U R E M E N T S

.....................................................................................................................................................................................
When our third-party valuation service providers are unable to obtain sufficient market observable information upon
which to estimate the fair value for a particular security, fair value is determined either by requesting brokers who are
knowledgeable about these securities to provide a price quote, which is generally non-binding, or by employing
widely accepted valuation models. Broker prices may be based on an income approach, which converts expected
future cash flows to a single present value amount, with specific consideration of inputs relevant to particular security
types. For structured securities, such inputs may include ratings, collateral types, geographic concentrations,
underlying loan vintages, loan delinquencies, and weighted average coupons and maturities. When the volume or
level of market activity for a security is limited, certain inputs used to determine fair value may not be observable in
the market. Broker prices may also be based on a market approach that considers recent transactions involving
identical or similar securities. Fair values provided by brokers are subject to similar control processes to those noted
above for fair values from third party valuation services, including management reviews. For those corporate debt
instruments (for example, private placements) that are not traded in active markets or that are subject to transfer
restrictions, valuations are adjusted to reflect illiquidity and non-transferability, and such adjustments generally are
based on available market evidence. When observable price quotations are not available, fair value is determined
based on discounted cash flow models using discount rates based on credit spreads, yields or price levels of
comparable securities, adjusted for illiquidity and structure. Fair values determined internally are also subject to
management review to ensure that valuation models and related inputs are reasonable.
The methodology above is relevant for all fixed maturity securities including residential mortgage-backed securities
(RMBS), commercial mortgage backed securities (CMBS), CDOs, other asset-backed securities (ABS) and fixed
maturity securities issued by government sponsored entities and corporate entities.
Equity Securities Traded in Active Markets – Trading and Available for Sale..............................................................................................................................................................................................
Whenever available, we obtain quoted prices in active markets for identical assets at the balance sheet date to
measure at fair value marketable equity securities in our trading and available for sale portfolios or in Other invested
assets. Market price data is generally obtained from exchange or dealer markets.
Mortgage and Other Loans Receivable..............................................................................................................................................................................................
We estimate the fair value of mortgage and other loans receivable that are measured at fair value by using dealer
quotations, discounted cash flow analyses and/or internal valuation models. The determination of fair value considers
inputs such as interest rate, maturity, the borrower’s creditworthiness, collateral, subordination, guarantees, past-due
status, yield curves, credit curves, prepayment rates, market pricing for comparable loans and other relevant factors.
Other Invested Assets..............................................................................................................................................................................................
We initially estimate the fair value of investments in certain hedge funds, private equity funds and other investment
partnerships by reference to the transaction price. Subsequently, we generally obtain the fair value of these
investments from net asset value information provided by the general partner or manager of the investments, the
financial statements of which are generally audited annually. We consider observable market data and perform
certain control procedures to validate the appropriateness of using the net asset value as a fair value measurement.
The fair values of other investments carried at fair value, such as direct private equity holdings, are initially
determined based on transaction price and are subsequently estimated based on available evidence such as market
transactions in similar instruments and other financing transactions of the issuer, with adjustments made to reflect
illiquidity as appropriate.
Short-term Investments..............................................................................................................................................................................................
For short-term investments that are measured at fair value, the carrying values of these assets approximate fair
values because of the relatively short period of time between origination and expected realization, and their limited
exposure to credit risk. Securities purchased under agreements to resell (reverse repurchase agreements) are
generally treated as collateralized receivables. We report certain receivables arising from securities purchased under
agreements to resell as Short-term investments in the Consolidated Balance Sheet. We use market-observable
..................................................................................................................................................................................................................................
AIG 2012 Form 10-K 235
I T E M 8 / N O T E 6 . F A I R V A L U E M E A S U R E M E N T S

.....................................................................................................................................................................................
interest rates for receivables measured at fair value. This methodology considers such factors as the coupon rate
and yield curves.
Separate Account Assets..............................................................................................................................................................................................
Separate account assets are composed primarily of registered and unregistered open-end mutual funds that
generally trade daily and are measured at fair value in the manner discussed above for equity securities traded in
active markets.
Freestanding Derivatives..............................................................................................................................................................................................
Derivative assets and liabilities can be exchange-traded or traded over-the-counter (OTC). We generally value
exchange-traded derivatives such as futures and options using quoted prices in active markets for identical
derivatives at the balance sheet date.
OTC derivatives are valued using market transactions and other market evidence whenever possible, including
market-based inputs to models, model calibration to market clearing transactions, broker or dealer quotations or
alternative pricing sources with reasonable levels of price transparency. When models are used, the selection of a
particular model to value an OTC derivative depends on the contractual terms of, and specific risks inherent in the
instrument, as well as the availability of pricing information in the market. We generally use similar models to value
similar instruments. Valuation models require a variety of inputs, including contractual terms, market prices and rates,
yield curves, credit curves, measures of volatility, prepayment rates and correlations of such inputs. For OTC
derivatives that trade in liquid markets, such as generic forwards, swaps and options, model inputs can generally be
corroborated by observable market data by correlation or other means, and model selection does not involve
significant management judgment.
For certain OTC derivatives that trade in less liquid markets, where we generally do not have corroborating market
evidence to support significant model inputs and cannot verify the model to market transactions, the transaction price
may provide the best estimate of fair value. Accordingly, when a pricing model is used to value such an instrument,
the model is adjusted so the model value at inception equals the transaction price. We will update valuation inputs in
these models only when corroborated by evidence such as similar market transactions, third party pricing services
and/or broker or dealer quotations, or other empirical market data. When appropriate, valuations are adjusted for
various factors such as liquidity, bid/offer spreads and credit considerations. Such adjustments are generally based
on available market evidence. In the absence of such evidence, management’s best estimate is used.
Embedded Policy Derivatives..............................................................................................................................................................................................
Certain variable annuity and equity-indexed annuity and life contracts contain embedded policy derivatives that we
bifurcate from the host contracts and account for separately at fair value, with changes in fair value recognized in
earnings. We have concluded these contracts contain (i) written option guarantees on minimum accumulation value,
(ii) a series of written options that guarantee withdrawals from the highest anniversary value within a specific period
or for life, or (iii) equity-indexed written options that meet the criteria of derivatives that must be bifurcated.
The fair value of embedded policy derivatives contained in certain variable annuity and equity-indexed annuity and
life contracts is measured based on actuarial and capital market assumptions related to projected cash flows over the
expected lives of the contracts. These cash flow estimates primarily include benefits and related fees assessed,
when applicable, and incorporate expectations about policyholder behavior. Estimates of future policyholder behavior
are subjective and based primarily on our historical experience.
With respect to embedded policy derivatives in our variable annuity contracts, because of the dynamic and complex
nature of the expected cash flows, risk neutral valuations are used. Estimating the underlying cash flows for these
products involves judgments regarding expected market rates of return, market volatility, correlations of market index
returns to funds, fund performance, discount rates and policyholder behavior. With respect to embedded policy
derivatives in our equity-indexed annuity and life contracts, option pricing models are used to estimate fair value,
taking into account assumptions for future equity index growth rates, volatility of the equity index, future interest
..................................................................................................................................................................................................................................
AIG 2012 Form 10-K236
I T E M 8 / N O T E 6 . F A I R V A L U E M E A S U R E M E N T S

.....................................................................................................................................................................................
rates, and determinations on adjusting the participation rate and the cap on equity-indexed credited rates in light of
market conditions and policyholder behavior assumptions. These methodologies incorporate an explicit risk margin to
take into consideration market participant estimates of projected cash flows and policyholder behavior.
We also incorporate our own risk of non-performance in the valuation of the embedded policy derivatives associated
with variable annuity and equity-indexed annuity and life contracts. Historically, the expected cash flows were
discounted using the interest rate swap curve (swap curve), which is commonly viewed as being consistent with the
credit spreads for highly-rated financial institutions (S&P AA-rated or above). A swap curve shows the fixed-rate leg
of a non-complex swap against the floating rate (for example, LIBOR) leg of a related tenor. The swap curve was
adjusted, as necessary, for anomalies between the swap curve and the U.S. Treasury yield curve. During the fourth
quarter of 2010, we revised the non-performance risk adjustment to reflect a market participant’s view of AIG Life
and Retirement’s claims paying ability. As a result, in 2010, we incorporated an additional spread to the swap curve
used to value embedded policy derivatives, thereby reducing the fair value of the embedded derivative liabilities by
$336 million, which was partially offset by $173 million of DAC amortization.
Super Senior Credit Default Swap Portfolio..............................................................................................................................................................................................
We value CDS transactions written on the super senior risk layers of designated pools of debt securities or loans
using internal valuation models, third-party price estimates and market indices. The principal market was determined
to be the market in which super senior credit default swaps of this type and size would be transacted, or have been
transacted, with the greatest volume or level of activity. We have determined that the principal market participants,
therefore, would consist of other large financial institutions who participate in sophisticated over-the-counter
derivatives markets. The specific valuation methodologies vary based on the nature of the referenced obligations and
availability of market prices.
The valuation of the super senior credit derivatives is challenging given the limitation on the availability of market
observable information due to the lack of trading and price transparency in certain structured finance markets. These
market conditions have increased the reliance on management estimates and judgments in arriving at an estimate of
fair value for financial reporting purposes. Further, disparities in the valuation methodologies employed by market
participants and the varying judgments reached by such participants when assessing volatile markets have increased
the likelihood that the various parties to these instruments may arrive at significantly different estimates as to their
fair values.
Our valuation methodologies for the super senior credit default swap portfolio have evolved over time in response to
market conditions and the availability of market observable information. We have sought to calibrate the
methodologies to available market information and to review the assumptions of the methodologies on a regular
basis.
In the case of credit default swaps written to facilitate regulatory capital relief, we
estimate the fair value of these derivatives by considering observable market transactions. The transactions with the
most observability are the early terminations of these transactions by counterparties. We continue to reassess the
expected maturity of the portfolio. There has been no requirement to make any payments as part of terminations of
super senior regulatory capital CDSs initiated by counterparties. In assessing the fair value of the regulatory capital
CDS transactions, we also consider other market data, to the extent relevant and available.
We use a modified version of the Binomial Expansion Technique (BET) model to
value our credit default swap portfolio written on super senior tranches of multi-sector CDOs of ABS. The BET model
was developed in 1996 by a major rating agency to generate expected loss estimates for CDO tranches and derive a
credit rating for those tranches, and remains widely used.
We have adapted the BET model to estimate the price of the super senior risk layer or tranche of the CDO. We
modified the BET model to imply default probabilities from market prices for the underlying securities and not from
rating agency assumptions. To generate the estimate, the model uses the price estimates for the securities
comprising the portfolio of a CDO as an input and converts those estimates to credit spreads over current LIBOR-
based interest rates. These credit spreads are used to determine implied probabilities of default and expected losses
..................................................................................................................................................................................................................................
AIG 2012 Form 10-K 237
Regulatory capital portfolio:
Multi-sector CDO portfolios:
I T E M 8 / N O T E 6 . F A I R V A L U E M E A S U R E M E N T S

.....................................................................................................................................................................................
on the underlying securities. This data is then aggregated and used to estimate the expected cash flows of the super
senior tranche of the CDO.
Prices for the individual securities held by a CDO are obtained in most cases from the CDO collateral managers, to
the extent available. CDO collateral managers provided market prices for 59 percent of the underlying securities used
in the valuation at December 31, 2012. When a price for an individual security is not provided by a CDO collateral
manager, we derive the price through a pricing matrix using prices from CDO collateral managers for similar
securities. Matrix pricing is a mathematical technique used principally to value debt securities without relying
exclusively on quoted prices for the specific securities, but rather by relying on the relationship of the security to
other benchmark quoted securities. Substantially all of the CDO collateral managers who provided prices used dealer
prices for all or part of the underlying securities, in some cases supplemented by third-party pricing services.
The BET model also uses diversity scores, weighted average lives, recovery rates and discount rates. We employ a
Monte Carlo simulation to assist in quantifying the effect on the valuation of the CDO of the unique aspects of the
CDO’s structure such as triggers that divert cash flows to the most senior part of the capital structure. The Monte
Carlo simulation is used to determine whether an underlying security defaults in a given simulation scenario and, if it
does, the security’s implied random default time and expected loss. This information is used to project cash flow
streams and to determine the expected losses of the portfolio.
In addition to calculating an estimate of the fair value of the super senior CDO security referenced in the credit
default swaps using our internal model, we also consider the price estimates for the super senior CDO securities
provided by third parties, including counterparties to these transactions, to validate the results of the model and to
determine the best available estimate of fair value. In determining the fair value of the super senior CDO security
referenced in the credit default swaps, we use a consistent process that considers all available pricing data points
and eliminates the use of outlying data points. When pricing data points are within a reasonable range an averaging
technique is applied.
In the case of credit default swaps written on
portfolios of investment-grade corporate debt, we use a mathematical model that produces results that are closely
aligned with prices received from third parties. This methodology uses the current market credit spreads of the
names in the portfolios along with the base correlations implied by the current market prices of comparable tranches
of the relevant market traded credit indices as inputs.
We estimate the fair value of our obligations resulting from credit default swaps written on CLOs to be equivalent to
the par value less the current market value of the referenced obligation. Accordingly, the value is determined by
obtaining third-party quotations on the underlying super senior tranches referenced under the credit default swap
contract.
Policyholder Contract Deposits..............................................................................................................................................................................................
Policyholder contract deposits accounted for at fair value are measured using an earnings approach by taking into
consideration the following factors:
• Current policyholder account values and related surrender charges;
• The present value of estimated future cash inflows (policy fees) and outflows (benefits and maintenance expenses)
associated with the product using risk neutral valuations, incorporating expectations about policyholder behavior,
market returns and other factors; and
• A risk margin that market participants would require for a market return and the uncertainty inherent in the model
inputs.
The change in fair value of these policyholder contract deposits is recorded as Policyholder benefits and claims
incurred in the Consolidated Statement of Operations.
..................................................................................................................................................................................................................................
AIG 2012 Form 10-K238
Corporate debt/Collateralized loan obligation (CLO) portfolios:
I T E M 8 / N O T E 6 . F A I R V A L U E M E A S U R E M E N T S

.....................................................................................................................................................................................
Long-Term Debt..............................................................................................................................................................................................
The fair value of non-structured liabilities is generally determined by using market prices from exchange or dealer
markets, when available, or discounting expected cash flows using the appropriate discount rate for the applicable
maturity. We determine the fair value of structured liabilities and hybrid financial instruments (where performance is
linked to structured interest rates, inflation or currency risks) using the appropriate derivative valuation methodology
(described above) given the nature of the embedded risk profile. In addition, adjustments are made to the valuations
of both non-structured and structured liabilities to reflect our own creditworthiness based on the methodology
described under the caption ‘‘Incorporation of Credit Risk in Fair Value Measurements – Our Own Credit Risk’’
above.
Borrowings under obligations of Guaranteed Investment Agreements (GIAs), which are guaranteed by us, are
recorded at fair value using discounted cash flow calculations based on interest rates currently being offered for
similar contracts and our current market observable implicit credit spread rates with maturities consistent with those
remaining for the contracts being valued. Obligations may be called at various times prior to maturity at the option of
the counterparty. Interest rates on these borrowings are primarily fixed, vary by maturity and range up to 9.8 percent.
Other Liabilities..............................................................................................................................................................................................
Other liabilities measured at fair value include certain securities sold under agreements to repurchase and certain
securities and spot commodities sold but not yet purchased. Liabilities arising from securities sold under agreements
to repurchase are generally treated as collateralized borrowings. We estimate the fair value of liabilities arising under
these agreements by using market-observable interest rates. This methodology considers such factors as the coupon
rate, yield curves and other relevant factors. Fair values for securities sold but not yet purchased are based on
current market prices. Fair values of spot commodities sold but not yet purchased are based on current market
prices of reference spot futures contracts traded on exchanges.
..................................................................................................................................................................................................................................
AIG 2012 Form 10-K 239
I T E M 8 / N O T E 6 . F A I R V A L U E M E A S U R E M E N T S

.....................................................................................................................................................................................
Assets and Liabilities Measured at Fair Value on a Recurring Basis..............................................................................................................................................................................................
The following table presents information about assets and liabilities measured at fair value on a recurring
basis and indicates the level of the fair value measurement based on the observability of the inputs used:
Assets:Bonds available for sale:
U.S. government and government sponsored entitiesObligations of states, municipalities and political subdivisionsNon-U.S. governmentsCorporate debtRMBSCMBSCDO/ABS
Total bonds available for sale
Bond trading securities:U.S. government and government sponsored entitiesObligations of states, municipalities and political subdivisionsNon-U.S. governmentsCorporate debtRMBSCMBSCDO/ABS
Total bond trading securities
Equity securities available for sale:Common stockPreferred stockMutual funds
Total equity securities available for sale
Equity securities tradingMortgage and other loans receivableOther invested assetsDerivative assets:
Interest rate contractsForeign exchange contractsEquity contractsCommodity contractsCredit contractsOther contractsCounterparty netting and cash collateral
Total derivative assets )
Short-term investmentsSeparate account assetsOther assets
Total
Liabilities:Policyholder contract depositsDerivative liabilities:
Interest rate contractsForeign exchange contractsEquity contractsCommodity contractsCredit contracts(d)
Other contractsCounterparty netting and cash collateral
Total derivative liabilities
Long-term debt(e)
Other liabilities
Total
..................................................................................................................................................................................................................................
AIG 2012 Form 10-K240
December 31, 2012 Counterparty Cash(in millions) Level 1 Level 2 Level 3 Netting(a) Collateral(b) Total
$ – $ 3,483 $ – $ – $ – $ 3,483– 34,681 1,024 – – 35,705
1,004 25,782 14 – – 26,800– 149,625 1,487 – – 151,112– 22,730 11,662 – – 34,392– 5,010 5,124 – – 10,134– 3,492 4,841 – – 8,333
1,004 244,803 24,152 – – 269,959
266 6,528 – – – 6,794– – – – – –– 2 – – – 2– 1,320 – – – 1,320– 1,331 396 – – 1,727– 1,424 812 – – 2,236– 3,969 8,536 – – 12,505
266 14,574 9,744 – – 24,584
3,002 3 24 – – 3,029– 34 44 – – 78
83 22 – – – 105
3,085 59 68 – – 3,212
578 84 – – – 662– 134 – – – 134
125 1,542 5,389 – – 7,056
2 5,521 956 – – 6,479– 104 – – – 104
104 63 54 – – 221– 144 1 – – 145– – 60 – – 60– – 38 – – 38– – – (2,467) (909) (3,376)
106 5,832 1,109 (2,467) (909 3,671
285 7,771 – – – 8,05654,430 2,907 – – – 57,337
– 696 – – – 696
$ 59,879 $ 278,402 $ 40,462 $ (2,467) $ (909) $ 375,367
$ – $ – $ 1,257 $ – $ – $ 1,257
– 5,582 224 – – 5,806– 174 – – – 174– 114 7 – – 121– 146 – – – 146– – 2,051 – – 2,051– 6 200 – – 206– – – (2,467) (1,976) (4,443)
– 6,022 2,482 (2,467) (1,976) 4,061
– 7,711 344 – – 8,05530 1,050 – – – 1,080
$ 30 $ 14,783 $ 4,083 $ (2,467) $ (1,976) $ 14,453
I T E M 8 / N O T E 6 . F A I R V A L U E M E A S U R E M E N T S

.....................................................................................................................................................................................
Assets:Bonds available for sale:
U.S. government and government sponsored entities $ 174 $ 5,904 $ – $ – $ – $ 6,078Obligations of states, municipalities and political subdivisions – 36,538 960 – – 37,498Non-U.S. governments 259 25,467 9 – – 25,735Corporate debt – 142,883 1,935 – – 144,818RMBS – 23,727 10,877 – – 34,604CMBS – 3,991 3,955 – – 7,946CDO/ABS – 3,082 4,220 – – 7,302
Total bonds available for sale 433 241,592 21,956 – – 263,981
Bond trading securities:U.S. government and government sponsored entities 100 6,362 – – – 6,462Obligations of states, municipalities and political subdivisions – 257 – – – 257Non-U.S. governments – 35 – – – 35Corporate debt – 809 7 – – 816RMBS – 1,345 303 – – 1,648CMBS – 1,283 554 – – 1,837CDO/ABS – 4,877 8,432 – – 13,309
Total bond trading securities 100 14,968 9,296 – – 24,364
Equity securities available for sale:Common stock 3,294 70 57 – – 3,421Preferred stock – 44 99 – – 143Mutual funds 55 5 – – – 60
Total equity securities available for sale 3,349 119 156 – – 3,624
Equity securities trading 43 82 – – – 125Mortgage and other loans receivable – 106 1 – – 107Other invested assets(c) 12,549 1,709 6,618 – – 20,876Derivative assets:
Interest rate contracts 2 7,251 1,033 – – 8,286Foreign exchange contracts – 143 2 – – 145Equity contracts 92 133 38 – – 263Commodity contracts – 134 2 – – 136Credit contracts – – 89 – – 89Other contracts 29 462 250 – – 741Counterparty netting and cash collateral – – – (3,660) (1,501) (5,161)
Total derivative assets 123 8,123 1,414 (3,660) (1,501) 4,499
Short-term investments 2,309 3,604 – – – 5,913Separate account assets 48,502 2,886 – – – 51,388
Total $ 67,408 $ 273,189 $ 39,441 $ (3,660) $ (1,501) $ 374,877
Liabilities:Policyholder contract deposits $ – $ – $ 918 $ – $ – $ 918Derivative liabilities:
Interest rate contracts – 6,661 248 – – 6,909Foreign exchange contracts – 178 – – – 178Equity contracts – 198 10 – – 208Commodity contracts – 146 – – – 146Credit contracts(d) – 4 3,362 – – 3,366Other contracts – 155 217 – – 372Counterparty netting and cash collateral – – – (3,660) (2,786) (6,446)
Total derivative liabilities – 7,342 3,837 (3,660) (2,786) 4,733
Long-term debt(e) – 10,258 508 – – 10,766Other liabilities 193 714 – – – 907
Total $ 193 $ 18,314 $ 5,263 $ (3,660) $ (2,786) $ 17,324
(a) Represents netting of derivative exposures covered by a qualifying master netting agreement.
(b) Represents cash collateral posted and received. Securities collateral posted for derivative transactions that is reflected in Fixed maturitysecurities in the Consolidated Balance Sheet, and collateral received, not reflected in the Consolidated Balance Sheet, were $1.9 billion and$299 million, respectively, at December 31, 2012 and $1.8 billion and $100 million, respectively, at December 31, 2011.
(c) Level 1 Other invested assets included $12.4 billion at December 31, 2011 of AIA ordinary shares publicly traded on the Hong Kong StockExchange.
(d) Level 3 Credit contracts included the fair value derivative liability on the super senior credit default swap portfolio of $2.0 billion and $3.2 billionat December 31, 2012 and 2011, respectively.
(e) Includes Guaranteed Investment Agreements (GIAs), notes, bonds, loans and mortgages payable.
..................................................................................................................................................................................................................................
AIG 2012 Form 10-K 241
December 31, 2011 Counterparty Cash(in millions) Level 1 Level 2 Level 3 Netting(a) Collateral(b) Total
I T E M 8 / N O T E 6 . F A I R V A L U E M E A S U R E M E N T S

.....................................................................................................................................................................................
Transfers of Level 1 and Level 2 Assets and Liabilities..............................................................................................................................................................................................
Our policy is to record transfers of assets and liabilities between Level 1 and Level 2 at their fair values as of the
end of each reporting period, consistent with the date of the determination of fair value. Assets are transferred out of
Level 1 when they are no longer transacted with sufficient frequency and volume in an active market. Conversely,
assets are transferred from Level 2 to Level 1 when transaction volume and frequency are indicative of an active
market. During the year ended December 31, 2012, we transferred $464 million of securities issued by Non-U.S.
government entities from Level 1 to Level 2, as they are no longer considered actively traded. For similar reasons,
during the year ended December 31, 2012, we transferred $888 million of securities issued by the U.S. government
and government-sponsored entities from Level 1 to Level 2. We had no material transfers from Level 2 to Level 1
during the year ended December 31, 2012.
Changes in Level 3 Recurring Fair Value Measurements..............................................................................................................................................................................................
The following tables present changes during December 31, 2012 and 2011 in Level 3 assets and liabilities
measured at fair value on a recurring basis, and the realized and unrealized gains (losses) related to the
Level 3 assets and liabilities in the Consolidated Balance Sheet at December 31, 2012 and 2011:
December 31, 2012Assets:
Bonds available for sale:Obligations of states,
municipalities and politicalsubdivisions
Non-U.S. governmentsCorporate debtRMBSCMBSCDO/ABS
Total bonds available for sale
Bond trading securities:Corporate debtRMBSCMBSCDO/ABS
Total bond trading securities
Equity securities available forsale:Common stockPreferred stock
Total equity securities availablefor sale
Mortgage and other loansreceivable
Other invested assets
Total
Liabilities:Policyholder contract depositsDerivative liabilities, net:
Interest rate contractsForeign exchange contractsEquity contractsCommodity contractsCredit contractsOther contracts
Total derivative liabilities, net
Long-term debt(b)
Total
..................................................................................................................................................................................................................................
AIG 2012 Form 10-K242
Net Changes inRealized and Unrealized Gains
Unrealized Accumulated Purchases, (Losses) IncludedFair value Gains (Losses) Other Sales, Gross Gross Fair value in Income onBeginning Included Comprehensive Issues and Transfers Transfers End Instruments Held
(in millions) of Year(a) in Income Income (Loss) Settlements, Net in out of Year at End of Year
$ 960 $ 48 $ 12 $ 84 $ 70 $ (150) $ 1,024 $ –9 1 (1) 1 4 – 14 –
1,935 (44) 145 24 664 (1,237) 1,487 –10,877 522 2,121 (316) 952 (2,494) 11,662 –
3,955 (135) 786 636 44 (162) 5,124 –4,220 334 289 10 691 (703) 4,841 –
21,956 726 3,352 439 2,425 (4,746) 24,152 –
7 – – (7) – – – –303 76 2 (109) 128 (4) 396 42554 70 2 (159) 446 (101) 812 87
8,432 3,683 3 (3,968) 386 – 8,536 2,547
9,296 3,829 7 (4,243) 960 (105) 9,744 2,676
57 22 (28) (33) 6 – 24 –99 17 (35) (36) 11 (12) 44 –
156 39 (63) (69) 17 (12) 68 –
1 – – (1) – – – –6,618 (95) 290 (257) 1,204 (2,371) 5,389 –
$ 38,027 $ 4,499 $ 3,586 $ (4,131) $ 4,606 $ (7,234) $ 39,353 $ 2,676
$ (918) $ (275) $ (72) $ 8 $ – $ – $ (1,257) $ 112
785 (11) – (42) – – 732 562 – – (2) – – – –
28 10 – 12 (3) – 47 (10)2 5 – (6) – – 1 (6)
(3,273) 638 – 644 – – (1,991) (1,172)33 (76) (18) 15 (116) – (162) 46
(2,423) 566 (18) 621 (119) – (1,373) (1,086)
(508) (411) (77) 242 (14) 424 (344) 105
$ (3,849) $ (120) $ (167) $ 871 $ (133) $ 424 $ (2,974) $ (869)
I T E M 8 / N O T E 6 . F A I R V A L U E M E A S U R E M E N T S

.....................................................................................................................................................................................
December 31, 2011Assets:
Bonds available for sale:Obligations of states, municipalities
and political subdivisions $ 609 $ 2 $ 112 $ 296 $ 17 $ (76) $ 960 $ –Non-U.S. governments 5 – – 5 – (1) 9 –Corporate debt 2,262 11 (25) 171 2,480 (2,964) 1,935 –RMBS 6,367 (50) 288 3,232 1,093 (53) 10,877 –CMBS 3,604 (100) 239 207 134 (129) 3,955 –CDO/ABS 4,241 73 142 (432) 852 (656) 4,220 –
Total bonds available for sale 17,088 (64) 756 3,479 4,576 (3,879) 21,956 –
Bond trading securities:Corporate debt – – – (11) 18 – 7 1RMBS 91 (27) – 239 – – 303 (28)CMBS 506 92 – (95) 292 (241) 554 87CDO/ABS 9,431 (660) – (323) 48 (64) 8,432 (677)
Total bond trading securities 10,028 (595) – (190) 358 (305) 9,296 (617)
Equity securities available for sale:Common stock 61 28 (4) (40) 18 (6) 57 –Preferred stock 64 (1) 32 (1) 5 – 99 –Mutual funds – – – (6) 6 – – –
Total equity securities available for sale 125 27 28 (47) 29 (6) 156 –
Equity securities trading 1 – – (1) – – – –Mortgage and other loans receivable – – – 1 – – 1 –Other invested assets 7,414 (10) 139 (739) 251 (437) 6,618 2
Total $ 34,656 $ (642) $ 923 $ 2,503 $ 5,214 $ (4,627) $ 38,027 $ (615)
Liabilities:Policyholder contract deposits $ (445) $ (429) $ – $ (44) $ – $ – $ (918) $ 508Derivative liabilities, net:
Interest rate contracts 732 46 – (2) 30 (21) 785 (90)Foreign exchange contracts 16 (11) – (5) 2 – 2 1Equity contracts 22 (16) – 41 (7) (12) 28 (15)Commodity contracts 23 1 – (22) – – 2 (1)Credit contracts (3,798) 332 – 193 – – (3,273) 493Other contracts (112) (14) (51) 74 (30) 166 33 (98)
Total derivatives liabilities, net (3,117) 338 (51) 279 (5) 133 (2,423) 290
Long-term debt(b) (982) (60) – 555 (21) – (508) (135)
Total $ (4,544) $ (151) $ (51) $ 790 $ (26) $ 133 $ (3,849) $ 663
(a) Total Level 3 derivative exposures have been netted in these tables for presentation purposes only.
(b) Includes GIAs, notes, bonds, loans and mortgages payable.
Net realized and unrealized gains and losses related to Level 3 items shown above are reported in theConsolidated Statement of Operations as follows:
December 31, 2012Bonds available for saleBond trading securitiesEquity securitiesOther invested assetsPolicyholder contract depositsDerivative liabilities, netOther long-term debt
December 31, 2011Bonds available for sale $ 638 $ (717) $ 15 $ (64)Bond trading securities (634) 4 35 (595)Equity securities – 27 – 27Other invested assets 23 (84) 51 (10)Policyholder contract deposits – (499) 70 (429)Derivative liabilities, net 2 13 323 338Other long-term debt – – (60) (60)
..................................................................................................................................................................................................................................
AIG 2012 Form 10-K 243
Net Changes inRealized and Unrealized Gains
Fair Unrealized Accumulated Purchases, (Losses) Includedvalue Gains (Losses) Other Sales, Gross Gross Fair value in Income on
Beginning Included Comprehensive Issues and Transfers Transfers End Instruments Held(in millions) of Year(a) in Income Income (Loss) Settlements, Net In Out of Year at End of Year
Net Net RealizedInvestment Capital Other
(in millions) Income Gains (Losses) Income Total
$ 906 $ (395) $ 215 $ 7263,303 – 526 3,829
– 39 – 3954 (210) 61 (95)
– (275) – (275)3 26 537 566– – (411) (411)
I T E M 8 / N O T E 6 . F A I R V A L U E M E A S U R E M E N T S

.....................................................................................................................................................................................
The following table presents the gross components of purchases, sales, issues and settlements, net, shown
above:
December 31, 2012Assets:
Bonds available for sale:Obligations of states, municipalities and political subdivisionsNon-U.S. governmentsCorporate debtRMBSCMBSCDO/ABS
Total bonds available for sale
Bond trading securities:Corporate debtRMBSCMBSCDO/ABS(b)
Total bond trading securities
Equity securitiesMortgage and other loans receivableOther invested assets
Total assets
Liabilities:Policyholder contract depositsDerivative liabilities, netOther long-term debt(c)
Total liabilities
December 31, 2011Assets:
Bonds available for sale:Obligations of states, municipalities and political subdivisions $ 305 $ (4) $ (5) $ 296Non-U.S. governments 4 (2) 3 5Corporate debt 497 (27) (299) 171RMBS 4,932 (205) (1,495) 3,232CMBS 470 (34) (229) 207CDO/ABS 1,067 (1) (1,498) (432)
Total bonds available for sale 7,275 (273) (3,523) 3,479
Bond trading securities:Corporate debt – – (11) (11)RMBS 305 (1) (65) 239CMBS 221 (207) (109) (95)CDO/ABS 331 (304) (350) (323)
Total bond trading securities 857 (512) (535) (190)
Equity securities – (31) (17) (48)Mortgage and other loans receivable – – 1 1Other invested assets 718 (296) (1,161) (739)
Total assets $ 8,850 $ (1,112) $ (5,235) $ 2,503
Liabilities:Policyholder contract deposits $ – $ (70) $ 26 $ (44)Derivative liabilities, net 43 – 236 279Other long-term debt(c) – – 555 555
Total liabilities $ 43 $ (70) $ 817 $ 790
(a) There were no issuances during year ended December 31, 2012.
(b) Includes $7.1 billion of securities purchased through the FRBNY’s auction of ML III assets.
(c) Includes GIAs, notes, bonds, loans and mortgages payable.
Both observable and unobservable inputs may be used to determine the fair values of positions classified in Level 3
in the tables above. As a result, the unrealized gains (losses) on instruments held at December 31, 2012 and 2011
may include changes in fair value that were attributable to both observable (e.g., changes in market interest rates)
and unobservable inputs (e.g., changes in unobservable long-dated volatilities).
..................................................................................................................................................................................................................................
AIG 2012 Form 10-K244
Purchases, Sales,Issues and
(in millions) Purchases Sales Settlements Settlements, Net(a)
$ 477 $ (219) $ (174) $ 845 (3) (1) 1
283 (75) (184) 242,308 (723) (1,901) (316)1,137 (318) (183) 6361,120 (4) (1,106) 10
5,330 (1,342) (3,549) 439
– – (7) (7)– (45) (64) (109)
225 (106) (278) (159)7,382 (21) (11,329) (3,968)
7,607 (172) (11,678) (4,243)
67 (56) (80) (69)– – (1) (1)
900 (100) (1,057) (257)
$ 13,904 $ (1,670) $ (16,365) $ (4,131)
$ – $ (25) $ 33 $ 811 (2) 612 621– – 242 242
$ 11 $ (27) $ 887 $ 871
I T E M 8 / N O T E 6 . F A I R V A L U E M E A S U R E M E N T S

.....................................................................................................................................................................................
Transfers of Level 3 Assets and Liabilities..............................................................................................................................................................................................
We record transfers of assets and liabilities into or out of Level 3 at their fair values as of the end of each reporting
period, consistent with the date of the determination of fair value. As a result, the Net realized and unrealized gains
(losses) included in income or other comprehensive income and as shown in the table above excludes $143 million
of net losses related to assets and liabilities transferred into Level 3 during 2012, and includes $92 million of net
gains related to assets and liabilities transferred out of Level 3 during 2012.
Transfers of Level 3 Assets
During the year ended December 31, 2012, transfers into Level 3 assets included certain RMBS, CMBS, CDO/ABS,
private placement corporate debt and certain private equity funds and hedge funds. Transfers of certain RMBS and
certain CDO/ABS into Level 3 assets were related to decreased observations of market transactions and price
information for those securities. The transfers of investments in certain other RMBS and CMBS into Level 3 assets
were due to a decrease in market transparency, downward credit migration and an overall increase in price disparity
for certain individual security types. Transfers of private placement corporate debt and certain other ABS into Level 3
assets were primarily the result of limited market pricing information that required us to determine fair value for these
securities based on inputs that are adjusted to better reflect our own assumptions regarding the characteristics of a
specific security or associated market liquidity. Certain private equity fund and hedge fund investments were also
transferred into Level 3 due to these investments being carried at fair value and no longer being accounted for using
the equity method of accounting, consistent with the changes to our ownership and the lack of ability to exercise
more than minor influence over the respective investments. Other hedge fund investments were transferred into
Level 3 as a result of limited market activity due to fund-imposed redemption restrictions.
Assets are transferred out of Level 3 when circumstances change such that significant inputs can be corroborated
with market observable data. This may be due to a significant increase in market activity for the asset, a specific
event, one or more significant input(s) becoming observable or a long-term interest rate significant to a valuation
becoming short-term and thus observable. In addition, transfers out of Level 3 assets also occur when investments
are no longer carried at fair value as the result of a change in the applicable accounting methodology, given changes
in the nature and extent of our ownership interest. During the year ended December 31, 2012, transfers out of
Level 3 assets primarily related to certain RMBS, CMBS, ABS, investments in private placement corporate debt and
private equity funds and hedge funds. Transfers of certain RMBS out of Level 3 assets were based on consideration
of the market liquidity as well as related transparency of pricing and associated observable inputs for these
investments. Transfers of investments in certain CMBS out of Level 3 were due to an increase in market
transparency, positive credit migration and an overall improvement in price comparability for certain individual security
types. Transfers of ABS and private placement corporate debt out of Level 3 assets were primarily the result of using
observable pricing information that reflects the fair value of those securities without the need for adjustment based on
our own assumptions regarding the characteristics of a specific security or the current liquidity in the market. The
removal of fund-imposed redemption restrictions, as well as certain fund investments becoming subject to the equity
method of accounting based on our level of influence over the respective investments, resulted in the transfer of
certain hedge fund and private equity fund investments out of Level 3.
Transfers of Level 3 Liabilities
Because we present carrying values of our derivative positions on a net basis in the table above, transfers into
Level 3 liabilities for the year ended December 31, 2012 primarily related to certain derivative assets transferred out
of Level 3 because of the presence of observable inputs on certain forward commitments and options. During the
year ended December 31, 2012, certain notes payable were transferred out of Level 3 liabilities because input
parameters for the pricing of these liabilities became more observable as a result of market movements and portfolio
aging. There were no significant transfers of derivative liabilities out of Level 3 for the year ended December 31,
2012.
We use various hedging techniques to manage risks associated with certain positions, including those classified
within Level 3. Such techniques may include the purchase or sale of financial instruments that are classified within
Level 1 and/or Level 2. As a result, the realized and unrealized gains (losses) for assets and liabilities classified
within Level 3 presented in the table above do not reflect the related realized or unrealized gains (losses) on hedging
instruments that are classified within Level 1 and/or Level 2.
..................................................................................................................................................................................................................................
AIG 2012 Form 10-K 245
I T E M 8 / N O T E 6 . F A I R V A L U E M E A S U R E M E N T S

.....................................................................................................................................................................................
Quantitative Information about Level 3 Fair Value Measurements..............................................................................................................................................................................................
The table below presents information about the significant unobservable inputs used for recurring fair value
measurements for certain Level 3 instruments, and includes only those instruments for which information
about the inputs is reasonably available to us, such as data from pricing vendors and from internal valuation
models. Because input information with respect to certain Level 3 instruments may not be reasonably
available to us, balances shown below may not equal total amounts reported for such Level 3 assets and
liabilities:
Assets:
Corporate debt Discounted cash flow Yield(b) 0.08% - 6.55% (3.31%)
RMBS Discounted cash flow Constant prepayment rate(c) 0.00% - 10.76% (5.03%)
Loss severity(c) 43.70% - 78.72% (61.21%)
Constant default rate(c) 4.21% - 13.30% (8.75%)
Yield(c) 2.23% - 9.42% (5.82%)
Certain CDO/ABS(d) Discounted cash flow Constant prepayment rate(c) 0.00% - 32.25% (11.82%)
Loss severity(c) 0.00% - 29.38% (6.36%)
Constant default rate(c) 0.00% - 4.05% (1.18%)
Yield(c) 5.41% - 10.67% (8.04%)
Commercial mortgage backed securities Discounted cash flow Yield(b) 0.00% - 19.95% (7.76%)
CDO/ABS – Direct Binomial Expansion Recovery rate(b) 3% - 63% (27%)
Investment Book Technique (BET) Diversity score(b) 4 - 44 (13)
Weighted average life(b) 1.27 - 9.11 years (4.91 years)
Liabilities:
Policyholder contract deposits – GMWB Discounted cash flow Equity implied volatility(b) 6.0% - 39.0%
Base lapse rates(b) 1.00% - 40.0%
Dynamic lapse rates(b) 0.2% - 60.0%
Mortality rates(b) 0.5% - 40.0%
Utilization rates(b) 0.5% - 25.0%
Derivative Liabilities – Credit contracts BET Recovery rates(b) 3% - 37% (17%)
Diversity score(b) 9 - 38 (14)
Weighted average life(b) 5.10 - 8.45 years (5.75 years)
(a) The unobservable inputs and ranges for the constant prepayment rate, loss severity and constant default rate relate to each of the individual
underlying mortgage loans that comprise the entire portfolio of securities in the RMBS and CDO securitization vehicles and not necessarily to the
securitization vehicle bonds (tranches) purchased by us. The ranges of these inputs do not directly correlate to changes in the fair values of the
tranches purchased by us because there are other factors relevant to the specific tranches owned by us including, but not limited to, purchase price,
position in the waterfall, senior versus subordinated position and attachment points.
(b) Represents discount rates, estimates and assumptions that we believe would be used by market participants when valuing these assets and
liabilities.
(c) Information received from independent third-party valuation service providers.
(d) Yield was the only input available for $6.6 billion of total fair value at December 31, 2012.
The ranges of reported inputs for Corporate debt, RMBS, CDO/ABS, and CMBS valued using a discounted cash flow
technique consist of plus/minus one standard deviation in either direction from the value-weighted average. The
preceding table does not give effect to our risk management practices that might offset risks inherent in these
investments.
..................................................................................................................................................................................................................................
AIG 2012 Form 10-K246
Fair Value at
December 31, Valuation Range(in millions) 2012 Technique Unobservable Input(a) (Weighted Average)(a)
$ 775
10,650
7,844
3,251
1,205
1,257
1,436
I T E M 8 / N O T E 6 . F A I R V A L U E M E A S U R E M E N T S

.....................................................................................................................................................................................
Sensitivity to Changes in Unobservable Inputs..............................................................................................................................................................................................
We consider unobservable inputs to be those for which market data is not available and that are developed using the
best information available to us about the assumptions that market participants would use when pricing the asset or
liability. Relevant inputs vary depending on the nature of the instrument being measured at fair value. The following
is a general description of sensitivities of significant unobservable inputs along with interrelationships between and
among the significant unobservable inputs and their impact on the fair value measurements. The effect of a change
in a particular assumption in the sensitivity analysis below is considered independently of changes in any other
assumptions. In practice, simultaneous changes in assumptions may not always have a linear effect on the inputs
discussed below. Interrelationships may also exist between observable and unobservable inputs. Such relationships
have not been included in the discussion below. For each of the individual relationships described below, the inverse
relationship would also generally apply.
Corporate Debt..............................................................................................................................................................................................
Corporate debt securities included in Level 3 are primarily private placement issuances that are not traded in active
markets or that are subject to transfer restrictions. Fair value measurements consider illiquidity and
non-transferability. When observable price quotations are not available, fair value is determined based on discounted
cash flow models using discount rates based on credit spreads, yields or price levels of publicly-traded debt of the
issuer or other comparable securities, considering illiquidity and structure. The significant unobservable input used in
the fair value measurement of corporate debt is the yield. The yield is affected by the market movements in credit
spreads and U.S. Treasury yields. In addition, the migration in credit quality of a given security generally has a
corresponding effect on the fair value measurement of the securities. For example, a downward migration of credit
quality would increase spreads. Holding U.S. Treasury rates constant, an increase in corporate credit spreads would
decrease the fair value of corporate debt.
RMBS and Certain CDO/ABS..............................................................................................................................................................................................
The significant unobservable inputs used in fair value measurements of RMBS and certain CDO/ABS valued by third-
party valuation service providers are constant prepayment rates (CPR), constant default rates (CDR), loss severity,
and yield. A change in the assumptions used for the probability of default will generally be accompanied by a
corresponding change in the assumption used for the loss severity and an inverse change in the assumption used for
prepayment rates. In general, increases in yield, CPR, CDR, and loss severity, in isolation, would result in a
decrease in the fair value measurement. Changes in fair value based on variations in assumptions generally cannot
be extrapolated because the relationship between the directional change of each input is not usually linear.
CMBS..............................................................................................................................................................................................
The significant unobservable input used in fair value measurements for CMBS is the yield. Prepayment assumptions
for each mortgage pool are factored into the yield. CMBS generally feature a lower degree of prepayment risk than
RMBS because commercial mortgages generally contain a penalty for prepayment. In general, increases in the yield
would decrease the fair value of CMBS.
CDO/ABS – Direct Investment book..............................................................................................................................................................................................
The significant unobservable inputs used for certain CDO/ABS securities valued using the BET are recovery rates,
diversity score, and the weighted average life of the portfolio. An increase in recovery rates and diversity score will
have a directionally similar corresponding impact on the fair value of the portfolio. An increase in the weighted
average life will decrease the fair value.
Policyholder contract deposits..............................................................................................................................................................................................
The significant unobservable inputs used for embedded derivatives in policyholder contract deposits measured at fair
value, mainly guaranteed minimum withdrawal benefits (GMWB) for variable annuity products, are equity volatility,
mortality rates, lapse rates and utilization rates. Mortality, lapse and utilization rates may vary significantly depending
..................................................................................................................................................................................................................................
AIG 2012 Form 10-K 247
I T E M 8 / N O T E 6 . F A I R V A L U E M E A S U R E M E N T S

.....................................................................................................................................................................................
upon age groups and duration. In general, increases in volatility and utilization rates will increase the fair value, while
increases in lapse rates and mortality rates will decrease the fair value of the liability associated with the GMWB.
Derivative liabilities – credit contracts..............................................................................................................................................................................................
The significant unobservable inputs used for Derivatives liabilities – credit contracts are recovery rates, diversity
scores, and the weighted average life of the portfolio. AIG non-performance risk is also considered in the
measurement of the liability.
An increase in recovery rates and diversity score will decrease the fair value of the liability. An increase in the
weighted average life will have a directionally similar corresponding effect on the fair value measurement of the
liability.
Investments in Certain Entities Carried at Fair Value Using Net Asset Value per Share..............................................................................................................................................................................................
The following table includes information related to our investments in certain other invested assets,
including private equity funds, hedge funds and other alternative investments that calculate net asset value
per share (or its equivalent). For these investments, which are measured at fair value on a recurring basis,
we use the net asset value per share as a practical expedient to measure fair value.
Investment Category
Private equity funds:Leveraged buyout Debt and/or equity investments made as part of a
transaction in which assets of mature companiesare acquired from the current shareholders,typically with the use of financial leverage $ 3,185 $ 945
Non-U.S. Investments that focus primarily on Asian andEuropean based buyouts, expansion capital,special situations, turnarounds, venture capital,mezzanine and distressed opportunities strategies 165 57
Venture capital Early-stage, high-potential, growth companiesexpected to generate a return through an eventualrealization event, such as an initial public offeringor sale of the company 316 39
Distressed Securities of companies that are already indefault, under bankruptcy protection, or troubled 182 42
Other Real estate, energy, multi-strategy, mezzanine,and industry-focused strategies 252 98
Total private equityfunds 4,100 1,181
Hedge funds:Event-driven Securities of companies undergoing material
structural changes, including mergers, acquisitionsand other reorganizations 774 2
Long-short Securities that the manager believes areundervalued, with corresponding short positions tohedge market risk 927 –
Macro Investments that take long and short positions infinancial instruments based on a top-down view ofcertain economic and capital market conditions 173 –
Distressed Securities of companies that are already indefault, under bankruptcy protection or troubled 272 10
Other Non-U.S. companies, futures and commodities,relative value, and multi-strategy and industry-focused strategies 627 –
Total hedge funds 2,773 12
Total $ 6,873 $ 1,193
..................................................................................................................................................................................................................................
AIG 2012 Form 10-K248
December 31, 2012 December 31, 2011
Fair Value Using Fair Value Using
Net Asset Value Net Asset Value
Per Share Unfunded Per Share Unfunded
(in millions) Investment Category Includes (or its equivalent) Commitments (or its equivalent) Commitments
$ 2,549 $ 659
179 25
163 16
87 21
255 152
3,233 873
747 2
1,091 –
238 –
316 –
416 –
2,808 2
$ 6,041 $ 875
I T E M 8 / N O T E 6 . F A I R V A L U E M E A S U R E M E N T S

.....................................................................................................................................................................................
Private equity fund investments included above are not redeemable, as distributions from the funds will be received
when underlying investments of the funds are liquidated. Private equity funds are generally expected to have 10-year
lives at their inception, but these lives may be extended at the fund manager’s discretion, typically in one or two-year
increments. At December 31, 2012, assuming average original expected lives of 10 years for the funds, 41 percent of
the total fair value using net asset value or its equivalent above would have expected remaining lives of less than
three years, 56 percent between three and seven years and 3 percent between seven and 10 years.
At December 31, 2012, hedge fund investments included above are redeemable monthly (15 percent), quarterly
(34 percent), semi-annually (28 percent) and annually (23 percent), with redemption notices ranging from one day to
180 days. More than 69 percent of these hedge fund investments require redemption notices of less than 90 days.
Investments representing approximately 74 percent of the value of the hedge fund investments cannot be redeemed,
either in whole or in part, because the investments include various restrictions. The majority of these restrictions have
pre-defined end dates and are generally expected to be lifted by the end of 2015. The restrictions that do not have
stated end dates were primarily put in place prior to 2009. The partial restrictions relate to certain hedge funds that
hold at least one investment that the fund manager deems to be illiquid.
Fair Value Option..............................................................................................................................................................................................
Under the fair value option, we may elect to measure at fair value financial assets and financial liabilities that are not
otherwise required to be carried at fair value. Subsequent changes in fair value for designated items are reported in
earnings. We elect the fair value option for certain hybrid securities given the complexity of bifurcating the economic
components associated with the embedded derivatives. Refer to Note 12 for additional information related to
embedded derivatives.
Additionally, beginning in the third quarter of 2012 we elected the fair value option for investments in certain private
equity funds, hedge funds and other alternative investments when such investments are eligible for this election. We
believe this measurement basis is consistent with the applicable accounting guidance used by the respective
investment company funds themselves. Refer to Note 7 herein for additional information.
The following table presents the gains or losses recorded related to the eligible instruments for which we
elected the fair value option:
Assets:
Mortgage and other loans receivable $ 11 $ 53
Bonds and equity securities 1,273 2,060
Trading – ML II interest 42 513
Trading – ML III interest (646) 1,792
Retained interest in AIA 1,289 (638)
Other, including Short-term investments 35 (39)
Liabilities:
Policyholder contract deposits – (320)
Long-term debt(a) (966) (1,595)
Other liabilities (67) (8)
Total gain(b) $ 971 $ 1,818
(a) Includes GIAs, notes, bonds, loans and mortgages payable.
(b) Excludes discontinued operation gains or losses on instruments that were required to be carried at fair value. For instruments required to be
carried at fair value, we recognized gains of $586 million, $1.3 billion and $4.9 billion for the years ended 2012, 2011 and 2010, respectively, that
were primarily due to changes in the fair value of derivatives, trading securities and certain other invested assets for which the fair value option was
not elected.
Interest income and dividend income on assets elected under the fair value option are recognized and included in
Net Investment Income in the Consolidated Statement of Operations with the exception of DIB-related activity, which
is included in Other income. Interest on liabilities for which we elected the fair value option is recognized in interest
expense in the Consolidated Statement of Operations. See Note 7 herein for additional information about our policiesfor recognition, measurement, and disclosure of interest and dividend income and interest expense.
..................................................................................................................................................................................................................................
AIG 2012 Form 10-K 249
Gain (Loss)Years Ended December 31,
(in millions) 2012 2011 2010
$ 47
2,339
246
2,888
2,069
56
–
(681)
(33)
$ 6,931
I T E M 8 / N O T E 6 . F A I R V A L U E M E A S U R E M E N T S
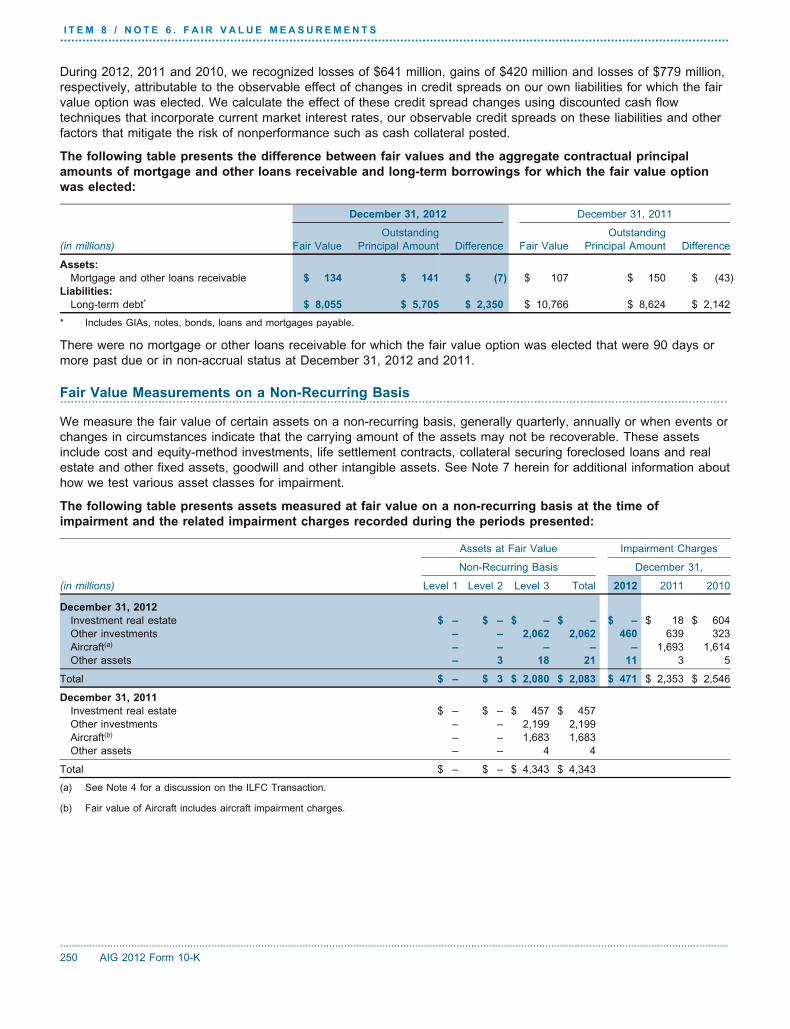
.....................................................................................................................................................................................
During 2012, 2011 and 2010, we recognized losses of $641 million, gains of $420 million and losses of $779 million,
respectively, attributable to the observable effect of changes in credit spreads on our own liabilities for which the fair
value option was elected. We calculate the effect of these credit spread changes using discounted cash flow
techniques that incorporate current market interest rates, our observable credit spreads on these liabilities and other
factors that mitigate the risk of nonperformance such as cash collateral posted.
The following table presents the difference between fair values and the aggregate contractual principal
amounts of mortgage and other loans receivable and long-term borrowings for which the fair value option
was elected:
Assets:
Mortgage and other loans receivable $ 107 $ 150 $ (43)
Liabilities:
Long-term debt* $ 10,766 $ 8,624 $ 2,142
* Includes GIAs, notes, bonds, loans and mortgages payable.
There were no mortgage or other loans receivable for which the fair value option was elected that were 90 days or
more past due or in non-accrual status at December 31, 2012 and 2011.
Fair Value Measurements on a Non-Recurring Basis..............................................................................................................................................................................................
We measure the fair value of certain assets on a non-recurring basis, generally quarterly, annually or when events or
changes in circumstances indicate that the carrying amount of the assets may not be recoverable. These assets
include cost and equity-method investments, life settlement contracts, collateral securing foreclosed loans and real
estate and other fixed assets, goodwill and other intangible assets. See Note 7 herein for additional information about
how we test various asset classes for impairment.
The following table presents assets measured at fair value on a non-recurring basis at the time of
impairment and the related impairment charges recorded during the periods presented:
December 31, 2012
Investment real estate $ 18 $ 604
Other investments 639 323
Aircraft(a) 1,693 1,614
Other assets 3 5
Total $ 2,353 $ 2,546
December 31, 2011
Investment real estate $ – $ – $ 457 $ 457
Other investments – – 2,199 2,199
Aircraft(b) – – 1,683 1,683
Other assets – – 4 4
Total $ – $ – $ 4,343 $ 4,343
(a) See Note 4 for a discussion on the ILFC Transaction.
(b) Fair value of Aircraft includes aircraft impairment charges.
..................................................................................................................................................................................................................................
AIG 2012 Form 10-K250
December 31, 2012 December 31, 2011
Outstanding Outstanding
(in millions) Fair Value Principal Amount Difference Fair Value Principal Amount Difference
$ 134 $ 141 $ (7)
$ 8,055 $ 5,705 $ 2,350
Assets at Fair Value Impairment Charges
Non-Recurring Basis December 31,
(in millions) Level 1 Level 2 Level 3 Total 2012 2011 2010
$ – $ – $ – $ – $ –
– – 2,062 2,062 460
– – – – –
– 3 18 21 11
$ – $ 3 $ 2,080 $ 2,083 $ 471
I T E M 8 / N O T E 6 . F A I R V A L U E M E A S U R E M E N T S

.....................................................................................................................................................................................
Fair Value Information about Financial Instruments Not Measured at Fair Value..............................................................................................................................................................................................
Information regarding the estimation of fair value for financial instruments not carried at fair value (excludinginsurance contracts and lease contracts) is discussed below:
• Fair values of loans on real estate and other loans receivable wereestimated for disclosure purposes using discounted cash flow calculations based upon discount rates that webelieve market participants would use in determining the price that they would pay for such assets. For certainloans, our current incremental lending rates for similar types of loans is used as the discount rate, as webelieve that this rate approximates the rates that market participants would use. The fair values of policy loansare generally estimated based on unpaid principal amount as of each reporting date or, in some cases, basedon the present value of the loans using a discounted cash flow model. No consideration is given to credit riskas policy loans are effectively collateralized by the cash surrender value of the policies.
• The majority of Other invested assets that are not measured at fair value representinvestments in life settlement contracts. The fair value of life settlement contracts included in Other investedassets is determined on a discounted cash flow basis, incorporating current life expectancy assumptions.
• The carrying values of these assets approximate fair values because ofthe relatively short period of time between origination and expected realization, and their limited exposure tocredit risk.
• Fair values for policyholdercontract deposits associated with investment-type contracts not accounted for at fair value were estimatedusing discounted cash flow calculations based upon interest rates currently being offered for similar contractswith maturities consistent with those remaining for the contracts being valued. Where no similar contracts arebeing offered, the discount rate is the appropriate tenor swap rate (if available) or current risk-free interest rateconsistent with the currency in which the cash flows are denominated.
• Fair values of these obligations were determined by reference to quoted market prices,where available and appropriate, or discounted cash flow calculations based upon our current market-observable implicit-credit-spread rates for similar types of borrowings with maturities consistent with thoseremaining for the debt being valued.
The following table presents the carrying value and estimated fair value of our financial instruments not
measured at fair value and indicates the level of the estimated fair value measurement based on theobservability of the inputs used:
December 31, 2012Assets:
Mortgage and other loans receivableOther invested assetsShort-term investmentsCash
Liabilities:Policyholder contract deposits associated with
investment-type contractsOther liabilitiesLong-term debt*
December 31, 2011Assets:
Mortgage and other loans receivable $ 20,494 $ 19,382Other invested assets 3,390 4,701Short-term investments 16,657 16,659Cash 1,474 1,474
Liabilities:Policyholder contract deposits associated with
investment-type contracts 122,125 106,950Other liabilities 896 896Long-term debt 61,295 64,487
* Excludes Long-term debt of ILFC reclassed to Liabilities held for sale on the Consolidated Balance Sheet.
..................................................................................................................................................................................................................................
AIG 2012 Form 10-K 251
Mortgage and other loans receivable:
Other Invested Assets:
Cash and short-term investments:
Policyholder contract deposits associated with investment-type contracts:
Long-term debt:
Estimated Fair ValueCarrying
(in millions) Level 1 Level 2 Level 3 Total Value
$ 823 $ 19,396 $ 20,219 $ 19,348237 3,521 3,758 4,932
20,752 – 20,752 20,752– – 1,151 1,151
245 123,860 124,105 105,9792,205 818 3,023 3,024
43,966 1,925 45,891 40,445
$ –––
1,151
–––
I T E M 8 / N O T E 6 . F A I R V A L U E M E A S U R E M E N T S

.....................................................................................................................................................................................
7. INVESTMENTS..............................................................................................................................................................................................
Fixed Maturity and Equity Securities..............................................................................................................................................................................................
Bonds held to maturity are carried at amortized cost when we have the ability and positive intent to hold these
securities until maturity. When we do not have the ability or positive intent to hold bonds until maturity, these
securities are classified as available for sale or as trading and are carried at fair value. None of our fixed maturity
securities met the criteria for held to maturity classification at December 31, 2012 or 2011.
Fixed maturity and equity securities classified as available for sale or as trading are carried at fair value. Unrealized
gains and losses from available for sale investments in fixed maturity and equity securities are reported as a
separate component of Accumulated other comprehensive income (loss), net of deferred acquisition costs and
deferred income taxes, in Total AIG shareholders’ equity. Realized and unrealized gains and losses from fixed
maturity and equity securities classified as trading are reflected in Net investment income (for insurance subsidiaries)
or Other income (for DIB). Investments in fixed maturity and equity securities are recorded on a trade-date basis.
Premiums and discounts arising from the purchase of bonds classified as available for sale are treated as yield
adjustments over their estimated holding periods, until maturity, or call date, if applicable. For investments in certain
RMBS, CMBS and CDO/ABS, (collectively, structured securities), recognized yields are updated based on current
information regarding the timing and amount of expected undiscounted future cash flows. For high credit quality
structured securities, effective yields are recalculated based on actual payments received and updated prepayment
expectations, and the amortized cost is adjusted to the amount that would have existed had the new effective yield
been applied since acquisition with a corresponding charge or credit to net investment income. For structured
securities that are not high credit quality, effective yields are recalculated and adjusted prospectively based on
changes in expected undiscounted future cash flows. For purchased credit impaired (PCI) securities, at acquisition,
the difference between the undiscounted expected future cash flows and the recorded investment in the securities
represents the initial accretable yield, which is to be accreted into net investment income over the securities’
remaining lives on a level-yield basis. Subsequently, effective yields recognized on PCI securities are recalculated
and adjusted prospectively to reflect changes in the contractual benchmark interest rates on variable rate securities
and any significant increases in undiscounted expected future cash flows arising due to reasons other than interest
rate changes.
Trading securities include the investment portfolio of the DIB. Trading securities for the DIB are held to meet
short-term investment objectives and to economically hedge other securities.
..................................................................................................................................................................................................................................
AIG 2012 Form 10-K252
I T E M 8 / N O T E 7 . I N V E S T M E N T S

.....................................................................................................................................................................................
Securities Available for Sale..............................................................................................................................................................................................
The following table presents the amortized cost or cost and fair value of our available for sale securities:
December 31, 2012
Bonds available for sale:
U.S. government and government sponsored entities
Obligations of states, municipalities and political subdivisions
Non-U.S. governments
Corporate debt
Mortgage-backed, asset-backed and collateralized:
RMBS
CMBS
CDO/ABS
Total mortgage-backed, asset-backed and collateralized
Total bonds available for sale(b)
Equity securities available for sale:
Common stock
Preferred stock
Mutual funds
Total equity securities available for sale
Total
December 31, 2011
Bonds available for sale:
U.S. government and government sponsored entities $ 5,661 $ 418 $ (1) $ 6,078 $ –
Obligations of states, municipalities and political subdivisions 35,017 2,554 (73) 37,498 (28)
Non-U.S. governments 24,843 994 (102) 25,735 –
Corporate debt 134,699 11,844 (1,725) 144,818 115
Mortgage-backed, asset-backed and collateralized:
RMBS 34,780 1,387 (1,563) 34,604 (716)
CMBS 8,449 470 (973) 7,946 (276)
CDO/ABS 7,321 454 (473) 7,302 49
Total mortgage-backed, asset-backed and collateralized 50,550 2,311 (3,009) 49,852 (943)
Total bonds available for sale(b) 250,770 18,121 (4,910) 263,981 (856)
Equity securities available for sale:
Common stock 1,682 1,839 (100) 3,421 –
Preferred stock 83 60 – 143 –
Mutual funds 55 6 (1) 60 –
Total equity securities available for sale 1,820 1,905 (101) 3,624 –
Total $ 252,590 $ 20,026 $ (5,011) $ 267,605 $ (856)
(a) Represents the amount of other-than-temporary impairment losses recognized in Accumulated other comprehensive income. Amount includes
unrealized gains and losses on impaired securities relating to changes in the value of such securities subsequent to the impairment measurement
date.
(b) At December 31, 2012 and December 31, 2011, bonds available for sale held by us that were below investment grade or not rated totaled
$29.6 billion and $24.2 billion, respectively.
..................................................................................................................................................................................................................................
AIG 2012 Form 10-K 253
Other-Than-
Amortized Gross Gross Temporary
Cost or Unrealized Unrealized Fair Impairments
(in millions) Cost Gains Losses Value in AOCI(a)
$ 3,161 $ 323 $ (1) $ 3,483 $ –
33,042 2,685 (22) 35,705 2
25,449 1,395 (44) 26,800 –
135,728 15,848 (464) 151,112 115
31,330 3,379 (317) 34,392 1,330
9,699 811 (376) 10,134 (54)
7,740 765 (172) 8,333 57
48,769 4,955 (865) 52,859 1,333
246,149 25,206 (1,396) 269,959 1,450
1,492 1,574 (37) 3,029 –
55 23 – 78 –
93 12 – 105 –
1,640 1,609 (37) 3,212 –
$ 247,789 $ 26,815 $ (1,433) $ 273,171 $ 1,450
I T E M 8 / N O T E 7 . I N V E S T M E N T S

.....................................................................................................................................................................................
Securities Available for Sale in a Loss Position..............................................................................................................................................................................................
The following table summarizes the fair value and gross unrealized losses on our available for sale
securities, aggregated by major investment category and length of time that individual securities have been
in a continuous unrealized loss position:
December 31, 2012
Bonds available for sale:
U.S. government and government sponsored entities
Obligations of states, municipalities and political subdivisions
Non-U.S. governments
Corporate debt
RMBS
CMBS
CDO/ABS
Total bonds available for sale
Equity securities available for sale:
Common stock
Preferred stock
Mutual funds
Total equity securities available for sale
Total
December 31, 2011
Bonds available for sale:
U.S. government and government sponsored entities $ 142 $ 1 $ – $ – $ 142 $ 1
Obligations of states, municipalities and political subdivisions 174 1 669 72 843 73
Non-U.S. governments 3,992 67 424 35 4,416 102
Corporate debt 18,099 937 5,907 788 24,006 1,725
RMBS 10,624 714 4,148 849 14,772 1,563
CMBS 1,697 185 1,724 788 3,421 973
CDO/ABS 1,680 50 1,682 423 3,362 473
Total bonds available for sale 36,408 1,955 14,554 2,955 50,962 4,910
Equity securities available for sale:
Common stock 608 100 – – 608 100
Preferred stock 6 – – – 6 –
Mutual funds 2 1 – – 2 1
Total equity securities available for sale 616 101 – – 616 101
Total $ 37,024 $ 2,056 $ 14,554 $ 2,955 $ 51,578 $ 5,011
At December 31, 2012, we held 3,637 and 198 individual fixed maturity and equity securities, respectively, that were
in an unrealized loss position, of which 1,385 individual fixed maturity securities were in a continuous unrealized loss
position for longer than 12 months. We did not recognize the unrealized losses in earnings on these fixed maturity
securities at December 31, 2012, because we neither intend to sell the securities nor do we believe that it is more
likely than not that it will be required to sell these securities before recovery of their amortized cost basis.
Furthermore, we expect to recover the entire amortized cost basis of these securities. In performing this evaluation,
we considered the recovery periods for securities in previous periods of broad market declines. For fixed maturity
securities with significant declines, we performed fundamental credit analysis on a security-by-security basis, which
included consideration of credit enhancements, expected defaults on underlying collateral, review of relevant industry
analyst reports and forecasts and other available market data.
..................................................................................................................................................................................................................................
AIG 2012 Form 10-K254
Less than 12 Months 12 Months or More Total
Gross Gross Gross
Fair Unrealized Fair Unrealized Fair Unrealized
(in millions) Value Losses Value Losses Value Losses
$ 153 $ 1 $ – $ – $ 153 $ 1
692 11 114 11 806 22
1,555 19 442 25 1,997 44
8,483 201 3,229 263 11,712 464
597 28 1,661 289 2,258 317
406 11 1,595 365 2,001 376
391 1 1,510 171 1,901 172
12,277 272 8,551 1,124 20,828 1,396
247 36 18 1 265 37
– – – – – –
3 – – – 3 –
250 36 18 1 268 37
$ 12,527 $ 308 $ 8,569 $ 1,125 $ 21,096 $ 1,433
I T E M 8 / N O T E 7 . I N V E S T M E N T S

.....................................................................................................................................................................................
Contractual Maturities of Securities Available for Sale..............................................................................................................................................................................................
The following table presents the amortized cost and fair value of fixed maturity securities available for saleby contractual maturity:
Due in one year or lessDue after one year through five yearsDue after five years through ten yearsDue after ten yearsMortgage-backed, asset-backed and collateralized
Total
Actual maturities may differ from contractual maturities because certain borrowers have the right to call or prepaycertain obligations with or without call or prepayment penalties.
The following table presents the gross realized gains and gross realized losses from sales or redemptions ofour available for sale securities:
Fixed maturity securities $ 2,042 $ 129 $ 2,138 $ 292Equity securities 199 35 811 86
Total $ 2,241 $ 164 $ 2,949 $ 378
For the year ended December 31, 2012, 2011 and 2010, the aggregate fair value of available for sale securities soldwas $40.3 billion, $44.0 billion and $56.0 billion, which resulted in net realized capital gains of $3.1 billion, $2.1 billionand $2.6 billion, respectively.
Trading Securities..............................................................................................................................................................................................
The following table presents the fair value of our trading securities:
Fixed maturities:U.S. government and government sponsored entities $ 6,462 26%Obligations of states, territories and political subdivisions 257 1Non-U.S. governments 35 –Corporate debt 816 3Mortgage-backed, asset-backed and collateralized:
RMBS 1,648 7CMBS 1,837 8CDO/ABS and other collateralized* 6,324 26
Total mortgage-backed, asset-backed and collateralized 9,809 41ML II 1,321 5ML III 5,664 23
Total fixed maturities 24,364 99
Equity securities 125 1
Total $ 24,489 100%
* Includes $0.9 billion of U.S. Government agency backed ABS.
..................................................................................................................................................................................................................................
AIG 2012 Form 10-K 255
Total Fixed Maturity Fixed Maturity SecuritiesDecember 31, 2012
Securities Available in a Loss Positionfor Sale Available for Sale
(in millions) Amortized Cost Fair Value Amortized Cost Fair Value
$ 11,801 $ 12,001 $ 717 $ 71351,646 54,918 3,239 3,16272,091 79,531 4,641 4,51061,842 70,650 6,602 6,28348,769 52,859 7,025 6,160
$ 246,149 $ 269,959 $ 22,224 $ 20,828
Years Ended December 31,
2012 2011 2010
Gross Gross Gross Gross Gross GrossRealized Realized Realized Realized Realized Realized
(in millions) Gains Losses Gains Losses Gains Losses
$ 2,778 $ 171515 31
$ 3,293 $ 202
December 31, 2012 December 31, 2011
Fair Percent Fair Percent(in millions) Value of Total Value of Total
$ 6,794 27%– –2 –
1,320 5
1,727 72,236 9
12,497 50
16,460 66– –8 –
24,584 98
662 2
$ 25,246 100%
I T E M 8 / N O T E 7 . I N V E S T M E N T S

.....................................................................................................................................................................................
Maiden Lane III..............................................................................................................................................................................................
The FRBNY completed the liquidation of ML III assets during the third quarter of 2012 and substantially all of the
sales proceeds have been distributed in accordance with the priority of payments of the transaction. In 2012, we
received total payments of approximately $8.5 billion, which included contractual and additional distributions and our
original $5.0 billion equity interest in ML III.
In 2012, we purchased $7.1 billion of securities through the FRBNY’s auction of ML III assets.
Other Invested Assets..............................................................................................................................................................................................
The following table summarizes the carrying values of other invested assets:
Alternative investments(a) $ 18,793
Mutual funds 258
Investment real estate(b) 2,778
Aircraft asset investments(c) 1,100
Life settlement contracts 4,006
Retained interest in AIA 12,367
All other investments 1,442
Total $ 40,744
(a) Includes hedge funds, private equity funds, affordable housing partnerships and other investment partnerships.
(b) Net of accumulated depreciation of $469 million and $428 million in 2012 and 2011, respectively.
(c) Consist primarily of AIG Life and Retirement investments in aircraft equipment held in trusts.
Other Invested Assets Carried at Fair Value..............................................................................................................................................................................................
Certain hedge funds, private equity funds, affordable housing partnerships and other investment partnerships for
which we have elected the fair value option are reported at fair value with changes in fair value recognized in Net
investment income with the exception of DIB investments, for which such changes are reported in Other income.
Other investments in hedge funds, private equity funds, affordable housing partnerships and other investment
partnerships in which our insurance operations do not hold aggregate interests sufficient to exercise more than minor
influence over the respective partnerships are reported at fair value with changes in fair value recognized as a
component of Accumulated other comprehensive income (loss). These investments are subject to
other-than-temporary impairment evaluation (see below for discussion on evaluating equity investments for
other-than-temporary impairment). The gross unrealized loss recorded in Accumulated other comprehensive income
on such investments was $68 million and $269 million at December 31, 2012 and 2011, respectively, the majority of
which pertains to investments in private equity funds and hedge funds that have been in continuous unrealized loss
position for less than 12 months.
Other Invested Assets – Equity Method Investments..............................................................................................................................................................................................
We account for hedge funds, private equity funds, affordable housing partnerships and other investment partnerships
using the equity method of accounting unless our interest is so minor that we may have virtually no influence over
partnership operating and financial policies. Under the equity method of accounting, our carrying value generally is
our share of the net asset value of the funds or the partnerships, and changes in our share of the net asset values
are recorded in Net investment income with the exception of DIB investments, for which such changes are reported
in Other income. In applying the equity method of accounting, we consistently use the most recently available
financial information provided by the general partner or manager of each of these investments, which is one to three
months prior to the end of our reporting period. The financial statements of these investees are generally audited
annually.
..................................................................................................................................................................................................................................
AIG 2012 Form 10-K256
December 31,
(in millions) 2012 2011
$ 18,990
128
3,195
984
4,357
–
1,463
$ 29,117
I T E M 8 / N O T E 7 . I N V E S T M E N T S

.....................................................................................................................................................................................
Direct private equity investments entered into for strategic purposes and not solely for capital appreciation or for
income generation are also accounted for under the equity method. Dividends received from our other strategic
investments were $8 million, $17 million and $25 million for the years ended December 31, 2012, 2011, and 2010,
respectively. The undistributed earnings of other strategic investments in which our ownership interest is less than
50 percent were $51 million, $9 million and $8 million at December 31, 2012, 2011, and 2010, respectively.
On October 29, 2010, we completed an IPO of 8.08 billion ordinary shares of AIA for aggregate gross proceeds of
approximately $20.5 billion. Upon completion of the IPO, we owned 33 percent of AIA’s outstanding shares.
Accordingly, we deconsolidated AIA and recorded a pre-tax gain of $16.3 billion in 2010. On March 7, 2012, we sold
approximately 1.72 billion ordinary shares of AIA for gross proceeds of approximately $6.0 billion. On September 11,
2012, we sold approximately 600 million ordinary shares of AIA for gross proceeds of approximately $2.0 billion. On
December 20, 2012, we sold approximately 1.65 billion ordinary shares of AIA for gross proceeds of approximately
$6.5 billion. As a result of these sales, we retained no interest in AIA as of December 31, 2012. We accounted for
our investment in AIA under the fair value option with gains and losses recorded in Net investment income. We
recorded fair value option gains from our investment in AIA of $2.1 billion and $1.3 billion for the years ended
December 31, 2012 and 2011, and a fair value option loss of $0.6 billion for the year ended December 31, 2010. At
December 31, 2011, the fair value of our 33 percent retained interest in AIA was approximately $12.4 billion, and
was included in Other invested assets.
The following table presents the carrying value and ownership percentage of AIA and all other equity method
investments:
2012 2011
AIA $ 12,367 33%
All other equity method investments 9,026 Various
Total $ 21,393
Summarized Financial Information of AIA..............................................................................................................................................................................................
The following is summarized financial information of AIA:
Operating results:
Total revenues $ 13,802
Total expenses (12,436)
Net income $ 1,366
Balance sheet:
Total assets $ 112,673
Total liabilities $ (90,894)
Substantially all of AIA’s assets consist of financial investments and deferred acquisition and origination costs and
substantially all of its liabilities consist of insurance- and investment-contract-related liabilities.
Summarized financial information for AIA was as of and for the year ended 2011. AIA was consolidated through
October 28, 2010. As a result, comparable amounts for 2010 are not being presented.
..................................................................................................................................................................................................................................
AIG 2012 Form 10-K 257
Carrying Ownership Carrying Ownership
(in millions, except percentages) Value Percentage Value Percentage
$ – –%
11,544 Various
$ 11,544
Year Ended December 31,
(in millions) 2011
At December 31,
(in millions) 2011
I T E M 8 / N O T E 7 . I N V E S T M E N T S

.....................................................................................................................................................................................
Summarized Financial Information of Other Equity Method Investees..............................................................................................................................................................................................
The following is the aggregated summarized financial information of our other equity method investees,
including those for which the fair value option has been elected:
Operating results:
Total revenues $ 12,749 $ 14,079
Total expenses (3,530) (3,812)
Net income $ 9,219 $ 10,267
Balance sheet:
Total assets $ 95,749
Total liabilities $ (22,379)
Summarized financial information for these equity method investees may be presented on a lag, due to the
unavailability of information for the investees at the respective balance sheet date, and is included for the periods in
which we held an equity method ownership interest. Summarized financial information for investees of entities that
have been divested or are held-for-sale is not included in the table above.
Other Investments..............................................................................................................................................................................................
Also included in Other invested assets are real estate held for investment and aircraft asset investments held by
non-Aircraft Leasing subsidiaries. These investments are reported at cost, less depreciation and subject to
impairment review, as discussed below.
Investments in Life Settlement Contracts..............................................................................................................................................................................................
Life settlement contracts are accounted for under the investment method. Under the investment method, we
recognize our initial investment in life settlement contracts at the transaction price plus all initial direct external costs.
Continuing costs to keep the policy in force, primarily life insurance premiums, increase the carrying value of the
investment. We recognize income on individual life settlement contracts when the insured dies, at an amount equal
to the excess of the contract proceeds over the carrying amount of the contract at that time. Contracts are reviewed
for indications that the expected future proceeds from the contract would not be sufficient to recover our estimated
future carrying amount of the contract, which is the current carrying amount for the contract plus anticipated
undiscounted future premiums and other capitalizable future costs. Any such contracts identified are written down to
their estimated fair value.
During 2012, 2011 and 2010, income recognized on life settlement contracts was $253 million, $320 million and
$213 million, respectively, and is included in Net investment income in the Consolidated Statement of Operations.
Our life settlement contracts reported above are monitored for impairment on a contract-by-contract basis quarterly.
Impairment charges on life settlement contracts included in net realized capital gains (losses) totaled $309 million,
$312 million and $74 million in 2012, 2011, and 2010 respectively.
..................................................................................................................................................................................................................................
AIG 2012 Form 10-K258
Years Ended December 31,
(in millions) 2012 2011 2010
$ 9,438
(5,183)
$ 4,255
At December 31,
(in millions) 2012 2011
$ 139,681
$ (26,529)
I T E M 8 / N O T E 7 . I N V E S T M E N T S

.....................................................................................................................................................................................
The following table presents further information regarding life settlement contracts:
Remaining Life Expectancy of Insureds:0 - 1 year1 - 2 years2 - 3 years3 - 4 years4 - 5 yearsThereafter
Total
At December 31, 2012, the anticipated life insurance premiums required to keep the life settlement contracts in force,
payable in the next 12 months ending December 31, 2013 and the four succeeding years ending December 31, 2017
are $546 million, $555 million, $562 million, $554 million and $555 million, respectively.
Net Investment Income..............................................................................................................................................................................................
Net investment income represents income primarily from the following sources in our insurance operations and AIG
Parent:
• Interest income and related expenses, including amortization of premiums and accretion of discounts on bonds
with changes in the timing and the amount of expected principal and interest cash flows reflected in the yield, as
applicable.
• Dividend income from common and preferred stock and distributions from other investments.
• Realized and unrealized gains and losses from investments in trading securities accounted for at fair value and
investments for which the fair value option has been elected.
• Earnings from private equity funds and hedge fund investments accounted for under the equity method.
• The difference between the carrying amount of a life settlement contract and the life insurance proceeds of the
underlying life insurance policy recorded in income upon the death of the insured.
• Changes in the fair values of our interests in ML II, AIA and MetLife securities prior to sale and change in the fair
value of our interests in ML III prior to the FRBNY liquidation of ML III assets.
The following table presents the components of Net investment income:
Fixed maturity securities, including short-term investments $ 11,814 $ 14,445Change in fair value of ML II 42 513Change in fair value of ML III (646) 1,792Change in fair value of AIA securities including realized gain in 2012 1,289 (638)Change in the fair value of MetLife securities prior to their sale (157) 665Equity securities 92 234Interest on mortgage and other loans 1,065 1,268Alternative investments* 1,622 1,957Real estate 107 126Other investments 36 177
Total investment income before policyholder income and trading gains 15,264 20,539Policyholder investment income and trading gains – 886
Total investment income 15,264 21,425Investment expenses 509 491
Net investment income $ 14,755 $ 20,934
* Includes hedge funds, private equity funds, affordable housing partnerships and other investment partnerships.
..................................................................................................................................................................................................................................
AIG 2012 Form 10-K 259
December 31, 2012
Number of Carrying Face Value(dollars in millions) Contracts Value (Death Benefits)
1 $ 3 $ 829 19 3590 138 269
234 250 554296 283 723
5,023 3,509 16,067
5,673 $ 4,202 $ 17,656
$ 12,592246
2,8882,069
–162
1,0831,769
12711
20,947–
20,947604
$ 20,343
Years Ended December 31,(in millions) 2012 2011 2010
I T E M 8 / N O T E 7 . I N V E S T M E N T S

.....................................................................................................................................................................................
Net Realized Capital Gains and Losses..............................................................................................................................................................................................
Net realized capital gains and losses are determined by specific identification. The net realized capital gains and
losses are generated primarily from the following sources:
• Sales of fixed maturity securities and equity securities (except trading securities accounted for at fair value and
investments for which the fair value option has been elected), real estate, investments in private equity funds and
hedge funds and other types of investments.
• Reductions to the cost basis of fixed maturity securities and equity securities (except trading securities accounted
for at fair value and investments for which the fair value option has been elected) and other invested assets for
other-than-temporary impairments.
• Changes in fair value of derivatives except for (1) those instruments at AIGFP that are not intermediated on behalf
of other AIG subsidiaries and (2) those instruments that are designated as hedging instruments when the change
in the fair value of the hedged item is not reported in Net realized capital gains (losses Exchange gains and losses
resulting from foreign currency transactions.
The following table presents the components of Net realized capital gains (losses) and the increase
(decrease) in unrealized appreciation of our available for sale securities:
Sales of fixed maturity securities $ 1,913 $ 1,846
Sales of equity securities 164 725
Other-than-temporary impairments:
Severity (51) (73)
Change in intent (12) (441)
Foreign currency declines (32) (63)
Issuer-specific credit events (1,165) (2,457)
Adverse projected cash flows (20) (5)
Provision for loan losses 48 (304)
Change in the fair value of MetLife securities prior to their sale (191) 315
Foreign exchange transactions (93) 191
Derivative instruments 448 (416)
Other (308) (34)
Net realized capital gains (losses) $ 701 $ (716)
Increase in unrealized appreciation of investments:
Fixed maturities $ 5,578 $ 8,677
Equity securities (206) 473
Other investments 146 156
Increase in unrealized appreciation* $ 5,518 $ 9,306
* Excludes net unrealized gains attributable to businesses held for sale.
Evaluating Investments for Other-Than-Temporary Impairments..............................................................................................................................................................................................
Fixed Maturity Securities
If we intend to sell a fixed maturity security or it is more likely than not that we will be required to sell a fixed maturity
security before recovery of its amortized cost basis and the fair value of the security is below amortized cost, an
other-than-temporary impairment has occurred and the amortized cost is written down to current fair value, with a
corresponding charge to earnings. When assessing our intent to sell a fixed maturity security, or whether it is more
likely than not that we will be required to sell a fixed maturity security before recovery of its amortized cost basis,
management evaluates relevant facts and circumstances including, but not limited to, decisions to reposition our
investment portfolio, sales of securities to meet cash flow needs and sales of securities to take advantage of
favorable pricing.
..................................................................................................................................................................................................................................
AIG 2012 Form 10-K260
$ 2,607
484
(44)
(62)
(8)
(1,048)
(5)
104
–
(234)
(684)
(181)
$ 929
$ 10,599
(232)
343
$ 10,710
Years Ended December 31,(in millions) 2012 2011 2010
I T E M 8 / N O T E 7 . I N V E S T M E N T S

.....................................................................................................................................................................................
For all other fixed maturity securities for which a credit impairment has occurred, the amortized cost is written down
to the estimated recovery value with a corresponding charge to earnings. The estimated recovery value is thepresent value of cash flows expected to be collected, as determined by management. The difference between fair
value and amortized cost that is not related to a credit impairment is recognized in unrealized appreciation(depreciation) of fixed maturity securities on which other-than-temporary credit impairments were taken (a separatecomponent of Accumulated other comprehensive income (loss)).
When estimating future cash flows for a structured fixed maturity security (e.g., RMBS, CMBS, CDO, ABS)management considers historical performance of underlying assets and available market information as well asbond-specific structural considerations, such as credit enhancement and priority of payment structure of the security.
In addition, the process of estimating future cash flows includes, but is not limited to, the following critical inputs,which vary by asset class:
• Current delinquency rates;
• Expected default rates and the timing of such defaults;
• Loss severity and the timing of any recovery; and
• Expected prepayment speeds.
For corporate, municipal and sovereign fixed maturity securities determined to be credit impaired, management
considers the fair value as the recovery value when available information does not indicate that another value ismore relevant or reliable. When management identifies information that supports a recovery value other than the fairvalue, the determination of a recovery value considers scenarios specific to the issuer and the security, and may be
based upon estimates of outcomes of corporate restructurings, political and macroeconomic factors, stability andfinancial strength of the issuer, the value of any secondary sources of repayment and the disposition of assets.
We consider severe price declines in our assessment of potential credit impairments. We may also modify our
modeled outputs for certain securities when we determine that price declines are indicative of factors notcomprehended by the cash flow models.
In periods subsequent to the recognition of an other-than-temporary impairment charge for available for sale fixed
maturity securities that is not foreign exchange related, we prospectively accrete into earnings the difference betweenthe new amortized cost and the expected undiscounted recovery value over the remaining expected holding period of
the security.
Credit Impairments
The following table presents a rollforward of the cumulative credit loss component of other-than-temporary
impairments recognized in earnings for available for sale fixed maturity securities held by us, and includes
structured, corporate, municipal and sovereign fixed maturity securities:
Balance, beginning of year $ 6,786 $ 7,803Increases due to:
Credit impairments on new securities subject to impairment losses 235 627
Additional credit impairments on previously impaired securities 735 1,294Reductions due to:
Credit impaired securities fully disposed for which there was no prior intent or
requirement to sell (529) (1,039)Credit impaired securities for which there is a current intent or anticipated
requirement to sell – (503)
Accretion on securities previously impaired due to credit* (544) (332)Hybrid securities with embedded credit derivatives reclassified to Bond trading
securities (179) (748)Other – (316)
Balance, end of year $ 6,504 $ 6,786
* Represents accretion recognized due to changes in cash flows expected to be collected over the remaining expected term of the credit impaired
securities as well as the accretion due to the passage of time.
..................................................................................................................................................................................................................................
AIG 2012 Form 10-K 261
$ 6,504
194
483
(1,105)
(5)
(915)
–
8
$ 5,164
Years Ended December 31,(in millions) 2012 2011 2010
I T E M 8 / N O T E 7 . I N V E S T M E N T S

.....................................................................................................................................................................................
Equity Securities
We evaluate our available for sale equity securities, equity method and cost method investments for impairment byconsidering such securities as candidates for other-than-temporary impairment if they meet any of the followingcriteria:
• the security has traded at a significant (25 percent or more) discount to cost for an extended period of time (nineconsecutive months or longer);
• a discrete credit event has occurred resulting in (i) the issuer defaulting on a material outstanding obligation; (ii) theissuer seeking protection from creditors under the bankruptcy laws or any similar laws intended for court-supervised reorganization of insolvent enterprises; or (iii) the issuer proposing a voluntary reorganization pursuantto which creditors are asked to exchange their claims for cash or securities having a fair value substantially lowerthan the par value of their claims; or
• we have concluded that it may not realize a full recovery on its investment, regardless of the occurrence of one ofthe foregoing events.
The determination that an equity security is other-than-temporarily impaired requires the judgment of managementand consideration of the fundamental condition of the issuer, its near-term prospects and all the relevant facts andcircumstances. The above criteria also consider circumstances of a rapid and severe market valuation decline inwhich we could not reasonably assert that the impairment period would be temporary (severity losses).
Other Invested Assets
Our investments in private equity funds and hedge funds are evaluated for impairment similar to the evaluation ofequity securities for impairments as discussed above. Such evaluation considers market conditions, events andvolatility that may impact the recoverability of the underlying investments within these private equity funds and hedgefunds and is based on the nature of the underlying investments and specific inherent risks. Such risks may evolvebased on the nature of the underlying investments.
Our investments in life settlement contracts are monitored for impairment based on the underlying life insurancepolicies, with cash flows reported periodically. An investment in a life settlement contract is considered impaired if theundiscounted cash flows resulting from the expected proceeds from the insurance policy are less than the carryingamount of the investment plus anticipated continuing costs. If an impairment loss is recognized, the investment iswritten down to fair value. During 2011, we implemented an enhanced process in which updated medical informationon individual insured lives is requested on a routine basis. In cases where updated information indicates that anindividual’s health has improved, an impairment loss may arise as a result of revised estimates of net cash flowsfrom the related contract. We also revised the valuation table used to estimate future net cash flows. This had thegeneral effect of decreasing the projected net cash flows on a number of contracts. These changes resulted in anincrease in the number of life settlement contracts identified as potentially impaired.
Our investments in aircraft assets and real estate are periodically evaluated for recoverability whenever changes incircumstances indicate the carrying amount of an asset may be impaired. When impairment indicators are present,we compare expected investment cash flows to carrying value. When the expected cash flows are less than thecarrying value, the investments are written down to fair value with a corresponding charge to earnings.
Purchased Credit Impaired (PCI) Securities..............................................................................................................................................................................................
In 2011, we began purchasing certain RMBS securities that had experienced deterioration in credit quality since theirissuance. We determined, based on our expectations as to the timing and amount of cash flows expected to bereceived, that it was probable at acquisition that we would not collect all contractually required payments for thesePCI securities, including both principal and interest after considering the effects of prepayments. At acquisition, thetiming and amount of the undiscounted future cash flows expected to be received on each PCI security wasdetermined based on our best estimate using key assumptions, such as interest rates, default rates and prepaymentspeeds. At acquisition, the difference between the undiscounted expected future cash flows of the PCI securities andthe recorded investment in the securities represents the initial accretable yield, which is to be accreted into netinvestment income over their remaining lives on a level-yield basis. Additionally, the difference between thecontractually required payments on the PCI securities and the undiscounted expected future cash flows representsthe non-accretable difference at acquisition. Over time, based on actual payments received and changes in estimatesof undiscounted expected future cash flows, the accretable yield and the non-accretable difference can change, asdiscussed further below.
..................................................................................................................................................................................................................................
AIG 2012 Form 10-K262
I T E M 8 / N O T E 7 . I N V E S T M E N T S

.....................................................................................................................................................................................
On a quarterly basis, the undiscounted expected future cash flows associated with PCI securities are re-evaluated
based on updates to key assumptions. Declines in undiscounted expected future cash flows due to further credit
deterioration as well as changes in the expected timing of the cash flows can result in the recognition of an
other-than-temporary impairment charge, as PCI securities are subject to our policy for evaluating investments for
other-than-temporary impairment. Changes to undiscounted expected future cash flows due solely to the changes in
the contractual benchmark interest rates on variable rate PCI securities will change the accretable yield prospectively.
Significant increases in undiscounted expected future cash flows for reasons other than interest rate changes are
recognized prospectively as adjustments to the accretable yield.
The following tables present information on our PCI securities, which are included in bonds available for
sale:
Contractually required payments (principal and interest) $ 18,708
Cash flows expected to be collected* 14,626
Recorded investment in acquired securities 9,379
* Represents undiscounted expected cash flows, including both principal and interest.
Outstanding principal balance $ 10,119
Amortized cost 7,006
Fair value 6,535
The following table presents activity for the accretable yield on PCI securities:
Balance, beginning of year $ –
Newly purchased PCI securities 3,943
Disposals –
Accretion (324)
Effect of changes in interest rate indices (62)
Net reclassification from non-accretable difference, including effects of prepayments 578
Balance, end of year $ 4,135
Pledged Investments..............................................................................................................................................................................................
Secured Financing and Similar Arrangements..............................................................................................................................................................................................
We enter into financing transactions whereby certain securities are transferred to financial institutions in exchange for
cash or other liquid collateral. Securities transferred by us under these financing transactions may be sold or
repledged by the counterparties. As collateral for the securities transferred by us, counterparties transfer assets to
us, such as cash or high quality fixed maturity securities. Collateral levels are monitored daily and are generally
maintained at an agreed-upon percentage of the fair value of the transferred securities during the life of the
transactions. Where we receive fixed maturity securities as collateral, we do not have the right to sell or repledge this
collateral unless an event of default occurs by the counterparties. At the termination of the transactions, we and our
counterparties are obligated to return the collateral provided and the securities transferred, respectively. We treat
these transactions as secured financing arrangements.
Secured financing transactions also include securities sold under agreements to repurchase (repurchase
agreements), in which we transfer securities in exchange for cash, with an agreement by us to repurchase the same
or substantially similar securities. In the majority of these repurchase agreements, the securities transferred by us
may be sold or repledged by the counterparties. Repurchase agreements entered into by the DIB are carried at fair
..................................................................................................................................................................................................................................
AIG 2012 Form 10-K 263
$ 11,791
7,718
8,823
$ 4,135
1,620
(298)
(672)
(213)
194
$ 4,766
(in millions) At Date of Acquisition
(in millions) December 31, 2012 December 31, 2011
Years Ended December 31,
(in millions) 2012 2011
I T E M 8 / N O T E 7 . I N V E S T M E N T S

.....................................................................................................................................................................................
value based on market-observable interest rates. All other repurchase agreements are recorded at their contracted
repurchase amounts plus accrued interest.
Under the secured financing transactions described above, securities available for sale with a fair value of $8.2 billion
and $2.3 billion at December 31, 2012 and December 31, 2011, respectively, and trading securities with a fair value
of $3.0 billion and $2.8 billion at December 31, 2012 and December 31, 2011, respectively, were pledged to
counterparties.
Prior to January 1, 2012, in the case of repurchase agreements where we did not obtain collateral sufficient to fund
substantially all of the cost of purchasing identical replacement securities during the term of the contract (generally
less than 90 percent of the security value), we accounted for the transaction as a sale of the security and reported
the obligation to repurchase the security as a derivative contract. The fair value of securities transferred under
repurchase agreements accounted for as sales was $2.1 billion at December 31, 2011. Effective January 1, 2012,
the level of collateral received by the transferor in a repurchase agreement or similar arrangement is no longer
relevant in determining whether the transaction should be accounted for as a sale. There were no repurchase
agreements accounted for as sales as of December 31, 2012.
We also enter into agreements in which securities are purchased by us under agreements to resell (reverse
repurchase agreements), which are accounted for as secured financing transactions and reported as short-term
investments or other assets, depending on their terms. These agreements are recorded at their contracted resale
amounts plus accrued interest, other than those that are accounted for at fair value. Such agreements entered into
by the DIB are carried at fair value based on market observable interest rates. In all reverse repurchase transactions,
we take possession of or obtain a security interest in the related securities, and we have the right to sell or repledge
this collateral received. The fair value of securities collateral pledged to us was $11.0 billion and $6.8 billion at
December 31, 2012 and December 31, 2011, respectively, of which $33 million and $122 million was repledged by
us.
Insurance – Statutory and Other Deposits..............................................................................................................................................................................................
Total carrying values of cash and securities deposited by our insurance subsidiaries under requirements of regulatory
authorities or other insurance-related arrangements, including certain annuity-related obligations and certain
reinsurance agreements, were $8.9 billion and $9.8 billion at December 31, 2012 and 2011, respectively.
Other Pledges..............................................................................................................................................................................................
Certain of our subsidiaries are members of Federal Home Loan Banks (FHLBs) and such membership requires the
members to own stock in these FHLBs. These subsidiaries owned an aggregate of $84 million and $77 million of
stock in FHLBs at December 31, 2012 and December 31, 2011, respectively. To the extent an AIG subsidiary
borrows from the FHLB, its ownership interest in the stock of FHLBs will be pledged to the FHLB. In addition, our
subsidiaries have pledged securities available for sale with a fair value of $341 million at December 31, 2012,
associated with advances from the FHLBs.
Certain GIAs have provisions that require collateral to be posted or payments to be made by us upon a downgrade
of our long-term debt ratings. The actual amount of collateral required to be posted to the counterparties in the event
of such downgrades, and the aggregate amount of payments that we could be required to make, depend on market
conditions, the fair value of outstanding affected transactions and other factors prevailing at and after the time of the
downgrade. The fair value of securities pledged as collateral with respect to these obligations approximated
$4.4 billion and $5.1 billion at December 31, 2012 and December 31, 2011, respectively. This collateral primarily
consists of securities of the U.S. government and government sponsored entities and generally cannot be repledged
or resold by the counterparties.
..................................................................................................................................................................................................................................
AIG 2012 Form 10-K264
I T E M 8 / N O T E 7 . I N V E S T M E N T S

.....................................................................................................................................................................................
8. LENDING ACTIVITIES..............................................................................................................................................................................................
Mortgage and other loans receivable include commercial mortgages, life insurance policy loans, commercial loans,
other loans and notes receivable. Commercial mortgages, commercial loans, and other loans and notes receivable
are carried at unpaid principal balances less credit allowances and plus or minus adjustments for the accretion or
amortization of discount or premium. Interest income on such loans is accrued as earned.
Direct costs of originating commercial mortgages, commercial loans, and other loans and notes receivable, net of
nonrefundable points and fees, are deferred and included in the carrying amount of the related receivables. The
amount deferred is amortized to income as an adjustment to earnings using the interest method.
Life insurance policy loans are carried at unpaid principal amount. There is no allowance for policy loans because
these loans serve to reduce the death benefit paid when the death claim is made and the balances are effectively
collateralized by the cash surrender value of the policy.
The following table presents the composition of Mortgages and other loans receivable:
Commercial mortgages* $ 13,554
Life insurance policy loans 3,049
Commercial loans, other loans and notes receivable 3,626
Total mortgage and other loans receivable 20,229
Allowance for losses (740)
Mortgage and other loans receivable, net $ 19,489
* Commercial mortgages primarily represent loans for office, retail and industrial properties, with exposures in California and New York representing
the largest geographic concentrations (22 percent and 15 percent, respectively, at December 31, 2012). Over 99 percent and 98 percent of the
commercial mortgages were current as to payments of principal and interest at December 31, 2012 and 2011, respectively.
The following table presents the credit quality indicators for commercial mortgage loans:
Credit Quality Indicator:
In good standing
Restructured(a)
90 days or less delinquent
>90 days delinquent or in
process of foreclosure
Total(b)
Valuation allowance
(a) Loans that have been modified in troubled debt restructurings and are performing according to their restructured terms. See
discussion of troubled debt restructurings below.
(b) Does not reflect valuation allowances.
Methodology Used to Estimate the Allowance for Credit Losses..............................................................................................................................................................................................
Mortgage and other loans receivable are considered impaired when collection of all amounts due under contractual
terms is not probable. For commercial mortgage loans in particular, the impairment is measured based on the fair
value of underlying collateral, which is determined based on the present value of expected net future cash flows of
the collateral, less estimated costs to sell. For other loans, the impairment may be measured based on the present
value of expected future cash flows discounted at the loan’s effective interest rate or based on the loan’s observable
market price, where available. An allowance is typically established for the difference between the impaired value of
the loan and its current carrying amount. Additional allowance amounts are established for incurred but not
..................................................................................................................................................................................................................................
AIG 2012 Form 10-K 265
$ 13,788
2,952
3,147
19,887
(405)
$ 19,482
998 $ 1,549 $ 4,698 $ 2,640 $ 1,654 $ 1,153 $ 1,671 $ 13,365 97%
8 50 207 7 2 – 22 288 2
4 – 17 – – – – 17 –
6 – 13 26 – – 79 118 1
1,016 $ 1,599 $ 4,935 $ 2,673 $ 1,656 $ 1,153 $ 1,772 $ 13,788 100%
$ 5 $ 74 $ 19 $ 19 $ 1 $ 41 $ 159 1%
(in millions) December 31, 2012 December 31, 2011
ClassDecember 31, 2012 Number Percent
(dollars in millions) of Loans Apartments Offices Retail Industrial Hotel Others Total of Total $
I T E M 8 / N O T E 8 . L E N D I N G A C T I V I T I E S

.....................................................................................................................................................................................
specifically identified impairments, based on the analysis of internal risk ratings and current loan values. Internal risk
ratings are assigned based on the consideration of risk factors including past due status, debt service coverage,
loan-to-value ratio or the ratio of the loan balance to the estimated value of the property, property occupancy, profile
of the borrower and of the major property tenants, economic trends in the market where the property is located, and
condition of the property. These factors and the resulting risk ratings also provide a basis for determining the level of
monitoring performed at both the individual loan and the portfolio level. When all or a portion of a commercial
mortgage loan is deemed uncollectible, the uncollectible portion of the carrying value of the loan is charged off
against the allowance. Interest income on impaired loans is recognized as cash is received.
A significant majority of commercial mortgage loans in the portfolio are non-recourse loans and, accordingly, the only
guarantees are for specific items that are exceptions to the non-recourse provisions. It is therefore extremely rare for
us to have cause to enforce the provisions of a guarantee on a commercial real estate or mortgage loan.
The following table presents a rollforward of the changes in the allowance for losses on Mortgage and other
loans receivable:
Allowance, beginning of year $ 470 $ 408 $ 878 $ 432 $ 2,012 $ 2,444
Loans charged off (78) (47) (125) (217) (137) (354)
Recoveries of loans previously
charged off 37 1 38 – 8 8
Net charge-offs (41) (46) (87) (217) (129) (346)
Provision for loan losses (69) 51 (18) 342 6 348
Other (55) – (55) (34) (1,601) (1,635)
Reclassified to Assets of businesses
held for sale – – – (53) (5) (58)
Activity of discontinued operations – 22 22 – 125 125
Allowance, end of year $ 305(a) $ 435 $ 740 $ 470 $ 408 $ 878
(a) Of the total, $47 million and $65 million relates to individually assessed credit losses on $286 million and $476 million of commercial mortgage
loans as of December 31, 2012 and 2011, respectively.
(b) Included in Other loans were finance receivables, which were reported net of unearned finance charges, for both investment purposes and
held for sale.
Troubled Debt Restructurings..............................................................................................................................................................................................
We modify loans to optimize their returns and improve their collectability, among other things. When such a
modification is undertaken with a borrower that is experiencing financial difficulty and the modification involves us
granting a concession to the troubled debtor, the modification is deemed to be a troubled debt restructuring (TDR).
We assess whether a borrower is experiencing financial difficulty based on a variety of factors, including the
borrower’s current default on any of its outstanding debt, the probability of a default on any of its debt in the
foreseeable future without the modification, the insufficiency of the borrower’s forecasted cash flows to service any of
its outstanding debt (including both principal and interest), and the borrower’s inability to access alternative third-party
financing at an interest rate that would be reflective of current market conditions for a non-troubled debtor.
Concessions granted may include extended maturity dates, interest rate changes, principal forgiveness, payment
deferrals and easing of loan covenants.
As of December 31, 2012 and 2011, we held no significant loans that had been modified in a TDR during those
respective years.
..................................................................................................................................................................................................................................
AIG 2012 Form 10-K266
2012 2011 2010
Years Ended December 31, Commercial Other Commercial Other Commercial Other(in millions) Mortgages Loans Total Mortgages Loans Total Mortgages Loans(b) Total
) ) )
) ) )
) )
) )
(a)
$ 305 $ 435 $ 740
(23 (21 (44
13 4 17
(10 (17 (27
(136 33 (103
– – –
– – –
– (205 (205
$ 159 $ 246 $ 405
I T E M 8 / N O T E 8 . L E N D I N G A C T I V I T I E S
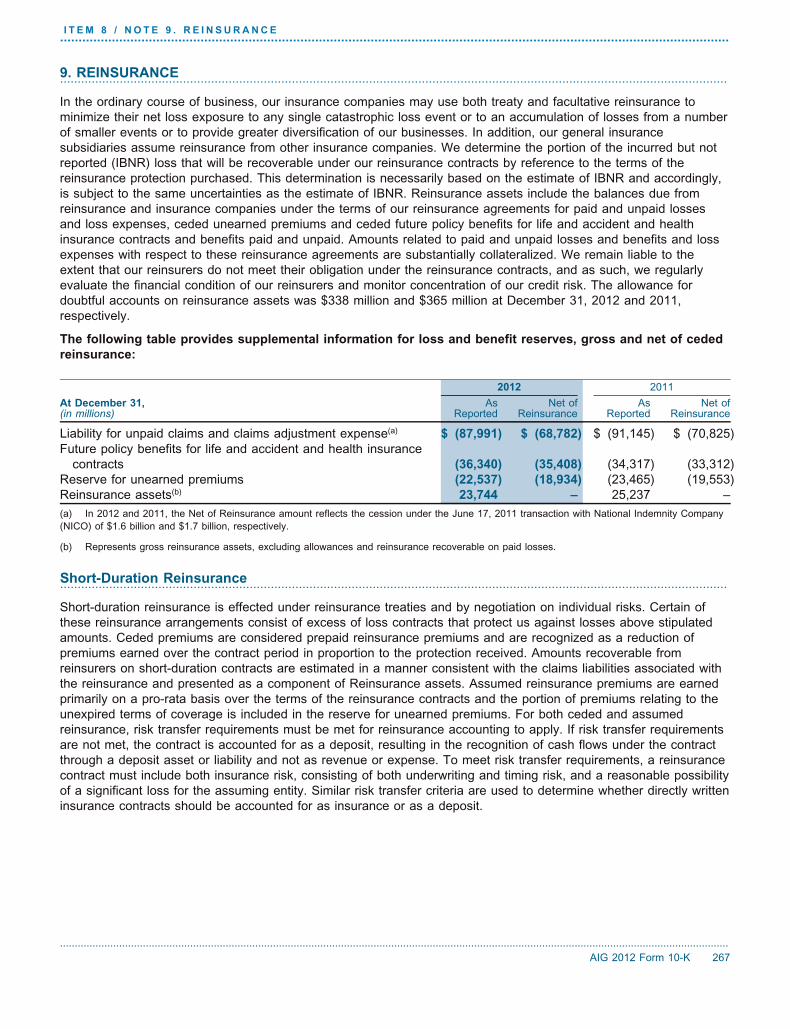
.....................................................................................................................................................................................
9. REINSURANCE..............................................................................................................................................................................................
In the ordinary course of business, our insurance companies may use both treaty and facultative reinsurance to
minimize their net loss exposure to any single catastrophic loss event or to an accumulation of losses from a number
of smaller events or to provide greater diversification of our businesses. In addition, our general insurance
subsidiaries assume reinsurance from other insurance companies. We determine the portion of the incurred but not
reported (IBNR) loss that will be recoverable under our reinsurance contracts by reference to the terms of the
reinsurance protection purchased. This determination is necessarily based on the estimate of IBNR and accordingly,
is subject to the same uncertainties as the estimate of IBNR. Reinsurance assets include the balances due from
reinsurance and insurance companies under the terms of our reinsurance agreements for paid and unpaid losses
and loss expenses, ceded unearned premiums and ceded future policy benefits for life and accident and health
insurance contracts and benefits paid and unpaid. Amounts related to paid and unpaid losses and benefits and loss
expenses with respect to these reinsurance agreements are substantially collateralized. We remain liable to the
extent that our reinsurers do not meet their obligation under the reinsurance contracts, and as such, we regularly
evaluate the financial condition of our reinsurers and monitor concentration of our credit risk. The allowance for
doubtful accounts on reinsurance assets was $338 million and $365 million at December 31, 2012 and 2011,
respectively.
The following table provides supplemental information for loss and benefit reserves, gross and net of ceded
reinsurance:
Liability for unpaid claims and claims adjustment expense(a) $ (91,145) $ (70,825)
Future policy benefits for life and accident and health insurance
contracts (34,317) (33,312)
Reserve for unearned premiums (23,465) (19,553)
Reinsurance assets(b) 25,237 –
(a) In 2012 and 2011, the Net of Reinsurance amount reflects the cession under the June 17, 2011 transaction with National Indemnity Company
(NICO) of $1.6 billion and $1.7 billion, respectively.
(b) Represents gross reinsurance assets, excluding allowances and reinsurance recoverable on paid losses.
Short-Duration Reinsurance..............................................................................................................................................................................................
Short-duration reinsurance is effected under reinsurance treaties and by negotiation on individual risks. Certain of
these reinsurance arrangements consist of excess of loss contracts that protect us against losses above stipulated
amounts. Ceded premiums are considered prepaid reinsurance premiums and are recognized as a reduction of
premiums earned over the contract period in proportion to the protection received. Amounts recoverable from
reinsurers on short-duration contracts are estimated in a manner consistent with the claims liabilities associated with
the reinsurance and presented as a component of Reinsurance assets. Assumed reinsurance premiums are earned
primarily on a pro-rata basis over the terms of the reinsurance contracts and the portion of premiums relating to the
unexpired terms of coverage is included in the reserve for unearned premiums. For both ceded and assumed
reinsurance, risk transfer requirements must be met for reinsurance accounting to apply. If risk transfer requirements
are not met, the contract is accounted for as a deposit, resulting in the recognition of cash flows under the contract
through a deposit asset or liability and not as revenue or expense. To meet risk transfer requirements, a reinsurance
contract must include both insurance risk, consisting of both underwriting and timing risk, and a reasonable possibility
of a significant loss for the assuming entity. Similar risk transfer criteria are used to determine whether directly written
insurance contracts should be accounted for as insurance or as a deposit.
..................................................................................................................................................................................................................................
AIG 2012 Form 10-K 267
2012 2011
At December 31, As Net of As Net of(in millions) Reported Reinsurance Reported Reinsurance
$ (87,991) $ (68,782)
(36,340) (35,408)
(22,537) (18,934)
23,744 –
I T E M 8 / N O T E 9 . R E I N S U R A N C E

.....................................................................................................................................................................................
The following table presents short-duration insurance premiums written and earned:
Premiums written:
Direct $ 41,710 $ 38,965 $ 898 $ 927 $ – $ – $ 42,608 $ 39,892
Assumed 3,031 2,442 – (2) 2 – 3,033 2,440
Ceded (9,901) (9,795) (97) (169) (2) – (10,000) (9,964)
Net $ 34,840 $ 31,612 $ 801 $ 756 $ – $ – $ 35,641 $ 32,368
Premiums earned:
Direct $ 42,878 $ 39,082 $ 835 $ 1,065 $ – $ – $ 43,713 $ 40,147
Assumed 3,294 2,488 55 80 (46) – 3,303 2,568
Ceded (10,483) (9,049) (98) (170) 46 – (10,535) (9,219)
Net $ 35,689 $ 32,521 $ 792 $ 975 $ – $ – $ 36,481 $ 33,496
* Includes results of Mortgage Guaranty.
For the years ended December 31, 2012, 2011 and 2010, reinsurance recoveries, which reduced loss and loss
expenses incurred, amounted to $4.5 billion, $6.1 billion and $8.0 billion, respectively.
Long-Duration Reinsurance..............................................................................................................................................................................................
Long-duration reinsurance is effected principally under yearly renewable term treaties. The premiums with respect to
these treaties are earned over the contract period in proportion to the protection provided. Amounts recoverable from
reinsurers on long-duration contracts are estimated in a manner consistent with the assumptions used for the
underlying policy benefits and are presented as a component of Reinsurance assets.
The following table presents premiums for our long-duration insurance and retirement services operations:
Gross premiums $ 3,104 $ 3,141 $ 17 $ 9,670 $ 3,121 $ 12,811
Ceded premiums (591) (621) (6) (435) (597) (1,056)
Net $ 2,513 $ 2,520 $ 11 $ 9,235 $ 2,524 $ 11,755
* Primarily represents results of AIA, which was deconsolidated during 2010.
Long-duration reinsurance recoveries, which reduced death and other benefits, approximated $758 million,
$611 million and $810 million, respectively, for the years ended December 31, 2012, 2011 and 2010.
The following table presents long-duration insurance in force ceded to other insurance companies:
Long-duration insurance in force ceded $ 140,156 $ 148,605
* Excludes amounts related to held-for-sale entities.
Long-duration insurance assumed in force represented 0.1 percent of gross long-duration insurance in force at
December 31, 2012, 0.07 percent at December 31, 2011 and 0.1 percent at December 31, 2010, and premiums
assumed by AIG Life and Retirement represented 0.5 percent, 0.5 percent and 0.3 percent of gross premiums for the
years ended December 31, 2012, 2011 and 2010, respectively.
AIG Life and Retirement operations utilize internal and third-party reinsurance relationships to manage insurance
risks and to facilitate capital management strategies. As a result of these reinsurance arrangements AIG Life and
Retirement is able to minimize the use of letters of credit and utilize capital more efficiently. Pools of highly-rated
third-party reinsurers are utilized to manage net amounts at risk in excess of retention limits. AIG Life and
Retirement’s domestic long-duration insurance companies also cede excess, non-economic reserves carried on a
..................................................................................................................................................................................................................................
AIG 2012 Form 10-K268
Years Ended AIG Property Casualty Other Businesses* Eliminations TotalDecember 31,(in millions) 2012 2011 2010 2012 2011* 2010* 2012 2011 2010 2012 2011 2010
$ 40,428 $ 938 $ – $ 41,366
3,428 (10) 7 3,425
(9,420) (70) (7) (9,497)
$ 34,436 $ 858 $ – $ 35,294
$ 40,954 $ 754 $ – $ 41,708
3,254 31 (30) 3,255
(9,335) (70) 30 (9,375)
$ 34,873 $ 715 $ – $ 35,588
Years Ended December 31, AIG Life and Retirement Divested Businesses* Total
(in millions) 2012 2011 2010 2012 2011 2010 2012 2011 2010
$ 3,030 $ 11 $ 3,041
(602) – (602)
$ 2,428 $ 11 $ 2,439
At December 31,(in millions) 2012 2011 2010*
$ 129,159
I T E M 8 / N O T E 9 . R E I N S U R A N C E

.....................................................................................................................................................................................
statutory-basis on certain term and universal life insurance policies and certain fixed annuities to onshore and
offshore affiliates.
AIG Life and Retirement generally obtains letters of credit to obtain statutory recognition of its intercompany
reinsurance transactions, particularly with respect to redundant statutory reserves requirements on term insurance
and universal life with secondary guarantees (XXX and AXXX reserves). For this purpose, AIG Life and Retirement
has a $585 million syndicated letter of credit facility outstanding at December 31, 2012, all of which relates to
long-duration intercompany reinsurance transactions. AIG Life and Retirement has also obtained approximately
$215 million of letters of credit on a bilateral basis all of which relates to long-duration intercompany reinsurance
transactions. All of these approximately $800 million of letters of credit are due to mature on December 31, 2015.
Reinsurance Security..............................................................................................................................................................................................
Our third-party reinsurance arrangements do not relieve us from our direct obligation to our insureds. Thus, a credit
exposure exists with respect to both short-duration and long-duration reinsurance ceded to the extent that any
reinsurer fails to meet the obligations assumed under any reinsurance agreement. We hold substantial collateral as
security under related reinsurance agreements in the form of funds, securities, and/or letters of credit. A provision
has been recorded for estimated unrecoverable reinsurance.
..................................................................................................................................................................................................................................
AIG 2012 Form 10-K 269
I T E M 8 / N O T E 9 . R E I N S U R A N C E

.....................................................................................................................................................................................
10. DEFERRED POLICY ACQUISITION COSTS..............................................................................................................................................................................................
Deferred policy acquisition costs represent those costs that are incremental and directly related to the successful
acquisition of new or renewal of existing insurance contracts. We defer incremental costs that result directly from,
and are essential to, the acquisition or renewal of an insurance contract. Such deferred policy acquisition costs
generally include agent or broker commissions and bonuses, premium taxes, and medical and inspection fees that
would not have been incurred if the insurance contract had not been acquired or renewed. Each cost is analyzed to
assess whether it is fully deferrable. We partially defer costs, including certain commissions, when we do not believe
that the entire cost is directly related to the acquisition or renewal of insurance contracts.
We also defer a portion of employee total compensation and payroll-related fringe benefits directly related to time
spent performing specific acquisition or renewal activities, including costs associated with the time spent on
underwriting, policy issuance and processing, and sales force contract selling. The amounts deferred are derived
based on successful efforts for each distribution channel and/or cost center from which the cost originates.
Advertising costs related to the issuance of insurance contracts that meet the direct-advertising criteria are deferred
and amortized as part of DAC.
Policy acquisition costs are deferred and amortized over the period in
which the related premiums written are earned, generally 12 months. DAC is grouped consistent with the manner in
which the insurance contracts are acquired, serviced and measured for profitability and is reviewed for recoverability
based on the profitability of the underlying insurance contracts. Investment income is anticipated in assessing the
recoverability of DAC. We assess the recoverability of DAC on an annual basis or more frequently if circumstances
indicate an impairment may have occurred. This assessment is performed by comparing recorded net unearned
premiums and anticipated investment income on in-force business to the sum of expected claims, claims adjustment
expenses, unamortized DAC and maintenance costs. If the sum of these costs exceeds the amount of recorded net
unearned premiums and anticipated investment income, the excess is recognized as an offset against the asset
established for DAC. This offset is referred to as a premium deficiency charge. Increases in expected claims and
claims adjustment expenses can have a significant impact on the likelihood and amount of a premium deficiency
charge.
Policy acquisition costs for participating life, traditional life and accident and
health insurance products are generally deferred and amortized, with interest, over the premium paying period. Policy
acquisition costs and policy issuance costs related to universal life, and investment-type products (investment-
oriented products) are deferred and amortized, with interest, in relation to the incidence of estimated gross profits to
be realized over the estimated lives of the contracts. Estimated gross profits are composed of net investment income,
net realized investment gains and losses, fees, surrender charges, expenses, and mortality and morbidity gains and
losses.
We use a ‘‘reversion to the mean’’ methodology, which allows us to maintain our long-term assumptions, while also
giving consideration to the effect of deviations from these assumptions occurring in the current period. A DAC
unlocking is performed when management determines that key assumptions (e.g. market return, surrender rates,
etc.) should be modified. The DAC asset is recalculated using the new assumptions. The use of a reversion to the
mean assumption is common within the industry; however, the parameters used in the methodology are subject to
judgment and vary within the industry. If estimated gross profits change significantly, DAC is recalculated using the
new assumptions. Any resulting adjustment is included in income as an adjustment to DAC. DAC is grouped
consistent with the manner in which the insurance contracts are acquired, serviced and measured for profitability and
is reviewed for recoverability based on the current and projected future profitability of the underlying insurance
contracts.
The DAC for investment-oriented products is also adjusted for changes in estimated gross profits that result from
changes in the net unrealized gains or losses on fixed maturity and equity securities available for sale. Because fixed
maturity and equity securities available for sale are carried at aggregate fair value, an adjustment is made to DAC
equal to the change in DAC amortization that would have been recorded if such securities had been sold at their
stated aggregate fair value and the proceeds reinvested at current yields. For long-duration traditional business, if
such reinvestment would not be sufficient to recover DAC and meet policyholder obligations an adjustment to DAC
and additional future policy benefits for those products is recorded using current best estimates that incorporate a
review of assumptions regarding mortality, morbidity, persistency, maintenance expenses and investment returns.
..................................................................................................................................................................................................................................
AIG 2012 Form 10-K270
Short-duration insurance contracts:
Long-duration insurance contracts:
I T E M 8 / N O T E 1 0 . D E F E R R E D P O L I C Y A C Q U I S I T I O N C O S T S

.....................................................................................................................................................................................
The change in these adjustments, net of tax, is included with the change in net unrealized appreciation (depreciation)
of investments that is credited or charged directly to Accumulated other comprehensive income (loss) (Shadow DAC).
Value of Business Acquired (VOBA) is determined at the time of acquisition and is reported in the Consolidated
Balance Sheet with DAC. This value is based on the present value of future pre-tax profits discounted at yields
applicable at the time of purchase. For participating life, traditional life and accident and health insurance products,
VOBA is amortized over the life of the business similar to that for DAC based on the assumptions at purchase. For
universal life, and investment-oriented products, VOBA is amortized in relation to the estimated gross profits to date
for each period.
For contracts accounted for at fair value, policy acquisition costs are expensed as incurred and not deferred or
amortized.
For discussion related to changes in deferred acquisition costs in 2012 due to the adoption of a new accounting
standard that addresses the accounting for costs associated with acquiring or renewing insurance contracts. See
Note 2 herein.
The following table presents a rollforward of DAC:
AIG Property Casualty:
Balance, beginning of year $ 2,099 $ 1,919
Acquisition costs deferred 4,548 4,058
Amortization expense (4,324) (3,894)
Increase (decrease) due to foreign exchange and other 52 16
Balance, end of year $ 2,375 $ 2,099
AIG Life and Retirement:
Balance, beginning of year $ 7,258 $ 8,462
Acquisition costs deferred 869 701
Amortization expense (1,142) (1,086)
Change in net unrealized losses on securities (486) (817)
Increase (decrease) due to foreign exchange 3 1
Other – (3)
Balance, end of year(a) $ 6,502 $ 7,258
Other operations:
Balance, beginning of year $ 32 $ 17,505
Dispositions(b) – (16,117)
Acquisition costs deferred 14 1,218
Amortization expense (20) (841)
Change in net unrealized gains (losses) on securities – 28
Increase due to foreign exchange 1 314
Activity of discontinued operations – 59
Reclassified to Assets held for sale – (1,960)
Other (2) (174)
Subtotal $ 25 $ 32
Consolidation and eliminations 35 42
Balance, end of year(a) $ 60 $ 74
Total deferred policy acquisition costs $ 8,937 $ 9,431
(a) Includes $(619) million, $(1.4) billion, and $(758) million for AIG Life and Retirement at December 31, 2012, 2011 and 2010, respectively, and
$(34) million for Divested businesses at 2011 related to the effect of net unrealized gains and losses on available for sale securities. For the year
ended December 31, 2010, there were no net unrealized gains and losses on available for sale securities associated with divested businesses.
(b) For 2010, includes AIA which was deconsolidated and ALICO which was sold in 2010.
..................................................................................................................................................................................................................................
AIG 2012 Form 10-K 271
Years Ended December 31,
(in millions) 2012 2011 2010
$ 2,375
4,861
(4,761)
(34)
$ 2,441
$ 6,502
724
(931)
(621)
(2)
–
$ 5,672
$ 25
–
36
(17)
–
–
–
–
–
$ 44
25
$ 69
$ 8,182
I T E M 8 / N O T E 1 0 . D E F E R R E D P O L I C Y A C Q U I S I T I O N C O S T S

.....................................................................................................................................................................................
Included in the above table is the VOBA, an intangible asset recorded during purchase accounting, which is
amortized in a manner similar to DAC. Amortization of VOBA was $53 million, $34 million and $90 million in 2012,
2011 and 2010, respectively, while the unamortized balance was $339 million, $430 million and $488 million at
December 31, 2012, 2011 and 2010, respectively. The percentage of the unamortized balance of VOBA at
December 31, 2012 expected to be amortized in 2013 through 2017 by year is: 8.3 percent, 7.3 percent, 6.9 percent,
6.0 percent and 6.4 percent, respectively, with 65.0 percent being amortized after five years. These projections are
based on current estimates for investment, persistency, mortality and morbidity assumptions. The DAC amortization
charged to income includes the increase or decrease of amortization related to Net realized capital gains (losses),
primarily in the retirement services business of AIG Life and Retirement. In 2012, 2011 and 2010, amortization
expense (increased) decreased by $119 million, $274 million and $114 million, respectively.
As we operate in various global markets, the estimated gross profits used to amortize DAC, VOBA and SIA are
subject to differing market returns and interest rate environments in any single period. The combination of market
returns and interest rates may lead to acceleration of amortization in some products and regions and simultaneous
deceleration of amortization in other products and regions.
DAC, VOBA and SIA for insurance-oriented, investment-oriented and retirement services products are reviewed for
recoverability, which involves estimating the future profitability of current business. This review involves significant
management judgment. If actual future profitability is substantially lower than estimated, AIG’s DAC, VOBA and SIA
may be subject to an impairment charge and AIG’s results of operations could be significantly affected in future
periods.
..................................................................................................................................................................................................................................
AIG 2012 Form 10-K272
I T E M 8 / N O T E 1 0 . D E F E R R E D P O L I C Y A C Q U I S I T I O N C O S T S

.....................................................................................................................................................................................
11. VARIABLE INTEREST ENTITIES..............................................................................................................................................................................................
A variable interest entity (VIE) is a legal entity that does not have sufficient equity at risk to finance its activities
without additional subordinated financial support or is structured such that equity investors lack the ability to make
significant decisions relating to the entity’s operations through voting rights and do not substantively participate in the
gains and losses of the entity. Consolidation of a VIE by its primary beneficiary is not based on majority voting
interest, but is based on other criteria discussed below.
While we enter into various arrangements with VIEs in the normal course of business, our involvement with VIEs is
primarily via our insurance companies as a passive investor in debt securities (rated and unrated) and equity
interests issued by VIEs. In all instances, we consolidate the VIE when we determine we are the primary beneficiary.
This analysis includes a review of the VIE’s capital structure, contractual relationships and terms, nature of the VIE’s
operations and purpose, nature of the VIE’s interests issued and our involvement with the entity. When assessing the
need to consolidate a VIE, we evaluate the design of the VIE as well as the related risks the entity was designed to
expose the variable interest holders to.
For VIEs with attributes consistent with that of an investment company or a money market fund, the primary
beneficiary is the party or group of related parties that absorbs a majority of the expected losses of the VIE, receives
the majority of the expected residual returns of the VIE, or both.
For all other variable interest entities, the primary beneficiary is the entity that has both (1) the power to direct the
activities of the VIE that most significantly affect the entity’s economic performance and (2) the obligation to absorb
losses or the right to receive benefits that could be potentially significant to the VIE. While also considering these
factors, the consolidation conclusion depends on the breadth of our decision-making ability and our ability to
influence activities that significantly affect the economic performance of the VIE.
Exposure to Loss..............................................................................................................................................................................................
Our total off-balance sheet exposure associated with VIEs, primarily consisting of financial guarantees and
commitments to real estate and investment funds, was $0.2 billion and $0.4 billion at December 31, 2012 and 2011,
respectively.
The following table presents our total assets, total liabilities and off-balance sheet exposure associated with
our variable interests in consolidated VIEs:
AIA/ALICO SPVs $ 14.2 $ 0.1
Real estate and investment funds(c) 1.5 0.4
Securitization Vehicles – –
Structured investment vehicles 1.0 –
Affordable housing partnerships 2.5 0.1
Other 3.6 2.0
Total $ 22.8 $ 2.6
(a) The assets of each VIE can be used only to settle specific obligations of that VIE.
(b) Decrease primarily due to the retirement of the AIA SPV Preferred Interests held by the Department of the Treasury. As a result, the AIA SPV
no longer qualified as a VIE. Assets include $567 million of cash held in escrow pursuant to the terms of the ALICO stock purchase agreement
between AIG and MetLife. See Note 16 herein for further discussion of the escrow arrangement.
(c) At December 31, 2012 and December 31, 2011, off-balance sheet exposure with respect to real estate and investments funds was
$48.7 million and $85.7 million, respectively.
We calculate our maximum exposure to loss to be (i) the amount invested in the debt or equity of the VIE, (ii) the
notional amount of VIE assets or liabilities where we have also provided credit protection to the VIE with the VIE as
the referenced obligation, and (iii) other commitments and guarantees to the VIE. Interest holders in VIEs sponsored
by us generally have recourse only to the assets and cash flows of the VIEs and do not have recourse to us, except
in limited circumstances when we have provided a guarantee to the VIE’s interest holders.
..................................................................................................................................................................................................................................
AIG 2012 Form 10-K 273
VIE Assets(a) VIE Liabilities
December 31, December 31, December 31, December 31,
(in billions) 2012 2011 2012 2011
$ 0.6(b) $ 0.1
1.0 0.2
2.4 –
1.7 0.1
2.3 0.2
3.3 1.3
$ 11.3 $ 1.9
I T E M 8 / N O T E 1 1 . V A R I A B L E I N T E R E S T E N T I T I E S

.....................................................................................................................................................................................
The following table presents total assets of unconsolidated VIEs in which we hold a variable interest, as well
as our maximum exposure to loss associated with these VIEs:
December 31, 2012
Real estate and investment funds
Affordable housing partnerships
Other
Total
December 31, 2011
Real estate and investment funds $ 18.3 $ 2.1 $ 0.3 $ 2.4
Affordable housing partnerships 0.6 0.6 – 0.6
Maiden Lane II and III interests 27.1 7.0 – 7.0
Other 1.5 – – –
Total $ 47.5 $ 9.7 $ 0.3 $ 10.0
Balance Sheet Classification..............................................................................................................................................................................................
Our interests in the assets and liabilities of consolidated and unconsolidated VIEs were classified in the
Consolidated Balance Sheet as follows:
Assets:
Available for sale securities $ 0.4 $ –
Trading securities 1.3 7.1
Mortgage and other loans receivable 0.5 –
Other invested assets* 17.2 2.6
Other asset accounts 3.4 –
Total $ 22.8 $ 9.7
Liabilities:
Long-term debt $ 1.7 $ –
Other liability accounts 0.9 –
Total $ 2.6 $ –
* Decrease from prior year was due to the repayment of the FRBNY Credit Facility from the AIA and ALICO SPVs pursuant to the
Recapitalization.
Real Estate and Investment Funds..............................................................................................................................................................................................
AIG, through AIG Global Real Estate, is an investor in various real estate investments, some of which are VIEs.
These investments are typically with unaffiliated third-party developers via a partnership or limited liability company
structure. The VIE’s activities consist of the development or redevelopment of commercial and residential real estate.
Our involvement varies from being a passive equity investor or finance provider to actively managing the activities of
the VIE.
Our insurance operations participate as passive investors in the equity issued primarily by third-party-managed hedge
and private equity funds. Our insurance operations typically are not involved in the design or establishment of VIEs,
nor do they actively participate in the management of VIEs.
..................................................................................................................................................................................................................................
AIG 2012 Form 10-K274
Maximum Exposure to Loss
Total VIE On-Balance Off-Balance
(in billions) Assets Sheet Sheet Total
$ 16.7 $ 1.8 $ 0.2 $ 2.0
0.5 0.5 – 0.5
1.0 0.1 – 0.1
$ 18.2 $ 2.4 $ 0.2 $ 2.6
Consolidated VIEs Unconsolidated VIEs
December 31, December 31, December 31, December 31,
(in billions) 2012 2011 2012 2011
$ 2.9 $ –
1.0 0.1
0.4 –
4.0 2.3
3.0 –
$ 11.3 $ 2.4
$ 0.7 $ –
1.2 –
$ 1.9 $ –
I T E M 8 / N O T E 1 1 . V A R I A B L E I N T E R E S T E N T I T I E S

.....................................................................................................................................................................................
Securitization Vehicles..............................................................................................................................................................................................
During 2012, we created VIEs that hold investments, primarily in investment-grade debt securities, and issued
beneficial interests in these investments. The majority of these beneficial interests are owned by AIG entities and we
maintain the power to direct the activities of the VIEs that most significantly impacts their economic performance and
bear the obligation to absorb losses or receive benefits from the entities that could potentially be significant to the
entities. Accordingly, we consolidate these entities and those beneficial interests issued to third-parties are reported
as Long-term debt.
Structured Investment Vehicle..............................................................................................................................................................................................
Through the DIB, we sponsor Nightingale Finance Ltd, a structured investment vehicle (SIV), which meets the
definition of a VIE. Nightingale Finance Ltd. invests in variable rate, investment-grade debt securities, the majority of
which are ABS. We have no equity interest in the SIV, but we maintain the power to direct the activities of the SIV
that most significantly impact the entity’s economic performance and bear the obligation to absorb economic losses
that could potentially be significant to the SIV. We are the primary beneficiary and consolidate the assets of the SIV,
which totaled over $1.7 billion as of December 31, 2012. Related liabilities were not significant.
Affordable Housing Partnerships..............................................................................................................................................................................................
SunAmerica Affordable Housing Partners, Inc. (SAAHP) organizes and invests in limited partnerships that develop
and operate affordable housing qualifying for federal tax credits, in addition to a few market rate properties across
the United States. The general partners in the operating partnerships are almost exclusively unaffiliated third-party
developers. We do not consolidate an operating partnership if the general partner is an unaffiliated person. Through
approximately 1,000 partnerships, SAAHP has investments in developments with approximately 130,000 apartment
units nationwide, and as of December 31, 2012, has syndicated approximately $7.7 billion in partnership equity to
other investors who will receive, among other benefits, tax credits under certain sections of the Internal Revenue
Code. The pre-tax income of SAAHP is reported, along with other AIG Life and Retirement partnership income, as a
component of the AIG Life and Retirement segment.
Maiden Lane Interests..............................................................................................................................................................................................
In 2008, certain of our wholly-owned life insurance companies sold all of their undivided interests in a pool of
$39.3 billion face amount of RMBS to ML II, whose sole member is the FRBNY. AIG has a significant variable
economic interest in ML II, which is a VIE.
In 2008, AIG entered into an agreement with the FRBNY, ML III and The Bank of New York Mellon, which
established arrangements, through ML III, to fund the purchase of multi-sector CDOs underlying or related to CDS
written by AIGFP. Concurrently, AIGFP’s counterparties to such CDS transactions agreed to terminate those CDS
transactions relating to the multi-sector CDOs purchased from them. AIG had a significant variable interest in ML III,
which was a VIE. In 2012, we received final distributions from ML II and ML III.
Other Asset Accounts..............................................................................................................................................................................................
Aircraft Trusts..............................................................................................................................................................................................
We have created two VIEs for the purpose of acquiring, owning, leasing, maintaining, operating and selling aircraft.
Our subsidiaries hold beneficial interests, including all the equity interests in these entities. These beneficial interests
include passive investments by our insurance operations in non-voting preferred equity interests and in the majority
of the debt issued by these entities. We maintain the power to direct the activities of the VIEs that most significantly
impact the entities’ economic performance, and bear the obligation to absorb economic losses or receive economic
benefits that could potentially be significant to the VIEs. As a result, we have determined that we are the primary
beneficiary and we fully consolidate the assets and liabilities of these entities, which totaled $1.2 billion and
$0.3 billion, respectively at December 31, 2012. The debt of these entities is not an obligation of, or guaranteed by,
us or any of our subsidiaries. Under a servicing agreement, ILFC acts as servicer for the aircraft owned by these
entities.
..................................................................................................................................................................................................................................
AIG 2012 Form 10-K 275
I T E M 8 / N O T E 1 1 . V A R I A B L E I N T E R E S T E N T I T I E S

.....................................................................................................................................................................................
Commercial Loans Vehicles..............................................................................................................................................................................................
We sponsor one VIE that has issued a variable funding note backed by a commercial loan collateralized by individual
life insurance assets. As of December 31, 2012, total consolidated assets and liabilities for this entity were
$412 million and $188 million, respectively; our maximum exposure, representing the carrying value of the consumer
loan, was $389 million.
Commercial Paper Conduit..............................................................................................................................................................................................
AIGFP is the primary beneficiary of Curzon Funding LLC, an asset-backed commercial paper conduit, the assets of
which serve as collateral for the conduit’s obligations.
RMBS, CMBS, Other ABS and CDOS..............................................................................................................................................................................................
Through our insurance company subsidiaries, we are a passive investor in RMBS, CMBS, other ABS and CDOs
primarily issued by domestic special-purpose entities. We generally do not sponsor or transfer assets to, or act as
the servicer to these asset-backed structures, and were not involved in the design of these entities.
Through our DIB, we also invest in CDOs and similar structures, which can be cash-based or synthetic and are
managed by third parties. The role of DIB is generally limited to that of a passive investor in structures we do not
manage.
Our maximum exposure in these types of structures is limited to our investment in securities issued by these entities.
Based on the nature of our investments and our passive involvement in these types of structures, we have
determined that we are not the primary beneficiary of these entities. We have not included these entities in the above
tables; however, the fair values of our investments in these structures are reported in Notes 6 and 7 herein.
Variable Interest Entities of Business Held for Sale..............................................................................................................................................................................................
Financing Vehicles..............................................................................................................................................................................................
ILFC has created wholly-owned subsidiaries for the purpose of purchasing aircraft and obtaining financing secured by
such aircraft. A portion of the secured debt has been guaranteed by the European Export Credit Agencies and the
Export-Import Bank of the United States. These entities meet the definition of a VIE because they do not have
sufficient equity to operate without ILFC’s subordinated financial support in the form of intercompany notes which
serve as equity. ILFC fully consolidates the entities, controls all the activities of the entities and guarantees the
activities of the entities. AIG has not included these entities in the above table as they are wholly-owned and there
are no other variable interests other than those of ILFC and the lenders. See Note 15 herein for further information.
Leasing Entities..............................................................................................................................................................................................
ILFC has created wholly-owned subsidiaries for the purpose of facilitating aircraft leases with airlines. The entities
meet the definition of a VIE because they do not have sufficient equity to operate without ILFC’s subordinated
financial support in the form of intercompany notes which serve as equity. ILFC fully consolidates the entities,
controls all the activities of the entities and fully guarantees the activities of the entities. AIG has not included these
entities in the above table as they are wholly owned and there are no other variable interests in the entities other
than those of ILFC.
..................................................................................................................................................................................................................................
AIG 2012 Form 10-K276
I T E M 8 / N O T E 1 1 . V A R I A B L E I N T E R E S T E N T I T I E S

.....................................................................................................................................................................................
12. DERIVATIVES AND HEDGE ACCOUNTING..............................................................................................................................................................................................
We use derivatives and other financial instruments as part of our financial risk management programs and as part of
our investment operations. Interest rate, currency, equity and commodity swaps, credit contracts (including the super
senior credit default swap portfolio), swaptions, options and forward transactions are accounted for as derivatives
recorded on a trade-date basis, and carried at fair value. Unrealized gains and losses are reflected in income, when
appropriate. In certain instances, a contract’s transaction price is the best indication of initial fair value. Aggregate
asset or liability positions are netted on the Consolidated Balance Sheet only to the extent permitted by qualifying
master netting arrangements in place with each respective counterparty. Cash collateral posted with counterparties in
conjunction with transactions supported by qualifying master netting arrangements is reported as a reduction of the
corresponding net derivative liability, while cash collateral received in conjunction with transactions supported by
qualifying master netting arrangements is reported as a reduction of the corresponding net derivative asset.
Derivatives, with the exception of bifurcated embedded derivatives, are reflected in the Consolidated Balance Sheet
in Derivative assets, at fair value and Derivative liabilities, at fair value. A bifurcated embedded derivative is
measured at fair value and accounted for in the same manner as a free standing derivative contract. The
corresponding host contract is accounted for according to the accounting guidance applicable for that instrument. A
bifurcated embedded derivative is generally presented with the host contract in the Consolidated Balance Sheet. See
Note 6 herein for additional information on embedded policy derivatives.
The following table presents the notional amounts and fair values of our derivative instruments:
Derivatives designated ashedging instruments:Interest rate contracts(b) $ – $ – $ 481 $ 38Foreign exchange contracts – – 180 1
Derivatives not designated ashedging instruments:Interest rate contracts(b) 72,660 8,286 73,248 6,870Foreign exchange contracts 3,278 145 3,399 178Equity contracts(c) 4,748 263 18,911 1,126Commodity contracts 691 136 861 146Credit contracts 407 89 25,857 3,366Other contracts(d) 24,305 741 2,125 372
Total derivatives notdesignated as hedginginstruments 106,089 9,660 124,401 12,058
Total derivatives $ 106,089 $ 9,660 $ 125,062 $ 12,097
(a) Fair value amounts are shown before the effects of counterparty netting adjustments and offsetting cash collateral.
(b) Includes cross currency swaps.
(c) Notional amount of derivative liabilities and fair values of derivative liabilities include $23 billion and $1.3 billion, respectively, at December 31,2012 and $18.3 billion and $0.9 billion, respectively at December 31, 2011 related to bifurcated embedded derivatives. A bifurcated embeddedderivative is generally presented with the host contract in the Consolidated Balance Sheet.
(d) Consist primarily of contracts with multiple underlying exposures.
..................................................................................................................................................................................................................................
AIG 2012 Form 10-K 277
December 31, 2012 December 31, 2011
Gross Derivative Gross Derivative Gross Derivative Gross DerivativeAssets Liabilities Assets Liabilities
Notional Fair Notional Fair Notional Fair Notional Fair(in millions) Amount Value(a) Amount Value(a) Amount Value(a) Amount Value(a)
$ – $ – $ – $ –– – – –
63,463 6,479 63,482 5,8068,325 104 10,168 1744,990 221 25,626 1,377
625 145 622 14670 60 16,244 2,051
20,449 38 1,488 206
97,922 7,047 117,630 9,760
$ 97,922 $ 7,047 $ 117,630 $ 9,760
I T E M 8 / N O T E 1 2 . D E R I V A T I V E S A N D H E D G E A C C O U N T I N G

.....................................................................................................................................................................................
The following table presents the fair values of derivative assets and liabilities in the Consolidated Balance
Sheet:
Global Capital Marketsderivatives:AIG Financial Products $ 86,128 $ 7,063 $ 90,241 $ 8,853AIG Markets 7,908 1,409 8,201 1,168
Total Global Capital Marketsderivatives 94,036 8,472 98,442 10,021
Non-Global Capital Marketsderivatives(a) 12,053 1,188 26,620 2,076
Total derivatives, gross $ 106,089 9,660 $ 125,062 12,097
Counterparty netting(b) (3,660) (3,660)Cash collateral(c) (1,501) (2,786)
Total derivatives, net 4,499 5,651
Less: Bifurcated embeddedderivatives – 918
Total derivatives onconsolidated balance sheet $ 4,499 $ 4,733
(a) Represents derivatives used to hedge the foreign currency and interest rate risk associated with insurance as well as embedded derivativesincluded in insurance contracts. Liabilities include bifurcated embedded derivatives, which are recorded in Policyholder contract deposits.
(b) Represents netting of derivative exposures covered by a qualifying master netting agreement.
(c) Represents cash collateral posted and received that is eligible for netting.
Collateral..............................................................................................................................................................................................
We engage in derivative transactions directly with unaffiliated third parties in most cases under International Swaps
and Derivatives Association, Inc. (ISDA) agreements. Many of the ISDA agreements also include Credit Support
Annex (CSA) provisions, which generally provide for collateral postings at various ratings and threshold levels. We
attempt to reduce our risk with certain counterparties by entering into agreements that enable collateral to be
obtained from a counterparty on an upfront or contingent basis. We minimize the risk that counterparties to
transactions might be unable to fulfill their contractual obligations by monitoring counterparty credit exposure and
collateral value and generally requiring additional collateral to be posted upon the occurrence of certain events or
circumstances. In addition, a significant portion of the derivative transactions have provisions that require collateral to
be posted upon a downgrade of our long-term debt ratings or give the counterparty the right to terminate the
transaction. In the case of some of the derivative transactions, as an alternative to posting collateral and subject to
certain conditions, we may assign the transaction to an obligor with higher debt ratings or arrange for a substitute
guarantee of our obligations by an obligor with higher debt ratings or take other similar action. The actual amount of
collateral required to be posted to counterparties in the event of such downgrades, or the aggregate amount of
payments that we could be required to make, depends on market conditions, the fair value of outstanding affected
transactions and other factors prevailing at and after the time of the downgrade.
Collateral posted by us to third parties for derivative transactions was $4.5 billion and $4.7 billion at December 31,
2012 and December 31, 2011, respectively. This collateral can generally be repledged or resold by the
counterparties. Collateral obtained by us from third parties for derivative transactions was $1.4 billion and $1.6 billion
at December 31, 2012 and December 31, 2011, respectively. We generally can repledge or resell this collateral.
Hedge Accounting..............................................................................................................................................................................................
We designated certain derivatives entered into by GCM with third parties as fair value hedges of available-for-sale
investment securities held by our insurance subsidiaries. The fair value hedges include foreign currency forwards
..................................................................................................................................................................................................................................
AIG 2012 Form 10-K278
December 31, 2012 December 31, 2011
Derivative Assets Derivative Liabilities Derivative Assets Derivative Liabilities
Notional Fair Notional Fair Notional Fair Notional Fair(in millions) Amount Value Amount Value Amount Value Amount Value
$ 59,854 $ 4,725 $ 66,717 $ 5,50614,028 1,308 18,774 1,818
73,882 6,033 85,491 7,324
24,040 1,014 32,139 2,436
$ 97,922 7,047 $ 117,630 9,760
(2,467) (2,467)(909) (1,976)
3,671 5,317
– 1,256
$ 3,671 $ 4,061
I T E M 8 / N O T E 1 2 . D E R I V A T I V E S A N D H E D G E A C C O U N T I N G

.....................................................................................................................................................................................
designated as hedges of the change in fair value of foreign currency denominated available-for-sale securities
attributable to changes in foreign exchange rates. We previously designated certain interest rate swaps entered into
by GCM with third parties as cash flow hedges of certain floating rate debt issued by ILFC, specifically to hedge the
changes in cash flows on floating rate debt attributable to changes in the benchmark interest rate. We de-designated
such cash flow hedges in December 2012 subsequent to the announcement of the ILFC Transaction.
We use foreign currency denominated debt and cross-currency swaps as hedging instruments in net investment
hedge relationships to mitigate the foreign exchange risk associated with our non-U.S. dollar functional currency
foreign subsidiaries. We assess the hedge effectiveness and measure the amount of ineffectiveness for these hedge
relationships based on changes in spot exchange rates. For the years ended December 31, 2012, 2011, and 2010
we recognized gains (losses) of $(74) million, $(13) million and $28 million, respectively, included in Foreign currency
translation adjustment in Accumulated other comprehensive income related to the net investment hedge
relationships.
A qualitative methodology is utilized to assess hedge effectiveness for net investment hedges, while regression
analysis is employed for all other hedges.
The following table presents the effect of our derivative instruments in fair value hedging relationships in the
Consolidated Statement of Operations:
Interest rate contracts:(a)
Loss recognized in earnings on derivatives $ (3)Gain recognized in earnings on hedged items(b) 152
Foreign exchange contracts:(a)
Loss recognized in earnings on derivatives (1)Gain recognized in earnings on hedged items 1
(a) Gains and losses recognized in earnings for the ineffective portion and amounts excluded from effectiveness testing, if any, are recorded inNet realized capital gains (losses).
(b) Includes $124 million and $149 million, for the years ended December 31, 2012 and 2011, respectively, representing the amortization of debtbasis adjustment recorded in Other income and Net realized capital gains (losses) following the discontinuation of hedge accounting.
The following table presents the effect of our derivative instruments in cash flow hedging relationships in the
Consolidated Statement of Operations:
Interest rate contracts(a):Gain (loss) recognized in OCI on derivatives $ (5)Gain (loss) reclassified from Accumulated OCI into earnings(b) (55)
(a) Hedge accounting was discontinued in December 2012 subsequent to the announcement of the ILFC Transaction. Gains and losses recognized inearnings are recorded in Income (loss) from discontinued operations. Previously the effective portion of the change in fair value of a derivative qualifying asa cash flow hedge was recorded in Accumulated other comprehensive income until earnings were affected by the variability of cash flows in the hedgeditem. Gains and losses reclassified from Accumulated other comprehensive income were previously recorded in Other income. Gains or losses recognizedin earnings on derivatives for the ineffective portion were previously recorded in Net realized capital gains (losses).
(b) Includes $19 million for the year ended December 2012, representing the reclassification from Accumulated other comprehensive income intoearnings following the discontinuation of cash flow hedges of ILFC debt.
..................................................................................................................................................................................................................................
AIG 2012 Form 10-K 279
$ –124
(2)2
$ (2)(35)
Years Ended December 31,(in millions) 2012 2011
Years Ended December 31,(in millions) 2012 2011
I T E M 8 / N O T E 1 2 . D E R I V A T I V E S A N D H E D G E A C C O U N T I N G

.....................................................................................................................................................................................
Derivatives Not Designated as Hedging Instruments..............................................................................................................................................................................................
The following table presents the effect of our derivative instruments not designated as hedging instruments
in the Consolidated Statement of Operations:
By Derivative Type:Interest rate contracts(a) $ 603Foreign exchange contracts 137Equity contracts(b) (263)Commodity contracts 4Credit contracts 337Other contracts 47
Total $ 865
By Classification:Policy fees $ 113Net investment income 8Net realized capital gains (losses) 248Other income (losses) 496
Total $ 865
(a) Includes cross currency swaps.
(b) Includes embedded derivative losses of $166 million and $397 million for the years ended December 31, 2012 and 2011, respectively.
Global Capital Markets Derivatives..............................................................................................................................................................................................
GCM enters into derivative transactions to mitigate market risk in its exposures (interest rates, currencies,
commodities, credit and equities) arising from its transactions. At December 31, 2012, GCM has entered into credit
derivative transactions with respect to $67 million of securities to economically hedge its credit risk. In most cases,
GCM has not hedged its exposures related to the credit default swaps it had written.
GCM follows a policy of minimizing interest rate, currency, commodity, and equity risks associated with investment
securities by entering into offsetting positions, thereby offsetting a significant portion of the unrealized appreciation
and depreciation.
Super Senior Credit Default Swaps..............................................................................................................................................................................................
Credit default swap transactions were entered into with the intention of earning revenue on credit exposure. In the
majority of these transactions, we sold credit protection on a designated portfolio of loans or debt securities.
Generally, such credit protection was provided on a ‘‘second loss’’ basis, meaning we would incur credit losses only
after a shortfall of principal and/or interest, or other credit events, in respect of the protected loans and debt
securities, exceeded a specified threshold amount or level of ‘‘first losses.’’
..................................................................................................................................................................................................................................
AIG 2012 Form 10-K280
Gains (Losses)Recognized in Earnings
$ (241)96
(641)(1)
6416
$ (140)
$ 1605
(672)367
$ (140)
Years Ended December 31,(in millions) 2012 2011
I T E M 8 / N O T E 1 2 . D E R I V A T I V E S A N D H E D G E A C C O U N T I N G

.....................................................................................................................................................................................
The following table presents the net notional amount, fair value of derivative liability and unrealized market
valuation gain of the super senior credit default swap portfolio, including credit default swaps written on
mezzanine tranches of certain regulatory capital relief transactions, by asset class:
Regulatory Capital:Corporate loans $ 1,830 $ – $ –Prime residential mortgages 3,653 – 6Other 887 9 8
Total 6,370 9 14
Arbitrage:Multi-sector CDOs(d) 5,476 3,077 249Corporate debt/CLOs(e) 11,784 127 44
Total 17,260 3,204 293
Mezzanine tranches 989 10 32
Total $ 24,619 $ 3,223 $ 339
(a) Net notional amounts presented are net of all structural subordination below the covered tranches. The decrease in the total net notionalamount from December 31, 2011 to December 31, 2012 was due primarily to terminations of $5.4 billion and amortization of $3.2 billion.
(b) Fair value amounts are shown before the effects of counterparty netting adjustments and offsetting cash collateral.
(c) Includes credit valuation adjustment gains (losses) of $(39) million and $26 million for the years ended December 31, 2012 and 2011,respectively, representing the effect of changes in our credit spreads on the valuation of the derivatives liabilities.
(d) During 2012, a super senior CDS transaction with a net notional amount of $470 million was terminated at approximately its fair value at thetime of termination. As a result, a $416 million loss, which was previously included in the fair value derivative liability as an unrealized marketvaluation loss, was realized. During 2012, $213 million was paid to counterparties with respect to multi-sector CDOs. Upon payment, a $213 millionloss, which was previously included in the fair value of the derivative liability as an unrealized market valuation loss, was realized. Multi-sector CDOsalso include $3.4 billion and $4.6 billion in net notional amount of credit default swaps written with cash settlement provisions at December 31, 2012and December 31, 2011, respectively. Collateral postings with regards to multi-sector CDOs were $1.6 billion and $2.7 billion at December 31, 2012and December 31, 2011, respectively.
(e) Corporate debt/CLOs include $1.2 billion in net notional amount of credit default swaps written on the super senior tranches of CLOs at bothDecember 31, 2012 and December 31, 2011. Collateral postings with regards to corporate debt/CLOs were $420 million and $477 million atDecember 31, 2012 and December 31, 2011, respectively.
The expected weighted average maturity of the super senior credit derivative portfolios as of December 31, 2012 was
less than one year for the regulatory capital prime residential mortgage portfolio, 6 years for the multi-sector CDO
arbitrage portfolio and 3 years for the corporate debt/CLO portfolio.
Given the current performance of the underlying portfolios, the level of subordination of the credit protection written
and the assessment of the credit quality of the underlying portfolio, as well as the risk mitigants inherent in the
transaction structures, we do not expect that we will be required to make payments pursuant to the contractual terms
of those transactions providing regulatory relief.
Because of long-term maturities of the CDS in the arbitrage portfolio, we are unable to make reasonable estimates of
the periods during which any payments would be made. However, the net notional amount represents the maximum
exposure to loss on the super senior credit default swap portfolio.
Written Single Name Credit Default Swaps..............................................................................................................................................................................................
We have also entered into credit default swap contracts referencing single-name exposures written on corporate,
index and asset-backed credits with the intention of earning spread income on credit exposure. Some of these
transactions were entered into as part of a long-short strategy to earn the net spread between CDS written and
purchased. At December 31, 2012, the net notional amount of these written CDS contracts was $410 million,
including ABS CDS transactions purchased from a liquidated multi-sector super senior CDS transaction. These
exposures have been partially hedged by purchasing offsetting CDS contracts of $51 million in net notional amount.
The net unhedged position of $359 million represents the maximum exposure to loss on these CDS contracts. The
average maturity of the written CDS contracts is 4 years. At December 31, 2012, the fair value of derivative liability
(which represents the carrying value) of the portfolio of CDS was $48 million.
..................................................................................................................................................................................................................................
AIG 2012 Form 10-K 281
Unrealized MarketFair Value of
Valuation Gain(c)
Net Notional Amount(a) Derivative Liability at(b)(c)
Years Ended December 31,December 31, December 31, December 31, December 31,
(in millions) 2012 2011 2012 2011 2012 2011
$ – $ – $ –97 – –– – 9
97 – 9
3,944 1,910 53811,832 60 67
15,776 1,970 605
– – 3
$ 15,873 $ 1,970 $ 617
I T E M 8 / N O T E 1 2 . D E R I V A T I V E S A N D H E D G E A C C O U N T I N G

.....................................................................................................................................................................................
Upon a triggering event (e.g., a default) with respect to the underlying credit, we would have the option to either
settle the position through an auction process (cash settlement) or pay the notional amount of the contract to thecounterparty in exchange for a bond issued by the underlying credit obligor (physical settlement).
These CDS contracts were written under ISDA Master Agreements. The majority of these ISDA Master Agreementsinclude credit support annexes (CSAs) that provide for collateral postings at various ratings and threshold levels. AtDecember 31, 2012, collateral posted by us under these contracts was $64 million prior to offsets for othertransactions.
All Other Derivatives..............................................................................................................................................................................................
Our businesses, other than GCM, also use derivatives and other instruments as part of their financial riskmanagement. Interest rate derivatives (such as interest rate swaps) are used to manage interest rate risk associatedwith embedded derivatives contained in insurance contract liabilities, fixed maturity securities, outstanding medium-and long-term notes as well as other interest rate sensitive assets and liabilities. Foreign exchange derivatives(principally foreign exchange forwards and options) are used to economically mitigate risk associated with non-U.S.dollar denominated debt, net capital exposures, and foreign currency transactions. Equity derivatives are used tomitigate financial risk embedded in certain insurance liabilities. The derivatives are effective economic hedges of theexposures that they are meant to offset.
In addition to hedging activities, we also enter into derivative instruments with respect to investment operations,which include, among other things, credit default swaps and purchasing investments with embedded derivatives, suchas equity-linked notes and convertible bonds.
Credit Risk-Related Contingent Features..............................................................................................................................................................................................
The aggregate fair value of our derivative instruments that contain credit risk-related contingent features that were ina net liability position at December 31, 2012, was approximately $3.9 billion. The aggregate fair value of assetsposted as collateral under these contracts at December 31, 2012, was 4.3 billion.
We estimate that at December 31, 2012, based on our outstanding financial derivative transactions a one-notchdowngrade of our long-term senior debt ratings to BBB+ by Standard & Poor’s Financial Services LLC, a subsidiaryof The McGraw-Hill Companies, Inc. (S&P), would permit counterparties to make additional collateral calls and permitcertain counterparties to elect early termination of contracts, resulting in a negligible amount of correspondingcollateral postings and termination payments; a one-notch downgrade to Baa2 by Moody’s Investors’ Service, Inc.(Moody’s) and an additional one-notch downgrade to BBB by S&P would result in approximately $102 million inadditional collateral postings and termination payments and a further one-notch downgrade to Baa3 by Moody’s andBBB- by S&P would result in approximately $112 million in additional collateral postings and termination payments.Additional collateral postings upon downgrade are estimated based on the factors in the individual collateral postingprovisions of the CSA with each counterparty and current exposure as of December 31, 2012. Factors considered in
estimating the termination payments upon downgrade include current market conditions, the complexity of thederivative transactions, historical termination experience and other observable market events such as bankruptcy anddowngrade events that have occurred at other companies. Our estimates are also based on the assumption thatcounterparties will terminate based on their net exposure to us. The actual termination payments could significantlydiffer from our estimates given market conditions at the time of downgrade and the level of uncertainty in estimatingboth the number of counterparties who may elect to exercise their right to terminate and the payment that may betriggered in connection with any such exercise.
Hybrid Securities with Embedded Credit Derivatives..............................................................................................................................................................................................
We invest in hybrid securities (such as credit-linked notes) with the intent of generating income, and not specificallyto acquire exposure to embedded derivative risk. As is the case with our other investments in RMBS, CMBS, CDOsand ABS, our investments in these hybrid securities are exposed to losses only up to the amount of our initialinvestment in the hybrid security. Other than our initial investment in the hybrid securities, we have no furtherobligation to make payments on the embedded credit derivatives in the related hybrid securities.
We elect to account for our investments in these hybrid securities with embedded written credit derivatives at fairvalue, with changes in fair value recognized in Net investment income and Other income. Our investments in thesehybrid securities are reported as Bond trading securities in the Consolidated Balance Sheet. The fair value of thesehybrid securities was $6.7 billion at December 31, 2012. These securities have a current par amount of $15.0 billionand have remaining stated maturity dates that extend to 2052.
..................................................................................................................................................................................................................................
AIG 2012 Form 10-K282
I T E M 8 / N O T E 1 2 . D E R I V A T I V E S A N D H E D G E A C C O U N T I N G

.....................................................................................................................................................................................
13. LIABILITY FOR UNPAID CLAIMS AND CLAIMS ADJUSTMENT EXPENSE AND FUTURE POLICY
BENEFITS FOR LIFE AND ACCIDENT AND HEALTH INSURANCE CONTRACTS AND
POLICYHOLDER CONTRACT DEPOSITS..............................................................................................................................................................................................
The liability for unpaid claims and claims adjustment expense represents the accumulation of estimates of unpaid
claims, including estimates for claims incurred but not reported and claim adjustments expenses, less applicable
discount for future investment income. We continually review and update the methods used to determine loss reserve
estimates and to establish the resulting reserves. Any adjustments resulting from this review are currently reflected in
pre-tax income. Because these estimates are subject to the outcome of future events, changes in estimates are
common given that loss trends vary and time is often required for changes in trends to be recognized and confirmed.
Reserve changes that increase previous estimates of ultimate cost are referred to as unfavorable or adverse
development or reserve strengthening. Reserve changes that decrease previous estimates of ultimate cost are
referred to as favorable development.
The following table presents the reconciliation of activity in the Liability for unpaid claims and claims
adjustment expense:
Liability for unpaid claims and claims adjustment expense, beginning of year $ 91,151 $ 85,386Reinsurance recoverable (19,644) (17,487)
Net liability for unpaid claims and claims adjustment expense, beginning ofyear 71,507 67,899
Foreign exchange effect 353 (126)Acquisitions(a) – 1,538Dispositions – (87)Changes in net loss reserves due to NICO transaction (1,703) –
Total 70,157 69,224
Losses and loss expenses incurred(b):Current year 27,931 24,455Prior years, other than accretion of discount(c) 195 4,182Prior years, accretion of discount 34 (562)
Total 28,160 28,075
Losses and loss expenses paid(b):Current year 11,534 9,873Prior years 15,958 15,919
Total 27,492 25,792
Balance, end of year:Net liability for unpaid claims and claims adjustment expense 70,825 71,507Reinsurance recoverable 20,320 19,644
Total $ 91,145 $ 91,151
(a) Represents the acquisition of Fuji on March 31, 2010.
(b) Includes amounts related to dispositions through the date of disposition.
(c) In 2012, includes $262 million, $46 million and $326 million related to excess casualty, commercial specialty workers’ compensation andenvironmental, respectively. In 2011, includes $(414) million, $145 million and $413 million related to excess casualty, commercial specialty workers’compensation and environmental, respectively. In 2010, includes $1.1 billion, $793 million and $1.5 billion related to excess casualty, excessworkers’ compensation and asbestos, respectively.
The net adverse development includes loss-sensitive business, for which we recognized a $54 million, $172 million
and $8 million loss-sensitive premium adjustment for the years ended December 31, 2012, 2011 and 2010,
respectively.
The 2010 net adverse loss development for prior accident years primarily relates to the asbestos, excess casualty,
excess workers’ compensation and primary workers’ compensation. Further, this charge primarily relates to accident
years 2007 and prior (accident years before the financial crisis in 2008) and a significant amount relates to accident
2005 and prior (accident years prior to the start of the managed reduction in these long-tail lines of business). In
2010, the reserve charges were primarily due to long-tail lines of business which have been reduced since 2006. In
..................................................................................................................................................................................................................................
AIG 2012 Form 10-K 283
Years Ended December 31,(in millions) 2012 2011 2010
$ 91,145(20,320)
70,825
757–
(11)90
71,661
25,385421(63)
25,743
9,29719,325
28,622
68,78219,209
$ 87,991
I T E M 8 / N O T E 1 3 . L I A B I L I T Y F O R U N P A I D C L A I M S A N D C L A I M S A D J U S T M E N T E X P E N S E A N D F U T U R E P O L I C Y
B E N E F I T S F O R L I F E A N D A C C I D E N T A N D H E A L T H I N S U R A N C E C O N T R A C T S A N D P O L I C Y H O L D E R C O N T R A C T D E P O S I T S

.....................................................................................................................................................................................
the case of asbestos, since 1985, standard policies have contained an absolute exclusion for asbestos and pollution-
related damages. The factors driving excess casualty loss cost were primarily due to medical inflation and the
exhaustion of underlying primary policies for products liability coverage and for homebuilders. In 2010, excess
workers’ compensation also experienced significant prior year development related to the passage of the Affordable
Care Act in March 2010 as we concluded that there is increased vulnerability to the risk of further cost-shifting to the
excess workers’ compensation class of business.
Discounting of Reserves..............................................................................................................................................................................................
At December 31, 2012, the liability for unpaid claims and claims adjustment expense reflects a net loss reserve
discount of $3.2 billion, including tabular and non-tabular calculations based upon the following assumptions:
• The tabular workers’ compensation discount is calculated using a 3.5 percent interest rate and the
1979-81 Decennial Mortality Table.
• The non-tabular workers’ compensation discount is calculated separately for companies domiciled in New York and
Pennsylvania, and follows the statutory regulations for each state. For New York companies, the discount is based
on a five percent interest rate and the companies’ own payout patterns. For Pennsylvania companies, the statute
has specified discount factors for accident years 2001 and prior, which are based on a six percent interest rate
and an industry payout pattern. For accident years 2002 and subsequent, the discount is based on the payout
patterns and investment yields of the companies.
• Certain asbestos business that was written by AIG Property Casualty is discounted, when allowed by the regulator
and when payments are fixed and determinable, based on the investment yields of the companies and the payout
pattern for this business.
The discount consists of the following: $801 million – tabular discount for workers’ compensation in the domestic
operations of AIG Property Casualty and $2.4 billion – non-tabular discount for workers’ compensation in the
domestic operations of AIG Property Casualty; and $51 million – non-tabular discount for asbestos for AIG Property
Casualty.
Future Policy Benefits..............................................................................................................................................................................................
Future policy benefits for life and accident and health insurance contracts include provisions for future dividends to
participating policyholders, accrued in accordance with all applicable regulatory or contractual provisions. Also
included in Future policy benefits are liabilities for annuities issued in structured settlement arrangements whereby a
claimant has agreed to settle a general insurance claim in exchange for fixed payments over a fixed determinable
period of time with a life contingency feature. Structured settlement liabilities are presented on a discounted basis
because the settled claims are fixed and determinable. Policyholder contract deposits also include our liability for
(a) certain guarantee benefits accounted for as embedded derivatives at fair value, (b) annuities issued in a
structured settlement arrangement with no life contingency and (c) certain contracts we elected to account for at fair
value.
The following table presents the components of future policy benefits:
Future policy benefits:Long duration and contracts $ 33,322Short duration contracts 995
Total future policy benefits $ 34,317
Long duration contract liabilities included in future policy benefits, as presented in the preceding table, result primarily
from life products. Short duration contract liabilities are primarily accident and health products. The liability for future
life policy benefits has been established on the basis of the following assumptions:
• Interest rates (exclusive of immediate/terminal funding annuities), which vary by year of issuance and products,
range from 1 percent to 9.5 percent within the first 20 years. Interest rates on immediate/terminal funding annuities
are at a maximum of 13.5 percent and grade to not greater than zero percent.
..................................................................................................................................................................................................................................
AIG 2012 Form 10-K284
At December 31,(in millions) 2012 2011
$ 36,121219
$ 36,340
I T E M 8 / N O T E 1 3 . L I A B I L I T Y F O R U N P A I D C L A I M S A N D C L A I M S A D J U S T M E N T E X P E N S E A N D F U T U R E P O L I C Y
B E N E F I T S F O R L I F E A N D A C C I D E N T A N D H E A L T H I N S U R A N C E C O N T R A C T S A N D P O L I C Y H O L D E R C O N T R A C T D E P O S I T S

.....................................................................................................................................................................................
• Mortality and surrender rates are based upon actual experience modified to allow for variations in policy form. The
weighted average lapse rate, including surrenders, for individual and group life was approximately 7.1 percent.
• Participating life business represented approximately 2.0 percent of the gross insurance in force at December 31,
2012 and 4.2 percent of gross Premiums and other considerations in 2012. The amount of annual dividends to be
paid is approved locally by the boards of directors of the life companies. Provisions for future dividend payments
are computed by jurisdiction, reflecting local regulations. The portions of current and prior Net income and of
current unrealized appreciation of investments that can inure to our benefit are restricted in some cases by the
insurance contracts and by the local insurance regulations of the jurisdictions in which the policies are in force.
Policyholder Contract Deposits..............................................................................................................................................................................................
The following table presents policyholder contract deposits liabilities:
Policyholder contract deposits:Annuities $ 98,657Universal life products 12,917Guaranteed investment contracts 6,788Variable products – fixed account option 3,181Corporate life products 2,239Other investment contracts 3,116
Total policyholder contract deposits $ 126,898
The liability for policyholder contract deposits has been established based on the following assumptions:
• Interest rates credited on deferred annuities, which vary by year of issuance, range from 1 percent to, including
bonuses, 9 percent. Current declared interest rates are generally guaranteed to remain in effect for a period of one
year though some are guaranteed for longer periods. Withdrawal charges generally range from zero percent to
20 percent grading to zero over a period of zero to 15 years.
• Guaranteed investment contracts (GICs) have market value withdrawal provisions for any funds withdrawn other
than benefit responsive payments. Interest rates credited generally range from 0.5 percent to 8.5 percent. The
majority of these GICs mature within four years.
• Interest rates on corporate life insurance products are guaranteed at 3 percent and the weighted average rate
credited in 2012 was 4.6 percent.
• The universal life products have credited interest rates of 1 percent to 8 percent and guarantees ranging from
1 percent to 5.5 percent depending on the year of issue. Additionally, universal life funds are subject to surrender
charges that amount to 9.7 percent of the aggregate fund balance grading to zero over a period not longer than
20 years.
• For variable products and investment contracts, policy values are expressed in terms of investment units. Each unit
is linked to an asset portfolio. The value of a unit increases or decreases based on the value of the linked asset
portfolio. The current liability at any time is the sum of the current unit value of all investment units plus any liability
for guaranteed minimum death or withdrawal benefits.
Certain products are subject to experience adjustments. These include group life and group medical products, credit
life contracts, accident and health insurance contracts/riders attached to life policies and, to a limited extent,
reinsurance agreements with other direct insurers. Ultimate premiums from these contracts are estimated and
recognized as revenue, and the unearned portions of the premiums recorded as liabilities. Experience adjustments
vary according to the type of contract and the territory in which the policy is in force and are subject to local
regulatory guidance.
..................................................................................................................................................................................................................................
AIG 2012 Form 10-K 285
At December 31,(in millions) 2012 2011
$ 98,54413,045
6,1783,9362,2843,130
$ 127,117
I T E M 8 / N O T E 1 3 . L I A B I L I T Y F O R U N P A I D C L A I M S A N D C L A I M S A D J U S T M E N T E X P E N S E A N D F U T U R E P O L I C Y
B E N E F I T S F O R L I F E A N D A C C I D E N T A N D H E A L T H I N S U R A N C E C O N T R A C T S A N D P O L I C Y H O L D E R C O N T R A C T D E P O S I T S

.....................................................................................................................................................................................
14. VARIABLE LIFE AND ANNUITY CONTRACTS..............................................................................................................................................................................................
We report variable contracts within the separate accounts when investment income and investment gains and losses
accrue directly to, and investment risk is borne by, the contract holder (traditional variable annuities), and the
separate account meets other accounting criteria to qualify for separate account treatment. The assets supporting the
variable portions of both traditional variable annuities and variable contracts with guarantees are carried at fair value
and reported as separate account assets with an equivalent summary total reported as separate account liabilities
when the separate account qualifies for separate account treatment. Assets for separate accounts that do not qualify
for separate account treatment are reported as trading account assets, and liabilities are included in the respective
policyholder liability account of the general account.
We also report variable annuity and life contracts through separate accounts, or general accounts when not qualified
for separate account reporting, when we contractually guarantee to the contract holder (variable contracts with
guarantees) either (a) total deposits made to the contract less any partial withdrawals plus a minimum return (and in
minor instances, no minimum returns) or (b) the highest contract value attained, typically on any anniversary date
minus any subsequent withdrawals following the contract anniversary. These guarantees include benefits that are
payable in the event of death, annuitization, or, in other instances, at specified dates during the accumulation period.
Such benefits are referred to as guaranteed minimum death benefits (GMDB), guaranteed minimum income benefits
(GMIB), guaranteed minimum withdrawal benefits (GMWB) and guaranteed minimum account value benefits (GMAV).
GMDB is our most widely offered benefit.
Amounts assessed against the contract holders for mortality, administrative, and other services are included in
revenue and changes in liabilities for minimum guarantees are included in Policyholder benefits and claims incurred
in the Consolidated Statement of Operations. Separate account net investment income, net investment gains and
losses, and the related liability changes are offset within the same line item in the Consolidated Statement of
Operations for those accounts that qualify for separate account treatment. Net investment income and gains and
losses on trading accounts for contracts that do not qualify for separate account treatment are reported in Net
investment income and are principally offset by amounts reported in Policyholder benefits and claims incurred.
The following table presents details concerning our GMDB exposures:
Account value(a) $ 57 $ 12
Amount at risk(b) 3 2
Average attained age of contract holders by
product 58 - 72 years 67 - 74 years
Range of guaranteed minimum return rates 3 - 10%
(a) Included in Policyholder contract deposits in the Consolidated Balance Sheet.
(b) Represents the amount of death benefit currently in excess of Account value.
The following summarizes GMDB and GMIB liabilities for guarantees on variable contracts reflected in the
general account:
Balance, beginning of year $ 412
Reserve increase 120
Benefits paid (87)
Balance, end of year $ 445
The GMDB liability is determined each period end by estimating the expected value of death benefits in excess of
the projected account balance and recognizing the excess ratably over the accumulation period based on total
expected assessments. We regularly evaluate estimates used and adjust the additional liability balance, with a
..................................................................................................................................................................................................................................
AIG 2012 Form 10-K286
2012 2011
Net Deposits Net Deposits
At December 31, Plus a Highest Contract Plus a Highest Contract
(dollars in billions) Minimum Return Value Attained Minimum Return Value Attained
$ 64 $ 13
2 1
59 - 73 years 66 - 75 years
3 - 10%
Years Ended December 31,
(in millions) 2012 2011
$ 445
43
(75)
$ 413
I T E M 8 / N O T E 1 4 . V A R I A B L E L I F E A N D A N N U I T Y C O N T R A C T S

.....................................................................................................................................................................................
related charge or credit to benefit expense, if actual experience or other evidence suggests that earlier assumptions
should be revised.
The following assumptions and methodology were used to determine the GMDB liability at December 31, 2012:
• Data used was up to 1,000 stochastically generated investment performance scenarios.
• Mean investment performance assumptions ranged from three percent to approximately ten percent depending on
the block of business.
• Volatility assumption was 16 percent.
• Mortality was assumed to be between 50 percent and 88 percent of the 1994 variable annuity minimum
guaranteed death benefit table for recent experience.
• Lapse rates vary by contract type and duration and ranged from zero percent to 37 percent.
• The discount rate ranged from 3.75 percent to 10 percent and is based on the growth rate assumption for the
underlying contracts in effect at the time of policy issuance.
In addition to GMDB, our contracts currently include to a lesser extent GMIB. The GMIB liability is determined each
period end by estimating the expected value of the annuitization benefits in excess of the projected account balance
at the date of annuitization and recognizing the excess ratably over the accumulation period based on total expected
assessments. We periodically evaluate estimates used and adjust the additional liability balance, with a related
charge or credit to benefit expense, if actual experience or other evidence suggests that earlier assumptions should
be revised.
In addition, our contracts currently include GMAV and GMWB benefits. GMAV and GMWB features are considered to
be embedded derivatives and are recognized at fair value through earnings. We enter into derivative contracts to
economically hedge a portion of the exposure that arises from GMAV and GMWB benefits. At December 31, 2012,
we had $19.8 billion of account values and $1.3 billion of net amount at risk that was attributable to variable
annuities with GMAV and GMWB benefits. See Note 6 herein for additional fair value disclosures.
..................................................................................................................................................................................................................................
AIG 2012 Form 10-K 287
I T E M 8 / N O T E 1 4 . V A R I A B L E L I F E A N D A N N U I T Y C O N T R A C T S

.....................................................................................................................................................................................
15. DEBT OUTSTANDING..............................................................................................................................................................................................
AIG’s long-term debt is denominated in various currencies, with both fixed and variable interest rates. Long-term debt
is carried at the principal amount borrowed, including unamortized discounts, hedge accounting valuation adjustments
and fair value adjustments, where applicable. The interest rates presented in the following table reflect the range of
contractual rates in effect at year end, including fixed and variable rate issuances.
The following table lists our total debt outstanding at December 31, 2012 and 2011. The interest rates
presented in the following table are the range of contractual rates in effect at year end, including fixed and
variable-rates:
Debt issued or guaranteed by AIG:
AIG general borrowings:
Notes and bonds payable 2.50% - 8.13% 2013 - 2097 $ 12,725
Subordinated debt 2.38% 2015 –
Junior subordinated debt(a) 4.88% - 8.63% 2037 - 2058 9,327
Loans and mortgages payable 1.09% - 9.00% 2013 - 2015 234
SunAmerica Financial Group, Inc. notes and
bonds payable 6.63% - 7.50% 2025 - 2029 298
Liabilities connected to trust preferred stock 7.57% - 8.50% 2030 - 2046 1,339
Total AIG general borrowings – – 23,923
AIG borrowings supported by assets:
MIP notes payable 0.38% - 8.59% 2013 - 2018 10,147
Series AIGFP matched notes and bonds payable 0.06% - 8.25% 2013 - 2052 3,807
GIAs, at fair value(b) 3.50% - 9.80% 2013 - 2047 7,964
Notes and bonds payable, at fair value(b) 0.18% - 10.37% 2013 - 2053 2,316
Loans and mortgages payable, at fair value – – 486
Total AIG borrowings supported by assets – – 24,720
Total debt issued or guaranteed by AIG – – 48,643
Debt not guaranteed by AIG:
ILFC:
Notes and bonds payable, ECA Facility, bank
financings and other secured financings 0.50% - 8.88% 2013 - 2025 23,365
Junior subordinated debt 4.54% - 6.25% 2065 999
Total ILFC debt(c) – – 24,364
Other subsidiaries notes, bonds, loans and
mortgages payable 0.24% - 8.29% 2013 - 2060 393
Debt of consolidated investments(d) 0.03% - 7.15% 2013 - 2035 1,853
Total debt not guaranteed by AIG – – 26,610
Total long term debt – – $ 75,253
(a) We may currently redeem our 6.45% Series A-4 and our 7.7% Series A-5 junior subordinated debt at their respective principal amounts plus
unpaid accrued interest on any of their respective interest payment dates. The remaining junior subordinated debt is subject to call options that
range from 2017-2038 and if we do not exercise these call options, the interest rate will change from the referenced fixed interest rate to a floating
rate. See further discussion under Junior Subordinated Debt below.
(b) DIB notes and bonds include structured debt instruments whose payment terms are linked to one or more financial or other indices (such as
equity index or commodity index or another measure that is not considered to be clearly and closely related to the debt instrument). The DIB
economically hedges its notes, bonds, and GIAs. As a result, certain of the interest rate or currency exposures are hedged with floating rate
instruments so the stated rates may not reflect the all-in cost of funding after taking into account the related hedges.
..................................................................................................................................................................................................................................
AIG 2012 Form 10-K288
Balance at Balance at
Year Ended December 31, 2012 Range of Maturity December 31, December 31,
(in millions) Interest Rate(s) Date(s) 2012 2011
$ 14,084
250
9,416
79
298
1,339
25,466
9,296
3,544
6,501
1,554
–
20,895
46,361
–
–
–
325
1,814
2,139
$ 48,500
I T E M 8 / N O T E 1 5 . D E B T O U T S T A N D I N G

.....................................................................................................................................................................................
(c) Excludes $24.3 billion of debt for ILFC at December 31, 2012 which has been reclassified to Liabilities of businesses held for sale.
(d) At December 31, 2012 and 2011, includes debt of consolidated investments held through AIG Global Real Estate Investment Corp., AIG Credit
Corp. and SunAmerica of $1.5 billion, $176 million and $133 million and $1.5 billion, $233 million and $91 million, respectively.
The following table presents maturities of long-term debt (including unamortized original issue discount,
hedge accounting valuation adjustments and fair value adjustments, when applicable), excluding $1.8 billion
in borrowings of consolidated investments:
General borrowings:
Notes and bonds payable $ 14,084 $ 1,469 $ 500 $ 999 $ 1,738 $ 1,455 $ 7,923
Subordinated debt 250 – – 250 – – –
Junior subordinated debt 9,416 – – – – – 9,416
Loans and mortgages payable 79 77 – 2 – – –
SAFG, Inc. notes and bonds payable 298 – – – – – 298
Liabilities connected to trust preferred stock 1,339 – – – – – 1,339
AIG general borrowings $ 25,466 $ 1,546 $ 500 $ 1,251 $ 1,738 $ 1,455 $ 18,976
Borrowings supported by assets:
MIP notes payable 9,296 851 1,613 1,021 1,329 3,971 511
Series AIGFP matched notes and bonds
payable 3,544 3 – – – – 3,541
GIAs, at fair value 6,501 380 585 601 321 260 4,354
Notes and bonds payable, at fair value 1,554 366 31 193 329 104 531
Loans and mortgages payable, at fair value – – – – – – –
AIG borrowings supported by assets 20,895 1,600 2,229 1,815 1,979 4,335 8,937
Other subsidiaries notes, bonds, loans and
mortgages payable 325 43 11 22 3 5 241
Total $ 46,686 $ 3,189 $ 2,740 $ 3,088 $ 3,720 $ 5,795 $ 28,154
Uncollateralized and collateralized notes, bonds, loans and mortgages payable consisted of the following:
AIG general borrowings $ 79 $ – $ 79
Other subsidiaries notes, bonds, loans and mortgages payable* 104 221 325
Total $ 183 $ 221 $ 404
* AIG does not guarantee any of these borrowings.
Junior Subordinated Debt..............................................................................................................................................................................................
During 2007 and 2008, we issued an aggregate of $12.5 billion of junior subordinated debentures denominated in
U.S. dollars, British Pounds and Euros in eight series of securities. In November 2011, we exchanged specified
series of our outstanding junior subordinated debentures for newly issued senior notes pursuant to an exchange
offer. In particular,we exchanged (i) $312 million aggregate principal amount of our outstanding Series A-1 Junior
Subordinated Debentures for $256 million aggregate principal amount of our new 6.820% Dollar notes due
November 15, 2037, (ii) £812 million ($1.26 billion at the December 31, 2011 exchange rate) aggregate principal
amount of our outstanding Series A-2 and Series A-8 Junior Subordinated Debentures for £662 million ($1.03 billion
at the December 31, 2011 exchange rate) aggregate principal amount of our new 6.765% Sterling notes due
November 15, 2017 and (iii) e591 million ($766 million at the December 31, 2011 exchange rate) aggregate principal
..................................................................................................................................................................................................................................
AIG 2012 Form 10-K 289
Year EndingDecember 31, 2012
(in millions) Total 2013 2014 2015 2016 2017 Thereafter
Uncollateralized Collateralized
At December 31, 2012 Notes/Bonds/Loans Loans and
(in millions) Payable Mortgages Payable Total
I T E M 8 / N O T E 1 5 . D E B T O U T S T A N D I N G

.....................................................................................................................................................................................
amount of our outstanding Series A-3 Junior Subordinated Debentures for e421 million ($545 million at the
December 31, 2011 exchange rate) aggregate principal amount of our new 6.797% Euro notes due November 15,
2017. This exchange resulted in a pre-tax gain on extinguishment of debt of approximately $484 million, which is
reflected in Net loss on extinguishment of debt in the Consolidated Statement of Operations and a deferred gain of
$65 million, which will be amortized as a reduction to future interest expense.
In connection with the issuance of the eight series of junior subordinated debentures, we had entered into
replacement capital covenants (the Original RCCs) for the benefit of the holders of ‘‘covered debt’’ (a designated
series of our notes). The Original RCCs provided that we would not repay, redeem, or purchase the applicable series
of junior subordinated debentures on or before a specified date, unless we issued certain replacement capital
securities. In August 2012, we issued an aggregate of $250 million of 2.375% Subordinated Notes due 2015 (the
Subordinated Notes), which upon their issuance became the ‘‘covered debt’’ under the Original RCCs. The holders of
the newly issued Subordinated Notes, as the holders of the ‘‘covered debt’’ under the Original RCCs, consented to
amendments to each of those Original RCCs that deleted all of the covenants that restricted our ability to repay,
redeem or purchase the applicable series of the junior subordinated debentures.
We have entered into new replacement capital covenants (the New RCCs) for the initial benefit of the holders of the
Subordinated Notes, in connection with our 5.75% Series A-2 Junior Subordinated Debentures and our 4.875%
Series A-3 Junior Subordinated Debentures. We covenant in each New RCC that, subject to certain exceptions, we
will not repay, redeem or purchase, and that none of our subsidiaries will purchase, the applicable series of junior
subordinated debentures prior to the scheduled termination date of that New RCC, unless since the date 360 days
prior to the date of that repayment, redemption or purchase, we have received a specified amount of net cash
proceeds from the sale of common stock or certain other qualifying securities that have certain characteristics that
are at least as equity-like as the applicable characteristics of the applicable series of junior subordinated debentures,
or we or our subsidiaries have issued a specified amount of common stock in connection with the conversion or
exchange of certain convertible or exchangeable securities.
We may currently redeem our 6.45% Series A-4 Junior Subordinated Debentures and our 7.70% Series A-5 Junior
Subordinated Debentures, in whole or in part, at their respective principal amounts plus accrued and unpaid interest
through the date of redemption.
Liabilities Connected To Trust Preferred Stock..............................................................................................................................................................................................
In connection with our acquisition of SunAmerica Financial Group, Inc. (SAFG, Inc.) in 2001, we entered into
arrangements with SAFG, Inc. with respect to outstanding SAFG, Inc. capital securities. In 1996, SAFG, Inc. issued
capital securities through a trust to institutional investors and funded the trust with SAFG, Inc. junior subordinated
debentures issued to the trust. SAFG, Inc. guaranteed payments to the holders of capital securities only to the extent
(i) the trust received payments on the debentures and (ii) these payments were available for the trust to pay to
holders of capital securities. In 2001, AIG Parent guaranteed the same payments to the holders of capital securities.
Like the SAFG, Inc. guarantee, the AIG Parent guarantee only applies to any payments actually made to the trust in
respect of the debentures. If no payments are made on the debentures, AIG Parent is not required to make any
payments to the trust. AIG Parent also guaranteed the debentures pursuant to a guarantee that is expressly
subordinated to certain SAFG, Inc. senior debt securities. Under the AIG Parent guarantee, AIG Parent is not
required to make any payments in respect of the debentures if such payment would be prohibited by the
subordination provisions of the debentures. As a result, AIG Parent will never be required to make a payment under
its guarantee of the debentures for so long as SAFG, Inc. is prohibited from making a payment on the debentures.
At December 31, 2012, the preferred stock outstanding consisted of $300 million liquidation value of 8.5 percent
preferred stock issued by American General Capital II in June 2000, $500 million liquidation value of 8.125 percent
preferred stock issued by American General Institutional Capital B in March 1997 and $500 million liquidation value
of 7.57 percent preferred stock issued by American General Institutional Capital A in December 1996.
..................................................................................................................................................................................................................................
AIG 2012 Form 10-K290
I T E M 8 / N O T E 1 5 . D E B T O U T S T A N D I N G

.....................................................................................................................................................................................
Credit Facilities..............................................................................................................................................................................................
On October 5, 2012, we terminated our previously outstanding $1.5 billion 364-Day syndicated credit facility and
amended and restated the four-year syndicated credit facility that was entered into in October 2011 (the Previous
Facility). The amended and restated four-year syndicated credit facility, the Four-Year Facility, provides for
$4.0 billion of unsecured revolving loans (increased from $3.0 billion in the Previous Facility), which includes a
$2.0 billion letter of credit sublimit (increased from $1.5 billion in the Previous Facility). The approximately $1.0 billion
of previously issued letters of credit under the Previous Facility were rolled into the letter of credit sublimit within the
Four-Year Facility. As a result, a total of approximately $3.0 billion remains available under the Four-Year Facility, of
which approximately $1.0 billion remains available for letters of credit. We expect that we may draw down on the
Four-Year Facility from time to time, and may use the proceeds for general corporate purposes. The Four Year
Facility also provides for the issuance of letters of credit. The Four-Year Facility is summarized in the following table.
Four-Year Syndicated Credit Facility $ 4,000 $ 3,037 October 2016 10/05/2012
..................................................................................................................................................................................................................................
AIG 2012 Form 10-K 291
December 31, 2012
(in millions) Available Effective
Facility Size Amount Expiration Date
I T E M 8 / N O T E 1 5 . D E B T O U T S T A N D I N G

.....................................................................................................................................................................................
16. CONTINGENCIES, COMMITMENTS AND GUARANTEES..............................................................................................................................................................................................
In the normal course of business, various contingent liabilities and commitments are entered into by AIG and certain
of its subsidiaries. In addition, AIG guarantees various obligations of certain subsidiaries.
AIG recorded an increase in its estimated litigation liability of approximately $783 million for the year ended
December 31, 2012 based on developments in several actions.
Although AIG cannot currently quantify its ultimate liability for unresolved litigation and investigation matters, including
those referred to below, it is possible that such liability could have a material adverse effect on AIG’s consolidated
financial condition or its consolidated results of operations or consolidated cash flows for an individual reporting
period.
Legal Contingencies..............................................................................................................................................................................................
AIG and its subsidiaries, in common with the insurance and financial services industries in general, are
subject to litigation, including claims for punitive damages, in the normal course of their business. In AIG’s insurance
operations (including UGC), litigation arising from claims settlement activities is generally considered in the
establishment of AIG’s liability for unpaid claims and claims adjustment expense. However, the potential for
increasing jury awards and settlements makes it difficult to assess the ultimate outcome of such litigation. AIG is also
subject to derivative, class action and other claims asserted by its shareholders and others alleging, among other
things, breach of fiduciary duties by its directors and officers and violations of insurance laws and regulations, as well
as federal and state securities laws. In the case of any derivative action brought on behalf of AIG, any recovery
would accrue to the benefit of AIG.
Various regulatory and governmental agencies have been reviewing certain public disclosures, transactions and
practices of AIG and its subsidiaries in connection with industry-wide and other inquiries into, among other matters,
AIG’s liquidity, compensation paid to certain employees, payments made to counterparties, and certain business
practices and valuations of current and former operating insurance subsidiaries. AIG has cooperated, and will
continue to cooperate, in producing documents and other information in response to subpoenas and other requests.
AIG’s Subprime Exposure, AIGFP Credit Default Swap Portfolio and Related Matters..............................................................................................................................................................................................
AIG, AIGFP and certain directors and officers of AIG, AIGFP and other AIG subsidiaries have been named in various
actions relating to our exposure to the U.S. residential subprime mortgage market, unrealized market valuation losses
on AIGFP’s super senior credit default swap portfolio, losses and liquidity constraints relating to our securities lending
program and related disclosure and other matters (Subprime Exposure Issues).
Between May 21, 2008 and January 15, 2009, eight purported
securities class action complaints were filed against AIG and certain directors and officers of AIG and AIGFP, AIG’s
outside auditors, and the underwriters of various securities offerings in the United States District Court for the
Southern District of New York (the Southern District of New York), alleging claims under the Securities Exchange Act
of 1934, as amended (the Exchange Act), or claims under the Securities Act of 1933, as amended (the Securities
Act). On March 20, 2009, the Court consolidated all eight of the purported securities class actions as In re American
International Group, Inc. 2008 Securities Litigation (the Consolidated 2008 Securities Litigation).
On May 19, 2009, lead plaintiff in the Consolidated 2008 Securities Litigation filed a consolidated complaint on behalf
of purchasers of AIG Common Stock during the alleged class period of March 16, 2006 through September 16, 2008,
and on behalf of purchasers of various AIG securities offered pursuant to AIG’s shelf registration statements. The
consolidated complaint alleges that defendants made statements during the class period in press releases, AIG’s
quarterly and year-end filings, during conference calls, and in various registration statements and prospectuses in
connection with the various offerings that were materially false and misleading and that artificially inflated the price of
AIG Common Stock. The alleged false and misleading statements relate to, among other things, the Subprime
Exposure Issues. The consolidated complaint alleges violations of Sections 10(b) and 20(a) of the Exchange Act and
Sections 11, 12(a)(2), and 15 of the Securities Act. On August 5, 2009, defendants filed motions to dismiss the
consolidated complaint, and on September 27, 2010, the Court denied the motions to dismiss.
..................................................................................................................................................................................................................................
AIG 2012 Form 10-K292
Overview.
Consolidated 2008 Securities Litigation.
I T E M 8 / N O T E 1 6 . C O N T I N G E N C I E S , C O M M I T M E N T S A N D G U A R A N T E E S

.....................................................................................................................................................................................
On April 1, 2011, the lead plaintiff in the Consolidated 2008 Securities Litigation filed a motion to certify a class of
plaintiffs. On November 2, 2011, the Court terminated the motion without prejudice to an application for restoration.
On March 30, 2012, the lead plaintiff filed a renewed motion to certify a class of plaintiffs.
We have accrued our estimate of probable loss with respect to this litigation.
On November 18, 2011, January 20, 2012, June 11, 2012, and August 8, 2012, four separate, though similar,
securities actions were brought against AIG and certain directors and officers of AIG and AIGFP by the Kuwait
Investment Authority, various Oppenheimer Funds, eight foreign funds and investment entities led by the British Coal
Staff Superannuation Scheme, and Pacific Life Funds and Pacific Select Fund. As of February 21, 2013, no
discussions concerning potential damages have occurred and the plaintiffs have not formally specified an amount of
alleged damages in their respective actions. As a result, we are unable to reasonably estimate the possible loss or
range of losses, if any, arising from these litigations.
Between June 25, 2008, and November 25, 2008, AIG,
certain directors and officers of AIG, and members of AIG’s Retirement Board and Investment Committee were
named as defendants in eight purported class action complaints asserting claims on behalf of participants in certain
pension plans sponsored by AIG or its subsidiaries. The Court subsequently consolidated these eight actions as In re
American International Group, Inc. ERISA Litigation II. On September 4, 2012, lead plaintiffs’ counsel filed a second
consolidated amended complaint. The action purports to be brought as a class action under the Employee
Retirement Income Security Act of 1974, as amended (ERISA), on behalf of all participants in or beneficiaries of
certain benefit plans of AIG and its subsidiaries that offered shares of AIG Common Stock. In the consolidated
amended complaint, plaintiffs allege, among other things, that the defendants breached their fiduciary responsibilities
to plan participants and their beneficiaries under ERISA, by continuing to offer the AIG Stock Fund as an investment
option in the plans after it allegedly became imprudent to do so. The alleged ERISA violations relate to, among other
things, the defendants’ purported failure to monitor and/or disclose certain matters, including the Subprime Exposure
Issues.
On November 20, 2012, defendants filed motions to dismiss the consolidated amended complaint.
As of February 21, 2013, plaintiffs have not formally specified an amount of alleged damages, discovery is ongoing,
and the Court has not determined if a class action is appropriate or the size or scope of any class. As a result, we
are unable to reasonably estimate the possible loss or range of losses, if any, arising from the litigation.
On November 12, 2008, an
application was filed in the Ontario Superior Court of Justice for leave to bring a purported class action against AIG,
AIGFP, certain directors and officers of AIG and Joseph Cassano, the former Chief Executive Officer of AIGFP,
pursuant to the Ontario Securities Act. If the Court grants the application, a class plaintiff will be permitted to file a
statement of claim against defendants. The proposed statement of claim would assert a class period of March 16,
2006 through September 16, 2008 and would allege that during this period defendants made false and misleading
statements and omissions in quarterly and annual reports and during oral presentations in violation of the Ontario
Securities Act.
On April 17, 2009, defendants filed a motion record in support of their motion to stay or dismiss for lack of jurisdiction
and forum non conveniens. On July 12, 2010, the Court adjourned a hearing on the motion pending a decision by
the Supreme Court of Canada in a pair of actions captioned Club Resorts Ltd. v. Van Breda 2012 SCC 17 (Van
Breda). On April 18, 2012, the Supreme Court of Canada clarified the standard for determining jurisdiction over
foreign and out-of-province defendants, such as AIG, by holding that a defendant must have some form of ‘‘actual,’’
as opposed to a merely ‘‘virtual,’’ presence in order to be deemed to be ‘‘doing business’’ in the jurisdiction. The
Supreme Court of Canada also suggested that in future cases, defendants may contest jurisdiction even when they
are found to be doing business in a Canadian jurisdiction if their business activities in the jurisdiction are unrelated to
the subject matter of the litigation. The matter has been stayed pending further developments in the Consolidated
2008 Securities Litigation.
In plaintiff’s proposed statement of claim, plaintiff alleged general and special damages of $500 million and punitive
damages of $50 million plus prejudgment interest or such other sums as the Court finds appropriate. As of
February 21, 2013 the Court has not determined whether it has jurisdiction or granted plaintiff’s application to file a
statement of claim, no merits discovery has occurred and the action has been stayed. As a result, we are unable to
reasonably estimate the possible loss or range of losses, if any, arising from the litigation.
..................................................................................................................................................................................................................................
AIG 2012 Form 10-K 293
ERISA Actions – Southern District of New York.
Canadian Securities Class Action – Ontario Superior Court of Justice.
I T E M 8 / N O T E 1 6 . C O N T I N G E N C I E S , C O M M I T M E N T S A N D G U A R A N T E E S

.....................................................................................................................................................................................
Starr International Litigation..............................................................................................................................................................................................
On November 21, 2011, Starr International Company, Inc. (SICO) filed a complaint against the United States in the
United States Court of Federal Claims (the Court of Federal Claims), bringing claims, both individually and on behalf
of all others similarly situated and derivatively on behalf of AIG (the SICO Treasury Action). The complaint challenges
the government’s assistance of AIG, pursuant to which AIG entered into the FRBNY Credit Facility and the United
States received an approximately 80 percent ownership in AIG. The complaint alleges that the interest rate imposed
on AIG and the appropriation of approximately 80 percent of AIG’s equity was discriminatory, unprecedented, and
inconsistent with liquidity assistance offered by the government to other comparable firms at the time and violated the
Equal Protection, Due Process, and Takings Clauses of the U.S. Constitution.
On November 21, 2011, SICO also filed a second complaint in the Southern District of New York against the FRBNY
bringing claims, both individually and on behalf of all others similarly situated and derivatively on behalf of AIG (the
SICO New York Action). This complaint also challenges the government’s assistance of AIG, pursuant to which AIG
entered into the FRBNY Credit Facility and the United States received an approximately 80 percent ownership in
AIG. The complaint alleges that the FRBNY owed fiduciary duties to AIG as our controlling shareholder, and that the
FRBNY breached these fiduciary duties by ‘‘divert[ing] the rights and assets of AIG and its shareholders to itself and
favored third parties’’ through transactions involving ML III, an entity controlled by the FRBNY, and by ‘‘participating
in, and causing AIG’s officers and directors to participate in, the evasion of AIG’s existing Common Stock
shareholders’ right to approve the massive issuance of the new Common Shares required to complete the
government’s taking of a nearly 80 percent interest in the Common Stock of AIG.’’ SICO also alleges that the
‘‘FRBNY has asserted that in exercising its control over, and acting on behalf of, AIG it did not act in an official,
governmental capacity or at the direction of the United States,’’ but that ‘‘[t]o the extent the proof at or prior to trial
shows that the FRBNY did in fact act in a governmental capacity, or at the direction of the United States, the
improper conduct . . . constitutes the discriminatory takings of the property and property rights of AIG without due
process or just compensation.’’
On January 31, 2012 and February 1, 2012, amended complaints were filed in the Court of Federal Claims and the
Southern District of New York, respectively.
In rulings dated July 2, 2012, and September 17, 2012, the Court of Federal Claims largely denied the United States’
motion to dismiss in the SICO Treasury Action. Discovery is proceeding. On December 3, 2012, SICO moved for
class certification.
On November 19, 2012, the Southern District of New York granted the FRBNY’s motion to dismiss the SICO New
York Action. On December 21, 2012, SICO filed a notice of appeal in the United States Court of Appeals for the
Second Circuit.
The United States has alleged, as an affirmative defense in its answer, that AIG is obligated to indemnify the FRBNY
and its representatives, including the Federal Reserve Board of Governors and the United States (as the FRBNY’s
principal), for any recovery in the SICO Treasury Action, and seeks a contingent offset or recoupment for the value
of net operating loss benefits the United States alleges that we received as a result of the government’s assistance.
The FRBNY has also requested indemnification under the FRBNY Credit Facility from AIG in connection with the
SICO New York Action and from ML III under the Master Investment and Credit Agreement and the Amended and
Restated Limited Liability Company Agreement of ML III.
In both of the actions commenced by SICO, the only claims naming AIG as a party (nominal defendant) are
derivative claims on behalf of AIG. On September 21, 2012, SICO made a pre-litigation demand on our Board
demanding that we pursue the derivative claims in both actions or allow SICO to pursue the claims on our behalf. On
January 9, 2013, our Board unanimously refused SICO’s demand in its entirety and on January 23, 2013, counsel for
the Board sent a letter to counsel for SICO describing the process by which our Board considered and refused
SICO’s demand and stating the reasons for our Board’s determination.
Other Litigation Related to AIGFP..............................................................................................................................................................................................
On September 30, 2009, Brookfield Asset Management, Inc. and Brysons International, Ltd. (together, Brookfield)
filed a complaint against AIG and AIGFP in the Southern District of New York. Brookfield seeks a declaration that a
..................................................................................................................................................................................................................................
AIG 2012 Form 10-K294
I T E M 8 / N O T E 1 6 . C O N T I N G E N C I E S , C O M M I T M E N T S A N D G U A R A N T E E S

.....................................................................................................................................................................................
1990 interest rate swap agreement between Brookfield and AIGFP (guaranteed by AIG) terminated upon the
occurrence of certain alleged events that Brookfield contends constituted defaults under the swap agreement’s
standard ‘‘bankruptcy’’ default provision. Brookfield claims that it is excused from all future payment obligations under
the swap agreement on the basis of the purported termination. At December 31, 2012, the estimated present value
of expected future cash flows discounted at LIBOR was $1.5 billion, which represents our maximum contractual loss
from the alleged termination of the contract. It is our position that no termination event has occurred and that the
swap agreement remains in effect. A determination that a termination event has occurred could result in a loss of our
entitlement to all future payments under the swap agreement and result in a loss to us of the full value at which we
are carrying the swap agreement.
Additionally, a determination that AIG triggered a ‘‘bankruptcy’’ event of default under the swap agreement could
also, depending on the Court’s precise holding, affect other AIG or AIGFP agreements that contain the same or
similar default provisions. Such a determination could also affect derivative agreements or other contracts between
third parties, such as credit default swaps under which AIG is a reference credit, which could affect the trading price
of AIG securities. During the third quarter of 2011, beneficiaries of certain previously repaid AIGFP guaranteed
investment agreements brought an action against AIG Parent and AIGFP making ‘‘bankruptcy’’ event of default
allegations similar to those made by Brookfield. The Court subsequently issued a decision dismissing that action,
which is currently on appeal.
Employment Litigation against AIG and AIG Global Real Estate Investment Corporation...............................................................................................................................................................................................
On December 9, 2009, AIG Global Real Estate Investment Corporation’s (AIGGRE) former
President, Kevin P. Fitzpatrick, several entities he controls, and various other single purpose entities (the SPEs) filed
a complaint in the Supreme Court of the State of New York, New York County against AIG and AIGGRE (the
Defendants). The case was removed to the Southern District of New York, and an amended complaint was filed on
March 8, 2010. The amended complaint asserts that the Defendants violated fiduciary duties to Fitzpatrick and his
controlled entities and breached Fitzpatrick’s employment agreement and agreements of SPEs that purportedly
entitled him to carried interest fees arising out of the sale or disposition of certain real estate. Fitzpatrick has also
brought derivative claims on behalf of the SPEs, purporting to allege that the Defendants breached contractual and
fiduciary duties in failing to fund the SPEs with various amounts allegedly due under the SPE agreements. Fitzpatrick
has also requested injunctive relief, an accounting, and that a receiver be appointed to manage the affairs of the
SPEs. He has further alleged that the SPEs are subject to a constructive trust. Fitzpatrick also has alleged a violation
of ERISA relating to retirement benefits purportedly due. Fitzpatrick has claimed that he is currently owed damages
totaling approximately $196 million, and that potential future amounts owed to him are approximately $78 million, for
a total of approximately $274 million. Fitzpatrick further claims unspecified amounts of carried interest on certain
additional real estate assets of AIG and its affiliates. He also seeks punitive damages for the alleged breaches of
fiduciary duties. Defendants assert that Fitzpatrick has been paid all amounts currently due and owing pursuant to
the various agreements through which he seeks recovery. As set forth above, the possible range of our loss is $0 to
$274 million, although Fitzpatrick claims that he is also entitled to additional unspecified amounts of carried interest
and punitive damages.
Frank Behm, former President of AIG Global Real Estate Asia Pacific, Inc. (AIGGREAP), has filed
two actions in connection with the termination of his employment. Behm filed an action on or about October 1, 2010
in Delaware Superior Court in which he asserts claims of breach of implied covenant of good faith and fair dealing
for termination in violation of public policy, deprivation of compensation, and breach of contract. Additionally, on or
about March 29, 2011, Behm filed an arbitration proceeding before the American Arbitration Association alleging
wrongful termination, in which he sought the payment of carried interest or ‘‘promote’’ distributed through the SPEs,
based on the sales of certain real estate assets. Behm also contended that he was entitled to promote as a third-
party beneficiary of Kevin Fitzpatrick’s employment agreement, which, Behm claimed, defined broadly a class of
individuals, allegedly including himself, who, with the approval of our former Chief Investment Officer, became eligible
to receive promote payments. Behm claimed approximately $67 million in carried interest. Multiple AIG entities (the
AIG Entities) are named as parties in each of the Behm matters. The AIG Entities have filed a counterclaim in the
Delaware case, contending that Behm owes them approximately $3.6 million (before pre-judgment interest) in tax
equalization payments made by the AIG Entities on Behm’s behalf.
..................................................................................................................................................................................................................................
AIG 2012 Form 10-K 295
Fitzpatrick matter.
Behm matter.
I T E M 8 / N O T E 1 6 . C O N T I N G E N C I E S , C O M M I T M E N T S A N D G U A R A N T E E S
.....................................................................................................................................................................................
Both matters filed by Behm are premised on the same key allegations. Behm claims that the AIG Entities wrongfully
terminated him from AIGGREAP in an effort to silence him for voicing opposition to allegedly improper practices
concerning the amount of AIG reserves for carried interest that Behm contends is due to him and others. The AIG
Entities contend that their reserves are appropriate, as Behm’s claims for additional carried interest are without merit.
Behm claims that, when he refused to accede to the AIG Entities’ position as to the amount of carried interest due,
he was targeted for investigation and subsequently terminated, purportedly for providing confidential AIG information
to a competitor, and its executive search firm. Behm argues that he did not disclose any confidential information;
instead, he met with several of the competitor’s representatives in order to foster interest in purchasing AIGGREAP.
On November 16, 2012, the arbitration panel ruled on Behm’s claims that had been submitted to arbitration (the
Award). Pursuant to the Award, on December 15, 2012, the AIG Entities paid Behm approximately $10.5 million in
full settlement of all claims submitted to the arbitration, with the exception that Behm retained rights to certain future
profit interests. The AIG Entities also paid Behm a portion of the fees and costs of the arbitration.
The Delaware Superior Court action is currently in discovery, and Behm has not articulated the specific amounts of
money that he claims are due. As a result, we are unable to reasonably estimate the possible loss or range of
losses, if any, arising from the litigation.
False Claims Act Complaint..............................................................................................................................................................................................
On February 25, 2010, a complaint was filed in the United States District Court for the Southern District of California
by two individuals (Relators) seeking to assert claims on behalf of the United States against AIG and certain other
defendants, including Goldman Sachs and Deutsche Bank, under the False Claims Act. Relators filed a First
Amended Complaint on September 30, 2010, adding certain additional defendants, including Bank of America and
Societe Generale. The amended complaint alleges that defendants engaged in fraudulent business practices in
respect of their activities in the over-the-counter market for collateralized debt obligations, and submitted false claims
to the United States in connection with the FRBNY Credit Facility and the ML II and ML III entities (the Maiden Lane
Interests) through, among other things, misrepresenting AIG’s ability and intent to repay amounts drawn on the
FRBNY Credit Facility, and misrepresenting the value of the securities that the Maiden Lane Interests acquired from
AIG and certain of its counterparties. The complaint seeks unspecified damages pursuant to the False Claims Act in
the amount of three times the damages allegedly sustained by the United States as well as interest, attorneys’ fees,
costs and expenses. The complaint and amended complaints were initially filed and maintained under seal while the
United States considered whether to intervene in the action. On or about April 28, 2011, after the United States
declined to intervene, the District Court lifted the seal, and Relators served the amended complaint on us on July 11,
2011. The Relators have not specified in their amended complaint an amount of alleged damages. As a result, we
are unable reasonably to estimate the possible loss or range of losses, if any, arising from the litigation.
2006 Regulatory Settlements and Related Regulatory Matters..............................................................................................................................................................................................
In February 2006, AIG reached a resolution of claims and matters under
investigation with the United States Department of Justice (DOJ), the Securities and Exchange Commission (SEC),
the Office of the New York Attorney General (NYAG) and the New York State Department of Insurance (DOI). The
settlements resolved investigations conducted by the SEC, NYAG and DOI in connection with the accounting,
financial reporting and insurance brokerage practices of AIG and its subsidiaries, as well as claims relating to the
underpayment of certain workers’ compensation premium taxes and other assessments. These settlements did not,
however, resolve investigations by regulators from other states into insurance brokerage practices related to
contingent commissions and other broker-related conduct, such as alleged bid rigging. Nor did the settlements
resolve any obligations that AIG may have to state guarantee funds in connection with any of these matters.
As a result of these settlements, AIG made payments or placed amounts in escrow in 2006 totaling approximately
$1.64 billion, $225 million of which represented fines and penalties.
In addition to the escrowed funds, $800 million was deposited into, and subsequently disbursed by, a fund under the
supervision of the SEC, to resolve claims asserted against AIG by investors, including the securities class action and
shareholder lawsuits described below.
..................................................................................................................................................................................................................................
AIG 2012 Form 10-K296
2006 Regulatory Settlements.
I T E M 8 / N O T E 1 6 . C O N T I N G E N C I E S , C O M M I T M E N T S A N D G U A R A N T E E S

.....................................................................................................................................................................................
A portion of the total $1.64 billion originally placed in escrow was designated to satisfy certain regulatory and
litigation liabilities related to workers’ compensation premium reporting issues. The original workers’ compensation
escrow amount was approximately $338 million and was placed in an account established as part of the 2006 New
York regulatory settlement and referred to as the Workers’ Compensation Fund. Additional money was placed into
escrow accounts as a result of subsequent litigation and regulatory settlements bringing the total workers’
compensation escrow amount to approximately $597 million. Approximately $147 million was released from the
workers’ compensation escrow accounts in satisfaction of fines, penalties and premium tax obligations, which were
imposed pursuant to a December 17, 2010 regulatory settlement agreement relating to workers’ compensation
premium reporting issues that was deemed final and effective on May 29, 2012. Following this disbursement,
approximately $450 million remains in escrow and is specifically designated to satisfy class action liabilities related to
workers’ compensation premium reporting issues. This amount is included in Other assets at December 31, 2012.
On February 1, 2012, AIG was informed by the SEC that AIG had complied with the terms of the settlement order
under which AIG had agreed to retain an independent consultant, and as of that date, was no longer subject to such
order.
Litigation Related to the Matters Underlying the 2006 Regulatory Settlements..............................................................................................................................................................................................
AIG and certain present and former directors and officers of AIG have been named in various actions related to the
matters underlying the 2006 Regulatory Settlements. These actions are described below.
Beginning in October 2004, a number of putative securities fraud
class action suits were filed in the Southern District of New York against AIG and consolidated as In re American
International Group, Inc. Securities Litigation (the Consolidated 2004 Securities Litigation). Subsequently, a separate,
though similar, securities fraud action was also brought against AIG by certain Florida pension funds. The lead
plaintiff in the Consolidated 2004 Securities Litigation is a group of public retirement systems and pension funds
benefiting Ohio state employees, suing on behalf of themselves and all purchasers of AIG’s publicly traded securities
between October 28, 1999 and April 1, 2005. The named defendants are AIG and a number of present and former
AIG officers and directors, as well as C.V. Starr & Co., Inc. (Starr), SICO, General Reinsurance Corporation, and
PricewaterhouseCoopers, LLP, among others. The lead plaintiff alleges, among other things, that AIG: (i) concealed
that it engaged in anti-competitive conduct through alleged payment of contingent commissions to brokers and
participation in illegal bid-rigging; (ii) concealed that it used ‘‘income smoothing’’ products and other techniques to
inflate its earnings; (iii) concealed that it marketed and sold ‘‘income smoothing’’ insurance products to other
companies; and (iv) misled investors about the scope of government investigations. In addition, the lead plaintiff
alleges that Maurice R. Greenberg, AIG’s former Chief Executive Officer, manipulated our stock price. The lead
plaintiff asserts claims for violations of Sections 11 and 15 of the Securities Act, Section 10(b) of the Exchange Act
and Rule 10b-5 promulgated thereunder, and Sections 20(a) and Section 20A of the Exchange Act.
On July 14, 2010, AIG approved the terms of a settlement (the Settlement) with lead plaintiffs. The Settlement is
conditioned on, among other things, court approval and a minimum level of shareholder participation. Under the
terms of the Settlement, if consummated, AIG would pay an aggregate of $725 million. Only two shareholders
objected to the Settlement, and 25 shareholders claiming to hold less than 1.5 percent of AIG’s outstanding shares at
the end of the class period submitted timely and valid requests to opt out of the class. Of those 25 shareholders,
seven are investment funds controlled by the same investment group, and that investment group is the only opt-out
who held more than 1,000 shares at the end of the class period. By order dated February 2, 2012, the District Court
granted lead plaintiffs’ motion for final approval of the Settlement. AIG has fully funded the amount of the Settlement
into an escrow account.
On January 23, 2012, AIG and the Florida pension funds, who had brought a separate securities fraud action,
executed a settlement agreement under which AIG paid $4 million.
On February 17, 2012 and March 6, 2012, two objectors appealed the final approval of the Settlement. On
September 27, 2012, the two objectors withdrew their appeals with prejudice.
Commencing in 2004, policyholders brought multiple federal antitrust and Racketeer
Influenced and Corrupt Organizations Act (RICO) class actions in jurisdictions across the nation against insurers and
brokers, including AIG and a number of its subsidiaries, alleging that the insurers and brokers engaged in one or
..................................................................................................................................................................................................................................
AIG 2012 Form 10-K 297
The Consolidated 2004 Securities Litigation.
The Multi-District Litigation.
I T E M 8 / N O T E 1 6 . C O N T I N G E N C I E S , C O M M I T M E N T S A N D G U A R A N T E E S

.....................................................................................................................................................................................
more broad conspiracies to allocate customers, steer business, and rig bids. These actions, including 24 complaints
filed in different federal courts naming AIG or an AIG subsidiary as a defendant, were consolidated by the judicial
panel on multi-district litigation and transferred to the United States District Court for the District of New Jersey
(District of New Jersey) for coordinated pretrial proceedings. The consolidated actions have proceeded in that Court
in two parallel actions, In re Insurance Brokerage Antitrust Litigation (the Commercial Complaint) and In re Employee
Benefits Insurance Brokerage Antitrust Litigation (the Employee Benefits Complaint, and, together with the
Commercial Complaint, the Multi-District Litigation).
The plaintiffs in the Commercial Complaint are a group of corporations, individuals and public entities that contracted
with the broker defendants for the provision of insurance brokerage services for a variety of insurance needs. The
broker defendants are alleged to have placed insurance coverage on the plaintiffs’ behalf with a number of insurance
companies named as defendants, including AIG subsidiaries. The Commercial Complaint also named various brokers
and other insurers as defendants (three of which have since settled). The Commercial Complaint alleges that
defendants engaged in a number of overlapping ‘‘broker-centered’’ conspiracies to allocate customers through the
payment of contingent commissions to brokers and through purported ‘‘bid-rigging’’ practices. It also alleges that the
insurer and broker defendants participated in a ‘‘global’’ conspiracy not to disclose to policyholders the payment of
contingent commissions. Plaintiffs assert that the defendants violated the Sherman Antitrust Act, RICO, and the
antitrust laws of 48 states and the District of Columbia, and are liable under common law breach of fiduciary duty
and unjust enrichment theories. Plaintiffs seek treble damages plus interest and attorneys’ fees as a result of the
alleged RICO and Sherman Antitrust Act violations.
The plaintiffs in the Employee Benefits Complaint are a group of individual employees and corporate and municipal
employers alleging claims on behalf of two separate nationwide purported classes: an employee class and an
employer class that acquired insurance products from the defendants from January 1, 1998 to December 31, 2004.
The Employee Benefits Complaint names AIG as well as various other brokers and insurers, as defendants. The
activities alleged in the Employee Benefits Complaint, with certain exceptions, track the allegations of customer
allocation through steering and bid-rigging made in the Commercial Complaint.
On August 16, 2010, the United States Court of Appeals for the Third Circuit (the Third Circuit) affirmed the dismissal
of the Employee Benefits Complaint in its entirety, affirmed in part and vacated in part the District Court’s dismissal
of the Commercial Complaint, and remanded the case for further proceedings consistent with the opinion. On
March 30, 2012, the District Court granted final approval of a settlement between AIG and certain other defendants
on the one hand, and class plaintiffs on the other, which settled the claims asserted against those defendants in the
Commercial Complaint. Pursuant to the settlement, AIG will pay approximately $7 million of a total aggregate
settlement amount of approximately $37 million. On April 27, 2012, notices of appeal of the District Court order
granting final approval were filed in the Third Circuit. As of December 5, 2012, the Third Circuit had dismissed all
appeals from the District Court order granting final approval of the settlement. On January 16, 2013, class plaintiffs
filed a motion in the District Court seeking an order authorizing distribution of the settlement fund.
A number of complaints making allegations similar to those in the Multi-District Litigation have been filed against AIG
and other defendants in state and federal courts around the country. The defendants have thus far been successful
in having the federal actions transferred to the District of New Jersey and consolidated into the Multi-District
Litigation. Two consolidated actions naming AIG defendants are still pending in the District of New Jersey. In the
consolidated action The Heritage Corp. of South Florida v. National Union Fire Ins. Co. (Heritage), an individual
plaintiff alleges damages ‘‘in excess of $75,000.’’ Because discovery has not been completed and a precise amount
of damages has not been specified, AIG is unable to reasonably estimate the possible loss or range of losses, if any,
arising from the Heritage litigation. As of February 21, 2013, the plaintiff in Avery Dennison Corp. v. Marsh &
McLennan Companies, Inc. (Avery), the other remaining consolidated action has not formally specified an amount of
alleged damages. AIG is therefore unable to reasonably estimate the possible loss or range of losses, if any, arising
from this matter.
Finally, the AIG defendants have settled the four state court actions filed in Florida, New Jersey, Texas, and Kansas
state courts, where plaintiffs had made similar allegations as those asserted in the Multi-District Litigation.
On May 24, 2007, the National Council on Compensation
Insurance (NCCI), on behalf of the participating members of the National Workers’ Compensation Reinsurance Pool
(the NWCRP), filed a lawsuit in the United States District Court for the Northern District of Illinois (the Northern
..................................................................................................................................................................................................................................
AIG 2012 Form 10-K298
Workers’ Compensation Premium Reporting.
I T E M 8 / N O T E 1 6 . C O N T I N G E N C I E S , C O M M I T M E N T S A N D G U A R A N T E E S

.....................................................................................................................................................................................
District of Illinois) against us with respect to the underpayment by AIG of its residual market assessments for
workers’ compensation insurance. The complaint alleged claims for violations of RICO, breach of contract, fraud and
related state law claims arising out of our alleged underpayment of these assessments between 1970 and the
present and sought damages purportedly in excess of $1 billion.
On April 1, 2009, Safeco Insurance Company of America (Safeco) and Ohio Casualty Insurance Company (Ohio
Casualty) filed a complaint in the Northern District of Illinois, on behalf of a purported class of all NWCRP participant
members, against AIG and certain of its subsidiaries with respect to the underpayment by AIG of its residual market
assessments for workers’ compensation insurance. The complaint was styled as an ‘‘alternative complaint,’’ should
the Northern District of Illinois grant our motion to dismiss the NCCI lawsuit for lack of subject-matter jurisdiction,
which motion to dismiss was ultimately granted on August 23, 2009. The allegations in the class action complaint are
substantially similar to those filed by the NWCRP.
On February 28, 2012, the Northern District of Illinois entered a final order and judgment approving a class action
settlement between us and a group of intervening plaintiffs, made up of seven participating members of the NWCRP,
which would require AIG to pay $450 million to satisfy all liabilities to the class members arising out of the workers’
compensation premium reporting issues, a portion of which would be funded out of the remaining amount held in the
Workers’ Compensation Fund. Liberty Mutual filed papers in opposition to approval of the proposed settlement and in
opposition to certification of a settlement class, in which it alleged our actual exposure, should the class action
continue through judgment, to be in excess of $3 billion. We dispute this allegation. Liberty Mutual and its
subsidiaries Safeco and Ohio Casualty subsequently appealed the Northern District of Illinois’ final order and
judgment to the United States Court of Appeals for the Seventh Circuit (the Seventh Circuit). On January 10, 2013,
AIG and Liberty Mutual entered into a settlement under which Liberty Mutual, Safeco and Ohio Casualty agreed
voluntarily to withdraw their appeals. In furtherance of such settlement, AIG, the Liberty Mutual parties and the
settlement class plaintiffs submitted an agreed stipulation of dismissal that is currently under review by the Seventh
Circuit.
The $450 million settlement amount, which is currently held in escrow pending final resolution of the class-action
settlement, was funded in part from the approximately $191 million remaining in the Workers’ Compensation Fund. In
the event that the settlement between AIG and Liberty Mutual is not approved, the appeal of the order and judgment
approving the class action settlement may resume. As of December 31, 2012, we had an accrued liability equal to
the amounts payable under the settlement.
Litigation Matters Relating to AIG’s Insurance Operations..............................................................................................................................................................................................
AIG and certain of its subsidiaries have been named defendants in two putative class actions in state
court in Alabama that arise out of the 1999 settlement of class and derivative litigation involving Caremark Rx, Inc.
(Caremark). The plaintiffs in the second-filed action intervened in the first-filed action, and the second-filed action was
dismissed. An excess policy issued by a subsidiary of AIG with respect to the 1999 litigation was expressly stated to
be without limit of liability. In the current actions, plaintiffs allege that the judge approving the 1999 settlement was
misled as to the extent of available insurance coverage and would not have approved the settlement had he known
of the existence and/or unlimited nature of the excess policy. They further allege that AIG, its subsidiaries, and
Caremark are liable for fraud and suppression for misrepresenting and/or concealing the nature and extent of
coverage.
The complaints filed by the plaintiffs and the intervenors request compensatory damages for the 1999 class in the
amount of $3.2 billion, plus punitive damages. AIG and its subsidiaries deny the allegations of fraud and suppression,
assert that information concerning the excess policy was publicly disclosed months prior to the approval of the
settlement, that the claims are barred by the statute of limitations, and that the statute cannot be tolled in light of the
public disclosure of the excess coverage. The plaintiffs and intervenors, in turn, have asserted that the disclosure
was insufficient to inform them of the nature of the coverage and did not start the running of the statute of limitations.
On August 15, 2012, the trial court entered an order granting plaintiffs’ motion for class certification. AIG and the
other defendants have appealed that order to the Alabama Supreme Court, and the case in the trial court will be
stayed until that appeal is resolved. General discovery has not commenced and AIG is unable to reasonably estimate
the possible loss or range of losses, if any, arising from the litigation.
..................................................................................................................................................................................................................................
AIG 2012 Form 10-K 299
Caremark.
I T E M 8 / N O T E 1 6 . C O N T I N G E N C I E S , C O M M I T M E N T S A N D G U A R A N T E E S

.....................................................................................................................................................................................
AIG’s life insurance companies have received industry-wide regulatory inquiries, including a
multi-state audit and market conduct examination covering compliance with unclaimed property laws and a directive
from the New York Insurance Department regarding claims settlement practices and other related state regulatory
inquiries. AIG recorded an increase of $55 million in policyholders benefit reserves in the third quarter of 2012 in
conjunction with the resolution of the multi-state examinations relating to the handling of unclaimed property and the
use of the Social Security Death Master File (SSDMF) to identify potential claims not yet presented to AIG in the
normal course of business. In addition, AIG paid an $11 million regulatory assessment to the various state insurance
departments that are parties to the regulatory settlement to defray costs of their examinations and monitoring.
Although AIG has enhanced its claims practices to include use of the SSDMF, it is possible that the settlement
remediation requirements, remaining inquiries, other regulatory activity or litigation could result in the payment of
additional amounts. AIG has also received a demand letter from a purported AIG shareholder requesting that the
Board of Directors investigate these matters, and bring appropriate legal proceedings against any person identified by
the investigation as engaging in misconduct. AIG believes it has adequately reserved for such claims, but there can
be no assurance that the ultimate cost will not vary, perhaps materially, from its estimate.
In connection with the previously disclosed multi-state examination of certain accident and health products, including
travel products, issued by National Union Fire Insurance Company of Pittsburgh, Pa. (National Union), Chartis Inc.,
on behalf of itself, National Union, and certain of Chartis Inc.’s insurance and non-insurance companies (collectively,
the Chartis parties) entered into a Regulatory Settlement Agreement with regulators from 50 U.S. jurisdictions
effective November 29, 2012. Under the agreement, and without admitting any liability for the issues raised in the
examination, the Chartis parties (i) paid a civil penalty of $50 million, (ii) entered into a corrective action plan
describing agreed-upon specific steps and standards for evaluating the Chartis parties’ ongoing compliance with laws
and regulations governing the issues identified in the examination, and (iii) agreed to pay a contingent fine in the
event that the Chartis parties fail to satisfy certain terms of the corrective action plan. National Union and other AIG
companies are also currently subject to civil litigation relating to the conduct of their accident and health business,
and may be subject to additional litigation relating to the conduct of such business from time to time in the ordinary
course. There can be no assurance that any regulatory action resulting from the issues identified will not have a
material adverse effect on AIG’s ongoing operations of the business subject to the agreement, or on similar business
written by other AIG carriers.
Industry-wide examinations conducted by the Minnesota Department of Insurance and the Department of Housing
and Urban Development (HUD) on captive reinsurance practices by lenders and mortgage insurance companies,
including UGC, have been ongoing for several years. In 2011, the Consumer Financial Protection Bureau (‘‘CFPB’’)
assumed responsibility for violations of the Real Estate Settlement Procedures Act from HUD, and assumed HUD’s
aforementioned ongoing investigation. In June 2012, the CFPB issued a Civil Investigative Demand (‘‘CID’’) to UGC
and other mortgage insurance companies, requesting the production of documents and answers to written questions.
The CFPB agreed to toll the deadlines associated with the CID pending discussions that could resolve the
investigation. Although UGC filed a petition to modify the CID on December 7, 2012, ending the tolling period, the
discussions that could resolve the investigation are still ongoing. UGC has received a proposed consent order from
the Minnesota Commissioner of Commerce (the MN Commissioner) which alleges that UGC violated the Real Estate
Settlement Procedures Act, the Fair Credit Reporting Act and other state and federal laws in connection with its
practices with captive reinsurance companies owned by lenders. UGC engaged in discussions with the MN
Commissioner with respect to the terms of the proposed consent order. UGC cannot predict if or when a consent
order may be entered into or, if entered into, what the terms of the final consent order will be. UGC is also currently
subject to civil litigation relating to its placement of reinsurance with captives owned by lenders, and may be subject
to additional litigation relating to the conduct of such business from time to time in the ordinary course.
Other Contingencies..............................................................................................................................................................................................
Liability for unpaid claims and claims adjustment expense..............................................................................................................................................................................................
Although we regularly review the adequacy of the established Liability for unpaid claims and claims adjustment
expense, there can be no assurance that our loss reserves will not develop adversely and have a material adverse
effect on our results of operations. Estimation of ultimate net losses, loss expenses and loss reserves is a complex
process, particularly for long-tail casualty lines of business, which include, but are not limited to, general liability,
commercial automobile liability, environmental, workers’ compensation, excess casualty and crisis management
..................................................................................................................................................................................................................................
AIG 2012 Form 10-K300
Regulatory Matters
I T E M 8 / N O T E 1 6 . C O N T I N G E N C I E S , C O M M I T M E N T S A N D G U A R A N T E E S

.....................................................................................................................................................................................
coverages, insurance and risk management programs for large corporate customers and other customized structured
insurance products, as well as excess and umbrella liability, directors and officers and products liability. Generally,
actual historical loss development factors are used to project future loss development. However, there can be no
assurance that future loss development patterns will be the same as in the past. Moreover, any deviation in loss cost
trends or in loss development factors might not be identified for an extended period of time subsequent to the
recording of the initial loss reserve estimates for any accident year. There is the potential for reserves with respect to
a number of years to be significantly affected by changes in loss cost trends or loss development factors that were
relied upon in setting the reserves. These changes in loss cost trends or loss development factors could be
attributable to changes in economic conditions in the United States and abroad, changes in the legal, regulatory,
judicial and social environment, changes in medical cost trends (inflation, intensity and utilization of medical services),
underlying policy pricing, terms and conditions, and claims handling practices.
Lease Commitments..............................................................................................................................................................................................
We occupy leased space in many locations under various long-term leases and have entered into various leases
covering the long-term use of data processing equipment.
The following table presents the future minimum lease payments under operating leases:
2013 $ 390
2014 282
2015 207
2016 171
2017 138
Remaining years after 2017 310
Total $ 1,498
Rent expense was $445 million, $482 million and $587 million for the years ended December 31, 2012, 2011
and 2010, respectively. These amounts include $16 million, $37 million and $129 million attributable to discontinued
operations for the years ended December 31, 2012, 2011 and 2010, respectively.
Flight Equipment Related to Business Held for Sale..............................................................................................................................................................................................
At December 31, 2012, ILFC had committed to purchase 229 new aircraft with aggregate estimated total remaining
payments of approximately $17.5 billion, including four aircraft through sale-leaseback transactions with airlines
deliverable from 2012 through 2019. ILFC had also committed to purchase five used aircraft and nine new spare
engines. ILFC also has the right to purchase an additional 50 Airbus A320neo family narrowbody aircraft. ILFC will
be required to find lessees for any aircraft acquired and to arrange financing for a substantial portion of the purchase
price. These commitments are related to discontinued operations and will not be retained by AIG upon closing of the
sale. See Note 4 herein, for a discussion of the ILFC transaction.
The following table presents the minimum future rental income on noncancelable operating leases of flight
equipment that has been delivered:
2013 $ 3,854
2014 3,344
2015 2,631
2016 2,001
2017 1,347
Remaining years after 2017 1,628
Total $ 14,805
Flight equipment is leased under operating leases with remaining terms ranging from one to fourteen years.
..................................................................................................................................................................................................................................
AIG 2012 Form 10-K 301
(in millions)
(in millions)
I T E M 8 / N O T E 1 6 . C O N T I N G E N C I E S , C O M M I T M E N T S A N D G U A R A N T E E S

.....................................................................................................................................................................................
Other Commitments..............................................................................................................................................................................................
In the normal course of business, we enter into commitments to invest in limited partnerships, private equity funds,
hedge funds and mutual funds and to purchase and develop real estate in the U.S. and abroad. These commitments
totaled $2.3 billion at December 31, 2012.
Guarantees..............................................................................................................................................................................................
Subsidiaries..............................................................................................................................................................................................
We have issued unconditional guarantees with respect to the prompt payment, when due, of all present and future
payment obligations and liabilities of AIGFP and AIG Markets arising from transactions entered into by AIGFP and
AIG Markets, respectively.
In connection with AIGFP’s business activities, AIGFP has issued, in a limited number of transactions, standby letters
of credit or similar facilities to equity investors in an amount equal to the termination value owing to the equity
investor by the lessee in the event of a lessee default (the equity termination value). The total amount outstanding at
December 31, 2012 was $306 million. In those transactions, AIGFP has agreed to pay such amount if the lessee
fails to pay. The amount payable by AIGFP is, in certain cases, partially offset by amounts payable under other
instruments typically equal to the present value of scheduled payments to be made by AIGFP. In the event that
AIGFP is required to make a payment to the equity investor, the lessee is unconditionally obligated to reimburse
AIGFP. To the extent that the equity investor is paid the equity termination value from the standby letter of credit
and/or other sources, including payments by the lessee, AIGFP takes an assignment of the equity investor’s rights
under the lease of the underlying property. Because the obligations of the lessee under the lease transactions are
generally economically defeased, lessee bankruptcy is the most likely circumstance in which AIGFP would be
required to pay.
Asset Dispositions..............................................................................................................................................................................................
General..............................................................................................................................................................................................
We are subject to financial guarantees and indemnity arrangements in connection with the completed sales of
businesses pursuant to our asset disposition plan. The various arrangements may be triggered by, among other
things, declines in asset values, the occurrence of specified business contingencies, the realization of contingent
liabilities, developments in litigation or breaches of representations, warranties or covenants provided by us. These
arrangements are typically subject to various time limitations, defined by the contract or by operation of law, such as
statutes of limitation. In some cases, the maximum potential obligation is subject to contractual limitations, while in
other cases such limitations are not specified or are not applicable.
We are unable to develop a reasonable estimate of the maximum potential payout under certain of these
arrangements. Overall, we believe that it is unlikely it will have to make any material payments related to completed
sales under these arrangements, and no material liabilities related to these arrangements have been recorded in the
Consolidated Balance Sheet. See Note 4 herein for additional information on sales of businesses and asset
dispositions.
ALICO Sale..............................................................................................................................................................................................
Pursuant to the terms of the ALICO stock purchase agreement, we have agreed to provide MetLife with certain
indemnities. The most significant remaining indemnities include:
• Indemnifications related to specific product, investment, litigation and other matters that are excluded from the
general representations and warranties indemnity. These indemnifications provide for various deductible amounts,
which in certain cases are zero, and maximum exposures, which in certain cases are unlimited, and may extend
for various periods after the completion of the sale.
• Tax indemnifications related to insurance reserves that extend for taxable periods ending on or before
December 31, 2013 and that are limited to an aggregate of $200 million, and certain other tax-related
..................................................................................................................................................................................................................................
AIG 2012 Form 10-K302
I T E M 8 / N O T E 1 6 . C O N T I N G E N C I E S , C O M M I T M E N T S A N D G U A R A N T E E S

.....................................................................................................................................................................................
representations and warranties that extend to the expiration of the statute of limitations and are subject to an
aggregate deductible of $50 million.
In connection with the indemnity obligations described above, as of December 31, 2012, approximately $567 million
of proceeds from the sale of ALICO were on deposit in an escrow arrangement. Under the terms of a letter
agreement between MetLife and us entered into on April 26, 2012, $44 million was released to us on April 30, 2012
which represented funds that were initially held back from the release of escrow to us on November 1, 2011. Under
the terms of a letter agreement between MetLife and us entered into on July 13, 2012, $950 million was released to
us on August 31, 2012 instead of November 1, 2012 as originally provided under the ALICO stock purchase
agreement. An additional $33 million was released on November 8, 2012. The amount required to be held in escrow
declines to zero in May 2013, although indemnification claims then pending will reduce the amount that can be
released to us.
Other..............................................................................................................................................................................................
• See Note 11 herein for commitments and guarantees associated with VIEs.
• See Note 12 herein for disclosures on derivatives.
• See Note 27 herein for additional disclosures on guarantees of outstanding debt.
..................................................................................................................................................................................................................................
AIG 2012 Form 10-K 303
I T E M 8 / N O T E 1 6 . C O N T I N G E N C I E S , C O M M I T M E N T S A N D G U A R A N T E E S

.....................................................................................................................................................................................
17. TOTAL EQUITY..............................................................................................................................................................................................
Shares Outstanding..............................................................................................................................................................................................
The following table presents a rollforward of outstanding shares:
Year Ended
December 31, 2010
Shares, beginning of
year 400,000 300,000 100,000 – 141,732,263 (6,661,356) 135,070,907
Issuances – – – – 5,391,804 – 5,391,804
Shares exchanged – – – – – 448 448
Shares, end of year 400,000 300,000 100,000 – 147,124,067 (6,660,908) 140,463,159
Year Ended
December 31, 2011
Shares, beginning of
year 400,000 300,000 100,000 – 147,124,067 (6,660,908) 140,463,159
Issuances – – – 20,000 100,799,653 – 100,799,653
Settlement of equity
unit stock purchase
contracts – – – – 3,606,417 – 3,606,417
Shares exchanged* (400,000) (300,000) (100,000) – 1,655,037,962 (11,678) 1,655,026,284
Shares purchased – – – – – (3,074,031) (3,074,031)
Shares cancelled – – – (20,000) – – –
Shares, end of year – – – – 1,906,568,099 (9,746,617) 1,896,821,482
Year Ended
December 31, 2012
Shares, beginning of
year
Issuances
Shares purchased
Shares, end of year
Preferred Stock and Recapitalization..............................................................................................................................................................................................
At December 31, 2010, a total of $7.5 billion was outstanding under the Department of the Treasury’s commitment
(the Department of the Treasury Commitment (Series F)) pursuant to the Securities Purchase Agreement, dated as
of April 17, 2009 (the Series F SPA), between AIG and the Department of the Treasury relating to our the Series F
Fixed Rate Non-Cumulative Perpetual Preferred Stock, par value $5.00 per share (the Series F Preferred Stock). On
January 14, 2011, we completed the Recapitalization in which the Series C Perpetual, Convertible, Participating
Preferred Stock, par value $5.00 per share (the Series C Preferred Stock), Series E Fixed Rate Non-Cumulative
Perpetual Preferred Stock, par value $5.00 per share (the Series E Preferred Stock) and the Series F Preferred
Stock were exchanged for AIG Common Stock and the Series G Cumulative Mandatory Convertible Preferred Stock,
par value $5.00 per share (the Series G Preferred Stock) was issued. In connection with the Recapitalization, we
repaid all amounts outstanding under the FRBNY Credit Facility. In connection with the May 2011 AIG Common
Stock Offering (described below under AIG Common Stock Offerings by the Department of the Treasury and AIG
Purchases of Shares), the Series G Preferred Stock was cancelled.
..................................................................................................................................................................................................................................
AIG 2012 Form 10-K304
Preferred StockCommon Treasury Outstanding
AIG Series E AIG Series F AIG Series C AIG Series G Stock Issued Stock Shares
– – – – 1,906,568,099 (9,746,617) 1,896,821,482
– – – – 43,581 685,727 729,308
– – – – – (421,228,855) (421,228,855)
– – – – 1,906,611,680 (430,289,745) 1,476,321,935
I T E M 8 / N O T E 1 7 . T O T A L E Q U I T Y

.....................................................................................................................................................................................
The following table presents the principal Consolidated Balance Sheet line items affected by the
Recapitalization on January 14, 2011, further described in Note 25 herein:
Other assets $ (24,297) $ (6,140)(b) $ – $ (30,437)Other liabilities (325) – – (325)Federal Reserve Bank of New York credit facility (20,689) – – (20,689)
Redeemable noncontrolling nonvoting, callable,junior preferred interests held by Departmentof Treasury – 20,292 – 20,292
AIG shareholders’ equity:Preferred stock
Series C preferred stock – – (23,000) (23,000)Series E preferred stock – – (41,605) (41,605)Series F preferred stock – 20,292 (7,378) (7,378)
(20,292)Series G preferred stock; 20,000 shares
issued; liquidation value $0(d) – – – –Common stock – – 4,138 4,138Additional paid-in capital – – 67,845 67,845Retained Earnings (3,283) – – (3,283)
Noncontrolling nonvoting, callable, junior andsenior preferred interests held by FederalReserve Bank of New York – (26,432) – (26,432)
Shares outstanding 1,655,037,962 1,655,037,962
(a) Repayment and Termination of the FRBNY Credit Facility – Funds held in escrow and included in Other assets from the AIA IPO and the
ALICO sale were used to repay the FRBNY Credit Facility. The adjustments to Other assets and Accumulated deficit reflects the write-off of the
unamortized portion of the net prepaid commitment fee asset.
(b) Repurchase and Exchange of SPV Preferred Interests – We used remaining net cash proceeds from the AIA IPO and the ALICO sale to pay
down a portion of the liquidation preference on the SPV Preferred Interests held by the FRBNY and drew down approximately $20.3 billion under
the Department of the Treasury Commitment (Series F) to repurchase the FRBNY’s remaining SPV Preferred Interests, which we then transferred to
the Department of the Treasury as part of the consideration for the exchange of the Series F Preferred Stock.
(c) Exchange of our Series C, E and F Preferred Stock for AIG Common Stock. The adjustments represent the exchange of Series C Preferred
Stock, Series E Preferred Stock, and Series F Preferred Stock for AIG Common Stock. As a result of the Recapitalization, the Department of the
Treasury acquired 1,655,037,962 shares of newly issued AIG Common Stock.
(d) In connection with the May 2011 AIG Common Stock offering and sale, the Series G Preferred Stock was cancelled.
The following table presents a rollforward of preferred stock:
Balance, January 1, 2010 $ 41,605 $ 5,179 $ 23,000 $ 69,784AIG Series F drawdown – 2,199 – 2,199
Balance, December 31, 2010 $ 41,605 $ 7,378 $ 23,000 $ 71,983
Shares Exchanged (41,605) (7,378) (23,000) (71,983)
Balance, December 31, 2011 $ – $ – $ – $ –
Shares Exchanged – – – –
Balance, December 31, 2012
..................................................................................................................................................................................................................................
AIG 2012 Form 10-K 305
Effect of Recapitalization
Repayment Repurchase Exchange
and and Exchange of Preferred
Termination of SPV Stock for
Increase (Decrease) of FRBNY Preferred Common Total Effect of
(in millions) Credit Facility(a) Interests Stock(c) Recapitalization
Total
Preferred
(in millions) AIG Series E AIG Series F AIG Series C Stock
$ – $ – $ – $ –
I T E M 8 / N O T E 1 7 . T O T A L E Q U I T Y

.....................................................................................................................................................................................
Dividends..............................................................................................................................................................................................
Payment of future dividends to our shareholders depends in part on the regulatory framework that will ultimately be
applicable to us, including our status as a savings and loan holding company under Dodd-Frank and whether we are
determined to be a SIFI. In addition, dividends will be payable on AIG Common Stock only when, as and if declared
by our Board of Directors in its discretion, from funds legally available therefor. In considering whether to pay a
dividend or purchase shares of AIG Common Stock, our Board of Directors will take into account such matters as our
financial position, the performance of our businesses, our consolidated financial condition, results of operations and
liquidity, available capital, the existence of investment opportunities, contractual, legal and regulatory restrictions on
the payment of dividends by our subsidiaries, rating agency considerations, including the potential effect on our debt
ratings, and such other factors as our Board may deem relevant. We did not pay any cash dividends in 2011 or
2012.
Share Issuances and Purchases..............................................................................................................................................................................................
Through registered public offerings, the Department of the Treasury has disposed of all of its ownership of AIG
Common Stock as of December 31, 2012, from ownership of approximately 92 percent (1.7 billion shares) prior to
the completion of the first registered public offering initiated by the Department of the Treasury as selling shareholder
in May 2011. During 2012, the Department of the Treasury, as selling shareholder, completed registered public
offerings of AIG Common Stock on March 13 (the March Offering), May 10 (the May Offering), August 8 (the August
Offering), September 14 (the September Offering) and December 14 (the December Offering). We participated as a
purchaser in the first four 2012 offerings.
The following table presents certain information relating to these offerings:
May 2011 Offering $ 29.00 200,000,000 $ 5,800 – $ –
2012 Offerings:
March Offering 29.00 206,896,552 6,000 103,448,276 3,000
May Offering 30.50 188,524,589 5,750 65,573,770 2,000
August Offering 30.50 188,524,590 5,750 98,360,656 3,000
September Offering 32.50 636,923,075 20,700 153,846,153 5,000
December Offering 32.50 234,169,156 7,610 – –
1,655,037,962 $ 51,610 421,228,855 $ 13,000
* Shares purchased by us in each of the 2012 offerings were purchased pursuant to AIG Board of Directors authorization.
Each of these purchases was authorized by our Board of Directors. At December 31, 2012, our Board had not
authorized any additional purchases. Potential future purchases of our shares will depend in part on the regulatory
framework that will ultimately be applicable to us. This framework will depend on, among other things, our capital
requirements as a savings and loan holding company under Dodd-Frank and whether we are determined to be a
SIFI.
In November 2011, our Board of Directors authorized the purchase of shares of AIG Common Stock, with an
aggregate purchase amount of up to $1 billion from time to time in the open market, through derivative or automatic
purchase contracts or otherwise. This authorization replaced all prior AIG Common Stock purchase authorizations.
We purchased a total of 3,074,031 shares of AIG Common Stock for approximately $70 million in 2011.
..................................................................................................................................................................................................................................
AIG 2012 Form 10-K306
AIG Common Stock Offerings by the Department of the Treasury and AIG Purchases of AIG Common Stock in 2012
U.S. Treasury AIG*
(dollars in millions, except share-price data) Price Shares Sold Amount Shares Purchased Amount
AIG Common Stock Purchases in 2011
I T E M 8 / N O T E 1 7 . T O T A L E Q U I T Y

.....................................................................................................................................................................................
Equity Units..............................................................................................................................................................................................
In May 2008, we sold 78.4 million equity units (the Equity Units) at a price per unit of $75 for gross proceeds of
$5.88 billion. The Equity Units included a stock purchase contract obligating the holder of an Equity Unit to purchase,
and obligating AIG to sell, a variable number of shares of AIG Common Stock for $25 in cash.
We were obligated to pay quarterly contract adjustment payments to the holders of the stock purchase contracts
under the Equity Units, at an initial annual rate of 2.71 percent applied to the stated amount. The present value of
the contract adjustment payments, $431 million, was recognized at inception as a liability (a component of Other
liabilities), and was recorded as a reduction to Additional paid-in capital.
In addition to the stock purchase contracts, as part of the Equity Units, we issued $1.96 billion of each of the
Series B-1, B-2 and B-3 junior subordinated debentures, which initially paid interest at rates of 5.67 percent,
5.82 percent and 5.89 percent, respectively.
The junior subordinated debentures were recorded as Other long-term debt in the Consolidated Balance Sheet. The
principal amount we owed on the subordinated debentures was equal to the amount owed to us under the related
stock purchase contract.
On November 23, 2010, we commenced an offer to exchange up to 74,480,000 of our Equity Units for consideration
per Equity Unit equal to 0.09867 share of AIG Common Stock plus $3.2702 in cash (the Exchange Offer). The stock
and cash received was the result of netting payments from two separate transactions, a repurchase of the
subordinated debentures and a cancellation of the stock purchase contracts.
On November 29, 2010, holders of 49,474,600 Equity Units accepted the Exchange Offer and their units were
tendered in exchange for 4,881,667 shares of AIG Common Stock and $162 million in cash. Following the
completion of the exchange offer, a total of 28,925,400 Equity Units remained outstanding. The execution of the
Exchange Offer resulted in a loss on the extinguishment of the subordinated debentures of approximately
$104 million and an increase to equity of approximately $3.7 billion.
In 2011, we remarketed the three series of debentures included in the Equity Units. We purchased and retired all of
the Series B-1, B-2 and B-3 Debentures representing $2.2 billion in aggregate principal and as of December 31,
2011, we had issued approximately 1.8 billion shares of AIG Common Stock in connection with the settlement of the
stock purchase contracts underlying the Equity Units.
..................................................................................................................................................................................................................................
AIG 2012 Form 10-K 307
I T E M 8 / N O T E 1 7 . T O T A L E Q U I T Y

.....................................................................................................................................................................................
Accumulated Other Comprehensive Income (Loss)..............................................................................................................................................................................................
The following table presents a rollforward of Accumulated other comprehensive income (loss):
Balance, January 1, 2010, net of tax $ (1,785) $ 7,829 $ 2,249 $ (128) $ (1,144) $ 7,021
Cumulative effect of change in accounting principle (76) (168) (688) – – (932)
Change in unrealized appreciation of investments 2,645 7,265 – – – 9,910
Change in deferred acquisition costs adjustment and
other (166) (491) – – – (657)
Change in foreign currency translation adjustments – – 654 – – 654
Change in net derivative losses arising from cash flow
hedging activities – – – 105 – 105
Net actuarial loss – – – – (1) (1)
Prior service credit – – – – 10 10
Change attributable to divestitures and deconsolidations 43 (2,854) (2,357) 6 290 (4,872)
Deferred tax asset (liability) (1,293) (1,627) 775 (17) (24) (2,186)
Total other comprehensive income (loss) 1,229 2,293 (928) 94 275 2,963
Acquisition of noncontrolling interest – – – – – –
Noncontrolling interests 2 99 80 – – 181
Balance, December 31, 2010, net of tax $ (634) $ 9,855 $ 553 $ (34) $ (869) $ 8,871
Change in unrealized appreciation of investments 55 5,463 – – – 5,518
Change in deferred acquisition costs adjustment and
other(a) 11 (641) – – – (630)
Change in future policy benefits(b) – (2,302) – – – (2,302)
Change in foreign currency translation adjustments – – (97) – – (97)
Change in net derivative losses arising from cash flow
hedging activities – – – 51 – 51
Net actuarial loss – – – – (752) (752)
Prior service credit – – – – 387 387
Change attributable to divestitures and deconsolidations 23 (3,643) (1,681) – 260 (5,041)
Deferred tax asset (liability) (163) (362) 786 (34) 35 262
Total other comprehensive income (loss) (74) (1,485) (992) 17 (70) (2,604)
Acquisition of noncontrolling interest – 45 66 – (18) 93
Noncontrolling interests 3 (160) 36 – – (121)
Balance, December 31, 2011, net of tax
Change in unrealized appreciation of investments
Change in deferred acquisition costs adjustment and
other
Change in future policy benefits
Change in foreign currency translation adjustments
Change in net derivative gains (losses) arising from
cash flow hedging activities
Net actuarial loss
Prior service credit
Deferred tax asset (liability)
Total other comprehensive income (loss)
Noncontrolling interests
Balance, December 31, 2012, net of tax
(a) Includes the pre-tax adjustment to Accumulated other comprehensive income related to a $152 million reduction of deferred acquisition costs
as a consequence of the recognition of additional policyholder benefit reserves disclosed below.
(b) The adjustment to policyholder benefit reserves assumes that the unrealized appreciation on available for sale securities is actually realized
and that the proceeds are reinvested at lower yields.
As a result of divestitures in 2010, $1.8 billion of Foreign currency cumulative translation adjustment and $6.1 billion
of Unrealized appreciation of investments were transferred to earnings as net gain on sale.
..................................................................................................................................................................................................................................
AIG 2012 Form 10-K308
$ (711) $ 8,575 $ (409) $ (17) $ (957) $ 6,481
2,306 8,404 – – – 10,710
(49) (840) – – – (889)
(85) (432) – – – (517)
– – (33) – – (33)
– – – 33 – 33
– – – – (273) (273)
– – – – (46) (46)
(886) (2,252) 33 (16) 232 (2,889)
1,286 4,880 – 17 (87) 6,096
– 9 (6) – – 3
$ 575 $ 13,446 $ (403) $ – $ (1,044) $ 12,574
Unrealized Appreciation
(Depreciation) of Fixed Net Derivative
Maturity Investments Unrealized Gains (Losses) Change in
on Which Other-Than- Appreciation Foreign Arising from Retirement
Temporary Credit (Depreciation) Currency Cash Flow Plan
Impairments Were of All Other Translation Hedging Liabilities
(in millions) Recognized Investments Adjustments Activities Adjustment Total
I T E M 8 / N O T E 1 7 . T O T A L E Q U I T Y

.....................................................................................................................................................................................
The following table presents the other comprehensive income (loss) reclassification adjustments for the
years ended December 31, 2012, 2011 and 2010:
December 31, 2010
Unrealized change arising during period $ 2,469 $ 9,270 $ 654 $ (25) $ (89) $ 12,279
Less: Reclassification adjustments included in net
income (53) 5,350 2,357 (136) (388) 7,130
Total other comprehensive income (loss), before income
tax expense (benefit) 2,522 3,920 (1,703) 111 299 5,149
Less: Income tax expense (benefit) 1,293 1,627 (775) 17 24 2,186
Total other comprehensive income (loss), net of income
tax expense (benefit) $ 1,229 $ 2,293 $ (928) $ 94 $ 275 $ 2,963
Less: Reclassification adjustments included in net
income
Total other comprehensive income, before
income tax expense (benefit)
Less: Income tax expense (benefit)
Total other comprehensive income, net of
income tax expense (benefit)
..................................................................................................................................................................................................................................
AIG 2012 Form 10-K 309
$2,236 $8,896 $ (33) $ (2) $ (406) $10,691
64 1,764 – (35) (87) 1,706
2,172 7,132 (33) 33 (319) 8,985
886 2,252 (33) 16 (232) 2,889
$1,286 $4,880 $ – $ 17 $ (87) $ 6,096
Unrealized Appreciation
(Depreciation) of Fixed Net Derivative
Maturity Investments Unrealized Gains (Losses) Change in
on Which Other-Than- Appreciation Foreign Arising from Retirement
Temporary Credit (Depreciation) Currency Cash Flow Plan
Impairments Were of All Other Translation Hedging Liabilities
(in millions) Recognized Investments Adjustments Activities Adjustment Total
December 31, 2011
Unrealized change arising during period $ 84 $4,222 $ (97) $ (5) $ (440) $ 3,764
Less: Reclassification adjustments included in net
income (5) 5,345 1,681 (56) (335) 6,630
Total other comprehensive income (loss), before
income tax expense (benefit) 89 (1,123) (1,778) 51 (105) (2,866)
Less: Income tax expense (benefit) 163 362 (786) 34 (35) (262)
Total other comprehensive income (loss), net of
income tax expense (benefit) $ (74) $(1,485) $ (992) $ 17 $ (70) $ (2,604)
December 31, 2012
Unrealized change arising during period
I T E M 8 / N O T E 1 7 . T O T A L E Q U I T Y

.....................................................................................................................................................................................
18. NONCONTROLLING INTERESTS..............................................................................................................................................................................................
The following table presents a rollforward of non-controlling interests:
Year Ended December 31, 2012
Balance, beginning of year
Repayment to Department of the Treasury
Net contributions (distributions)
Consolidation (deconsolidation)
Comprehensive income:
Net income
Other comprehensive income (loss), net of tax:
Unrealized gains on investments
Foreign currency translation adjustments
Total other comprehensive income (loss), net of tax
Total comprehensive income
Other
Balance, end of year
Year Ended December 31, 2011
Balance, beginning of year $ – $ 434 $ 434 $ 26,358 $ 1,562 $ 27,920
Repurchase of SPV preferred interests in connection with
Recapitalization – – – (26,432) – (26,432)
Exchange of consideration for preferred stock in connection
with Recapitalization 20,292 – 20,292 – – –
Repayment to Department of the Treasury (12,425) – (12,425) – – –
Net distributions – (21) (21) – (8) (8)
Deconsolidation – (307) (307) – (123) (123)
Acquisition of noncontrolling interest – – – – (489) (489)
Comprehensive income (loss):
Net income (loss) 560 (8) 552 74 82 156
Other comprehensive income (loss), net of tax:
Unrealized losses on investments – (2) (2) – (155) (155)
Foreign currency translation adjustments – – – – 36 36
Total other comprehensive income (loss), net of tax – (2) (2) – (119) (119)
Total comprehensive income (loss) 560 (10) 550 74 (37) 37
Other – – – – (50) (50)
Balance, end of year $ 8,427 $ 96 $ 8,523 $ – $ 855 $ 855
Redeemable noncontrolling interest..............................................................................................................................................................................................
represented preferred
interests in the AIA SPV and ALICO SPV. In connection with the execution of our orderly asset disposition plan, as
well as the repayment of the FRBNY Credit Facility, we transferred two of our wholly owned businesses, AIA and
ALICO, to two newly created SPVs in exchange for all the common and preferred interests (the SPV Preferred
Interests) of those SPVs. On December 1, 2009, AIG transferred the SPV Preferred Interests to the FRBNY in
consideration for a $25 billion reduction of the outstanding loan balance and of the maximum amount of credit
available under the FRBNY Credit Facility and amended the terms of the FRBNY Credit Facility. As part of the
closing of the Recapitalization, the remaining SPV Preferred Interests, with an aggregate liquidation preference of
approximately $20.3 billion at January 14, 2011, were purchased from the FRBNY by AIG and transferred to the
Department of the Treasury as part of the consideration for the exchange of Series F Preferred Stock. Under the
..................................................................................................................................................................................................................................
AIG 2012 Form 10-K310
Redeemable
Noncontrolling interests Non-redeemable
Noncontrolling interestsHeld by
Department Held by
(in millions) of Treasury Other Total FRBNY Other Total
$ 8,427 $ 96 $ 8,523 $ – $ 855 $ 855
(8,635) – (8,635) – – –
– 36 36 – (87) (87)
– 68 68 – (27) (27)
208 14 222 – 40 40
– 4 4 – 5 5
– – – – (6) (6)
– 4 4 – (1) (1)
208 18 226 – 39 39
– 116 116 – (113) (113)
$ – $ 334 $ 334 $ – $ 667 $ 667
Nonvoting, callable, junior preferred interests held by the Department of Treasury
I T E M 8 / N O T E 1 8 . N O N C O N T R O L L I N G I N T E R E S T S

.....................................................................................................................................................................................
terms of the SPVs’ limited liability company agreements, the SPVs generally may not distribute funds to us until the
liquidation preferences and preferred returns on the respective SPV Preferred Interests had been repaid in full and
concurrent distributions had been made on certain participating returns attributable to the respective SPV Preferred
Interests. In connection with the Recapitalization, we agreed to cause the proceeds of certain asset dispositions to be
used to pay down the remaining SPV Preferred Interests.
The common interests, which we retained, entitled us to 100 percent of the voting power of the SPVs. The voting
power allowed us to elect the boards of managers of the SPVs, who oversaw the management and operation of the
SPVs. Primarily due to the substantive participation rights of the SPV Preferred Interests, the SPVs were determined
to be VIEs. As the primary beneficiary of the SPVs, we consolidated the SPVs.
As a result of the closing of the Recapitalization on January 14, 2011, the SPV Preferred Interests held by the
Department of the Treasury were no longer considered permanent equity on our Consolidated Balance Sheet, and
were classified as redeemable non-controlling interests. As part of the Recapitalization, we used approximately
$6.1 billion of the cash proceeds from the sale of ALICO to pay down a portion of the liquidation preference of the
SPV Preferred Interests. The liquidation preference of the SPV Preferred Interests was further reduced by
approximately $12.4 billion using proceeds from the sale of AIG Star, AIG Edison, Nan Shan, and MetLife securities
received in the sale of ALICO. During the first quarter of 2011, the remaining liquidation preference of the ALICO
SPV Preferred Interests was paid in full.
The SPV Preferred Interests were measured at fair value on their issuance date. The SPV Preferred Interests initially
had a liquidation preference of $25 billion and had a preferred return of five percent per year compounded quarterly
through September 22, 2013 and nine percent thereafter. The preferred return is reflected in Income (loss) from
continuing operations attributable to noncontrolling interests – Nonvoting, callable, junior and senior preferred
interests in the Consolidated Statement of Operations. The difference between the SPV Preferred Interests’ fair value
and the initial liquidation preference was amortized and included in Net income (loss) from continuing operations
attributable to noncontrolling interests – Nonvoting, callable, junior and senior preferred interests.
During the first quarter of 2012, the liquidation preference of the AIA SPV Preferred Interests was paid down in full.
See Note 16 herein for a discussion of indemnity payments made to MetLife pursuant to the terms of the ALICO
stock purchase agreement.
Non-redeemable noncontrolling interests..............................................................................................................................................................................................
include the equity interests of third-party shareholders in our
consolidated subsidiaries and includes the preferred shareholders’ equity in outstanding preferred stock of ILFC, a
wholly-owned subsidiary that is held for sale at December 31, 2012. The preferred stock in ILFC consists of 1,000
shares of market auction preferred stock (MAPS) in two series (Series A and B) of 500 shares each. Each of the
MAPS shares has a liquidation value of $100,000 per share and is not convertible. Dividends on the MAPS are
accounted for as a reduction of the noncontrolling interest. The dividend rate, other than the initial rate, for each
dividend period for each series is reset approximately every seven weeks (49 days) on the basis of orders placed in
an auction, provided such auctions are able to occur. At December 31, 2012, there is no ability to conduct such
auctions; therefore, the MAPS certificate of determination dictates that a maximum applicable rate, as defined in the
certificate of determination, be paid on the MAPS. At December 31, 2012, the dividend rate for each of the Series A
and Series B MAPS was 0.50 percent and 0.36 percent respectively.
For the years ended December 31, 2012 and 2011, the Noncontrolling interests balance declined by $188 million and
$707 million, respectively. In 2012, this decline was primarily caused by an adjustment for the reclassification of
noncontrolling interest from permanent to temporary and acquisitions of noncontrolling interests in 2012. In 2011, the
decline in noncontrolling interest balance was mostly due to the acquisition of Fuji’s noncontrolling interest.
..................................................................................................................................................................................................................................
AIG 2012 Form 10-K 311
Non-redeemable noncontrolling interests
I T E M 8 / N O T E 1 8 . N O N C O N T R O L L I N G I N T E R E S T S

.....................................................................................................................................................................................
19. EARNINGS (LOSS) PER SHARE (EPS)..............................................................................................................................................................................................
Basic and diluted earnings (loss) per share are based on the weighted average number of common shares
outstanding, adjusted to reflect all stock dividends and stock splits. Diluted EPS is based on those shares used in
basic EPS plus shares that would have been outstanding assuming issuance of common shares for all dilutive
potential common shares outstanding, adjusted to reflect all stock dividends and stock splits. Basic EPS was not
affected by outstanding stock purchase contracts. Diluted EPS was not affected by outstanding stock purchase
contracts because they were not dilutive.
In connection with the issuance of the Series C Preferred Stock, we applied the two-class method for calculating
EPS. The two-class method is an earnings allocation method for computing EPS when a company’s capital structure
includes either two or more classes of common stock or common stock and participating securities. This method
determines EPS based on dividends declared on common stock and participating securities (i.e., distributed
earnings), as well as participation rights of participating securities in any undistributed earnings. The Series C
Preferred Stock was retired as part of the Recapitalization on January 14, 2011.
We applied the two-class method due to the participation rights of the Series C Preferred Stock through January 14,
2011. However, application of the two-class method had no effect on earnings per share for 2011 because we
recognized a net loss attributable to AIG common shareholders from continuing operations, which is not applicable to
participating stock for EPS, for 2011. Subsequent to January 14, 2011, we have not had any outstanding
participating securities that would subject us to the two-class method.
The following table presents the computation of basic and diluted EPS:
Numerator for EPS:
Income from continuing operations $ 19,540 $ 13,254
Net income from continuing operations attributable to noncontrolling interests:
Nonvoting, callable, junior and senior preferred interests 634 1,818
Other 54 354
Total net income from continuing operations attributable to noncontrolling
interests 688 2,172
Net income attributable to AIG from continuing operations 18,852 11,082
Income (loss) from discontinued operations $ 1,790 $ (969)
Net income from discontinued operations attributable to noncontrolling interests 20 55
Net income (loss) attributable to AIG from discontinued operations, applicable
to common stock for EPS 1,770 (1,024)
Deemed dividends to AIG Series E and F Preferred Stock (812) –
Income (loss) allocated to the Series C Preferred Stock – continuing operations – (8,828)
Net income attributable to AIG common shareholders from continuing
operations, applicable to common stock for EPS $ 18,040 $ 2,254
Income (loss) allocated to the Series C Preferred Stock – discontinued
operations – 816
Net income (loss) attributable to AIG common shareholders from discontinued
operations, applicable to common stock for EPS $ 1,770 $ (208)
Denominator for EPS:
Weighted average shares outstanding – basic 1,799,385,757 136,585,844
Dilutive shares 72,740 63,436
Weighted average shares outstanding – diluted* 1,799,458,497 136,649,280
EPS attributable to AIG common shareholders:
Basic and diluted:
Income from continuing operations $ 10.03 $ 16.50
Income (loss) from discontinued operations $ 0.98 $ (1.52)
* Dilutive shares are calculated using the treasury stock method and include dilutive shares from share-based employee compensation
plans, and the warrants issued to the Department of the Treasury in 2009. The number of shares excluded from diluted shares outstanding
were 78 million, 76 million and 11 million for the years ended December 31, 2012, 2011 and 2010, respectively, because the effect would
have been anti-dilutive.
..................................................................................................................................................................................................................................
AIG 2012 Form 10-K312
Years Ended December 31,
(dollars in millions, except per share data) 2012 2011 2010
$ 7,752
208
54
262
7,490
$ (4,052)
–
(4,052)
–
–
$ 7,490
–
$ (4,052)
1,687,197,038
29,603
1,687,226,641
$ 4.44
$ (2.40)
I T E M 8 / N O T E 1 9 . E A R N I N G S ( L O S S ) P E R S H A R E ( E P S )

.....................................................................................................................................................................................
Deemed dividends resulted from the Recapitalization and represent the excess of:
• the fair value of the consideration transferred to the Department of the Treasury, which consisted of 1,092,169,866
shares of AIG Common Stock, $20.2 billion of AIA SPV Preferred Interests and ALICO SPV Preferred Interests,
and a liability for a commitment by us to pay the Department of the Treasury’s costs to dispose of all of its shares,
over
• the carrying value of the Series E Preferred Stock and Series F Preferred Stock.
The fair value of the AIG Common Stock issued for the Series C Preferred Stock over the carrying value of the
Series C Preferred Stock is not a deemed dividend because the Series C Preferred Stock was contingently
convertible into the 562,868,096 shares of AIG Common Stock for which it was exchanged. See Note 25 herein for
further discussion of shares exchanged in connection with the Recapitalization.
..................................................................................................................................................................................................................................
AIG 2012 Form 10-K 313
I T E M 8 / N O T E 1 9 . E A R N I N G S ( L O S S ) P E R S H A R E ( E P S )

.....................................................................................................................................................................................
20. STATUTORY FINANCIAL DATA AND RESTRICTIONS..............................................................................................................................................................................................
The following table presents statutory surplus and net income (loss) for our property casualty and life
insurance and retirement services operations in accordance with statutory accounting practices:
At December 31,
Statutory surplus(a):
Property casualty(b) $ 40,215
Life insurance and retirement services 14,184
Years Ended December 31,
Statutory net income (loss)(a)(c):
Property casualty $ 2,330 $ 471
Life insurance and retirement services 797 794
(a) Excludes discontinued operations and other divested businesses. Statutory surplus and net income (loss) with respect to foreign operations are
estimated at November 30.
(b) The 2011 amount was increased by $917 million for Property casualty and decreased $267 million for Life insurance and retirement services.
(c) Includes catastrophe losses (property casualty) and Net realized capital gains and losses.
Our insurance subsidiaries file financial statements prepared in accordance with statutory accounting practices
prescribed or permitted by domestic and foreign insurance regulatory authorities. The principal differences between
statutory financial statements and financial statements prepared in accordance with U.S. GAAP for domestic
companies are that statutory financial statements do not reflect DAC, some bond portfolios may be carried at
amortized cost, investment impairments are determined in accordance with statutory accounting practices, assets and
liabilities are presented net of reinsurance, policyholder liabilities are generally valued using more conservative
assumptions and certain assets are non-admitted.
At December 31, 2012, 2011 and 2010, statutory capital of our insurance subsidiaries exceeded minimum company
action level requirements.
Subsidiary Dividend Restrictions..............................................................................................................................................................................................
Payments of dividends to us by our insurance subsidiaries are subject to certain restrictions imposed by regulatory
authorities. With respect to our domestic insurance subsidiaries, the payment of any dividend requires formal notice
to the insurance department in which the particular insurance subsidiary is domiciled. For example, unless permitted
by the New York Superintendent of Insurance, property casualty companies domiciled in New York may not pay
dividends to shareholders that, in any 12-month period, exceed the lesser of ten percent of such company’s statutory
policyholders’ surplus or 100 percent of its ‘‘adjusted net investment income,’’ as defined. Generally, less severe
restrictions applicable to both property casualty and life insurance companies exist in most of the other states in
which our insurance subsidiaries are domiciled. Under the laws of many states, an insurer may pay a dividend
without prior approval of the insurance regulator when the amount of the dividend is below certain regulatory
thresholds. Other foreign jurisdictions may restrict the ability of our foreign insurance subsidiaries to pay dividends.
There are also various local restrictions limiting cash loans and advances to us by our subsidiaries. Largely as a
result of these restrictions, approximately 92 percent of the aggregate equity of our consolidated insurance operations
was restricted from transfer to AIG Parent at December 31, 2012. We cannot predict how regulatory investigations
may affect the ability of our regulated subsidiaries to pay dividends.
To our knowledge, no AIG insurance company is currently on any regulatory or similar ‘‘watch list’’ with regard to
solvency.
..................................................................................................................................................................................................................................
AIG 2012 Form 10-K314
$ 40,111
14,692
$ 3,855
3,827
(in millions) 2012 2011 2010
I T E M 8 / N O T E 2 0 . S T A T U T O R Y F I N A N C I A L D A T A A N D R E S T R I C T I O N S

.....................................................................................................................................................................................
21. SHARE-BASED COMPENSATION AND OTHER PLANS..............................................................................................................................................................................................
Our Consolidated Statement of Operations included share-based compensation expense as follows:
Share-based compensation expense – pre-tax* $ (16) $ 333Share-based compensation expense – after tax (10) 216
* As of December 31, 2012, compensation expense for the majority of our outstanding share-based awards is attributed to liability-classified
awards, the value of which are based on our share price at the reporting date. Our share price was $35.30, $23.20 and $57.62 at December 31,
2012, December 31, 2011 and December 31, 2010, respectively, and is the primary driver of the volatility in share-based compensation expense.
Pre-tax share-based compensation expense related to discontinued operations for the years ended December 31, 2012, 2011 and 2010 of
$15 million ($10 million after tax), ($4 million) (($3 million) after tax) and $18 million ($13 million after tax), respectively, is also included.
Employee Plans..............................................................................................................................................................................................
Our employees are granted awards under the AIG 2010 Stock Incentive Plan, as amended (2010 Plan), under whichwe have issued restricted stock, restricted stock units (RSUs) and stock appreciation rights (SARs). The 2010 Plansupersedes all plans for which share-based awards remain outstanding and is currently the only plan under whichshare-based awards can be issued.
However, of all grants made under the legacy plans, only grants under the 2007 Stock Incentive Plan (the 2007Plan) and the Starr International Company, Inc. Deferred Compensation Profit Participation Plans (the SICO Plans)remain unvested as of December 31, 2012.
Our share-settled awards are settled with newly-issued shares of AIG Common Stock. Share awards made by SICOare settled by SICO.
Non-Employee Plans..............................................................................................................................................................................................
Our non-employee directors received share-based compensation in the form of deferred stock units (DSUs) under the2010 Plan with delivery deferred until retirement from the Board. In 2012, 2011 and 2010, we granted to directors19,434, 21,203 and 14,484 DSUs, respectively.
Stock Options..............................................................................................................................................................................................
AIG Stock Option Plan..............................................................................................................................................................................................
Options granted under the 2007 Plan and the 1999 Stock Option Plan are vested and out of the money atDecember 31, 2012. These awards generally vested over four years (25 percent vesting per year) and expired10 years from the date of grant. There were no stock options granted since 2008; however, in 2012, we issued558,358 shares in connection with previous exercises of options with delivery deferred.
The following table provides a roll forward of stock option activity:
Options:Exercisable at beginning of year 710,298 $ 1,172.25 2.96
Expired (196,053) $ 1,284.58
Exercisable at end of year 514,245 $ 1,129.42 2.49
The aggregate intrinsic value for all unexercised options is zero, and no unrecognized compensation costs remain forstock options under these plans at December 31, 2012.
..................................................................................................................................................................................................................................
AIG 2012 Form 10-K 315
$ 286186
Years Ended December 31,
(in millions) 2012 2011 2010
Weighted
Average
Remaining
As of or for the Year Weighted Average Contractual
Ended December 31, 2012 Shares Exercise Price Life
I T E M 8 / N O T E 2 1 . S H A R E - B A S E D C O M P E N S A T I O N A N D O T H E R P L A N S

.....................................................................................................................................................................................
Other Share-Settled Awards under Share-Based Plans..............................................................................................................................................................................................
AIG 2010 Stock Incentive Plan..............................................................................................................................................................................................
The 2010 Plan was adopted at the 2010 Annual Meeting of Shareholders. The total number of shares of AIGCommon Stock that may be granted under the 2010 Plan is 60,000,000 (the reserve). During 2012, 2011 and 2010,we granted DSUs, RSUs, restricted stock and stock appreciation rights (SARS) under the 2010 Plan. Each RSU,DSU, SAR and share of restricted stock awarded reduces the number of shares available for future grants by oneshare. The reserve is also reduced for the issuance of cash-settled share-based awards regardless of the form inwhich the award is originally granted. At December 31, 2012, a total of 25,031,720 shares remained in reserve forfuture grants under the 2010 Plan.
AIG 2007 Stock Incentive Plan..............................................................................................................................................................................................
The 2007 Plan was adopted at the 2007 Annual Meeting of Shareholders. The 2010 Plan superseded the 2007 Plan,therefore, there were no grants made under the 2007 Plan subsequent to May 11, 2010. During 2010, 114,521time-vested RSUs were granted under the 2007 Plan and vest on the second or the third anniversary of the date ofgrant.
SICO Plans..............................................................................................................................................................................................
The SICO Plans provide that shares of AIG Common Stock currently held by SICO are set aside for the benefit ofthe participant and distributed upon retirement. The SICO Board of Directors currently may permit an early payout ofshares under certain circumstances. Prior to payout, the participant is not entitled to vote, dispose of or receivedividends with respect to such shares, and shares are subject to forfeiture under certain conditions, including but notlimited to the participant’s termination of employment with us prior to normal retirement age. A significant portion ofthe awards under the SICO Plans vest the year after the participant reaches age 65, provided that the participantremains employed by us through age 65. The portion of the awards for which early payout is available vest on theapplicable payout date.
Although none of the costs of the various benefits provided under the SICO Plans have been paid by us, we haverecorded compensation expense for the deferred compensation amounts payable to our employees by SICO, with anoffsetting amount credited to Additional paid-in capital reflecting amounts deemed contributed by SICO.
Restricted Stock and Restricted Stock Unit Valuation..............................................................................................................................................................................................
The fair value of restricted stock and RSUs is based on the closing price of AIG Common Stock on the date of grant.
The following table summarizes outstanding share-settled awards and RSUs that are fully vested on the date
of grant but subject to transfer restrictions under the foregoing plans(a):
Unvested, beginning of year(c) 48,892 195,907 $ 74.57 $ 1,209.45Granted 241,268 – 31.04 –Vested (240,765) (48,391) 34.47 747.11Forfeited (10,146) (27,572) 92.70 1,210.60
Unvested, end of year 39,249 119,944 $ 48.29 $ 1,197.96
(a) Excludes DSUs and options, which are discussed under the Non-Employee Plans and Stock Options sections above.
(b) Excludes legacy Deferred Compensation Profit Participation and Partners Plan for which the final installments (38,959 RSUs) vested on
January 1, 2012.
(c) Adjusted to reflect the Company’s election in 2012 to cash-settle RSUs that were previously expected to be share-settled.
The total unrecognized compensation cost (net of expected forfeitures) related to unvested SICO awards is$46 million and the weighted-average and expected period of years over which those costs are expected to berecognized are 5.44 years and 27 years, respectively. The unrecognized expense for all other awards totals less than$1 million, with a weighted average period of less than one year.
..................................................................................................................................................................................................................................
AIG 2012 Form 10-K316
Weighted Average
Number of Shares/RSUs Grant-Date Fair Value
As of or for the Year AIG SICO AIG SICO
Ended December 31, 2012 Plans(b) Plans Plans Plans
I T E M 8 / N O T E 2 1 . S H A R E - B A S E D C O M P E N S A T I O N A N D O T H E R P L A N S

.....................................................................................................................................................................................
Liability Awards..............................................................................................................................................................................................
We have issued various share-based grants, including restricted stock units, linked to AIG Common Stock, butproviding for cash settlement to certain of our most highly compensated employees and executive officers. Share-based cash settled awards are recorded as liabilities until the final payout is made or the award is replaced with astock-settled award. Compensation expense is recognized over the vesting periods, unless the award is fully vestedon the grant date in which case the entire award value is immediately expensed.
Unlike stock-settled awards, which have a fixed grant-date fair value (unless the award is subsequently modified), thefair value of unsettled or unvested liability awards is remeasured at the end of each reporting period based on thechange in fair value of one share of AIG Common Stock. The liability and corresponding expense are adjustedaccordingly until the award is settled.
Restricted Stock Units..............................................................................................................................................................................................
Stock Salary Awards..............................................................................................................................................................................................
In 2009, we established a program of regular grants of vested stock or units that is generally referred to as ‘‘StockSalary.’’ Stock Salary is determined as a dollar amount through the date that salary is earned and accrued at thesame time or times as the salary would otherwise be paid in cash. Stock Salary was granted to any individualqualifying as a senior executive officer or one of our next twenty most highly compensated employees (the Top 25).Stock Salary for a Top 25 employee (other than our CEO) is settled in three equal installments on the first, secondand third anniversary of grant. Stock Salary was also granted to individuals qualifying as an executive officer or oneof our next 75 most highly compensated employees (Top 26-100), and is generally settled on either the first or thirdanniversary of grant in accordance with the terms of an employee’s award. Except as noted below, Stock Salarygrants issued were awarded in the form of immediately vested RSUs, and the number of units awarded was basedon the value of AIG Common Stock on the grant date. During 2012, we issued 2,668,436 RSUs to eligibleemployees.
In 2010, Stock Salary was awarded in the form of fully vested long term performance units (LTPU) that weremeasured based on a mix of our hybrid securities and AIG Common Stock weighted 80 percent and 20 percent,respectively. In April 2011, unsettled LTPUs were subsequently converted to RSUs based on the value of AIGCommon Stock on the conversion date. RSUs are settled in cash based on the value of AIG Common Stock on theapplicable settlement date. During 2012, 2011 and 2010 we paid $111 million, $35 million and $18 millionrespectively to settle awards; for those awards that were unsettled at the end of each year, we recognized a chargeof $173 million, a reduction of $1 million and a charge of $192 million in compensation expense in the respectiveyears to reflect fluctuations in the price of AIG Common Stock.
TARP RSUs..............................................................................................................................................................................................
TARP RSUs awarded require the achievement of objective performance metrics as a condition to entitlement. Whenvested and transferable, an award would be settled in 25 percent installments in proportion to the settlement of ourTARP obligations. Prior to December 2011, TARP RSUs granted to the Top 25 (other than our CEO) vested on thethird anniversary of grant, while TARP RSUs granted to the Top 26-100 vested on the second anniversary of grantand are subject to transferability restrictions for an additional year after vesting. As of December 2011, all TARPRSUs granted will vest in two 50 percent installments on the second and third anniversary of the date of grant. OurTARP obligations were fully repaid in December 2012. Accordingly, 100 percent of outstanding TARP RSUs will vestonce the service requirements are satisfied.
Other RSUs..............................................................................................................................................................................................
Fully-vested RSUs totaling 271,131 were issued in March 2011 to certain employees in the Top 26-100 based on2010 performance. Similarly, 301,645 fully vested RSUs were issued in March 2010 for performance in 2009. TheRSUs for both awards will be cash-settled in March 2014 and 2013 for the 2010 and 2009 grants, respectively,based on the value of AIG Common Stock on each settlement date. Compensation expense totaling $8 million and$9 million was recorded in December 2010 and December 2009, respectively, when the awards were initially grantedand $4 million was recorded for those awards that remained unsettled at December 31, 2012.
..................................................................................................................................................................................................................................
AIG 2012 Form 10-K 317
I T E M 8 / N O T E 2 1 . S H A R E - B A S E D C O M P E N S A T I O N A N D O T H E R P L A N S

.....................................................................................................................................................................................
During 2012, with the exception of 139,169 fully-vested RSUs issued to certain employees, RSUs granted and issued
in March 2012 for Recipients’ 2011 performance will vest in two 50 percent installments on the second and third
anniversary of the date of grant.
Long Term Incentive Plans..............................................................................................................................................................................................
Under our Long-Term Incentive Plan (LTIP), certain employees are offered the opportunity to receive additional
compensation in the form of cash and/or SARs if certain performance metrics are met. The ultimate value of LTIP
awards is contingent on the achievement of performance measures aligned to the participant’s business unit over a
two-year period and such value could range from zero to twice the target amount. Subsequent to the performance
period, the earned awards are subject to an additional time-vesting period. This results in a graded vesting schedule
for the cash portion of up to two years, while the SARs portion cliff-vests two years after the performance period
ends. For a majority of SARs issued under the 2011 LTIP, the strike price, which is based on our average share
price over the 30-day period prior to the March grant date, was $37.40. On January 19, 2011, the previous strike
price of $31.91 for SARs issued under both the 2010 LTIP and the 2009 LTIP was adjusted to $26.97 pursuant to
anti-dilution provisions of the LTIP due to the issuance of warrants in connection with the Recapitalization (see
Note 25 for additional discussion). No SARs were granted in connection with the 2012 LTIP.
The cash portion of the awards expensed in 2012, 2011 and 2010 totaled approximately $189 million, $199 million,
and $258 million, respectively.
The following table presents a rollforward of SARs and cash-settled RSUs (excluding stock salary) as well as
the related expenses:
Unvested, beginning of year(a) 14,123,062 1,549,622 7,389
Granted(b) 1,809,842 678,188 836,355
Vested(c) (1,864,801) (246,434) (139,169)
Forfeited (1,711,530) (91,942) (18,285)
Unvested, end of year 12,356,573 1,889,434 686,290
Net compensation expense for the year (in millions) $ 84 $ 31 $ 17
(a) Adjusted to reflect our election in 2012 to cash-settle RSUs that were previously expected to be share-settled.
(b) Represents additional SARs earned as a result of the completion of the performance period for the 2010 LTIP.
(c) Pursuant to the terms of the LTIP, vesting was accelerated for SARs awarded to employees who became retirement eligible or were
deceased.
The total unrecognized compensation cost (net of expected forfeitures) related to unvested SARs and
cash-settled RSUs excluding stock salary and the weighted-average periods over which those costs are
expected to be recognized are as follows:
SARs $ 28 0.87 2
TARP RSUs 33 1.04 3
RSUs 14 1.00 2
..................................................................................................................................................................................................................................
AIG 2012 Form 10-K318
Number of Units
Year Ended December 31, 2012 SARs TARP RSUs RSUs
Unrecognized Weighted- ExpectedAt December 31, 2012 Compensation Average Period Period(in millions) Cost (years) (years)
I T E M 8 / N O T E 2 1 . S H A R E - B A S E D C O M P E N S A T I O N A N D O T H E R P L A N S

.....................................................................................................................................................................................
Stock Appreciation Rights Valuation..............................................................................................................................................................................................
We use a Monte Carlo simulation approach, which incorporates a range of input parameters that is consistently
applied, to determine the fair value of SARs awards at each reporting period. The table below presents the
assumptions used to estimate the fair value of SARs on December 31, 2012.
Expected dividend yield(a) –%
Expected volatility(b) 33.78 - 40.57%
Weighted-average volatility 37.64%
Risk-free interest rate(c) 0.34 - 0.40%
Expected term(d) 1.0 - 2.0 years
(a) The dividend yield is estimated at zero percent given our recent dividend history. See Note 17 herein for additional information.
(b) The expected volatilities are the implied volatilities with the nearest maturity and strike price as of valuation date from actively traded stock
options on AIG Common Stock.
(c) The risk-free interest rate is the continuously compounded interest rate for the term between the valuation date and maturity date that is
assumed to be constant and equal to the interpolated value between the closest data points on the USD LIBOR-Swap curve as of valuation date.
(d) The term to maturity is specified in the contract of each SARs grant.
..................................................................................................................................................................................................................................
AIG 2012 Form 10-K 319
2012
I T E M 8 / N O T E 2 1 . S H A R E - B A S E D C O M P E N S A T I O N A N D O T H E R P L A N S

.....................................................................................................................................................................................
22. EMPLOYEE BENEFITS..............................................................................................................................................................................................
Pension Plans..............................................................................................................................................................................................
We offer various defined benefit plans to eligible employees based on years of service.
The U.S. AIG Retirement Plan (the qualified plan) is a noncontributory defined benefit plan, which is subject to the
provisions of ERISA. U.S. salaried employees who are employed by a participating company and completed
12 months of continuous service are eligible to participate in the plan. Effective April 1, 2012, the qualified plan was
converted to a cash balance formula comprised of pay credits based on six percent of a plan participant’s annual
compensation (subject to IRS limitations) and annual interest credits. In addition, employees can take their vested
benefits when they leave AIG as a lump sum or an annuity option after completing at least three years of service.
However, employees satisfying certain age and service requirements (i.e. grandfathered employees) remain covered
under the old plan formula, which is based upon a percentage of final average compensation multiplied by years of
credited service, up to 44 years. Grandfathered employees will receive the higher of the benefits under the cash
balance or final average pay formula at retirement. Non-U.S. defined benefit plans are generally either based on the
employee’s years of credited service and compensation in the years preceding retirement or on points accumulated
based on the employee’s job grade and other factors during each year of service.
We also sponsor several non-qualified unfunded defined benefit plans for certain employees, including key
executives, designed to supplement pension benefits provided by the qualified plan. These include the AIG
Non-Qualified Retirement Income Plan (AIG NQRIP) formerly known as AIG Excess Retirement Income Plan, which
provides a benefit equal to the reduction in benefits payable to certain employees under the qualified plan as a result
of federal tax limitations on compensation and benefits payable, and the Supplemental Executive Retirement Plan
(Supplemental), which provides additional retirement benefits to designated executives. Under the Supplemental plan,
an annual benefit accrues at a percentage of final average pay multiplied by each year of credited service, not
greater than 60 percent of final average pay, reduced by any benefits from the current and any predecessor
retirement plans (including the AIG NQRIP Plan), Social Security, and any benefits accrued under a Company
sponsored foreign deferred compensation plan. As of December 2012, we are no longer subject to the Special
Master for TARP Executive Compensation; therefore, the suspension of future benefit accruals in the non-qualified
retirement plans for our Top 100 most highly compensated employees is lifted.
Postretirement Plans..............................................................................................................................................................................................
We also provide postretirement medical care and life insurance benefits in the U.S. and in certain non-U.S. countries.
Eligibility in the various plans is generally based upon completion of a specified period of eligible service and
attaining a specified age. Overseas, benefits vary by geographic location.
U.S. postretirement medical and life insurance benefits are based upon the employee attaining the age of 55 and
having a minimum of ten years of service. Eligible employees who have medical coverage can enroll in retiree
medical without having to elect immediate retirement pension benefits. Medical benefits are contributory, while the life
insurance benefits are generally non-contributory. Retiree medical contributions vary from requiring no cost for
pre-1989 retirees to requiring actual premium payments reduced by certain subsidies for post-1993 retirees. These
contributions are subject to adjustment annually. Other cost sharing features of the medical plan include deductibles,
coinsurance and Medicare coordination. Effective April 1, 2012, the retiree medical employer subsidy for the AIG
Postretirement plan was eliminated for employees who were not grandfathered. Additionally, new employees hired
after December 31, 2012 are not eligible for retiree life insurance.
The following table presents the funded status of the plans, reconciled to the amount reported in the
Consolidated Balance Sheet. The measurement date for most of the Non-U.S. defined benefit pension and
..................................................................................................................................................................................................................................
AIG 2012 Form 10-K320
I T E M 8 / N O T E 2 2 . E M P L O Y E E B E N E F I T S

.....................................................................................................................................................................................
postretirement plans is November 30, consistent with the fiscal year end of the sponsoring companies. For
all other plans, measurement occurs as of December 31.
Change in projected benefit obligation:
Benefit obligation, beginning of year $ 3,878 $ 1,981 $ 279 $ 66
Service cost 150 66 8 4
Interest cost 207 37 13 2
Actuarial (gain) loss 653 (7) 6 7
Benefits paid:
AIG assets (8) (26) (7) (1)
Plan assets (118) (48) – –
Plan amendment (324) (11) (63) –
Curtailments – – –
Settlements – (56) – –
Foreign exchange effect – 80 – 1
Dispositions – (888) – (30)
Acquisitions – – – –
Other – 9 – 3
Projected benefit obligation, end of year $ 4,438 $ 1,137 $ 236 $ 52
Change in plan assets:
Fair value of plan assets, beginning of year $ 3,425 $ 954 $ – $ –
Actual return on plan assets, net of expenses 125 3 – –
AIG contributions 8 100 7 1
Benefits paid:
AIG assets (8) (26) (7) (1)
Plan assets (118) (48) – –
Settlements – (56) – –
Foreign exchange effect – 45 – –
Dispositions – (295) – –
Acquisitions – – – –
Other – 6 – –
Fair value of plan assets, end of year $ 3,432 $ 683 $ – $ –
Funded status, end of year $ (1,006) $ (454) $ (236) $ (52)
Amounts recognized in the consolidated balance sheet:
Assets $ – $ 80 $ – $ –
Liabilities (1,006) (534) (236) (52)
Total amounts recognized $ (1,006) $ (454) $ (236) $ (52)
Pre tax amounts recognized in Accumulated other
comprehensive income (loss):
Net gain (loss) $ (1,550) $ (272) $ (18) $ (2)
Prior service (cost) credit 303 30 48 1
Total amounts recognized $ (1,247) $ (242) $ 30 $ (1)
(a) We do not currently fund postretirement benefits.
(b) Includes non-qualified unfunded plans of which the aggregate projected benefit obligation was $238 million and $210 million for the U.S. and
$299 million and $267 million for the non-U.S. at December 31, 2012 and 2011, respectively.
..................................................................................................................................................................................................................................
AIG 2012 Form 10-K 321
Pension Postretirement(a)
As of or for the Years Ended U.S. Plans(b) Non-U.S. Plans(b) U.S. Plans Non-U.S. PlansDecember 31,(in millions) 2012 2011 2012 2011 2012 2011 2012 2011
$ 4,438 $ 1,137 $ 236 $ 52
154 53 5 3
200 34 11 2
536 69 22 11
(12) (7) (11) (1)
(150) (35) – –
– 4 (8) –
(5) (3) – – (1)
– (20) – –
– (32) – –
– – – –
– – – –
– 5 – –
$ 5,161 $ 1,205 $ 255 $ 66
$ 3,432 $ 683 $ – $ –
438 34 – –
12 86 11 1
(12) (7) (11) (1)
(150) (35) – –
– (20) – –
– (15) – –
– – – –
– – – –
– 1 – –
$ 3,720 $ 727 $ – $ –
$ (1,441) $ (478) $ (255) $ (66)
$ – $ 65 $ – $ –
(1,441) (543) (255) (66)
$ (1,441) $ (478) $ (255) $ (66)
$ (1,764) $ (299) $ (40) $ 1
267 21 46 (13)
$ (1,497) $ (278) $ 6 $ (12)
I T E M 8 / N O T E 2 2 . E M P L O Y E E B E N E F I T S

.....................................................................................................................................................................................
The following table presents the accumulated benefit obligations for U.S. and Non-U.S. pension benefit
plans:
U.S. pension benefit plans $ 4,291
Non-U.S. pension benefit plans $ 895
Defined benefit pension plan obligations in which the projected benefit obligation was in excess of the
related plan assets and the accumulated benefit obligation was in excess of the related plan assets were as
follows:
Projected benefit obligation $ 4,438 $ 956 $ 4,438 $ 916
Accumulated benefit obligation 4,291 895 4,291 864
Fair value of plan assets 3,432 422 3,432 388
The following table presents the components of net periodic benefit cost recognized in income and other
amounts recognized in Accumulated other comprehensive income (loss) with respect to the defined benefit
pension plans and other postretirement benefit plans:
Components of net periodic benefit cost:
Service cost $ 150 $ 149 $ 66 $ 137 $ 8 $ 8 $ 4 $ 8
Interest cost 207 216 37 59 13 15 2 4
Expected return on assets (250) (259) (25) (31) – – – –
Amortization of prior service (credit) cost (7) 1 (4) (9) (2) – – –
Amortization of net (gain) loss 65 57 15 45 – (1) – –
Net curtailment (gain) loss – 1 – (1) – (2) – –
Net settlement (gain) loss – 58 8 3 – (6) – –
Other – – – 2 – – – –
Net periodic benefit cost $ 165 $ 223 $ 97 $ 205 $ 19 $ 14 $ 6 $ 12
Amount associated with discontinued operations $ – $ 1 $ – $ – $ – $ – $ – $ –
Total recognized in Accumulated other comprehensive income
(loss) $ (396) $ 85 $ 261 $ 167 $ 56 $ (3) $ (6) $ 16
Total recognized in net periodic benefit cost and other
comprehensive income (loss) $ (561) $ (139) $ 164 $ (38) $ 37 $ (17) $ (12) $ 4
The estimated net loss and prior service credit that will be amortized from Accumulated other comprehensive income
into net periodic benefit cost over the next fiscal year are $145 million and $37 million, respectively, for our combined
defined benefit pension plans. For the defined benefit postretirement plans, the estimated amortization from
Accumulated other comprehensive income for net loss and prior service credit that will be amortized into net periodic
benefit cost over the next fiscal year will be less than $9 million in the aggregate.
The annual pension expense in 2013 for the AIG U.S. and non-U.S. defined benefit pension plans is expected to be
approximately $292 million including less than $1 million associated with ILFC. A 100 basis point increase in the
discount rate or expected long-term rate of return would decrease the 2013 expense by approximately $90 million
and $43 million, respectively, with all other items remaining the same. Conversely, a 100 basis point decrease in the
discount rate or expected long-term rate of return would increase the 2013 expense by approximately $96 million and
$43 million, respectively, with all other items remaining the same.
..................................................................................................................................................................................................................................
AIG 2012 Form 10-K322
At December 31,
(in millions) 2012 2011
$ 4,827
$ 1,125
PBO Exceeds Fair Value of Plan Assets ABO Exceeds Fair Value of Plan Assets
U.S. Plans Non-U.S. Plans U.S. Plans Non-U.S. PlansAt December 31,
(in millions) 2012 2011 2012 2011 2012 2011 2012 2011
$ 5,161 $ 1,028 $ 5,161 $ 1,018
4,827 964 4,827 959
3,720 485 3,720 478
Pension Postretirement
U.S. Plans Non-U.S. Plans U.S. Plans Non-U.S. Plans
(in millions) 2012 2011 2010 2012 2011 2010 2012 2011 2010 2012 2011 2010
$ 154 $ 53 $ 5 $ 3
200 34 11 2
(240) (20) – –
(33) (4) (10) –
118 13 – –
– 1 – (1)
– 4 – –
– – – –
$ 199 $ 81 $ 6 $ 4
$ (2) $ – $ – $ –
$ (250) $ (36) $ (23) $ (11)
$ (447) $ (117) $ (29) $ (15)
I T E M 8 / N O T E 2 2 . E M P L O Y E E B E N E F I T S

.....................................................................................................................................................................................
Assumptions..............................................................................................................................................................................................
The following table summarizes the weighted average assumptions used to determine the benefit
obligations:
December 31, 2012
Discount rate
Rate of compensation increase
December 31, 2011
Discount rate 4.62% 3.02% 4.51% 4.19%
Rate of compensation increase 4.00% 2.94% N/A 3.61%
(a) The non-U.S. plans reflect those assumptions that were most appropriate for the local economic environments of each of the subsidiaries
providing such benefits.
The following table summarizes assumed health care cost trend rates for the U.S. plans:
Following year:
Medical (before age 65) 7.59%
Medical (age 65 and older) 6.88%
Ultimate rate to which cost increase is assumed to decline 4.50%
Year in which the ultimate trend rate is reached:
Medical (before age 65) 2027
Medical (age 65 and older) 2027
A one percent point change in the assumed healthcare cost trend rate would have the following effect on our
postretirement benefit obligations:
U.S. plans $ 3 $ (3)
Non-U.S. plans $ 11 $ (8)
Our postretirement plans provide benefits primarily in the form of defined employer contributions rather than defined
employer benefits. Changes in the assumed healthcare cost trend rate are subject to caps for U.S. plans. Our
non-U.S. postretirement plans are not subject to caps.
..................................................................................................................................................................................................................................
AIG 2012 Form 10-K 323
Pension Postretirement
U.S. Plans Non-U.S. Plans(a) U.S. Plans Non-U.S. Plans(a)
3.93% 2.62% 3.67% 3.45%
4.00% 2.86% N/A 3.55%
At December 31, 2012 2011
7.39%
6.82%
4.50%
2027
2027
One Percent One Percent
Increase DecreaseAt December 31,
(in millions) 2012 2011 2012 2011
$ 5 $ (4)
$ 15 $ (11)
I T E M 8 / N O T E 2 2 . E M P L O Y E E B E N E F I T S

.....................................................................................................................................................................................
The following table presents the weighted average assumptions used to determine the net periodic benefit
costs:
2012
Discount rate
Rate of compensation increase
Expected return on assets
2011
Discount rate 5.50% 2.25% 5.25% 4.00%
Rate of compensation increase 4.00% 3.00% N/A 3.00%
Expected return on assets 7.50% 3.14% N/A N/A
2010
Discount rate 6.00% 2.75% 5.75% 3.75%
Rate of compensation increase 4.00% 3.50% N/A 3.75%
Expected return on assets 7.75% 3.75% N/A N/A
(a) The non-U.S. plans reflect those assumptions that were most appropriate for the local economic environments of the subsidiaries providing
such benefits.
Discount Rate Methodology..............................................................................................................................................................................................
The projected benefit cash flows under the U.S. AIG Retirement plan were discounted using the spot rates derived
from the Mercer Pension Discount Yield Curve at December 31, 2012 and December 31, 2011, which resulted in a
single discount rate that would produce the same liability at the respective measurement dates. The discount rates
were 3.94 percent at December 31, 2012 and 4.62 percent at December 31, 2011. The methodology was
consistently applied for the respective years in determining the discount rates for the other U.S. plans.
In general, the discount rates for non-U.S. pension plans were developed based on the duration of liabilities on a
plan by plan basis and were selected by reference to high quality corporate bonds in developed markets or local
government bonds where developed markets are not as robust or are nonexistent.
The projected benefit obligation for Japan represents approximately 57 and 62 percent of the total projected benefit
obligations for our non-U.S. pension plans at December 31, 2012 and 2011, respectively. The weighted average
discount rate of 1.54 and 1.70 percent at December 31, 2012 and 2011 respectively for Japan was selected by
reference to the AA rated corporate bonds reported by Rating and Investment Information, Inc. based on the duration
of the plans’ liabilities.
Plan Assets..............................................................................................................................................................................................
The investment strategy with respect to assets relating to our U.S. and non-U.S. pension plans is designed to
achieve investment returns that will (a) provide for the benefit obligations of the plans over the long term; (b) limit the
risk of short-term funding shortfalls; and (c) maintain liquidity sufficient to address cash needs. Accordingly, the asset
allocation strategy is designed to maximize the investment rate of return while managing various risk factors,
including but not limited to, volatility relative to the benefit obligations, diversification and concentration, and the risk
and rewards profile indigenous to each asset class. The assessment of the expected rate of return for all our plans is
long-term and thus not expected to change annually; however, significant changes in investment strategy or
economic conditions may warrant such a change.
There were no shares of AIG Common Stock included in the U.S. and non-U.S. pension plans assets at
December 31, 2012 or 2011.
..................................................................................................................................................................................................................................
AIG 2012 Form 10-K324
Pension Postretirement
At December 31, U.S. Plans Non-U.S. Plans(a) U.S. Plans Non-U.S. Plans(a)
4.62% 3.02% 4.51% 4.19%
4.00% 2.94% N/A 3.61%
7.25% 2.91% N/A N/A
I T E M 8 / N O T E 2 2 . E M P L O Y E E B E N E F I T S

.....................................................................................................................................................................................
U.S. Pension Plans..............................................................................................................................................................................................
The long-term strategic asset allocation is reviewed and revised approximately every three years. The plans’ assets
are monitored by the investment committee of our Retirement Board and the investment managers, which includes
allocating the plans’ assets among approved asset classes within pre-approved ranges permitted by the strategic
allocation.
The following table presents the asset allocation percentage by major asset class for U.S. pension plans and
the target allocation:
Asset class:
Equity securities 45% 52%
Fixed maturity securities 30% 30%
Other investments 25% 18%
Total 100% 100%
The expected long-term rate of return for the plan was 7.25 and 7.50 percent for 2012 and 2011, respectively. The
expected rate of return is an aggregation of expected returns within each asset class category and incorporates the
current and target asset allocations. The combination of the expected asset return and any contributions made by us
are expected to maintain the plans’ ability to meet all required benefit obligations. The expected asset return for each
asset class was developed based on an approach that considers key fundamental drivers of the asset class returns
in addition to historical returns, current market conditions, asset volatility and the expectations for future market
returns.
Non-U.S. Pension Plans..............................................................................................................................................................................................
The assets of the non-U.S. pension plans are held in various trusts in multiple countries and are invested primarily in
equities and fixed maturity securities to maximize the long-term return on assets for a given level of risk.
The following table presents the asset allocation percentage by major asset class for Non-U.S. pension plans
and the target allocation:
Asset class:
Equity securities 28% 38%
Fixed maturity securities 43% 39%
Other investments 28% 6%
Cash and cash equivalents 1% 17%
Total 100% 100%
The expected weighted average long-term rates of return for our non-U.S. pension plans was 2.91 and 3.14 percent
for the years ended December 31, 2012 and 2011, respectively. The expected rate of return for each country is an
aggregation of expected returns within each asset class for such country. For each country, the return with respect to
each asset class was developed based on a building block approach that considers historical returns, current market
conditions, asset volatility and the expectations for future market returns.
Assets Measured at Fair Value..............................................................................................................................................................................................
We are required to disclose the level of the fair value measurement of the plan assets. The inputs and methodology
used in determining the fair value of these assets are consistent with those used to measure our assets as noted in
Note 6 herein.
..................................................................................................................................................................................................................................
AIG 2012 Form 10-K 325
Target Actual Actual
At December 31, 2013 2012 2011
44%
29%
27%
100%
Target Actual Actual
At December 31, 2013 2012 2011
36%
43%
6%
15%
100%
I T E M 8 / N O T E 2 2 . E M P L O Y E E B E N E F I T S

.....................................................................................................................................................................................
The following table presents information about our plan assets based on the level within the fair value
hierarchy in which the fair value measurement falls:
At December 31, 2012
Assets:
Cash & cash equivalents
Equity securities:
U.S.(a)
International(b)
Fixed maturity securities:
U.S. investment grade(c)
International investment grade(c)
U.S. and international high yield(d)
Mortgage and other asset-backed securities(e)
Other fixed maturity securities
Other investment types:
Hedge funds(f)
Commodities
Private equity(g)
Insurance contracts
Total
At December 31, 2011
Assets:
Cash & cash equivalents $ 9 $ – $ – $ 9 $ 114 $ – $ – $ 114
Equity securities:
U.S.(a) 1,449 13 – 1,462 19 – – 19
International(b) 305 16 – 321 242 1 – 243
Fixed maturity securities:
U.S. investment grade(c) – 794 1 795 – – – –
International investment grade(c) – – – – – 139 – 139
U.S. and international high yield(d) – 104 – 104 – 88 – 88
Mortgage and other asset-backed securities(e) – 80 36 116 – – – –
Other fixed maturity securities – – – – – 40 1 41
Other investment types:
Hedge funds(f) – 345 – 345 – – – –
Commodities – 26 – 26 – – – –
Private equity(g) – – 223 223 – – – –
Insurance contracts – 31 – 31 – – 39 39
Total $ 1,763 $ 1,409 $ 260 $ 3,432 $ 375 $ 268 $ 40 $ 683
(a) Includes index funds that primarily track several indices including S&P 500 and S&P Small Cap 600 in addition to other actively managed
accounts comprised of investments in large cap companies.
(b) Includes investments in companies in emerging and developed markets.
(c) Represents investments in U.S. and non-U.S. government issued bonds, U.S. government agency or sponsored agency bonds, and investment
grade corporate bonds.
(d) Consists primarily of investments in securities or debt obligations that have a rating below investment grade.
(e) Comprised primarily of investments in U.S. government agency or U.S. government sponsored agency bonds.
(f) Includes funds comprised of macro, event driven, long/short equity, and controlled risk hedge fund strategies and a separately managed
controlled risk strategy.
(g) Includes funds that are diverse by geography, investment strategy, and sector.
..................................................................................................................................................................................................................................
AIG 2012 Form 10-K326
U.S. Plans Non-U.S. Plans
(in millions) Level 1 Level 2 Level 3 Total Level 1 Level 2 Level 3 Total
$ 229 $ – $ – $ 229 $ 113 $ – $ – $ 113
1,331 15 – 1,346 21 1 – 22
290 18 – 308 240 – – 240
– 763 11 774 – – – –
– 112 – 112 – 169 – 169
– 134 – 134 – 96 – 96
– 59 – 59 – – – –
– – – – – 17 27 44
– 334 – 334 – – – –
– 170 – 170 – – – –
– – 225 225 – – – –
– 29 – 29 – – 43 43
$ 1,850 $ 1,634 $ 236 $ 3,720 $ 374 $ 283 $ 70 $ 727
I T E M 8 / N O T E 2 2 . E M P L O Y E E B E N E F I T S

.....................................................................................................................................................................................
The inputs or methodologies used for valuing securities are not necessarily an indication of the risk associated with
investing in these securities. Based on our investment strategy, we have no significant concentrations of risks.
The U.S. pension plan holds a group annuity contract with US Life, one of our subsidiaries, which totaled $29 million
and $31 million at December 31, 2012 and 2011, respectively.
Changes in Level 3 fair value measurements..............................................................................................................................................................................................
The following table presents changes in our U.S. and Non-U.S. Level 3 plan assets measured at fair value:
U.S. Plan Assets:Fixed maturity
U.S. investment gradeMortgage and other asset-
backed securitiesPrivate equity
Total
Non-U.S. Plan Assets:Other fixed maturity securitiesInsurance contracts
Total
U.S. Plan Assets:Fixed maturity
U.S. investment grade $ 1 $ – $ – $ – $ – $ – $ – $ – $ 1 $ –U.S. and international high
yield – – – – – (1) 1 – – 1Mortgage and other asset-
backed securities 80 1 34 (79) – (1) 4 (3) 36 13Equities – U.S. – – – – – – – – – –Private equity 209 5 30 (20) – (1) – – 223 (23)
Total $ 290 $ 6 $ 64 $ (99) $ – $ (3) $ 5 $ (3) $ 260 $ (9)
Non-U.S. Plan Assets:Other fixed maturity securities $ – $ – $ 1 $ – $ – $ – $ – $ – $ 1 $ –Private equity – – – – – – – – – –Insurance contracts 34 3 2 – – – – – 39 –
Total $ 34 $ 3 $ 3 $ – $ – $ – $ – $ – $ 40 $ –
Transfers of Level 1 and Level 2 Assets and Liabilities..............................................................................................................................................................................................
Our policy is to record transfers of assets and liabilities between Level 1 and Level 2 at their fair values as of the
end of each reporting period, consistent with the date of the determination of fair value. Assets are transferred out of
Level 1 when they are no longer transacted with sufficient frequency and volume in an active market. Conversely,
assets are transferred from Level 2 to Level 1 when transaction volume and frequency are indicative of an active
market. We had no significant transfers between Level 1 and Level 2 during the year ended December 31, 2012.
Transfers of Level 3 Assets..............................................................................................................................................................................................
During the year ended December 31, 2012, transfers of Level 3 assets included certain U.S. investment grade and
mortgage backed securities and other fixed maturity securities. These transfers were due to a decrease in market
transparency, downward credit migration and an overall increase in price disparity for certain individual security types.
..................................................................................................................................................................................................................................
AIG 2012 Form 10-K 327
Net Changes in
Realized and Unrealized Gains
Balance Unrealized Balance (Losses) on
Beginning Gains Transfers Transfers at End Instruments HeldAt December 31, 2012(in millions) of year (Losses) Purchases Sales Issuances Settlements In Out of year at End of year
$ 1 $ 5 $ 9 $ (29) $ – $ (10) $ 36 $ (1) $ 11 $ 1
36 – – – – – – (36) – –223 9 23 (26) – – 4 (8) 225 (14)
$ 260 $ 14 $ 32 $ (55) $ – $ (10) $ 40 $ (45) $ 236 $ (13)
$ 1 $ – $ – $ (1) $ – $ – $ 27 $ – $ 27 $ –39 2 2 – – – – – 43 –
$ 40 $ 2 $ 2 $ (1) $ – $ – $ 27 $ – $ 70 $ –
Changes in
Net Unrealized Gains
Balance Realized and Balance (Losses) on
Beginning Unrealized Transfers Transfers at End Instruments HeldAt December 31, 2011(in millions) of year Gains (Losses) Purchases Sales Issuances Settlements In Out of year at End of year
I T E M 8 / N O T E 2 2 . E M P L O Y E E B E N E F I T S

.....................................................................................................................................................................................
Expected Cash Flows..............................................................................................................................................................................................
Funding for the U.S. pension plan ranges from the minimum amount required by ERISA to the maximum amount that
would be deductible for U.S. tax purposes. Contributed amounts in excess of the minimum amounts are deemed
voluntary. Amounts in excess of the maximum amount would be subject to an excise tax and may not be deductible
under the Internal Revenue Code. There are no minimum required cash contributions for the AIG Retirement Plan in
2013. Supplemental, AIG NQRIP and postretirement plan payments are deductible when paid.
Our annual pension contribution in 2013 is expected to be approximately $100 million for our U.S. and non-U.S.
non-qualified plans. No contributions to the AIG Retirement Plan are currently anticipated. These estimates are
subject to change, since contribution decisions are affected by various factors including our liquidity, market
performance and management’s discretion.
The expected future benefit payments, net of participants’ contributions, with respect to the defined benefit
pension plans and other postretirement benefit plans, are as follows:
2013 $ 312 $ 48 $ 16 $ 1
2014 322 44 17 1
2015 328 44 18 1
2016 336 47 18 1
2017 351 51 19 1
2018 - 2022 1,830 287 107 10
Defined Contribution Plans..............................................................................................................................................................................................
In addition to several small defined contribution plans, we sponsor a voluntary savings plan for U.S. employees which
provide for pre-tax salary reduction contributions by employees. Effective January 1, 2012, the Company matching
contribution was changed to 100 percent of the first six percent of participant contributions, up to the IRS maximum
limits of $17,000 for employee contributions and to $15,000 for the Company matching contribution, irrespective of
their length of service. Prior to the change, company contributions of up to seven percent of annual salary were
made depending on the employee’s years of service subject to certain compensation limits.
Pre-tax expenses associated with this plan were $132 million, $98 million and $102 million in 2012, 2011 and 2010
respectively, excluding approximately $1 million per year relating to ILFC.
..................................................................................................................................................................................................................................
AIG 2012 Form 10-K328
Pension Postretirement
U.S. Non-U.S. U.S. Non-U.S.(in millions) Plans Plans Plans Plans
I T E M 8 / N O T E 2 2 . E M P L O Y E E B E N E F I T S

.....................................................................................................................................................................................
23. OWNERSHIP..............................................................................................................................................................................................
Through registered public offerings, the Department of the Treasury disposed of all of its ownership of AIG Common
Stock during 2012 and 2011. The Department of the Treasury still owns two series of warrants (the Series D Warrant
and Series F Warrant, respectively). The Series D Warrant provides for the purchase of 2,689,938 shares of AIG
Common Stock at $50 per share. The Series F Warrant provides for the purchase of 150 shares of AIG Common
Stock at $0.00002 per share. Both series of warrants have a 10-year term and are exercisable at any time, in whole
or in part. For discussion of the Recapitalization, see Note 25 herein.
A Schedule 13G/A filed February 14, 2013 reports aggregate ownership of 110,209,093 shares, or approximately
7.3 percent (based on the AIG Common Stock outstanding, as adjusted to reflect the warrants owned), of AIG
Common Stock and warrants (85,862,294 shares plus 24,346,799 warrants) as of December 31, 2012, including
securities beneficially owned by The Fairholme Fund and other funds and investment vehicles managed by Fairholme
Capital Management and securities owned by Mr. Bruce Berkowitz personally. The calculation of ownership interest
for purposes of the AIG Tax Asset Protection Plan and Article 13 of our Restated Certificate of Incorporation is
different than beneficial ownership for Schedule 13G.
..................................................................................................................................................................................................................................
AIG 2012 Form 10-K 329
I T E M 8 / N O T E 2 3 . O W N E R S H I P

.....................................................................................................................................................................................
24. INCOME TAXES..............................................................................................................................................................................................
The following table presents income (loss) from continuing operations before income tax expense (benefit)
by U.S. and foreign location in which such pre-tax income (loss) was earned or incurred.
U.S. $ (566) $ 15,749
Foreign 682 4,498
Total $ 116 $ 20,247
The following table presents the income tax expense (benefit) attributable to pre-tax income (loss) from
continuing operations:
Foreign and U.S. components of actual income tax expense:
Foreign:
Current $ 302 $ 823
Deferred (20) 270
U.S.:
Current (284) (243)
Deferred (19,422) 6,143
Total $ (19,424) $ 6,993
Our actual income tax (benefit) expense differs from the statutory U.S. federal amount computed by applying
the federal income tax rate due to the following:
U.S. federal income tax at
statutory rate adjustments: $ 2,604 $ 911 35.0% $ 22,877 $ 8,007 35.0%
Tax exempt interest (454) (17.4) (587) (2.6)
Investment in subsidiaries and
partnerships (224) (8.6) (1,319) (5.8)
Variable interest entities (43) (1.7) (2) –
Uncertain tax positions (29) (1.1) (36) (0.2)
Dividends received deduction (52) (2.0) (108) (0.5)
Effect of foreign operations (386) (14.8) 602 2.6
Bargain purchase gain – – (116) (0.5)
State income taxes (85) (3.3) (104) (0.5)
Other 116 4.5 215 1.0
Effect of discontinued
operations (173) (6.6) 119 0.5
Effect of discontinued
operations – goodwill – – 1,268 5.5
Valuation allowance:
Continuing operations (18,307) NM 1,361 6.0
Discontinued operations – – 1,292 5.7
Consolidated total amounts 2,604 (18,726) NM 22,877 10,592 46.2
Amounts attributable to
discontinued operations 2,488 698 28.1 2,630 3,599 136.8
Amounts attributable to
continuing operations $ 116 $ (19,424) NM% $ 20,247 $ 6,993 34.5%
..................................................................................................................................................................................................................................
AIG 2012 Form 10-K330
2012 2011 2010
$ 5,515
3,807
$ 9,322
2012 2011 2010
$ 484
(275)
311
1,050
$ 1,570
$ 2,893 $ 1,013 35.0%
(302) (10.4)
(26) (0.9)
32 1.1
586 20.3
(58) (2.0)
172 5.9
– –
(83) (2.9)
(107) (3.7)
(127) (4.4)
– –
(1,907) (65.9)
– –
2,893 (807) (27.9)
(6,429) (2,377) 37.0
$ 9,322 $ 1,570 16.8%
Years Ended December 31,(in millions)
Years Ended December 31,(in millions)
2012 2011 2010
Pre-Tax Tax Percent of Pre-Tax Tax Percent of Tax Percent of
Years Ended December 31, Income Expense/ Pre-Tax Income Expense/ Pre-Tax Pre-Tax Expense/ Pre-Tax
(dollars in millions) (Loss) (Benefit) Income (Loss) (Loss) (Benefit) Income (Loss) Income (Benefit) Income
I T E M 8 / N O T E 2 4 . I N C O M E T A X E S

.....................................................................................................................................................................................
For the year ended December 31, 2012, the effective tax rate on pre-tax income from continuing operations was
16.8 percent. The effective tax rate for the year ended December 31, 2012, attributable to continuing operations
differs from the statutory rate primarily due to tax benefits of $1.9 billion related to a decrease in the life-insurance-
business capital loss carryforward valuation allowance and $302 million associated with tax exempt interest income.
These items were partially offset by charges of $586 million related to uncertain tax positions and $172 million
associated with the effect of foreign operations.
For the year ended December 31, 2011, the effective tax rate on pre-tax income from continuing operations was not
meaningful, due to the significant effect of releasing approximately $18.4 billion of the deferred tax asset valuation
allowance. Other factors that contributed to the difference from the statutory rate included tax benefits of $454 million
associated with tax exempt interest income, $386 million associated with the effect of foreign operations, and
$224 million related to our investment in subsidiaries and partnerships.
For the year ended December 31, 2010, the effective tax rate on pre-tax income from continuing operations was
34.5 percent. The effective tax rate for the year ended December 31, 2010, attributable to continuing operations
differs from the statutory rate primarily due to tax benefits of $1.3 billion associated with our investment in
subsidiaries and partnerships, principally the AIA SPV which is treated as a partnership for U.S. tax purposes, and
$587 million associated with tax exempt interest, partially offset by an increase in the valuation allowance attributable
to continuing operations of $1.4 billion.
The following table presents the components of the net deferred tax assets (liabilities):
Deferred tax assets:
Losses and tax credit carryforwards $ 28,223
Unrealized loss on investments 2,436
Accruals not currently deductible, and other 6,431
Investments in foreign subsidiaries and joint ventures 1,432
Loss reserve discount 1,260
Loan loss and other reserves 877
Unearned premium reserve reduction 1,696
Employee benefits 1,217
Total deferred tax assets 43,572
Deferred tax liabilities:
Adjustment to life policy reserves (1,978)
Deferred policy acquisition costs (3,340)
Flight equipment, fixed assets and intangible assets (4,530)
Unrealized gains related to available for sale debt securities (4,010)
Other (378)
Total deferred tax liabilities (14,236)
Net deferred tax assets before valuation allowance 29,336
Valuation allowance (11,047)
Net deferred tax assets (liabilities) $ 18,289
The following table presents our U.S. consolidated income tax group tax losses and credits carryforwards as
of December 31, 2012 on a tax return basis.
Net operating loss carryforwards $ 40,872 $ 14,305 2025 - 2031
Capital loss carryforwards – Life 17,249 6,037 2013 - 2014
Capital loss carryforwards – Non-Life 88 31 2013
Foreign tax credit carryforwards – 5,549 2015 - 2022
Other carryforwards and other – 515 Various
Total AIG U.S. consolidated income tax group tax losses and credits carryforwards $ 26,437
..................................................................................................................................................................................................................................
AIG 2012 Form 10-K 331
$ 25,359
3,365
4,499
1,435
1,235
547
1,145
1,483
39,068
(1,817)
(2,816)
(2,015)
(7,464)
(225)
(14,337)
24,731
(8,036)
$ 16,695
December 31,
(in millions) 2012 2011
December 31, 2012 Tax Expiration
(in millions) Gross Effected Periods
I T E M 8 / N O T E 2 4 . I N C O M E T A X E S

.....................................................................................................................................................................................
Assessment of Deferred Tax Asset Valuation Allowance..............................................................................................................................................................................................
The evaluation of the recoverability of the deferred tax asset and the need for a valuation allowance requires us to
weigh all positive and negative evidence to reach a conclusion that it is more likely than not that all or some portion
of the deferred tax asset will not be realized. The weight given to the evidence is commensurate with the extent to
which it can be objectively verified. The more negative evidence that exists, the more positive evidence is necessary
and the more difficult it is to support a conclusion that a valuation allowance is not needed.
Our framework for assessing the recoverability of deferred tax assets weighs the sustainability of recent operating
profitability, the predictability of future operating profitability of the character necessary to realize the deferred tax
assets, and our emergence from cumulative losses in recent years. The framework requires us to consider all
available evidence, including:
• the nature, frequency, and severity of cumulative financial reporting losses in recent years;
• the sustainability of recent operating profitability of our subsidiaries in various tax jurisdictions;
• the predictability of future operating profitability of the character necessary to realize the net deferred tax asset;
• the carryforward periods for the net operating loss, capital loss and foreign tax credit carryforwards, including the
effect of reversing taxable temporary differences; and,
• prudent and feasible tax planning strategies that would be implemented, if necessary, to protect against the loss of
the deferred tax assets.
As a result of sales in the ordinary course of business to manage the investment portfolio and the application of
prudent and feasible tax planning strategies during the year ended December 31, 2012, AIG determined that an
additional portion of the life insurance business capital loss carryforwards will more-likely-than-not be realized prior to
their expiration.
For the year ended December 31, 2012, AIG released $2.1 billion of its deferred tax asset valuation allowance
associated with the life insurance business capital loss carryforwards, of which $1.9 billion was allocated to income
from continuing operations. Additional life insurance business capital loss carryforwards may be realized in the future
if and when other prudent and feasible tax planning strategies are identified. Changes in market conditions, including
rising interest rates above AIG’s projections, may result in a reduction in projected taxable gains and reestablishment
of a valuation allowance.
The following table presents the net deferred tax assets (liabilities) for December 31, 2012, and December 31,
2011, respectively, on a U.S. GAAP basis:
Net U.S. consolidated return group deferred tax assets $ 29,442
Net deferred tax assets (liabilities) in Other comprehensive income (3,041)
Valuation allowance (7,240)
Subtotal 19,161
Net foreign, state & local deferred tax assets 4,261
Valuation allowance (3,807)
Subtotal 454
Subtotal – Net U.S, foreign, state & local deferred tax assets 19,615
Net foreign, state & local deferred tax liabilities (1,326)
Total AIG net deferred tax assets (liabilities) $ 18,289
Deferred Tax Asset Valuation Allowance of U.S. Consolidated Income Tax Group..............................................................................................................................................................................................
At December 31, 2012, and December 31, 2011, our U.S. consolidated income tax group had net deferred tax assets
(liabilities) after valuation allowance of $17.3 billion and $19.2 billion, respectively. At December 31, 2012, and
December 31, 2011, our U.S. consolidated income tax group had valuation allowances of $5.1 billion and $7.2 billion,respectively.
..................................................................................................................................................................................................................................
AIG 2012 Form 10-K332
December 31,
(in millions) 2012 2011
$ 29,550
(7,174)
(5,068)
17,308
3,126
(2,968)
158
17,466
(771)
$ 16,695
I T E M 8 / N O T E 2 4 . I N C O M E T A X E S

.....................................................................................................................................................................................
For the year ended December 31, 2011, the decrease in the U.S. consolidated income tax group deferred tax asset
valuation allowance was $18.4 billion. The entire decrease in the deferred tax asset valuation allowance was
allocated to continuing operations. The amount allocated to continuing operations also included the decrease in the
deferred tax asset valuation allowance attributable to the anticipated inclusion of the ALICO SPV within the 2011
U.S. consolidated federal income tax return.
Deferred Tax Liability – Foreign, State and Local..............................................................................................................................................................................................
At December 31, 2012 and December 31, 2011, we had net deferred tax liabilities of $613 million and $872 million,
respectively, related to foreign subsidiaries, state and local tax jurisdictions, and certain domestic subsidiaries that file
separate tax returns.
At December 31, 2012 and December 31, 2011, we had deferred tax asset valuation allowances of $2.9 billion and
$3.8 billion, respectively, related to foreign subsidiaries, state and local tax jurisdictions, and certain domestic
subsidiaries that file separate tax returns. We maintained these valuation allowances following our conclusion that we
could not demonstrate that it was more likely than not that the related deferred tax assets will be realized. This was
primarily due to factors such as cumulative losses in recent years and the inability to demonstrate profits within the
specific jurisdictions over the relevant carryforward periods.
Tax Examinations and Litigation..............................................................................................................................................................................................
We file a consolidated U.S. federal income tax return with our eligible U.S. subsidiaries. Several U.S. subsidiaries
included in the consolidated financial statements previously filed separate U.S. federal income tax returns and were
not part of our U.S. consolidated income tax group. Subsidiaries operating outside the U.S. are taxed, and income
tax expense is recorded, based on applicable U.S. and foreign law.
The statute of limitations for all tax years prior to 2000 has expired for our consolidated federal income tax return.
We are currently under examination for the tax years 2000 through 2006.
On March 20, 2008, we received a Statutory Notice of Deficiency (Notice) from the IRS for years 1997 to 1999. The
Notice asserted that we owe additional taxes and penalties for these years primarily due to the disallowance of
foreign tax credits associated with cross-border financing transactions. The transactions that are the subject of the
Notice extend beyond the period covered by the Notice, and the IRS is challenging the later periods. It is also
possible that the IRS will consider other transactions to be similar to these transactions. We have paid the assessed
tax plus interest and penalties for 1997 to 1999. On February 26, 2009, we filed a complaint in the United States
District Court for the Southern District of New York seeking a refund of approximately $306 million in taxes, interest
and penalties paid with respect to its 1997 taxable year. We allege that the IRS improperly disallowed foreign tax
credits and that our taxable income should be reduced as a result of our 2005 restatement of its consolidated
financial statements.
On March 29, 2011, the U.S. District Court, Southern District of New York, ruled on a motion for partial summary
judgment that we filed on July 30, 2010 related to the disallowance of foreign tax credits associated with cross
border financing transactions. The court denied our motion with leave to renew following the completion of discovery
regarding certain transactions referred to in our motion, which we believe may be significant to the outcome of the
action.
On August 1, 2012, we filed a motion for partial summary judgment. The parties completed submission of briefs in
support of their respective positions on November 12, 2012. As of February 21, 2013 the motion remains pending.
We will vigorously defend our position, and continue to believe that we have adequate reserves for any liability that
could result from the IRS actions.
We also filed an administrative refund claim on September 9, 2010 for our 1998 and 1999 tax years.
We continue to monitor legal and other developments in this area and evaluate the effect, if any, on our position,
including recent decisions adverse to other taxpayers.
..................................................................................................................................................................................................................................
AIG 2012 Form 10-K 333
I T E M 8 / N O T E 2 4 . I N C O M E T A X E S
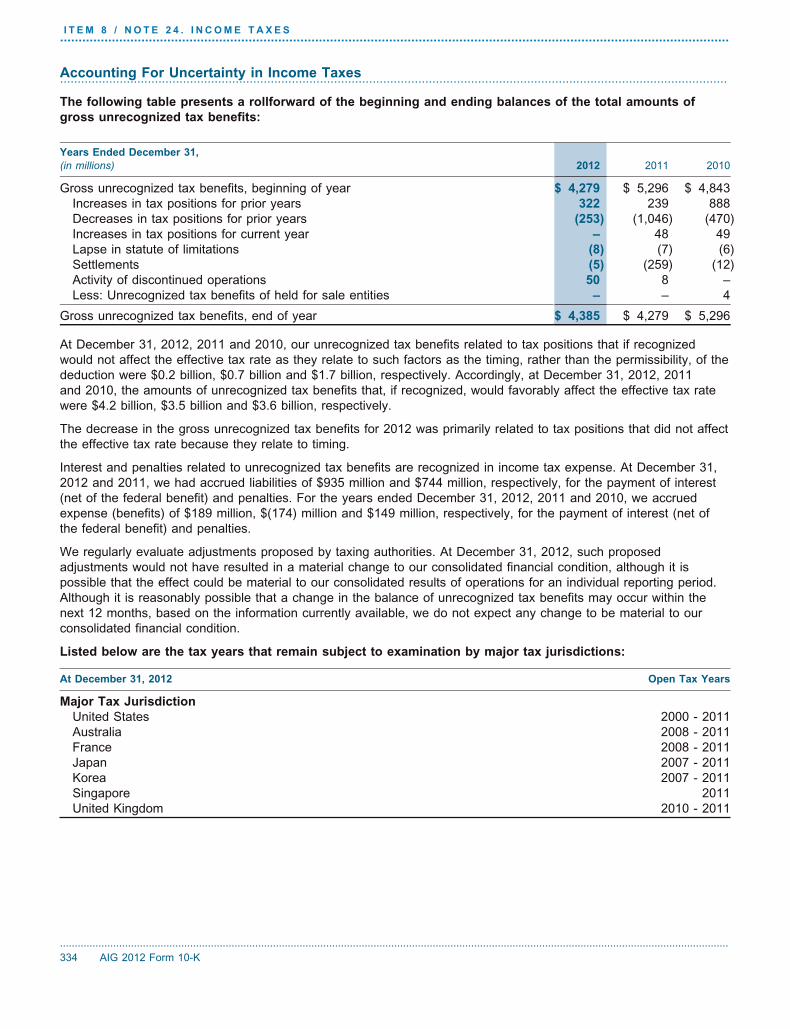
.....................................................................................................................................................................................
Accounting For Uncertainty in Income Taxes..............................................................................................................................................................................................
The following table presents a rollforward of the beginning and ending balances of the total amounts of
gross unrecognized tax benefits:
Gross unrecognized tax benefits, beginning of year $ 5,296 $ 4,843
Increases in tax positions for prior years 239 888
Decreases in tax positions for prior years (1,046) (470)
Increases in tax positions for current year 48 49
Lapse in statute of limitations (7) (6)
Settlements (259) (12)
Activity of discontinued operations 8 –
Less: Unrecognized tax benefits of held for sale entities – 4
Gross unrecognized tax benefits, end of year $ 4,279 $ 5,296
At December 31, 2012, 2011 and 2010, our unrecognized tax benefits related to tax positions that if recognized
would not affect the effective tax rate as they relate to such factors as the timing, rather than the permissibility, of the
deduction were $0.2 billion, $0.7 billion and $1.7 billion, respectively. Accordingly, at December 31, 2012, 2011
and 2010, the amounts of unrecognized tax benefits that, if recognized, would favorably affect the effective tax rate
were $4.2 billion, $3.5 billion and $3.6 billion, respectively.
The decrease in the gross unrecognized tax benefits for 2012 was primarily related to tax positions that did not affect
the effective tax rate because they relate to timing.
Interest and penalties related to unrecognized tax benefits are recognized in income tax expense. At December 31,
2012 and 2011, we had accrued liabilities of $935 million and $744 million, respectively, for the payment of interest
(net of the federal benefit) and penalties. For the years ended December 31, 2012, 2011 and 2010, we accrued
expense (benefits) of $189 million, $(174) million and $149 million, respectively, for the payment of interest (net of
the federal benefit) and penalties.
We regularly evaluate adjustments proposed by taxing authorities. At December 31, 2012, such proposed
adjustments would not have resulted in a material change to our consolidated financial condition, although it is
possible that the effect could be material to our consolidated results of operations for an individual reporting period.
Although it is reasonably possible that a change in the balance of unrecognized tax benefits may occur within the
next 12 months, based on the information currently available, we do not expect any change to be material to our
consolidated financial condition.
Listed below are the tax years that remain subject to examination by major tax jurisdictions:
Major Tax Jurisdiction
United States 2000 - 2011
Australia 2008 - 2011
France 2008 - 2011
Japan 2007 - 2011
Korea 2007 - 2011
Singapore 2011
United Kingdom 2010 - 2011
..................................................................................................................................................................................................................................
AIG 2012 Form 10-K334
Years Ended December 31,
(in millions) 2012 2011 2010
$ 4,279
322
(253)
–
(8)
(5)
50
–
$ 4,385
At December 31, 2012 Open Tax Years
I T E M 8 / N O T E 2 4 . I N C O M E T A X E S

.....................................................................................................................................................................................
25. RECAPITALIZATION..............................................................................................................................................................................................
On January 14, 2011 (the Closing), we completed a series of integrated transactions to recapitalize AIG (theRecapitalization) with the Department of the Treasury, the FRBNY and AIG Credit Facility Trust (the Trust), includingthe repayment of all amounts owed under the FRBNY Credit Facility. At the Closing, we recognized a net loss onextinguishment of debt, primarily representing $3.3 billion in accelerated amortization of the remaining prepaidcommitment fee asset resulting from the termination of the FRBNY Credit Facility.
Repayment and Termination of the FRBNY Credit Facility..............................................................................................................................................................................................
At the Closing, we repaid to the FRBNY approximately $21 billion in cash, representing complete repayment of allamounts owed under the FRBNY Credit Facility, and the FRBNY Credit Facility was terminated. The funds for therepayment came from the net cash proceeds from our sale of 67 percent of the ordinary shares of AIA in its initialpublic offering and from our sale of ALICO in 2010.
Repurchase and Exchange of SPV Preferred Interests..............................................................................................................................................................................................
At the Closing, we drew down approximately $20.3 billion (the Series F Closing Drawdown Amount) under theDepartment of the Treasury Commitment (Series F) pursuant to the Series F SPA. The Series F Closing DrawdownAmount was the full amount remaining under the Department of the Treasury Commitment (Series F), less $2 billionthat we designated to be available after the closing for general corporate purposes under a commitment relating toour Series G Preferred Stock described below (the Series G Drawdown Right). Our right to draw on the Departmentof the Treasury Commitment (Series F) (other than the Series G Drawdown Right) was terminated.
We used the Series F Closing Drawdown Amount to repurchase all of the FRBNY’s AIA SPV Preferred Interests andthe ALICO SPV Preferred Interests. We transferred the SPV Preferred Interests to the Department of the Treasury aspart of the consideration for the exchange of the Series F Preferred Stock (described below).
During the first quarter of 2011, the liquidation preference of the ALICO SPV Preferred Interests was paid down infull. During the first quarter of 2012, the liquidation preference of the AIA SPV Preferred Interests was paid down infull.
Issuance and Cancellation of Our Series G Preferred Stock..............................................................................................................................................................................................
At the Closing, we and the Department of the Treasury amended and restated the Series F SPA to provide for theissuance of 20,000 shares of Series G Preferred Stock by AIG to the Department of the Treasury. The Series GPreferred Stock was issued with a liquidation preference of zero. Because the net proceeds to us from thecompletion of the registered public offering of AIG Common Stock in May 2011 of $2.9 billion exceeded the$2.0 billion Series G Drawdown Right, the Series G Drawdown Right was terminated and the Series G PreferredStock was cancelled immediately thereafter.
Exchange of Our Series C, E and F Preferred Stock for AIG Common Stock and Series G PreferredStock..............................................................................................................................................................................................
At the Closing:
• the shares of our Series C Preferred Stock held by the Trust were exchanged for 562,868,096 shares of newlyissued AIG Common Stock, which were subsequently transferred by the Trust to the Department of the Treasury;
• the shares of our Series E Preferred Stock held by the Department of the Treasury were exchanged for924,546,133 newly issued shares of AIG Common Stock; and
• the shares of the Series F Preferred Stock held by the Department of the Treasury, were exchanged for (a) theSPV Preferred Interests, (b) 20,000 shares of the Series G Preferred Stock (subsequently cancelled) and(c) 167,623,733 shares of newly issued AIG Common Stock.
For a discussion of the Department of the Treasury’s sale of all of its ownership of AIG Common Stock, see Note 17herein.
Issuance of Warrants to Purchase AIG Common Stock..............................................................................................................................................................................................
On January 19, 2011, as part of the Recapitalization, we issued to the holders of record of AIG Common Stock as ofJanuary 13, 2011, by means of a dividend, ten-year warrants to purchase a total of 74,997,778 shares of AIGCommon Stock at an exercise price of $45.00 per share. We retained 67,650 of these warrants for tax withholdingpurposes. No warrants were issued to the Trust, the Department of the Treasury or the FRBNY.
..................................................................................................................................................................................................................................
AIG 2012 Form 10-K 335
I T E M 8 / N O T E 2 5 . R E C A P I T A L I Z A T I O N

.....................................................................................................................................................................................
26. QUARTERLY FINANCIAL INFORMATION (UNAUDITED)..............................................................................................................................................................................................
Consolidated Statements of Income (Loss)..............................................................................................................................................................................................
Total revenues $ 16,283 $ 15,547 $ 11,606 $ 16,376
Income (loss) from continuing
operations before income taxes (1,428) 1,711 (2,938) 2,771
Income (loss) from discontinued
operations, net of income taxes 2,707 41 (1,052) 94
Net income (loss) 1,501 2,053 (3,826) 21,602
Net income (loss) from continuing
operations attributable to
noncontrolling interests:
Nonvoting, callable, junior, and
senior preferred interests 252 141 145 96
Other (55) 64 19 26
Total net income from continuing
operations attributable to
noncontrolling interests 197 205 164 122
Net income (loss) from discontinued
operations attributable to
noncontrolling interests 7 12 – 1
Total net income (loss) attributable to
noncontrolling interests 204 217 164 123
Net income (loss) attributable to AIG $ 1,297 $ 1,836 $ (3,990) $ 21,479
Earnings (loss) per common share
attributable to AIG common
shareholders:
Basic and diluted:
Income (loss) from continuing
operations $ (1.42) $ 0.98 $ (1.55) $ 11.26
Income (loss) from discontinued
operations $ 1.73 $ 0.02 $ (0.55) $ 0.05
Weighted average shares
outstanding:
Basic 1,557,748,353 1,836,713,069 1,899,500,628 1,898,734,116
Diluted 1,557,863,729 1,836,771,513 1,899,500,628 1,898,845,071
Noteworthy quarterly items – income
(expense):
Other-than-temporary impairments (254) (181) (496) (349)
Net gain (loss) on sale of divested
businesses (72) (2) (2) 2
Adjustment to federal and foreign
deferred tax valuation allowance (604) 564 (905) 19,252
Net gain (loss) on extinguishment
of debt (3,313) (79) – 484
Change in fair value of AIA
securities 1,062 1,521 (2,315) 1,021
Change in fair value of Maiden
Lane Interests 995 (843) (974) 218
..................................................................................................................................................................................................................................
AIG 2012 Form 10-K336
$ 17,291 $ 16,006 $ 16,505 $ 15,854
4,466 1,669 2,558 629
64 179 37 (4,332)
3,449 2,339 1,861 (3,949)
208 – – –
33 7 5 9
241 7 5 9
– – – –
241 7 5 9
$ 3,208 $ 2,332 $ 1,856 $ (3,958)
$ 1.68 $ 1.23 $ 1.11 $ 0.25
$ 0.03 $ 0.10 $ 0.02 $ (2.93)
1,875,972,970 1,756,689,067 1,642,472,814 1,476,457,586
1,876,002,775 1,756,714,475 1,642,502,251 1,476,457,586
(618) (216) (114) (219)
– – – (2)
347 1,239 205 116
(21) (11) – 41
1,795 (493) 527 240
1,498 1,306 330 –
Three Months Ended
March 31, June 30, September 30, December 31,(dollars in millions,
except per share data) 2012 2011 2012 2011 2012 2011 2012 2011
I T E M 8 / N O T E 2 6 . Q U A R T E R L Y F I N A N C I A L I N F O R M A T I O N ( U N A U D I T E D )

.....................................................................................................................................................................................
27. INFORMATION PROVIDED IN CONNECTION WITH OUTSTANDING DEBT..............................................................................................................................................................................................
The following condensed consolidating financial statements reflect the results of SunAmerica Financial Group, Inc.(SAFG, Inc.), formerly known as AIG Life Holdings (U.S.), Inc. (AIGLH), a holding company and a 100 percentowned subsidiary of AIG. AIG provides a full and unconditional guarantee of all outstanding debt of SAFG, Inc.
Condensed Consolidating Balance Sheet..............................................................................................................................................................................................
December 31, 2012Assets:
Short-term investmentsOther investments(a)
Total investmentsCashLoans to subsidiaries(b)
Investment in consolidated subsidiaries(b)
Other assets, including current and deferred income taxesAssets held for sale
Total assets
Liabilities:Insurance liabilitiesOther long-term debtOther liabilities, including intercompany balances(a)(c)
Loans from subsidiaries(b)
Liabilities held for sale
Total liabilities
Other
Redeemable noncontrolling interests
Total AIG shareholders’ equityNon-redeemable noncontrolling interests
Total equity
Total liabilities and equity
December 31, 2011Assets:
Short-term investments $ 12,868 $ – $ 14,110 $ (4,406) $ 22,572Other investments(a) 6,599 – 481,525 (100,258) 387,866
Total investments 19,467 – 495,635 (104,664) 410,438Cash 176 13 1,285 – 1,474Loans to subsidiaries(b) 39,971 – (39,971) – –Investment in consolidated subsidiaries(b)(d) 80,990 32,361 (11,463) (101,888) –Other assets, including current and deferred income taxes 25,019 2,722 117,992 (4,591) 141,142
Total assets $ 165,623 $ 35,096 $ 563,478 $ (211,143) $ 553,054
Liabilities:Insurance liabilities $ – $ – $ 282,790 $ (274) $ 282,516Other long-term debt 35,906 1,638 138,240 (100,531) 75,253Other liabilities, including intercompany balances(a)(c)(d) 15,863 249 77,767 (9,510) 84,369Loans from subsidiaries(b) 12,316 2,420 (14,736) – –
Total liabilities 64,085 4,307 484,061 (110,315) 442,138
Redeemable noncontrolling interests (see Note 18):Nonvoting, callable, junior preferred interests held by Department of
the Treasury – – – 8,427 8,427Other – – 29 67 96
Total redeemable noncontrolling interests – – 29 8,494 8,523
Total AIG shareholders’ equity 101,538 30,789 78,996 (109,785) 101,538Non-redeemable noncontrolling interests – – 392 463 855
Total equity 101,538 30,789 79,388 (109,322) 102,393
Total liabilities and equity $ 165,623 $ 35,096 $ 563,478 $ (211,143) $ 553,054
(a) Includes intercompany derivative asset positions, which are reported at fair value before credit valuation adjustment.
(b) Eliminated in consolidation.
(c) For December 31, 2012 and December 31, 2011, includes intercompany tax payable of $6.1 billion and $9.8 billion, respectively, and intercompanyderivative liabilities of $602 million and $901 million, respectively, for American International Group, Inc. (As Guarantor) and intercompany tax receivable of$120 million and $128 million, respectively, for SAFG, Inc.
..................................................................................................................................................................................................................................
AIG 2012 Form 10-K 337
AmericanInternational Reclassifications
Group, Inc. Other and Consolidated(in millions) (As Guarantor) SAFG, Inc. Subsidiaries Eliminations AIG
$ 14,764 $ – $ 18,323 $ (4,279) $ 28,8083,902 – 345,706 (2,592) 347,016
18,666 – 364,029 (6,871) 375,82481 73 997 – 1,151
35,064 – 5,169 (40,233) –70,781 43,891 (28,239) (86,433) –23,153 150 121,345 (4,955) 139,693
– – 31,965 – 31,965
$ 147,745 $ 44,114 $ 495,266 $ (138,492) $ 548,633
$ – $ – $ 280,487 $ (235) $ 280,25236,366 1,638 10,197 299 48,50012,375 261 90,022 (9,146) 93,512
1,002 472 41,754 (43,228) –– – 27,366 – 27,366
49,743 2,371 449,826 (52,310) 449,630
– – 192 142 334
– – 192 142 334
98,002 41,743 44,955 (86,698) 98,002– – 293 374 667
98,002 41,743 45,248 (86,324) 98,669
$ 147,745 $ 44,114 $ 495,266 $ (138,492) $ 548,633
I T E M 8 / N O T E 2 7 . I N F O R M A T I O N P R O V I D E D I N C O N N E C T I O N W I T H O U T S T A N D I N G D E B T

.....................................................................................................................................................................................
Condensed Consolidating Statement of Income (Loss)..............................................................................................................................................................................................
Year Ended December 31, 2012Revenues:
Equity in earnings of consolidated subsidiaries(a)
Change in fair value of ML IIIOther income(b)
Total revenues
Expenses:Other interest expense(c)
Net loss on extinguishment of debtOther expenses
Total expenses
Income (loss) from continuing operations before income taxexpense (benefit)
Income tax expense (benefit)
Income (loss) from continuing operationsIncome (loss) from discontinued operations
Net income (loss)Less:Net income from continuing operations attributable to
noncontrolling interests:Nonvoting, callable, junior and senior preferred interestsOther
Total net income attributable to noncontrolling interests
Net income (loss) attributable to AIG
Year Ended December 31, 2011Revenues:
Equity in earnings of consolidated subsidiaries(a)(d) $ 6,260 $ 1,586 $ – $ (7,846) $ –Change in fair value of ML III (723) – 77 – (646)Other income(b)(d) 1,088 189 60,370 (1,189) 60,458
Total revenues 6,625 1,775 60,447 (9,035) 59,812
Expenses:Interest expense on FRBNY Credit Facility 72 – – (2) 70Other interest expense(c) 2,845 281 437 (1,189) 2,374Net loss on extinguishment of debt 2,847 – – – 2,847Other expenses 867 – 53,538 – 54,405
Total expenses 6,631 281 53,975 (1,191) 59,696
Income (loss) from continuing operations before income taxexpense (benefit) (6) 1,494 6,472 (7,844) 116
Income tax expense (benefit) (19,695) (103) 374 – (19,424)
Income (loss) from continuing operations 19,689 1,597 6,098 (7,844) 19,540Income (loss) from discontinued operations 933 – 859 (2) 1,790
Net income (loss) 20,622 1,597 6,957 (7,846) 21,330Less:Net income from continuing operations attributable to
noncontrolling interests:Nonvoting, callable, junior and senior preferred interests – – – 634 634Other – – 54 – 54
Total income from continuing operations attributable tononcontrolling interests – – 54 634 688
Income from discontinued operations attributable tononcontrolling interests – – 20 – 20
Total net income attributable to noncontrolling interests – – 74 634 708
Net income (loss) attributable to AIG $ 20,622 $ 1,597 $ 6,883 $ (8,480) $ 20,622
..................................................................................................................................................................................................................................
AIG 2012 Form 10-K338
American
International Reclassifications
Group, Inc. Other and Consolidated
(in millions) (As Guarantor) SAFG, Inc. Subsidiaries Eliminations AIG
$ 1,970 $ 2,315 $ – $ (4,285) $ –2,287 – 601 – 2,8881,911 49 61,191 (383) 62,768
6,168 2,364 61,792 (4,668) 65,656
2,257 174 271 (383) 2,3199 – – – 9
1,602 – 52,404 – 54,006
3,868 174 52,675 (383) 56,334
2,300 2,190 9,117 (4,285) 9,322(1,137) (17) 2,724 – 1,570
3,437 2,207 6,393 (4,285) 7,7521 – (4,053) – (4,052)
3,438 2,207 2,340 (4,285) 3,700
– – – 208 208– – 54 – 54
– – 54 208 262
$ 3,438 $ 2,207 $ 2,286 $ (4,493) $ 3,438
I T E M 8 / N O T E 2 7 . I N F O R M A T I O N P R O V I D E D I N C O N N E C T I O N W I T H O U T S T A N D I N G D E B T

.....................................................................................................................................................................................
Year Ended December 31, 2010
Revenues:
Equity in earnings of consolidated subsidiaries(a) $ 21,385 $ 1,695 $ – $ (23,080) $ –
Change in fair value of ML III – – 1,792 – 1,792
Other income(b) 3,046 246 70,403 (2,658) 71,037
Total revenues 24,431 1,941 72,195 (25,738) 72,829
Expenses:
Interest expense on FRBNY Credit Facility 4,107 – – (79) 4,028
Other interest expense(c) 2,279 378 2,711 (2,654) 2,714
Loss on extinguishment of debt 104 – – – 104
Other expenses 1,664 – 44,072 – 45,736
Total expenses 8,154 378 46,783 (2,733) 52,582
Income (loss) from continuing operations before income tax
expense (benefit) 16,277 1,563 25,412 (23,005) 20,247
Income tax expense (benefit)(d) 5,402 (101) 1,692 – 6,993
Income (loss) from continuing operations 10,875 1,664 23,720 (23,005) 13,254
Loss from discontinued operations (817) – (73) (79) (969)
Net income (loss) 10,058 1,664 23,647 (23,084) 12,285
Less:
Net income from continuing operations attributable to noncontrolling
interests:
Nonvoting, callable, junior and senior preferred interests – – – 1,818 1,818
Other – – 354 – 354
Total income from continuing operations attributable to
noncontrolling interests – – 354 1,818 2,172
Income from discontinued operations attributable to noncontrolling
interests – – 55 – 55
Total net income attributable to noncontrolling interests – – 409 1,818 2,227
Net income (loss) attributable to AIG $ 10,058 $ 1,664 $ 23,238 $ (24,902) $ 10,058
(a) Eliminated in consolidation.
(b) Includes intercompany income of $242 million, $489 million, and $2.6 billion for 2012, 2011, and 2010, respectively, for American International
Group, Inc. (As Guarantor).
(c) Includes intercompany interest expense of $141 million, $700 million, and $28 million for 2012, 2011, and 2010, respectively, for American International
Group, Inc. (As Guarantor).
(d) For 2010 and 2009, income taxes recorded by American International Group, Inc. (As Guarantor) include deferred tax expense attributable to foreign
businesses sold and a valuation allowance to reduce the consolidated deferred tax asset to the amount more likely than not to be realized. For 2011, the
income tax benefit includes the effect of releasing a significant portion of the deferred tax asset valuation allowance. See Note 24 herein for additional
information.
..................................................................................................................................................................................................................................
AIG 2012 Form 10-K 339
American
International Reclassifications
Group, Inc. Other and Consolidated
(in millions) (As Guarantor) SAFG, Inc. Subsidiaries Eliminations AIG
I T E M 8 / N O T E 2 7 . I N F O R M A T I O N P R O V I D E D I N C O N N E C T I O N W I T H O U T S T A N D I N G D E B T

.....................................................................................................................................................................................
Condensed Consolidating Statement of Comprehensive Income (Loss)..............................................................................................................................................................................................
Year Ended December 31, 2012
Net income (loss)
Other comprehensive income (loss)
Comprehensive income (loss)
Total comprehensive income attributable to noncontrolling interests
Comprehensive income (loss) attributable to AIG
Year Ended December 31, 2011
Net income (loss) $ 20,622 $ 1,597 $ 6,957 $ (7,846) $ 21,330
Other comprehensive income (loss) (2,483) 1,101 (2,674) 1,452 (2,604)
Comprehensive income (loss) 18,139 2,698 4,283 (6,394) 18,726
Total comprehensive income (loss) attributable to noncontrolling
interests – – (47) 634 587
Comprehensive income (loss) attributable to AIG $ 18,139 $ 2,698 $ 4,330 $ (7,028) $ 18,139
Year Ended December 31, 2010
Net income (loss) $ 10,058 $ 1,664 $ 23,647 $ (23,084) $ 12,285
Other comprehensive income (loss) 2,782 3,258 2,270 (5,347) 2,963
Comprehensive income (loss) 12,840 4,922 25,917 (28,431) 15,248
Total comprehensive income attributable to noncontrolling interests – – 590 1,818 2,408
Comprehensive income (loss) attributable to AIG $ 12,840 $ 4,922 $ 25,327 $ (30,249) $ 12,840
..................................................................................................................................................................................................................................
AIG 2012 Form 10-K340
$ 3,438 $ 2,207 $ 2,340 $ (4,285) $ 3,700
6,093 3,973 7,158 (11,128) 6,096
9,531 6,180 9,498 (15,413) 9,796
– – 57 208 265
$ 9,531 $ 6,180 $ 9,441 $ (15,621) $ 9,531
American
International Reclassifications
Group, Inc. Other and Consolidated
(in millions) (As Guarantor) SAFG, Inc. Subsidiaries Eliminations AIG
I T E M 8 / N O T E 2 7 . I N F O R M A T I O N P R O V I D E D I N C O N N E C T I O N W I T H O U T S T A N D I N G D E B T

.....................................................................................................................................................................................
Condensed Consolidating Statement of Cash Flows..............................................................................................................................................................................................
(in millions)
Year Ended December 31, 2012Net cash (used in) provided by operating activities – continuing
operationsNet cash provided by operating activities – discontinued operations
Net cash (used in) provided by operating activities
Cash flows from investing activities:Sales of investmentsPurchase of investmentsLoans to subsidiaries – netContributions to subsidiaries – netNet change in restricted cashNet change in short-term investmentsOther, net
Net cash provided by investing activities – continuing operationsNet cash (used in) investing activities – discontinued operations
Net cash provided by investing activities
Cash flows from financing activities:Issuance of long-term debtRepayments of long-term debtPurchase of Common StockIntercompany loans – netOther, net
Net cash (used in) financing activities – continuing operationsNet cash (used in) financing activities – discontinued operations
Net cash (used in) financing activities
Effect of exchange rate changes on cash
Change in cashCash at beginning of periodReclassification to assets held for sale
Cash at end of period
Year Ended December 31, 2011Net cash (used in) provided by operating activities – continuing
operations $ (5,600) $ 1,277 $ (1,933) $ (6,256)Net cash provided by operating activities – discontinued operations – – 6,175 6,175
Net cash (used in) provided by operating activities (5,600) 1,277 4,242 (81)
Cash flows from investing activities:Sales of investments 2,565 – 82,134 84,699Sales of divested businesses, net 1,075 – (488) 587Purchase of investments (19) – (100,471) (100,490)Loans to subsidiaries – net 3,757 – (3,757) –Contributions to subsidiaries – net* (15,973) (2) 15,975 –Net change in restricted cash 1,945 – 25,257 27,202Net change in short-term investments (7,130) – 25,929 18,799Other, net* 1,543 – (1,363) 180
Net cash (used in) provided by investing activities – continuingoperations (12,237) (2) 43,216 30,977
Net cash provided by investing activities – discontinued operations – – 5,471 5,471
Net cash (used in) provided by investing activities (12,237) (2) 48,687 36,448
..................................................................................................................................................................................................................................
AIG 2012 Form 10-K 341
American Other
International Subsidiaries
Group, Inc. and Consolidated
(As Guarantor) SAFG, Inc. Eliminations AIG
(825) 2,682 (1,109) 748– – 2,928 2,928
$ (825) $ 2,682 $ 1,819 $ 3,676
16,874 – 84,025 100,899(4,406) – (70,222) (74,628)5,126 – (5,126) –(152) – 152 –(377) – 1,072 695
(2,029) – (6,129) (8,158)259 – (785) (526)
15,295 – 2,987 18,282– – (1,670) (1,670)
15,295 – 1,317 16,612
3,754 – 1,090 4,844(3,238) – (4,038) (7,276)
(13,000) – – (13,000)(2,032) (2,622) 4,654 –
(49) – (4,951) (5,000)
(14,565) (2,622) (3,245) (20,432)– – (132) (132)
(14,565) (2,622) (3,377) (20,564)
– – 16 16
(95) 60 (225) (260)176 13 1,285 1,474
– – (63) (63)
$ 81 $ 73 $ 997 $ 1,151
I T E M 8 / N O T E 2 7 . I N F O R M A T I O N P R O V I D E D I N C O N N E C T I O N W I T H O U T S T A N D I N G D E B T

.....................................................................................................................................................................................
(in millions)
Cash flows from financing activities:FRBNY credit facility repayments (14,622) – – (14,622)Issuance of long-term debt 2,135 – 1,055 3,190Repayments of long-term debt (6,181) – (3,305) (9,486)Proceeds from drawdown on the Department of the Treasury
Commitment* 20,292 – – 20,292Issuance of common stock 5,055 – – 5,055Intercompany loans – net 11,519 (1,262) (10,257) –Purchase of common stock (70) – – (70)Other, net* (164) – (35,325) (35,489)
Net cash (used in) provided by financing activities – continuingoperations 17,964 (1,262) (47,832) (31,130)
Net cash (used in) financing activities – discontinued operations – – (5,796) (5,796)
Net cash (used in) provided by financing activities 17,964 (1,262) (53,628) (36,926)
Effect of exchange rate changes on cash – – 29 29
Change in cash 127 13 (670) (530)Cash at beginning of period 49 – 1,509 1,558Change in cash of businesses held for sale – – 446 446
Cash at end of period $ 176 $ 13 $ 1,285 $ 1,474
Year Ended December 31, 2010Net cash (used in) provided by operating activities – continuing
operations $ (1,942) $ (141) $ 8,244 $ 6,161Net cash provided by operating activities – discontinued operations – – 10,436 10,436
Net cash (used in) provided by operating activities (1,942) (141) 18,680 16,597
Cash flows from investing activities:Sales of investments 3,997 – 86,869 90,866Sales of divested businesses, net 278 – 21,482 21,760Purchase of investments (55) – (92,780) (92,835)Loans to subsidiaries – net 5,703 – (5,703) –Contributions to subsidiaries – net* (2,574) – 2,574 –Net change in restricted cash (183) – (26,843) (27,026)Net change in short-term investments (4,291) – 1,845 (2,446)Other, net* (300) – 133 (167)
Net cash (used in) provided by investing activities – continuingoperations 2,575 – (12,423) (9,848)
Net cash (used in) investing activities – discontinued operations – – (64) (64)
Net cash (used in) provided by investing activities 2,575 – (12,487) (9,912)
Cash flows from financing activities:FRBNY credit facility repayments (19,110) – (4,068) (23,178)FRBNY credit facility borrowings 19,900 – – 19,900Issuance of long-term debt 1,996 – 1,346 3,342Repayments of long-term debt (3,681) (500) (3,805) (7,986)Proceeds from drawdown on the Department of the Treasury
Commitment* 2,199 – – 2,199Intercompany loans – net (1,777) 639 1,138 –Other, net* (168) – (1,126) (1,294)
Net cash (used in) provided by financing activities – continuingoperations (641) 139 (6,515) (7,017)
Net cash (used in) financing activities – discontinued operations – – (2,244) (2,244)
Net cash (used in) provided by financing activities (641) 139 (8,759) (9,261)
Effect of exchange rate changes on cash – – 39 39
Change in cash (8) (2) (2,527) (2,537)Cash at beginning of period 57 2 4,341 4,400Change in cash of businesses held for sale – – (305) (305)
Cash at end of period $ 49 $ – $ 1,509 $ 1,558
* Includes activities related to the Recapitalization. See Note 17 herein.
..................................................................................................................................................................................................................................
AIG 2012 Form 10-K342
American Other
International Subsidiaries
Group, Inc. and Consolidated
(As Guarantor) SAFG, Inc. Eliminations AIG
I T E M 8 / N O T E 2 7 . I N F O R M A T I O N P R O V I D E D I N C O N N E C T I O N W I T H O U T S T A N D I N G D E B T

.....................................................................................................................................................................................
Supplementary Disclosure of Cash Flow Information..............................................................................................................................................................................................
Cash (paid) received during the Year Ended
December 31, 2012 for:
Interest:
Third party
Intercompany
Taxes:
Income tax authorities
Intercompany
Cash (paid) received during the Year Ended
December 31, 2011 for:
Interest:
Third party* $ (6,909) $ (128) $ (1,948) $ (8,985)
Intercompany (311) (169) 480 –
Taxes:
Income tax authorities $ 13 $ – $ (729) $ (716)
Intercompany (335) 1 334 –
Cash (paid) received during the Year Ended
December 31, 2010 for:
Interest:
Third party $ (2,493) $ (166) $ (2,507) $ (5,166)
Intercompany (12) (222) 234 –
Taxes:
Income tax authorities $ (32) $ – $ (970) $ (1,002)
Intercompany 859 – (859) –
* Includes payment of FRBNY Credit Facility accrued compounded interest of $4.7 billion in the first quarter of 2011.
American International Group, Inc (As Guarantor) supplementary disclosure of non-cash activities:..............................................................................................................................................................................................
Intercompany non-cash financing and investing activities:
Capital contributions
to subsidiaries through the forgiveness of loans $ – $ 2,510
in the form of bond available for sale securities – –
Return of capital and dividend received
in the form of cancellation of intercompany loan – –
in the form of bond trading securities 3,668 –
Intercompany loan receivable offset by intercompany payable 18,284 1,364
Exchange of intercompany payable with loan payable – 469
Investment assets received through reduction of intercompany loan receivable – 468
Paydown of FRBNY Credit Facility by subsidiary – 4,068
Other capital contributions – net 523 346
..................................................................................................................................................................................................................................
AIG 2012 Form 10-K 343
American Other
International Subsidiaries
Group, Inc. and Consolidated
(As Guarantor) SAFG, Inc. Eliminations AIG
$ (2,089) $ (128) $ (1,820) $ (4,037)
(133) (56) 189 –
$ (7) $ – $ (440) $ (447)
230 (41) (189) –
Year Ended December 31,
(in millions) 2012 2011 2010
$ –
4,078
9,303
3,320
–
–
–
–
579
I T E M 8 / N O T E 2 7 . I N F O R M A T I O N P R O V I D E D I N C O N N E C T I O N W I T H O U T S T A N D I N G D E B T

PART II..............................................................................................................................................................................................
..............................................................................................................................................................................................
None.
..............................................................................................................................................................................................
EVALUATION OF DISCLOSURE CONTROLS AND PROCEDURES..............................................................................................................................................................................................
Disclosure controls and procedures are designed to ensure that information required to be disclosed in reports filedor submitted under the Securities Exchange Act of 1934, as amended (the Exchange Act) is recorded, processed,summarized and reported within the time periods specified in SEC rules and forms and that such information isaccumulated and communicated to management, including the Chief Executive Officer and Chief Financial Officer, toallow timely decisions regarding required disclosures. In connection with the preparation of this Annual Report onForm 10-K, an evaluation was carried out by AIG management, with the participation of AIG’s Chief Executive Officerand Chief Financial Officer, of the effectiveness of our disclosure controls and procedures (as defined inRules 13a-15(e) and 15d-15(e) under the Exchange Act, as of December 31, 2012. Based on this evaluation, AIG’sChief Executive Officer and Chief Financial Officer concluded that our disclosure controls and procedures wereeffective as of December 31, 2012.
Management’s Report on Internal Control Over Financial Reporting..............................................................................................................................................................................................
Management of AIG is responsible for establishing and maintaining adequate internal control over financial reporting.AIG’s internal control over financial reporting is a process, under the supervision of AIG’s Chief Executive Officer andChief Financial Officer, designed to provide reasonable assurance regarding the reliability of financial reporting andthe preparation of AIG’s financial statements for external purposes in accordance with U.S. GAAP.
Because of its inherent limitations, internal control over financial reporting may not prevent or detect misstatements.Also, projections of any evaluation of effectiveness to future periods are subject to the risk that controls may becomeinadequate because of changes in conditions, or that the degree of compliance with the policies or procedures maydeteriorate.
AIG management conducted an assessment of the effectiveness of our internal control over financial reporting as ofDecember 31, 2012 based on the criteria established in Internal Control – Integrated Framework issued by theCommittee of Sponsoring Organizations of the Treadway Commission (COSO).
AIG management has concluded that, as of December 31, 2012, our internal control over financial reporting waseffective based on the criteria articulated in Internal Control – Integrated Framework issued by the COSO. Theeffectiveness of our internal control over financial reporting as of December 31, 2012 has been audited byPricewaterhouseCoopers LLP, an independent registered public accounting firm, as stated in their report, which isincluded in this Annual Report on Form 10-K.
Changes in Internal Control Over Financial Reporting..............................................................................................................................................................................................
We continue our implementation of new technology solutions, which began in 2010, to mitigate the reliance onmanual controls and to improve internal controls relating to the period-end financial reporting and consolidationprocess, income taxes and reporting for non-standard transactions. As a result, we have updated our internalcontrols to accommodate the modifications to our business processes and accounting procedures. We haveevaluated the effect on our internal control over financial reporting of this implementation for the quarter endedDecember 31, 2012, and determined that this conversion has not materially affected, and is not reasonably likely tomaterially affect, our internal control over financial reporting. There have been no other changes in our internalcontrol over financial reporting that have occurred during the quarter ended December 31, 2012 that have materiallyaffected, or are reasonably likely to materially affect, our internal control over financial reporting.
..................................................................................................................................................................................................................................
AIG 2012 Form 10-K344
ITEM 9 / CHANGES IN AND DISAGREEMENTS WITHACCOUNTANTS ON ACCOUNTING AND FINANCIAL DISCLOSURE
ITEM 9A / CONTROLS AND PROCEDURES
PART III..............................................................................................................................................................................................
..............................................................................................................................................................................................
Except for the information provided in Part 1, Item 1. Business under the heading ‘‘Directors and Executive Officers
of AIG’’, all information required by Items 10, 11, 12, 13 and 14 of this Form 10-K is incorporated by reference from
the definitive proxy statement for AIG’s 2013 Annual Meeting of Shareholders, which will be filed with the SEC not
later than 120 days after the close of the fiscal year pursuant to Regulation 14A.
..............................................................................................................................................................................................
See Item 10 herein.
..............................................................................................................................................................................................
See Item 10 herein.
..............................................................................................................................................................................................
See Item 10 herein.
..............................................................................................................................................................................................
See Item 10 herein.
..................................................................................................................................................................................................................................
AIG 2012 Form 10-K 345
ITEM 10 / DIRECTORS, EXECUTIVE OFFICERS ANDCORPORATE GOVERNANCE
ITEM 11 / EXECUTIVE COMPENSATION
ITEM 12 / SECURITY OWNERSHIP OF CERTAIN BENEFICIALOWNERS AND MANAGEMENT AND RELATED STOCKHOLDERMATTERS
ITEM 13 / CERTAIN RELATIONSHIPS AND RELATEDTRANSACTIONS, AND DIRECTOR INDEPENDENCE
ITEM 14 / PRINCIPAL ACCOUNTING FEES AND SERVICES

PART IV..............................................................................................................................................................................................
..............................................................................................................................................................................................
(a) Financial Statements and Schedules. See accompanying Index to Financial Statements.
(b) Exhibits. See accompanying Exhibit Index.
..................................................................................................................................................................................................................................
AIG 2012 Form 10-K346
ITEM 15 / EXHIBITS, FINANCIAL STATEMENT SCHEDULES

Pursuant to the requirements of Section 13 or 15(d) of the Securities Exchange Act of 1934, as amended, the
Registrant has duly caused this Annual Report on Form 10-K to be signed on its behalf by the undersigned,
thereunto duly authorized, on the 21st of February, 2013.
AMERICAN INTERNATIONAL GROUP, INC.
By /s/ ROBERT H. BENMOSCHE
(Robert H. Benmosche, President and
Chief Executive Officer)
KNOW ALL PERSONS BY THESE PRESENTS, that each person whose signature appears below constitutes and
appoints Robert H. Benmosche and David L. Herzog, and each of them severally, his or her true and lawful
attorney-in-fact, with full power of substitution and resubstitution, to sign in his or her name, place and stead, in any
and all capacities, to do any and all things and execute any and all instruments that such attorney may deem
necessary or advisable under the Securities Exchange Act of 1934, as amended, and any rules, regulations and
requirements of the U.S. Securities and Exchange Commission in connection with this Annual Report on Form 10-K
and any and all amendments hereto, as fully for all intents and purposes as he or she might or could do in person,
and hereby ratifies and confirms all said attorneys-in-fact and agents, each acting alone, and his or her substitute or
substitutes, may lawfully do or cause to be done by virtue hereof.
Pursuant to the requirements of the Securities Exchange Act of 1934, as amended, this Annual Report on Form 10-K
has been signed below by the following persons on behalf of the Registrant and in the capacities indicated on the
21st of February, 2013.
Signature Title
/s/ ROBERT H. BENMOSCHE President, Chief Executive Officer and Director
(Principal Executive Officer)(Robert H. Benmosche)
/s/ DAVID L. HERZOG Executive Vice President and Chief Financial Officer
(Principal Financial Officer)(David L. Herzog)
/s/ JOSEPH D. COOK Vice President – Finance
(Principal Accounting Officer)(Joseph D. Cook)
/s/ W. DON CORNWELLDirector
(W. Don Cornwell)
/s/ JOHN H. FITZPATRICKDirector
(John H. Fitzpatrick)
/s/ CHRISTOPHER S. LYNCHDirector
(Christopher S. Lynch)
..................................................................................................................................................................................................................................
AIG 2012 Form 10-K 347
SIGNATURES

Signature Title
/s/ ARTHUR C. MARTINEZDirector
(Arthur C. Martinez)
/s/ GEORGE L. MILES, JR.Director
(George L. Miles, Jr.)
/s/ HENRY S. MILLERDirector
(Henry S. Miller)
/s/ ROBERT S. MILLERDirector
(Robert S. Miller)
/s/ SUZANNE NORA JOHNSONDirector
(Suzanne Nora Johnson)
/s/ MORRIS W. OFFITDirector
(Morris W. Offit)
/s/ RONALD A. RITTENMEYERDirector
(Ronald A. Rittenmeyer)
/s/ DOUGLAS M. STEENLANDDirector
(Douglas M. Steenland)
..................................................................................................................................................................................................................................
AIG 2012 Form 10-K348
2 Plan of acquisition, reorganization, arrangement,
liquidation or succession
(1) Master Transaction Agreement, dated as of Incorporated by reference to Exhibit 2.1 to AIG’s
December 8, 2010, among AIG, ALICO Holdings LLC, Current Report on Form 8-K filed with the SEC on
AIA Aurora LLC, the Federal Reserve Bank of New December 8, 2010 (File No. 1-8787).
York, the United States Department of the Treasury
and the AIG Credit Facility Trust
3 Articles of incorporation and by-laws
3(i) Restated Certificate of Incorporation of AIG Incorporated by reference to Exhibit 3.2 to AIG’s
Current Report on Form 8-K filed with the SEC on
July 13, 2011 (File No. 1-8787).
3(ii) AIG By-laws, amended August 10, 2009 Incorporated by reference to Exhibit 3(ii) to AIG’s
Current Report on Form 8-K filed with the SEC on
August 14, 2009 (File No. 1-8787).
4 Instruments defining the rights of security holders, Certain instruments defining the rights of holders of
including indentures long-term debt securities of AIG and its subsidiaries
are omitted pursuant to Item 601(b)(4)(iii) of
Regulation S-K. AIG hereby undertakes to furnish to
the Commission, upon request, copies of any such
instruments.
(1) Credit Agreement, dated as of September 22, Incorporated by reference to Exhibit 99.1 to AIG’s
2008, between AIG and Federal Reserve Bank of New Current Report on Form 8-K filed with the SEC on
York September 26, 2008 (File No. 1-8787).
(2) Amendment No. 2, dated as of November 9, 2008, Incorporated by reference to Exhibit 10.4 to AIG’s
to the Credit Agreement dated as of September 22, Quarterly Report on Form 10-Q for the quarter ended
2008 between AIG and Federal Reserve Bank of New September 30, 2008 (File No. 1-8787).
York
(3) Amendment No. 3, dated as of April 17, 2009, to Incorporated by reference to Exhibit 99.1 to AIG’s
the Credit Agreement dated as of September 22, 2008 Current Report on Form 8-K filed with the SEC on
between AIG and the Federal Reserve Bank of New April 20, 2009 (File No. 1-8787).
York
(4) Amendment No. 4, dated as of December 1, 2009, Incorporated by reference to Exhibit 10.3 to AIG’s
to the Credit Agreement dated as of September 22, Current Report on Form 8-K filed with the SEC on
2008 between AIG and the Federal Reserve Bank of December 1, 2009 (File No. 1-8787).
New York
(5) Warrant to Purchase Common Stock, issued Incorporated by reference to Exhibit 10.2 to AIG’s
November 25, 2008 Current Report on Form 8-K filed with the SEC on
November 26, 2008 (File No. 1-8787).
(6) Warrant to Purchase Common Stock, issued Incorporated by reference to Exhibit 10.2 to AIG’s
April 17, 2009 Current Report on Form 8-K filed with the SEC on
April 20, 2009 (File No. 1-8787).
(7) Warrant Agreement (including Form of Warrant), Incorporated by reference to Exhibit 10.1 to AIG’s
dated as of January 6, 2011, between AIG and Wells Current Report on Form 8-K filed with the SEC on
Fargo Bank, N.A., as Warrant Agent January 7, 2011 (File No. 1-8787).
(8) Registration Rights Agreement, dated as of Incorporated by reference to Exhibit 99.4 to AIG’s
January 14, 2011, between AIG and the United States Current Report on Form 8-K filed with the SEC on
Department of the Treasury January 14, 2011 (File No. 1-8787).
(9) Agreement to Amend Warrants, dated as of Incorporated by reference to Exhibit 99.5 to AIG’s
January 14, 2011, between AIG and the United States Current Report on Form 8-K filed with the SEC on
Department of the Treasury January 14, 2011 (File No. 1-8787).
..................................................................................................................................................................................................................................
AIG 2012 Form 10-K 349
ExhibitNumber Description Location
EXHIBIT INDEX

(10) Tax Asset Protection Plan, dated as of March 9, Incorporated by reference to Exhibit 4.1 to AIG’s
2011, between AIG and Wells Fargo Bank, N.A., as Current Report on Form 8-K filed with the SEC on
Rights Agent, including as Exhibit A the forms of March 9, 2011 (File No. 1-8787).
Rights Certificate and of Election to Exercise
(11) Subordinated Debt Indenture, dated as of Incorporated by reference to Exhibit 4.1 to AIG’s
August 23, 2012, between AIG and The Bank of New Current Report on Form 8-K filed with the SEC on
York Mellon, as Trustee August 23, 2012 (File No. 1-8787).
(12) Amendment to the Replacement Capital Incorporated by reference to Exhibit 99.1 to AIG’s
Covenants, dated as of August 23, 2012, by AIG in Current Report on Form 8-K filed with the SEC on
favor of and for the benefit of each Covered August 23, 2012 (File No. 1-8787).
Debtholder
(13) Replacement Capital Covenant, dated as of Incorporated by reference to Exhibit 99.2 to AIG’s
August 23, 2012, by AIG in favor of and for the benefit Current Report on Form 8-K filed with the SEC on
of each Covered Debtholder, in connection with AIG’s August 23, 2012 (File No. 1-8787).
Series A-2 Junior Subordinated Debentures
(14) Replacement Capital Covenant, dated as of Incorporated by reference to Exhibit 99.3 to AIG’s
August 23, 2012, by AIG in favor of and for the benefit Current Report on Form 8-K filed with the SEC on
of each Covered Debtholder, in connection with AIG’s August 23, 2012 (File No. 1-8787).
Series A-3 Junior Subordinated Debentures
9 Voting Trust Agreement None.
10 Material contracts
(1) AIG Amended and Restated 1999 Stock Option Filed as exhibit to AIG’s Definitive Proxy Statement
Plan* dated April 4, 2003 (File No. 1-8787) and incorporated
herein by reference.
(2) Form of Stock Option Grant Agreement under the Incorporated by reference to Exhibit 10(a) to AIG’s
AIG Amended and Restated 1999 Stock Option Plan* Quarterly Report on Form 10-Q for the quarter ended
September 30, 2004 (File No. 1-8787).
(3) AIG Executive Deferred Compensation Plan* Incorporated by reference to Exhibit 4(a) to AIG’s
Registration Statement on Form S-8 (File
No. 333-101640).
(4) AIG Supplemental Incentive Savings Plan* Incorporated by reference to Exhibit 4(b) to AIG’s
Registration Statement on Form S-8 (File
No. 333-101640).
(5) AIG Director Stock Plan* Filed as an exhibit to AIG’s Definitive Proxy Statement
dated April 5, 2004 (File No. 1-8787) and incorporated
herein by reference.
(6) Amended and Restated American General Incorporated by reference to Exhibit 10.15 to American
Supplemental Thrift Plan (December 31, 1998)* General Corporation’s Annual Report on Form 10-K for
the year ended December 31, 2000 (File No. 1-7981).
(7) Letter Agreement, dated August 16, 2009, between Incorporated by reference to Exhibit 99.1 to AIG’s
AIG and Robert H. Benmosche* Current Report on Form 8-K filed with the SEC on
August 17, 2009 (File No. 1-8787).
(8) AIG Amended and Restated Executive Severance Incorporated by reference to Exhibit 10.1 to AIG’s
Plan* Current Report on Form 8-K filed with the SEC on
September 26, 2008 (File No. 1-8787).
(9) AIG 2012 Executive Severance Plan* Filed herewith.
(10) Assurance Agreement, by AIG in favor of eligible Incorporated by reference to Exhibit 10(6) to AIG’s
employees, dated as of June 27, 2005, relating to Quarterly Report on Form 10-Q for the quarter ended
certain obligations of Starr International Company, Inc.* March 31, 2005 (File No. 1-8787).
..................................................................................................................................................................................................................................
AIG 2012 Form 10-K350
ExhibitNumber Description Location

(11) 2005/2006 Deferred Compensation Profit Incorporated by reference to Exhibit 10.50 to AIG’s
Participation Plan for Senior Partners (amended and Annual Report on Form 10-K for the year ended
restated effective December 31, 2008)* December 31, 2008 (File No. 1-8787).
(12) 2005/2006 Deferred Compensation Profit Incorporated by reference to Exhibit 10.51 to AIG’s
Participation Plan for Partners (amended and restated Annual Report on Form 10-K for the year ended
effective December 31, 2008)* December 31, 2008 (File No. 1-8787).
(13) 2005/2006 Deferred Compensation Profit Incorporated by reference to Exhibit 10.52 to AIG’s
Participation Plan RSU Award Agreement (amended Annual Report on Form 10-K for the year ended
and restated effective December 31, 2008)* December 31, 2008 (File No. 1-8787).
(14) Final Judgment and Consent with the Securities Incorporated by reference to Exhibit 10.2 to AIG’s
and Exchange Commission, including the related Current Report on Form 8-K filed with the SEC on
complaint, dated February 9, 2006 February 9, 2006 (File No. 1-8787).
(15) Agreement between the Attorney General of the Incorporated by reference to Exhibit 10.3 to AIG’s
State of New York and AIG and its Subsidiaries, dated Current Report on Form 8-K filed with the SEC on
January 18, 2006 February 9, 2006 (File No. 1-8787).
(16) AIG Senior Partners Plan (amended and restated Incorporated by reference to Exhibit 10.59 to AIG’s
effective December 31, 2008)* Annual Report on Form 10-K for the year ended
December 31, 2008 (File No. 1-8787).
(17) AIG Partners Plan (amended and restated Incorporated by reference to Exhibit 10.60 to AIG’s
effective December 31, 2008)* Annual Report on Form 10-K for the year ended
December 31, 2008 (File No. 1-8787).
(18) AIG Amended and Restated 2007 Stock Incentive Incorporated by reference to Exhibit 10.62 to AIG’s
Plan* Annual Report on Form 10-K for the year ended
December 31, 2008 (File No. 1-8787).
(19) AIG Form of Stock Option Award Agreement* Incorporated by reference to Exhibit 10.A to AIG’s
Registration Statement on Form S-8 (File No. 333-
148148).
(20) AIG Amended and Restated Form of Performance Incorporated by reference to Exhibit 10.64 to AIG’s
RSU Award Agreement* Annual Report on Form 10-K for the year ended
December 31, 2008 (File No. 1-8787).
(21) AIG Amended and Restated Form of Time-Vested Incorporated by reference to Exhibit 10.65 to AIG’s
RSU Award Agreement* Annual Report on Form 10-K for the year ended
December 31, 2008 (File No. 1-8787).
(22) AIG Form of Time-Vested RSU Award Agreement Incorporated by reference to Exhibit 10.D to AIG’s
with Four-Year Pro Rata Vesting* Registration Statement on Form S-8 (File No. 333-
148148).
(23) AIG Amended and Restated Form of Time-Vested Incorporated by reference to Exhibit 10.67 to AIG’s
RSU Award Agreement with Three-Year Pro Rata Annual Report on Form 10-K for the year ended
Vesting* December 31, 2008 (File No. 1-8787).
(24) AIG Amended and Restated Form of Time-Vested Incorporated by reference to Exhibit 10.68 to AIG’s
RSU Award Agreement with Three-Year Pro Rata Annual Report on Form 10-K for the year ended
Vesting and with Early Retirement* December 31, 2008 (File No 1-8787).
(25) AIG Amended and Restated Form of Incorporated by reference to Exhibit 10.69 to AIG’s
Non-Employee Director Deferred Stock Units Award Annual Report on Form 10-K for the year ended
Agreement* December 31, 2008 (File No. 1-8787).
(26) Form of AIG 2009 TARP RSU Award Agreement Incorporated by reference to Exhibit 10.2 to AIG’s
(Top 25)* Current Report on Form 8-K filed with the SEC on
December 31, 2009 (File No. 1-8787).
(27) Form of AIG 2009 TARP RSU Award Agreement Incorporated by reference to Exhibit 10.63 to AIG’s
(Top 100)* Annual Report on Form 10-K for the year ended
December 31, 2009 (File No. 1-8787).
..................................................................................................................................................................................................................................
AIG 2012 Form 10-K 351
ExhibitNumber Description Location
(28) Form of AIG Stock Salary Award Agreement* Incorporated by reference to Exhibit 10.2 to AIG’s
Current Report on Form 8-K filed with the SEC on
December 31, 2009 (File No. 1-8787).
(29) Memorandum of Understanding, dated Incorporated by reference to Exhibit 10.1 to AIG’s
November 25, 2009, between AIG, Maurice R. Current Report on Form 8-K filed with the SEC on
Greenberg, Howard I. Smith, C.V. Starr and Star November 25, 2009 (File No. 1-8787).
International Company, Inc.
(30) Purchase Agreement, dated as of June 25, 2009, Incorporated by reference to Exhibit 2.1 to AIG’s
among AIG, American International Reinsurance Current Report on Form 8-K filed with the SEC on
Company, Limited and the Federal Reserve Bank of June 25, 2009 (File No. 1-8787).
New York
(31) Purchase Agreement, dated as of June 25, 2009, Incorporated by reference to Exhibit 2.2 to AIG’s
between AIG and the Federal Reserve Bank of New Current Report on Form 8-K filed with the SEC on
York June 25, 2009 (File No. 1-8787).
(32) Fourth Amended and Restated Limited Liability Incorporated by reference to Exhibit 10.1 to AIG’s
Company Agreement of AIA Aurora LLC, dated as of Current Report on Form 8-K filed with the SEC on
December 1, 2009, among AIG, American International December 1, 2009 (File No. 1-8787).
Reinsurance Company, Limited and the Federal
Reserve Bank of New York
(33) Second Amended and Restated Limited Liability Incorporated by reference to Exhibit 10.2 to AIG’s
Company Agreement of ALICO Holdings LLC, dated Current Report on Form 8-K filed with the SEC on
as of December 1, 2009, between AIG and the Federal December 1, 2009 (File No. 1-8787).
Reserve Bank of New York
(34) Master Investment and Credit Agreement, dated Incorporated by reference to Exhibit 10.1 to AIG’s
as of November 25, 2008, among Maiden Lane Current Report on Form 8-K filed with the SEC on
III LLC, the Federal Reserve Bank of New York, AIG December 2, 2008 (File No. 1-8787).
and the Bank of New York Mellon
(35) Asset Purchase Agreement, dated as of Incorporated by reference to Exhibit 10.1 to AIG’s
December 12, 2008, among the Sellers party thereto, Current Report on Form 8-K filed with the SEC on
AIF Securities Lending Corp., AIG, Maiden Lane II LLC December 15, 2008 (File No. 1-8787).
and the Federal Reserve Bank of New York
(36) AIG Credit Facility Trust Agreement, dated as of Incorporated by reference to Exhibit 10.1 to AIG’s
January 16, 2009, among the Federal Reserve Bank of Current Report on Form 8-K filed with the SEC on
New York and Jill M. Considine, Chester B. Feldberg January 23, 2009 (File No. 1-8787).
and Douglas L. Foshee, as Trustees
(37) Form of letter agreement with certain directors Incorporated by reference to Exhibit 10(103) to
regarding deferred fees for 2009* Amendment No. 1 to AIG’s Annual Report for the year
ended December 31, 2008 on Form 10-K/A filed with
the SEC on April 30, 2009 (File No. 1-8787).
(38) Final Determination, dated December 21, 2009, Incorporated by reference to Exhibit 10.1 to AIG’s
from the Office of the Special Master for TARP Current Report on Form 8-K filed with the SEC on
Executive Compensation to AIG* December 31, 2009 (File No. 1-8787).
(39) Determination Memorandum, dated October 22, Incorporated by reference to Exhibit 10.1 to AIG’s
2009, from the Office of the Special Master for TARP Current Report on Form 8-K filed with the SEC on
Executive Compensation to AIG* October 23, 2009 (File No. 1-8787).
(40) 2009-2010 Stock Salary Award Agreement Incorporated by reference to Exhibit 10.1 to AIG’s
between AIG and Robert H. Benmosche, dated Current Report on Form 8-K filed with the SEC on
November 24, 2009* November 25, 2009 (File No. 1-8787).
(41) Restrictive Covenant Agreement between AIG and Incorporated by reference to Exhibit 10.1 to AIG’s
Robert H. Benmosche, dated November 24, 2009* Current Report on Form 8-K filed with the SEC on
November 25, 2009 (File No. 1-8787).
..................................................................................................................................................................................................................................
AIG 2012 Form 10-K352
ExhibitNumber Description Location

(42) Form of Reimbursement Agreement for Use of Incorporated by reference to Exhibit 10.1 to AIG’s
Corporate Aircraft* Current Report on Form 8-K filed with the SEC on
January 25, 2010 (File No. 1-8787).
(43) Agreement to Amend Master Transaction Incorporated by reference to Exhibit 10.1 to AIG’s
Agreement, Guarantee, Pledge and Proceeds Current Report on Form 8-K filed with the SEC on
Application Agreement and LLC Agreements, dated as March 8, 2012 (File No. 1-8787).
of March 7, 2012, among AIG, AM Holdings LLC, AIA
Aurora LLC and the United States Department of the
Treasury
(44) Agreement to Terminate Intercompany Loan, Incorporated by reference to Exhibit 10.1 to AIG’s
dated as of March 21, 2012, among AIG, AIA Current Report on Form 8-K filed with the SEC on
Aurora LLC, AM Holdings LLC and the United States March 22, 2012 (File No. 1-8787).
Department of the Treasury
(45) Letter Agreement, dated as of March 3, 2012, Incorporated by reference to Exhibit 2.1 to AIG’s
among AIG, AIA Aurora LLC, AM Holdings LLC and Current Report on Form 8-K filed with the SEC on
the United States Department of the Treasury March 6, 2012 (File No. 1-8787).
(46) First Amended and Restated Credit Agreement, Incorporated by reference to Exhibit 10.1 to AIG’s
dated as of October 5, 2012, among AIG, the Current Report on Form 8-K filed with the SEC on
subsidiary borrowers party thereto, the lenders party October 5, 2012 (File No. 1-8787)
thereto, JPMorgan Chase Bank, N.A., as
Administrative Agent, and each Several L/C Agent
party thereto.
(47) Purchase Agreement, dated as of September 30, Incorporated by reference to Exhibit 2.1 to AIG’s
2010, between American International Group, Inc. and Current Report on Form 8-K filed with the SEC on
Prudential Financial, Inc. (excluding certain exhibits October 4, 2010 (File No. 1-8787).
and schedules)
(48) American International Group, Inc. 2010 Stock Incorporated by reference to AIG’s Definitive Proxy
Incentive Plan* Statement, dated April 12, 2010 (Filed No. 1-8787).
(49) AIG Amended Form of 2010 Stock Incentive Plan Incorporated by reference to Exhibit 10.14 to AIG’s
DSU Award Agreement* Quarterly Report on Form 10-Q for the quarter ended
March 31, 2012 (File No. 1-8787).
(50) Form of Award Letter for LTPU-based stock Incorporated by reference to Exhibit 10.2 to AIG’s
salary* Current Report on Form 8-K filed with the SEC on
May 28, 2010 (File No. 1-8787).
(51) Determination Memorandum, dated March 23, Incorporated by reference to Exhibit 10.1 to AIG’s
2010, from the Office of the Special Master for TARP Current Report on Form 8-K filed with the SEC on
Executive Compensation to AIG* April 2, 2010 (File No. 1-8787).
(52) Stock Purchase Agreement, dated as of March 7, Incorporated by reference to Exhibit 2.1 to AIG’s
2010, among American International Group, Inc., Current Report on Form 8-K filed with the SEC on
ALICO Holdings LLC and MetLife, Inc. March 11, 2010 (File No. 1-8787).
(53) Supplemental Determination Memorandum, dated Incorporated by reference to Exhibit 99.2 to AIG’s
February 5, 2010, from the Office of the Special Current Report on Form 8-K filed with the SEC on
Master for TARP Executive Compensation to AIG* February 8, 2010 (File No. 1-8787).
(54) Release and Restrictive Covenant Agreement Incorporated by reference to Exhibit 99.3 to AIG’s
between AIG and Peter Hancock* Current Report on Form 8-K filed with the SEC on
February 8, 2010 (File No. 1-8787).
(55) Non-Competition and Non-Solicitation Agreement Incorporated by reference to Exhibit 99.4 to AIG’s
between AIG and Peter Hancock, dated February 8, Current Report on Form 8-K filed with the SEC on
2010* February 8, 2010 (File No. 1-8787).
(56) Determination Memorandum, dated April 16, 2010, Incorporated by reference to Exhibit 10.2 to AIG’s
from the Office of the Special Master for TARP Quarterly Report on Form 10-Q for the quarter ended
Executive Compensation to AIG* March 31, 2010 (File No. 1-8787).
..................................................................................................................................................................................................................................
AIG 2012 Form 10-K 353
ExhibitNumber Description Location

(57) Supplemental Determination Memorandum, dated Incorporated by reference to Exhibit 10(103) to AIG’s
August 3, 2010, from the Office of the Special Master Annual Report on Form 10-K for the year ended
for TARP Executive Compensation to AIG* December 31, 2010 (File No. 1-8787).
(58) Supplemental Determination Memorandum, dated Incorporated by reference to Exhibit 10(104) to AIG’s
December 20, 2010, from the Office of the Special Annual Report on Form 10-K for the year ended
Master for TARP Executive Compensation to AIG* December 31, 2010 (File No. 1-8787).
(59) Supplemental Determination Memorandum, dated Incorporated by reference to Exhibit 10(105) to AIG’s
May 18, 2010, from the Office of the Special Master Annual Report on Form 10-K for the year ended
for TARP Executive Compensation to AIG* December 31, 2010 (File No. 1-8787).
(60) Amendment No. 1, dated as of March 7, 2010, to Incorporated by reference to Exhibit 10(106) to AIG’s
the Second Amended and Restated Limited Liability Annual Report on Form 10-K for the year ended
Company Agreement of ALICO Holdings LLC December 31, 2010 (File No. 1-8787).
(61) Determination Memorandum, dated April 1, 2011, Incorporated by reference to Exhibit 10.1 to AIG’s
from the Office of the Special Master for TARP Current Report on Form 8-K filed with the SEC on
Executive Compensation to AIG* April 1, 2011 (File No. 1-8787).
(62) Determination Memorandum, dated April 8, 2011, Incorporated by reference to Exhibit 10.109 to AIG’s
from the Office of the Special Master for TARP Annual Report on Form 10-K for the year ended
Executive Compensation to AIG* December 31, 2011 (File No. 1-8787).
(63) Supplemental Determination Memorandum, dated Incorporated by reference to Exhibit 10.110 to AIG’s
October 21, 2011, from the Office of the Special Annual Report on Form 10-K for the year ended
Master for TARP Executive Compensation to AIG* December 31, 2011 (File No. 1-8787).
(64) Supplemental Determination Memorandum, dated Incorporated by reference to Exhibit 10.111 to AIG’s
August 19, 2011, from the Office of the Special Master Annual Report on Form 10-K for the year ended
for TARP Executive Compensation to AIG* December 31, 2011 (File No. 1-8787).
(65) Determination Memorandum, dated April 6, 2012, Incorporated by reference to Exhibit 10.1 to AIG’s
from the Office of the Special Master for TARP Current Report on Form 8-K filed with the SEC on
Executive Compensation to AIG* April 10, 2012 (File No. 1-8787).
(66) Determination Memorandum, dated May 9, 2012, Filed herewith.
from the Office of the Special Master for TARP
Executive Compensation to AIG*
(67) Description of Non-Management Director Incorporated by reference to Exhibit 10.1 to AIG’s
Compensation* Quarterly Report on Form 10-Q for the quarter ended
September 30, 2012 (File No. 1-8787).
(68) Employment Letter, dated as of June 21, 2012, Incorporated by reference to Exhibit 10.2 to
between Laurette T. Koellner and AIG* International Lease Finance Corporation’s Current
Report on Form 8-K filed with the SEC on June 21,
2012 (File No. 1-31616).
(69) AIG Non-Qualified Retirement Income Plan* Filed herewith.
(70) AIG Supplemental Executive Retirement Plan* Filed herewith.
(71) Amendment to the AIG Supplemental Executive Filed herewith.
Retirement Plan*
(72) American General Corporation Supplemental Incorporated by reference to Exhibit 10.1 to American
Executive Retirement Plan* General Corporation’s Quarterly Report on Form 10-Q
for the quarter ended September 30, 1998 (File
No. 1-7981).
(73) Amendment Number One to the American Filed herewith.
General Corporation Supplemental Executive
Retirement Plan*
(74) Amendment Number Two to the American Filed herewith.
General Corporation Supplemental Executive
Retirement Plan*
..................................................................................................................................................................................................................................
AIG 2012 Form 10-K354
ExhibitNumber Description Location
(75) Master Transaction Agreement, dated as of Incorporated by reference to Exhibit 10.6 to AIG’s
April 19, 2011, by and among American Home Quarterly Report on Form 10-Q for the quarter ended
Assurance Company, Chartis Casualty Company (f/k/a March 31, 2011 (File No. 1-8787).
American International South Insurance Company),
Chartis Property Casualty Company (f/k/a AIG
Casualty Company), Commerce and Industry
Insurance Company, Granite State Insurance
Company, Illinois National Insurance Co., National
Union Fire Insurance Company of Pittsburgh, Pa., New
Hampshire Insurance Company, The Insurance
Company of the State of Pennsylvania, Chartis Select
Insurance Company (f/k/a AIG Excess Liability
Insurance Company Ltd.), Chartis Specialty Insurance
Company (f/k/a American International Specialty Lines
Insurance Company), Landmark Insurance Company,
Lexington Insurance Company, AIU Insurance
Company, American International Reinsurance
Company, Ltd. and American Home Assurance
Company, National Union Fire Insurance Company of
Pittsburgh, Pa., New Hampshire Insurance Company
and Chartis Overseas Limited acting as members of
the Chartis Overseas Association as respects business
written or assumed by or from affiliated companies of
Chartis Inc. (collectively, the Reinsureds), Eaglestone
Reinsurance Company and National Indemnity
Company
(76) Unconditional Capital Maintenance Agreement, Incorporated by reference to Exhibit 10.9 to AIG’s
dated as of March 30, 2011, between AIG and Quarterly Report on Form 10-Q for the quarter ended
American General Life Insurance Company March 31, 2011 (File No. 1-8787).
(77) Side Letter, dated as of February 19, 2013, to Filed herewith.
Unconditional Capital Maintenance Agreement, dated
as of March 30, 2011, between AIG and American
General Life Insurance Company
(78) Unconditional Capital Maintenance Agreement, Incorporated by reference to Exhibit 10.11 to AIG’s
dated as of March 30, 2011, between AIG and The Quarterly Report on Form 10-Q for the quarter ended
United States Life Insurance Company in the City of March 31, 2011 (File No. 1-8787).
New York
(79) Side Letter, dated as of February 19, 2013, to Filed herewith.
Unconditional Capital Maintenance Agreement, dated
as of March 30, 2011, between AIG and The United
States Life Insurance Company in the City of New
York
(80) Amended and Restated Unconditional Capital Filed herewith.
Maintenance Agreement, dated as of February 20,
2013, among AIG, Chartis Inc., AIU Insurance
Company, American Home Assurance Company,
Chartis Casualty Company, Chartis Property Casualty
Company, Chartis Specialty Insurance Company,
Commerce and Industry Insurance Company, Granite
State Insurance Company, Illinois National
Insurance Co., Lexington Insurance Company, National
Union Fire Insurance Company of Pittsburgh, Pa., New
Hampshire Insurance Company and The Insurance
Company of the State of Pennsylvania
..................................................................................................................................................................................................................................
AIG 2012 Form 10-K 355
ExhibitNumber Description Location

(81) Unconditional Capital Maintenance Agreement, Incorporated by reference to Exhibit 10.26 to AIG’s
dated as of March 15, 2011, between AIG and AGC Quarterly Report on Form 10-Q for the quarter ended
Life Insurance Company March 31, 2011 (File No. 1-8787).
(82) Unconditional Capital Maintenance Agreement, Incorporated by reference to Exhibit 10.30 to AIG’s
dated as of March 30, 2011, between AIG and The Quarterly Report on Form 10-Q for the quarter ended
Variable Annuity Life Insurance Company March 31, 2011 (File No. 1-8787).
(83) Side Letter, dated as of February 19, 2013, to Filed herewith.
Unconditional Capital Maintenance Agreement, dated
as of March 30, 2011, between AIG and The Variable
Annuity Life Insurance Company
(84) Share Purchase Agreement, dated as of Incorporated by reference to Exhibit 2.1 to AIG’s
December 9, 2012, by and among AIG Capital Current Report on Form 8-K filed with the SEC on
Corporation, AIG and Jumbo Acquisition Limited December 10, 2012 (File No. 1-8787).
11 Statement re: computation of per share earnings Included in Note 17 to Consolidated Financial
Statements.
12 Computation of Ratios of Earnings to Fixed Charges Filed herewith.
21 Subsidiaries of Registrant Filed herewith.
23 Consent of Independent Registered Public Accounting Filed herewith.
Firm
23.1 Consent of Independent Accountants Filed herewith.
24 Powers of attorney Included on signature page and filed herewith.
31 Rule 13a-14(a)/15d-14(a) Certifications Filed herewith.
32 Section 1350 Certifications** Filed herewith.
99.02 Securities Registered pursuant to Section 12(b) of the Filed herewith.
Act
99.1 Certification of principal executive officer pursuant to Filed herewith.
Section 111(b)(4) of the Emergency Economic
Stabilization Act of 2008
99.2 Certification of principal financial officer pursuant to Filed herewith.
Section 111(b)(4) of the Emergency Economic
Stabilization Act of 2008
99.3 AIA Group Limited Consolidated Financial Statements Filed herewith.
for the year ended November 30, 2011
101 Interactive data files pursuant to Rule 405 of Filed herewith.
Regulation S-T: (i) the Consolidated Balance Sheet as
of December 31, 2012 and December 31, 2011, (ii) the
Consolidated Statement of Operations for the three
years ended December 31, 2012, (iii) the Consolidated
Statement of Shareholders’ Equity for the three years
ended December 31, 2012, (iv) the Consolidated
Statement of Cash Flows for the three years ended
December 31, 2012, (v) the Consolidated Statement of
Comprehensive Income (Loss) for the three years
ended December 31, 2012 and (vi) the Notes to the
Consolidated Financial Statements.
* This exhibit is a management contract or a compensatory plan or arrangement.
** This information is furnished and not filed for purposes of Sections 11 and 12 of the Securities Act of 1933 and Section 18 of the Securities
and Exchange Act of 1934.
..................................................................................................................................................................................................................................
AIG 2012 Form 10-K356
ExhibitNumber Description Location

Summary of Investments – Other than Investments in Related Parties
Schedule I
Fixed maturities:
U.S. government and government sponsored entities
Obligations of states, municipalities and political subdivisions
Non-U.S. governments
Public utilities
All other corporate debt securities
Mortgage-backed, asset-backed and collateralized
Total fixed maturity securities
Equity securities and mutual funds:
Common stock:
Public utilities
Banks, trust and insurance companies
Industrial, miscellaneous and all other
Total common stock
Preferred stock
Mutual funds
Total equity securities and mutual funds
Mortgage and other loans receivable, net of allowance
Other invested assets
Short-term investments, at cost (approximates fair value)
Derivative assets
Total investments
* Original cost of equity securities and fixed maturities is reduced by other-than-temporary impairment charges, and, as to fixed maturity
securities, reduced by repayments and adjusted for amortization of premiums or accretion of discounts.
..................................................................................................................................................................................................................................
AIG 2012 Form 10-K 357
Amount at
At December 31, 2012 which shown in
(in millions) Cost* Fair Value the Balance Sheet
$ 9,955 $ 10,277 $ 10,277
33,042 35,705 35,705
25,451 26,802 26,802
22,266 24,993 24,993
114,782 127,439 127,439
65,237 69,327 69,327
270,733 294,543 294,543
9 11 11
1,579 3,036 3,036
553 631 631
2,141 3,678 3,678
56 78 78
105 118 118
2,302 3,874 3,874
19,482 20,353 19,482
28,257 26,711 29,117
28,808 28,808 28,808
3,671 3,671 3,671
$ 353,253 $ 377,960 $ 379,495

Condensed Financial Information of RegistrantBalance Sheet – Parent Company Only
Schedule II
Assets:
Short-term investments $ 12,868
Other investments 6,599
Total investments 19,467
Cash 176
Loans to subsidiaries* 39,971
Due from affiliates – net* 303
Current and deferred income taxes 22,944
Investments in consolidated subsidiaries* 80,990
Other assets 1,772
Total assets $ 165,623
Liabilities:
Intercompany tax payable* $ 9,801
Notes and bonds payable 12,725
Junior subordinated debt 9,327
MIP notes payable 10,138
Series AIGFP matched notes and bonds payable 3,560
Loans and mortgages payable 156
Loans from subsidiaries* 12,316
Other liabilities (includes intercompany derivative liabilities of $602 in 2012 and $901
in 2011) 6,062
Total liabilities 64,085
AIG Shareholders’ equity:
Common stock 4,766
Treasury stock (942)
Additional paid-in capital 80,459
Retained earnings 10,774
Accumulated other comprehensive income 6,481
Total AIG shareholders’ equity 101,538
Total liabilities and equity $ 165,623
* Eliminated in consolidation.
See Accompanying Notes to Condensed Financial Information of Registrant, which include a summary of revisions to prior year balances in
connection with a change in accounting principle.
..................................................................................................................................................................................................................................
AIG 2012 Form 10-K358
December 31,
(in millions) 2012 2011
$ 14,764
3,902
18,666
81
35,064
422
20,601
70,781
2,130
$ 147,745
$ 6,078
14,334
9,416
9,287
3,329
–
1,002
6,297
49,743
4,766
(13,924)
80,410
14,176
12,574
98,002
$ 147,745

Condensed Financial Information of Registrant (Continued)Statement of Income (Loss) – Parent Company Only
Schedule II
Revenues:
Equity in earnings of consolidated subsidiaries* $ 6,260 $ 21,385
Interest income 596 3,249
Change in fair value of ML III (723) –
Net realized capital gains (losses) 213 (209)
Other income 279 6
Expenses:
Accrued and compounding interest (24) (636)
Amortization of prepaid commitment asset (48) (3,471)
Total interest expense on FRBNY Credit Facility (72) (4,107)
Other interest expense (2,845) (2,279)
Restructuring expense and related asset impairment and other expenses (36) (451)
Net loss on extinguishment of debt (2,847) (104)
Other expenses (831) (1,213)
Income (loss) from continuing operations before income tax expense (benefit) (6) 16,277
Income tax expense (benefit) (19,695) 5,402
Net income 19,689 10,875
Income (loss) from discontinued operations 933 (817)
Net income attributable to AIG Parent Company $ 20,622 $ 10,058
* Eliminated in consolidation.
See Accompanying Notes to Condensed Financial Information of Registrant, which include a summary of revisions to prior year balances inconnection with a change in accounting principle.
..................................................................................................................................................................................................................................
AIG 2012 Form 10-K 359
Years Ended December 31,
(in millions) 2012 2011 2010
$ 1,970
358
2,287
747
806
–
–
–
(2,257)
(47)
(9)
(1,555)
2,300
(1,137)
3,437
1
$ 3,438

Condensed Financial Information of Registrant (Continued)Statement of Comprehensive Income (Loss) – Parent Company Only
Schedule II
Net income (loss) $ 20,622 $ 10,058
Other comprehensive income (loss) (2,483) 2,782
Total comprehensive income attributable to AIG $ 18,139 $ 12,840
See accompanying Notes to Condensed Financial Information of Registrant.
..................................................................................................................................................................................................................................
AIG 2012 Form 10-K360
Years Ended December 31,
(in millions) 2012 2011 2010
$ 3,438
6,093
$ 9,531

Condensed Financial Information of Registrant (Continued)Statement of Cash Flows – Parent Company Only
Schedule II
Net cash used in operating activities $ (5,600) $ (1,942)
Cash flows from investing activities:
Sales and maturities of investments 2,224 3,212
Sales of divested businesses 1,075 278
Purchase of investments (19) (55)
Net change in restricted cash 1,945 (183)
Net change in short-term investments (7,130) (4,291)
Contributions to subsidiaries – net (15,973) (2,574)
Payments received on mortgages and other loan receivables 341 785
Loans to subsidiaries – net 3,757 5,703
Other, net 1,543 (300)
Net cash provided by (used in) investing activities (12,237) 2,575
Cash flows from financing activities:
Federal Reserve Bank of New York credit facility borrowings – 19,900
Federal Reserve Bank of New York credit facility repayments (14,622) (19,110)
Issuance of long-term debt 2,135 1,996
Repayment of long-term debt (6,181) (3,681)
Proceeds from drawdown on the Department of the Treasury Commitment 20,292 2,199
Issuance of Common Stock 5,055 –
Loans from subsidiaries – net 11,519 (1,777)
Purchase of Common Stock (70) –
Other, net (164) (168)
Net cash provided by (used in) financing activities 17,964 (641)
Change in cash 127 (8)
Cash at beginning of year 49 57
Cash at end of year $ 176 $ 49
Supplementary disclosure of cash flow information:
Intercompany non-cash financing and investing activities:
Capital contributions in the form of available for sale securities $ – $ –
Capital contributions to subsidiaries through forgiveness of loans – 2,510
Other capital contributions – net 523 346
Paydown of FRBNY Credit Facility by subsidiary – 4,068
Investment assets received through reduction of intercompany loan receivable – 468
Exchange of intercompany payable with loan payable – 469
Intercompany loan receivable offset by intercompany payable 18,284 1,364
Return of capital and dividend received in the form of cancellation of
intercompany loan – –
Return of capital and dividend received in the form of bond trading securities 3,668 –
See Accompanying Notes to Condensed Financial Information of Registrant.
..................................................................................................................................................................................................................................
AIG 2012 Form 10-K 361
Years Ended December 31,
(in millions) 2012 2011 2010
$ (825)
16,546
–
(4,406)
(377)
(2,029)
(152)
328
5,126
259
15,295
–
–
3,754
(3,238)
–
–
(2,032)
(13,000)
(49)
(14,565)
(95)
176
$ 81
Years Ended December 31,
(in millions) 2012 2011 2010
$ 4,078
–
579
–
–
–
–
9,303
3,320

Notes to Condensed Financial Information of Registrant..............................................................................................................................................................................................
American International Group, Inc.’s (the Registrant) investments in consolidated subsidiaries are stated at cost plus
equity in undistributed income of consolidated subsidiaries. The accompanying condensed financial statements of the
Registrant should be read in conjunction with the consolidated financial statements and notes thereto of American
International Group, Inc. and subsidiaries included in the Registrant’s 2012 Annual Report on Form 10-K for the year
ended December 31, 2012 (2012 Annual Report on Form 10-K) filed with the Securities and Exchange Commission
on February 21, 2013.
On January 1, 2012, the Registrant retrospectively adopted a standard that changed its subsidiaries’ method of
accounting for costs associated with acquiring or renewing insurance contracts. The standard clarifies how to
determine whether the costs incurred in connection with the acquisition of new or renewal insurance contracts qualify
as deferred policy acquisition costs. Accordingly, the Registrant revised its financial information and accompanying
notes included herein.
The following tables present the Condensed Balance Sheet as of December 31, 2011 and the Condensed
Statement of Income (Loss) for the years ended December 31, 2011 and 2010, showing the amounts
previously reported, the effect of the change due to the adoption of the standard and the adjusted amounts
that are reflected in the Registrant’s condensed financial information:
Assets:
Investments in consolidated subsidiaries $ 84,403 $ (3,413) $ 80,990
Total assets 169,036 (3,413) 165,623
AIG shareholders’ equity:
Retained earnings 14,332 (3,558) 10,774
Accumulated other comprehensive income 6,336 145 6,481
Total AIG shareholders’ equity $ 104,951 $ (3,413) $ 101,538
Statement of Operations:
Equity in earnings of consolidated subsidiaries $ 5,222 $ 1,038 $ 6,260
Income (loss) from continuing operations before income tax benefit (1,044) 1,038 (6)
Income tax benefit (17,909) (1,786) (19,695)
Net income 16,865 2,824 19,689
Net income attributable to AIG Parent Company $ 17,798 $ 2,824 $ 20,622
Statement of Operations:
Equity in earnings of consolidated subsidiaries $ 18,040 $ 3,345 $ 21,385
Income from continuing operations before income tax benefit 12,932 3,345 16,277
Income tax expense 5,144 258 5,402
Net income 7,788 3,087 10,875
Loss from discontinued operations (2) (815) (817)
Net income attributable to AIG Parent Company $ 7,786 $ 2,272 $ 10,058
..................................................................................................................................................................................................................................
AIG 2012 Form 10-K362
December 31, 2011 As Previously Effect of As Currently
(in millions) Reported Change Reported
Year Ended December 31, 2011 As Previously Effect of As Currently
(dollars in millions) Reported Change Reported
Year Ended December 31, 2010 As Previously Effect of As Currently
(dollars in millions) Reported Change Reported

The Registrant adopted this standard on January 1, 2012 and included the Condensed Consolidating Statement of
Comprehensive Income (Loss).
The Registrant includes in its statement of income (loss) dividends from its subsidiaries and equity in undistributed
income (loss) of consolidated subsidiaries, which represents the net income (loss) of each of its wholly-owned
subsidiaries.
On December 1, 2009, the Registrant and the Federal Reserve Bank of New York (FRBNY) completed two
transactions that reduced the outstanding balance and the maximum amount of credit available under the FRBNY
Credit Facility by $25 billion. In connection with one of those transactions, the Registrant assigned $16 billion of its
obligation under the FRBNY Credit Agreement to a subsidiary. The Registrant subsequently settled its obligation to
the subsidiary with a $15.5 billion non-cash dividend from the subsidiary. The difference was recognized over the
remaining term of the FRBNY Credit Agreement as a reduction to interest expense. The remaining difference was
derecognized by AIG through earnings due to the repayment in January 2011 of all amounts owed under, and the
termination of, the FRBNY Credit Facility.
Certain prior period amounts have been reclassified to conform to the current period presentation.
The five-year debt maturity schedule is incorporated by reference from Note 15 to Consolidated Financial
Statements.
The Registrant files a consolidated federal income tax return with certain subsidiaries and acts as an agent for the
consolidated tax group when making payments to the Internal Revenue Service. The Registrant and its subsidiaries
have adopted, pursuant to a written agreement, a method of allocating consolidated Federal income taxes. Amounts
allocated to the subsidiaries under the written agreement are included in Due to Affiliates in the accompanying
Condensed Balance Sheets.
Income taxes in the accompanying Condensed Balance Sheets are comprised of the Registrant’s current and
deferred tax assets, the consolidated group’s current income tax receivable, deferred taxes related to tax attribute
carryforwards of AIG’s U.S. consolidated income tax group and a valuation allowance to reduce the consolidated
deferred tax asset to an amount more likely than not to be realized. See Note 24 to the Consolidated Financial
Statements for additional information.
The consolidated U.S. deferred tax asset for net operating loss, capital loss and tax credit carryforwards and
valuation allowance are recorded by the Parent Company, which files the consolidated U.S. Federal income tax
return, and are not allocated to its subsidiaries. Generally, as, and if, the consolidated net operating losses and other
tax attribute carryforwards are utilized, the intercompany tax balance will be settled with the subsidiaries.
..................................................................................................................................................................................................................................
AIG 2012 Form 10-K 363

Schedule III
At December 31, 2012, 2011 and 2010 and for the years then ended
2012
AIG Property Casualty
AIG Life and Retirement
Mortgage Guaranty
Other
2011
AIG Property Casualty $ 2,375 $ 91,686 $ 23,236 $ 26 $ 35,689 $ 4,348 $ 27,949 $ 4,324 $ 6,539 $ 34,840
AIG Life and Retirement 6,502 30,607 – 880 5,218 9,882 9,132 1,142 2,085 –
Mortgage Guaranty 25 3,104 229 – 792 132 834 20 167 801
Other 35 65 – 5 (4) 393 2 – (333) –
$ 8,937 $ 125,462 $ 23,465 $ 911 $ 41,695 $ 14,755 $ 37,917 $ 5,486 $ 8,458 $ 35,641
2010
AIG Property Casualty $ 2,099 $ 90,026 $ 23,573 $ 21 $ 32,521 $ 4,392 $ 27,867 $ 3,894 $ 6,207 $ 31,612
AIG Life and Retirement 7,258 28,192 – 686 5,230 10,768 8,754 1,086 2,206 –
Mortgage Guaranty 32 3,907 230 – 975 1,941 500 26 245 756
Divested Businesses – – – – 9,266 3,963 8,719 814 1,821 –
Other 42 294 – 5 37 (130) 39 1 (316) –
$ 9,431 $ 122,419 $ 23,803 $ 712 $ 48,029 $ 20,934 $ 45,879 $ 5,821 $ 10,163 $ 32,368
(a) Liability for unpaid claims and claims adjustment expense with respect to the General Insurance operations are net of discounts of
$3.25 billion, $3.18 billion and $3.22 billion at December 31, 2012, 2011 and 2010, respectively.
(b) Reflected in insurance balances payable in the accompanying Consolidated Balance Sheet.
..................................................................................................................................................................................................................................
AIG 2012 Form 10-K364
Supplementary Insurance Information
Liability
for Unpaid
Claims and
Claims Losses Amortization
Deferred Adjustment Reserve Policy Premiums and Loss of Deferred
Policy Expense, for and and Net Expenses Policy Other Net
Acquisition Future Policy Unearned Contract Policy Investment Incurred, Acquisition Operating Premiums
Segment (in millions) Costs Benefits(a) Premiums Claims(b) Fees Income Benefits Costs Expenses Written
$ 2,441 $ 90,011 $ 22,161 $ 24 $ 34,873 $ 4,820 $ 25,785 $ 4,761 $ 7,317 $ 34,436
5,672 32,288 – 856 5,219 10,755 9,977 931 2,079 –
44 1,957 376 – 715 146 659 17 177 858
25 75 – 9 (5) 4,622 (82) – (338) –
$ 8,182 $ 124,331 $ 22,537 $ 889 $ 40,802 $ 20,343 $ 36,339 $ 5,709 $ 9,235 $ 35,294

Schedule IV
At December 31, 2012, 2011 and 2010 and for the years then ended
2012
Long-duration insurance in force
Premiums:
AIG Property Casualty
AIG Life and Retirement
Mortgage Guaranty
Divested businesses
Eliminations
Total premiums
2011
Long-duration insurance in force $ 918,982 $ 140,156 $ 643 $ 779,469 0.1%
AIG Property Casualty $ 41,710 $ 9,901 $ 3,031 $ 34,840 8.7%
AIG Life and Retirement 3,085 591 19 2,513 0.8
Mortgage Guaranty 898 97 – 801 –
Divested businesses 15 6 2 11 18.2
Eliminations – (5) (5) – –
Total premiums $ 45,708 $ 10,590 $ 3,047 $ 38,165 8.0%
2010
Long-duration insurance in force(a) $ 891,145 $ 148,605 $ 1,220 $ 743,760 0.2%
Premiums:
AIG Property Casualty $ 38,965 $ 9,795 $ 2,442 $ 31,612 7.7%
AIG Life and Retirement 3,119 621 22 2,520 0.9
Mortgage Guaranty 927 169 (2) 756 (0.3)
Divested businesses 9,643 435 27 9,235(b) 0.3
Eliminations – (25) (25) – –
Total premiums $ 52,654 $ 10,995 $ 2,464 $ 44,123 5.6%
(a) Excludes long-duration insurance in force of $399.4 billion related to held-for-sale entities at December 31, 2010.
(b) Includes accident and health premiums of $1.57 billion in 2010.
..................................................................................................................................................................................................................................
AIG 2012 Form 10-K 365
Reinsurance
Percent of
Ceded to Assumed Amount
Gross Other from Other Assumed
(in millions) Amount Companies Companies Net Amount to Net
$ 918,260 $ 129,159 $ 458 $ 789,559 0.1%
$ 40,428 $ 9,420 $ 3,428 $ 34,436 10.0%
3,014 602 16 2,428 0.7
938 70 (10) 858 (1.2)
11 – – 11 –
– 7 7 – –
$ 44,391 $ 10,099 $ 3,441 $ 37,733 9.1%

Valuation and Qualifying Accounts
Schedule V
For the years ended December 31, 2012, 2011 and 2010
2012
Allowance for mortgage and
other loans receivable
Allowance for premiums and
insurances balances
receivable
Allowance for reinsurance
assets
Federal and foreign
valuation allowance for
deferred tax assets
2011
Allowance for mortgage and
other loans receivable $ 878 $ (18) $ (125) $ 22 $ – $ (55) $ 38 $ 740
Allowance for premiums and
insurances balances
receivable 515 63 (94) – – – – 484
Allowance for reinsurance
assets 492 (116) (63) – – – 51 364
Federal and foreign
valuation allowance for
deferred tax assets 27,548 (18,307) – – – – 1,806 11,047
2010
Allowance for mortgage and
other loans receivable $ 2,444 $ 348 $ (354) $ 125 $ (58) $ (1,635) $ 8 $ 878
Allowance for premiums and
insurances balances
receivable 537 87 (113) (2) – (7) 13 515
Allowance for reinsurance
assets 440 3 14 (4) – – 39 492
Federal and foreign
valuation allowance for
deferred tax assets 25,605 1,361 – 1,292 – – (710) 27,548
* Includes recoveries of amounts previously charged off and reclassifications to/from other accounts.
..................................................................................................................................................................................................................................
AIG 2012 Form 10-K366
AdditionsReclassified
Balance, Charged to Activity of to Assets of
Beginning Costs and Discontinued Businesses Divested Other Balance,
(in millions) of year Expenses Charge Offs Operations Held for Sale Businesses Changes* End of year
$ 740 $ (103) $ (43) $ (205) $ – $ – $ 16 $ 405
484 174 (36) – – – 2 624
364 (4) (1) – – – (21) 338
11,047 (1,907) – – – – (1,104) 8,036

Exhibit 12
Earnings:
Pre-tax income(a): $ 78 $ 20,246 $ (15,709) $ (104,323)
Add – Fixed charges 3,217 7,535 14,403 17,688
Adjusted Pre-tax income 3,295 27,781 (1,306) (86,635)
Fixed charges:
Interest expense $ 2,149 $ 6,333 $ 12,943 $ 15,113
Portion of rent expense representing interest 161 196 244 299
Interest credited to policy and contract holders 907 1,006 1,216 2,276
Total fixed charges $ 3,217 $ 7,535 $ 14,403 $ 17,688
Preferred stock dividend requirements $ – $ – $ 1,204 $ 400
Total fixed charges and preferred stock dividend
requirements $ 3,217 $ 7,535 $ 15,607 $ 18,088
Total fixed charges, excluding interest credited to policy
and contract holders $ 2,310 $ 6,529 $ 13,187 $ 15,412
Ratio of earnings to fixed charges:
Ratio 1.02 3.69 n/a n/a
Coverage deficiency n/a n/a $ (15,709) $ (104,323)
Ratio of earnings to fixed charges and preferred
stock dividends:
Ratio 1.02 3.69 n/a n/a
Coverage deficiency n/a n/a (16,913) (104,723)
Ratio of earnings to fixed charges, excluding interest
credited to policy and contract holders(b):
Ratio 1.43 4.26 n/a n/a
Coverage deficiency n/a n/a $ (14,493) $ (102,047)
(a) From continuing operations, excluding undistributed earnings (loss) from equity method investments and capitalized interest.
(b) The Ratio of earnings to fixed charges excluding interest credited to policy and contract holders removes interest credited to guaranteed
investment contract (GIC) policyholders and guaranteed investment agreement (GIA) contract holders. Such interest expenses are also removed
from earnings used in this calculation. GICs and GIAs are entered into by AIG’s subsidiaries. The proceeds from GICs and GIAs are invested in a
diversified portfolio of securities, primarily investment grade bonds. The assets acquired yield rates greater than the rates on the related
policyholders obligation or contract, with the intent of earning a profit from the spread.
..................................................................................................................................................................................................................................
AIG 2012 Form 10-K 367
COMPUTATION OF RATIOS OF EARNINGS TO FIXED CHARGES
Years Ended December 31,
(in millions, except ratios) 2012 2011 2010 2009 2008
$ 7,151
3,166
10,317
$ 2,054
148
964
$ 3,166
$ –
$ 3,166
$ 2,202
3.26
n/a
3.26
n/a
4.69
n/a

Exhibit 21
Percentageof Voting
SecuritiesJurisdiction of held byIncorporation or Immediate
As of December 31, 2012 Organization Parent(1)
American International Group, Inc. Delaware (2)
AIA Aurora LLC Delaware 100
AIG Capital Corporation Delaware 100
AIG Consumer Finance Group, Inc. Delaware 100
AIG Credit S.A. Poland 100
AIG Credit Corp. Delaware 100
A.I. Credit Consumer Discount Company Pennsylvania 100
A.I. Credit Corp. New Hampshire 100
AICCO, Inc. Delaware 100
AIG Credit Corp. of Canada Canada 100
AIG Equipment Finance Holdings, Inc. Delaware 100
AIG Commercial Equipment Finance, Inc. Delaware 100
AIG Commercial Equipment Finance Company, Canada Canada 100
AIG Global Asset Management Holdings Corp. Delaware 100
AIG Asset Management (Europe) Limited England 100
AIG Asset Management (Ireland) Limited Ireland 100
AIG Asset Management (U.S.), LLC Delaware 100
AIG Global Real Estate Investment Corp. Delaware 100
AIG Securities Lending Corp. Delaware 100
International Lease Finance Corporation California 100
Fleet Solutions Holdings Inc. Delaware 100
AeroTurbine, Inc. Delaware 100
AIG Federal Savings Bank The United States 100
AIG Financial Products Corp. Delaware 100
AIG-FP Matched Funding Corp. Delaware 100
AIG Matched Funding Corp. Delaware 100
AIG Management France S.A. France 90.07(3)
AIG Funding, Inc. Delaware 100
AIG Global Services, Inc. New Hampshire 100
AIG Life Insurance Company (Switzerland) Ltd. Switzerland 100
AIG Markets, Inc. Delaware 100
AIG Trading Group Inc. Delaware 100
AIG International Inc. Delaware 100
AIUH LLC Delaware 100
Chartis Inc. Delaware 100
Chartis Global Claims Services, Inc. Delaware 100
Chartis Claims, Inc. Delaware 100
Health Direct, Inc. Delaware 100
Chartis Global Services, Inc. Delaware 100
Chartis North America, Inc. New York 100
Chartis International, LLC Delaware 100
AIG APAC HOLDINGS PTE. LTD. Singpore 100
Chartis Singapore Insurance Pte. Ltd. Singpore 100
AIG Insurance New Zealand Limited New Zealand 100
..................................................................................................................................................................................................................................
AIG 2012 Form 10-K368
Subsidiaries of Registrant

Percentageof Voting
SecuritiesJurisdiction of held byIncorporation or Immediate
As of December 31, 2012 Organization Parent(1)
AIG Malaysia Insurance Berhad Malaysia 100
AIG Philippines Insurance, Inc. Philippines 100
AIG Vietnam Insurance Company Limited Vietnam 100
Chartis Australia Insurance Limited Australia 100
Chartis Insurance (Thailand) Public Company Limited Thailand 48.986
Chartis Insurance Hong Kong Limited Hong Kong 100
Chartis Taiwan Insurance Co., Ltd. Taiwan 100
PT AIG Insurance Indonesia Indonesia 61.21(4)
AIG MEA Holdings Limited United Arab Emirates 100
AIG CIS Investments, LLC Russian Federation 100
AIG Insurance Company, CJSC Russian Federation 100
AIG Shared Services Corporation New York 100
AIU Insurance Company New York 100
AIG Insurance Company China Limited China 100
American International Reinsurance Company, Ltd. Bermuda 100
AIG Seguros Mexico, S.A. de C.V. Mexico 100
Chartis Africa Holdings, Inc. Delaware 100
AIG Kenya Insurance Company Limited Kenya 66.67
Chartis Central Europe & CIS Insurance Holdings Corporation Delaware 100
UBB-AIG Insurance Company AD Bulgaria 40
Chartis Egypt Insurance Company S.A.E. Egypt 95.02
Chartis European Insurance Investments Inc. Delaware 100
Chartis Japan Holdings, LLC Delaware 100
Chartis Japan Capital Company, LLC Delaware 100
The Fuji Fire and Marine Insurance Company, Limited Japan 45.45(5)
American Fuji Fire & Marine Insurance Company Illinois 100
Fuji International Insurance Company Limited England 100
Fuji Life Insurance Company Ltd. Japan 100
Chartis Kazakhstan Insurance Company Joint Stock Company Kazakhstan 100
Chartis Latin America Investments, LLC Delaware 100
Chartis Seguros Guatemala, S.A. Guatemala 100
Chartis Memsa Holdings, Inc. Delaware 100
AIG Sigorta A.S. Turkey 100
CHARTIS Investment Holdings (Private) Limited Sri Lanka 100
AIG Insurance Limited Sri Lanka 100
Chartis Iraq, Inc. Delaware 100
CHARTIS Lebanon S.A.L. Lebanon 100
Chartis Libya, Inc. Delaware 100
Tata AIG General Insurance Company Limited India 26
Chartis Overseas Limited Bermuda 100
AIG Cyprus Limited Cyprus 100
AIG Israel Insurance Company Ltd. Israel 50.01
AIG Luxembourg Financing Limited England 100
AIG MEA Limited United Arab Emirates 100
AIG Seguros Colombia S.A. Colombia 96.58(6)
AIG Uganda Limited Uganda 100
American International Underwriters del Ecuador S.A. Ecuador 100
..................................................................................................................................................................................................................................
AIG 2012 Form 10-K 369

Percentageof Voting
SecuritiesJurisdiction of held byIncorporation or Immediate
As of December 31, 2012 Organization Parent(1)
AIG-Metropolitana Cıa. de Seguros y Reaseguros del Ecuador S.A. Ecuador 32.06(7)
Arabian American Insurance Company (Bahrain) E.C. Bahrain 100
Chartis Chile Compania de Seguros Generales S.A. Chile 100
Chartis Global Management Company Limited Bermuda 100
Chartis Insurance Company-Puerto Rico Puerto Rico 100
AIG Insurance (Guernsey) PCC Limited Guernsey 100
Chartis Latin America I.I. Puerto Rico 100
Chartis Overseas Association Bermuda 67(8)
AIG Europe Holdings Limited England 58.54(9)
AIG Europe Financing Limited England 100
AIG Europe Sub Holdings Limited England 100
AIG Europe Limited England 100
AIG Germany Holding GmbH Germany 100
Chartis Romania S.A. Romania 100
Chartis Seguros Brasil S.A. Brazil 100
Chartis Seguros, El Salvador, Sociedad Anonima El Salvador 99.99(10)
Chartis Vida, Sociedad Anonima, Seguros de Personas El Salvador 99.99
Chartis Seguros Uruguay S.A. Uruguay 100
CHARTIS Takaful-Enaya B.S.C. (c) Bahrain 100
Chartis Uzbekistan Insurance Company Joint Venture LLC Uzbekistan 51
Hellas Insurance Co. S.A. Greece 50
Inversiones Segucasai, C.A. Venezuela 50(11)
C.A. de Seguros American International Venezuela 93.72
Johannesburg Insurance Holdings (Proprietary) Limited South Africa 100
AIG Life South Africa Limited South Africa 100
AIG South Africa Limited South Africa 100
La Meridional Compania Argentina de Seguros S.A. Argentina 95(12)
Underwriters Adjustment Company, Inc. Panama 100
Chartis Pacific Rim Holdings, L.L.C. Delaware 100
AIG Japan Holdings Kabushiki Kaisha Japan 100
JI Accident & Fire Insurance Company, Ltd. Japan 50
Chartis Non-Life Holding Company (Japan), Inc. Delaware 100
Chartis Trinidad and Tobago Insurance Company Limited Trinidad & Tobago 100
Chartis Ukraine Insurance Company PJSC Ukraine 94.221(13)
Global Information Services Private Limited India 50
Travel Guard Worldwide, Inc. Wisconsin 100
AIG Travel Assist, Inc. Delaware 100
Travel Guard Americas LLC Wisconsin 100
Travel Guard Asia Pacific Pte. Ltd. Singapore 100
Travel Guard EMEA Limited England 100
AIG Travel Insurance Agency, Inc. Texas 100
Livetravel, Inc. Wisconsin 100
Travel Guard Group Canada, Inc. Canada 100
Travel Guard Group, Inc. Delaware 100
WINGS International SAS France 100
Chartis U.S., Inc. Delaware 100
American Home Assurance Company New York 100
..................................................................................................................................................................................................................................
AIG 2012 Form 10-K370

Percentageof Voting
SecuritiesJurisdiction of held byIncorporation or Immediate
As of December 31, 2012 Organization Parent(1)
American International Realty Corp. Delaware 31.47(14)
Pine Street Real Estate Holdings Corp. New Hampshire 31.47(15)
Chartis Aerospace Insurance Services, Inc. Georgia 100
Chartis Canada Holdings Inc. Canada 100
Chartis Insurance Company of Canada Canada 100
Chartis Insurance Agency, Inc. New Jersey 100
Chartis Property Casualty Company Pennsylvania 100
Commerce and Industry Insurance Company New York 100
AIG Polska S.A. w Likwiadacji Poland 98.5(16)
Eaglestone Reinsurance Company Pennsylvania 100
Morefar Marketing, Inc. Delaware 100
National Union Fire Insurance Company of Pittsburgh, Pa. Pennsylvania 100
Chartis Specialty Insurance Company Illinois 100
Lexington Insurance Company Delaware 100
Chartis Excess Limited Ireland 100
Mt. Mansfield Company, Inc. Vermont 100
National Union Fire Insurance Company of Vermont Vermont 100
New Hampshire Insurance Company Pennsylvania 100
Chartis Casualty Company Pennsylvania 100
Granite State Insurance Company Pennsylvania 100
Illinois National Insurance Co. Illinois 100
New Hampshire Insurance Services, Inc. New Hampshire 100
Risk Specialists Companies, Inc. Delaware 100
Risk Specialists Companies Insurance Agency, Inc. Massachusetts 100
Agency Management Corporation Louisiana 100
The Gulf Agency, Inc. Alabama 100
Design Professionals Association Risk Purchasing Group, Inc. Illinois 100
The Insurance Company of the State of Pennsylvania Pennsylvania 100
AM Holdings LLC Delaware 100
American Security Life Insurance Company Limited Liechtenstein 100
Chartis Azerbaijan Insurance Company Open Joint Stock Company Azerbaijan 100
MG Reinsurance Limited Vermont 100
SAFG Retirement Services, Inc. Delaware 100
SunAmerica Financial Group, Inc. Texas 100
AGC Life Insurance Company Missouri 100
AIG Life of Bermuda, Ltd. Bermuda 100
American General Life Insurance Company Texas 100
AIG Advisor Group, Inc. Maryland 100
Financial Service Corporation Delaware 100
FSC Securities Corporation Delaware 100
Royal Alliance Associates, Inc. Delaware 100
SagePoint Financial, Inc. Delaware 100
Woodbury Financial Services, Inc. Minnesota 100
AIG Enterprise Services, LLC Delaware 100
American General Annuity Service Corporation Texas 100
American General Bancassurance Services, Inc. Illinois 100
SunAmerica Affordable Housing Partners, Inc. California 100
..................................................................................................................................................................................................................................
AIG 2012 Form 10-K 371

Percentageof Voting
SecuritiesJurisdiction of held byIncorporation or Immediate
As of December 31, 2012 Organization Parent(1)
SunAmerica Asset Management Corp. Delaware 100
SunAmerica Capital Services, Inc. Delaware 100
SunAmerica Retirement Markets, Inc. Maryland 100
SunAmerica Series Trust Massachusetts 100
The United States Life Insurance Company in the City of New York New York 100
The Variable Annuity Life Insurance Company Texas 100
Valic Retirement Services Company Texas 100
Knickerbocker Corporation Texas 100
SunAmerica Life Reinsurance Company Missouri 100
United Guaranty Corporation North Carolina 100
AIG United Guaranty Agenzia di Assicurazione S.R.L. Italy 100
AIG United Guaranty Insurance (Asia) Limited Hong Kong 100
AIG United Guaranty Mexico, S.A. Mexico 99.999999(17)
AIG United Guaranty Re Limited Ireland 100
United Guaranty Insurance Company North Carolina 100
United Guaranty Mortgage Insurance Company North Carolina 100
United Guaranty Mortgage Insurance Company of North Carolina North Carolina 100
United Guaranty Partners Insurance Company Vermont 100
United Guaranty Residential Insurance Company North Carolina 75.03(18)
United Guaranty Commercial Insurance Company of North Carolina North Carolina 100
United Guaranty Credit Insurance Company North Carolina 100
United Guaranty Mortgage Indemnity Company North Carolina 100
United Guaranty Residential Insurance Company of North Carolina North Carolina 100
United Guaranty Services, Inc. North Carolina 100
(1) Percentages include directors’ qualifying shares.
(2) Substantially all subsidiaries listed are consolidated in the accompanying financial statements. Certain subsidiaries have been omitted from the
tabulation. The omitted subsidiaries, when considered in the aggregate, do not constitute a significant subsidiary.
(3) Also owned 9.93 percent by AIG Matched Funding Corp.
(4) Also owned 38.79 percent by PT Tiara Citra Cemerlang.
(5) Also owned 38.84 percent by Chartis Non-Life Holding Company (Japan), Inc. and 15.71 percent by AIG Japan Holdings Kabushiki Kaisha.
(6) Also owned 3.42 percent by Chartis Insurance Company-Puerto Rico.
(7) Also owned 19.72 percent by Chartis Overseas Association.
(8) Also owned 12 percent by New Hampshire Insurance Company, 11 percent by National Union Fire Insurance Company of Pittsburgh, Pa., and
10 percent by American Home Assurance Company.
(9) Also owned 40.15 percent by Chartis Overseas Limited and 1.31 percent by AIG Luxembourg Financing Limited.
(10) Also owned 0.01 percent by Chartis Latin America Investments, LLC.
(11) Also owned 50 percent by Chartis Latin America Investments, LLC.
(12) Also owned 4.99 percent by Chartis Global Management Company Limited.
(13) Also 5.734 percent by Limited Liability Company with Foreign Investments Steppe Securities, and 0.022 percent by Chartis Central Europe &
CIS Insurance Holdings Corporation.
(14) Also owned 27 percent by New Hampshire Insurance Company, 22.06 percent by National Union Fire Insurance Company of Pittsburgh, Pa.,
5.75 percent by AIU Insurance Company, 5.05 percent by Commerce and Industry Insurance Company, 4.05 percent by The Insurance Company of
the State of Pennsylvania, 1.67 percent by Lexington Insurance Company, 1.62 percent by Chartis Property Casualty Company, 0.73 percent by
Illinois National Insurance Co., and 0.6 percent by Granite State Insurance Company.
..................................................................................................................................................................................................................................
AIG 2012 Form 10-K372

(15) Also owned 27 percent by New Hampshire Insurance Company, 22.06 percent by National Union Fire Insurance Company of Pittsburgh, Pa.,
5.75 percent by AIU Insurance Company, 5.05 percent by Commerce and Industry Insurance Company, 4.05 percent by The Insurance Company of
the State of Pennsylvania, 1.67 percent by Lexington Insurance Company, 1.62 percent by Chartis Property Casualty Company, 0.73 percent by
Illinois National Insurance Co., and 0.6 percent by Granite State Insurance Company.
(16) Also owned 0.75 percent by AIU Insurance Company.
(17) Also owned 0.000001 percent by United Guaranty Services, Inc.
(18) Also owned 24.97 percent by United Guaranty Residential Insurance Company of North Carolina.
..................................................................................................................................................................................................................................
AIG 2012 Form 10-K 373

Exhibit 23
We hereby consent to the incorporation by reference in the Registration Statements on Form S-8 (No. 2-45346,
No. 2-75875, No. 2-78291, No. 2-91945, No. 33-18073, No. 33-57250, No. 333-48639, No. 333-58095,
No. 333-70069, No. 333-83813, No. 333-31346, No. 333-39976, No. 333-45828, No. 333-50198, No. 333-52938,
No. 333-68640, No. 333-101640, No. 333-101967, No. 333-108466, No. 333-111737, No. 333-115911,
No. 333-148148 and No. 333-168679) and Form S-3 (No. 333-182469, No. 333-160645, No. 333-74187,
No. 333-106040, No. 333-132561, No. 333-150865 and No. 333-143992) of American International Group, Inc. of our
report dated February 21, 2013 relating to the financial statements, financial statement schedules and the
effectiveness of internal control over financial reporting, which appears in this Annual Report on Form 10-K.
/s/ PricewaterhouseCoopers LLP
New York, New York
February 21, 2013
..................................................................................................................................................................................................................................
AIG 2012 Form 10-K374
CONSENT OF INDEPENDENT REGISTERED PUBLIC ACCOUNTING FIRM

Exhibit 23.1
We hereby consent to the incorporation by reference in the Registration Statements on Form S-8 (No. 2-45346,
No. 2-75875, No. 2-78291, No. 2-91945, No. 33-18073, No. 33-57250, No. 333-48639, No. 333-58095,
No. 333-70069, No. 333-83813, No. 333-31346, No. 333-39976, No. 333-45828, No. 333-50198, No. 333-52938,
No. 333-68640, No. 333-101640, No. 333-101967, No. 333-108466, No. 333-111737, No. 333-115911,
No. 333-148148 and No. 333-168679) and Form S-3 (No. 333-182469, No. 333-160645, No. 333-74187,
No. 333-106040, No. 333-132561, No. 333-150865 and No. 333-143992) of American International Group, Inc. of our
report dated 24 February 2012 relating to the consolidated financial statements of AIA Group Limited, which appears
in this Annual Report on Form 10-K.
/s/ PricewaterhouseCoopers LLP
Hong Kong
21 February 2013
..................................................................................................................................................................................................................................
AIG 2012 Form 10-K 375
CONSENT OF INDEPENDENT ACCOUNTANTS

Exhibit 31
I, Robert H. Benmosche, certify that:
1. I have reviewed this Annual Report on Form 10-K of American International Group, Inc.;
2. Based on my knowledge, this report does not contain any untrue statement of a material fact or omit to state a
material fact necessary to make the statements made, in light of the circumstances under which such statements
were made, not misleading with respect to the period covered by this report;
3. Based on my knowledge, the financial statements, and other financial information included in this report, fairly
present in all material respects the financial condition, results of operations and cash flows of the registrant as of,
and for, the periods presented in this report;
4. The registrant’s other certifying officer and I are responsible for establishing and maintaining disclosure controls
and procedures (as defined in Exchange Act Rules 13a-15(e) and 15d-15(e)) and internal control over financial
reporting (as defined in Exchange Act Rules 13a-15(f) and 15d-15(f)) for the registrant and have:
(a) Designed such disclosure controls and procedures, or caused such disclosure controls and procedures to be
designed under our supervision, to ensure that material information relating to the registrant, including its
consolidated subsidiaries, is made known to us by others within those entities, particularly during the period in
which this report is being prepared;
(b) Designed such internal control over financial reporting, or caused such internal control over financial
reporting to be designed under our supervision, to provide reasonable assurance regarding the reliability of
financial reporting and the preparation of financial statements for external purposes in accordance with generally
accepted accounting principles;
(c) Evaluated the effectiveness of the registrant’s disclosure controls and procedures and presented in this
report our conclusions about the effectiveness of the disclosure controls and procedures, as of the end of the
period covered by this report based on such evaluation; and
(d) Disclosed in this report any change in the registrant’s internal control over financial reporting that occurred
during the registrant’s most recent fiscal quarter (the registrant’s fourth fiscal quarter in the case of an annual
report) that has materially affected, or is reasonably likely to materially affect, the registrant’s internal control over
financial reporting; and
5. The registrant’s other certifying officer and I have disclosed, based on our most recent evaluation of internal
control over financial reporting, to the registrant’s auditors and the audit committee of the registrant’s board of
directors (or persons performing the equivalent functions):
(a) All significant deficiencies and material weaknesses in the design or operation of internal control over
financial reporting which are reasonably likely to adversely affect the registrant’s ability to record, process,
summarize and report financial information; and
(b) Any fraud, whether or not material, that involves management or other employees who have a significant
role in the registrant’s internal control over financial reporting.
Date: February 21, 2013
/s/ ROBERT H. BENMOSCHE
Robert H. Benmosche
President and Chief Executive Officer
..................................................................................................................................................................................................................................
AIG 2012 Form 10-K376
CERTIFICATIONS

I, David L. Herzog, certify that:
1. I have reviewed this Annual Report on Form 10-K of American International Group, Inc.;
2. Based on my knowledge, this report does not contain any untrue statement of a material fact or omit to state a
material fact necessary to make the statements made, in light of the circumstances under which such statements
were made, not misleading with respect to the period covered by this report;
3. Based on my knowledge, the financial statements, and other financial information included in this report, fairly
present in all material respects the financial condition, results of operations and cash flows of the registrant as of,
and for, the periods presented in this report;
4. The registrant’s other certifying officer and I are responsible for establishing and maintaining disclosure controls
and procedures (as defined in Exchange Act Rules 13a-15(e) and 15d-15(e)) and internal control over financial
reporting (as defined in Exchange Act Rules 13a-15(f) and 15d-15(f)) for the registrant and have:
(a) Designed such disclosure controls and procedures, or caused such disclosure controls and procedures to be
designed under our supervision, to ensure that material information relating to the registrant, including its
consolidated subsidiaries, is made known to us by others within those entities, particularly during the period in
which this report is being prepared;
(b) Designed such internal control over financial reporting, or caused such internal control over financial
reporting to be designed under our supervision, to provide reasonable assurance regarding the reliability of
financial reporting and the preparation of financial statements for external purposes in accordance with generally
accepted accounting principles;
(c) Evaluated the effectiveness of the registrant’s disclosure controls and procedures and presented in this
report our conclusions about the effectiveness of the disclosure controls and procedures, as of the end of the
period covered by this report based on such evaluation; and
(d) Disclosed in this report any change in the registrant’s internal control over financial reporting that occurred
during the registrant’s most recent fiscal quarter (the registrant’s fourth fiscal quarter in the case of an annual
report) that has materially affected, or is reasonably likely to materially affect, the registrant’s internal control over
financial reporting; and
5. The registrant’s other certifying officer and I have disclosed, based on our most recent evaluation of internal
control over financial reporting, to the registrant’s auditors and the audit committee of the registrant’s board of
directors (or persons performing the equivalent functions):
(a) All significant deficiencies and material weaknesses in the design or operation of internal control over
financial reporting which are reasonably likely to adversely affect the registrant’s ability to record, process,
summarize and report financial information; and
(b) Any fraud, whether or not material, that involves management or other employees who have a significant
role in the registrant’s internal control over financial reporting.
Date: February 21, 2013
/s/ DAVID L. HERZOG
David L. Herzog
Executive Vice President
and Chief Financial Officer
..................................................................................................................................................................................................................................
AIG 2012 Form 10-K 377
CERTIFICATIONS

Exhibit 32
In connection with this Annual Report on Form 10-K of American International Group, Inc. (the ‘‘Company’’) for the
year ended December 31, 2012, as filed with the Securities and Exchange Commission on the date hereof (the
‘‘Report’’), I, Robert H. Benmosche, President and Chief Executive Officer of the Company, certify, pursuant to 18
U.S.C. Section 1350, that to my knowledge:
(1) The Report fully complies with the requirements of Section 13(a) or 15(d), as applicable, of the Securities
Exchange Act of 1934; and
(2) The information contained in the Report fairly presents, in all material respects, the financial condition and
results of operations of the Company.
Date: February 21, 2013
/s/ ROBERT H. BENMOSCHE
Robert H. Benmosche
President and Chief Executive Officer
The foregoing certification is being furnished solely pursuant to 18 U.S.C. Section 1350 and is not being filed as part
of the Report or as a separate disclosure document.
..................................................................................................................................................................................................................................
AIG 2012 Form 10-K378
CERTIFICATION

In connection with this Annual Report on Form 10-K of American International Group, Inc. (the ‘‘Company’’) for the
year ended December 31, 2012, as filed with the Securities and Exchange Commission on the date hereof (the
‘‘Report’’), I, David L. Herzog, Executive Vice President and Chief Financial Officer of the Company, certify, pursuant
to 18 U.S.C. Section 1350, that to my knowledge:
(1) The Report fully complies with the requirements of Section 13(a) or 15(d), as applicable, of the Securities
Exchange Act of 1934; and
(2) The information contained in the Report fairly presents, in all material respects, the financial condition and
results of operations of the Company.
Date: February 21, 2013
/s/ DAVID L. HERZOG
David L. Herzog
Executive Vice President and Chief Financial Officer
The foregoing certification is being furnished solely pursuant to 18 U.S.C. Section 1350 and is not being filed as part
of the Report or as a separate disclosure document.
..................................................................................................................................................................................................................................
AIG 2012 Form 10-K 379
CERTIFICATION

Exhibit 99.02
Common Stock, Par Value $2.50 Per Share New York Stock Exchange
Warrants (expiring January 19, 2021) New York Stock Exchange
5.75% Series A-2 Junior Subordinated Debentures New York Stock Exchange
4.875% Series A-3 Junior Subordinated Debentures New York Stock Exchange
6.45% Series A-4 Junior Subordinated Debentures New York Stock Exchange
7.70% Series A-5 Junior Subordinated Debentures New York Stock Exchange
Stock Purchase Rights New York Stock Exchange
..................................................................................................................................................................................................................................
AIG 2012 Form 10-K380
SECURITIES REGISTERED PURSUANT TO SECTION 12(b) OF THE ACT:
Name of Each ExchangeTitle of Each Class on Which Registered

Shareholder Information
Corporate HeadquartersAmerican International Group, Inc.180 Maiden LaneNew York, New York 10038(212) 770-7000
Listings and CertificationsStock Market ListingsNew York and Tokyo Stock ExchangesNYSE common stock trading symbol: AIG
SEC CertificationsThe certifications by the Chief Executive Officer and the Chief Financial Officer of AIG, required under Section 302 of the Sarbanes-Oxley Act of 2002, were filed as exhibits to AIG’s Annual Report on Form 10-K for 2012 and are included herein.
NYSE CertificationThe Chief Executive Officer of AIG made an unqualified certification to the NYSE with respect to AIG’s compliance with the NYSE Corporate Governance Listing Standards in May 2012.
Annual Meeting of ShareholdersThe 2013 Annual Meeting of Shareholders will be held on Wednesday, May 15, 2013, at 11:00 a.m., at 180 Maiden Lane, New York, New York.
Shareholder AssistanceVisit the AIG corporate website at www.aig.com. Requests for copies of the Annual Report to Shareholders and Annual Report on Form 10-K for the year ended December 31, 2012, should be directed to:Investor RelationsAmerican International Group, Inc.180 Maiden LaneNew York, New York 10038(212) 770-6293
Transfer Agent and RegistrarWells Fargo Bank, N.A.Shareowner ServicesPO Box 64854St. Paul, MN 55164-0854(888) 899-8293shareowneronline.com
Courier Service AddressWells Fargo Bank, N.A.Shareowner Services1110 Centre Pointe Curve, Suite 101Mendota Heights, MN 55120-4100
Duplicate Mailings/ HouseholdingA shareholder who receives multiple copies of AIG’s proxy materials and Annual Report may eliminate duplicate report mailings by contacting AIG’s transfer agent.
Design: Graphic Expression, Inc., www.tgenyc.com

American International Group, Inc.
180 Maiden LaneNew York, NY 10038www.aig.com