bringing accountability to life - acenet.edu · bringing accountability to life voices from the...
TRANSCRIPT
Bringing Accountability to Life
Viewpoints: Voices from the Field
1
Voices from the FieldViewpointsAmericanCouncil on Education
CENTER FOR POLICY RESEARCH AND STRATEGY
Bringing Accountability to LifeHow Savvy Data Users Find the “Actionable N” to Improve Equity and Sustainability in Higher Education
Alicia C. Dowd, Keith Witham, Debbie Hanson, Cheryl D. Ching, Román Liera, Marlon Fernandez Castro
ACE and the American Council on Education are registered marks of the American Council on Education and may not be used or reproduced without the express written permission of ACE.
American Council on EducationOne Dupont Circle NWWashington, DC 20036
© 2018. All rights reserved. No part of this publication may be reproduced or transmitted in any form or by any means electronic or mechanical, including photocopying, recording, or by any information storage and retrieval system, without permission in writing from the publisher.
AmericanCouncil on Education
Bringing Accountability to Life:How Savvy Data Users Find the “Actionable N”
to Improve Equity and Sustainability in Higher EducationAlicia C. Dowd, Keith Witham, Debbie Hanson,
Cheryl D. Ching, Román Liera, Marlon Fernandez Castro
Bringing Accountability to Life:How Savvy Data Users Find the “Actionable N”
to Improve Equity and Sustainability in Higher EducationAlicia C. Dowd, Keith Witham, Debbie Hanson,
Cheryl D. Ching, Román Liera, Marlon Fernandez Castro
Suggested citation: Dowd, Alicia C., Keith Witham, Debbie Hanson, Cheryl D. Ching, Román Liera, and Marlon Fernandez Castro. 2018. Bringing Accountability to Life: How Savvy Data Users Find the “Actionable N” to Improve Equity and Sustainability in Higher Education. Washington, DC: American Council on Edu-cation, The Pennsylvania State University Center for the Study of Higher Education, and the University of Southern California Center for Urban Education.
Cover photo courtesy of ACE member institution St. Thomas University (FL).
ACKNOWLEDGMENTS
This report is based on the study of Data Use and Organizational Learning Under Conditions of Account-ability in Higher Education, which was funded by the Spencer Foundation. The authors are grateful for early guidance provided by members of the study’s advisory group: David Longanecker and Anna Neumann (co-chairs), Michael Bastedo, Stella Flores, John Morgan, and Dominique Raymond. We also greatly appreci-ate valuable insights on the study design, findings, and recommendations provided by Estela Mara Bensi-mon, director of the Center for Urban Education and the originator of the Equity Scorecard.
About the AuthorsAll of the researchers were affiliated with the Center for Urban Education (CUE) at the University of Southern California at the outset of this study. Alicia C. Dowd is now a professor at The Pennsylvania State University Center for the Study of Higher Education (CSHE); Keith Witham is deputy director, College Excellence Program, the Aspen Institute; Debbie Hanson is a senior project specialist, Cheryl D. Ching a postdoctoral scholar and research associate, and Román Liera a research assistant and doctoral candidate at CUE; and Marlon Fernandez Castro is a doctoral student at Penn State, where he is also a CSHE research assistant. Correspondence about this report should be addressed to Alicia C. Dowd by emailing [email protected].
Center for Policy Research and StrategyACE’s Center for Policy Research and Strategy (CPRS) pursues thought leadership at the intersection of public policy and institutional strategy. CPRS provides senior postsecondary leaders and public policymakers with an evidence base to responsibly promote emergent practices in higher education with an emphasis on long-term and systemic solutions for an evolving higher education landscape and changing American demographic.
American Council on EducationThe American Council on Education is a membership organization that mobilizes the higher education community to shape effective public policy and foster innovative, high-quality practice.
Bringing Accountability to Life
Viewpoints: Voices from the Field
v
EXECUTIVE SUMMARYEquity and effectiveness are two principles for administrative, curricular, and pedagogical decision making in higher education. They are invoked in many accountability policies. In this context, equitable policies and practices are those that close gaps in college access, quality of experience, and degree outcomes that currently exist between members of traditionally privileged and traditionally marginalized racial, ethnic, and socioeconomic groups. Effective policies and practices are those that enable an institution to realize its mission while sustaining itself financially to meet the needs of future generations. Institutions of higher education have multifaceted missions, which often makes it difficult to gauge effectiveness. In this context, state and federal policymakers are adopting accountability policies that require college administrators to evaluate their judgments through contextualized data use and reporting.
This report provides a humanistic perspective on data-informed decision making in higher education. It identifies and celebrates the many ways savvy data users in institutions of higher education are helping college students navigate barriers to academic success and—even more importantly—taking steps to remove those barriers. The technical and humanistic aspects of data use are both important, but data do not drive decisions—people do. Illustrating the need for “different data for different folks,” this report highlights the valuable uses of administrative data, which are organic in nature, and of accountability data, which are syn-thetic in nature.
Accountability data are not typically used in the daily work of managing the flow of students through administrative and academic systems. To address this problem, savvy educational leaders are beginning to provide opportunities for faculty and staff to find the “actionable N” by making fine-grained, disaggre-gated data available for regular use. To promote enlivened uses of data, they are providing faculty, staff, and administrators with time and space to unpack the meaning of the key performance indicators (KPIs) of accountability data. The “actionable N” differs depending on a person’s role. It is the number that grabs people’s attention and motivates them to action where action is needed in their own area of work to ensure quality, equity, and effectiveness.
Key findings include:
• Used primarily for case management, administrative data exist within human and technical systems that are personalized, organic, and networked; they are populated by the individuals whose lives will be affected by the decisions made using the case data. Administrative data systems are inhabited, living data systems that enable humanistic data use motivated by an ethic of care.
• A well-supported, structured data use process that involves staff, faculty, and administrators in finding out where students are being lost engenders a willingness among these practitioners to revise the specific procedures, practices, and policies that trip students up on their academic journeys.
vi Bringing Accountability to Life
Viewpoints: Voices from the Field
• Staff, faculty, and administrators who gain knowledge and expertise in the use of institutional data begin to act as institutional “intrapreneurs”1 to improve institutional equity and effectiveness. Intrapreneurs create new ways of doing things after questioning whether existing practices are working and, if not, they ask, “Why not do this differently?”
The lessons of this study show that practitioners use accountability data and become reform-minded institutional intrapreneurs when they:
• Humanize data by breaking it down to a small “N.”
• Have access to disaggregated cohort data.
• Observe patterns in data that reveal specific cohorts of students who are not being well served by current practices and policies.
• Hold up a mirror to their own practices to assess what is working and what is not.
• Design new strategies for data use, shared governance, student advising, and program administra-tion.
Leaders and practitioners who wish to promote the enlivened use of accountability data should:
• Allow time, space, and resources for faculty, staff, and administrators to interactively define and access data for small cohorts of interest so that they can find the “actionable N.”
• Articulate the value of using data disaggregated by race and ethnicity based on equity as a stan-dard of practice.
• Provide professional development and incentives to faculty to act as data coaches on faculty com-mittees, including strategic planning, accreditation self-studies, department curriculum commit-tees, and program review committees.
1 The authors thank John Rajeski, who pointed out the relevance of the term “intrapreneur” in this context during a class discussion, when he was a doctoral student in the University of Southern California’s Rossier School of Education’s Organizational Change and Leadership Program.
Bringing Accountability to Life
Viewpoints: Voices from the Field
1
INTRODUCTIONWe know that data do not drive decision making—people do.2 Savvy college leaders use data in commu-nication with those around them for data-informed decision making of the highest quality. Many of those who design data use and accountability projects aim to drive decision making with data, but that is an ineffective approach. The ideal of accountability comes to life when people in colleges and universities use data to understand what is working—and what is not working—to provide the very best education to their students. The key performance indicators (KPIs) of higher education accountability have evolved over several decades in response to the realities of data use. Yet, with the exception of executive leaders who are directly responsible for reporting on their institutions’ performance to governing boards, these data remain largely unknown to and unused by the majority of faculty, staff, and administrators.3 Though KPIs are often carefully selected and designed, they are not as powerful as the personalized “strategic stories” of collective struggle and triumph that motivate so many college personnel to invest themselves deeply in the work of their institutions.4
The limitations of current data use practices matter because accountability—which is the “giving and receiving of accounts” among responsible parties and institutional stakeholders5—is too important to get wrong. At its best, performance accountability is a joint effort between policymakers, board members,
educational leaders, and educators to use public resources efficiently, effectively, and equitably. At its worst, it is a jumble of metrics, measures, and mandates that does not produce knowledge of what needs to change or help us understand how to change what is not working.
State and federal accountability goals and metrics express the values of public higher education. Data are a key ingredient for the ideals of accountability to be put in action by administrators, faculty, and staff.
2 For more on this point, see Alicia Dowd’s report Data Don’t Drive: Building a Practitioner-Driven Culture of Inquiry to Assess Community College Performance (2005).
3 This lack of practical use may be why performance-based funding data, one of the most common types of accountability data in higher education, has had limited observable impact on educational practice and on stu-dent success (Hillman, Tandberg, and Gross 2014; Rutherford and Rabovsky 2014).
4 Mark Walton, the author of Generating Buy-In: Mastering the Language of Leadership (2004), emphasizes the importance of telling strategic stories.
5 This definition of accountability is taken from the article “Accountability and Accounterability” by McKernan and McPhail (2012), who emphasize that “it is clear that the idea of accountability contains threads of both calcu-lation and narration: counting and accounting, recounting and explaining oneself.” They continue: “Boland and Schultze (1996), for example, insist that narrative and calculation are always intertwined in accountability: ‘each supplying the conditions for, and being enabled by, the other’: They remind us that the word ‘account’ has roots in both the French ‘a conter, meaning to tell a story’ and in the Latin ‘accomputare, meaning to compute’” (63).
Savvy data use involves putting the right data in the hands of the right people at
the right time.
2 Bringing Accountability to Life
Viewpoints: Voices from the Field
That is why we are currently experiencing a big push for big data and predictive analytics. However, accumulating and pushing out more and more data is not necessarily a winning strategy. Savvy data use involves putting the right data in the hands of the right people at the right time. Adapting an old adage, it is clear that we need “different data for different folks.”
Technocratic and humanistic approaches are both needed to use big and small data effectively. It is essential to use “small N” data to create racial equity in higher education, one of our nation’s most endur-ing and pressing challenges. At many institutions, the number of African American, American Indian,
WHY FOCUS ON USING DATA TO PROMOTE RACIAL EQUITY?
In an era of increased racial tension, emboldened hate speech, and conflicts concerning which racial and ethnic groups are experiencing disadvantage or privilege, it is beneficial to take a practical look at the ways colleges and universities provide equitable or stratified access to higher education. The term “equity” refers to a standard of justice that can be advanced through well-designed policies and practices.
Many educational leaders are searching for ways to communicate their institutional commitment to equity. In this arena, though words matter, actions speak louder than words. By using data to show that racial equity gaps in access to college and degrees are closing, educational leaders demon-strate accountability. By showing governing boards and the public the ways that staff, faculty, and administrators are using data to improve institutional performance, college and university leaders can articulate equity as a standard of practice that is beneficial to all students and to society as a whole. Broadening access to higher education for African American, American Indian, Latinx, Southeast Asian, and low-income students is both a social and economic imperative for institutions in states with a declining high school population.
Educational leaders who adopt equity as a standard of practice advance higher education’s respon-sibility to promote the public good. Equity is a relational term that expresses a vision of a just society. It is not possible to have more equity for some students and less for others. We are all in this together. Inequitable practices affect all students and society negatively.
Educational leaders who hold equity as a standard of practice call on staff, faculty, and administra-tors to examine root causes of inequitable participation and success in academic programs among racial and ethnic groups. It is beneficial to set this standard because practitioners often assume without referencing any data that students are to blame. Such deficit-minded thinking allows poor advising, curricular, and administrative practices to remain in place. An equity-minded approach embraces the opportunity for data use that supports innovation and creativity in designing high-quality educational programs.
Bringing Accountability to Life
Viewpoints: Voices from the Field
3
Latinx, and Southeast Asian students still falls far below the share of these groups in the U.S. population and in the regions served by public state universities, which are the focus of this report.
This research report illustrates how, when, and where data are being used on university campuses to improve college performance. It recommends ways to enable greater numbers of faculty, staff, and administrators to use data to identify bottlenecks to student progress. Based on a case study of university faculty, administrators, and staff who were involved in a data use initiative designed to meet the needs of public accountability, it shows how savvy data users break data down into units of analysis that are actionable. Our focus here is on using data to promote racial equity in higher education, because college and university leaders today are searching for effective strategies to address racial disparities in educa-tional opportunity and attainment.
LESSONS FROM A CASE STUDY OF DATA USEThe setting of this case study is the Pennsylvania State System of Higher Education (PASSHE), where the board of governors revised the system’s performance-based funding (PBF)6 policy in 2010 as part of the board’s Strategic Initiatives.7 At that time, PASSHE leaders also contracted with the University of Southern California’s Center for Urban Education (CUE) to conduct CUE’s Equity Scorecard in all 14 universities of the system.8 The Equity Scorecard action research process, data tools, and strategies for “equity-minded” action guided PASSHE’s administrators, faculty, and staff as they became “data wise”9 in pursuit of the accountability goals set out in the system’s KPIs.10 These indicators included measures of student access and success, which were used to identify inequities in college participation and outcomes among income, racial, and ethnic groups.
6 Performance-based funding (PBF) is also referred to today as outcomes-based funding; we retain the term PBF to be consistent with the context of our study.
7 The development of PASSHE’s accountability goals at that time were described by John Cavanaugh and Peter Garland’s 2012 Change magazine article “Performance Funding in Pennsylvania.”
8 For a highly relevant report on the data tools of the Equity Scorecard, see Bensimon et al. 2012.
9 This apt expression was introduced by Boudett, City, and Murnane (2005) in their guide to data use in schools: Data Wise: A Step by Step Guide to Using Assessment Results to Improve Teaching and Learning.
10 At this time, PASSHE was also a participant in national efforts to improve higher education, including Access to Success, led by the National Association of System Heads (NASH), and the Deliverology initiative of the Educa-tional Delivery Institute (EDI).
Educational leaders who adopt equity as a standard of practice advance higher
education’s responsibility to promote the public good.
4 Bringing Accountability to Life
Viewpoints: Voices from the Field
Like PASSHE, many systems and institutions across the United States are seeking to use data better to inform improvements in institutional performance, especially to enhance equity and effectiveness. PASSHE universities are a particularly valuable setting to learn about savvy data use because PASSHE leaders invested in numerous initiatives to support organizational learning and data-informed decision making. PASSHE’s accountability standards were voluntarily adopted by the system leaders and chief academic officers as a way to communicate the PASSHE system’s value to legislators in a state with numerous public and private colleges and universities, each vying for public support.11
In 2013–15, with funding from the Spencer Foundation, researchers affiliated with the Center for Urban Education conducted a case study of five of the 14 PASSHE universities, meeting with and interviewing nearly 100 Equity Scorecard evidence team members and their colleagues who used data in their daily work routines.12 Study results add to our previously reported “lessons learned” about the most powerful uses of data to improve equity in college participation and outcomes among racial and ethnic groups.13
THE BEAUTY OF USING DATA CLOSE TO PRACTICEA student meets with a financial aid advisor to discuss her financial aid package.
A faculty member talks with a student after class to encourage him to consider applying for a fellowship.
The registrar calls the bursar to see if a hold on a student’s registration has been cleared up.
A program director learns that one of the program’s most active students has left the university.
With the exception of student-faculty interaction in classroom settings, the most common “actionable N” in higher education is very small; in fact, this N has a value of one. The most immediate and effec-tive data use happens during one-on-one interactions between students and faculty, students and staff members, and among staff, faculty, and administrators focused on individual student cases. An N of one brings data close to practice when staff, faculty, and administrators ask themselves, “What is the best course of action we can take to fulfill our responsibilities in this case?”
Data that are close to practice are organic: they represent human needs in real time and are constantly in flux. Organic data use is a quintessential productive activity “inside the black box” of higher education. It involves case-by-case management as faculty, staff, and administrators examine administrative data in admissions, enrollment, grading, financial aid, health care, and other systems that track student progress, learning, and well-being.
Data use that is close to practice is personalized and networked in living systems. Organic data sys-tems evolve over time in response to users’ needs. Users include state and federal officials who monitor compliance with data and resource-use policies, and administrators who track the core assets of colleges
11 For a history of accountability policies in PASSHE, see Cavanaugh and Garland 2012.
12 We present results without specifically naming the five universities in the case study in order to keep confidential the identities of individual participants.
13 See, for example, the case studies reported in Dowd and Bensimon 2015 and Bensimon and Malcom 2012.
Bringing Accountability to Life
Viewpoints: Voices from the Field
5
and universities: money, students, and personnel. Organic data systems develop in response to regula-tion by federal and state agencies and to the needs of students.14 Data users are networked horizontally with colleagues at their own and at other institutions. They are also networked vertically with regulators (who elicit compliance to changes in the data systems) and the people (most often students or college
personnel) who are depending on the resources tracked in the system. It may be counterintuitive to view highly bureaucratized systems as organic. However, if you really listen to financial aid administrators, human resources and affirmative action officers, and others in highly regulated areas, it becomes clear that well-developed, administrative data systems are used by faculty, staff, and administrators to serve students in very personalized ways that are simultaneously bureaucratic and deeply caring.
An example from the arena of enrollment management, a function of utmost importance in public, tuition-driven institutions, illustrates the use of organic data in a personalized and networked manner, close to practice. In lean budget times at a small- to mid-sized university, a decline in registration of a few dozen students is immediately seen and felt by the loss or reassignment of colleagues. The enrollment and success milestones that mark students’ journeys from application to admission to their hoped-for graduation in four years (or six, or eight, or even longer)—are coming under close scrutiny from a rev-enue perspective. There are many potential exit and reentry points along what is typically not a linear path to a degree. Numerous staff, administrators, and faculty have a hand in collecting and using enroll-ment data. Enrollment professionals and advisors play the role of case managers, advising students step by step in selecting courses, majors, and programs of study.
DIY DATA USE WITH AN ETHIC OF CAREAn ethic of care characterizes expert data use in enrollment management. Personalized attention to students and awareness of the critical need for enrollment revenues combine to make expert data use in this area highly interconnected among data users. Data resides in multiple data systems and streams of information. Even when the time comes for the official enrollment count (e.g., the fall census), data are fluid. A student has a registration hold, but then it is cleared. An athlete’s course schedule conflicts with practice times, and it must be changed. A full-time student takes on more hours at work, drops a class, and shifts into part-time status. The census date arrives and, midstream in this constant flow, a numerical snapshot captures the annual fall enrollment count for the university’s federal Integrated Postsecondary Education Data System (IPEDS) entry.
14 Responsive data use develops equally in response to the needs of personnel (as to students); for example, through the work of human resource and equal opportunity offices. In this report, given the accountability emphasis on producing more college graduates, the focus here is on examples involving students.
Data use that is close to practice is personalized and networked in living systems.
6 Bringing Accountability to Life
Viewpoints: Voices from the Field
Yet, students’ lives and schedules are still in flux. To address this fluidity, administrators and staff members create interim data records that often reside outside the official university data. Staff members simultaneously manage interim and official data in interaction with students and colleagues, knowing when to capture information as part of the record and when to wait until special circumstances get sorted out. While still ensuring compliance, they “MacGyver” the record, creating a workaround that ensures students do not get double counted or lost in the system.
A popular expression based on a 1980s U.S. television series, to “MacGyver” something is to trouble-shoot a problem and devise a clever solution using the most basic materials at hand (e.g., a paper clip, a pad of paper, or a sticky note). Due to budget cuts and inadequate information technology resources, staff members in our study found themselves using a variety of manual strategies to track students and resources. They carried out these tasks in the best of the do-it-yourself (DIY) tradition. As study partici-pants informed us, their DIY workarounds are quite varied and labor intensive. Staff described detailed “hand audits” and creative strategies to “pull data from multiple places.” Data systems that were meant to streamline data use were often not functional or trustworthy. One staff member exclaimed, “Half of my day is spent either configuring programs, testing, [or] trying to find out what’s wrong if a student’s account doesn’t look right.”
The value of the small “N” is often overlooked. “Data is hard to get,” an administrator at one institution said, adding, “We can get the university level data easily; small data is harder.” Yet, handcrafted, small data are oftentimes needed when staff would like to direct resources to students who need them the most. Compounding the challenges of data use, the academic records of students who entered college through special programs were not always systematically incorporated into the main university databases. Staff members worked twice as hard to sort out data from “on ramp” programs (such as summer start-up terms) and pathways (such as transfer). Because access programs disproportionately serve students of color, the inefficiencies of these systems were also having a disparate and inequitable impact.
What motivates the MacGyvers of student advising, academic affairs, enrollment, financial aid, and other administrative offices to interact with complex (and often confusing) administrative data systems in a humane rather than a bureaucratic way? These faculty, staff, and administrators are innovative and resourceful because they have a focus on responding to the student who is standing in front of them, a student who has an educational need that they can help meet. They see students as individuals and in community with those around them; they speak of them as “our students,” not as “those students.” Just as a party host would be alarmed if a dinner guest rushed out midway through a meal, if a student abruptly leaves the university, these professionals who use data with an ethic of care want to know why.
While MacGyver the TV character was a white male, the DIY experts of higher education located in advising and enrollment management offices are predominantly female, and in numbers dispropor-tionate to other functional areas, many are staff members of color. In our case study, African American female staff members played an especially important role connecting African American students to uni-versity resources. For example, one staff member went out of her way to carve out spaces where black stu-dents could confide in her and feel that their concerns had been heard and not judged. “There are some students who do need to be able to be real and say it the way it is and know that it’s heard,” she explained, adding, “for African American students, I would say that it’s good for them to know that I am here as a resource, and as an ear.” She and others acted as “institutional agents” for racially minoritized students, using their knowledge, resources, and relationships to help students navigate university bureaucracies and life in a predominantly white setting.
Bringing Accountability to Life
Viewpoints: Voices from the Field
7
In an era of public sector budget cuts and limited resources, the work of staff was further complicated by the fact that they were often excluded from planning sessions for projects involving the overhaul of aging data systems. The computer programming and systems redesign workforce is predominantly white and male. These information technologists carry out their work in a very different arena. Administrative leaders need to bring these groups of people with equally valuable skill sets together to empower staff and avoid problems. With greater investments in computer systems, investments in the human systems of data use must keep pace. Danger lies in investing in the realm of high tech without simultaneously investing in the student-centered workforce that has the nuts-and-bolts, DIY know-how concerning the quintessential work of the university that student information systems must support.
Private sector companies and not-for-profit organizations now offer data analysis services that aggre-gate years of student data to characterize patterns of student success and failure at specific points in the curriculum. These multivariate, predictive analyses can be powerful tools for change, but they need to be placed in the hands of knowledgeable student advisors. If the number of staff members, especially staff members of color who forge connections with students of color, is diminished to pay for data analytics services by outside companies, the equity and effectiveness of data use will be undermined.
Educational leaders who would like to create productive conditions for the formal and DIY uses of admin-istrative and accountability data should:
• Harness the DIY problem-solving spirit held by many staff members who routinely use data to tackle problems with the resources at hand. When redesigning student information systems, have IT staff members and consultants work collaboratively and with equal resources alongside student affairs personnel, administrative assistants, and academic advisors.
• Ensure that the MacGyvers of higher education have a seat at the table with the information tech-nologists to ensure that computing technology is useful to and does not displace the staff who do the most important student-centered work.
• Negotiate professional development and training opportunities for staff in contracts with data analytics providers, ensuring that they have capacity to use and offer needed modifications to data tools as they are adopted on campus.
• Create hybrid information technology-student advising positions and locate them in admissions, enrollment management, and student retention and success offices.
• Recognize the tremendous value of the ethic of care that motivates these DIY data users. Their personal touch means a lot to students and can make or break a student’s day. Their willingness to step up and troubleshoot may well be the action that sustains a student’s commitment to obtaining a degree.
With greater investments in computer systems, investments in the human systems
of data use must keep pace.
8 Bringing Accountability to Life
Viewpoints: Voices from the Field
DATA, DATA EVERYWHERE, BUT WHO WILL ANALYZE IT ALL? University leaders who want to promote savvy data use will face the challenge of getting data out of the hands of often overworked and inaccessible data gurus (typically located in the university’s institutional research office) and into the hands of staff, faculty, and administrators.
Equity Scorecard evidence teams in our case study were charged with analyzing numeric and qualitative data, identifying equity gaps in access, retention, graduation, and academic excellence (e.g., STEM, hon-ors programs), and recommending an action plan to senior administrators to close those gaps. PASSHE’s investment in structured data, guided by the inquiry process of the Equity Scorecard, made data available to evidence team members in ways they had not previously experienced. As one administrator explained, “We just haven’t had great access to data. . . . We’re still wrapping our minds around the fact that data may be available.”
Institutional researchers (IRs) played a key role in creating opportunities for meaningful data use, but there were not enough IRs to go around. As IRs interacted with faculty and staff colleagues who had an interest in producing actionable knowledge from data, they started to take on a teaching role. One IR who had served on an Equity Scorecard evidence team explained how her practices had changed as a result of interacting with colleagues to make sense of data. Where previously she may have prepared 30 slides for a presentation at a meeting, she began instead to select key data tables much more selectively, in order to make data “more equally consumable,” as she put it. This change was encouraging and satisfy-ing to her because her work became even more collegial and interactive.
I saw how the light bulbs went on, and then all of the sudden, because they understand [the data], they can talk about it, and they can ask other questions because they under-stand all the components of it.
This IR was enthusiastic about her new interactive mode of doing her work and embraced the IR-as-teacher mode.15 To see the “light bulb” going on as colleagues worked with her was motivating. As data users were interacting with her and each other, asking questions of the data, they were making
15 For a case study of IRs taking on the identity of data coach and teacher, see Dowd et. al 2012.
University leaders who want to promote savvy data use will face the challenge of getting
data out of the hands of often overworked and inaccessible data gurus and into the hands of
staff, faculty, and administrators.
Bringing Accountability to Life
Viewpoints: Voices from the Field
9
sense of it in ways they had not when the IR simply walked them through a PowerPoint presentation of graphs and tables.
Unfortunately, it seemed that almost as soon as Equity Scorecard evidence team members got a taste for data use, their access to data dried up. IRs were the keepers of the data on these campuses, increasingly overworked and in-demand as “data gurus.” Demands on their time were escalating. These time demands were exacerbated as a culture of data use emerged, where administrators at all levels were hoping to use data to make good decisions about where to devote resources and wanted to benefit from deeper interac-tions with IR staff. Noting that his university’s institutional researcher was often too busy to attend team meetings, one team leader said regretfully that “when he was able to be there, he was a very good team member.”
Staff and administrators who lacked the ability to replicate data reports doubted their chances of being able to measure impact over time. One university administrator who had learned the “hard lesson” about data quality identified a more fundamental concern. He was afraid the group would “have to begin again with perhaps a new data look” and “lose the idea” that had motivated their inquiry process. “I’m concerned about that,” he added, “because I think that a way to lose the incentive . . . the idea that this is something you need to care about, is to not be able to go back and take the same data look to compare where you are now with where you might have been, to demonstrate clearly that a recommendation, for example, had a positive impact in terms of closing that retention gap.” These examples indicate that lack of IR time and limited opportunities for learning about available data constrain productive data use.
To address these data use constraints, educational leaders should seek out ways to move data out of the hands of their often overworked and inaccessible data gurus in the IR offices and into the hands of fac-ulty, staff, and administrators who are equipped to ask and answer meaningful questions of institutional data. The strategies that will promote this goal include:
• Double or even triple the number of institutional research staff members.
• Improve data literacy campus-wide by increasing IR staff capacity to teach others about data sys-tems, variables, and definitions.
• Promote a teaching capacity and an IR-as-teacher identity among IR staff by providing profes-sional development opportunities that hone these skills.
• Write job descriptions and hire IR staff and officers with interest and capabilities to play a teaching role.
Unfortunately, it seemed that almost as soon as Equity Scorecard evidence team members got a taste for data use, their access to data dried up.
10 Bringing Accountability to Life
Viewpoints: Voices from the Field
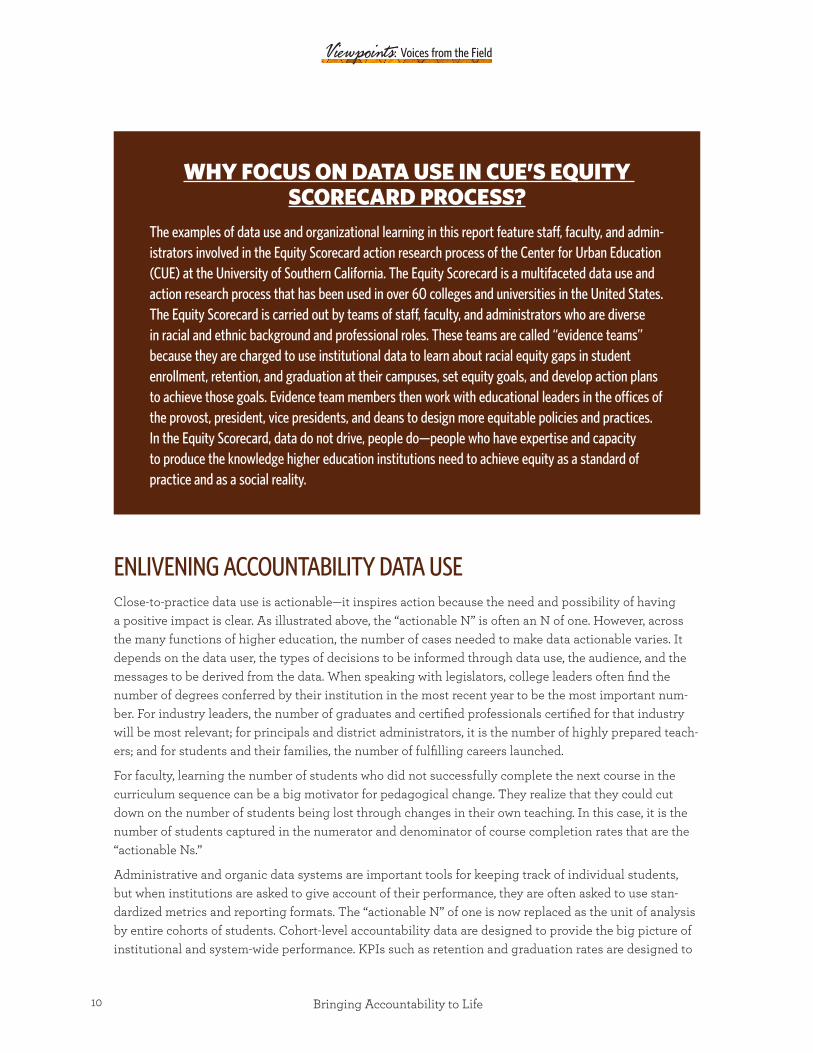
WHY FOCUS ON DATA USE IN CUE’S EQUITY SCORECARD PROCESS?
The examples of data use and organizational learning in this report feature staff, faculty, and admin-istrators involved in the Equity Scorecard action research process of the Center for Urban Education (CUE) at the University of Southern California. The Equity Scorecard is a multifaceted data use and action research process that has been used in over 60 colleges and universities in the United States. The Equity Scorecard is carried out by teams of staff, faculty, and administrators who are diverse in racial and ethnic background and professional roles. These teams are called “evidence teams” because they are charged to use institutional data to learn about racial equity gaps in student enrollment, retention, and graduation at their campuses, set equity goals, and develop action plans to achieve those goals. Evidence team members then work with educational leaders in the offices of the provost, president, vice presidents, and deans to design more equitable policies and practices. In the Equity Scorecard, data do not drive, people do—people who have expertise and capacity to produce the knowledge higher education institutions need to achieve equity as a standard of practice and as a social reality.
ENLIVENING ACCOUNTABILITY DATA USEClose-to-practice data use is actionable—it inspires action because the need and possibility of having a positive impact is clear. As illustrated above, the “actionable N” is often an N of one. However, across the many functions of higher education, the number of cases needed to make data actionable varies. It depends on the data user, the types of decisions to be informed through data use, the audience, and the messages to be derived from the data. When speaking with legislators, college leaders often find the number of degrees conferred by their institution in the most recent year to be the most important num-ber. For industry leaders, the number of graduates and certified professionals certified for that industry will be most relevant; for principals and district administrators, it is the number of highly prepared teach-ers; and for students and their families, the number of fulfilling careers launched.
For faculty, learning the number of students who did not successfully complete the next course in the curriculum sequence can be a big motivator for pedagogical change. They realize that they could cut down on the number of students being lost through changes in their own teaching. In this case, it is the number of students captured in the numerator and denominator of course completion rates that are the “actionable Ns.”
Administrative and organic data systems are important tools for keeping track of individual students, but when institutions are asked to give account of their performance, they are often asked to use stan-dardized metrics and reporting formats. The “actionable N” of one is now replaced as the unit of analysis by entire cohorts of students. Cohort-level accountability data are designed to provide the big picture of institutional and system-wide performance. KPIs such as retention and graduation rates are designed to
Bringing Accountability to Life
Viewpoints: Voices from the Field
11
be compared over time and across institutions. These data are pulled from local institutional data sys-tems into university and system-wide institutional research offices to create a snapshot of institutional performance at designated points in time.
KPIs should ideally tell us how well public and not-for-profit institutions are doing in service to students, families, businesses, and communities—in other words, in service to the public good. They should enable public colleges and universities to show stakeholders that they are equitably and efficiently putting tax dollars to good use. However, the use of KPIs is not yet well integrated into the organizational routines of college administration. In terms of development over time, however, cohort-based accountability data sys-tems are younger siblings to the administrative systems of financial aid, admissions, and enrollment data, which have been built up over a much longer period of time. On any given campus it is typical that only a few people have sufficient working familiarity with the university’s accountability data to incorporate KPIs effectively into presentations about institutional effectiveness. The giving and receiving of accounts about institutional performance is impoverished by the lack of a critical mass of expert data users.
Aggregating individual student records, typical KPI metrics of access, retention, and graduation require numerators and denominators that group together cohorts of students for analysis. The personalized case management of administrative data users is replaced, for state-level accountability purposes, by standardized reporting of synthetic indicators. Aggregated accountability data are not inhabited by individual people in the same way as administrative data. Students’ needs and crises simply do not drive attention to accountability data in the same urgent way that life events compel caring use of administra-tive data.
To address this problem, savvy educational leaders are making time and space for data users on their campuses to gain expertise in the use of accountability data in their everyday work routines. By recogniz-ing the differences between the organic characteristics of administrative system data and the synthetic characteristics of accountability data, they support data use strategies that “enliven” the use of KPIs. Time is needed for administrators, faculty, and staff to learn what is measured in accountability metrics such as retention and graduation rates and to break down highly aggregated cohort data into actionable data. Spaces where this learning can occur include regular committee and department meetings, as well as task forces, accreditation self-studies, and presidential advisory groups. In our study, the time and space needed for inquiry into problems of institutional performance was created when provosts invited about a dozen staff, faculty, and administrators with diverse backgrounds and professional functions to act as an Equity Scorecard evidence team. Evidence teams analyzed institutional data from an equity- minded perspective to produce actionable knowledge about institutional strategies to promote equity.16
FINDING THE “ACTIONABLE N” IN ACCOUNTABILITY METRICSAs respondents in this study showed us, synthetic cohort data come to life when campus data users interpret the data on a human scale, at a nuts-and-bolts level where they know they can make a difference through their own work. We call the process of humanizing the data and catalyzing an action orientation “finding the actionable N.”
16 To learn more about the principles and practices of equity-minded data use, see the case studies provided by Bensimon and Malcom 2012.
12 Bringing Accountability to Life
Viewpoints: Voices from the Field
This experience was articulated by one administrator, who explained that when his university’s evidence team examined data relative to their Equity Scorecard goals, the tone of the meetings changed once they saw that “it only takes five or six students to do this.” They realized that equity goals were in reach and that they could make a difference. This realization activated a sense of professionalism. The conversation shifted from a discussion of a broad and seemingly unmovable social issue to “let’s talk about what we should do and what we can do.”
A faculty member who served on an Equity Scorecard evidence team articulated this same experience, explaining that the data his evidence team examined became meaningful to him when the institutional researcher “kept breaking down” the data, “trying to make it smaller and smaller.” He explained how using a small N made him realize that the changes needed to achieve equity goals were “doable.” The fac-ulty member continued, explaining that the university could achieve “small victories”: if “we retain four more students of color, five more students of color, six more students of color, look how much the [equity] gap has closed at that point, right?”
The lessons of this case study show that administrators, staff members, and faculty can find the “action-able N” in accountability data when data gets broken down into smaller units. Accountability data become actionable when practitioners work together to identify small “N” cohorts of students who they can reach out to specifically to achieve equity goals. This involves viewing students as “our” students, not as “those students,” a neglectful designation that befalls many students, especially students of color, who are admitted through college access programs.
Zooming out from the small “N” to the bigger picture, staff and administrators who also identified bot-tlenecks constricting the progress of specific groups of students at their university became motivated to change their policies and practices. When the large and amorphous cohorts of students represented in accountability data were broken down into smaller cohorts of students at particular places in their academic journeys, staff, faculty, and administrators saw that policies and practices within their control were barriers to student success. Examples of focal groups that were identified through fine-grained cohort analysis include transfer students, students who earn a D or an F or withdraw from introductory core courses (referred to as “DFWs”), first-generation students, and underrepresented racial and ethnic minority groups.
Each of the five universities in this case study used the action research process of the Equity Scorecard to identify several groups of students who were not being well served by the university’s matriculation policies. One group that received considerable attention included those being placed into the status of “pre-major” or “undeclared major.” Looking at fine-grained cohort statistics on students who were not in good academic standing, one administrator exclaimed, “This is the one that shocks me. . . . If you’re undecided [not in a major], one out of every three of you is not in good academic standing. . . . If you start undecided, term one to term three—one year—you don’t stay.” The gap in student progress was substan-tial compared with students who were enrolled in major fields of study. The data showed that two-thirds of students who had started out at the university as undeclared majors departed prematurely without degrees. In contrast, only one in five students with a declared major was not in good standing. Among those who did persist to graduation, undeclared majors were also accumulating more credits, putting in more effort to find the right courses to fulfill their program of study. The longer time-to-degree posed the risk of losing financial aid as students exhausted their eligibility.
This loss of students was inefficient, inequitable, and damaging to the financial sustainability of the institution. By examining cohort data disaggregated by race and ethnicity, evidence teams found that
Bringing Accountability to Life
Viewpoints: Voices from the Field
13
African American students were disproportionately isolated from advising resources because they were more likely than others to start college with an undeclared major. Students who declare a major—and are accepted into that major—receive much greater levels of advising than those who are not in a major because they become part of an identifiable academic community. For example, students in majors gain access to faculty in their area of study, through advising workshops and opportunities to do research. They also benefit from peer group networks and activities such as academically focused clubs, teams, career-oriented field trips, and hosted events with guest speakers. The lower resources provided to undeclared majors, who numbered in the hundreds on each campus, was an equity issue because African American students were disproportionately among this group.
When Equity Scorecard evidence team members at PASSHE universities realized that the policies and practices affecting a small cohort of students had a disparate negative impact on African American students, the improvements they made were beneficial to the institutions and their students as a whole. While African Americans were disproportionately enrolled in undeclared major status, the majority of undeclared majors were white students. All undeclared majors had less access to advisors and enriching co-curricular activities in comparison to their peers enrolled in major fields of study. The undeclared status was associated with delayed time to degree. The inquiry process focused on undeclared students led to a refreshed curriculum in some areas and updated student-centered policies in others. As evidence team members got a grip on the bottlenecks to student progress that were created by their own policies, this problem-defining aspect of data opened up into to a search for solutions.
USING DATA TO DESIGN EQUITABLE AND SUSTAINABLE SOLUTIONSSeeing patterns of inequities and inefficiency in fine-grained accountability data created the impetus for change when administrators interpreted the loss of students from the perspective of institutional respon-sibility for student success, rather than from a deficit perspective focused on lack of student preparation. For one administrator, the patterns revealed by the disaggregated, fine-grained cohort data prompted the realization that the university needed to “do a better job of helping students explore options from the start, not wait, because if we wait, they leave.” In a similar way, accountability data on student retention, combined with student survey results rating the quality of faculty advising as poor, motivated action at another university. An administrator explained that her colleagues came to realize “we have to do some-thing . . . we have to do more”; the survey results had “finally” catalyzed that realization. She emphasized the word “finally” to communicate the impact of this “aha moment” on the institution’s willingness to try something new.
With such data-informed insights propelling attention to institutional responsibility for the loss of students, changes did ensue. For example, one university in our study hired additional adjunct faculty to reach out to undeclared majors using “intrusive advising” methods to keep an eye on the students’ aca-demic progress. This change improved institutional performance in retention. At three other universities, academic and advising services for students were reconfigured to place undeclared majors into smaller academic communities. Rather than expecting a student to come in with a firm commitment to an area of study, programming was redesigned to support students who had not yet declared a major. In this way, resources were redistributed more equitably between students who started college ready to enter a major and those who did not. Faculty, administrators, and staff are more likely to invest themselves in big and small ways in equity work when they believe their efforts will pay off. They value the opportunity to be
14 Bringing Accountability to Life
Viewpoints: Voices from the Field
effective and to make a difference in students’ lives. The immediacy of impact and reward involved in working with small “N” data motivates additional investments in larger scale changes.
In our study, the scaling-up process was carried out in a variety of ways, including curriculum policy change, strategic planning, and program development. For example, one faculty member changed her mind from thinking that reaching out to struggling students was a “mothering move” to thinking of such personalized communications as an “advising move.” This perspective strengthened over time through her successful engagement in the Equity Scorecard and in a variety of faculty governance roles. It moti-vated her personal investments as an advisor. In addition, she led her faculty colleagues in restructuring their advising time, which involved creating a tutoring center and ensuring that faculty would be readily available to students at the center.
This shift of the advising space from the sometimes intimidating “office hours” model to a more open tutoring center, where faculty-student interactions could occur informally, represented a new resource for student retention. This was especially effective for retention of students of color, who are more likely to be first-generation college students. Those who do not enter college with a sense of privilege about making use of available resources can be reluctant to call on faculty during office hours (Dowd, Pak, and Bensimon 2013). In responding to this concern, administrative leadership was also key. Executive leaders supported the scale-up from individual- to institutional-level change by repurposing a remodeled class-room space for use as the tutoring center.
CONCLUSION: ADMINISTRATIVE LEADERSHIP FOR SAVVY DATA USE OF THE “ACTIONABLE N”Policymakers want educators in schools and colleges to become savvy data users who will use available resources equitably, efficiently, and effectively to graduate educated citizens, informed citizens, civic leaders, and productive members of the workforce. The lessons of this study show that accountability data become actionable when the numerators and denominators of persistence and success rates are translated into an “actionable N.” Accountability data become actionable data and the ideals of account-ability come to life in caring ways when connections between institutional practice and the loss of stu-dents from campus are made clear.
As the examples in this report show, accountability data become enlivened through closer attention to the impact of campus policies on small “N” cohorts of students at particular, manageable moments in their academic career. The availability of fine-grained, disaggregated use of cohort-based accountability data created the opportunity for more effective uses of data.
Investments in structured time for data use were rewarded as data users put their knowledge to work to design more equitable practices. Staff, faculty, and administrators who gain knowledge and expertise in the use of performance accountability data began to act as institutional “intrapreneurs” to improve institutional equity and financial sustainability. Intrapreneurs are innovators who reconfigure the use of organizational resources. Intrapreneurs question whether existing practices are working and, if not, they question, “Why not? Why not do this differently?”
Bringing Accountability to Life
Viewpoints: Voices from the Field
15
The lessons of this study show that practitioners become reform-minded institutional intrapreneurs when they have institutional support to:
• Humanize data by breaking it down to a small “N.”
• Examine cohort data disaggregated by race and ethnicity and discuss patterns in the data that reveal specific cohorts of students who are not being well served by current practices and policies.
• Identify bottlenecks to student progress and take responsibility for institutional performance and process improvements.
• Hold up a mirror to their own practices to assess what is working and what is not.
• Design new strategies for data use, shared governance, student advising, and program administration.
• Use insights from data use to inform strategic investment and reinvestment into programs, functions, and services that are mission-centered and that promote equitable access and outcomes.
The ideals of accountability become actionable when staff, faculty, and administrators make an active con-nection between the numbers in the data and the students they advise, teach, and shepherd through higher education—whether that work takes place in classrooms, advising centers, or administrative and program offices. The universities in this case study were engaged in a cultural shift toward the results-orientation
policymakers would like to bring about through pay-for-performance funding models and other account-ability requirements. The most motivated data users were driven by the desire to better understand the ways they could change their own practices to hold themselves to their ideals of equity and standards of profes-sionalism.
Executive leaders and practitioners who wish to promote the savvy use of accountability data should capital-ize on this professionalism by:
• Directing resources to fund the time and space for faculty and staff to interactively define and access data for small cohorts of interest so that they can find the “actionable N.”
• Articulate the value of using data disaggregated by race and ethnicity based on equity as a standard of practice.
• Provide visible support for professional learning about equity and institutional effectiveness through speeches, reports to governing boards, newsletters, and blogs.
Staff, faculty, and administrators who gain knowledge and expertise in the use of
performance accountability data began to act as institutional “intrapreneurs” to improve
institutional equity and financial sustainability.
16 Bringing Accountability to Life
Viewpoints: Voices from the Field
• Encourage faculty data use and inquiry within typical governance and organizational structures; for example, department and faculty council meetings.
• Provide training and incentives to faculty who have the capacity to act as data coaches, serving as a liaison between IR and faculty committees, including strategic planning, accreditation self-studies, department curriculum committees, and program review committees.
The most motivated data users were driven by the desire to better understand the ways
they could change their own practices to hold themselves to their ideals of equity and
standards of professionalism.
Bringing Accountability to Life
Viewpoints: Voices from the Field
17
REFERENCESBensimon, Estela Mara, Alicia C. Dowd, David Longanecker, and Keith Witham. 2012. “We Have Goals:
Now What?” Change: The Magazine of Higher Learning 44 (6): 14–25.
Bensimon, Estela Mara, and Lindsey Malcom. Eds. 2012. Confronting Equity Issues on Campus: Implement-ing the Equity Scorecard in Theory and Practice. Sterling, VA: Stylus Publishing.
Boudett, Kathryn Parker, Elizabeth A. City, and Richard J. Murnane. Eds. 2005. Data Wise: A Step by Step Guide to Using Assessment Results to Improve Teaching and Learning. Cambridge, MA: Harvard Education Press.
Cavanaugh, John C., and Peter Garland. 2012. “Performance Funding in Pennsylvania.” Change: The Mag-azine of Higher Learning 44 (3): 34–39.
Dowd, Alicia C. 2005. Data Don’t Drive: Building a Practitioner-Driven Culture of Inquiry to Assess Com-munity College Performance. Indianapolis, IN: Lumina Foundation.
Dowd, Alicia C., and Estela Mara Bensimon. 2015. Engaging the “Race Question”: Accountability and Equity in Higher Education. New York: Teachers College Press.
Dowd, Alicia C., Lindsey Malcom, Jonathan Nakamoto, and Estela Mara Bensimon. 2012. “Institutional Researchers as Teachers and Equity Advocates: Facilitating Organizational Learning and Change.” In Confronting Equity Issues on Campus: Implementing the Equity Scorecard in Theory and Practice, edited by Estela Mara Bensimon and Lindsey Malcom, 191–215. Sterling, VA: Stylus Publishing.
Dowd, Alicia C., Jenny H. Pak, and Estela Mara Bensimon. 2013. “The Role of Institutional Agents in Pro-moting Transfer.” Education Policy Analysis Archives 21 (15): 1–44.
Hillman, Nicholas W., David A. Tandberg, and Jacob P. K. Gross. 2014. “Performance Funding in Higher Education: Do Financial Incentives Impact College Completions?” Journal of Higher Education 85 (6): 826–857. doi:10.1353/jhe.2014.0031.
McKernan, John F., and Kenneth McPhail. 2012. “Accountability and Accounterability.” Critical Perspec-tives on Accounting 23 (3): 177–182.
Rutherford, Amanda, and Thomas Rabovsky. 2014. “Evaluating Impacts of Performance Funding Policies on Student Outcomes in Higher Education.” Annals of the American Academy of Political and Social Science 655 (1): 185–208. doi:10.1177/0002716214541048.
Walton, Mark S. 2004. Generating Buy-In: Mastering the Language of Leadership. New York: AMACOM.

AmericanCouncil on Education