brioquery explorer - broward county public schools transition from 5x to 6x.… · brioquery...
TRANSCRIPT

BrioQuery Explorer: Transitioning from 5.x to 6.x
Customer Staff Development Services
Broward County Public Schools

ii BrioQuery Explorer: Transitioning from 5.x to 6.x

BrioQuery Explorer: Transitioning from 5.x to 6.x iii
Table of Contents
Unit One: What’s New in Brio Explorer 6.2 .............................................................1
Unit Two: BrioQuery Basics (A Review)..................................................................3
Unit Three: Navigating the Interface .......................................................................5
Unit Four: Working with the Repository Catalog .....................................................15
Unit Five: Working in the Results Section ...............................................................19
Unit Six: Running Reports.......................................................................................27
Unit Seven: Creating Tabular-Style Reports (Something New in 6.2).....................31
Unit Eight: Managing the BrioQuery Document ......................................................41
Appendix A- Sections at a Glance
Query Section .............................................................................................45
Results Section ..........................................................................................46
Pivot Section ...............................................................................................47
Chart Section ..............................................................................................48
Report Section ............................................................................................50
EIS Section .................................................................................................52
Appendix B - The Data Warehouse Website ..........................................................53

iv BrioQuery Explorer: Transitioning from 5.x to 6.x

What’s New in Brio Explorer 6.x 1
Unit 1: What’s New in Brio Explorer 6.2 Brio Explorer version 6.2 adds a series of new features and capabilities to the product suite. In this release there are a number of critical and high-value additions across the product line. This document gives you an overview of the new features found in 6.2. Enjoy this new version; we are confident that it will help you make better-informed business decisions to increase productivity, efficiency, and revenue within your organization. General JavaScript Code The Brio Macro language used to customize Brio queries previous to this version is gone. Brio now uses JavaScript to code queries. It is also possible to password protect JavaScript code in Brio Explorer documents. This means that any macros you created in previous versions must be rewritten in JavaScript. Currently it is possible in each of the client tools (Designer, Explorer, Navigator) to access the object model and modify or delete JavaScript code. This new feature prevents unauthorized users from accessing the scripting environment by requiring a proper password. The menu choice to set the password is found under the File/Save Options menu. Saving Computed Columns as a Snapshot To speed the loading of documents in certain instances, it is now possible to save the values of computed columns within a document. For very large documents that contain many computed columns it would normally require the entire set of computed columns to be recalculated on opening, which can be time consuming for large documents. To prevent this, users can save the computed columns values with the document in the same way that they currently save results sets of queries. When using this feature, computed columns will be refreshed whenever the query is reprocessed. Saving computed columns as a snapshot applies to individual Results and Table sections, with the feature added as part of the Save Query Results with Document choice under the File/Save Options menu. Multiple Queries It is now possible to run multiple queries within the same document. You may run one query, run another query, and then link the results. You may also use the results from one query to limit a second query.


BrioQuery Basics 3
Unit 2: BrioQuery Basics(A Review) The Repository By using BrioQuery you will have access to the vast information available in the Data Warehouse. In addition to the data within the warehouse, you will have access to the Query Repository. Here you will find custom designed Queries, many with reports, which have been developed for the most requested topics. The Repository is actually located within the database. Most of the time you will use the Repository to access standard queries and standard queries with reports. It is from these queries that you will be able to obtain the current data (results) that you need. You will also be able to view that data in pre-determined reports or design your own. The Query: What is Involved in Creating It A query is set of database instructions that are required to retrieve data. When you retrieve data, you are essentially “reading” what is stored in a database. Data warehouses are built specifically to make this reading process faster and easier. When a Query is created, the database is directed to return an answer set to a specific question. Each row returned in the results set is an answer to the question. There may be a few rows returned or many, depending on the question. Elements of a Query in BrioQuery Request Line Items and Limits The query consists of the column names that we wish to retrieve data from, as well as specific limits on the data that we predefine before the query is processed. Limits are absolutely necessary in order for the query to return a specific answer set and run quickly. When you select a Standard Query from the Repository, the Request Line items will be pre-determined. You will, however, be asked to set limits on certain items. Aggregate Values If the data is to be summarized into groups when it is returned, the query will need to be “aggregated”. There is a choice in BrioQuery - one can return a very low level of detail or a highly summarized results set. Standard Queries in the Repository will have any aggregating of values already completed for you. Sorting To help understand the results set returned from a query, you may choose to predefine how you would like the data to be sorted. Most databases can quickly sort the data

4 BrioQuery Explorer: Transitioning from 5.x to 6.x
before it is returned to you. You can also sort the data locally after the results set is returned, if you would rather look at your data from a different perspective.
About BrioQuery Documents
With BrioQuery, you work in document files that consolidate the different specifications for querying, analyzing, and presenting data stored on the database server. Each BrioQuery document can include:
• A Data Model which graphically represents the database
• A Query, which retrieves a subset of data from the database
• A Results set, which is displayed in a spreadsheet-style format
• Detail reports which present customized views of your data
• Table Reports, which are reports, displayed in a tabular-style
• Multidimensional Pivot reports that permit drill-down analysis of data results
• Charts that graphically display your query results and allow different angles of vision on the data

Navigating the Interface 5
Unit 3: Navigating The Interface Launching the Application
Upon opening BrioQuery Explorer, a new Welcome to BrioQuery dialog box appears. In this dialog box, you will choose whether to create a new document or open an existing document, and the oce that you use.
To get started: 1. Double-Click on the BrioQuery Explorer 6.x icon on your desktop.
(In Windows – you may also go to the Start menu, point to Programs and BrioQuery Explorer 6.x, and then click BrioQuery Explorer 6.x.)
2. The application opens and the Welcome to BrioQuery dialog box appears. NOTE The illustration lists examples of files under "Recent Database
Connection Files" and "Recent Documents". Keep in mind that this dialog box does not list any files or db connections upon opening the application for the first time.

6 BrioQuery Explorer: Transitioning f
3. In the Welcome to BrioQuery dialog box, select an option, and then click the OK button. The following options are available:
• Create a New Document
• Local Document – document resides locally on client's computer • Connect an empty BrioQuery document to a data source
using an existing connection file. • Connect an empty BrioQuery document to a data source by
creating a new connection file. • Repository Document – document exists in the DWH Repository
• Connect to a Repository using an existing connection file and download a BrioQuery document.
• Create a new connection file to connect to a Repository and download a Repository document.
• Other – create a document without a database connection
• Import the contents of a local file into a Table section. File formats include tab delimited {*.txt}, comma delimited {*.csv} and Excel {*.xls}.
• Open a blank BrioQuery document, not connected to a data source, containing an EIS Section.
• Open an Existing Document
• Select a BrioQuery document from the Recent Documents list or click the Browse button to navigate to a document.
3. If prompted, enter a username and password to connect to a data source.
Note: Brio Client Interface The Brio client interface is a tri-pane window that provides all components necessary for performing database operations. It includes the Section title, the Section pane, the Content pane, the Catalog pane and the Request, Limit and Sort lines.
Dragging a docking bar to a new location can undock interface components, such as toolbars, lines, and Outliners.
Once a component is uthe top of the compone
NOTE The Catalog Pa
Dockingrom 5.x to 6.x
ndocked, it can be resized. To re-dock, double-click nt.
ne displays a list of tables in the database.

Navigating the Interface 7
Below is an illustration of the interface.
2a 2b 9
(1) Section Title Bar
The Section Title bar, which is shown above the Request line, displays the section you are currently working in.
To hide or close the Section Title: • On the View menu, click Section Title Bar.
(2) Section Pane
The Section pane, in the upper left area of the windows, lists all the sections that are available in a document.
To reopen the Section pane:
(2a) Click the Section/Catalog icon on the Standard toolbar or on the View menu, click Section /Catalog.
To hide or close the Section pane: (2b) Click the X icon to the right of the "Section" heading.
(3) Content Pane
The Content pane (lower right area of the window), provides a view of the section you are using (ie. the Data Model, Results or Chart).
6a 6b 1
5
2
4
7a
7b 7c
3
8

8 BrioQuery Explorer: Transitioning from 5.x to 6.x
(4) Catalog Pane The Catalog pane, in the lower left area of the window, displays tables, items, reports, and/or reporting tools. The Catalog appears in a directory tree format.
To navigate through the directory tree: • Click the + and - signs next to the Table Catalog. Click the + sign to expand the directory tree, and click the - sign to collapse the directory tree.
(5) Document Sections
Documents can consist of the following sections: • Query -- Database tables are listed in the Catalog pane and data
models are displayed in the content area. The Request line, Sort line and Limit lines are used to create queries.
• OLAP Query – This is NOT available on our system. • Result -- Rows of data returned from a query are stored in a table
format. Data can be sorted, limited, computed, and formatted. • Table -- New tables can be created based on the rows of data
stored in the Results section. • Pivot -- A cross-tab report style section where data can be
analyzed. • Chart -- Bar, line, pie, area, and ribbon charts can be created. • Report -- Free-form structured reporting where multiple result sets
can be displayed in one report. • EIS -- An Executive Information System that has a streamlined,
push-button approach to querying a database. Graphics can be imported, buttons added, and hotspots scripted to create a customized console, which retrieves data and runs reports with a mouse click. This section requires a knowledge of JavaScript programming.
To navigate to a section: • Click the section name in the Section pane of the application. If the
Section pane is not displayed, on the View menu, click Section Catalog.
To insert a new section: • On the Insert menu, click the section type you want to insert.
(6) Toolbars
Three toolbars provide quick access to frequently used features. The toolbar configuration is saved when you exit the application, and displays the same toolbars when the application is restarted.
To toggle a toolbar: •••• On the View menu, point to Toolbars, and then click the (toolbar name).
Navigating the Interface 9
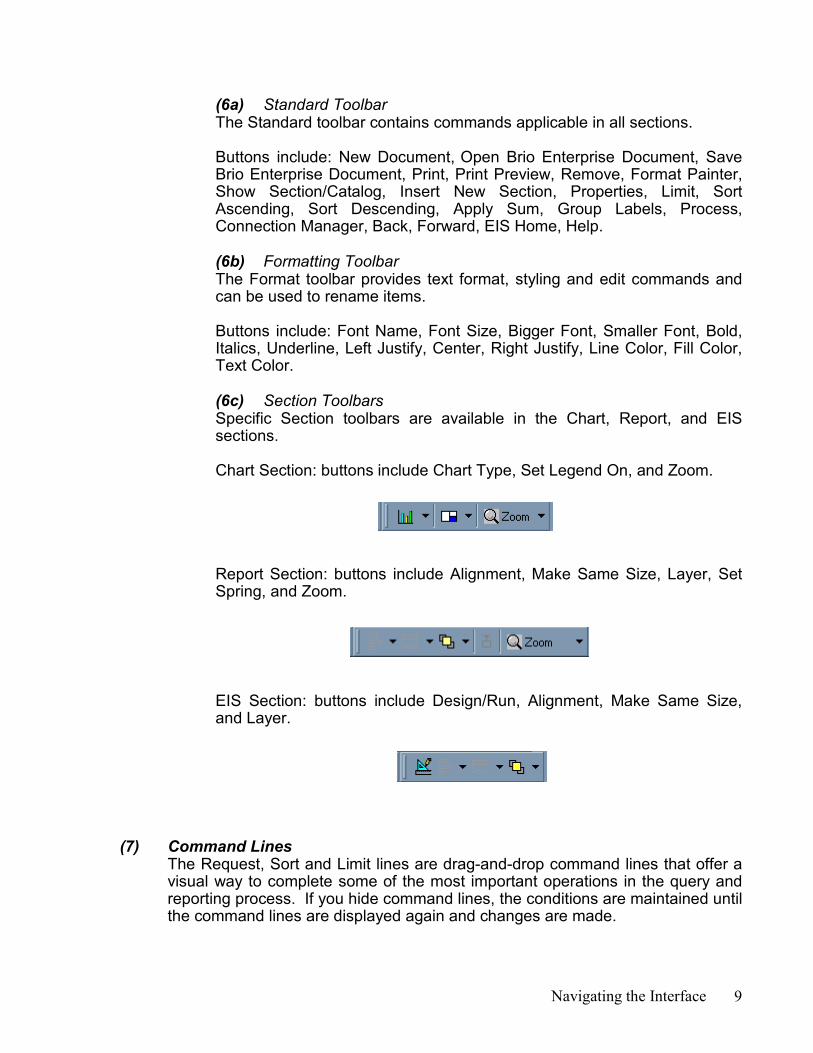
(6a) Standard Toolbar The Standard toolbar contains commands applicable in all sections. Buttons include: New Document, Open Brio Enterprise Document, Save Brio Enterprise Document, Print, Print Preview, Remove, Format Painter, Show Section/Catalog, Insert New Section, Properties, Limit, Sort Ascending, Sort Descending, Apply Sum, Group Labels, Process, Connection Manager, Back, Forward, EIS Home, Help. (6b) Formatting Toolbar The Format toolbar provides text format, styling and edit commands and can be used to rename items. Buttons include: Font Name, Font Size, Bigger Font, Smaller Font, Bold, Italics, Underline, Left Justify, Center, Right Justify, Line Color, Fill Color, Text Color. (6c) Section Toolbars Specific Section toolbars are available in the Chart, Report, and EIS sections. Chart Section: buttons include Chart Type, Set Legend On, and Zoom.
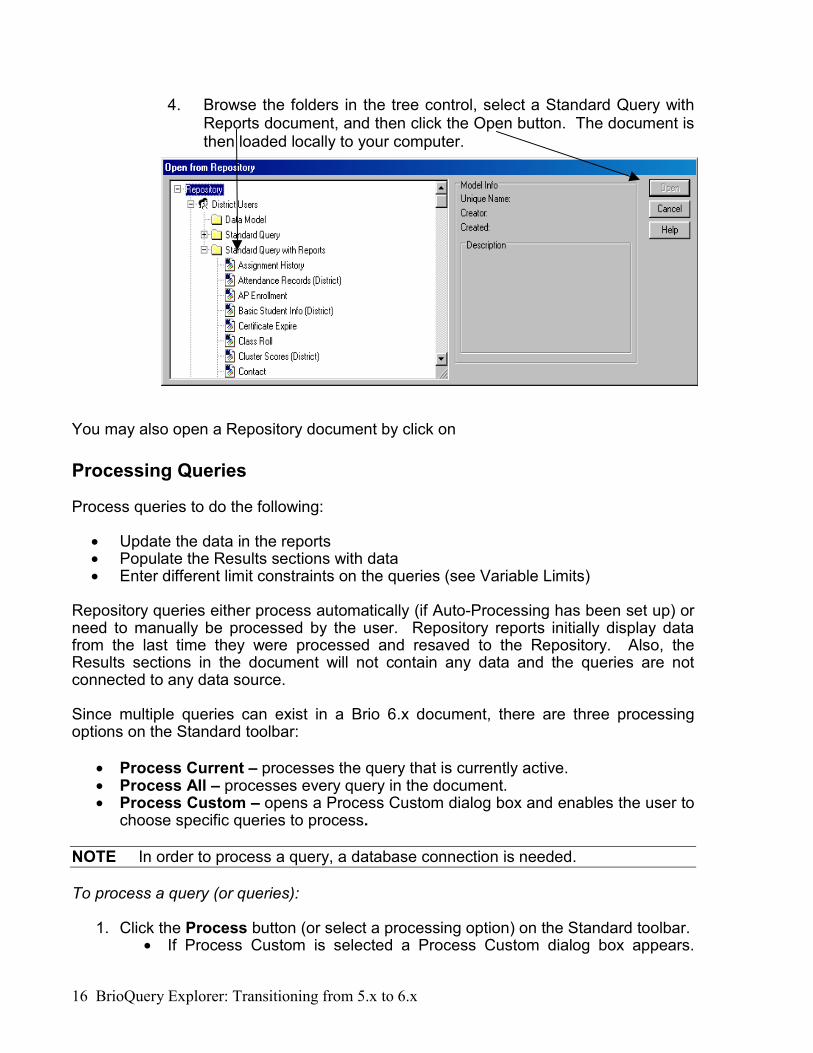
Report Section: buttons include Alignment, Make Same Size, Layer, Set Spring, and Zoom.
EIS Section: buttons include Design/Run, Alignment, Make Same Size, and Layer.
(7) Command Lines
The Request, Sort and Limit lines are drag-and-drop command lines that offer a visual way to complete some of the most important operations in the query and reporting process. If you hide command lines, the conditions are maintained until the command lines are displayed again and changes are made.

10 BrioQuery Explorer: Transitioning from 5.x to 6.x
To toggle the command lines: On the Section Title bar, click (command option). (7a) Request Line The Request line appears in the Query section and references the items in the query. Items are added to the query by dragging them from a data model to the Request line. The Request line is expandable and can wrap text to display multiple rows of request columns. (7b) Limit Line The Limit line tracks limit constraints placed on a query. A limit can be applied to an item by dragging an item from the data model in the content area to the Limit line. A Limit line is also available in the Results and Table Sections for the purposes of filtering data locally. (7c) Sort Line The Sort line tracks sort conditions applied to the data set, and allows you to specify compound and nested sorts. Apply a sort to an item by dragging a Request item to the Sort line.
(8) Status Bar The Status Bar is located below the content area and displays live information about data retrieval and the connection status.
To toggle the Status Bar: • On the View menu, click Status Bar.
(9) Process
BrioQuery Explorer 6.2 allows multiple queries in a document. There are three processing options:
• Process Current – processes the query that is currently active. • Process All – processes every query in the document. • Process Custom – opens a Process Custom dialog box and
enables the user to choose specific queries to process.
Results from one query may be used as input to another query within the same document.
Outliners Outliners are drag-and-drop templates used in the Table, Pivot, Chart, and Report sections. Each Outliner panel corresponds to a specific layout element of the report. To create reports, drag items from the Catalog into an Outliner panel. Data appears simultaneously in the content area with the appropriate formatting. Also use the Outliner to manage a report. The Outliner lets you add, move, reorder and remove items quickly and easily.

Navigating the Interface 11
To toggle Outliners: Click Outliner on the Section Title bar.
Table Outliner
Pivot Outliner
Chart Outliner
Report Outliner
Selection Techniques Brio clients follow standard mouse procedure for selecting items in a series.
To select a contiguous range of items:
1. Click the first item in the range. 2. Hold the [shift] key and click the last item in the range. The entire range of
items is selected.
NOTE You cannot make contiguous item selections in the Chart section. You have to select each chart object as discontiguous items. To select discontiguous items:
1. Ctrl-Click each item (Windows), or Command-Click each item (Macintosh).

12 BrioQuery Explorer: Transitioning from 5.x to 6.x
Special Selections
In several cases, use the modifier key to select or complete a mouse operation (for example, when selecting an individual row in Pivot reports). The modifier key combination depends on your operating system platform:
• Windows: Alt-Click • Macintosh: Option-Click
Menus, Speed Menus, and Keyboard Commands
Speed menus are convenient for issuing commands "on the fly". In addition, users can also use standard menu bar commands to perform a variety of tasks.
To use a speed menu: 1. Right-Click(Windows) or Ctrl-Click(Mac). 2. Choose the desired command from the speed menu, or submenu.
Keyboard Commands Keyboard commands are used in the following ways:
1. Press a modifier key to make a special selection. 2. Press the Delete key to remove items from the display. 3. Scroll up and down in Results and report sections using the
Page Up and Page Down keys (or the scrollbars and mouse).
Online Help
Brio Enterprise Online Help is an online guide to working with the Brio suite of products. The default Online Help window pops up in the upper-right corner of the screen. A vertical scrollbar is available on the window if all the text cannot be displayed in the default open window.
To access Online Help: • On the Windows Help menu, click Help. • On the Macintosh Apple menu, click Help.

Navigating the Interface 13
UNIT 3: SUMMARY EXERCISES
1. Log off Brio. (Choose File/Quit from the Menu Bar) 2. Launch the BrioQuery Application and open the Repository
Catalog. Answer the Below Question: How do you determine that you have successfully logged onto Brio?

14 BrioQuery Explorer: Transitioning from 5.x to 6.x

Working with the Repository Catalog 15
Unit 4: Working with the Repository Catalog Retrieving Repository Documents To retrieve a Repository document, a user first needs to connect to the database where the Repository resides. To connect to a Repository, a user requires a database connection file. Connection files have an *.oce (Open Catalog Extension) file extension. A connection file contains all of the software and network specifications needed to connect to the database. These files are created by ETS and available as part of these installation of BrioQuery. For more information, refer to the instructions found at the Data Warehouse web site.
To download a Repository document:
1. Open BrioQuery. 2. Configure the Welcome to BrioQuery dialog box, and then click the
OK button. • Select Repository Document from the first pull-down menu. • Click the Browse button to search for a connection file to the
database that contains the Repository, and then double-click the connection file. By default, connection files are stored in a folder called "Open Catalog Extensions".
3. Log on to the database by entering in a Host User and Host Password. Click the OK button to continue.
16 BrioQuery Explorer: Transitioning from 5.x to 6.x
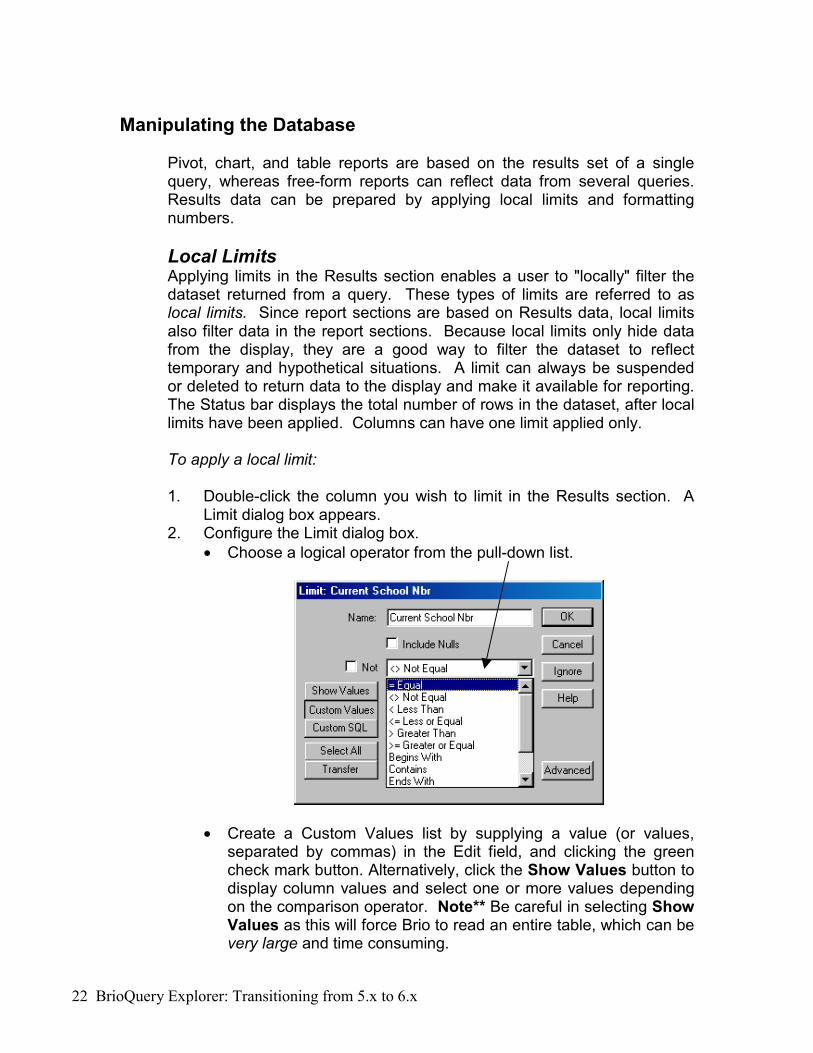
4. Browse the folders in the tree control, select a Standard Query with Reports document, and then click the Open button. The document is then loaded locally to your computer.
You may also open a Repository document by click on Processing Queries Process queries to do the following:
• Update the data in the reports • Populate the Results sections with data • Enter different limit constraints on the queries (see Variable Limits)
Repository queries either process automatically (if Auto-Processing has been set up) or need to manually be processed by the user. Repository reports initially display data from the last time they were processed and resaved to the Repository. Also, the Results sections in the document will not contain any data and the queries are not connected to any data source. Since multiple queries can exist in a Brio 6.x document, there are three processing options on the Standard toolbar:
• Process Current – processes the query that is currently active. • Process All – processes every query in the document. • Process Custom – opens a Process Custom dialog box and enables the user to
choose specific queries to process.
NOTE In order to process a query, a database connection is needed. To process a query (or queries):
1. Click the Process button (or select a processing option) on the Standard toolbar.
• If Process Custom is selected a Process Custom dialog box appears.

Working with the Repository Catalog 17
Click the check boxes beside particular queries, and then click the OK button.
2. In each connection dialog box, enter a Host User (that is, a database user name) and Host Password, and then click the OK button.
• During retrieval, the Status bar displays a dynamic row count indicating the rate and progress of database processing and network transfer.
To cancel a processing query:
• Windows: Simultaneously press and hold the [Alt] and [End] keys on the
keyboard until the query is canceled. • Macintosh: Press and hold the [Apple/Command] and [.].
NOTE Do NOT cancel processing by using a FORCE QUIT in MAC or END TASK in Windows unless absolutely necessary. If you do, please notify DWHMail so that we may cancel the processing on the AS400.
If the database is performing computations prior to sending the data across the network, the query can only be canceled if an asynchronous API, such as Open Client is used.
a) Auto-Processing
Queries can be configured to automatically process when a document is opened. This saves users the step of manually processing the queries (that is, clicking the Process button). This is referred to as auto-processing. To do this click on Query → Query Options; put a check mark next to Auto-Process.
b) Variable Limits Queries often contain variable limits that prompt users to enter or select limit values before the queries are processed on the database. Variable limits provide query flexibility. For example, a query may prompt users to select a year or particular school value. Some users may want to look at the current year and others the previous year. Variable limits have a V with a number in brackets next to it (ie. V(1)). To turn it off, Right-Click(Windows) or Ctrl-Click(Mac) on the limit and click Variable Limit. To have a variable limit come up, but not use it, click Ignore.
Most databases contain such large volumes of data that setting limits on queries is critical. Administrators need to set limits on their queries; however, hard-coding the limit values does not always meet the users needs. Variable limits often solve the problem since users must enter limit values in the prompts, but can enter the values they need.

18 BrioQuery Explorer: Transitioning from 5.x to 6.x
Prior to processing a query a limit can be set to return a specified number of rows. To preset a specific number of rows to be returned choose: Query/Query Options from the menu bar. Click in the Return First # of rows box and specify the number of rows to be returned.

Working in the Results Section 19
Unit 5: Working in the Results Section About the Results Section The Results section acts as a place to manipulate or prepare the data for pivot, charts, tables, and free-form reports. It is also used to verify the accuracy of queries. Although a query may have accessed several different database tables, the data is consolidated into a single table in the Results section. Each requested item is arrayed in a column field, and there is a row for each database record. In order to be able to create reports, data must be available in the Results section. If you do not save the results of a query with a document, then creating reports and analyzing data is not possible. Below is an example of a Results section:
Note the area at the bottom of the results. This lists all the items you have selected on the Request line of the query.

20 BrioQuery Explorer: Transitioning from 5.x to 6.x
Opening and Closing Documents Documents can be stored locally on a user's computer or on a network file server. It is a good idea to save the documents with results prior to data manipulation. (This will avoid the necessity of re-processing queries should the results section become lost). To open a document on a file server upon opening the application:
1. Open BrioQuery Explorer. 2. Configure the Welcome to BrioQuery dialog box, and then click the OK button.
• Select Local Document from the first pull-down menu. This is selected by default.
• In the "Open an Existing Document” area, click the Browse button to search for a document, browse for the document, select the document through Network Neighborhood, or one of your mapped network drives, and then click the Open button. The document is opened.
To open a document from within the application:
• On the File menu, click Open, browse to a directory, select a document, and
then click the Open button. To close a document:
• On the File menu, click Close. If the document has not been saved, the user is prompted to save.
Saving Documents Documents can be saved locally or on a file server for future use. Saving a document is similar to saving other application files. Content from all sections is saved. The following saving options are available:
• Save the document in a compressed format. This results in smaller file sizes, which saves valuable storage space and enables the document to be quickly transmitted. The decompression of the compressed file happens automatically when the document is reopened. Brio clients can be configured to save all documents in compression file format by globally enabling the Compress All Documents Option.
• Save results with the document if you wish to be able to work without being connected to the database.
• Password Protect a document. Users must enter a password to open the document.
• Password Protect your JavaScript within a document. Users must enter a password to look at Document Scripts and EIS Sections in Design Mode.

Working in the Results Section 21
To save a new document:
1. On the File menu, click Save As. 2. In the Save File dialog box, select a directory, enter the name of the file, choose
a file type, and then click the Save button.
To save the document in a compressed format:
1. On the File menu, point to Save Options, and then click Compress Document. A check mark is displayed next to the Compress Document feature.
To configure all documents to save in compression file format:
1. On the Tools menu, point to Options, and then click Program Options. 2. In the General tab, choose Compress all documents and/or Create new
documents compressed. To save the results with a document:
1. On the File menu, point to Save Options, and then click Save Query Results With Document.
2. In the Save Results With Document dialog box, click the check boxes for the queries for which to save results, and then click the OK button.
To password protect a document:
1. On the File menu, point to Save Options, and then click Password Protect Document.
2. In the Password Protect Document dialog box, enter a password, and then click the OK button.
To password protect Document Scripts:
1. On the File menu, point to Save Options, and then click Password Protect Design Mode.
2. In the Password Protect Design Mode dialog box, enter a password, and then click the OK button.
22 BrioQuery Explorer: Transitioning from 5.x to 6.x
Manipulating the Database
Pivot, chart, and table reports are based on the results set of a single query, whereas free-form reports can reflect data from several queries. Results data can be prepared by applying local limits and formatting numbers.
Local Limits Applying limits in the Results section enables a user to "locally" filter the dataset returned from a query. These types of limits are referred to as local limits. Since report sections are based on Results data, local limits also filter data in the report sections. Because local limits only hide data from the display, they are a good way to filter the dataset to reflect temporary and hypothetical situations. A limit can always be suspended or deleted to return data to the display and make it available for reporting. The Status bar displays the total number of rows in the dataset, after local limits have been applied. Columns can have one limit applied only. To apply a local limit:
1. Double-click the column you wish to limit in the Results section. A
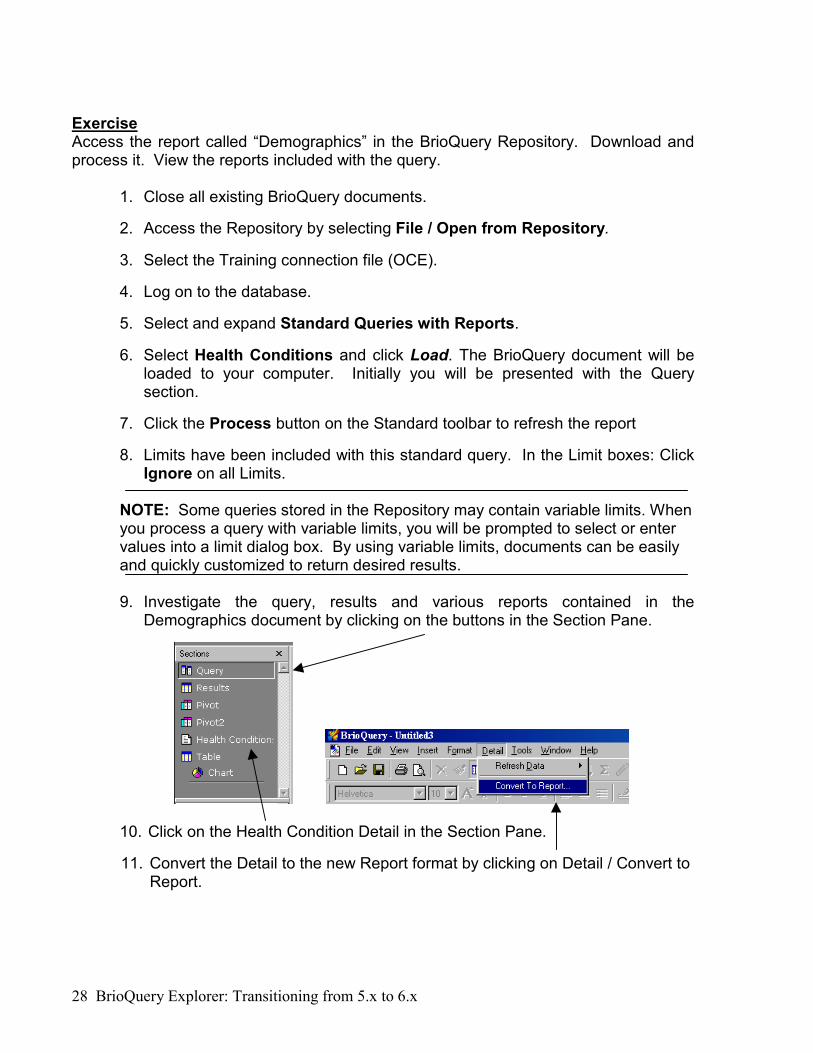
Limit dialog box appears. 2. Configure the Limit dialog box.
• Choose a logical operator from the pull-down list.
• Create a Custom Values list by supplying a value (or values, separated by commas) in the Edit field, and clicking the green check mark button. Alternatively, click the Show Values button to display column values and select one or more values depending on the comparison operator. Note** Be careful in selecting Show Values as this will force Brio to read an entire table, which can be very large and time consuming.

Working in the Results Section 23
3. When the values are highlighted in the values panel, click the OK
button. The limit is applied to the column and the column name is added to the Limit line.
To remove a limit in a results set:
• Right-Click(Windows) or Ctrl-Click(Mac) a Limit item, and then click Remove.
To remove all limits in a results set:
• Right-Click(Windows) or Ctrl-Click(Mac) Limit on the Limit line, and then click Remove.
Formatting Numbers in Results
Format numbers once in the Results section to avoid formatting them each time they are used in a report section. To apply a number format to a column: 1. Select a column, Right-Click(Windows) or Ctrl-Click(Mac), and then
click Number. A Properties dialog box appears.

24 BrioQuery Explorer: Transitioning from 5.x to 6.x
2. In the Numbers tab select a number format, and then click the OK button.
3. You may also click on Custom to create a custom format.

Working in the Results Section 25
UNIT 5: SUMMARY EXERCISES
1. Launch Brio. 2. Process the FCAT query from the Repository, limiting your Request to 500
rows; ignore all criteria (limits). 3. Save your query with results. 4. Sort your records in alphabetical order by grade level. 5. Create a list of students whose FCAT score is below 250.
Answer the Following Questions:
1. If you wanted to open a document you have on your computer, what would you select from the Welcome to BrioQuery dialog box?
2. How do you view values for a field prior to choosing a limit for a field?

26 BrioQuery Explorer: Transitioning from 5.x to 6.x

Running Reports 27
Unit 6: Running Reports Getting Started Your first step in using a Repository report is to get connected to the database and browse the Repository. You then select a report and load it to your computer. Next, you simply process the query and manipulate the reporting sections. Example
The picture shows a Repository containing Standard Query with Reports documents.
Opening the Repository after Brio has been launched To access a Standard Query or a Standard Query with Reports in the Repository, after successful sign-on:
1. Choose File > Open from Repository.
2. Select the appropriate connection file (e.g., Training, District).
3. Log on to the database.
4. Choose the Repository (e.g., Training) you would like to browse by clicking the database icon.
5. Select the listing for either Standard Query or Standard Query with Reports to see the listing available documents.
6. Select the report you want to use and click Open. (Mouse click once prior to choosing the “open” button to view a description of the query)
7. Click the Process button on the Standard toolbar if the query does not process automatically. Remember, you may be asked to define various limits.
8. Select the section tabs to view the reports.
28 BrioQuery Explorer: Transitioning from 5.x to 6.x
Exercise Access the report called “Demographics” in the BrioQuery Repository. Download and process it. View the reports included with the query.
1. Close all existing BrioQuery documents.
2. Access the Repository by selecting File / Open from Repository.
3. Select the Training connection file (OCE).
4. Log on to the database.
5. Select and expand Standard Queries with Reports.
6. Select Health Conditions and click Load. The BrioQuery document will be loaded to your computer. Initially you will be presented with the Query section.
7. Click the Process button on the Standard toolbar to refresh the report
8. Limits have been included with this standard query. In the Limit boxes: Click Ignore on all Limits.
NOTE: Some queries stored in the Repository may contain variable limits. When you process a query with variable limits, you will be prompted to select or enter values into a limit dialog box. By using variable limits, documents can be easily and quickly customized to return desired results. 9. Investigate the query, results and various reports contained in the
Demographics document by clicking on the buttons in the Section Pane.
10. Click on the Health Condition Detail in the Section Pane.
11. Convert the Detail to the new Report format by clicking on Detail / Convert to Report.

Running Reports 29
Wide Reports Previously users could create reports that were wider than the available print area for use when deploying reports for viewing rather than printing functionality. Since 6.0 the width of the available report design space was determined by the available print drivers and so was limited to the maximum printable space. In this release, a Page Size tab has been added to the Report Page Setup dialog. Now users may select custom report size dimensions to create reports much larger than the maximum printable space. Reports created which exceed the paper size available from the print driver can still be printed, however, only the leftmost portion of the report that fits on the paper will be printed. This new feature is primarily for creating reports for onscreen viewing only. Users who export Reports to HTML pages may want to use this setting to control the number of ‘pages’ that are included in each HTML file. The default behavior is to export each logical page to a single HTML file. By adjusting the height of your Page Size to say 33 inches, when exporting the report to an HTML file, it will have the equivalent of three printed pages in the single HTML file. If you wish to ensure that all the pages in your report are contained in a single HTML file, set this height value to a large number. Modifying Existing Detail Reports Because the Detail designer is no longer supported, existing Detail reports are opened in read-only mode. To modify the main contents of an existing Detail report, it must first be converted to the new Reporter. Detail reports can only be converted to Reporter when the document contains Saved Results, so you may need to reprocess the query before conversion. Next, select Detail | Convert to Report from the main menu system. This will insert a new Report section into the document that contains the converted report. The original Detail report is left untouched. Every effort has been made to make the conversion to the new Reporter as faithful to the original Detail design as possible. Some conversions may need some rework. Other reports, especially those that use computed items, multiple page header/footers, or complex formatting, may need some additional design work after conversion.
30 BrioQuery Explorer: Transitioning from 5.x to 6.x
UNIT 6: SUMMARY EXERCISES
1. Select the Contact Query from the Repository Catalog. 2. Process the Query. 3. Use the following Limits when prompted:
a. Student Number: IGNORE b. School Number: 0251 c. Last Name: IGNORE d. First Name: IGNORE
4. Convert the Detail to a Brio 6.2x Report. Answer the Following Questions: 1. Where is the command to convert an old style Detail to a Brio 6 Report?

Creating Tabular-Style Reports 31
Unit 7: Creating Tabular-Style Reports (Something New in 6.2)
About Tabular-Style Reports The Table section is used for creating tabular-style reports. The data is not summarized in the Table section, as it is in the other report sections. The data is presented at the same granularity level as in the Results section.
Table sections share the same functionality as Results sections. Pivots, Charts, and free-form reports can be created based on a table's dataset, in the same way reports are derived from a Results dataset.
The Outliner in the Table Section contains Request items that are to be included in the table report. Below is an example of a blank Table section.
To create a table report:
1. On the Insert menu, click New Table. 2. Drag Request items from the Catalog into the Outliner. Click the
Outliner button on the Section Title bar if it is not displayed below the content area. A Request item can be added only once to a table.
32 BrioQuery Explorer: Transitioning from 5.x to 6.x
Removing and Hiding Columns Columns can be removed from or hidden in a table report. If a column is not added to the Outliner or it is removed from the Outliner, then it cannot be displayed in reports or referenced in local computed columns. If a column is added to the Outliner, and then hidden, it is not displayed in the table report, but can be referenced in local computed columns and displayed in other reports.
To remove a column in a table report:
• Select a column in a table Right-Click(Windows) or Ctrl-Click(Mac), and then click Remove Column.
To hide a column in a table report:
• Select a column in a table, Right-Click(Windows) or Ctrl-Click(Mac), and then click Hide Column.
To unhide a column in a table report:
• To unhide a column, Right-Click(Windows) or Ctrl-Click(Mac) anywhere within the Contents pane and click Unhide Column. When the Unhide Column dialog box appears, select the column that you want to unhide and click OK.
• You can also select Unhide Column from the Table menu. Sorting Tables
The rows in a table report can be sorted based on a single column or multiple columns. Use the Sort (Ascending or Descending) buttons on the Standard toolbar to quickly sort a column or multiple columns in the same order (ascending or descending). Use the Sort Line to view Sort items and to apply nested sorts to multiple columns using combinations of ascending and descending sort orders.
To sort a column using the Sort buttons:
• Select a column to be sorted, and then click the Sort (Ascending or Descending) button on the Standard toolbar.
To apply sort conditions using the Sort line:
1. Click Sort on the Section Title bar to display the Sort line. 2. Drag Request items from the Catalog pane to the Sort line.
• Establish a final sort sequence by reordering Sort items. Items are sorted from left to right.
• Double-click specific Sort items to toggle ascending and descending sort orders. Ascending is the default sort order.

Creating Tabular-Style Reports 33
• Click Sort Now on the Sort line to begin sorting.
Local Limits
Set limits on columns in a table report to filter the data displayed. Table section limits are in addition to the limits set in the Results section. Keep in mind that limits applied in a Table section are also applied to other reports that stem from a Table section. Limits can be suspended or deleted to return data to the display and make it available for reporting. The Status bar displays the total number of rows in the table report, with limits applied. Only one limit per column can be applied.
To limit data in a table report:
1. Double-click a column in a table report. A Limit dialog box appears. 2. Configure the limit dialog box:
• Choose a logical operator from the pull-down list. • Create a Custom Values list by supplying a value (or values,
separated by commas) in the Edit field, and then clicking the green check mark button.
34 BrioQuery Explorer: Transitioning from 5.x to 6.x
• Alternatively, click the Show Values button to display column values, and then select one or more values depending on the comparison operator.
3. When the values are highlighted in the values panel, click the OK
button. The limit is applied to the column and the column name is added to the Limit line.
To remove a limit in a table report:
• Right-Click(Windows) or Ctrl-Click(Mac) a Limit item, and then click Remove.
To remove all limits in a table report:
• Right-Click(Windows) or Ctrl-Click(Mac) Limit on the Limit line, and then click Remove.
Grand Totals and Break Totals Table reports can display grand totals and break totals. Multiple grand totals can be displayed at the bottom of a column, each with a different data function applied. Break totals are defined in reference to data in other columns, which define a break point for the total. Data functions for break totals can also be defined.
Break totals are generated using break columns. The break column contains the data by which to group (break) the totals. The break column usually contains text values.
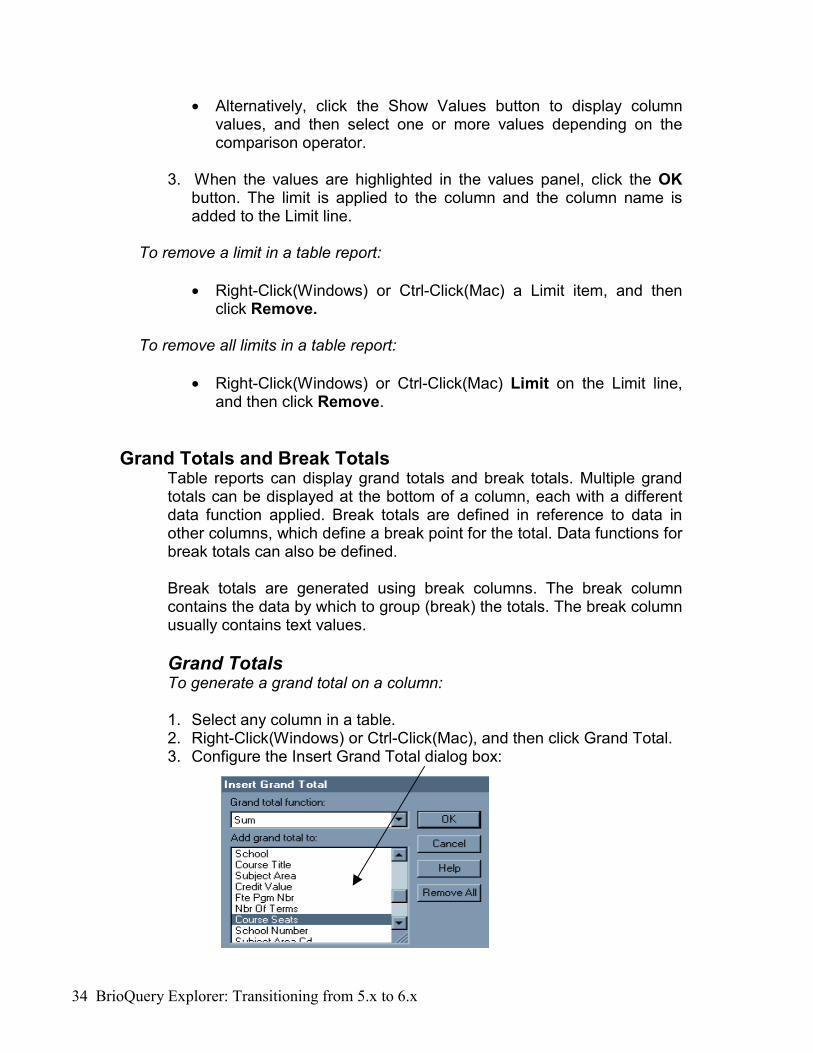
Grand Totals To generate a grand total on a column: 1. Select any column in a table. 2. Right-Click(Windows) or Ctrl-Click(Mac), and then click Grand Total. 3. Configure the Insert Grand Total dialog box:
Creating Tabular-Style Reports 35
• Select a data function from the first pull-down menu. • Select a column from the second pull-down menu.
4. Once the Insert Grand Total dialog box is configured, click the OK
button. A total is displayed at the bottom of the selected column. TIP To quickly create a grand total using the sum data function, select
a column, and then click the Grand Total button on the Standard tool bar.
To remove a grand total in a table report: 1. Highlight a grand total row by clicking in the left margin. The grand
total row is highlighted. 2. Right-Click(Windows) or Ctrl-Click(Mac) and then click Remove
Row. The grand total is removed.
To remove all grand totals in a table report: 1. Select any column in a table report, Right-Click(Windows) or Ctrl-
Click(Mac), and then click Grand Total. 2. In the Insert Grand Total dialog box, click the Remove All button,
and then click the OK button. All grand totals are removed in the table report.
To change the data function applied to a grand total: 1. Double-click a grand total in a table report. 2. In the Modify Total Function dialog box, select a data function from
the pull-down menu, and then click the OK button.
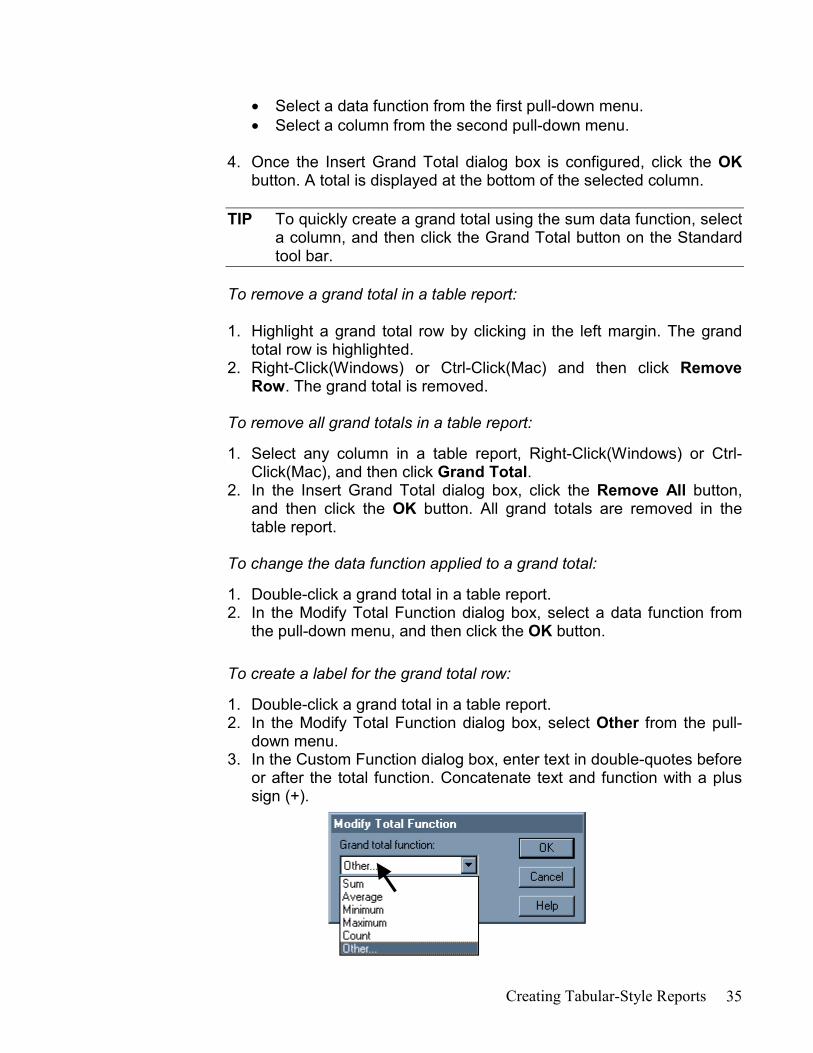
To create a label for the grand total row:
1. Double-click a grand total in a table report. 2. In the Modify Total Function dialog box, select Other from the pull-
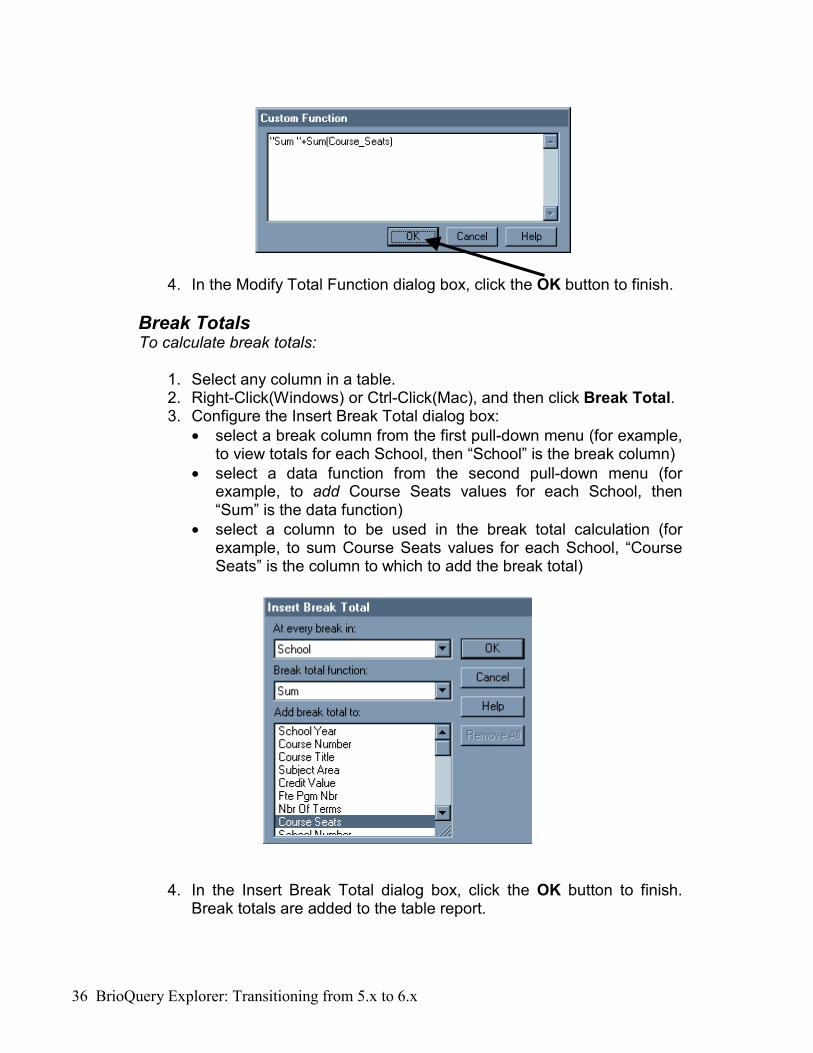
down menu. 3. In the Custom Function dialog box, enter text in double-quotes before
or after the total function. Concatenate text and function with a plus sign (+).
36 BrioQuery Explorer: Transitioning from 5.x to 6.x
4. In the Modify Total Function dialog box, click the OK button to finish.
Break Totals To calculate break totals:
1. Select any column in a table. 2. Right-Click(Windows) or Ctrl-Click(Mac), and then click Break Total. 3. Configure the Insert Break Total dialog box:
• select a break column from the first pull-down menu (for example, to view totals for each School, then “School” is the break column)
• select a data function from the second pull-down menu (for example, to add Course Seats values for each School, then “Sum” is the data function)
• select a column to be used in the break total calculation (for example, to sum Course Seats values for each School, “Course Seats” is the column to which to add the break total)
4. In the Insert Break Total dialog box, click the OK button to finish. Break totals are added to the table report.

Creating Tabular-Style Reports 37
To remove break totals in a table report: 1. Highlight a break total row by clicking in the left margin. The break
total row is highlighted. 2. Right-Click(Windows) or Ctrl-Click(Mac), and then click Remove
Row. All related break totals are removed.
To modify a break total's function: 1. Double-click a break total in a table report. 2. In the Modify Total Function dialog box, select a data function from
the pull-down menu, and then click the OK button. To modify the label for a break total:
• Double-click a break total row label, enter/modify text in double
quotes, and then click the OK button.

38 BrioQuery Explorer: Transitioning from 5.x to 6.x
Formatting Tables
Use the techniques listed below to format table reports.
Format Options Resize a column Drag a column’s margin left or right to resize it
manually. or Double-click a column’s margin to Auto-Size. or On the Format menu, point to Column, and then click Auto-Size Width or Standard Width.
Resize a row Select a row (by clicking in the left margin), position the cursor on a row's edge, and then drag the edge up or down to resize a row manually. or Select a row (by clicking in the left margin); on the Format menu, point to Row, and then click Standard Height to resize a row to a standard size. Note – Total rows need to be resized separately than regular data rows.
Font On the Format menu, click Font. Select a Font type, Style (Regular, Bold, Italic, Bold Italic), Size, and Effect (Underline, Overline, Double Overline). Columns can have different fonts.
Numbers, Dates, and Times
On the Format menu, click Number. Select number format from the Category area (Number, Currency, Percentage, Date, Time, or Custom).
Justify data Highlight columns, and then click a justification icon (Left, Center or Right; Top, Middle or Bottom) on the Format toolbar.
Suppress duplicate values
Select a column, Right-Click(Windows) or Ctrl-Click(Mac) and then click Suppress Duplicates. This feature can be applied to multiple columns.
Display row numbers On the Format menu, click Row Numbers to toggle them on or off.
Display grid lines On the Format menu, click Grid Lines to toggle them on or off. In the dialog box, select properties for horizontal and vertical grid lines: Default, None, or Custom (choose a Color, Width, and Style).

Creating Tabular-Style Reports 39
Format Options Display column titles On the Format menu, click Column Titles to toggle
them on or off. Wrap text in a column Select a column; then, on the Format menu, click
Wrap Text. Modify the border around a table
On the Format menu, click Border and Background. In the Border area, select properties for the border: Default (Black line), None, or Custom (choose a Color, Width, and Style).
Modify the fill of a table On the Format menu, click Border and Background. In the Fill area, select properties for the background: Default (white), None, or Custom (choose a Color). Select an alternating color if desired.
Column text color Select a column; then on the Format menu, click Font. Select a text color from the Font Color pull-down menu.

40 BrioQuery Explorer: Transitioning from 5.x to 6.x
UNIT 7: SUMMARY EXERCISES
1. Open the Demographic query from the Repository. 2. Limit the query to the first 500 rows. 3. Sort the query (in the Table section) by school and grade level. 4. Find the number of 7th grade, Black students by school. 5. Find the number of 7th grade, Spanish-speaking students by school. 6. What is the total number of students in the Demographic query?
Answer the Following Questions:
1. How do you hide and unhide columns?
2. How do you access the speed menu?

Managing the BrioQuery Document 41
Unit 8: Managing the BrioQuery Document
Basic Document Manipulation
Printing Reports
Users can print an active document section using the Print command. To print a section:
1. In the Section pane, select the section to print. 2. On the File menu, click Print. 3. Configure the print dialog box, and then click the OK button.

42 BrioQuery Explorer: Transitioning from 5.x to 6.x
Exporting Report Sections Report sections can be exported in common file formats such as Excel or Lotus. Sections can also be exported as HTML format, making it easy to distribute data to many corporate intranets or web sites.
To export a report as a common file format: 1. On the File menu, point to Export, and then click Section. 2. Configure the Export Section dialog box, and then click the Save button.
3. Select a destination directory for the export file. 4. Type a name for the section to be exported. 5. Choose a file format from the Save as Type menu. The table below
describes common extensions for format types. • HTML (*.htm) • Excel (*.xls) • Lotus 1-2-3 WKS (*.wks) • Tab-delimited text (*.txt) • Comma-delimited text (*.csv)
For formatting problems, tips, and suggestions, go to “Tips and Tricks” on the Data Warehouse website (http://web/dwh)

Managing the BrioQuery Document 43
Export Reports to Excel Selecting the Excel format will actually export a tab-delimited file. It will also assign the file an extension of .xls. All versions of Excel correctly import this file without any user intervention. This will allow a wide variety of applications to gain access to the content of reports created in Brio Explorer. When exporting reports all header and footer information will be exported as well with as much text indentation preserved as possible. Only text elements will be exported. No graphical elements (i.e. lines, shapes, or pictures) will be exported, as these are not supported in a text file format. For example, if you started with the following report:
When exported and opened in Excel the report output would look like this:
44 BrioQuery Explorer: Transitioning from 5.x to 6.x
UNIT 8: SUMMARY EXERCISES
1. Use the Demographic query you currently have open. 2. Go to the Results section. 3. Export the results as an Excel document. Answer the Following Questions: 1. What are the formats that a query can be converted to?

Sections at a Glance 45
Appendix- A Sections At A Glance
Query Section
1 2 3 4 5 6 7 8 9 10 11 12 13 14 15 16
1 Remove button 17 Section Title bar 2 Format Painter button 18 Request line button 3 Show Section / Catalog 19 Limit line button 4 Insert Section button 20 Sort button 5 Properties button 21 Back arrow 6 Limit button 22 Forward arrow 7 Sort Ascending button 23 Catalog pane 8 Sort Descending button 24 Tables 9 Grand Total 25 Request line
10 Group Items 26 Limit line 11 Process button 27 Sort line 12 Connections 28 Content pane 13 Back arrow 29 Topic 14 Forward arrow 30 Topic items 15 EIS Home button 31 Status bar 16 Help 32 Section pane
25
23
17
32
24
18 19 20 21 22
26
27
28
29
30
31

46 BrioQuery Explorer: Transitioning from 5.x to 6.x
Results Section 1 2 3 4
1 Select All corner 2 Column Heading 3 Limit line 4 Sort line 5 Row heading 6 Section Pane 7 Catalog pane 8 Request column 9 Request column
10 Cell 11 Row 12 Column title
11
12
10
6
5
8
9
7
Sections at a Glance 47
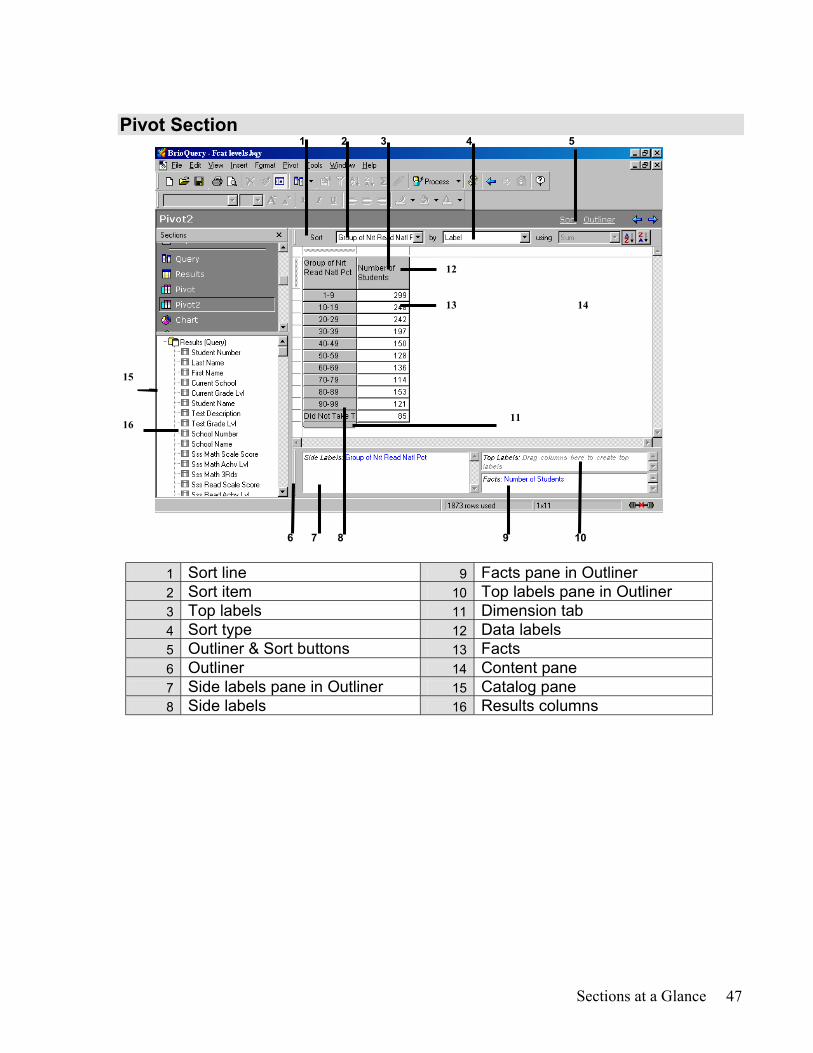
Pivot Section 1 2 3 4 5
6 7 8 9 10
1 Sort line 9 Facts pane in Outliner 2 Sort item 10 Top labels pane in Outliner 3 Top labels 11 Dimension tab 4 Sort type 12 Data labels 5 Outliner & Sort buttons 13 Facts 6 Outliner 14 Content pane 7 Side labels pane in Outliner 15 Catalog pane 8 Side labels 16 Results columns
15
16
12
13
11
14

48 BrioQuery Explorer: Transitioning from 5.x to 6.x
Chart Section 6 7 1 2 3 8 9 10
12 13 14
1 Chart type button 8 Sort aggregate 2 Legend on 9 Sort Order Ascending button 3 Zoom button 10 Sort Order Descending button 4 Catalog pane 11 Content pane 5 Results columns 12 Y-Facts pane in Outliner 6 Sort item 13 Z-Categories pane in Outliner 7 Sort type 14 X- Categories pane in Outliner
4
5
11

Sections at a Glance 49
Chart Section (Continued) 15 16 17 19
20 21 18 22 23
15 Y-Axis label 16 Y-Axis values 17 Chart titles 18 Z-Axis values 19 Legend 20 X-Axis values 21 X-Axis label 22 Z-Axis label 23 Chart area

50 BrioQuery Explorer: Transitioning from 5.x to 6.x
Report Section 1 2 3 4 5
1 Sort button 2 Expression button 3 Groups button 4 Table button 5 Content pane 6 Sections 7 Results columns 8 Catalog pane
6
7
8
Sections at a Glance 51
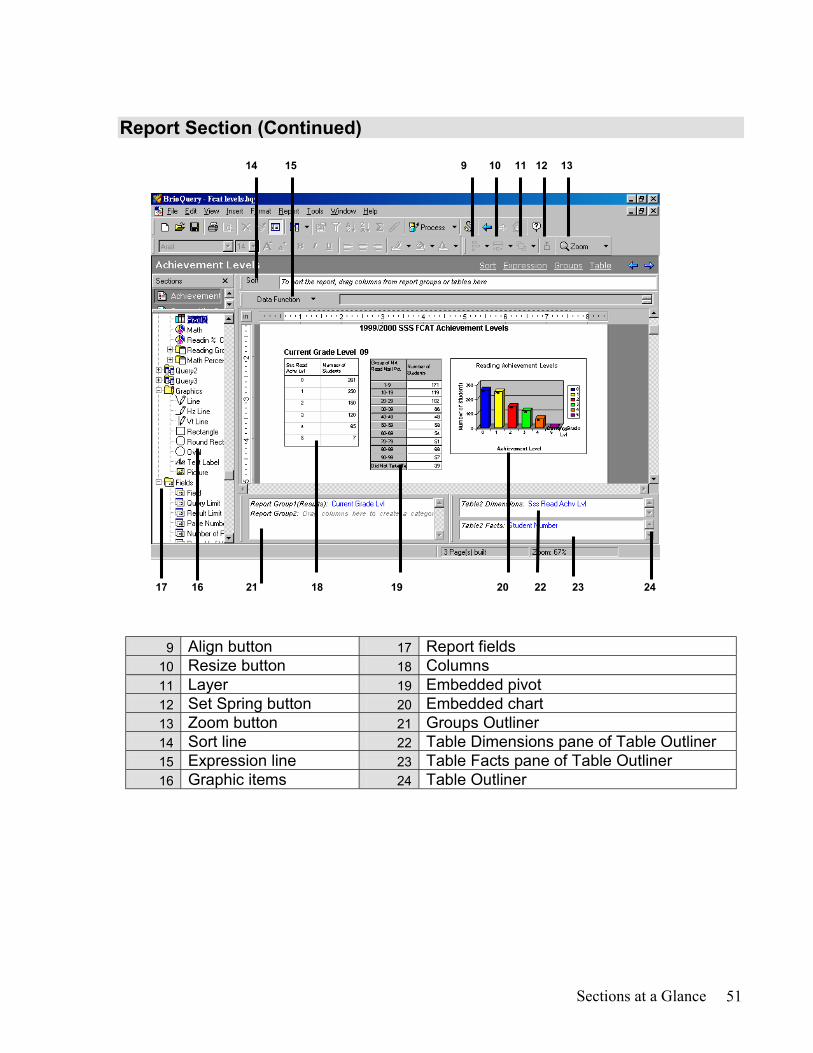
Report Section (Continued) 14 15 9 10 11 12 13
17 16 21 18 19 20 22 23 24
9 Align button 17 Report fields 10 Resize button 18 Columns 11 Layer 19 Embedded pivot 12 Set Spring button 20 Embedded chart 13 Zoom button 21 Groups Outliner 14 Sort line 22 Table Dimensions pane of Table Outliner 15 Expression line 23 Table Facts pane of Table Outliner 16 Graphic items 24 Table Outliner

52 BrioQuery Explorer: Transitioning from 5.x to 6.x
EIS Section 1 12 3 4 5 6 7 2
17 13 14 15 16
1 Ruler Units of Measurement 10 Graphic items 2 Embedded picture 11 Control items 3 Ruler 12 Embedded Command button 4 Design/Run button 13 Embedded dropdown list 5 Align 14 Embedded graphic 6 Resize button 15 Embedded text 7 Layer 16 Content pane 8 Catalog pane 17 Embedded chart 9 Sections
9
8
10
11

The DWH Web Site 53
Appendix B - The Data Warehouse Website Everything you want to know about the Data Warehouse can be found on our website: http://web/dwh This should be your first choice for finding information about anything and everything.
Web Queries Run Brio Queries on the Intranet. Selected queries are available for you to process with your criteria without the need for the Brio client software on your computer.
DWH Reports Special reports for each school will be run at the district Data Warehouse and will be posted in Acrobat Reader (pdf) format. These reports can be viewed or printed by each school.
What’s in the DWH Information on a varied group of topics is kept at this location. You can find a list of all the tables in the Warehouse, their descriptions, all the elements in each table, and descriptions of the elements themselves. In addition, you can find detailed information on the tests and subtests, including the codes, test names, subtest names and which fields are available for each test.
What’s New All additions and updates to the Data Warehouse and Brio will be posted here.
Tips and Tricks Do all those little things that help make your queries special. Easily do those more difficult tasks. Additionally, it is sometimes useful to have a list of students whose

54 BrioQuery Explorer: Transitioning from 5.x to 6.x
information you may want to reference on a continual basis. Instructions for creating a “student list” are also at this location.
FAQs (Frequently Asked Questions) Any general question that you have will probably have an answer here. This section is divided into four parts: Access to the System, Hardware & Software Installation and Download, Information on the Data, and Miscellaneous. Discussion Group Submit your ideas and discuss with others your experiences with the data warehouse. Feedback Form Any comments, suggestions, or additions you would like to see made to the Data Warehouse should be posted here. Your feedback is highly valued, and is reviewed daily. Software & Documentation Instructions for installing and/or upgrading Brio are available at this site. Any of these instructions may be retrieved through the Intranet in "PDF" format. The use of this technology ensures that each document retains its original format features. Viewing and printing these instructions will require that your computer have the "Adobe Acrobat Reader 4.x" application installed. If you do not have Acrobat Reader, there is a link to the Adobe site to download the reader to your computer. Troubleshooting If you have problems with installation or access to the Data Warehouse using Brio, you can find many of the answers already listed here. The four sections (Login Problems, Error Messages, Installation Problems, and Miscellaneous) are complete with diagrams and pictures to make any problem easier to correct. Training Instructions for signing up for Brio training and the training schedules are listed here. Statistics Statistics on the Data Warehouse are maintained here. Search Search for anything on the Data Warehouse Website. Email Notification (of Changes & Updates) If you would like to be notified immediately of any updates, modifications and problems, sign up for email notification. In addition, when the system is going to be taken down for service, a notice will be sent out.

The DWH Web Site 55
NOTES