broad-based solutions - sharedata
TRANSCRIPT

BROAD-BASED SOLUTIONSANNUAL REPORT 2003

After three years of restructuring,involving tough decisions andsignificant change, we now havea properly positioned, broad-basedportfolio of businesses thatenables the Group to offerintegrated, top-quality solutionsacross the full infrastructuralvalue chain.

WATER & SANITATION SERVICESCIVILS
Group Five’s highly skilled and experienced teams facilitate the full scope of projects from their initial concept through
to completion and the operational and maintenance management going forward.
A BROAD-BASED OFFERIntegrated products and services across the infrastructure value chain
The concept development of infrastructural projects is key to the successful
delivery of the final product. The IDS team identifies the needs and
deliverables of each project and develops the initial project concept. The
concept is then translated into a detailed design specification and an
appropriate financial structure to ensure the project’s success. Delivery is
ensured through the close liaison between the IDS team and the appointed
in-house or external contractors.
The Group’s manufacturing facilities provide building products for a
wide range of construction contracts. Group Five’s manufacturing and
construction businesses work closely together to ensure that the needs
of customers are met on time, and with products of the highest quality .
The Group’s construction activities encompass building, civils, roads and
engineering. This enables Group Five to deliver on the broad
infrastructural development needs created through the projects of IDS.
The Group has also pioneered leading-edge products such as pre-cast
housing systems, which offer unique and cost-effective construction
solutions to a wide range of clients.
Operations and maintenance provides services that optimise and support
the design and development of infrastructural projects, ensuring that the
client’s investment in infrastructural assets is well managed through
efficient revenue collection and appropriate operations and maintenance.
VAAL SANITARYWARE
DPI PLASTICS
ENGINEERING
MANUFACTURING CONSTRUCTION OPERATIONS & MAINTENANCE
KBR GROUP FIVE INDUSTRIAL SERVICES
INTERTOLL
OASISBUILDING
ROADS
INFRASTRUCTURAL
DEVELOPMENT
SERVICES
EVERITE BUILDING PRODUCTS
INFRASTRUCTURAL DEVELOPMENT SERVICES (IDS)

1
02 / financial highlights04 / then and now and next08 / market spread10 / chairman’s review12 / ceo’s reviewoperational review16 / infrastructural development services18 / manufacturing22 / construction26 / operations and maintenance
30 / board of directors32 / operational management 34 / corporate governance41 / chief financial officer’s report43 / financial statements78 / administration and shareholders’ diary79 / notice of annual general meeting81 / form of proxy82 / notes to proxy
CONTENTS

• Average compound 3 year revenue growth of 12,7%• Average compound 3 year operating profit growth of 54,6%• Average compound 3 year EPS growth of 58,4%
2
FINANCIAL HIGHLIGHTSfor the years ended 30 June
2003 2002 2001 2000 1999
CONSOLIDATED BALANCE SHEETS (R’000)
Equity and liabilities
Shareholders’ equity 455 080 381 813 322 775 286 082 283 233
Minority interest 9 899 5 949 3 882 1 228 5 182
Non-current liabilities 107 031 106 099 94 432 70 986 69 897
Current liabilities 1 521 143 1 779 095 1 221 895 1 119 809 989 602
2 093 153 2 272 956 1 642 984 1 478 105 1 347 914
Assets
Non-current assets 604 132 544 922 466 808 320 851 318 222
Current assets 1 489 021 1 728 034 1 176 176 1 157 254 1 029 692
2 093 153 2 272 956 1 642 984 1 478 105 1 347 914
CONSOLIDATED INCOME STATEMENTS (R’000)
Revenue 4 100 361 4 020 756 3 167 000 2 863 410 2 673 434
Operating profit 160 127 124 573 80 136 43 346 85 779
Finance costs (28 530) (26 397) (8 025) (8 231) (12 084)
Profit before taxation 131 597 98 176 72 111 35 115 73 695
Taxation (30 463) (19 821) (21 378) (10 603) (19 717)
Profit after taxation 101 134 78 355 50 733 24 512 53 978
Minority interest (4 366) (1 346) (3 672) (205) (1 014)
Attributable profit 96 768 77 009 47 061 24 307 52 964
SHARE CAPITAL (’000) 69 120 69 120 69 120 69 120 69 120
Issued shares 73 573 73 573 73 573 73 573 73 573
Less: Treasury shares 4 453 4 453 4 453 4 453 4 453
140
120
100
80
60
40
20
0
Earnings and dividends per shareCents per share
99 00 01 02 03
Earnings per share Dividends per share
700
600
500
400
300
200
100
0
Net asset value and market price (30 June)Cents per share
99 00 01 02 03
Net asset value Market price
76,6
24,0
35,2
14,0
68,1
25,0
111,
431
,0 37,0
140,
0
409,
817
6,0
413,
921
7,0
335,
046
7,0
552,
434
0,0
658,
452
0,0

3
FINANCIAL HIGHLIGHTSfor the years ended 30 June
2003 2002 2001 2000 1999
STATISTICSShare statistics – cents per share
Earnings 140,0 111,4 68,1 35,2 76,6
Dividends (based on the years to which they relate) 37,0 31,0 25,0 14,0 24,0
Net asset value 658,4 552,4 467,0 413,9 409,8
STOCK EXCHANGE PERFORMANCE
Market price – high 771 525 301 430 315
Market price – low 340 310 175 185 145
Market price – year-end 520 340 335 217 176
Market capitalisation – year-end (R million) 382,6 250,1 246,5 141,5 129,2
Value of shares traded (R’000) 199 495 80 616 57 140 37 162 51 474
Number traded (’000) 34 456 20 751 23 070 13 805 27 750
Percentage traded (%) 46,8 28,2 31,4 18,8 37,7
Closing price/net asset value 0,8 0,6 0,7 0,5 0,4
Closing price/earnings ratio 3,7 3,1 4,8 6,2 2,3
Closing dividend yield (%)
(based on the years to which they relate) 7,1 9 7,5 6,5 13,6
BUSINESS PERFORMANCE
Dividend cover (based on the years to which they relate) 3,8 3,6 2,7 2,5 3,2
Current ratio 1,0 1,0 1,0 1,0 1,0
Return on ordinary shareholders’ interest (%) 21,3 20,2 14,6 8,5 18,7
Return on total assets (%) 7,3 5,5 4,9 3,1 6,3
Profit margin (%) 3,9 3,1 2,5 1,5 3,2
EMPLOYEE STATISTICS
Number of employees 13 682 14 020 12 424 11 018 11 774
Revenue per employee (R’000) 300 287 255 260 227
DEFINITIONS
Earnings per share refer note 6 to the annual financial statements.
Net asset value per share ordinary shareholders’ interest divided by the number of shares in issue.
Closing price/earnings ratio market value of shares at the end of the year divided by earnings.
Closing dividend yield dividends per share as a percentage of market value per share at year-end.
Dividend cover earnings divided by dividends.
Current ratio current assets divided by current liabilities. A broad indicator of the Group’s short-term liquidity.
Return on ordinary attributable earnings as a percentage of ordinary shareholders’ interest at year-end.
shareholders’ interest An objective measure of the Group’s profitability for shareholders, after allowing for financing.
Return on total assets operating profit divided by average total assets. A measurement of the effectiveness with which management uses the
assets at its disposal.
Asset turnover ratio of revenue to total capital employed. A measure of the utilisation of assets.
Profit margin operating profit as a percentage of revenue.
Revenue per employee revenue divided by average number of employees.

4
What was neededEliminate pyramid structure and low voting shares.
Strengthen board.
Change inappropriate organisational structure.
Unify the Group to ensure a proactive and not reactive approach.
Strengthen leadership team and conduct a quality audit on staff.
Build a strong forward order book and solid growth prospects.
Grow international activities.
Phase out asbestos.
THEN AND NOWGroup Five embarked on a restructuring programme three years ago, ending in July 2003. Below is an outline of
deliverables and what was achieved.

5
What was achievedNow a single listed entity with one class of shares.
Share price more than doubled between 2000 and 2003.
Board reconstituted with additional non-executive directors.
Currently majority non-executive directors.
Divisions eliminated and business units reduced from 19 to 14, resulting in
significant overhead cost savings and more effective lines of communication.
An integrated offer across the full value chain achieved, allowing the Group to deliver
commercial solutions to customers. Average compound revenue and operating profit
growth of 12,7% and 54,6% achieved over the three-year period.
New quality appointments made, with strong management driving each area of the
business. Poor performers removed, enabling opportunities to promote talent.
These changes resulted in the improvement of overall performance.
Order book improved from 2000 to 2003 by R2 billion. Leading-edge products
introduced, such as Nutec and biaxially orientated pipe technology to break into
new markets.
International revenue increased from R800 million in 2000 to R1,4 billion in 2003.
Achieved in December 2002, ahead of legislative requirements.

6
Focus area• Pursue black economic empowerment Group level and accelerate progress on targeted
employment equity levels.
• Elevate customer focus and retention in all business units by integrating CRM processes.
• Upgrade levels of risk management in each business unit through commercial appointments
and training in newly developed risk and commercial methodologies.
• Grow the international base and expanding services across borders.
• Optimise newly implemented JD Edwards construction management system by
December 2003.
• Implement JD Edwards manufacturing management system by June 2004.
• Optimise business unit productivity through adoption of best construction and
manufacturing practices.
• Establish a full-time specialist turnkey project team for mega projects.
AND NEXT... CORE FOCUS AREAS FOR 2004The restructuring programme has created a platform for sustainable growth going forward. Highlighted below are
core focus areas for 2004.

7
Expected outcome• Achieve long-term sustainable growth.
• Contribute to social upliftment of previously disadvantaged groups.
• Increased levels of negotiated work.
• Better understanding of client needs, enabling speedier and improved
project delivery.
• Improved secured order book, providing more effective project planning.
• Better margins.
• Improved cash flow.
• Reduced finance costs.
• Diversify further the Group’s geographic position mitigating country risk.
• Expand global market share for the Group.
• Fully integrated management information systems providing immediate access to
accurate and relevant information necessary for decision-making.
• Elimination of non value-added tasks and activities at all levels.
• Competitive advantage through the use of state of the art technology.
• Improved outputs.
• Reduced cost.
• Improved quality to customers.
• Quicker construction times, enabling project cost-savings.
• Identification and procurement of major multi-disciplinary projects.
• Long-term order book secured.

8
MARKET SPREADIn 2004, Group Five will celebrate thirty years of operating in infrastructural markets. The Group is
active in thirteen countries in Africa, India, the Middle East, Indian Ocean Islands and Europe.
The South African operations contributed 67% (R2,7 billion) to revenues and cross-border work
contributed 33% (R1,4 billion).

9
A steady stream of infrastructural and mining expenditure has enabled
the Group to work throughout BOTSWANA over several decades. Current
contracts include the installation of services at Ghanzi, construction
works at Jwaneng Diamond Mine and road building contracts at Jwaneng
and Mathangwane.
The large road infrastructure development programme in INDIA has
attracted international attention and created opportunities for the Group.
Through the Group’s subsidiary, Intertoll ICS, a 28-year contract for the
operation and maintenance of the Delhi-Noida bridge, spanning the Yamuna
River, has been secured. In addition, it has been awarded an eight-year
project to operate two toll roads, one from Delhi to Jaipur and one from
Delhi to Agra.
The Group has been involved in various building and civil engineering works
in MAURITIUS for a number of years. Work is nearing completion on the
R220 million joint venture St. Martin Sewage treatment plant at Port Louis.
The Group intends to expand its international activities where opportunities
exist in cross-border niche markets as these projects tend to generate
higher margins than work secured in South Africa.
To meet growth objectives, the Group has continued its drive to expand
international activities in selected countries, with cross-border revenue
growing by 18% over the last three years.
Risk mitigation is key in entering new markets. Steps taken by the
Group include an in-depth country assessment, the selection of the
right local partner and a thorough contract risk evaluation process by
the risk committee.
The majority of the cross-border revenues are generated from Angola,
Botswana, Algeria, Tanzania, India and Mauritius. The Group’s preferred
target markets are those African countries that derives strong revenues from
oil, gas, mining and industrial activities as income generated from these
sectors provides for ongoing infrastructural development. The multi-
disciplinary nature of the Group’s activities, coupled with its ability to be
flexible in its offerings, have allowed it to procure significant contracts over
the years.
The decision to enter the ANGOLAN market was made in 2000 after the
Group was awarded the Presidential contract, Nova Vida, for 2 480 housing
units and associated infrastructure projects in Luanda.
The cessation of hostilities and the implementation of new government
structures have had a very positive impact on the construction opportunities
in this country, resulting in various projects, both in the private and public
sectors. New contracts include the USD26 million turnkey contract for
Cimangola for a 120 ton cement mill extension in Luanda. In the last
two years, the Angolan operation has contributed R797 million to
Group revenue.
The Group has been active for the last five years in TANZANIA, mainly in
the provision of infrastructure for the mining sector in the Mwanza area. The
more recent developments in Dar es Salaam have provided the opportunity
for the establishment of the Group’s building activities in the capital. The last
year has seen the successful completion of the Law Reform Commission
project for the Government of Tanzania, and the award of the USD75 million
twin towers project for the Reserve Bank of Tanzania.
Group Five has gained a foothold in the USD11 billion North African
construction market through an entry into ALGERIA, where two design
and build contracts for pre-cast housing complexes and a sports stadium
to the value of R250 million have recently been secured. It is anticipated that
oil and gas revenues will continue to provide the basis for further
infrastructural development.

CHAIRMAN’S REVIEWThe three-year restructuring plan introduced when the Group was unbundled at the end of 2000 is now complete
and many of the objectives set at that time have been achieved. Earnings over the three-year period have
increased fourfold, we have strong management in place, a clear set of deliverables in each business and a
better understanding of our clients needs.
10
George Thomas – Chairman

11
Once again, I am pleased to report a significant improvement in attributable profit for
the year. Earnings per share grew by 26% from 111,4 cents to 140,0 cents and
headline earnings per share by 24% from 90,0 cents to 111,3 cents. Dividends for
the year have been increased by 19%, with a marginal increase in dividend cover.
The three-year restructuring plan introduced when the Group was unbundled at the
end of 2000 is now complete and many of the objectives set at that time have
been achieved.
Earnings over the three-year period have increased fourfold and the share price has
more than doubled in what has been an exceptionally difficult market for equities.
The operating environment in which the plan was introduced has by no means been
an easy one. There have been some setbacks, but there have also been some major
successes. The most notable achievements over the past three years have been:
• elimination of the Group’s pyramid structure and low voting shares,
• strengthening of the board,
• changing the inappropriate operational structure, and
• unifying the Group and diversifying activities, both locally and internationally.
These actions have resulted in a focused, cohesive Group with clear strategies and
the ability to deliver sustainable growth.
The restructuring has eliminated the causes of the Group’s historical poor
performance. We now have strong management in place, clear deliverables in each
business and a better understanding of what our clients demand from us. Although
the year under review saw the tail-end of the poor performance in Roads, Group
Five’s balanced portfolio of businesses resulted in a strong performance on a Group
level for the third consecutive year.
The major achievement during the year has been the turnaround in the
Manufacturing operations. Since Everite Building Products has only recently returned
to profitability, a further improvement is expected in the current year, notwithstanding
the low level of activity in affordable housing, Everite’s traditional market.
If the distortion caused by the violent fluctuation in exchange rates is set aside, the
underlying operating profit in Construction showed an 18% improvement compared
to an exceptional 67% increase in the previous year. Building enjoyed an excellent
year, with both Civils and Engineering trading at approximately the same level as in
the previous year. The main problem area in Construction was Roads, where a
number of major projects in Southern Africa recorded losses. These projects have
now been completed and a major restructuring of the business has taken place.
Going forward, the focus will be on creating a smaller, more cohesive unit
concentrating on bottom-line profits rather than chasing revenue.
The results of Operations and Maintenance were also impacted by the strengthening
of the Rand, notably those of Intertoll. Infrastructural Development Services exceeded
profitability targets and the role this business unit performs in offering a full
infrastructural service to clients continues to assume increasing importance.
A net cash outflow for the year was recorded mainly due to an increase in working capital
of R88 million. However, the financial state of the Group remains strong, with borrowings,
net of cash, at balance sheet date representing only 5% of shareholder’s funds.
Although a core focus is growing the international base, this will not decrease the
commitment to invest in South Africa and to play a constructive role in the country’s
future development.
The Group remains committed to pursuing the Government’s June 2006
employment equity targets and the development, training and upliftment of the
previously disadvantaged. The greatest challenge is undoubtedly meeting the
required levels for senior and middle management and finding the necessary
technical skills. While the requisite equity forums and procedures are in place,
progress towards placing an increased number of previously disadvantaged
individuals in management positions has been disappointing. The 2004 year will see
an increased drive towards achieving our objectives through dedicated corporate
support to business units to deal with employment equity and corporate social
responsibility issues.
It is the intention to pursue black economic empowerment proactively at Group level
and to accelerate initiatives to support and grow emerging black business, including
the establishment of empowerment companies in conjunction with the business units.
Examples of these initiatives are three empowerment distributorships established by
DPI and owned by historically disadvantaged individuals. These commercially
successful regional businesses benefit from the Group’s technical skills input and
the partners’ local knowledge and market penetration. The Civils business units
have also had success in forming ongoing joint partnerships with local communities
to manufacture concrete and associated construction products. Affirmative
procurement at all levels will continue to receive attention in the year ahead.
The threat posed by the HIV/AIDS pandemic to employees’ health, productivity and
the industry skills base presents a major challenge. The Group is currently reviewing
its HIV/AIDS strategy following a benchmarking exercise against best practice.
The year saw yet another pleasing improvement in safety throughout operations. The
disabling injury frequency rate (DIFR) improved by 32,5%, resulting in Construction
and Manufacturing beating industry norms by 77% and 42% respectively. The Group
has further demonstrated its commitment to safety with the launch of the OHSHS
18000-based Group Five Safety and Health System. Several Nosa 5 and
4-star ratings have been achieved on projects.
At the time of writing, the Construction order book was R3,5 billion and the
Government’s recent announcement of its plan to increase expenditure on
infrastructure offers further encouragement. Manufacturing operations are now
trading profitably and have clear growth targets for 2004. Given current trading
conditions, management is confident that these should be achievable. In addition,
the Group remains focused on improving operating efficiencies across the business.
A further meaningful improvement in earnings for the coming financial year is
therefore expected.
The achievements over the past three years would not have been possible but for
the dedication and energy displayed by management and staff throughout the
Group, led from the front by Mike Lomas and his executive colleagues. The Group
is indebted to all of them. Finally, may I thank my co-directors for their continued
support, wisdom and guidance.

12
CEO’S REVIEWThe restructuring has resulted in a Group that is able to service customers’ requirements across the full
infrastructure value chain. The diversified and yet inter-related nature of the business units, both locally and
internationally, provides a balance to earnings. This balance allowed Group Five to again deliver strong results
in the year under review, with operating profits increasing by 29%.
Mike Lomas – Chief Executive Officer

13
INTRODUCTION
As mentioned in the Chairman’s Review, Group Five embarked on a
challenging three-year restructuring programme during 2000. Our focus
was to substantially and sustainably improve the performance of business
units and to reposition our products and services to meet market and
customer demands. Our objective during the three-year restructuring
process was to grow returns to shareholders, whilst radically changing the
shape and culture of the organisation. These objectives were achieved.
In the space of the three-year period, the Group delivered positive results,
culminating in an increase in revenue of R1,2 billion from R2,9 billion
to R4,1 billion, an increase in operating profit of R117 million from
R43 million to R160 million and an increase in EPS from 35 cents to 140 cents.
Although the restructuring commenced off a low base due to the poor
performance of many of the business units, all business units are now
appropriately positioned to ensure sustainable growth going forward.
The refocusing of these business units has resulted in a Group that is able
to service customers’ requirements across the full infrastructure value
chain. The diversified and yet inter-related nature of the business units, both
locally and internationally, provides a balance to the Group’s earnings,
optimising returns, whilst minimising risks.
This balance allowed Group Five to again deliver strong results in the
current year, with operating profits increasing by 29%.
OPERATIONAL REVIEW
The private sector’s focus on outsourcing non-core requirements and the
public sector’s need for raising capital for the development of infrastructure
has increased the demand for infrastructural solutions incorporating
financial structuring.
This has allowed Infrastructural Development Services (IDS) to produce
good results, with operating profit increasing by 27%. To take advantage of
current opportunities, the management team will be further strengthened in
the new year.
Procuring the N1/N2 Winelands and N2 Wild Coast unsolicited bids from the
South African National Roads Agency Limited has taken longer than
anticipated, principally due to the resolution of environmental issues. The
process will soon gain momentum although the benefits should become
apparent in 2005.
Although the Manufacturing business units only contribute 15% to Group
revenue, they provide an invaluable role in enabling the Group to deliver
across the full infrastructure value chain.
One of the most outstanding achievements accruing from the three-year
restructuring programme was returning Manufacturing to profitability. The
Manufacturing business units generated an operating profit of R34 million,
compared with a loss in the prior year of R52 million.
Vaal Sanitaryware had an outstanding year, significantly increasing
operating profits. The business unit made a conscious decision to move
away from high-volume, low-margin business to enhance profitability. The
recent introduction of a high pressure casting system and the installation of
computerised driers will improve productivity, reduce waste and lead to
further factory efficiencies.
The DPI black economic empowerment strategy has gained momentum in
the year and culminated in the establishment of three BEE companies. The
growth strategy, coupled with the introduction of new technology, enabled
the business unit to achieve record profitability.
Following significant interventions by management, Everite Building
Products has been turned around, resulting in this business breaking even
for the year and is now trading profitably.
The use of asbestos in Manufacturing has ceased and has been replaced by
PVA/Cellulose combinations. This, coupled with the introduction of the
innovative value added range of Nutec products, has opened the door to
export markets. The Group is carefully evaluating all opportunities.
The focus going forward for all the Group’s Manufacturing business units
will be to further improve service to customers, introduce new technology
and products and achieve global standards throughout the operations.
The positive interaction now being achieved between the Group’s IDS,
Manufacturing, and Construction activities has led the way to the increased
use of the Group’s manufactured products on construction projects.

14
CEO’S REVIEW CONTINUED
Construction revenue, which remained constant due to the deferment of
major projects by the mining companies and the strengthening of the Rand,
represents 78% of the Group‘s revenue. Operating profit before exchange
gains/losses increased by 18%. Exchange gains decreased by R60 million
compared to the previous year, resulting in a reduction in operating profit
from R137 million to R91 million.
The integration of building, civil and road activities in KwaZulu-Natal into a
single multi-disciplinary unit was successfully completed within the year.
This new unit enjoys the benefit of low overhead costs, coupled with
flexibility to service local customers with a wide range of building and
construction products.
The focus on delivery by Group Five Building, which ensures adherence to
customers’ time and quality standards, has resulted in 70% repeat business
and negotiated work.
In spite of long lead times, the decision to secure large building projects in
selected cross-border markets at better margins is having a positive impact
on the business.
Civils and Engineering have performed well in a tough and competitive
market. The deferment of projects by the mining houses following the
strengthening of the Rand has negatively impacted local contractors that
mainly rely on the mines as a source of work.
Civils and Engineering have focused on creating quality order books through
strategic partners in the natural gas and energy sectors in North Africa.
These opportunities should provide future benefits through long-term
negotiated contracts.
Engineering work prospects typically follow the prospects for Civils. Current
market conditions indicate that a quiet period for the business unit in the
first quarter of the new financial year should be expected.
The consolidation and downsizing of the Roads business unit has been
completed. A new managing director with 20 years’ experience within the
Group was appointed in December 2002 and the operational board and
structures have been rationalised. Control over the business has been
increased with a substantial reduction in the number of contracts being
undertaken. The problematic joint venture contract in Gorongosa,
Mozambique, was completed in May 2003. With 80% of projected revenue
for 2004 already secured and the restructuring of the business unit
completed, a positive result in Roads for 2004 is expected.
The trend in the public and private sectors to outsource the operations and
maintenance of infrastructural assets is supporting the growth of the
Group’s business units. Services are currently supplied to the toll road,
water and industrial sectors through Intertoll, WSSA and KBR Group Five
Industrial Services. Oasis, a joint venture with an empowerment company,
has been established to service our entry into the facilities management
field with the award of a contract for a mining house in Rustenburg.
Whilst the underlying operations performed well, the strengthening of the
Rand had a negative impact on offshore profits accruing from Intertoll.
MANAGEMENT
One of the core focus areas during the restructuring was to put the right
structures in place to ensure the efficient delivery of Group strategy.
The Group’s management has been focused around an executive and a
management committee.
The Group executive committee consists of the CEO, CFO and the Group
executive directors responsible for HR and business development. It is
responsible for formulating and driving the overall strategic direction of the
Group, capacity building, succession planning and transformation.

15
The Group management committee, which comprises executive committee
members and all business unit managing directors, is responsible for
driving the execution of strategy and related initiatives into the businesses.
The purpose of the committee is to ensure the alignment and maximum use
of resources throughout operations, whilst maintaining focus on business
unit performance.
The Group management committee has been strengthened in the last year
by the inclusion of three new members.
The new organisational structure has significantly improved communication
in the Group and ensures that Group-wide goals are achieved. The
interaction between the operational managing directors has increased
cross-business unit opportunities and the sharing of operational best
practices, resulting in a seamless offer to clients.
MARKET OUTLOOK
The Government’s recent announcement of its intention to spend
R67,5 billion to address the backlog in infrastructure will stimulate
local industry.
Despite a global slowdown, world demand for precious metals is driving
development and expansion of mines and industrial plants. Whilst the
strengthening of the Rand has impacted on this expansion, it has been
countered by strong cross-border opportunities.
Oil and natural gas field developments in Africa, coupled with pipe
networks, will provide exciting associated infrastructural development
opportunities in the medium to long term.
The advent of peace in Angola and the longer-term prospects of regional
development through the New Economic Plan for Africa’s Development
(NEPAD) should impact positively on construction activities.
The recent and possible future interest rate cuts should benefit the mining,
industrial and commercial markets.
APPRECIATION
I wish to thank the board for their direction and support and my colleagues
for their enthusiasm, sense of purpose and unwavering commitment,
especially during the three-year period of immense change.
In 2004, the Group will celebrate thirty years as a listed company. I wish to
extend my appreciation and gratitude to management and all members of
staff and their families for making this milestone possible.
OPERATIONAL REVIEW – IDSINFRASTRUCTURAL DEVELOPMENT SERVICES
17
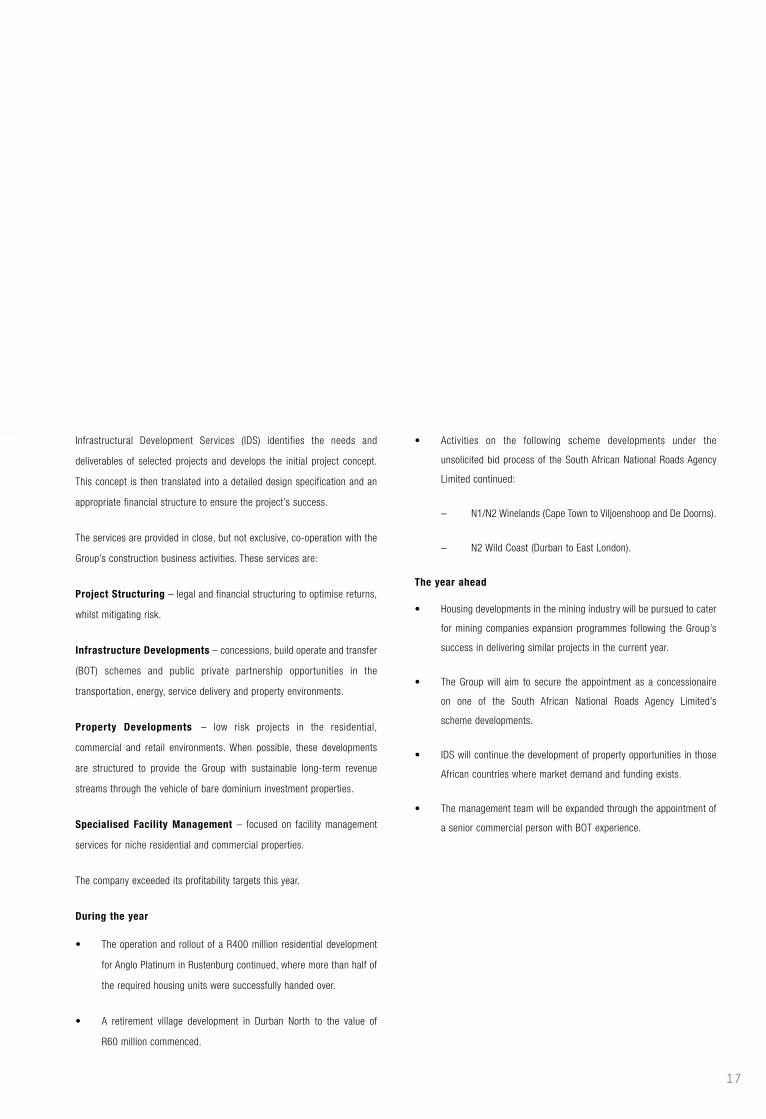
Infrastructural Development Services (IDS) identifies the needs and
deliverables of selected projects and develops the initial project concept.
This concept is then translated into a detailed design specification and an
appropriate financial structure to ensure the project’s success.
The services are provided in close, but not exclusive, co-operation with the
Group’s construction business activities. These services are:
Project Structuring – legal and financial structuring to optimise returns,
whilst mitigating risk.
Infrastructure Developments – concessions, build operate and transfer
(BOT) schemes and public private partnership opportunities in the
transportation, energy, service delivery and property environments.
Property Developments – low risk projects in the residential,
commercial and retail environments. When possible, these developments
are structured to provide the Group with sustainable long-term revenue
streams through the vehicle of bare dominium investment properties.
Specialised Facility Management – focused on facility management
services for niche residential and commercial properties.
The company exceeded its profitability targets this year.
During the year
• The operation and rollout of a R400 million residential development
for Anglo Platinum in Rustenburg continued, where more than half of
the required housing units were successfully handed over.
• A retirement village development in Durban North to the value of
R60 million commenced.
• Activities on the following scheme developments under the
unsolicited bid process of the South African National Roads Agency
Limited continued:
– N1/N2 Winelands (Cape Town to Viljoenshoop and De Doorns).
– N2 Wild Coast (Durban to East London).
The year ahead
• Housing developments in the mining industry will be pursued to cater
for mining companies expansion programmes following the Group’s
success in delivering similar projects in the current year.
• The Group will aim to secure the appointment as a concessionaire
on one of the South African National Roads Agency Limited’s
scheme developments.
• IDS will continue the development of property opportunities in those
African countries where market demand and funding exists.
• The management team will be expanded through the appointment of
a senior commercial person with BOT experience.

OPERATIONAL REVIEW – MANUFACTURING
19
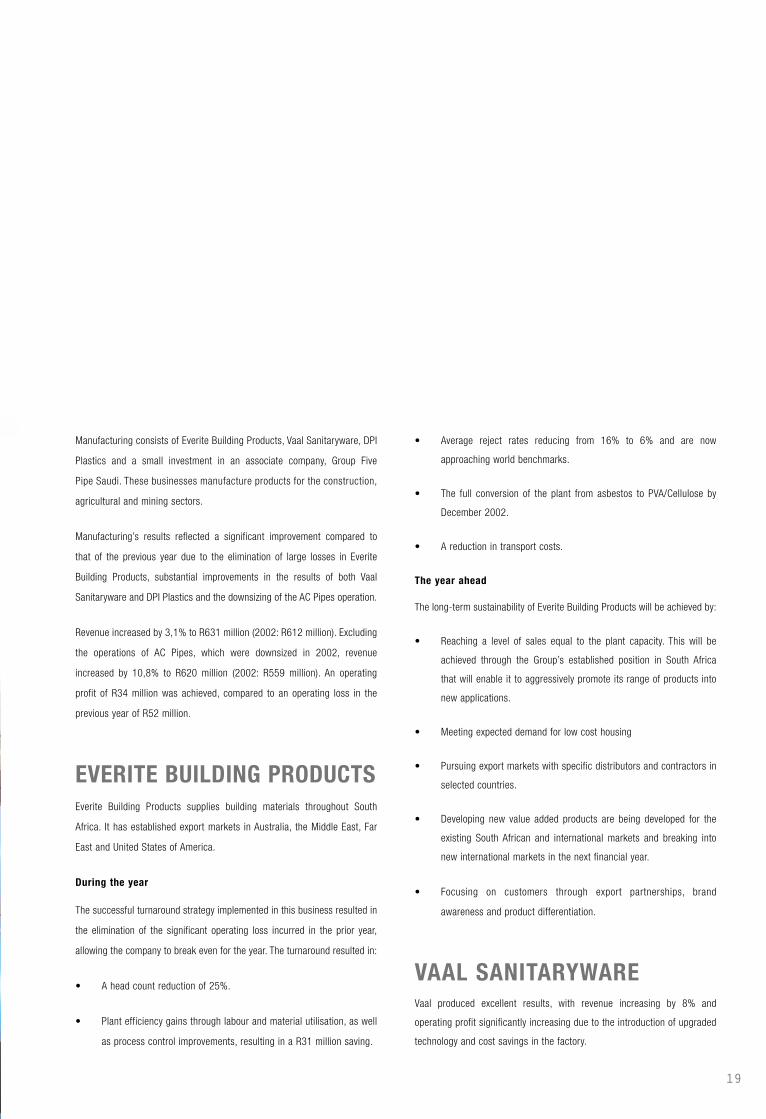
Manufacturing consists of Everite Building Products, Vaal Sanitaryware, DPI
Plastics and a small investment in an associate company, Group Five
Pipe Saudi. These businesses manufacture products for the construction,
agricultural and mining sectors.
Manufacturing’s results reflected a significant improvement compared to
that of the previous year due to the elimination of large losses in Everite
Building Products, substantial improvements in the results of both Vaal
Sanitaryware and DPI Plastics and the downsizing of the AC Pipes operation.
Revenue increased by 3,1% to R631 million (2002: R612 million). Excluding
the operations of AC Pipes, which were downsized in 2002, revenue
increased by 10,8% to R620 million (2002: R559 million). An operating
profit of R34 million was achieved, compared to an operating loss in the
previous year of R52 million.
EVERITE BUILDING PRODUCTSEverite Building Products supplies building materials throughout South
Africa. It has established export markets in Australia, the Middle East, Far
East and United States of America.
During the year
The successful turnaround strategy implemented in this business resulted in
the elimination of the significant operating loss incurred in the prior year,
allowing the company to break even for the year. The turnaround resulted in:
• A head count reduction of 25%.
• Plant efficiency gains through labour and material utilisation, as well
as process control improvements, resulting in a R31 million saving.
• Average reject rates reducing from 16% to 6% and are now
approaching world benchmarks.
• The full conversion of the plant from asbestos to PVA/Cellulose by
December 2002.
• A reduction in transport costs.
The year ahead
The long-term sustainability of Everite Building Products will be achieved by:
• Reaching a level of sales equal to the plant capacity. This will be
achieved through the Group’s established position in South Africa
that will enable it to aggressively promote its range of products into
new applications.
• Meeting expected demand for low cost housing
• Pursuing export markets with specific distributors and contractors in
selected countries.
• Developing new value added products are being developed for the
existing South African and international markets and breaking into
new international markets in the next financial year.
• Focusing on customers through export partnerships, brand
awareness and product differentiation.
VAAL SANITARYWAREVaal produced excellent results, with revenue increasing by 8% and
operating profit significantly increasing due to the introduction of upgraded
technology and cost savings in the factory.

20
During the year
• The focus was to further increase factory efficiencies and satisfy
customer needs.
• Factory technology was upgraded with the introduction of a high
pressure casting system, the installation of computerised driers and
a heat recuperation unit. The upgrade resulted in major productivity
improvements in the last quarter of the financial year.
• Product developments have been accelerated and four new
countertop basins were successfully launched.
• The Group moved away from high volume, low margin products due
to fierce competition in the sanitaryware market.
• Low levels of working capital were maintained through effective
management.
The year ahead
• Increased attention will be placed on customer relationships to
ensure growth in an increasingly competitive market.
• The Group’s new product development programme will be
accelerated, with a view to launching a new range of sanitaryware.
• Efficiencies will continue to be improved through technology upgrades.
DPIDPI manufactures plastic piping systems for a wide range of markets
in South Africa, Namibia, Botswana, Tanzania, Zimbabwe and the Indian
Ocean Islands.
A marked improvement in revenue and operating profit was achieved
through stable market conditions and improved factory efficiencies.
During the year
• Specific attention to empowerment, customer relationships and
product development resulted in the company’s leadership position
and market share being maintained in a highly competitive market.
• A major achievement was the successful commissioning of the new
biaxially orientated uPvC pipe extrusion line and the introduction of
Gemini-Biax to the local market during the last quarter of the
financial year. This will result in substantial raw material savings and
the penetration of new markets due to the superior performance of
the product.
• In accordance with the business implementation of a black economic
empowerment strategy, three black empowerment companies were
established, leading to increased levels of business.
• New product developments and refinements of existing product
ranges continued to receive attention and a number of new pipe and
fittings systems were launched to meet specific customer needs.
The year ahead
To maintain its leadership position, the company will focus on:
• Full implementation of world class manufacturing practices in the
South African manufacturing operations and introducing the
procedures to the cross-border plants. This should result in further
factory efficiency improvements.
• Capitalising on the potential of the black economic empowerment
partnerships. Plans are in place to also establish an empowerment
company in KwaZulu-Natal.
• Continued attention to the Group’s cross-border strategy, with
opportunities in sub-Saharan Africa and the Indian Ocean Islands are
being pursued.
• Improving the performance of the joint venture company DPI-Simba
in Tanzania.
GROUP FIVE PIPE SAUDIThe Group has a 25% interest in an associated company, Group Five Pipe
Saudi, with Marine & Civil and the Al-Qahtani family in Damman, Saudi
Arabia. The company manufactures large diameter spiral welded steel pipes
for the water and gas industries in the Middle East.
Revenue for the year was insufficient to enable the company to achieve
break-even as they did not secure any large contracts. A detailed review of
the company’s markets and its operations is being undertaken to restore
operations to profitability.

21

OPERATIONAL REVIEW - CONSTRUCTION

23
Construction revenue remained constant at R3,2 billion compared with
the exceptional improvement of 40% in the previous year. If the distortion
caused by the violent fluctuations in exchange rates is set aside, the
underlying profit in construction showed an improvement of 18%.
The order book for next year is healthy and with the completion of the
restructuring of the Roads operations, all activities are expected to be
profitable in the next financial year.
BUILDINGGroup Five has maintained and enhanced its position as one of the largest
commercial building operations in South Africa. In addition, major cross-
border operations have been undertaken in Angola, Tanzania and Algeria,
contributing strongly to turnover.
In KwaZulu-Natal the Group’s building operations have been successfully
integrated into a multi-disciplinary construction business, which includes
civils and roads. The integration will allow the business to better meet
market needs and has already resulted in significant overhead cost savings.
Building revenue remained constant, representing 45% of the Group’s
construction revenue. Operating profit before exchange gains/losses
reflected a 29% increase over the previous year.
During the year
• The focus during the current and previous years on securing work in
Tanzania and Algeria has paid off with the award of major contracts
in both countries, totalling R850 million.
• A number of major projects were completed in South Africa, including
the Dimension Data Campus in Bryanston, Vodacom Head Office
Phase IV in Midrand and Nedcor Head Office Phase II in Sandton.
• The management focus given to the Western Cape, where the Group
was not very successful in the past, has resulted in an improved
profit contribution.
• The Group’s housing activities were adversely affected by the deferral
of housing projects for the mining sector which resulted in an under-
recovery of overhead costs.
The year ahead
• Prospects for housing, both within and outside South Africa, are
promising and are being vigorously pursued.
• It is encouraging to note that satisfied customers have negotiated a
number of new building contracts for the year ahead, strongly
boosting the Group’s order book.
• The Angolan operations, which have mainly been involved with the
public sector, are now also focusing on the fast growing private
sector, allowing the Group to tap into a wider market in that country.
• Three new contracts to the value of R170 million for upmarket
apartments at The Oysters in Umhlanga Rocks, KwaZulu-Natal, have
been negotiated and are due to be completed by the end of June 2004.
ROADSGroup Five Roads operates throughout South Africa and selected African
countries. Clients include the various national roads agencies in Africa,

24
provincial and local authorities in South Africa, major international donor
agencies and large mining groups.
Road’s operating losses increased mainly due to a reduction in exchange
gains compared to the previous year and, to a lesser extent, the run out on
problematic contracts.
The restructuring of the operations that commenced more than a year ago
is complete. The restructuring resulted in:
• The appointment in December 2002 of Eugene du Toit as managing
director. Eugene was previously the managing director of Civils
Infrastructure and has been with the Group for 23 years.
• Streamlining the organisation and reducing the management team
from 20 to 11 people.
• A reduction in the number of active contracts from 40 to 15 and the
downsizing of the business unit from a turnover of R737 million in the
current year to a potential R450 million in the coming year. This
action has been taken in order to ensure that focus is given to fewer
contracts so as to achieve better margins.
• The optimisation of the plant fleet which has resulted in a smaller,
more modern fleet which is more cost effective.
The year ahead
• The business unit has secured the major portion of its order book for
the year ahead and any further contracts will only be entered into
after undergoing strict commercial risk assessments to ensure that it
will be profitable and cash positive.
• Concentration is being focused on reducing the capital employed in
this business unit by R100 million by June 2004.
• Implementation of new management reporting and site systems
on all contracts by December 2003 will ensure that relevant
information is available on a timeous basis. This will enable
management to more effectively manage the operations on a
consistent basis.
CIVILSGroup Five Civils is one of the leading civils businesses in South Africa.
It undertakes design and construction work for concrete support structures,
silos, water retaining structures and associated works. It also operates in
selected African countries and Mauritius.
Deferments of major projects by the resource sector in the latter half of the
financial year following the strengthening of the SA Rand, impacted on a
strong operational performance, resulting in a 17% decrease in revenue
and a 10% decrease in operating profit.
During the year
• The business focused on continuing to successfully deliver all
major projects.
• Partnerships were formed with General Electric for the provision of
power generating plants throughout Africa and with Minproc from
Australia for mining projects throughout Africa were formed,
positioning the Group strongly for major future contracts.
• Ongoing work on the Build, Operate, Train and Transfer (BOTT) water
projects in Limpopo and the Eastern Cape was successfully executed.
• The continuous servicing of major clients, such as Sasol and Iscor,
provided a base load of work for Civils throughout the year.
The year ahead
• Improving our long-term planning and business intelligence to reduce
response time to enquiries and the formation of strategic alliances
with various partners will continue to receive attention.
• Customer focus will be improved through the implementation of an
effective CRM strategy, resulting in an integrated approach to
enhancing customer relationships.
• Cross-border opportunities in Angola and Mauritius appear promising
and are being strongly evaluated. The Group is well represented in
these countries, which has positioned it appropriately for securing
upcoming projects.
25
ENGINEERINGEngineering, which operates as Group Five Projects, procures the majority
of its work by supplying, constructing and upgrading industrial and mining
process plants throughout Africa. Its most significant customers are those
in the diamond, platinum, gold, steel and zinc sectors.
The performance of this business was strong despite of delays in finalising
the commercial closure of a mining house contract, which adversely
affected the operating result and led to higher levels of working capital.
Revenue increased whilst operating profit, before taking into account
exchange translations, was in line with the previous year and met
expectations.
During the year
• The management team was restructured, with several high-level
appointments, to improve the electrical and instrumentation
operations and the financial, commercial and logistical areas of
the business.
• In line with our integrated strategy across the full infrastructure value
chain, closer liaison with Civils on the detailed planning of projects
resulted in improved market intelligence and the ability to
secure work.
• The upgrade of risk management procedures commenced during
the year and is continuing to receive special attention to ensure issues
that can lead to adverse bottom line results are proactively addressed.
The year ahead
The strong management team now in place will focus on the issues that will
enhance profitability through:
• Exploiting the benefits from the significant oil, gas and
petrochemical developments planned for southern Africa. This will
be done through the creation of a dedicated petrochemical business
unit, using the technology and skills available through local and
international partners.
• Optimising the recent implementation of the new JD Edwards system
to improve site management and overall management information flow.
• Developing the commercial competence of key staff and the
implementing of appropriate commercial systems and procedures to
ensure that risk management from tender through to contract
execution is improved.
• Applying global best practice in the procurement supply chain which
should lead to lower procurement costs and improved materials
handling and availability.

OPERATIONAL REVIEW – OPERATIONSAND MAINTENANCE
27
Operations and Maintenance has three business units – Intertoll, Water &
Sanitation Services (WSSA) KBR/Group Five Industrial Services and Oasis
Facilities Management. As Oasis has only recently been formed no review
of operations is included.
Revenue increased by 19% during the year, but the strengthening of the
Rand led to a 34% decrease in operating profit.
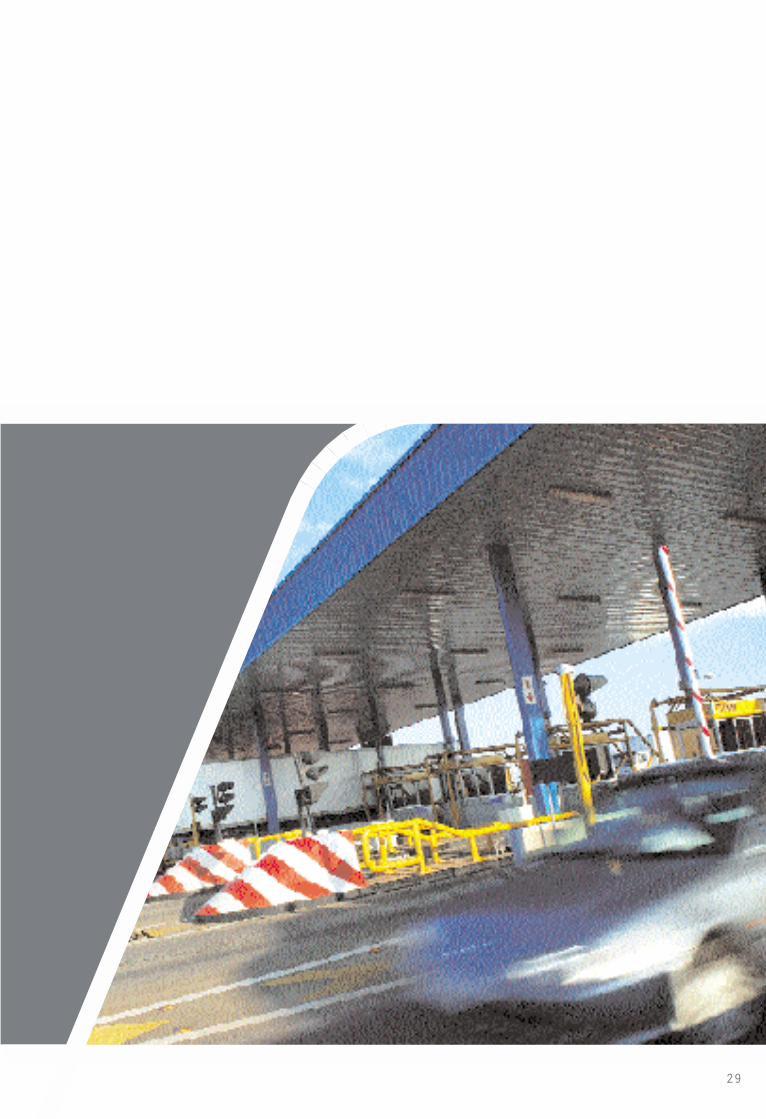
INTERTOLLIntertoll’s activities include the design and development of toll and
motorway facilities, the supply of toll and motorway management equipment
and the operation and maintenance of toll roads.
The business performed in line with expectations. Although revenue grew by
R29 million, operating profits declined due to the lower contribution of
offshore profits as the Rand strengthened and, to a lesser extent, lower
average margins following a five year renewal of a European contract.
During the year
• Intertoll grew its South African activities following the award of a
Comprehensive Operations and Maintenance Contract (CTROM) for
Mariannhill on the N3.
• The Uthungulu Consortium, of which Intertoll is a member, has been
awarded preferred bidder status on the John Ross Highway
Concession at Richards Bay.
• Two substantial eight-year joint venture projects in India were
secured with a local construction partner in Delhi. However, these
projects have not met expectations due to internal problems in the
joint venture.
• The Noida Bridge Concession contract performed ahead of
expectations due to good traffic growth at the facility.
• In the European market, the Hungarian Concession contract has
continued to perform well.
The year ahead
• Focus will be given to resolving the issues affecting performance on
the two National Highway contracts in Delhi.
• The Group’s presence in Western Europe will be developed through
targeting consulting work in Germany, Greece and UK and Operations
and Maintenance projects in the Euro zone.
• The core South African business will be increased through the
National Highway CTROM and Concession programmes.
• Project management resources and technical expertise will be
improved in preparation for the future toll road programmes in South
Africa, India and Western Europe.
• Opportunities in Brazil will be investigated where Intertoll has prior
project experience.
WSSAWSSA is a joint venture with Ondeo Services, part of the global services
group, Suez. This business unit manages, operates and maintains water and
wastewater systems in South Africa.
Revenue increased by approximately 10% and operating profit exceeded
expectations.

28
During the year
• A major focus has been on the improvement of operational
efficiencies which, coupled with recoveries of amounts provided for
in previous years, led to improved profitability.
• Additional work previously managed by local municipalities was also
awarded to the company.
• The Johannesburg Water management contract, aimed at forming
and delivering a sustainable water and sanitation utility to the City of
Johannesburg and its communities, is being implemented to the
clients’ satisfaction.
The year ahead
• Following the success of the productivity improvement programme,
the company has launched a strategy to sustain its position as a
market leader in South Africa with integrated systems at all levels
aimed at optimising both operating and capital expenditure.
• Commercially tailored solutions are being sold to clients as opposed
to concepts and more emphasis is being placed on performance
management at all levels of the organisation.
• The BOTT programme, which provided sustainable water services to
rural populations in the Eastern Cape and Limpopo provinces in
partnership with the Department of Water Affairs and Local
Government, is nearing completion with the transfer of services to
District Municipalities. Nevertheless, a substantial backlog still needs
to be addressed in both sanitation and water provision in these areas
and the Group is well placed to service this need.
KBR/GROUP FIVEINDUSTRIAL SERVICESThe joint venture with Kellogg Brown & Root offers specialist core
maintenance and shutdown services to key customers in the petrochemical
and paper industries. The company performed well in the year exceeding
both turnover and profitability targets.
Significant developments included reaching an agreement in-principle with
Maziya Industries to form a new black economic empowerment joint venture
that will support the black economic empowerment initiatives of our
customers and provide a competitive advantage in the heavy industrial and
petrochemical maintenance markets.
The year ahead
• The strategic positioning of the business in several new market
sectors will be improved with joint venture partners holding
established track records. Specialist maintenance systems and
shutdown training and skills development initiatives are currently
being developed to support this initiative.
29

30
BOARD OF DIRECTORSThe composition of the Board meets the criteria set out in the King II report, with the
majority being non-executives.
Security Association. He previously served as executive chairman of
Building Materials Suppliers of South Africa. George had 32 years
experience at AECI where he was an executive director for 15 years.
3. Howard Turner (60) Chief Financial Officer. Joined the Group and
appointed a director in 1993. He is a CA(SA). He has a Diploma in
Business Information Processing and is a graduate of the Stanford
Executive Programme. He was in public practice with Coopers &
Lybrand from 1962 to 1992, ending his time there as Managing
Partner and a member of the National Executive Committee. He was a
Member of the Board of Directors of Johannesburg Chamber of
Commerce and Industries and currently serves as a Member of the
Board of Directors of The Automobile Association of South Africa and
Iliad Africa Limited.
1. Mike Lomas (55) Chief Executive Officer. Appointed a director in 1992. He
has a BTech (Hons) Civil & Structural Engineering, BSc (Hons) Water
Utilisation Engineering, PrEng. MSAICE, C.Eng.MICE, SEP (Stanford
University) and is a Member of the Institute of Civil Engineers. From 1978 to
1997 he held various executive positions, including managing director of
Group Five Engineering, chairman of the Group’s granite factory and
operations director for the roads and earthworks activities in southern Africa.
2. George Thomas (71) Non-executive Chairman. Appointed a director
in 1996. George is a CA(SA). He is currently the non–executive
chairman of AFC Limited, Property Fund Managers Limited and Capital
Property Fund. He is also a non-executive director of Rex Trueform
Clothing Company Limited, The New Housing Company, Queenspark
(Pty) Ltd, African & Overseas Enterprises Ltd., and Biarritz Parktown
1.
3. 2.

31
a recently formed resource company and a Director of the Bindura Nickel
Corporation in Zimbabwe. He previously served as a Director of LTA
Limited, and an executive vice president and alternate director of the
Anglo American Corporation where he contributed to the development of
their cross-border activities. He was also an executive director of the
African Business Round Table. He has been involved in financial, legal
and commercial negotiations with the World Bank, IFC, MIGA and African
Development Bank and a number of bilateral financial institutions. Kalaa
brings with him a very broad experience in doing business throughout the
African Continent.
7. Dennis Paizes (67) Non-executive Director. Appointed a director in
1996. He holds a BComm degree and has extensive financial services
experience. He has held managerial positions with Union Acceptances,
Manufacturers Life, Liberty Life, AA Mutual and Kirsh Properties. He
retired in 1996 as managing director of Fedsure Asset Managers and
is now a director of several companies and the chairman or trustee of
various pension funds.
4. Piet du Preez (53) Executive Director: Human Resources. Joined the
Group in 1979. Appointed a director in 1998. He holds a BA HBA
degree and a PMD Diploma. He was the senior personnel officer of
Iscor, after which he joined Everite where he was a personnel manager
and group human resource manager. In March 1993, he was appointed
as group human resources director for Group Five.
Harold Banton (60) Executive Director: Business Development.
Joined the Group in 1988. Appointed a director in 1994. He is a fellow
of the British Chartered Institute of Building. He worked for the
construction company John Laings in the UK for 24 years and spent a
few years in the Middle East. He was previously a construction director
of Ovcon and managing director of Goldstein Housing and Group
Five Building.
5. Baroness Chalker of Wallasey (61) Non-executive Director.
Appointed a director in 2001. She is an independent advisor to the
World Bank and to a number of businesses in Britain and southern
Africa. She is also the first female advisory director of Unilever Plc and
chairman of their external affairs and corporate relations committees.
She is also a non-executive director of Ashanti Goldfields Company Ltd.
She was a UK Member of Parliament for Wallasey from 1974 to 1992
and also a Government Minister for 18 consecutive years. She was
Minister of State for Transport for three years and the Minister of State
for Africa at the Foreign & Commonwealth Office for 12 years. She was
also Minister for Overseas Development from 1989 until 1997. During
these eight years she was responsible for overseas development world
wide and for African and Commonwealth affairs.
6. Kalaa Mpinga (42) Non-executive Director. Appointed in 2002.
He holds a BSc in Agricultural Economics and a MSc in International
Agricultural Development. Currently Chairman of Mwana Africa Holdings,
Rufus Maruma (44) Non-executive Director. Appointed in 2002.
He has an STD (Dip), BSc PED, BA (Hons), MSc (Environmental Science)
and several certificates in Environmental Studies. He is a world-
respected tourism, conservation, environmental and waste management
expert, has been a key member of many prestigious councils and
international initiatives and has been head of the Department of
Environmental Affairs and Tourism in the Limpopo Province. He was also
a member of the National Parks Board. He is chairman of Stewart
Scott International, Palabora Mining Company Ltd, Bohlweki
Environmental (Pty) Ltd, is executive chairman of George Stott &
Company, and is a director of Enviroserv Holdings Ltd, Bakwena
Concession Company, Amafaun Faun and Pan African Shopfitters. He is
a member of the advisory panel of the Limpopo Province.
4. 5.
6. 7.

32
OPERATIONAL MANAGEMENTThe Group executive team sets the Group’s direction by formulating and driving strategy. The executive team is comprised of CEO,
CFO, HR director and Group business development director. The management committee, which consists of the executive team and
the MDs of the business units, manages the integration of strategy into the Group and builds culture through the synergy of efforts.
1. Frank Enslin (47) MD: Housing. Appointed 1 March 1996.
BSc (Building Science).
Paul le Sueur (46) MD: Building. Appointed 1 September 1984. BSc,
QS, MAQS, RQS, MSc Building Management.
Roux Gerber (33) MD: Infrastructure Development Services.
Appointed 3 July 2002. BEng (Civil), Executive Programme in
Business Management.
2. Mathathias (Matt) Nkala (45) MD: KwaZulu-Natal. Appointed
1 September 2002. BSc Eng (Electrical), MBL.
3. Andrew Mc Jannet (40) MD Civils Engineering. Appointed 9 January 1987.
BSc Eng (Civil), BA (PPE), MA (Oxon), Pr Eng, MSAICE.
Patrick Ayoub (42) CEO: WSSA. Appointed 1 July 2000. MBA,
General Management Programme CEDEP (INSEAD).
4. Johan de Witt (46) MD: Vaal Sanitaryware. Appointed 1 January 2001.
Advanced Diploma in Business Studies, Executive Management
Programme, Management Development Programme.
Piet Martins (50) MD: Angola. Appointed 1 October 1984.
National Diploma Civil Engineering.
1. 2.
3. 4.

33
5. Peter Keenan (46) MD: Civils Mining and Industrial.
Appointed 5 October 1990. Higher National Diploma Civil Engineering.
Michael Upton (49) MD: Projects. Appointed 1 September 2002.
BSc Eng (Electrical), Management Development Programme,
Pr Eng, SAIEE.
6. Eugene du Toit (48) MD: Roads and Earthworks.
Appointed 1 January 1980. BSc Eng (Civil), BEng (Hons),
Construction/Project Management Diploma in Arbitration.
Tim Woodhead (44) MD: Intertoll.
Appointed 24 August 1992. BSc Eng (Civil), MBA.
7. Glenn Geldenhuis (47) MD: DPI Plastics. Appointed 1 May 1998.
BEng (Electronics) (Hons), MBL.
John Wallace (45) MD: Everite Building Products.
Appointed 1 April 2002. BCom, Executive Programmes in
Advanced Marketing and Executive Management.
8. Paul O’Flaherty (40) Group Financial Controller. Appointed
1 January 2002. BCom, BAcc, CA (SA).
5.
7.
6.
8.

CORPORATE GOVERNANCE“Corporate Governance is concerned with holding the balance between economic and social goals and between
individuals and communal goals… the aim is to align as nearly as possible the interests of individuals,
corporations and society.”Sir Adrian Cadbury, Corporate Governance Overview, 1999 World Bank Report
34

35
INTRODUCTION
Essentially, corporate governance is the means of
ensuring due and adequate control over the strategy and
direction of an organisation and the management, use and
disposition of its assets – both financial and non-financial
– in achieving its key objectives.
The Board of Group Five Limited fully subscribes to the principles of
discipline, transparency, independence, accountability, responsibility,
fairness and social responsibility as endorsed by King II.
The Group continuously benchmarks itself against the recommendations of
King II and complies to the extent considered practical. If and when areas
of non-compliance are discovered, they are addressed.
BOARDS AND DIRECTORS
(A) THE BOARD
The board is responsible for the good governance of the Group, which
encompasses driving strategic direction and taking responsibility
for a range of key decisions affecting such strategy. This role,
together with the monitoring of executive directors, board committees
and management policies and decisions, ensures that the board
retains effective control and acts as an independent representative
for shareholders.
The board meets quarterly and at other times as is deemed
necessary. In fulfilling their duties, both to the Group and its
shareholders, the directors aim to act impartially and independently
when considering matters of strategy, performance and allocation of
resources, and to maintain the highest levels of conduct. The board
has established a number of committees in which the non-executives
play an active role and which operate within defined terms of
reference as laid down by it.
(B) CHAIRMAN AND CHIEF EXECUTIVE OFFICER
The posts of chairman and chief executive officer are separately held
with a clear division of duties. The chairman’s post is held by a non-
executive director. The chairman’s performance is evaluated annually
at a board meeting.
(C) COMPOSITION OF THE BOARD
The board consists of four executive directors and five non-
executive directors.
The performance of the former is evaluated by the remuneration
committee and the latter by the chairman in consultation with the CEO
and executive directors.
All the non-executive directors are considered independent in terms
of the criteria of King II. Full details of the current directors are set out
on page 30 – 31 of the financial statements.
There is no formally constituted nomination committee for the
election of directors. The board considers that such a committee is
not required as this function is dealt with by the remuneration
committee and details of any proposed candidate are distributed to all
directors for consideration before any appointment is made.
(D) BOARD COMMITTEES
Currently, the board has three formalised committees as set
out below.
Risk committee
The risk committee consists of the chairman, CEO, CFO and one non-
executive director.
The risk management process to date has been to manage the
Group’s business risks by safeguarding its assets and revenues,
ensuring compliance with the numerous statutory laws and
regulations affecting it, as well as insuring for those events beyond
the control of management.
The risk committee, which was established in the previous year,
is now fully functional and its specific terms of reference include
providing a policy, framework and methodology for the Group to
identify, analyse and manage risk, and to provide assurance to the
board that the risk management policy and strategy set by the board
is operating effectively. The committee is not responsible for risk
management, but facilitates, challenges and drives the process.
Audit committee
The audit committee consists of the chairman, CEO, CFO and
two non-executive directors. Both the internal and external auditors
have unrestricted access to the audit committee. Meetings are held
at least three times a year and are attended by the external
and internal auditors. All directors have an open invitation to attend
these meetings.
The audit committee operates in accordance with written terms of
reference which include approving and evaluating the external

auditors and their audit plan (including fees), approving and
evaluating the internal auditors and their audit plan, reviewing and
approving the annual financial statements and interim report, and
reviewing the significant findings and problems arising from both the
external and internal audits.
The audit committee believes that both the external and internal
auditors are independent.
Remuneration committee
The remuneration committee consists of the chairman, the CEO, one
executive director, two non-executive directors and an independent
external consultant. Its specific terms of reference as delegated
by the board embrace recommendations with regards to Group
remuneration policy, approval of remuneration packages for executive
directors and senior officials, bonus and incentive schemes and
applications, non-executive directors’ fees, share purchase and
option schemes and service agreements.
(E) DIRECTORS’ REMUNERATION
Summary
Year Year
ended ended
30 June 30 June
2003 2002
R’000 R’000
Executive directors
• For management
services, excluding
incentives 7 086 8 612
• Performance and
equity incentives 3 946 4 249
11 032 12 861
Non-executive directors
• Directors’ and other fees 1 316 461
Total 12 348 13 322
CORPORATE GOVERNANCE CONTINUED
36

37
DETAILS OF EMOLUMENTS PAID:
Executive directors
Retirement,
medical and Performance
Salary and other and equity
car allowance contributions incentives Other Total
Name (R’000) (R’000) (R’000) (R’000)
30 June 30 June 30 June 30 June 30 June
2003 2002 2003 2002 2003 2002 2003 2002 2003 2002
M Lomas 1 589 1 367 265 225 1 409 1 261 15 92 3 278 2 945
H Turner 1 121 991 190 165 949 939 28 58 2 288 2 152
P du Preez 811 749 182 133 680 480 40 41 1 713 1 403
P Erasmus 1 532 434 152 75 209 – 27 28 1 920 537
H Banton 930 796 170 141 699 639 34 92 1 833 1 667
P Sneddon – 528 – 84 – – – 63 – 675
P le Sueur – 676 – 118 – 654 – 92 – 1 540
FT Venter – 572 – 116 – 189 – 102 – 979
BD van Wyk – 606 – 109 – 87 – 160 – 962
5 983 6 719 959 1 166 3 946 4 249 144 728 11 032 12 861
Non-executive directors
Total Total
30 June 30 June
2003 2002
R’000 R’000
G Thomas 293 124
L Chalker 447 254
D Paizes 84 44
GM Negota – 49
K Mpinga 256 –
M Maruma 236 –
1 316 461
(F) COMPANY SECRETARY
The company secretary is appointed by the board. The company
secretary’s statement of compliance is set out on page 44 of the
financial statements.
All directors have access to the advice and services of the company
secretary, who is responsible to the board for ensuring board
procedures are complied with. Notwithstanding, all directors are,
however, entitled to seek independent professional advice about the
affairs of the Group at the Group’s expense.
A formal orientation programme for the induction of new directors as
well as a re-orientation programme for existing directors is being
implemented. The company secretary is also responsible for alerting
directors to any relevant changes to the Companies Act, the Insider
Trading Act and the JSE Listings Requirements.
(G) OTHER
The board acknowledges its responsibility for the preparation,
integrity and fair presentation of the annual financial statements, as
well as its responsibility in assessing the going concern of the
Group. A statement in this regard is set out on page 44 of the
financial statements.
The Group’s new Code of Ethics will be introduced during the
forthcoming year.
RISK MANAGEMENT, INTERNAL AUDIT AND
INTERNAL CONTROLS
The Group maintains systems of internal control over financial reporting and
over safeguarding of assets, which are designed to provide reasonable
assurance to the board of directors and the Group’s senior management
regarding the preparation of reliable published financial statements and the
safeguarding of the Group’s assets.
An internal audit team reports directly to the audit committee and its role
includes an evaluation and assessment of the Group’s compliance with its
internal control procedures as described above.
A management sub-committee of the board risk committee is tasked to
formally identify, rate and document the broad spectrum of high level risks
in all areas of the Group on an ongoing basis, including strategic;
operational; financial; human resource; safety; health; environment and
quality; information technology; and marketing and business development.
In a move away from a predominantly financial focus on risk, the Group has
reviewed its information requirements in line with best practice processes
and systems and is now in the process of implementing suitable hardware
and software to assist management in its ability to identify, evaluate,
monitor and report on all significant risks in an accurate, relevant and
timeous manner.
SOCIAL UPLIFTMENT AND DEVELOPMENT
The Group continues to focus on providing bursaries to students from
previously disadvantaged communities. In conjunction with Rand Afrikaans
University progress was made in identifying and attracting talented black
scholars into the engineering profession.
Corporate Social Investment activities revolved around community
upliftment projects. Donations amounting to R404 000 (2002: R280 640)
were made. Key focus areas for donations were for HIV/AIDS, education and
projects aimed at improving the quality of life in communities.
The Group continues to implement various commercial equity initiatives in
order to bring people from historically disadvantaged communities into
mainstream economic opportunities. Examples of this are:
• The establishment of Dilokong (Pty) Ltd by the Civils Mining and
Industrial business unit. Dilokong is 50% black owned and supplies
concrete to all Eastern Limb Platinum Developments.
• DECTI, a specialist procurement verification company, in
conjunction with various mining houses, is in the process of
accrediting the Civils Mining and Industrial business unit as
meeting their black empowerment criteria. Civils Mining and
Industrial will then be listed with the “SA Mining Preferential
Procurement Forum” as a preferred contractor.
• DPI has successfully established three black empowerment merchant
trading companies which supply a complete range of civil and
industrial products to various Southern African markets. These
companies are DPI-Motown, Incledon-DPI and DPI-Phumela Trading.
All three have performed exceptionally well.
Group Five continues to seek opportunities to establish black empowerment
companies with historically disadvantaged community groups.
EMPLOYMENT EQUITY
The Group remains committed to pursuing its employment equity
objectives. Where possible opportunities are sought to develop people from
within. However, a shortage of skills at more senior levels and difficulty in
attracting the right calibre of people into the industry at tertiary level
means that progress is slower than anticipated.
CORPORATE GOVERNANCE CONTINUED
38

39
The percentage of employees from designated groups (ie previously disadvantaged individuals) by occupational category is reflected in the table below:
% EMPLOYEES FROM DESIGNATED GROUPS
Category Actual Actual Actual Target
June 2001 June 2002 June 2003 June 2006
Senior Management (Peromnes 1 – 5) 7,1% 6,5% 8,8% 20%
Middle Management (Peromnes 6 – 7) 18,5% 19,9% 18,2% 35%
Specialised/Skilled (Peromnes 8 – 11) 56,6% 57,3% 56,4% 50%
Administration (Peromnes 12 – 13) 96,3% 96,7% 95,6% 60%
Semi Skilled/Lower (Peromnes 14 – 19) 99,6% 99,3% 99,1% 90%
SAFETY, HEALTH, ENVIRONMENT
AND QUALITY (SHEQ)
The ability to effectively manage safety, health, environment and quality
issues within all operations is of paramount importance to the success of
the Group. Significant investments have been made in SHEQ initiatives and
excellent progress achieved in implementing such initiatives. Outside
expertise has assisted in transferring knowledge into the Group.
SAFETY
Based on a process of investigations and appraisals of existing market
place safety and health management systems, the development of the
Group Five Safety and Health system was completed. This management
system was developed in line with the “Occupational Health and Safety
Assessment Series 18001” (OHSAS 18001) management system
standards. A major advantage of this management system, with external
certification by the South African Bureau of Standards (SABS), is that it
offers assurance to the Group’s clients that the highest standards will be
maintained by all operations. The objective is to attain full OHSAS 18001
certification in all business units.
The Group’s initiatives in this regard resulted in notable external safety
awards on the following projects:
• NOSA 4 Star Grading
– Sasol 1
– Silvacel Mondi
• NOSA 5 Star Grading
– Marula Mine
– SSF Secunda
– Twickenham Mine
• MBA 5 Star Grading
– Silvacel Mondi
– Oyster Rock (Umhlanga Rocks)
– Engen Refinery
HUMAN RESOURCES
The Group’s human resources management priorities are:
• Manpower and succession planning
• Performance management
• Identification of talent and development of our people
• Application of best practice in people management processes
• Employment equity
The shortage of skills in both management and engineering/technical
arenas continues to stretch existing resources. Identification and retention
of talent in the organisation and developing the student pipeline from
designated groups remain imperatives.
The Group’s manpower and succession planning approach has been
significantly revised during the past year and is in the process of being
implemented throughout the business units. This should result in the right
quality and quantity of skills being available at all levels in the future.
During the year under review the Group introduced a revised incentive
scheme at senior management levels. The new scheme is aimed at
improving shareholder value by focusing not only on financial but also on
strategic objectives.
Employee assistance programmes are being revised to ensure appropriate
support for employees and families working in African countries.
The Group continues to maintain sound industrial relationships with all
stakeholders and was not negatively affected by industrial action during the
year under review.
In the year ahead the focus will be on manpower and succession planning
together with building managerial skills to deal with growth strategies.

40
Group Five Housing received the “Best Construction Company” safety award
from Anglo Plats Rustenburg on the Oasis housing project.
HEALTH
The Group’s Occupational Health programmes continued to focus on health
risks in the working environments as well as the management of
occupational health risks related to employees working in African countries.
To this extent the Group is maintaining five Occupational Health Clinics to
monitor occupational health trends.
The Group’s Executive Health Policy and Programme was revisited and a
structured programme was introduced in the year under review.
Third party services were engaged to advise the Group on safety and
health issues.
HIV/AIDS
The Group, in consultation with Medscheme completed a critical evaluation
of processes and activities relating to the HIV/Aids pandemic and resultant
impact on the Group’s activities.
Based on best practice both nationally and internationally, our policy and
practices were reviewed resulting in a revised HIV/Aids strategy which is
currently being implemented throughout the Group.
The outcome of an “actuarial modelling” exercise to assess the impact on
risk benefit arrangements is still awaited.
ENVIRONMENT
The Group remains committed to the achievement of ISO 14000 certification
by the end of 2004.
The focus from an environmental perspective remains on sustainability and
minimising the environmental impact of all operations.
QUALITY MANAGEMENT
Certification of our business units in terms of ISO 9001 increased from 50%
in the previous financial year to 86% at the end of June 2003. This
achievement was mainly due to the leadership commitment in the Group’s
business units to provide quality service to our customers.
We are confident that with the continued implementation of the Group’s
integrated quality management system all business units will be certified by
the end of the next financial year.
STAKEHOLDER COMMUNICATION
The Group is committed to a policy of effective communication with its
stakeholders, in particular with the investment community. The policy is one
of honest, open and timeous communication on both financial and non-
financial matters.
The executive committee of the Group, which is chaired by the chief
executive officer, together with the assistance of external consultants,
monitors and evaluates on a monthly basis the effectiveness of the
communication strategy. In addition to formal communications, matters
considered of general interest to all shareholders are communicated on the
Stock Exchange News Services (“SENS”). The board deems the annual
general meeting to be a further forum for contact with shareholders and
encourages their attendance and participation.
The Group has a corporate website (www.g5.co.za) and wishes to pursue
the electronic communication and distribution of annual financial
statements, interim reports and voting/proxies. To this end and to ensure
the Group remains abreast with updates in the Companies Act and the JSE
Listings Requirements, the Group’s Memorandum and Articles have been
modified where necessary and shareholders will be asked to adopt them at
the forthcoming Annual General Meeting.
CORPORATE GOVERNANCE CONTINUED

41
CHIEF FINANCIAL OFFICER’S REPORT
FINANCIAL OVERVIEWRevenue increased by 2% to R4,1 billion (2002: R4,0 billion), earnings per
share by 26% to 140,0 cents (2002: 111,4 cents) and headline earnings
per share by 24% to 111,3 cents (2002: 90,0 cents).
Total dividends of 37 cents relating to the year under review represent an
increase of 19% over the previous year. The dividends are approximately
3,8 times covered, which is in line with the Group’s policy of being between
three and four times covered.
RESULTS OF OPERATIONSThe Group’s overall performance for the year has been pleasing given the
volatility experienced in the currency markets. The policy of limiting our
foreign currency exposure by matching, to the extent possible, the currency
in which revenues are received with the currency of related costs and
repatriating all available foreign cash immediately, has minimised the
adverse effect of the extreme currency fluctuations.
Due to the strengthening of the Rand revenue generated outside South
Africa during the past year has decreased to 33% of the Group’s turnover
compared to 37% in the previous year.
Operating profit increased by 29% to R160,1 million (2002: R124,6 million).
Included in operating profit are foreign exchange losses of R2,4 million in
the current year compared to exchange gains of R64,2 million in the prior
year, due to the strengthening of the Rand.
Reference should be made to the Segmental Analysis on page 52 and the
Operational Review on pages 16 to 28 for a detailed explanation of
the results.
Net finance costs increased from R26,4 million to R28,5 million due to
higher average interest rates and increased levels of working capital.
The effective tax rate was 23,1% (2002: 20,2%) primarily due to the use of
tax losses for which no deferred tax asset was previously raised.
The Group has tax losses of half a billion Rand available for set off against
future taxable income.
LIQUIDITY AND CAPITALRESOURCESFunding and treasury policies are managed centrally by the Group.
Included in cash and cash equivalents at 30 June 2003 is an amount of
R137,8 million (2002: R120 million) relating to advance payments on
foreign contracts which is only available to the Group when the last
certificates on the relevant contracts are approved.
The Group’s directors believe that working capital resources, by way of cash
generated from operations, borrowing facilities and existing cash on hand
are sufficient to meet the Group’s future working capital needs.
CASH RESOURCES
Operations
Net cash generated from operations of R129 million was in line with the
prior year amount of R132,2 million.
Investing
Net expenditure on fixed assets and investments of R118,4 million
(2002: R132,7 million) was in line with budget. Plant in the Roads business
unit considered excess to requirements was disposed of as part of the
process of optimising plant to a smaller but more modern fleet.
CREDIT FACILITIES
The Group has a total local borrowing facility with major South African banks
of R238 million of which R173 million was drawn down at 30 June 2003

42
(2002: R107 million). Total financial institution backed guarantees provided
to third parties amounted to R1,1 billion which was at the limit of the total
facilities provided.
The Group’s investment in the finance leases relating to the Anglo Plats
mining house employees project of R266,3 million at 30 June 2003 has
been offset for disclosure purposes against a long-term loan due to
Nedbank of the same amount. This is in accordance with AC 125 “Financial
Instruments – Presentation and Disclosure" as there is a legally enforceable
right to offset the amounts.
OTHERTHE YEAR AHEAD
In line with the overall Group strategy the financial function will be focused
on the following objectives in the next year:
• Optimising the utilisation of the JD Edwards ERP software which was
successfully implemented in the Construction and Infrastructure
Development Services operations during the year;
• Streamlining and enhancing the performance of the recently formed
financial and payroll shared services operation;
• Implementing the JD Edwards ERP software in the Manufacturing and
Operations and Maintenance operations;
• Significantly improving working capital management through the
setting of detailed objectives by business units, monitoring progress
and taking corrective action where necessary; and
• Raising the standard of financial reporting and analysis of results to
ensure that there is effective interpretation and monitoring as well as
relevant and timeous management action.
LITIGATION AND CONTINGENCIES
The Group is from time to time involved in various claims and legal
proceedings arising in the ordinary course of business. The directors do not
believe that the outcome of any of the pending proceedings or claims
against the Group will have a material adverse effect on the financial
condition or future operations of the Group.
CHIEF FINANCIAL OFFICER’S REPORTCONTINUED

43 / financial statements
CONTENTS
44 / statement of responsibility bythe board of directors
44 / statement of compliance bythe company secretary
45 / report of the independent auditors46 / directors’ report48 / income statement49 / balance sheet50 / cash flow statement
51 / statement of changes in equity52 / segmental analysis53 / accounting policies58 / notes to the financial statements71 / annexure 1 company balance sheet72 / annexure 2 interest in subsidiaries73 / annexure 3 investment in joint ventures75 / annexure 4 investment in associates76 / annexure 5 analysis to shareholders

The directors are responsible for the maintenance of proper accounting records and the preparation, integrity and fair
presentation of the financial statements of Group Five Limited and its subsidiaries. The financial statements, presented on pages
46 to 77 have been prepared in accordance with South African Statements of Generally Accepted Accounting Practice and in the
manner required by the Companies Act in South Africa and include amounts based on judgements and estimates made by
management. The directors also prepared the other information included in the annual report and are responsible for both its
accuracy and its consistency with the financial statements.
The directors also have general responsibility for taking such steps as are reasonably open to them to safeguard the assets of
the Group and prevent and detect fraud and other irregularities. The going concern basis has been adopted in preparing the
financial statements. The directors have no reason to believe that the Group will not be a going concern in the foreseeable future
based on forecasts and available cash resources. The viability of the Group is supported by the financial statements.
The financial statements have been audited by the independent accounting firm, PricewaterhouseCoopers Inc., who have been
given unrestricted access to all financial records and related data, including minutes of all meetings of shareholders, the board
of directors and committees of the board. The directors believe that all representations made to the independent auditors during
their audit were valid and appropriate. PricewaterhouseCoopers Inc.’s unqualified audit report is presented on page 45.
The financial statements were approved by the board of directors on 20 August 2003 and are signed on its behalf by:
GM Thomas MH Lomas
44 / financial statements
Statement of Responsibility by the Board of Directorsfor the year ended 30 June 2003
The company has lodged with the Registrar of Companies all such returns as are required of a public company in terms of the
Companies Act 61 of 1973, and all such returns are true, correct and up to date.
GD Mottram
20 August 2003
Statement of Compliance by the Company Secretaryfor the year ended 30 June 2003

Report of theIndependent Auditors
for the year ended 30 June 2003TO THE MEMBERS OF GROUP FIVE LIMITED
We have audited the company and Group financial statements set out on pages 46 to 77 for the year ended 30 June 2003. These
financial statements are the responsibility of the company’s directors. Our responsibility is to express an opinion on these financial
statements based on our audit.
SCOPE
We conducted our audit in accordance with Statements of South African Auditing Standards. Those standards require that we
plan and perform the audit to obtain reasonable assurance that the financial statements are free of material misstatement.
An audit includes:
• examining, on a test basis, evidence supporting the amounts and disclosures included in the financial statements;
• assessing the accounting principles used and significant estimates made by management; and
• evaluating the overall financial statement presentation.
We believe that our audit provides a reasonable basis for our opinion.
AUDIT OPINION
In our opinion, the financial statements fairly present, in all material respects, the financial position of the company and Group at
30 June 2003 and the results of their operations and cash flows for the year then ended in accordance with South African
Statements of Generally Accepted Accounting Practice, and in the manner required by the Companies Act in South Africa.
PricewaterhouseCoopers Inc.
Registered Accountants and Auditors
Chartered Accountants (SA)
Johannesburg
20 August 2003
45 / financial statements

Directors’ Reportfor the year ended 30 June 2003NATURE OF BUSINESS
Group Five Limited is an investment holding company with interests in the construction, engineering, manufacturing and
operations and maintenance industries. The company does not trade and all of its activities are undertaken through its
subsidiaries, joint ventures and associates.
GROUP RESULTS
The consolidated income statement for the year is set out on page 48 and attention is drawn to the reports of the chairman, chief
executive officer and chief financial officer for comment thereon. Segmental information as approved by the directors relating to
the business of the Group is set out on page 52.
SHARE CAPITAL
The authorised and issued share capital is as follows:
Authorised:
150 000 000 ordinary shares of no par value.
Issued:
73 573 023 ordinary shares of no par value with 4 453 432 ordinary shares held as treasury stock.
DIVIDENDS
On 20 August 2003, the directors declared a final dividend of 23,0 cents per ordinary share (2002: 20,0 cents). In order to
comply with the requirements of STRATE the relevant details are:
Event Date
Last day to trade cum-dividend 17 October 2003
Shares to commence trading ex-dividend 20 October 2003
Record date (date shareholders recorded in books) 24 October 2003
Payment date 27 October 2003
No share certificates may be dematerialised or rematerialised between 20 October 2003 and 24 October 2003, both dates inclusive.
46 / financial statements
Directors’ Reportfor the year ended 30 June 2003
DIRECTORS AND SECRETARY
The names of the directors appear on page 30 and 31 of this report. Since the date of the last annual financial statements the
following movement took place:
Executive/
Name Non-executive Resigned
PJ Erasmus Executive 7 March 2003
In terms of the articles of association of the company, Messrs MR Maruma and KK Mpinga retire as non-executive directors and
Mr MH Lomas retires as executive director from the board at the forthcoming annual general meeting. Being eligible, they
offer themselves for re-election. The name and registered office of the company secretary appears on page 78 of this report.
DIRECTORS’ SHAREHOLDINGS
At 30 June 2003 the number of ordinary shares held beneficially and non-beneficially by the current directors was 907 015 and
nil respectively (2002: 932 215 and nil respectively). There has been no material change in their holdings between the year-end
and the date of this report.
BORROWING POWERS
In terms of the articles of association the company has unlimited borrowing powers.
AUDITORS
PricewaterhouseCoopers Inc. will continue in office in accordance with section 270(2) of the Companies Act.
47 / financial statements

Income Statementfor the year ended 30 June 2003
Group
2003 2002
Notes R’000 R’000
Contract, property rental and development revenue 3 246 925 3 240 272
Other sales revenue 853 436 780 484
Total revenue 2 4 100 361 4 020 756
Total operating cost (3 940 234) (3 896 183)
Operating profit 3 160 127 124 573
Finance costs 4 (28 530) (26 397)
Profit before taxation 131 597 98 176
Taxation 5 (30 463) (19 821)
Profit after taxation 101 134 78 355
Minority interest (4 366) (1 346)
Attributable profit for the year 96 768 77 009
Earnings per share/fully diluted earnings per share (cents) 6.1 140,0 111,4
Headline earnings per share (cents) 6.2 111,3 90,0
Dividends per share (cents) – based on years to which they relate 37,0 31,0
48 / financial statements

Balance Sheetat 30 June 2003
Group
2003 2002
Notes R’000 R’000
ASSETS
NON-CURRENT ASSETS
Fixed assets 7 509 425 449 477
Associates 8 14 659 16 652
Other investments 9 80 048 78 793
604 132 544 922
CURRENT ASSETS
Inventories 10 213 738 264 580
Contracts in progress 11 196 823 256 526
Accounts receivable 12 814 842 907 055
Bank balances and cash 13, 23 263 618 299 873
1 489 021 1 728 034
Total assets 2 093 153 2 272 956
EQUITY AND LIABILITIES
CAPITAL AND RESERVES
Shareholders’ equity 455 080 381 813
MINORITY INTERESTS IN SUBSIDIARIES 9 899 5 949
NON-CURRENT LIABILITIES
Interest-bearing borrowings 13 60 832 50 803
Provision for post-employment obligations 19 46 199 55 296
Deferred taxation 14 – –
107 031 106 099
CURRENT LIABILITIES
Accounts payable 15, 23 1 142 349 1 381 931
Provisions for liabilities and charges 16 124 757 166 659
Taxation 17 862 19 078
Bank overdrafts and short-term borrowings 13, 23 236 175 211 427
1 521 143 1 779 095
Total liabilities 1 628 174 1 885 194
Total equity and liabilities 2 093 153 2 272 956
49 / financial statements

Cash Flow Statementfor the year ended 30 June 2003
Group
2003 2002
Notes R’000 R’000
CASH FLOW FROM OPERATING ACTIVITIESOperating profit before working capital changes 20 216 803 179 738
Working capital changes 21 (87 823) (47 462)
Cash generated from operations 128 980 132 276
Finance costs (28 530) (26 397)
Taxation paid 22 (29 630) (43 982)
Dividends paid (23 501) (17 971)
Cash effects of operating activities 47 319 43 926
CASH FLOW FROM INVESTING ACTIVITIES
Acquisition of fixed assets (161 569) (157 800)
Acquisition of investments (1 255) (14 245)
Repayments by associates 4 302 4 705
Proceeds on disposal of fixed assets 40 171 34 598
Cash effects of investing activities (118 351) (132 742)
CASH FLOW FROM FINANCING ACTIVITIES
Long-term borrowings raised 26 161 34 665
Long-term borrowings repaid (16 132) (14 757)
Cash effects of financing activities 10 029 19 908
Net decrease in cash and cash equivalents (61 003) (68 908)
Cash and cash equivalents at beginning of year 88 446 157 354
Cash and cash equivalents at end of year 23 27 443 88 446
50 / financial statements

Statement of Changes in Equityfor the year ended 30 June 2003
Group
2003 2002
R’000 R’000
STATED CAPITALOpening and closing balance (69 119 591 no par value shares) 286 245 286 245
286 245 286 245
DISTRIBUTABLE RESERVES
Opening balance 95 568 36 530
Retained earnings for the year 96 768 77 009
Dividends paid (23 501) (17 971)
Closing balance 168 835 95 568
Shareholders’ equity 455 080 381 813
73 573 023 (2002: 73 573 023) ordinary shares have been placed under the control of the directors until the next annual
general meeting of shareholders. 4 453 432 (2002: 4 453 432) ordinary shares are held as treasury stock by the Group.
51 / financial statements

Segmental Analysisfor the year ended 30 June 2003INDUSTRY SEGMENTS
For management purposes, the Group is organised on a worldwide basis into four major operating segments as depicted within
the graphs below:
52 / financial statements
200
150
100
50
0
-50
-100
Industry Segments – Operating profit/(loss)R millions
Construction
2003 2002
Manufacturing Operationsand Maintenance
IDSTotal
160
125
91
137
3434
(52)
16
25
19 15
4 500
4 000
3 500
3 000
2 500
2 000
1 500
1 000
500
0
Industry Segments – RevenueR millions
Construction
2003 2002
Manufacturing Operationsand Maintenance
IDSTotal
4 10
0
4 02
1
3 20
4
3 18
0
631
612
234
197
3131 32
2 500
2 000
1 500
1 000
500
0
Industry Segments – Total assetsR millions
Total
2003 2002
Manufacturing Operationsand Maintenance
IDSConstruction
1 83
0 1 98
5
1 06
2 1 19
9
469
438
164
148
135 20
0
800
600
400
200
000
800
600
400
200
0
Industry Segments – Total liabilitiesR millions
Total
2003 2002
Manufacturing Operationsand Maintenance
IDSConstruction
1 37
4
1 63
5
1 13
8
116
136
84 95
36 36
1 36
8
200
150
100
50
0
Industry Segments – Capital expenditure and depreciatR millions
Capex 2002 Capex2003 Depreciation 2002 Depreciation
Total Manufacturing Operationsand Maintenance
IDSConstruction
173
158
8982
110
6353 55
4576
3224
4 3 33 3
14 161
GEOGRAPHICAL SEGMENTS
The Group’s segments are managed on a worldwide basis and operate in three principal geographical areas of the world.
4 500
4 000
3 500
3 000
2 500
2 000
1 500
1 000
500
0
Geographical Segments – RevenueR millions
2003 2002
Total Other Africancountries
Othercontinents
South Africa
4 10
0
4 02
1
2 74
2
2 54
4
1 24
3
1 39
1
115
86
2 500
2 000
1 500
1 000
500
0
Geographical Segments – Total assets andcapital expenditure R millions
2003 Total assets 2002 Total assets2003 Capital expenditure 2002 Capital expenditure
Total Other Africancountries
Othercontinents
South Africa
1 83
0 1 96
5
1 11
4 1 29
3
173
158
1 29
3
157
156
606
556
15
110
136
Accounting Policies
1. PRINCIPAL ACCOUNTING POLICIES
The financial statements are prepared on the historical cost basis as modified by the revaluation of investments and
investment property. The following are the principal accounting policies used by the Group which are in conformity with
South African Statements of Generally Accepted Accounting Practice and, other than stated in note 1.25, are consistent
with those of the previous year. Where necessary, comparative figures have been adjusted to conform with changes in
presentation in the current year.
1.1 USE OF ESTIMATES
The preparation of the financial statements in conformity with South African Statements of Generally Accepted
Accounting Practice requires the Group’s management to make estimates and assumptions that affect the reported
amounts of assets and liabilities and disclosure of contingent assets and liabilities at the date of the financial
statements, and the reported amounts of revenues and expenses during the reporting period. Actual results could
differ from those estimates.
1.2 BASIS OF CONSOLIDATION
Subsidiaries
The consolidated financial statements include those of the holding company and its subsidiaries. The results of the
subsidiaries acquired or disposed of during the year are included in the consolidated income statement from
the effective date of acquisition and up to the effective date of disposal. Intra-group profits are eliminated on
consolidation.
Joint ventures
Joint ventures are those entities in which the Group has joint control. The proportion of assets, liabilities, income and
expenses and cash flows attributable to the interests of the Group in jointly controlled entities has been incorporated
in the consolidated financial statements under the appropriate headings. The results of joint ventures are included
from the effective dates of acquisition and up to the effective dates of disposal.
1.3 ASSOCIATES
Associates are those investments in which the Group has a long-term interest and over which it exercises significant
influence, but not control. The Group’s share of post-acquisition results of associates is included in the consolidated
financial statements, using the equity accounting basis. Equity accounting involves recognising in the income
statement the Group’s share of the associate’s profit or loss for the year. The Group’s interest in the associate is
carried in the balance sheet at an amount that reflects its share of the net assets of the associate.
1.4 FOREIGN ENTITIES
The assets and liabilities of foreign entities are translated to Rands at rates of exchange ruling at the end of the financial
year. The results of their operations are translated at an appropriate weighted average rate of exchange for the
year and are included in operating profits. Gains or losses on translation of foreign subsidiaries are taken directly to
other reserves.
1.5 FOREIGN OPERATIONS
The financial statements of foreign operations are translated to Rands as follows:
– monetary assets and liabilities at rates of exchange ruling at the end of the financial year;
– non-monetary assets and liabilities at historic rates of exchange; and
– income statement items at the weighted average rates of exchange for the year.
Translation gains and losses are included in operating profit.
53 / financial statements

Accounting Policies
1. PRINCIPAL ACCOUNTING POLICIES (CONTINUED)
1.6 REVENUE RECOGNITION
Sales relating to long-term contracts are accounted for under the percentage of completion method; the stage
of completion is measured by reference to the value of work performed. Property sales are recognised when
agreements for the sale are signed. Other sales are recognised upon delivery of products and customer acceptance,
if any, or performance of services, net of value added taxes and discounts, and after eliminating sales within
the Group.
Other income earned by the Group is recognised on the following basis:
• Interest income – as it accrues (taking into account the effective yield on the asset) unless collectability is
in doubt.
• Dividend income – when the shareholder’s right to receive payment is established.
1.7 FOREIGN TRANSACTIONS
Transactions in foreign currencies are converted at the approximate rates of exchange ruling at the dates of these
transactions. Balances outstanding on unsettled monetary foreign transactions at the end of the financial year, are
translated to Rands at the approximate rates ruling at that date.
1.8 PROPERTIES
Properties consist of the following:
• company occupied property;
• investment property; and
• property held as inventory.
The accounting for each category is as follows:
• company occupied property is carried at cost less accumulated depreciation; other than land, which is not
depreciated, depreciation is calculated to write-off the cost of this property, over its expected useful life on a
straight-line basis; generally buildings are depreciated over 50 years;
• investment property, which is property held to generate independent cash flows through rental or capital
appreciation, is carried at fair value with changes in fair value included in operating profit; and
• property held as inventory, which is property held for development and resale, is valued at the lower of cost and
net realisable value and disclosed as inventory.
1.9 OTHER FIXED ASSETS
Other fixed assets are stated at cost. Depreciation is calculated to write-off the cost of other fixed assets, including
capitalised leased assets, over their expected useful lives on a straight-line basis.
The expected useful lives are generally as follows:
Plant – 5 to 15 years
Vehicles – 5 years
Furniture and other equipment – 3 to 5 years
54 / financial statements
Accounting Policies
1. PRINCIPAL ACCOUNTING POLICIES (CONTINUED)
1.10 COMPUTER SOFTWARE DEVELOPMENT COSTS
Expenditure that enhances and extends the benefits of computer software programs is recognised as a capital
improvement and added to the original cost of the software. Computer software development costs recognised as
assets are disclosed as fixed assets and amortised using the straight-line method over their useful lives, not
exceeding a period of three years.
1.11 CAPITALISATION OF BORROWING COSTS
Borrowing costs, incurred in respect of project developments that require a substantial period to construct, are
capitalised up to the date that the construction of the asset is substantially complete.
1.12 INVESTMENTS
Investments consist of available-for-sale financial assets. Available-for-sale investments are carried at fair value with
changes in fair value included in net profit or loss.
1.13 IMPAIRMENT OF LONG-TERM ASSETS
The Group continually reviews its long-term assets which includes properties, other fixed assets and investments to
assess recoverability from estimated future discounted cash flows. To the extent that the net carrying value of the
long-term assets exceeds future discounted cash flows, a provision for impairment is made.
1.14 LEASED ASSETS
Where assets are acquired under finance lease agreements that transfer to the Group substantially all the risks and
rewards of ownership, their cash cost equivalent is capitalised. The capital element of the leasing commitment is
disclosed under long-term liabilities. Lease rentals are treated as consisting of capital and interest elements, using
the effective interest rate method.
1.15 OPERATING LEASES
Leases of assets under which all the risks and benefits of ownership are effectively retained by the lessor are
classified as operating leases. Payments made under operating leases are charged to the income statement on a
straight-line basis over the period of the lease.
1.16 INVENTORIES
Materials, consumable stores, work in progress and finished goods are valued at the lower of cost and net realisable
value. In general, cost is determined on a first-in-first-out basis. The cost of manufactured goods includes direct
expenditure and an appropriate proportion of manufacturing overheads. Provision is made for slow moving, obsolete and
defective inventory.
1.17 LONG-TERM CONTRACTS
Long-term contracts in progress are valued at cost, comprising direct expenditure and attributable overheads,
together with a proportion of the estimated total profit earned on the work completed to date, less certified progress
payments received and receivable. Costs include expenditure relating to future activity together with provisions made
for losses expected to arise on completion of individual contracts. Advance payments received on individual
contracts are shown separately under accounts payable.
1.18 CASH AND CASH EQUIVALENTS
For the purpose of the cash flow statement, cash and cash equivalents comprise bank balances and cash, including bank
overdrafts and short-term borrowings. Cash and cash equivalents are reflected at year-end bank statement balance.
55 / financial statements

Accounting Policies
1. PRINCIPAL ACCOUNTING POLICIES (CONTINUED)
1.19 DEFERRED TAXATION
Deferred income tax is provided, using the liability method, for all temporary differences arising between the tax bases
of assets and liabilities and their carrying values for financial reporting purposes. Currently enacted tax rates are used
to determine deferred income tax.
The principal temporary differences arise from depreciation on property, plant and equipment, various provisions,
contracting allowances and tax losses carried forward. Deferred tax assets relating to the carry forward of unused tax
losses are recognised to the extent that it is probable that future taxable profit will be available against which the
unused tax losses can be utilised.
1.20 PROVISIONS
Provisions are recognised when the Group has a present legal or constructive obligation as a result of past events,
it is probable that an outflow of resources embodying economic benefits will be required to settle the obligation, and
a reliable estimate of the amount of the obligation can be made.
1.21 EMPLOYEE BENEFITS
The accounting policies relating to employee benefits can be categorised into three areas, as follows:
a) Pension obligations
The Group participates in a Group defined benefit plan, a number of Group defined contribution plans and a
number of multi-employer industry plans. The pension plans are funded by payments from employees and by
relevant Group companies, taking account of the recommendations of independent qualified actuaries. All plans
and their assets are managed in separate trustee-administered funds.
The Group’s pension accounting costs for the defined contribution plans and multi-employer industry plans are
limited to the annually determined contributions. For the defined benefit plan, the pension accounting costs are
assessed using the projected unit credit method. Under this method, the cost of providing pensions is charged
to the income statement so as to spread the regular cost over the service lives of employees in accordance with
the advice of qualified actuaries who carry out a full valuation of the plans annually. The pension obligation is
measured as the present value of the estimated future cash outflows. All actuarial gains and losses are spread
forward over the average remaining service lives of employees.
b) Post-employment obligations
Some Group companies provide post-employment medical and pension costs for certain of their retirees. The
expected costs of these benefits are accrued over the period of employment using a methodology similar to that
of defined benefit plans. Valuations of these obligations are carried out on a periodic basis by professionally
qualified independent actuaries. The post-employment obligations are not funded.
c) Leave pay
Employee entitlements to annual leave are recognised when they accrue to employees. Full provision is made
for the estimated liability for annual leave, as a result of services by employees, up to the balance sheet date.
56 / financial statements

Accounting Policies
1. PRINCIPAL ACCOUNTING POLICIES (CONTINUED)
1.22 SEGMENTAL REPORTING
The Group’s primary format for reporting segment information is business segments and its secondary format is
geographical segments based on the location of its operations.
Inter-segment transfers: Segment revenue, segment expenses and segment results include transfers between
business segments and between geographical segments. Such transfers are accounted for at competitive market
prices charged to unaffil iated customers for similar goods. These transfers are eliminated on consolidation.
Segment revenue and expenses: All segment revenue and expenses are directly attributable to the segments and are
disclosed at the operating profit/(loss) level.
Segment assets and liabilities: Segment assets include all operating assets used by a segment and consist principally
of inventories, contracts in progress, receivables (net of allowances) and property, plant and equipment.
Segment liabilities include all operating liabilities and consist principally of accounts payable and provisions for
liabilities and charges.
Segment assets and liabilities do not include income taxes nor bank balances/overdrafts as the Group operates
under a centralised cash management function.
1.23 FINANCIAL INSTRUMENTS
Financial instruments carried on the balance sheet include cash and cash equivalents (as defined), investments,
accounts receivable, accounts payable, provisions and non-current liabilities (excluding deferred taxation). The
particular recognition methods adopted are disclosed in the individual policy statements or notes associated with
each item.
1.24 DIVIDENDS PAID
Dividends paid are recognised when declared by the board of directors.
1.25 EARNINGS PER SHARE
a) Earnings per share is based on attributable profit for the year divided by the weighted average number of
ordinary shares (excluding treasury shares) in issue during the year. Fully diluted earnings per share is presented
when the inclusion of potential ordinary shares has a dilutive effect on earnings per share.
b) Headline earnings per share is based on the same calculation as above except that attributable profit excludes
items of a capital nature as defined in Circular 7/2002 “Interpretation of Statement of Investment Practice No 1:
Headline Earnings” as issued by the South African Institute of Chartered Accountants in December 2002.
The adjustment on headline earnings as previously reported is as follows:
Currently As previously
reported reported
30 June 2002 30 June 2002
R’000 R’000
Attributable profit 77 009 77 009
Adjusted for:
• profit on disposal of fixed assets (after tax) (5 876) (5 876)
• fair value adjustment relating to investment property (after tax) (8 917) –
Headline profit 62 216 71 133
Weighted average number of shares (000’s) 69 120 69 120
Headline earnings per share (cents) 90,0 102,9
57 / financial statements
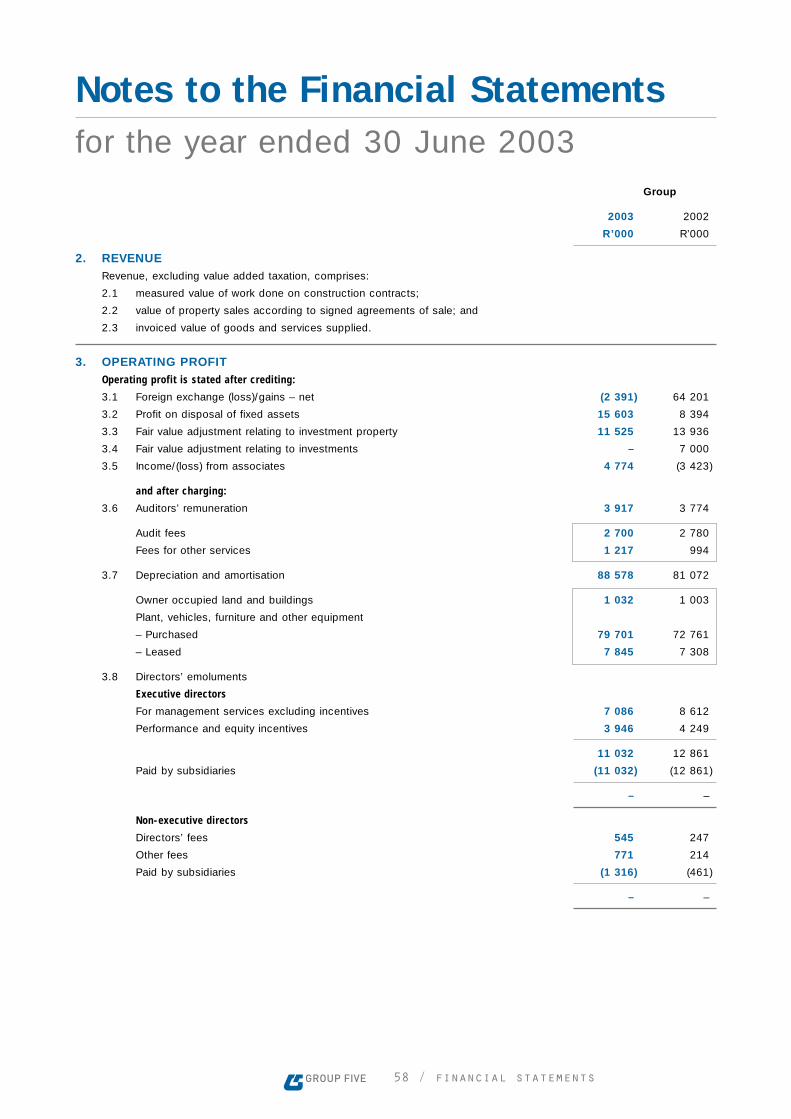
Notes to the Financial Statementsfor the year ended 30 June 2003
Group
2003 2002
R’000 R’000
2. REVENUERevenue, excluding value added taxation, comprises:
2.1 measured value of work done on construction contracts;
2.2 value of property sales according to signed agreements of sale; and
2.3 invoiced value of goods and services supplied.
3. OPERATING PROFITOperating profit is stated after crediting:
3.1 Foreign exchange (loss)/gains – net (2 391) 64 201
3.2 Profit on disposal of fixed assets 15 603 8 394
3.3 Fair value adjustment relating to investment property 11 525 13 936
3.4 Fair value adjustment relating to investments – 7 000
3.5 Income/(loss) from associates 4 774 (3 423)
and after charging:
3.6 Auditors’ remuneration 3 917 3 774
Audit fees 2 700 2 780
Fees for other services 1 217 994
3.7 Depreciation and amortisation 88 578 81 072
Owner occupied land and buildings 1 032 1 003
Plant, vehicles, furniture and other equipment
– Purchased 79 701 72 761
– Leased 7 845 7 308
3.8 Directors’ emoluments
Executive directors
For management services excluding incentives 7 086 8 612
Performance and equity incentives 3 946 4 249
11 032 12 861
Paid by subsidiaries (11 032) (12 861)
– –
Non-executive directors
Directors’ fees 545 247
Other fees 771 214
Paid by subsidiaries (1 316) (461)
– –
58 / financial statements

Notes to the Financial Statementsfor the year ended 30 June 2003
Group
2003 2002
R’000 R’000
3. OPERATING PROFIT (CONTINUED)
3.9 Rentals under operating leases 15 768 7 980
Land and buildings 9 395 5 675
Other equipment 6 373 2 305
3.10 Remuneration other than to employees 12 450 8 133
Management services 395 1 996
Technical services 12 055 6 137
4. FINANCE COSTSInterest (paid)/received:
Bank and short-term borrowings (28 530) (27 440)
Other – 1 043
(28 530) (26 397)
Interest to the value of R4,3 million (2002: R5,5 million) was capitalised to
developments in progress.
59 / financial statements

Notes to the Financial Statementsfor the year ended 30 June 2003
Group
2003 2002
R’000 R’000
5. TAXATIONSOUTH AFRICAN NORMAL TAXATION
Current taxation (5 553) –
– current year (5 553) –
Deferred taxation – 2 191
– current year – 2 191
FOREIGN TAXATION (INCLUDING WITHHOLDING TAX)
Current taxation (22 861) (21 828)
– current year (22 861) (21 828)
SHARE OF ASSOCIATES’ TAXATION (2 049) (184)
(30 463) (19 821)
RECONCILIATION OF NORMAL TAXATION RATE % %
South African normal taxation rate 30,0 30,0
Adjusted for:
Capital items and disallowed expenses 1,0 1,6
Tax losses not recognised/(use of tax losses not recognised) – net (7,9) (11,4)
Effective rate of taxation 23,1 20,2
R’000 R’000
Estimated taxation losses available for set-off against
future taxable income 499 990 413 318
Potential taxation relief at current taxation rates 149 997 123 995
This is dependent on sufficient taxable income being earned in
future by subsidiaries concerned.
60 / financial statements

Notes to the Financial Statementsfor the year ended 30 June 2003
Attributable Earnings
profit Shares per share
R’000 000’s (cents)
6. EARNINGS PER SHARE6.1 EARNINGS PER SHARE/FULLY DILUTED EARNINGS PER SHARE
For the year ended 30 June 2003
Basic/fully diluted earnings per share
Shares outstanding 1 July 2002 69 120
Weighted average number of shares issued during the period – –
Income available to shareholders 96 768 69 120 140,0
For the year ended 30 June 2002
Basic/fully diluted earnings per share
Shares outstanding 1 July 2001 69 120
Weighted average number of shares issued during the period –
Income available to shareholders 77 009 69 120 111,4
2003 2002
R’000 R’000
6.2 HEADLINE EARNINGS PER SHARE
A reconciliation is as follows:
Attributable profit 96 768 77 009
Adjusted for:
• profit on disposal of fixed assets (after tax) (10 922) (5 876)
• fair value adjustment relating to investment property (after tax) (8 925) (8 917)
Headline profit 76 921 62 216
Weighted average number of shares (000’s) 69 120 69 120
Headline earnings per share (cents) 111,3 90,0
61 / financial statements
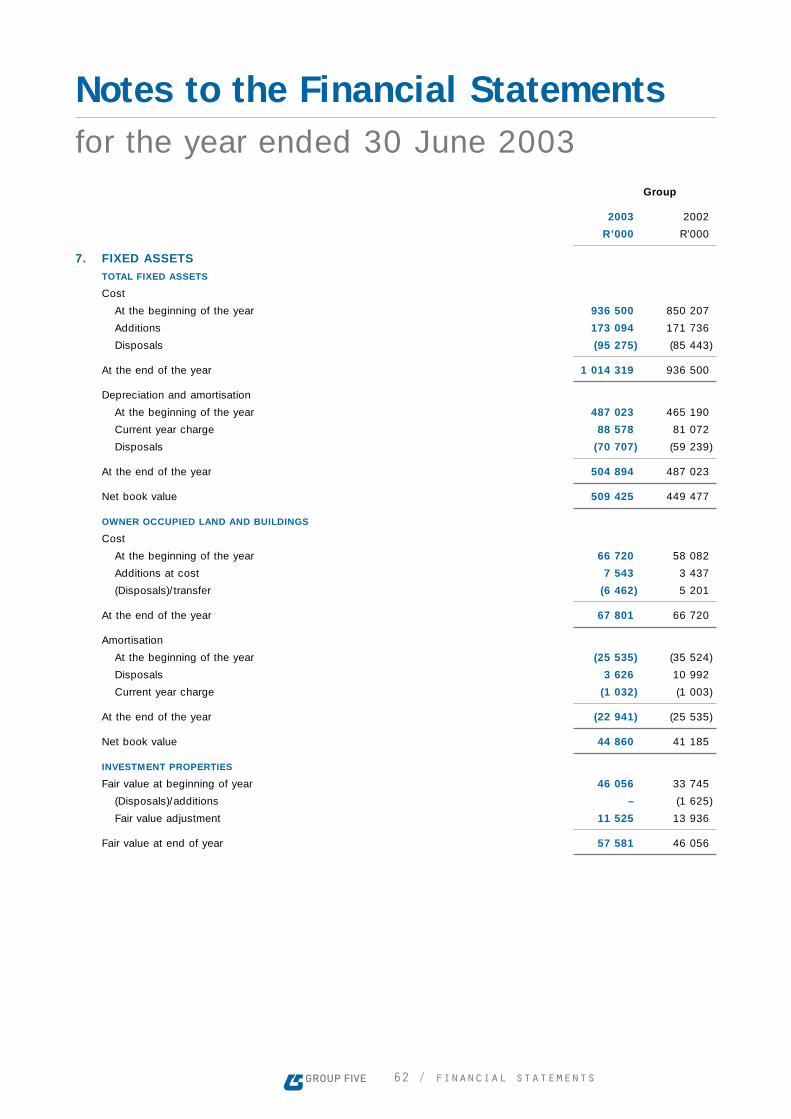
Notes to the Financial Statementsfor the year ended 30 June 2003
Group
2003 2002
R’000 R’000
7. FIXED ASSETSTOTAL FIXED ASSETS
Cost
At the beginning of the year 936 500 850 207
Additions 173 094 171 736
Disposals (95 275) (85 443)
At the end of the year 1 014 319 936 500
Depreciation and amortisation
At the beginning of the year 487 023 465 190
Current year charge 88 578 81 072
Disposals (70 707) (59 239)
At the end of the year 504 894 487 023
Net book value 509 425 449 477
OWNER OCCUPIED LAND AND BUILDINGS
Cost
At the beginning of the year 66 720 58 082
Additions at cost 7 543 3 437
(Disposals)/transfer (6 462) 5 201
At the end of the year 67 801 66 720
Amortisation
At the beginning of the year (25 535) (35 524)
Disposals 3 626 10 992
Current year charge (1 032) (1 003)
At the end of the year (22 941) (25 535)
Net book value 44 860 41 185
INVESTMENT PROPERTIES
Fair value at beginning of year 46 056 33 745
(Disposals)/additions – (1 625)
Fair value adjustment 11 525 13 936
Fair value at end of year 57 581 46 056
62 / financial statements

Notes to the Financial Statementsfor the year ended 30 June 2003
Group
2003 2002
R’000 R’000
7. FIXED ASSETS (CONTINUED)
PLANT, VEHICLES, FURNITURE AND OTHER EQUIPMENT – PURCHASED
Cost
At the beginning of the year 778 729 721 826
Additions 150 434 142 112
Disposals (88 813) (85 209)
At the end of the year 840 350 778 729
Depreciation
At the beginning of the year (445 003) (417 483)
Disposals 67 082 45 241
Current year charge (79 701) (72 761)
At the end of the year (457 622) (445 003)
Net book value 382 728 333 726
PLANT, VEHICLES, FURNITURE AND OTHER EQUIPMENT – LEASED
Cost
At the beginning of the year 44 995 36 554
Additions 3 592 12 251
Disposals – (3 810)
At the end of the year 48 587 44 995
Depreciation
At the beginning of the year (16 485) (12 183)
Disposals – 3 006
Current year charge (7 845) (7 308)
At the end of the year (24 330) (16 485)
Net book value 24 257 28 510
A full list of the Group’s land and buildings is maintained at the registered office.
The fair value of investment properties has been calculated using either discounted
cash flow analysis or market values.
8. ASSOCIATESUNLISTED ASSOCIATE
Shares at cost 10 143 10 143
Group’s share of retained earnings and reserves 4 516 (1 848)
14 659 8 295
Unsecured loans – 8 357
14 659 16 652
Directors’ valuation of shares of unlisted associates 14 659 8 295
63 / financial statements

Notes to the Financial Statementsfor the year ended 30 June 2003
Group
2003 2002
R’000 R’000
9. OTHER INVESTMENTSUnlisted shares and investments at fair value – 2 948
Foreign investments at fair value 80 048 75 845
80 048 78 793
The fair value of other investments has been calculated using either discounted
cash flow analysis or market values.
10. INVENTORIESManufacturing materials 25 817 23 082
Consumable stores 27 256 54 687
Manufacturing work in progress 19 760 7 769
Manufacturing finished goods 61 253 41 816
Properties and developments in progress 79 652 137 226
213 738 264 580
11. CONTRACTS IN PROGRESSLong-term contracts 5 384 503 5 143 666
Certified payments received and receivable (5 187 680) (4 887 140)
196 823 256 526
These include: Profits (429 492) (310 675)
Losses 141 533 158 844
(287 959) (151 831)
12. ACCOUNTS RECEIVABLEAccounts receivable includes:
– Retention debtors 32 931 68 648
– Amounts owing by joint venture partners 166 239 112 866
– VAT refundable 9 391 18 404
– Prepayments 13 275 10 600
– Contract and trade debtors 527 576 607 841
– Other receivables 65 430 88 696
814 842 907 055
The carrying value of accounts receivable approximates its fair value due to
the short-term nature of these instruments.
64 / financial statements
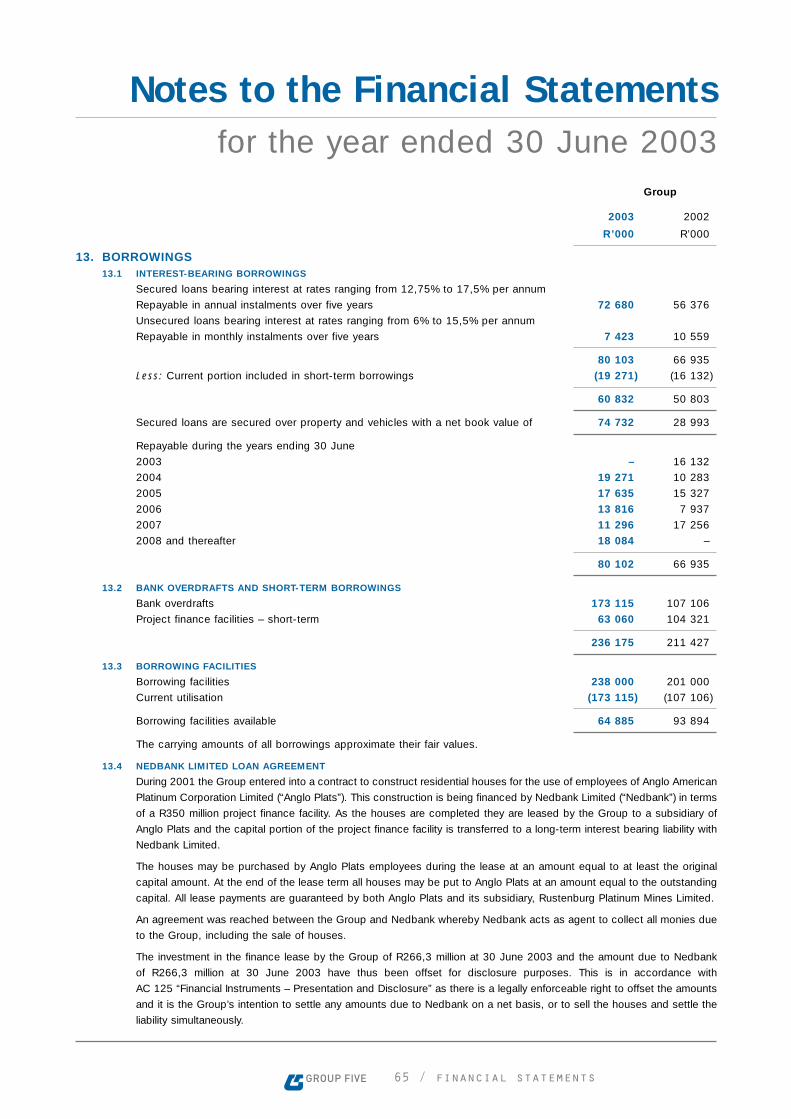
Notes to the Financial Statementsfor the year ended 30 June 2003
65 / financial statements
Group
2003 2002
R’000 R’000
13. BORROWINGS13.1 INTEREST-BEARING BORROWINGS
Secured loans bearing interest at rates ranging from 12,75% to 17,5% per annum
Repayable in annual instalments over five years 72 680 56 376
Unsecured loans bearing interest at rates ranging from 6% to 15,5% per annum
Repayable in monthly instalments over five years 7 423 10 559
80 103 66 935
Less: Current portion included in short-term borrowings (19 271) (16 132)
60 832 50 803
Secured loans are secured over property and vehicles with a net book value of 74 732 28 993
Repayable during the years ending 30 June
2003 – 16 132
2004 19 271 10 283
2005 17 635 15 327
2006 13 816 7 937
2007 11 296 17 256
2008 and thereafter 18 084 –
80 102 66 935
13.2 BANK OVERDRAFTS AND SHORT-TERM BORROWINGS
Bank overdrafts 173 115 107 106
Project finance facilities – short-term 63 060 104 321
236 175 211 427
13.3 BORROWING FACILITIES
Borrowing facilities 238 000 201 000
Current utilisation (173 115) (107 106)
Borrowing facilities available 64 885 93 894
The carrying amounts of all borrowings approximate their fair values.
13.4 NEDBANK LIMITED LOAN AGREEMENT
During 2001 the Group entered into a contract to construct residential houses for the use of employees of Anglo American
Platinum Corporation Limited (“Anglo Plats”). This construction is being financed by Nedbank Limited (“Nedbank”) in terms
of a R350 million project finance facility. As the houses are completed they are leased by the Group to a subsidiary of
Anglo Plats and the capital portion of the project finance facility is transferred to a long-term interest bearing liability with
Nedbank Limited.
The houses may be purchased by Anglo Plats employees during the lease at an amount equal to at least the original
capital amount. At the end of the lease term all houses may be put to Anglo Plats at an amount equal to the outstanding
capital. All lease payments are guaranteed by both Anglo Plats and its subsidiary, Rustenburg Platinum Mines Limited.
An agreement was reached between the Group and Nedbank whereby Nedbank acts as agent to collect all monies due
to the Group, including the sale of houses.
The investment in the finance lease by the Group of R266,3 million at 30 June 2003 and the amount due to Nedbank
of R266,3 million at 30 June 2003 have thus been offset for disclosure purposes. This is in accordance with
AC 125 “Financial Instruments – Presentation and Disclosure” as there is a legally enforceable right to offset the amounts
and it is the Group’s intention to settle any amounts due to Nedbank on a net basis, or to sell the houses and settle the
liability simultaneously.

Notes to the Financial Statementsfor the year ended 30 June 2003
Group
2003 2002
R’000 R’000
14. DEFERRED TAXATIONBalance at beginning of year – 2 191
Other – (2 191)
Balance at end of year – –
The closing balance deferred taxation liability is attributable to the following items:
Capital allowances 25 048 18 742
Provisions (37 694) (28 333)
Other allowances 67 941 65 825
Sundry 1 368 1 324
Estimated tax losses (net of valuation allowances) (56 663) (57 564)
– –
15. ACCOUNTS PAYABLEAccounts payable includes:
– Advance payments received 254 496 371 885
– Amounts owing to joint ventures – 30 759
– Trade and other creditors 290 631 346 875
– Accrued expenses 406 916 389 947
– Subcontractor creditors 137 717 187 314
– Retention creditors 33 318 39 019
– Current portion of long-term borrowings 19 271 16 132
1 142 349 1 381 931
The carrying value of accounts payable approximates its fair value due to
the short-term nature of these instruments.
16. PROVISIONS FOR LIABILITIES AND CHARGESContract Rental Payroll Sundry
provisions guarantee provisions provisions Total
Balance at 30 June 2001 71 899 2 195 89 287 17 574 180 955
Movement during the year (47 190) 974 27 482 4 438 (14 296)
Balance at 30 June 2002 24 709 3 169 116 769 22 012 166 659
Movement during the year (12 977) (1 400) (15 616) (11 909) (41 902)
Balance at 30 June 2003 11 732 1 769 101 153 10 103 124 757
The carrying value of provisions approximates their fair value due to the short-term nature of these instruments.
The provisions have been determined based on assessments and estimates by management. Actual results could differ
from estimates and there is no certainty as to the timing of the cash flows relating to these provisions.
66 / financial statements

Notes to the Financial Statementsfor the year ended 30 June 2003
Group
2003 2002
R’000 R’000
17. COMMITMENTS AND CONTINGENCIESFIXED ASSET COMMITMENTS
Contracts placed 31 292 44 042
Contracts not placed at 30 June, approved by directors 22 128 33 261
53 420 77 303
The above expenditure will be funded from existing resources and facilities.
OPERATING LEASE COMMITMENTS
The future minimum lease payments under non-cancellable operating leases are as follows:
Not later than 1 year 17 541 15 768
Later than 1 year and not later than 5 years 55 807 61 837
Later than 5 years 49 375 60 886
122 723 138 491
GUARANTEES
Total financial institution backed guarantees provided to third parties amounted to R1 115 million (2002: R1 267 million). The
directors do not believe any exposure to loss is likely.
OTHER
The Group is from time to time involved in various claims and legal proceedings arising in the ordinary course of business.
The directors do not believe that adverse decisions in any pending proceedings or claims against the Group will have a
material adverse effect on the financial condition or future of operations of the Group.
18. FINANCIAL INSTRUMENTSBUSINESS AND CREDIT CONCENTRATION
Financial instruments which potentially subject the Group to concentrations of credit risk are primarily cash and cash
equivalents and trade receivables. As regards cash and cash equivalents the Group deals primarily with major financial
institutions in South Africa.
The Group’s customers are concentrated primarily in South Africa but also exist in the rest of Africa and Eastern Europe. The
majority of the customers are concentrated in the mining, financial institution and public sectors. The Group establishes an
allowance for doubtful accounts based upon factors surrounding the credit risk of specific customers, historical trends and
other information.
FOREIGN CURRENCY RISK
The Group conducts its business in various foreign currencies. As a result, it is subject to the transaction exposure that arises
from foreign exchange rate movements between the dates that foreign currency transactions are recorded (foreign sales and
purchases) and the dates they are consummated (cash receipts and cash disbursements in foreign currencies). The Group
may, from time to time, hedge its foreign currency exposure for either purchase or sale transactions through the use of foreign
currency forward exchange contracts. Foreign currency denominated construction contracts entered into are primarily
US Dollar based and the Group’s results are exposed to the financial effects of the fluctuating Rand against the US Dollar.
INTEREST RATE RISK
The Group is exposed to interest rate risk through its cash and cash equivalents and interest-bearing long-term liabilities.
Short-term interest rate exposure is monitored and managed by corporate treasury and may be hedged from time to time
through the use of interest rate swaps.
67 / financial statements

Notes to the Financial Statementsfor the year ended 30 June 2003
Group
2003 2002
R’000 R’000
19. EMPLOYEE BENEFITS19.1 STAFF COSTS
Wages and salaries 870 906 811 336
Pension costs – defined contribution plans (including industry plans) 47 052 42 968
Pension costs – defined benefit plan (primarily service cost) 7 097 6 481
Other post-employment benefits (primarily interest cost) – 3 280
925 055 864 065
Average number of persons employed by the Group during the year: Number Number
Full time 5 939 6 128
Part time 7 743 7 892
13 682 14 020
South Africa 7 304 8 238
Overseas 6 378 5 782
13 682 14 020
19.2 PENSION SCHEME
The latest actuarial valuation of the Group defined benefit plan was carried out in
June 2003 and was considered by the actuaries to be in a sound financial condition.
A summary of the valuation is presented below: R’000 R’000
Present value of funded obligations (661 017) (664 670)
Fair value of plan assets 751 391 787 432
Surplus 90 374 122 762
% %
The principal assumptions used for accounting purposes were as follows:
Discount rate 10,0 12,0
Expected return on assets 10,0 11,5
Future salary increases 7,0 8,5
Future pension increases 5,0 6,7
Revised pension fund legislation stipulates that, in addition to the Group being
entitled to a share of the surplus, past and current employees are also entitled
to share in the distribution of the surplus. The Group has not recognised any
portion of the surplus in its balance sheet as the impact of the revised
legislation is still being evaluated.
19.3 POST-EMPLOYMENT OBLIGATIONS 46 199 55 296
The Group’s accrual for post-employment medical and pension obligations is based
on assumptions used by the independent actuaries which includes appropriate mortality
tables, long-term estimates of increases in medical costs and appropriate discount rates.
In addition to certain of the assumptions used for the pension scheme, the main actuarial
assumption is a long-term increase in health costs of 7,5% per year (2002: 7,5%).
68 / financial statements

Notes to the Financial Statementsfor the year ended 30 June 2003
19. EMPLOYEE BENEFITS (CONTINUED)
19.4 SHARE OPTION SCHEME
The Group operates a Share Option Scheme for certain of its employees.
Share option activity was as follows:
Eligible for Granted and Average Net
allocation accepted price available
Balance as at 30 June 2001 9 196 600 8 176 850 – 1 019 750
Amendment to the Share Option Scheme as
approved at the Annual General Meeting 3 678 400 – – 3 678 400
Options granted – 1 225 000 3,66 (1 225 000)
Options paid for/lapsed – (447 450) 1,80 447 450
Balance as at 30 June 2002 12 875 000 8 954 400 – 3 920 600
Options granted – 375 000 4,00 (375 000)
Options paid for/lapsed – (1 576 150) 2,00 1 576 150
Balance as at 30 June 2003 12 875 000 7 753 250 – 5 121 750
Group
2003 2002
R’000 R’000
20. OPERATING PROFIT BEFORE WORKING CAPITAL CHANGESProfit before taxation 131 597 98 176
Adjustments for:
Depreciation and amortisation 88 578 81 072
Fair value adjustments (11 525) (20 936)
Profit on disposal of fixed assets (15 603) (8 394)
Share of associate (income)/loss (4 774) 3 423
Finance costs 28 530 26 397
216 803 179 738
21. WORKING CAPITAL CHANGESAccounts payable (239 582) 453 685
Accounts receivable 92 213 (181 635)
Provisions (41 902) (14 296)
Contracts in progress 59 703 (173 857)
Inventories 50 842 (125 309)
Post-employment obligations (9 097) (6 050)
(87 823) (47 462)
69 / financial statements

Notes to the Financial Statementsfor the year ended 30 June 2003
Group
2003 2002
R’000 R’000
22. RECONCILIATION OF TAXATION PAIDTaxation owing at the beginning of the year (19 078) 41 048
Charge per the income statement (excluding associates) (28 414) (19 821)
Movement in deferred taxation – (2 191)
Taxation owing at the end of the year 17 862 19 078
Total paid during the year (29 630) (43 982)
23. CASH AND CASH EQUIVALENTS AT END OF YEARBank balances and cash 263 618 299 873
Bank overdraft and short-term borrowings (236 175) (211 427)
Cash and cash equivalents at end of year 27 443 88 446
Included in bank balances and cash are US$ denominated contract advance payments
amounting to R137,8 million (2002: R120 million). This amount is available to the Group
when the last certificates on the relevant contracts are approved.
70 / financial statements

Annexure 1Company Balance Sheet
at 30 June 20032003 2002
Notes R’000 R’000
ASSETSInvestment in subsidiaries 313 970 337 471
Other investments 500 500
314 470 337 971
EQUITY AND LIABILITIES
Stated capital – closing balance (69 119 591 no par value shares) 286 245 286 245
Distributable reserves – closing balance 28 225 51 726
Distributable reserves – opening balance 51 726 69 697
Dividends paid (23 501) (17 971)
314 470 337 971
1. PRINCIPAL ACCOUNTING POLICIESThe financial statements are prepared on the historical cost basis. These financial
statements should be read together with the Group financial statements set out on
pages 46 to 77. The accounting policies adopted are set out on pages 53 to 57.
2. INVESTMENT IN SUBSIDIARIESShares at cost 410 732 410 732
Amounts owing to subsidiaries (96 762) (73 261)
313 970 337 471
3. INCOME STATEMENT AND CASH FLOW STATEMENTNeither an income statement nor cash flow statement has been prepared as the company did not trade during the year.
The dividends and directors’ emoluments paid were funded by subsidiaries.
71 / financial statements

Annexure 2Interest in Subsidiariesat 30 June 2003
Issued ordinary
share capital Percentage held Shares at cost
2003 2002 2003 2002 2003 2002
Shares Shares % % R’000 R’000
Group Five Construction
(Proprietary) Limited 1 000 000 1 000 000 100,0 100,0 14 177 14 177
Group Five International Limited 1 000 1 000 100,0 100,0 27 985 27 985
Everite Limited 51 191 400 51 191 400 100,0 100,0 368 570 368 570
410 732 410 732
PRINCIPAL SUBSIDIARIES: DIRECT AND INDIRECT
Armitage Shanks (SA) (Proprietary) Limited
Everite Building Products (Proprietary) Limited
Everite Limited
Group Five (Botswana) (Proprietary) Limited
Group Five (Zambia) (Proprietary) Limited
Group Five Building (Proprietary) Limited
Group Five Civils Mining and Industrial (Proprietary) Limited
Group Five Civil Engineering (Proprietary) Limited
Group Five Construction Limited (Malawi)
Group Five Construction (Proprietary) Limited
Group Five Construction (UK) Limited (UK, Ghana, Malawi, Mauritius)
Group Five Contractors (Namibia) (Proprietary) Limited
Group Five Angola LDA
Group Five Mali SARL
Group Five Buildings East (Proprietary) Limited (Tanzania branch)
Group Five Lesotho (Proprietary) Limited
72 / financial statements
Group Five Construction (Proprietary) Limited – (Ghana branch)
Group Five Design and Planning (Proprietary) Limited
Group Five Housing (Proprietary) Limited
Group Five Infrastructure Developments (Proprietary) Limited
Group Five International Limited (Mauritius, Angola, Algeria)
Group Five KwaZulu-Natal (Proprietary) Limited
Group Five Mozambique LDA
Group Five Plant & Equipment (Proprietary) Limited
Group Five Projects (Proprietary) Limited
Group Five Properties (Proprietary) Limited
Group Five Roads & Earthworks (Proprietary) Limited
Group Five Swaziland (Proprietary) Limited
Group Five Tanzania Limited
Intertoll Holdings (Proprietary) Limited
Vaal Sanitaryware (Proprietary) Limited
Unless specified all companies are incorporated in South Africa.
The holding company’s interest in the aggregate net profits earned by subsidiaries amounted to R96,8 million
(2002: R77,0 million) respectively.

Annexure 3Investment in Joint Ventures
at 30 June 2003The total percentage holdings by the Group in the equity of each significant jointly controlled entity are as follows:
Proportion
Nature of issued
of shares held
Joint venture business (%)
CGM Construction (Proprietary) Limited Construction contracting 33
Group Five Batch Plant Joint Venture (Mauritius) Supply of concrete 50
LTA/Mohale Joint Venture (Lesotho) Construction contracting 33
St Martins Sewage Joint Venture (Mauritius) Sewage works 50
Group Five Gipila Joint Venture Construction contracting 50
GLG Joint Venture Road construction 50
DPI Holdings (Proprietary) Limited Pipe manufacturing 40
Water and Sanitation Services South Africa (Proprietary) Limited Sewage works 50
Livingstone Joint Venture (Zambia) Construction contracting 50
Monkey Bay Joint Venture Construction contracting 50
G5 – CMC Temane Joint Venture (Mozambique) Construction contracting 50
Michelangelo Towers Joint Venture Construction contracting 50
73 / financial statements

Annexure 3Investment in Joint Venturesat 30 June 2003
2003 2002
R’000 R’000
AGGREGATE FINANCIAL INFORMATION:BALANCE SHEET
Group’s proportionate share of assets and liabilities:
Assets
Non-current assets 46 131 43 825
Current assets 217 869 123 821
264 000 167 646
Equity and liabilities
Shareholders’ interest 87 818 76 908
Non-current liabilities 18 489 14 395
Current liabilities 157 693 76 343
264 000 167 646
INCOME STATEMENT
Group’s proportionate share of income and expenditure:
Revenue 455 140 404 189
Profit before taxation 21 669 45 594
Taxation (4 984) (9 119)
Profit after taxation 16 685 36 475
Dividends received 1 456 1 796
SUMMARISED CASH FLOW STATEMENT
Cash flow from operating activities 73 315 (94 012)
Cash flow from investing activities (1 066) 29 516
Cash flow from financing activities 7 285 11 049
Net increase/(decrease) in cash and cash equivalents 79 534 (53 447)
74 / financial statements

Annexure 4Investment in Associates
at 30 June 2003
75 / financial statements
The total percentage holdings by the Group in the equity of each associate are as follows:
Nature Proportion
of Number of of issued
Associate business shares issued shares held (%)
UNLISTEDMetsi Water and Sanitation Company
(Proprietary) Limited Water supply 2 250 ordinary shares of R1 each 23
Amanz’ Abantu Services (Proprietary) Limited Water supply 100 ordinary shares of R1 each 45
Dura Piling (Proprietary) Limited Piling 3 404 000 ordinary shares of R1 each 15
Group Five Pipe (Saudi) Limited Pipe manufacturing 30 000 ordinary shares of SR1 each 25
Johannesburg Water Management (Proprietary) Limited Water and waste
management 100 ordinary shares of R1 each 14,5
2003 2002
R’000 R’000
Aggregate financial information: Unlisted
BALANCE SHEET
Group’s proportionate share of assets and liabilities:
Assets
Non-current assets 1 453 1 525
Current assets 27 406 37 510
28 859 39 035
Equity and liabilities
Shareholders’ interest 7 577 5 945
Non-current liabilities 1 855 124
Current liabilities 19 427 32 966
28 859 39 035
INCOME STATEMENT
Group’s proportionate share of income and expenditure:
Revenue 86 581 88 409
Profit/(loss) before taxation 4 774 (3 423)
Taxation (2 049) –
Profit/(loss) after taxation 2 725 (3 423)
Dividends received 1 215 1 002
SUMMARISED CASH FLOW STATEMENT
Cash flow from operating activities 5 937 (7 196)
Cash flow from investing activities (934) (114)
Cash flow from financing activities 396 (285)
Net increase in cash and cash equivalents 5 399 (7 595)

Annexure 5Analysis of Shareholdersat 30 June 2003
Number of Number of
shareholders % shares %
Shareholder spread
1 – 1 000 shares 1 112 49,80 437 302 0,59
1 001 – 10 000 shares 819 36,68 3 284 142 4,46
10 001 – 50 000 shares 185 8,28 4 648 206 6,32
50 001 – 500 000 shares 88 3,94 13 357 120 18,15
500 001 – 1 000 000 shares 14 0,67 10 377,311 14,11
1 000 001 and over shares 14 0,63 41 468 942 56,37
2 232 100,00 73 573 023 100,00
Distribution of shareholders
Individuals 1 835 82,18 7 081 499 9,62
Limited Companies 12 0,54 41 313 0,06
Banks 22 0,99 925 396 1,26
Nominee Companies or Trusts 135 6,05 1 863 842 2,53
Growth Funds/Unit Trusts 74 3,31 25 244 646 34,31
Pty Companies 53 2,37 3 478 228 4,73
Close Corporations 37 1,66 196 816 0,27
Other Corporate Bodies 2 0,09 117 000 0,16
Investment Companies 21 0,94 19 687 529 26,76
Retirement Funds 29 1,30 6 973 359 9,48
Insurance Companies 3 0,13 654 600 0,89
Directors 6 0,31 913 965 1,24
Share Trust 2 0,09 1 941 398 2,64
Treasury Shares 1 0,04 4 453 432 6,05
2 232 100,00 73 573 023 100,00
Number of Number of
shareholders % linked units %
Public/non-public shareholders
Non-public shareholders 10 0,45 11 147 344 15,15
Directors of the company 6 0,27 913 965 1,24
Normac Roofing Systems Pty Ltd (Treasury shares) 1 0,05 4 453 432 6,05
Share Trust 2 0,09 1 941 398 2,64
Nedcor Limited 1 0,05 3 838 549 5,22
Public shareholders 2 223 99,55 62 425 679 84,85
2 233 100,00 73 573 023 100,00
Beneficial shareholders with an interest of 5% or more in shares
Old Mutual Group 24 131 922 32,80
Normac Roofing Systems Pty Ltd (Treasury shares) 4 453 432 6,05
Nedcor Limited 3 838 549 5,22
32 423 903 44,07
76 / financial statements

Annexure 5Analysis of Shareholders
at 30 June 2003
2003 Direct %
Directors' shareholdings
Thomas, GM 30 000 0,04
Lomas, MH 139 005 0,19
Turner, HC 400 000 0,54
Du Preez, P 139 005 0,19
Banton, JH 169 005 0,23
Paizes, D 30 000 0,04
907 015 1,23
2002 Direct %
Directors' shareholdings
Thomas, GM 30 000 0,04
Lomas, MH 139 005 0,19
Turner, HC 400 000 0,54
Du Preez, P 139 005 0,19
Banton, JH 169 005 0,23
Paizes, D 30 000 0,04
Le Sueur P 25 200 0,03
932 215 1,26
Rank Name of shareholder %
1 Old Mutual Group 24 131 922 32,80
2 Normac Roofing Systems Pty Ltd (Treasury shares) 4 453 432 6,05
3 Nedcor Limited 3 838 549 5,22
4 Investment Solutions 2 676 281 3,64
5 African Harvest Limited 2 400 000 3,26
6 Eskom Pension Fund & Provident Fund 2 389 367 3,25
7 Prudential M & G 1 973 686 2,68
8 Rivonia Share Scheme Services Pty Ltd 1 941 398 2,64
9 M Cubed Holdings Limited 1 846 721 2,51
10 Ellerine Brothers (Pty) Limited 1 562 500 2,12
11 Rand Merchant Bank 1 192 253 1,62
12 Stripe Investments 78 991 300 1,35
13 Futuregrowth 886 657 1,21
14 BOE Bank 882 918 1,20
15 Frater Asset Management 837 054 1,14
16 RMA 715 390 0,97
17 Anglo American Platinum Corp Limited 689 600 0,94
18 Investec Limited 685 130 0,93
19 Coronation Capital 572 000 0,78
20 Sage 564 492 0,77
Total 55 230 650 75,08
77 / financial statements

78 / financial statements
Administrationfor the year ended 30 June 2003TRANSFER SECRETARIES
Computershare Limited
11 Diagonal Street, Johannesburg 2001
Tel: (011) 370 5000
Fax: (011) 370 5271
BANKERS
ABSA Bank Limited
FNB Corporate, a division of FirstRand Bank Limited
Standard Corporate and Merchant Bank
AUDITORS
PricewaterhouseCoopers Inc.
SECRETARY
GD Mottram
REGISTERED OFFICE
Registration number 1969/000032/06
Share code: GRF ISIN: ZAE 000027405
371 Rivonia Boulevard, Rivonia 2128
PO Box 5016, Rivonia 2128
Tel: (011) 806 0111
Fax: (011) 803 1324
RISK COMMITTEE
GM Thomas
L Chalker
MH Lomas
HC Turner
AUDIT COMMITTEE
GM Thomas
MH Lomas
KK Mpinga
D Paizes
HC Turner
REMUNERATION COMMITTEE
GM Thomas
P du Preez
MH Lomas
MR Maruma
D Paizes
A van Zyl
CORPORATE FINANCE SPONSOR
Nedbank Corporate
Shareholders’ Diary
FEBRUARY
Interim announcement
Interim dividend declared
APRIL
Interim dividend paid
JUNE
Financial year-end
AUGUST
Preliminary announcement
Final dividend declared
Annual report published
OCTOBER
Final dividend paid
Annual general meeting

79 / financial statements
Notice of Annual General Meetingfor the year ended 30 June 2003GROUP FIVE LIMITED(Registration number 1969/000032/06)
(Incorporated in the Republic of South Africa)
Share code: GRF ISIN Code:ZAE000027405
(“Group Five” or “the company”)
Notice is hereby given that the annual general meeting of shareholders of the company will be held at the offices of Group Five,
371 Rivonia Boulevard, Rivonia, on 21 October 2003 at 09h00 for the purpose of considering, and if deemed fit, passing with or
without modification, the following resolutions:
1. To receive and consider the annual financial statements of the group for the year ended 30 June 2003, together with the
directors’ and independent auditors’ reports.
2. 3.1, 3.2, 3.3 who, in terms of the Company’s Articles of Association retire by rotation at the annual general meeting, but,
being eligible, offer themselves for re-election. Such re-elections are to be voted on individually unless a resolution is agreed
to by the meeting that a single resolution be used.
3. To re-elect Messrs Lomas, Maruma and Mpinga, as directors of the company, who retire by rotation in terms of the
company’s Articles of Association and who are eligible and offer themselves for re-election:
3.1 Mr MH Lomas
3.2 Mr MR Maruma
3.3 Mr KK Mpinga
A brief CV in respect of each director offering himself for re-election appears on page 30 and further of this annual report.
4. To ratify the remuneration paid to directors for the past financial year.
5. To re-appoint PricewaterhouseCoopers Inc. as independent auditors of the company.
6. To consider and if deemed fit to pass, with or without modification, the special resolution[s] listed below:
SPECIAL RESOLUTION 1
“RESOLVED THAT in terms of Section 62 of the Companies Act, 61 of 1973 ("Companies Act"), as amended, the existing
Articles of Association of the company be and are hereby substituted with new Articles of Association, a copy of which has
been tabled at this annual general meeting and signed by the Chairman for the purpose of identification, with effect from
the date of passing of this resolution, regardless of the date of registration thereof."
The reason for and effect of the passing of special resolution 1 is to enable the company to consolidate amendments made
to the existing Articles of Association, which provide for recent changes in company law, and the interpretation thereof.
The new Articles of Association are available for inspection by the shareholders of the company at the registered office of
Group Five.
7. To consider and if deemed fit to pass, with or without modification, the ordinary resolutions listed below:
ORDINARY RESOLUTION 1
"RESOLVED THAT the entire authorised but unissued share capital of the company, from time to time, be placed under the
control of the directors of the company until the next annual general meeting with the authority to allot and issue all or part
thereof in their discretion, subject to Sections 221 (2) and 222 of the Companies Act as amended, and the JSE Securities
Exchange South Africa (“JSE”) Listings Requirements.”
ORDINARY RESOLUTION 2
"RESOLVED THAT, pursuant to the Articles of Association of the company, the directors of the company be and are hereby
authorised, until the next annual general meeting of the company (whereupon this authority shall lapse, unless it is renewed
at the aforementioned annual general meeting, provided that it shall not extend beyond 15 months from the date of this
annual general meeting), to allot and issue ordinary shares for cash subject to the JSE Listings Requirements and the
Companies Act, as amended, on the following basis:
1. the allotment and issue of ordinary shares for cash shall be made only to persons qualifying as public shareholders as
defined in the Listings Requirements of the JSE, and not to related parties;
80 / financial statements
2. the number of ordinary shares issued for cash shall not in the aggregate in any one financial year of the company
exceed 15% of the company’s issued ordinary shares;
3. the maximum discount at which ordinary shares may be issued for cash is 10% of the weighted average traded price
on the JSE of those ordinary shares over 30 days prior to the date that the price of the issue is determined or agreed
by the directors of the company; and
4. after the company has issued ordinary shares for cash which represent, on a cumulative basis within a financial year,
5% or more of the number of ordinary shares in issue prior to that issue, the company shall publish an announcement
containing full details of the issue, including the effect of the issue on the net asset value and earnings per share of
the company."
NOTE
In terms of the Listings Requirements of the JSE, a 75% majority of the votes cast by shareholders present or represented by
proxy at the annual general meeting must be cast in favour of ordinary resolution 2 for it to be approved.
VOTING AND PROXIES
A member entitled to attend and vote at the annual general meeting is entitled to appoint a proxy/proxies to attend, speak, and
on a poll, vote in his/her stead. A proxy need not to be a member of the company.
A form of proxy is attached for the convenience of any certificated shareholder and own-name registered dematerialised
shareholder who cannot attend the annual general meeting, but who wish to be represented thereat;
Certificated shareholders
Shareholders wishing to attend the annual general meeting have to ensure beforehand with the transfer secretaries of the
Company that their shares are in fact registered in their name. Should this not be the case and the shares are registered in
another name, or in the name of a nominee company, it is incumbent on shareholders attending the meeting to make the ncessary
arrangements with that party to be able to attend and vote in their capacity.
Uncertificated shareholders
Shareholders who have dematerialised their shares who wish to attend the annual general meeting have to request their Central
Securities Depository Participant (‘CSDP’) or broker to provide them with a Letter of Representation. Should shareholders who have
dematerialised their ordinary shares wish to vote by proxy, they must provide their CSDP or broker with their voting instructions in
terms of the custody agreement entered into between the dematerialised shareholders and their CSDP or broker.
PROXIES
The instrument appointing a proxy and the authority (if any) under which it is signed must reach the Transfer Secretary of the
company at the address given below, by no later than 17 October 2003.
On a poll every shareholder of the company present in person or represented by proxy shall have one vote for every share held
in the company by the shareholder.
By order of the Board
GD MottramCompany secretary
20 August 2003
Registered office Transfer secretariesGroup Five Limited Computershare Limited
371 Rivonia Boulevard Ground Floor, 70 Marshall Street
Rivonia Johannesburg
2128 2001
PO Box 5016 PO Box 61051
Rivonia Marshalltown
2128 2107
Notice of Annual General Meetingfor the year ended 30 June 2003

Form of Proxy
For use at the annual general meeting of the holders of ordinary shares in the company (“Group Five shareholders”) to be held atthe offices of Group Five, 371 Rivonia Boulevard, Rivonia on 21 October 2003 (“the annual general meeting”) at 09h00.
Group Five shareholders who have dematerialised their Group Five shares through a CSDP/broker must not comlete this form ofproxy and must provide their CSDP/broker with their voting instructions, except for Group Five shareholders who have electedown name registration in the sub-register through a CSDP/broker, which shareholders must complete this form of proxy and lodgeit with the transfer secretaries. Holders of dematerialised Group Five shares wishing to attend the annual general meeting mustinform their CSDP/broker of such intention and request their CSDP/broker to issue them with the relevant authorisation to attend.
I/We
of
being the registered holder/s of ordinary shares in the capital of the company, hereby appoint (See note 1):
1. or, failing him/her
2. or, failing him/her
3. or, failing him/her
the chairman of the annual general meeting
as my/our proxy to act for me/us at the annual general meeting for the purposes of considering and, if deemed fit, passing, withor without modification, the resolution to be proposed thereat and at each adjournment thereof and to vote for and/or against theresolutions and/or abstain from voting in respect of the ordinary shares registered in my/our name/s in accordance with theinstructions/notes on the reverse side hereof.
Proposed ordinary/special resolutions In favour Against Abstain
1. RESOLUTION NUMBER 1
Adoption of the annual financial statements for the year ended 30 June 2003.
2. RESOLUTION NUMBER 2
Re-election of directors by a single resolution
3. RESOLUTION NUMBER 3
Re-election of directors.
4. RESOLUTION NUMBER 4
Ratify directors’ fees for year ended 30 June 2003.
5. RESOLUTION NUMBER 5
Directors authorised to appoint auditors.
6. RESOLUTION NUMBER 6
Placing the unissued shares under the control of the directors.
7. RESOLUTION NUMBER 7
Directors authorised to allot and issue ordinary shares for cash
8. SPECIAL RESOLUTION NUMBER 1
Approve amendments to Articles of Association.
A member entitled to attend and vote at the annual general meeting may appoint one or more proxies to attend, vote, speakand act in his stead. A proxy need not be a member of the company.
Signed at on 2003
Signature
assisted by me (where applicable)
(State capacity and full name) (see note 2).
Please use block letters.
Please read the notes on the reverse side hereof.81
(Registration number 1969/000032/06)(Incorporated in the Republic of South Africa)Share code: GRF ISIN Code:ZAE000027405(“Group Five” or “the company”)

Notes to Proxy
NOTES
1. A Group Five shareholder may insert the name of a proxy or the names of two alternative proxies of his/her choice in the
spaces provided, with or without deleting ‘the chairman of the general meeting’, but any such deletion must be initialled by
the Group Five shareholder concerned.
If two or more proxies attend the meeting, then that person attending the meeting whose name appears first on the proxy
form, and whose name is not deleted, shall be regarded as the validly appointed proxy.
2. The authority of a person signing a proxy in a representative capacity must be attached to the proxy unless that authority has
already been recorded by the company’s transfer secretaries or waived by the chairman of the annual general meeting.
3. In order to be effective, proxy forms must reach the registered office of the company or the company’s transfer secretaries at
least 48 hours before the time appointed for holding the meeting.
4. Any alteration or correction made to this form of proxy must be initialled by the signatory/(ies).
5. If this proxy form is returned without any indication as to how the proxy should vote, the proxy will be entitled to vote or abstain
from voting as he thinks fit.
6. The delivery of the duly completed proxy form shall not preclude any member or his duly authorised representative from
attending the meeting, speaking and voting instead of such duly appointed proxy.
Registered office
371 Rivonia Boulevard
Rivonia
Sandton
2128
PO Box 5016
Rivonia 2128
82 / financial statements

BROAD-BASED SOLUTIONS