broad lane, whalley - ribble valley · pdf filedavid wilson homes nw ... 1.1 hepworth...
TRANSCRIPT
Noise AssessmentJuly 2012
Application for Residential Development at Mitton Road, Whalley
Report No.: 21506.01v1
May 2012
PROPOSED RESIDENTIAL DEVELOPMENT ON LAND AT MITTON ROAD/BROAD LANE, WHALLEY:
ASSESSMENT AND CONTROL OF ROAD TRAFFIC & RAILWAY NO ISE IMPACT
Report prepared by: Hepworth Acoustics Ltd
21 Little Peter Street Manchester
M15 4PS
On behalf of: David Wilson Homes NW
Report Prepared By:
Daniel Carrol BSc AMIOA – Graduate Consultant
Report Checked By:
Paul Bassett BSc MSc FIOA – Regional Director
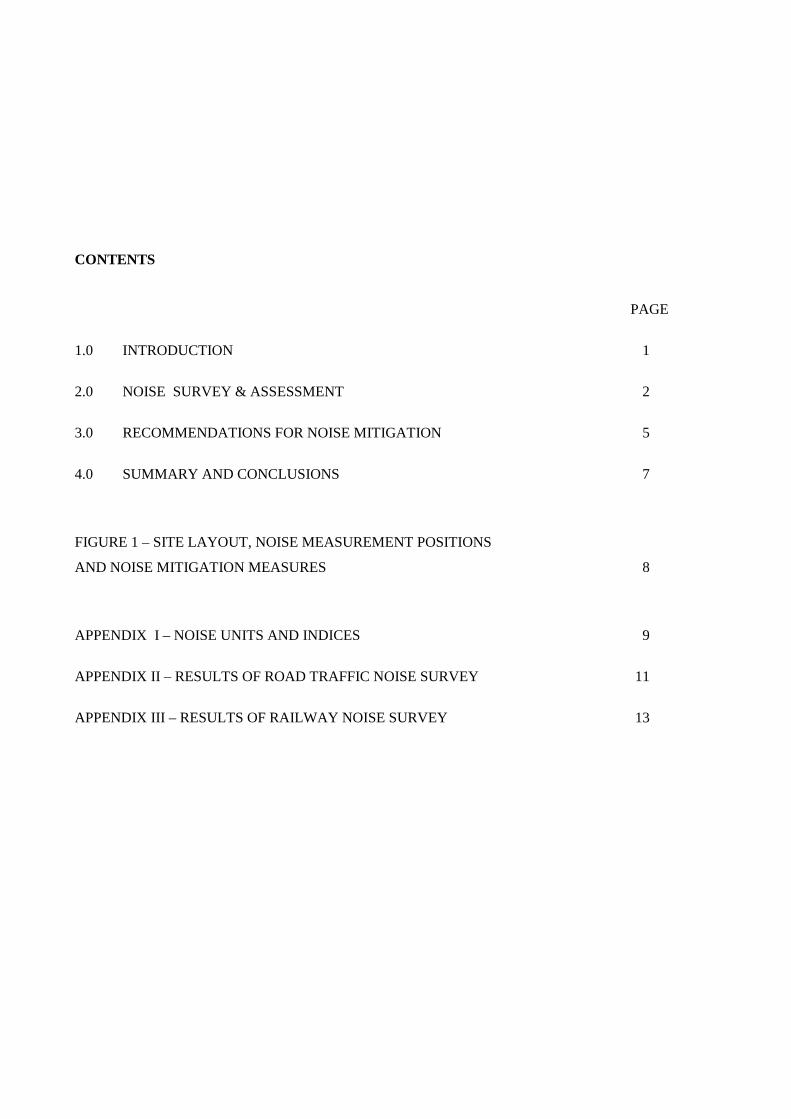
CONTENTS
PAGE
1.0 INTRODUCTION 1
2.0 NOISE SURVEY & ASSESSMENT 2
3.0 RECOMMENDATIONS FOR NOISE MITIGATION 5
4.0 SUMMARY AND CONCLUSIONS 7
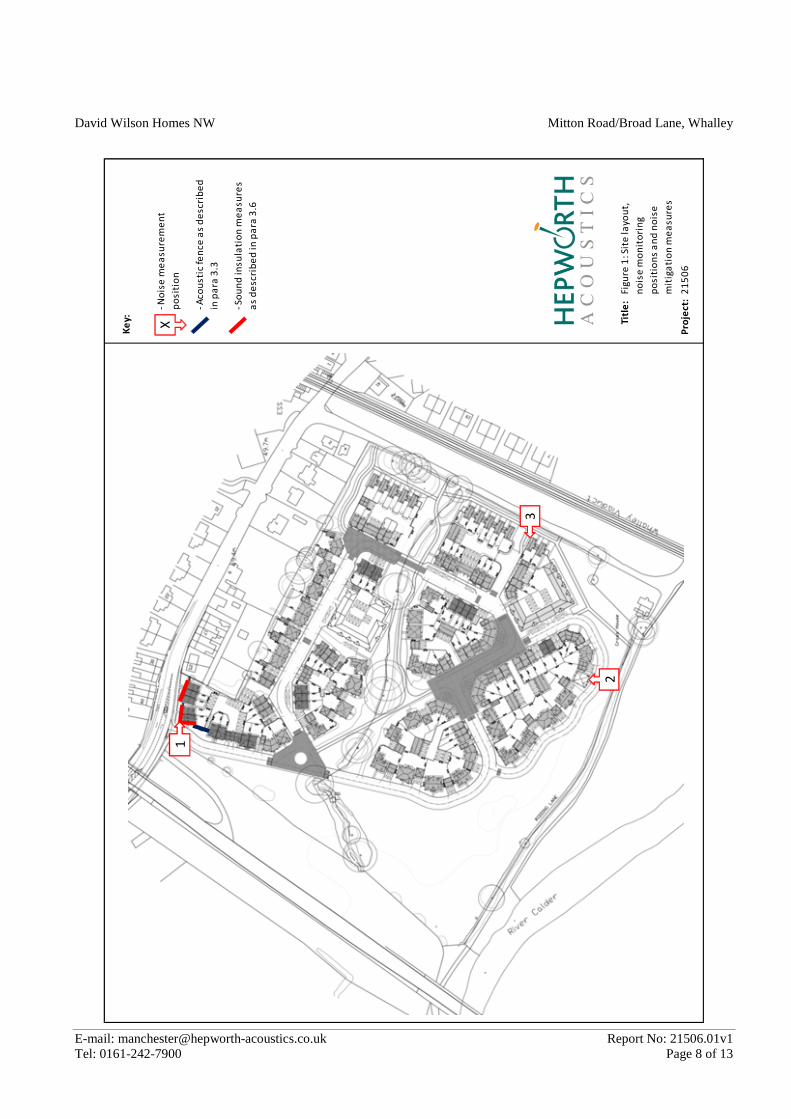
FIGURE 1 – SITE LAYOUT, NOISE MEASUREMENT POSITIONS
AND NOISE MITIGATION MEASURES 8
APPENDIX I – NOISE UNITS AND INDICES 9
APPENDIX II – RESULTS OF ROAD TRAFFIC NOISE SURVEY 11
APPENDIX III – RESULTS OF RAILWAY NOISE SURVEY 13
David Wilson Homes NW Mitton Road/Broad Lane, Whalley
E-mail: [email protected] Report No: 21506.01v1 Tel: 0161-242-7900 Page 1 of 13
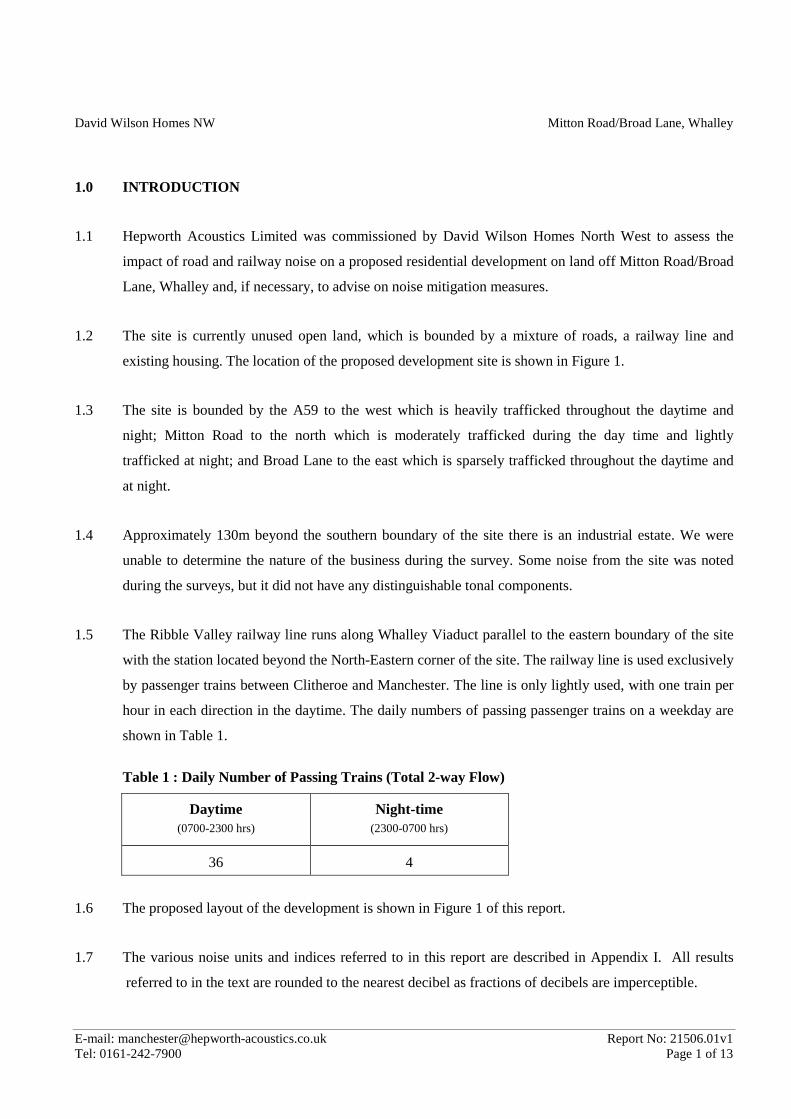
1.0 INTRODUCTION
1.1 Hepworth Acoustics Limited was commissioned by David Wilson Homes North West to assess the
impact of road and railway noise on a proposed residential development on land off Mitton Road/Broad
Lane, Whalley and, if necessary, to advise on noise mitigation measures.
1.2 The site is currently unused open land, which is bounded by a mixture of roads, a railway line and
existing housing. The location of the proposed development site is shown in Figure 1.
1.3 The site is bounded by the A59 to the west which is heavily trafficked throughout the daytime and
night; Mitton Road to the north which is moderately trafficked during the day time and lightly
trafficked at night; and Broad Lane to the east which is sparsely trafficked throughout the daytime and
at night.
1.4 Approximately 130m beyond the southern boundary of the site there is an industrial estate. We were
unable to determine the nature of the business during the survey. Some noise from the site was noted
during the surveys, but it did not have any distinguishable tonal components.
1.5 The Ribble Valley railway line runs along Whalley Viaduct parallel to the eastern boundary of the site
with the station located beyond the North-Eastern corner of the site. The railway line is used exclusively
by passenger trains between Clitheroe and Manchester. The line is only lightly used, with one train per
hour in each direction in the daytime. The daily numbers of passing passenger trains on a weekday are
shown in Table 1.
Table 1 : Daily Number of Passing Trains (Total 2-way Flow)
Daytime (0700-2300 hrs)
Night-time (2300-0700 hrs)
36 4
1.6 The proposed layout of the development is shown in Figure 1 of this report.
1.7 The various noise units and indices referred to in this report are described in Appendix I. All results
referred to in the text are rounded to the nearest decibel as fractions of decibels are imperceptible.
David Wilson Homes NW Mitton Road/Broad Lane, Whalley
E-mail: [email protected] Report No: 21506.01v1 Tel: 0161-242-7900 Page 2 of 13
2.0 NOISE SURVEY & ASSESSMENT
2.1 A noise measurement survey has been carried out. Noise levels were measured on the development site
between 11:00 – 15:10 hours on Wednesday 16th May and between 04:00 – 07:00 on Wednesday 23rd
May 2012.
2.2 Noise levels were measured at the following locations (as shown in Figure 2):
i. Location 1 – Nearest proposed façade to Mitton Road/A59 ii. Location 2 – Nearest proposed façade to Southern Boundary iii. Location 3 – Nearest proposed façade to Railway Line.
2.3 The noise monitoring was carried out using a Brüel & Kjær 2260 ‘Type 1’ sound level meter (Serial
numbers 2467015). The meter was mounted onto a tripod with a microphone height of approximately
1.4 metres above the ground. A windshield was fitted to the microphone during all noise measurements.
All measurements were carried out in ‘free-field’ conditions. Calibration checks were carried out
before and after the noise survey with no variance in levels observed.
Road Traffic Noise Survey
2.4 The traffic noise monitoring was carried out for representative periods of the daytime at Location 1, as
described above. The daytime noise levels have been evaluated generally on the basis of the ‘shortened
measurement method’ described in the Department of Transport document ‘Calculation of Road Traffic
Noise’ (CRTN), 1988. The CRTN shortened measurement method involves taking traffic noise
measurements over representative sampling time periods within any three consecutive hours between
10:00 hours and 17:00 hours. CRTN uses LA10 which can be converted to LAeq, however we have used
the averaged LAeq hour values as an estimate of the LAeq (16 hour) values.
2.5 The night-time LAeq (15min) values at Locations 1 and 2 have been averaged logarithmically. The resulting
values have been taken as being representative of the night-time LAeq (8 hour) values.
2.6 Location 2 was used to measure any noise from the industrial premises beyond the southern boundary
in addition to distant road traffic noise upon the nearest proposed residential properties to the southern
facade. At Location 2 the LAeq, 15 Min values have been averaged logarithmically. The resulting value has
been taken as being representative of the day-time LAeq value.
David Wilson Homes NW Mitton Road/Broad Lane, Whalley
E-mail: [email protected] Report No: 21506.01v1 Tel: 0161-242-7900 Page 3 of 13
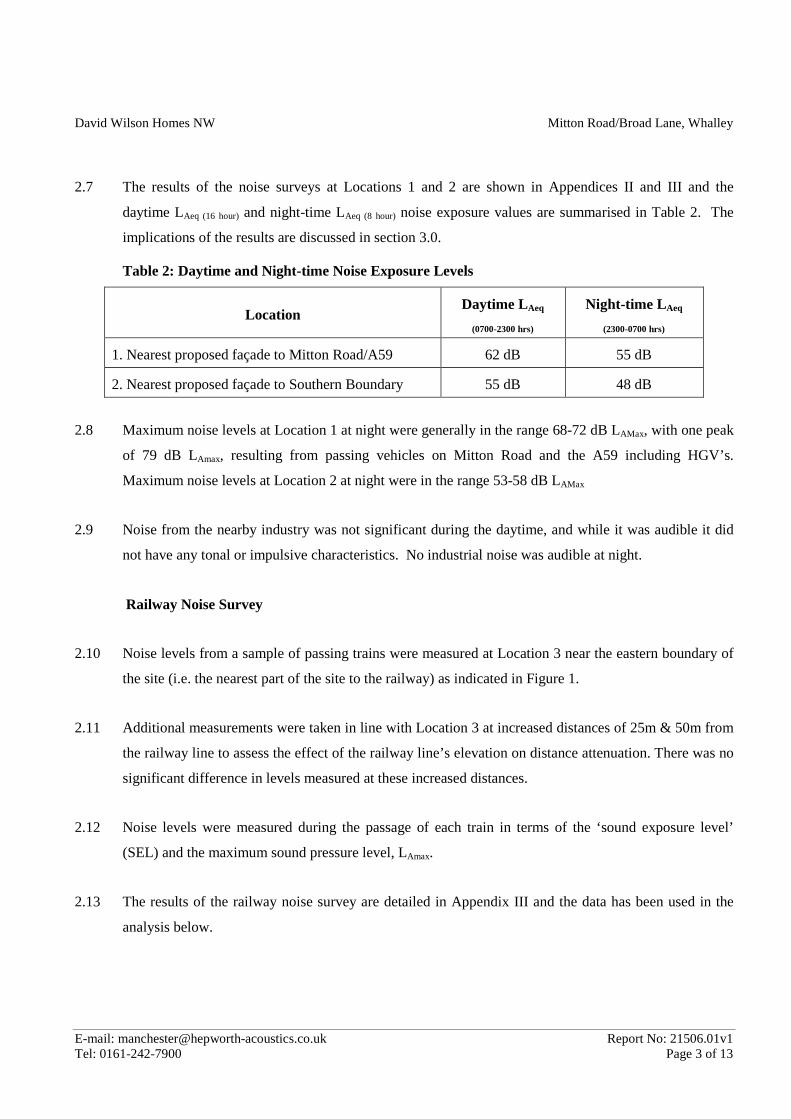
2.7 The results of the noise surveys at Locations 1 and 2 are shown in Appendices II and III and the
daytime LAeq (16 hour) and night-time LAeq (8 hour) noise exposure values are summarised in Table 2. The
implications of the results are discussed in section 3.0.
Table 2: Daytime and Night-time Noise Exposure Levels
Location Daytime LAeq
(0700-2300 hrs) Night-time L Aeq
(2300-0700 hrs)
1. Nearest proposed façade to Mitton Road/A59 62 dB 55 dB
2. Nearest proposed façade to Southern Boundary 55 dB 48 dB
2.8 Maximum noise levels at Location 1 at night were generally in the range 68-72 dB LAMax, with one peak
of 79 dB LAmax, resulting from passing vehicles on Mitton Road and the A59 including HGV’s.
Maximum noise levels at Location 2 at night were in the range 53-58 dB LAMax
2.9 Noise from the nearby industry was not significant during the daytime, and while it was audible it did
not have any tonal or impulsive characteristics. No industrial noise was audible at night.
Railway Noise Survey
2.10 Noise levels from a sample of passing trains were measured at Location 3 near the eastern boundary of
the site (i.e. the nearest part of the site to the railway) as indicated in Figure 1.
2.11 Additional measurements were taken in line with Location 3 at increased distances of 25m & 50m from
the railway line to assess the effect of the railway line’s elevation on distance attenuation. There was no
significant difference in levels measured at these increased distances.
2.12 Noise levels were measured during the passage of each train in terms of the ‘sound exposure level’
(SEL) and the maximum sound pressure level, LAmax.
2.13 The results of the railway noise survey are detailed in Appendix III and the data has been used in the
analysis below.
David Wilson Homes NW Mitton Road/Broad Lane, Whalley
E-mail: [email protected] Report No: 21506.01v1 Tel: 0161-242-7900 Page 4 of 13
Calculation of Railway Noise Exposure
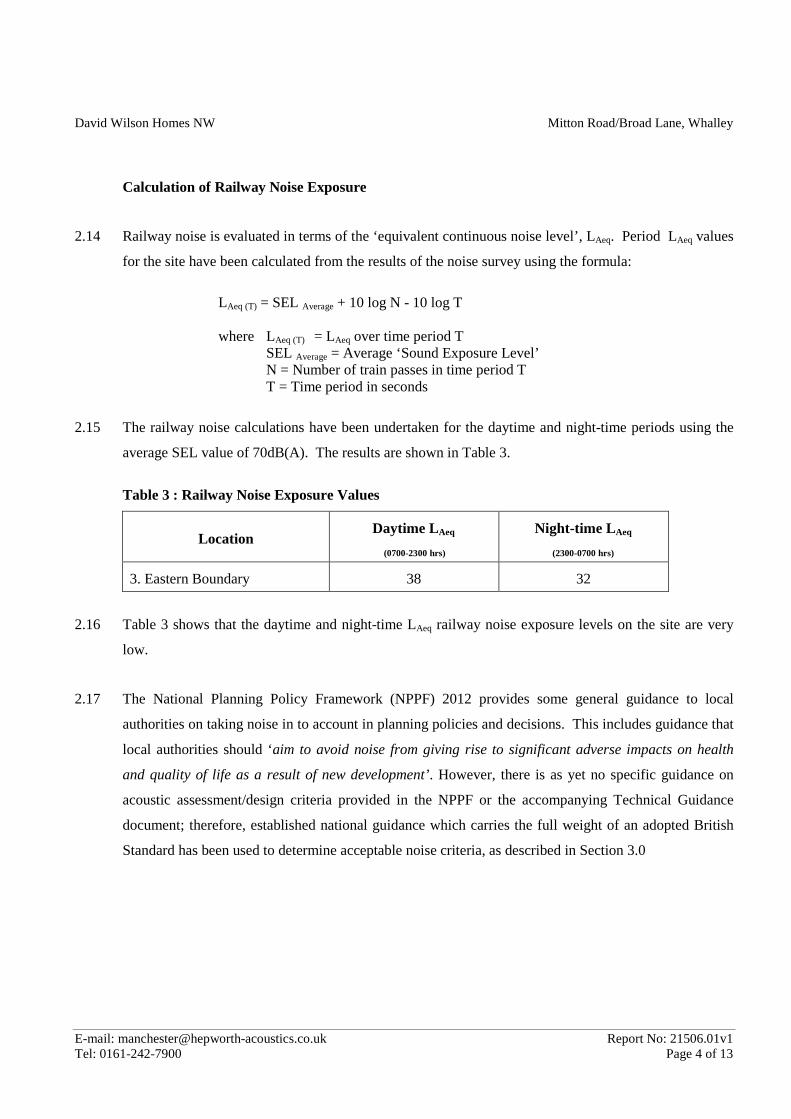
2.14 Railway noise is evaluated in terms of the ‘equivalent continuous noise level’, LAeq. Period LAeq values
for the site have been calculated from the results of the noise survey using the formula:
LAeq (T) = SEL Average + 10 log N - 10 log T where LAeq (T) = LAeq over time period T SEL Average = Average ‘Sound Exposure Level’ N = Number of train passes in time period T T = Time period in seconds
2.15 The railway noise calculations have been undertaken for the daytime and night-time periods using the
average SEL value of 70dB(A). The results are shown in Table 3.
Table 3 : Railway Noise Exposure Values
Location Daytime LAeq
(0700-2300 hrs) Night-time L Aeq
(2300-0700 hrs)
3. Eastern Boundary 38 32
2.16 Table 3 shows that the daytime and night-time LAeq railway noise exposure levels on the site are very
low.
2.17 The National Planning Policy Framework (NPPF) 2012 provides some general guidance to local
authorities on taking noise in to account in planning policies and decisions. This includes guidance that
local authorities should ‘aim to avoid noise from giving rise to significant adverse impacts on health
and quality of life as a result of new development’. However, there is as yet no specific guidance on
acoustic assessment/design criteria provided in the NPPF or the accompanying Technical Guidance
document; therefore, established national guidance which carries the full weight of an adopted British
Standard has been used to determine acceptable noise criteria, as described in Section 3.0
David Wilson Homes NW Mitton Road/Broad Lane, Whalley
E-mail: [email protected] Report No: 21506.01v1 Tel: 0161-242-7900 Page 5 of 13
3.0 RECOMMENDATIONS FOR NOISE MITIGATION
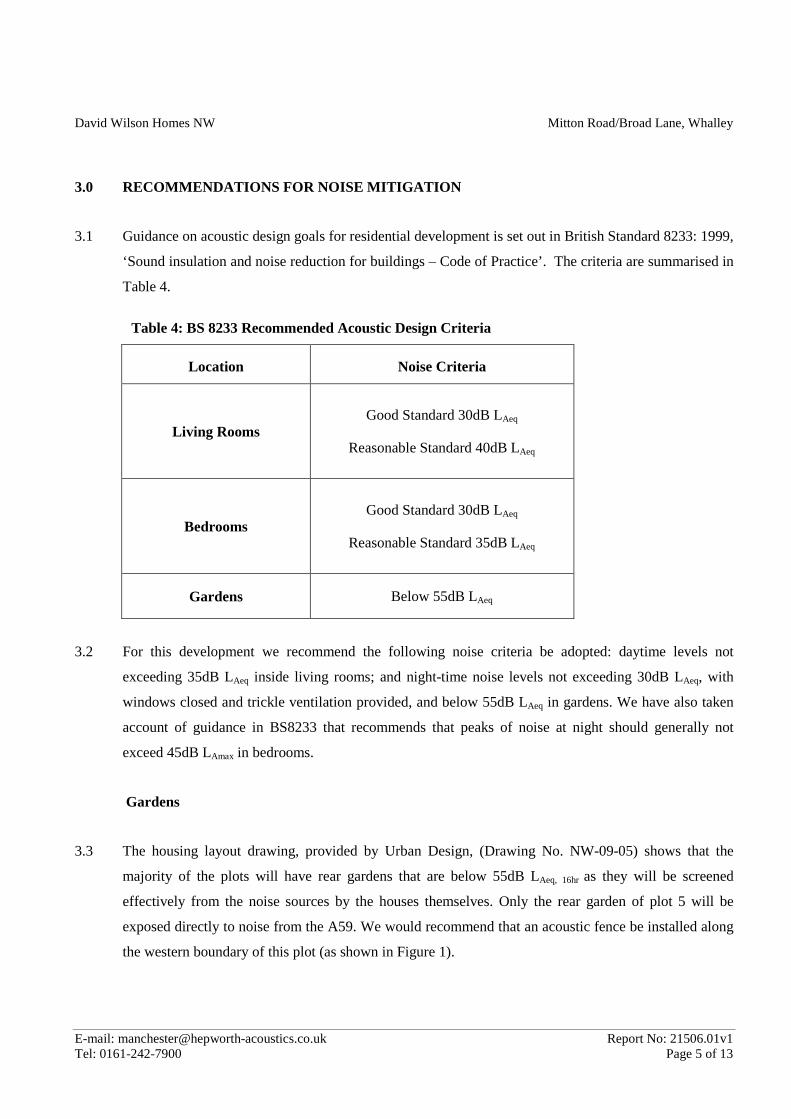
3.1 Guidance on acoustic design goals for residential development is set out in British Standard 8233: 1999,
‘Sound insulation and noise reduction for buildings – Code of Practice’. The criteria are summarised in
Table 4.
Table 4: BS 8233 Recommended Acoustic Design Criteria
Location Noise Criteria
Living Rooms Good Standard 30dB LAeq
Reasonable Standard 40dB LAeq
Bedrooms Good Standard 30dB LAeq
Reasonable Standard 35dB LAeq
Gardens Below 55dB LAeq
3.2 For this development we recommend the following noise criteria be adopted: daytime levels not
exceeding 35dB LAeq inside living rooms; and night-time noise levels not exceeding 30dB LAeq, with
windows closed and trickle ventilation provided, and below 55dB LAeq in gardens. We have also taken
account of guidance in BS8233 that recommends that peaks of noise at night should generally not
exceed 45dB LAmax in bedrooms.
Gardens
3.3 The housing layout drawing, provided by Urban Design, (Drawing No. NW-09-05) shows that the
majority of the plots will have rear gardens that are below 55dB LAeq, 16hr as they will be screened
effectively from the noise sources by the houses themselves. Only the rear garden of plot 5 will be
exposed directly to noise from the A59. We would recommend that an acoustic fence be installed along
the western boundary of this plot (as shown in Figure 1).

David Wilson Homes NW Mitton Road/Broad Lane, Whalley
E-mail: [email protected] Report No: 21506.01v1 Tel: 0161-242-7900 Page 6 of 13
3.4 To provide the required attenuation, the fence in addition to being at least 2.0m high, should be
constructed from at least 20mm thick timber with no holes or gaps. Suppliers of proprietary acoustic
fences include Jacksons Fencing (www.jacksons-fencing.co.uk), Guardian Fencing
(www.guardianfencing.com) and Ransfords (www.ransfords.co.uk).
Houses
3.5 For the majority of houses on the site, the adopted internal noise criteria will be achieved with the
installation of well fitted standard thermal double glazing (i.e. 4mm glass – nominal cavity – 4mm
glass) and standard in-frame trickle vents. However, there is a section of the site that will require an
increased specification of ventilation to meet the internal noise criteria, which are as follows:
Houses immediately facing Mitton Road (Plots 1-5)
3.6 All bedrooms in these houses should, instead of standard slot vents, have ventilation provided by an
acoustically treated alternative such as the Aereco EAR System comprising EAR 206 humidity
sensitive indoor unit, and acoustic sleeve, with outdoor AEA851 acoustic canopy (Dn,e,w 42dB).
Houses most exposed to railway noise
3.7 The low levels of noise from the railway line mean that no specific measures are required to meet the
internal noise criteria due to noise from the railway.
Planning Condition
3.8 The need to ensure that an adequate scheme of noise mitigation is implemented can be formalised by an
appropriately worded planning condition that requires a scheme of noise mitigation measured to be
submitted to, and approved by, the local planning authority prior to commencement of building works.

David Wilson Homes NW Mitton Road/Broad Lane, Whalley
E-mail: [email protected] Report No: 21506.01v1 Tel: 0161-242-7900 Page 7 of 13
4.0 SUMMARY AND CONCLUSIONS
4.1 A noise assessment has been carried out for a proposed residential development on land at Mitton
Road/Broad Lane, Whalley.
4.2 Noise measurement surveys have been carried out on the site and the daytime and night-time road
traffic and railway noise exposure values have been evaluated
4.3 Where necessary, we have recommended appropriate noise mitigation measures in order to achieve
acceptable noise levels as defined in BS8233:1999. The implementation of an adequate scheme of noise
mitigation measures can be ensured by the use of an appropriately worded planning condition.
David Wilson Homes NW Mitton Road/Broad Lane, Whalley
E-mail: [email protected] Report No: 21506.01v1 Tel: 0161-242-7900 Page 8 of 13
FIGURE 1 – SITE LAYOUT, NOISE MEASUREMENT POSITIONS AND NOISE
MITIGATION MEASURES
Ke
y:
Tit
le:
Pro
jec
t:- N
ois
e m
ea
su
rem
en
t
po
sit
ion
- S
ou
nd
in
su
lati
on
me
as
ure
s
as d
esc
rib
ed
in
pa
ra 5
.5
21
50
6
Fig
ure
1: S
ite
la
yo
ut,
no
ise
mo
nit
ori
ng
po
sit
ion
s a
nd
no
ise
mit
iga
tio
n m
ea
su
res
- A
co
us
tic f
en
ce
as d
esc
rib
ed
in p
ara
3.3
- S
ou
nd
in
su
lati
on
me
as
ure
s
as d
esc
rib
ed
in
pa
ra 3
.6
- S
ou
nd
in
su
lati
on
me
as
ure
s
as d
esc
rib
ed
in
pa
ra 5
.3
- S
ou
nd
in
su
lati
on
me
as
ure
s
as d
esc
rib
ed
in
pa
ra 5
.4
3
2
X1
David Wilson Homes NW Mitton Road/Broad Lane, Whalley
E-mail: [email protected] Report No: 21506.01v1 Tel: 0161-242-7900 Page 9 of 13
APPENDIX I – NOISE UNITS AND INDICES
a) Sound Pressure Level and the decibel (dB)
A sound wave is a small fluctuation of atmospheric pressure. The human ear responds to these
variations in pressure, producing the sensation of hearing. The ear can detect a very wide range of
pressure variations. In order to cope with this wide range of pressure variations, a logarithmic scale is
used to convert the values into manageable numbers. Although it might seem unusual to use a
logarithmic scale to measure a physical phenomenon, it has been found that human hearing also
responds to sound in an approximately logarithmic fashion. The dB (decibel) is the logarithmic unit
used to describe sound (or noise) levels. The usual range of sound pressure levels is from 0 dB
(threshold of hearing) to 120 dB (threshold of pain).
b) Frequency and hertz (Hz)
As well as the loudness of a sound, the frequency content of a sound is also very important. Frequency
is a measure of the rate of fluctuation of a sound wave. The unit used is cycles per second, or hertz
(Hz). Sometimes large frequency values are written as kilohertz (kHz), where 1 kHz = 1000 Hz.
Young people with normal hearing can hear frequencies in the range 20 Hz to 20,000 Hz. However, the
upper frequency limit gradually reduces as a person gets older.
c) A-weighting
The ear is not equally sensitive to sound at all frequencies. It is less sensitive to sound at low and very
high frequencies, compared with the frequencies in between. Therefore, when measuring a sound made
up of different frequencies, it is often useful to ‘weight’ each frequency appropriately, so that the
measurement correlates better with what a person would actually hear. This is usually achieved by
using an electronic filter called the ‘A’ weighting, which is built into sound level meters. Noise levels
measured using the ‘A’ weighting are denoted dB(A) or dBLA.
David Wilson Homes NW Mitton Road/Broad Lane, Whalley
E-mail: [email protected] Report No: 21506.01v1 Tel: 0161-242-7900 Page 10 of 13
d) Glossary of Terms
When a noise level is constant and does not fluctuate, it can be described adequately by measuring the
dB(A) level. However, when the noise level varies with time, the measured dB(A) level will vary as
well. In this case it is therefore not possible to represent the noise climate with a simple dB(A) value.
In order to describe noise where the level is continuously varying, a number of other indices can be
used. The indices used in this report are described below.
LAeq This is the A–weighted 'equivalent continuous noise level' which is an average of the total
sound energy measured over a specified time period. In other words, LAeq is the level of a
continuous noise which has the same total (A–weighted) energy as the real fluctuating noise,
measured over the same time period. It is increasingly being used as the preferred parameter for
all forms of environmental noise.
LAmax This is the maximum A–weighted noise level that was recorded during the monitoring period.
LA10 This is the A–weighted noise level exceeded for 10% of the time period. LA10 is usually used
as a measure of traffic noise.
LA90 This is the A–weighted noise level exceeded for 90% of the time period. LA90 is used as a
measure of background noise.
SEL This is the A–weighted ‘Sound Exposure Level’ which is used for measuring discrete noise
events. Essentially it is a measure of the sound energy of the whole noise event normalised to a
period of 1 second. The SEL value can be used to calculate the actual LAeq value for a given
time period if the number of noise events is known.
David Wilson Homes NW Mitton Road/Broad Lane, Whalley
E-mail: [email protected] Report No: 21506.01v1 Tel: 0161-242-7900 Page 11 of 13
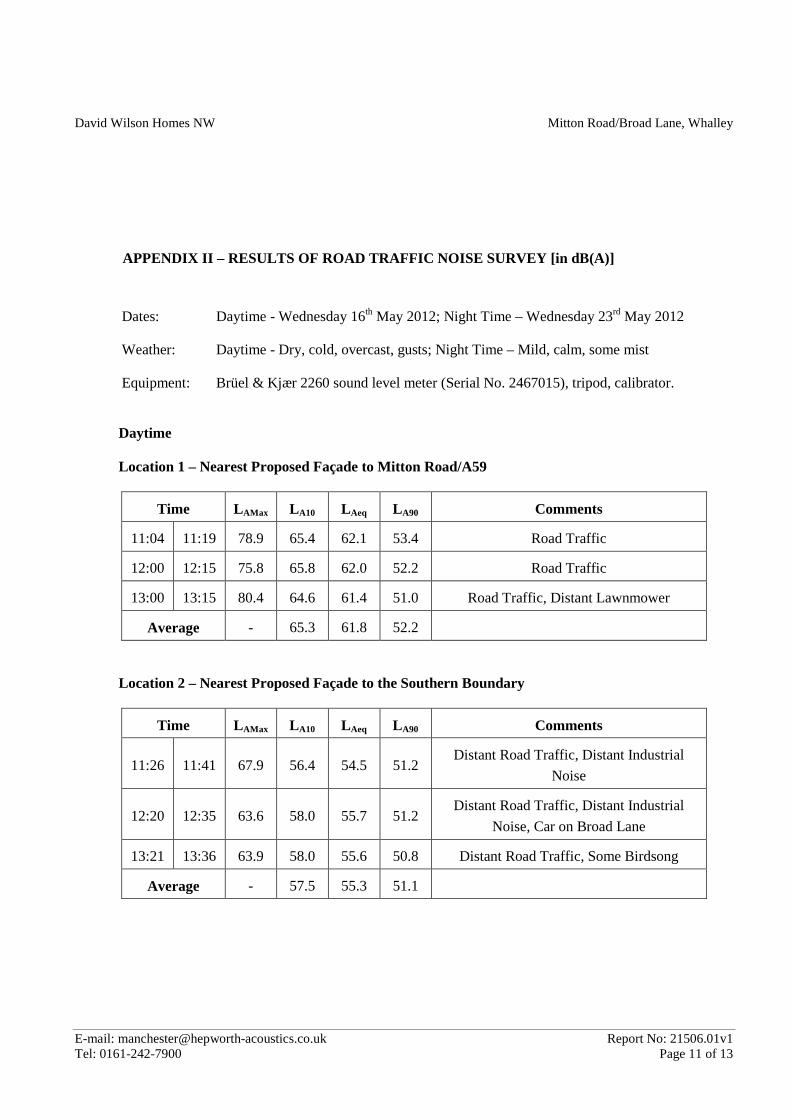
APPENDIX II – RESULTS OF ROAD TRAFFIC NOISE SURVEY [in dB(A)]
Dates: Daytime - Wednesday 16th May 2012; Night Time – Wednesday 23rd May 2012
Weather: Daytime - Dry, cold, overcast, gusts; Night Time – Mild, calm, some mist
Equipment: Brüel & Kjær 2260 sound level meter (Serial No. 2467015), tripod, calibrator.
Daytime Location 1 – Nearest Proposed Façade to Mitton Road/A59
Time LAMax LA10 LAeq LA90 Comments
11:04 11:19 78.9 65.4 62.1 53.4 Road Traffic
12:00 12:15 75.8 65.8 62.0 52.2 Road Traffic
13:00 13:15 80.4 64.6 61.4 51.0 Road Traffic, Distant Lawnmower
Average - 65.3 61.8 52.2
Location 2 – Nearest Proposed Façade to the Southern Boundary
Time LAMax LA10 LAeq LA90 Comments
11:26 11:41 67.9 56.4 54.5 51.2 Distant Road Traffic, Distant Industrial
Noise
12:20 12:35 63.6 58.0 55.7 51.2 Distant Road Traffic, Distant Industrial
Noise, Car on Broad Lane
13:21 13:36 63.9 58.0 55.6 50.8 Distant Road Traffic, Some Birdsong
Average - 57.5 55.3 51.1
David Wilson Homes NW Mitton Road/Broad Lane, Whalley
E-mail: [email protected] Report No: 21506.01v1 Tel: 0161-242-7900 Page 12 of 13
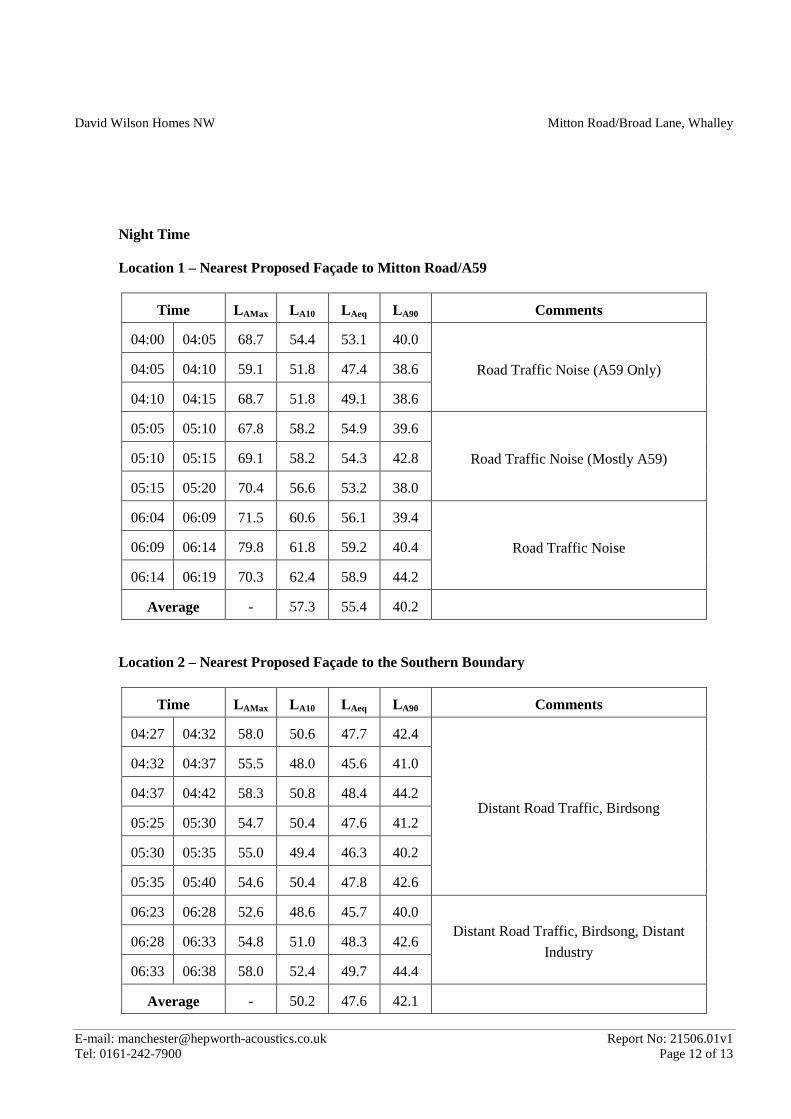
Night Time Location 1 – Nearest Proposed Façade to Mitton Road/A59
Time LAMax LA10 LAeq LA90 Comments
04:00 04:05 68.7 54.4 53.1 40.0
Road Traffic Noise (A59 Only)
04:05 04:10 59.1 51.8 47.4 38.6
04:10 04:15 68.7 51.8 49.1 38.6
05:05 05:10 67.8 58.2 54.9 39.6
Road Traffic Noise (Mostly A59)
05:10 05:15 69.1 58.2 54.3 42.8
05:15 05:20 70.4 56.6 53.2 38.0
06:04 06:09 71.5 60.6 56.1 39.4
Road Traffic Noise
06:09 06:14 79.8 61.8 59.2 40.4
06:14 06:19 70.3 62.4 58.9 44.2
Average - 57.3 55.4 40.2
Location 2 – Nearest Proposed Façade to the Southern Boundary
Time LAMax LA10 LAeq LA90 Comments
04:27 04:32 58.0 50.6 47.7 42.4
Distant Road Traffic, Birdsong
04:32 04:37 55.5 48.0 45.6 41.0
04:37 04:42 58.3 50.8 48.4 44.2
05:25 05:30 54.7 50.4 47.6 41.2
05:30 05:35 55.0 49.4 46.3 40.2
05:35 05:40 54.6 50.4 47.8 42.6
06:23 06:28 52.6 48.6 45.7 40.0 Distant Road Traffic, Birdsong, Distant
Industry 06:28 06:33 54.8 51.0 48.3 42.6
06:33 06:38 58.0 52.4 49.7 44.4
Average - 50.2 47.6 42.1

David Wilson Homes NW Mitton Road/Broad Lane, Whalley
E-mail: [email protected] Report No: 21506.01v1 Tel: 0161-242-7900 Page 13 of 13
APPENDIX III – RESULTS OF RAILWAY NOISE SURVEY [in dB(A)]
Dates: Wednesday 16th May 2012
Weather: Dry, cold, overcast, gusts.
Equipment: Brüel & Kjær 2260 sound level meter (Serial No. 2467015), tripod, calibrator.
Location 3- Nearest Proposed Façade to the Eastern Boundary
Time Train Type Direction L Amax, SEL
11:45 3-car Passenger S 58.8 68.6
12:45 3-car Passenger S 60.7 69.9
15:04 2-car Passenger N 59.5 69.3
13:45 3-car Passenger S 59.9 72.5
14:46 3-car Passenger S 59.1 70.6
(Log) Average SEL = 70.4