broadridge financial solutions, inc./media/files/b/broadridge-ir/reports-and...introduction david ng...
TRANSCRIPT

2014 Investor &Analyst Day
• Broadridge Financial Solutions, Inc.
December 11, 2014

2014 Investor &Analyst Day
• Broadridge Financial Solutions, Inc.
David NgHead of Investor Relations
Introduction

2© 2014 | 2
Broadridge Financial Solutions: Agenda for Investor Day
Introduction David Ng
Managing Director, Investor Relations
9:00–09:05
Opening Remarks Richard J. Daly
President and Chief Executive Officer
9:05–09:25
Strategy and Business Overview Timothy C. Gokey
Chief Operating Officer
9:25–09:45
Banks, Broker-Dealers and Issuers (ICS) Robert Schifellite
President, Investor Communication Solutions
9:45–10:10
Mutual Fund and Retirement Solutions (ICS) Gerard F. Scavelli
President, Mutual Fund and Retirement Solutions
10:10–10:30
Break 10:30–10:45
Global Technology and Operations (GTO) Charles J. Marchesani
President, Global Technology and Operations
10:45–11:05
Global Sales and Marketing Christopher J. Perry
President, Global Sales, Marketing and Client Solutions
11:05–11:20
M&A Overview Vijay Mayadas
SVP, Strategy & M&A
11:20–11:30
Financial Overview James M. Young
Chief Financial Officer
11:30–11:50
Closing Remarks Richard J. Daly
President and Chief Executive Officer
11:50–12:00
Q&A 12:00–12:30
Lunch with Management Team Management Team at Assigned Tables 12:30–1:30

3© 2014 | 3
Forward-Looking Statements
The Broadridge 2014 Investor & Analyst Day presentations and other written or oral statements made from time to time by representatives of Broadridge may contain "forward-looking statements" within the meaning of the Private Securities Litigation Reform Act of 1995. Statements that are not historical in nature, and which may be identified by the use of words such as "expects," "assumes," "projects,""anticipates," "estimates," "we believe," could be" and other words of similar meaning, are forward-looking statements. In particular, information about our future performance objectives are forward-looking statements. These statements are based on management’s expectations and assumptions and are subject to risks and uncertainties that may cause actual results to differ materially from those expressed. These risks and uncertainties include those risk factors discussed in Part I, "Item 1A. Risk Factors" of our Annual Report on Form 10-K for the fiscal year ended June 30, 2014 (the "2014 Annual Report"), as they may be updated in any future reports filed with the Securities and Exchange Commission. All forward-looking statements speak only as of the date of the presentations and are expressly qualified in their entirety by reference to the factors discussed in the 2014 Annual Report. These risks include: the success of Broadridge in retaining and selling additional services to its existing clients and in obtaining new clients; Broadridge’s reliance on a relatively small number of clients, the continued financial health of those clients, and the continued use by such clients of Broadridge’s services with favorable pricing terms; changes in laws and regulations affecting Broadridge’s clients or the services provided by Broadridge; declines in participation and activity in the securities markets; any material breach of Broadridge security affecting its clients’ customer information; the failure of Broadridge’s outsourced data center services provider to provide the anticipated levels of service; a disaster or other significant slowdown or failure of Broadridge’s systems or error in the performance of Broadridge’s services; overall market and economic conditions and their impact on the securities markets; Broadridge’s failure to keep pace with changes in technology and demands of its clients; Broadridge’s ability to attract and retain key personnel; the impact of new acquisitions and divestitures; and competitive conditions. Broadridge disclaims any obligation to update or revise forward-looking statements that may be made to reflect events or circumstances that arise after the date made or to reflect the occurrence of unanticipated events, other than as required by law.

4© 2014 | 4
Explanation of the Company’s Use of Non-GAAP Financial MeasuresIn certain circumstances, results have been presented that are not generally accepted accounting principles measures (“Non-GAAP”) and should be viewed in addition to, and not as a substitute for, the Company’s reported results. These Non-GAAP measures are indicators that management uses to provide additional meaningful comparisons between current results and prior reported results, and as a basis for planning and forecasting for future periods. In addition, Broadridge believes this Non-GAAP information helps investors understand the effect of these items on reported results and provides a better representation of the Company’s performance.
Our Non-GAAP historical and projected earnings results are adjusted to exclude the impact of certain significant events from our GAAP results such as Acquisition Amortization and Other Costs. Acquisition Amortization and Other Costs represent amortization charges associated with intangible asset values as well as other transaction costs associated with the Company’s acquisitions.
Free cash flows is a Non-GAAP measure and is defined by the Company as cash flows from operating activities, less capital expenditures and software purchases.
Please see the supplemental materials provided at the end the Broadridge 2014 Investor & Analyst Day presentations entitled “Non-GAAP to GAAP Reconciliations” for reconciliations of our historical Non-GAAP measures to the comparable GAAP measures. The supplemental materials are posted on Broadridge’s Investor Relations website at www.broadridge-ir.com and are also included as Attachment 99.1 to the Company’s Form 8-K dated December 11, 2014.
Use of Material Contained HereinThe information contained in the Broadridge 2014 Investor & Analyst Day presentations is being provided for your convenience and information only. This information is accurate as of the date of its initial presentation. If you plan to use this information for any purpose, verification of its continued accuracy is your responsibility. Broadridge assumes no duty to update or revise the information contained in the presentations. You may reproduce information contained in the presentations provided you do not alter, edit, or delete any of the content and provided you identify the source of the information as Broadridge Financial Solutions, Inc., which owns the copyright. The Broadridge 2014 Investor & Analyst Day presentations are posted on the Company’s Investor Relations website at www.broadridge-ir.com and are also included as Attachment 99.1 to the Company’s Form 8-K dated December 11, 2014.
Broadridge and the Broadridge logo are registered trademarks of Broadridge Financial Solutions, Inc.

2014 Investor &Analyst Day
• Broadridge Financial Solutions, Inc.
Richard J. DalyPresident and Chief Executive Officer
Opening Remarks

6© 2014 | 6
Broadridge Has a Unique Franchise and Ubiquitous Presence in Financial Services
1. Top 10 global banks based on total revenues in equity, FICC and IBD per Coalition Research, 1Q’14 | Note: All Broadridge results and statistics are for FY14 unless otherwise stated
of outstanding shares in US processed
80%+
investor communicationsprocessed annually
2+ Billion
years of financial services experience
50+ 10of the top-101 global banks are our clients
leading provider of US beneficial proxy and prospectus,US fixed income & Canadian equity processing
#1 98%client revenue retention rate
Investor Communication SolutionsGlobal Technology and
Operations
average daily in North American fixed income & equity trades
$5+ Trillion
countries where we clear and settle trades
70+

7© 2014 | 7
Broadridge Has Generated Top Quartile TSR of 13% Since Becoming Public
0
50
100
150
200
250
300
2007 2008 2009 2010 2011 2012 2013 2014
Broadridge share price performance vs. S&P 5001
Broadridge
S&P 500
TSR CAGR1
1. March 2007-June 2014 | Source: S&P Dow Jones Indices; S&P Capital IQ; BCG analysis
Penson termination/restructuringFinancial crisis
Decrease in event-driven revenues
Share price indexedto March 31, 2007
13%
7%

8© 2014 | 8
Broadridge Has Demonstrated Strong Capital Stewardship Since Becoming Public
Our powerful business model has allowed us to generatestrong and steady cash flow
Free cash flows
$2.2B
1. March 2007-June 2014 | Note: Share repurchases amount reflects share repurchases under our stock repurchase program
Key sources and uses of cash1

9© 2014 | 9
Broadridge Has Demonstrated Strong Capital Stewardship Since Becoming Public
Acquisitions
$0.6B
Cash returned to shareholders
$1.4B
Share repurchases
$0.9B
Dividends$0.5B
Free cash flows
$2.2B
Our powerful business model has allowed us to generatestrong and steady free cash flows
1. March 2007-June 2014 | Note: Share repurchases amount reflects share repurchases under our stock repurchase program
Key sources and uses of cash1

10© 2014 | 10
Pri
ori
ty
Our Capital Stewardship Priorities Over the Next 3 Years
Committed to a strong dividend
Targeting minimum 45% of net earnings
Continual tuck-in acquisitionsto drive growth
Selectively targeting about $400-600M
Share repurchases Increase targeted levels of share repurchases
Maintain investment grade credit rating
Using debt capacity for investments and capital return• Target 2:1 Adj. Debt/EBITDAR
Sustainable stockholder returns through responsible and balanced capital stewardship

11© 2014 | 11
Broadridge’s Business Has Three Key Features That Enable Greater Control of Destiny
98% client revenue retention rate
Consistently high
retention rate reflects
the strength of our
client relationships
Expanding portfolio of growth products
Growth products
contributed ~25% of
recurring fee revenue in
FY14 vs. ~10% in FY10
Note: All Broadridge results and statistics are for FY14 unless otherwise stated
Our business model is highly resilient with a balanced portfolio and reduced reliance on market factors
90% of total revenueis recurring
Diverse revenue
distribution
• Over 1,100 broker-dealers
• ~10,000 corporate issuers
• ~800 mutual fund families

12© 2014 | 12
Our Industry Is Undergoing Significant Evolution
We are uniquely positioned to take advantage of new opportunities created by secular trends
Regulatory environment driving mutualization of non-differentiating costs and capabilitiesMutualization
1
Digital technologies reducing print communications and creating new content channels
Digitization
2
Financial firms looking to drive growth and excellence through data and analytics
Data & Analytics
3
13© 2014 | 13
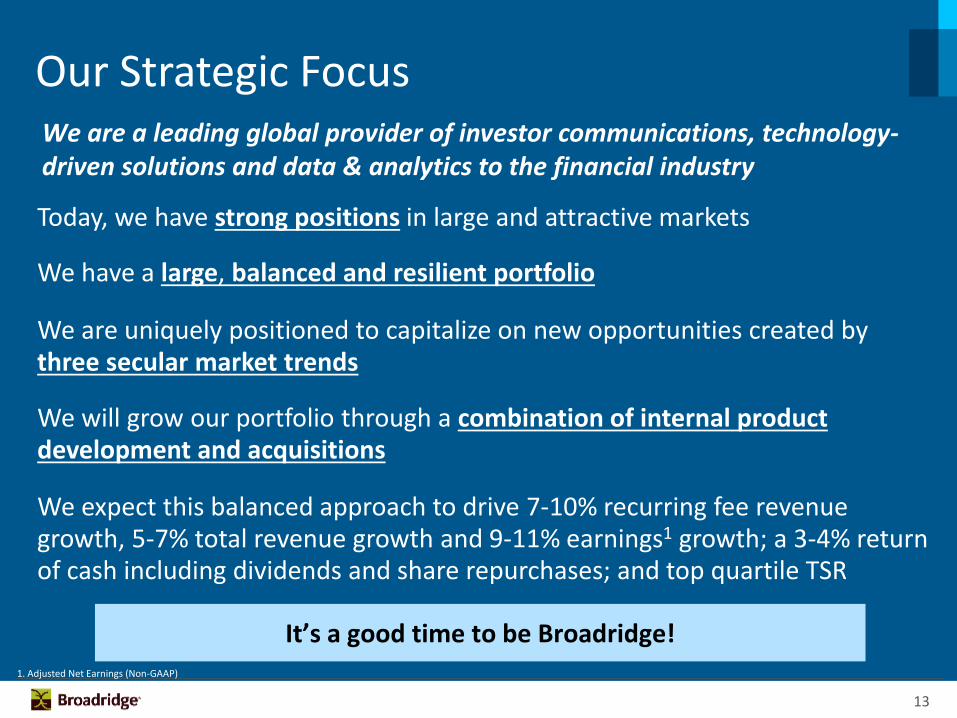
Today, we have strong positions in large and attractive markets
We will grow our portfolio through a combination of internal product development and acquisitions
We have a large, balanced and resilient portfolio
We are uniquely positioned to capitalize on new opportunities created by three secular market trends
We expect this balanced approach to drive 7-10% recurring fee revenue growth, 5-7% total revenue growth and 9-11% earnings1 growth; a 3-4% return of cash including dividends and share repurchases; and top quartile TSR
Our Strategic FocusWe are a leading global provider of investor communications, technology-driven solutions and data & analytics to the financial industry
It’s a good time to be Broadridge!1. Adjusted Net Earnings (Non-GAAP)

2014 Investor &Analyst Day
• Broadridge Financial Solutions, Inc.
Timothy C. GokeyChief Operating Officer
Executing on Growth -Strategy and Business Overview

15© 2014 |
Today’s Discussion
• The Market Opportunity for Broadridge
• Our Evolving Product Portfolio
• Executing on Growth
• Our Continued Track Record
15

16© 2014 |
Data & AnalyticsNetwork and data assets that enable clients to create unique value
MutualizationStrong drive to standardize duplicative, non-differentiating industry capabilities
DigitizationDigital technologies that enable lower cost, higher touch interactions
Key Market Trends
We Have a $24B Market Opportunity
100%=$24B
Addressable Market
Bank, Broker-Dealers and Issuers
Mutual Fund & Retirement Solutions
Global Technology & Operations
16

17© 2014 |
Regulatory Pressure is Driving Our Clients to Mutualize Capabilities
17

18© 2014 |
0
5
10
15
Effect of Recent and Future Regulation on Return on Equity (Pre-regulation to 2020)
Regulatory Pressure is Driving Our Clients to Mutualize Capabilities
Sources: BCG Global Risk report, Nov 2013; BCG Capital Markets report, Apr 2013 & May 2014; McKinsey Capital Markets report, Nov 2013
Total (average) Regulations Corrective Actions
ROE (%)
Corrective actions
Basel 2.5 & 3
Pre-regulationaverageRoE
2014average RoE
15
7
3
11
Today
18

19© 2014 |
0
5
10
15
Effect of Recent and Future Regulation on Return on Equity (Pre-regulation to 2020)
Regulatory Pressure is Driving Our Clients to Mutualize Capabilities
FutureRoE
Upcomingregulations
Sources: BCG Global Risk report, Nov 2013; BCG Capital Markets report, Apr 2013 & May 2014; McKinsey Capital Markets report, Nov 2013
Total (average) Regulations Corrective Actions
ROE (%)
Corrective actions
Basel 2.5 & 3
Pre-regulationaverageRoE
2014average RoE
15
7
3
11
3-7
4-8
Today 3-5 years
19

20© 2014 |
0
5
10
15
Effect of Recent and Future Regulation on Return on Equity (Pre-regulation to 2020)
Regulatory Pressure is Driving Our Clients to Mutualize Capabilities
Sources: BCG Global Risk report, Nov 2013; BCG Capital Markets report, Apr 2013 & May 2014; McKinsey Capital Markets report, Nov 2013
Total (average) Regulations Corrective Actions
ROE (%)
FutureRoE
Upcomingregulations
Corrective actions
Basel 2.5 & 3
Pre-regulationaverageRoE
2014average RoE
Cost, Risk optimization and revenue growth
FutureRoE after mitigation
15
7
3 11
3-7
4-8
6-8
10-15
3-5 yearsToday
Cost of Equity: Range 10–12%
20
21© 2014 |
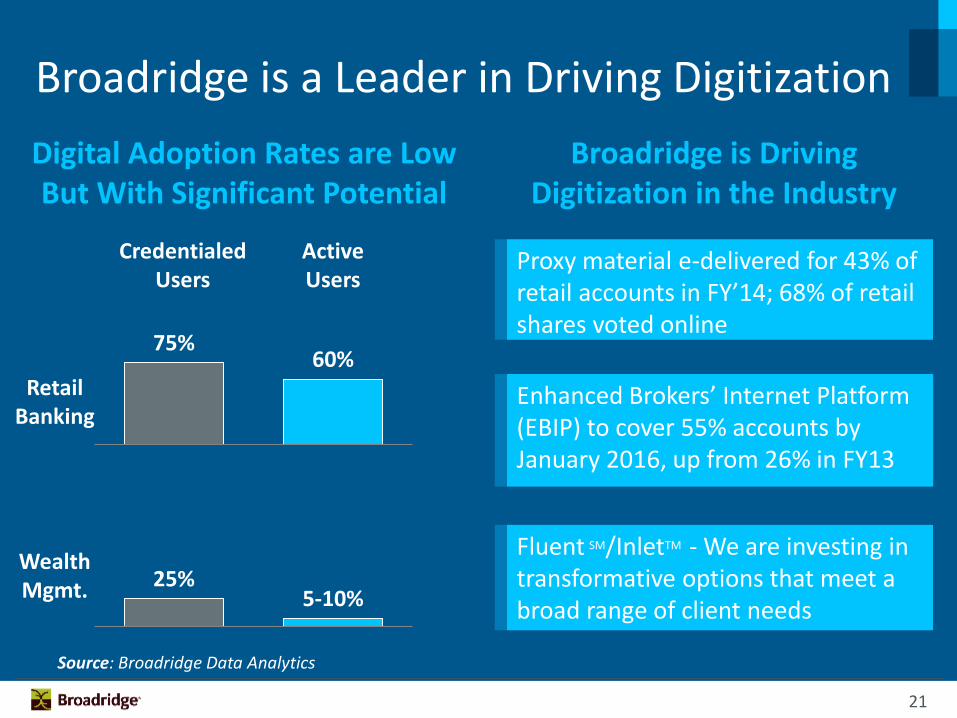
Broadridge is a Leader in Driving Digitization
Enhanced Brokers’ Internet Platform (EBIP) to cover 55% accounts by January 2016, up from 26% in FY13
Fluent SM/InletTM - We are investing in transformative options that meet a broad range of client needs
Proxy material e-delivered for 43% of retail accounts in FY’14; 68% of retail shares voted online
Digital Adoption Rates are Low But With Significant Potential
Broadridge is Driving Digitization in the Industry
75%60%
25%5-10%
CredentialedUsers
ActiveUsers
Source: Broadridge Data Analytics
Wealth Mgmt.
Retail Banking
21

22© 2014 |
• Financial Services spends ~$12B annually on Data & Analytics in the U.S.
• Broadridge has unique data assets to add value to clients, holding data on every beneficial equity position of every investor in the market
• FY14 $46M recurring fee revenue from existing Data & Analytics businesses, expected to double in 4 years, with addressable market opportunity of more than $1 billion
Source: Opera Solutions
We are working closely with our clients to help them use their data to serve their end-clients more effectively and efficiently
Significant Opportunity in Data & Analytics
22

23© 2014 |
Our Product Portfolio has Evolved to Target the Market Opportunity
23

24© 2014 |
FY14 Recurring Revenue Closed Sales
Our Product Portfolio has Evolved to Target the Market Opportunity
Heritage
Acquired
Launched afterAcquired
New Since2007
5%
56 22%
17%
100%=$127M
Mature
Growth
40% 60%
100%=$127M
60%40%
24

25© 2014 |
Percent of Recurring Fee Revenue
Investment in Growth Businesses is Shifting Revenue Mix
10%25%
35%
90%75%
65%
FY10 FY14 FY17F
Mature
Growth
FY10-17F CAGR
25%
3%
25

26© 2014 |
Illustrative Annual Change in EBIT Margin FY14-17F
Multiple Factors Driving Stronger Margins
Revenue Mix OperatingLeverage
Productivity Netof Investments
Total
10-20 bps
30-40 bps
5-15 bps 45-75 bps
FY11-14 Annual change 15 bps 35 bps 60 bps 110 bps
Note: EBIT Margin (Non-GAAP)
26

27© 2014 |
Most Balanced Business
Banks, Broker-Dealers and Issuers
• Manage regulatory issues on behalf of our clients • Enhance product differentiation • Win transition to digital
Support & Extend The Core
• Advisor Solutions• Tax Managed Services• Securities Class Actions
Drive Growth Business Portfolio
• Fluent / Inlet• Wealth Insight SolutionsSM
• Shareholder Data Services
Drive Transformative Options in Digital & Data
27

28© 2014 |
Strongest Growth Engine
Mutual Fund and Retirement Solutions
• Leverage mutual fund and ETF database • Expand data capabilities to penetrate mutual funds• Offer revenue and expense solutions to asset
management and capital markets firms
Grow Data & Analytics
• Grow trade processing sales• Attract AUA by serving Retirement Plan Advisors
Drive Mutual Fund Trade Processing
• Expand communications footprint • Expand plan sponsor product offering
Selectively Expand Communications
28

29© 2014 |
Turnaround Evolving into Growth
Global Technology and Operations
• Right-size key businesses• Align pricing and productivity• Improve technology
Drive Productivity & Investment
• Wealth Management• Capital Markets (e.g. Financing and Liquidity)• Global (e.g. Accenture Post-Trade Processing/Global
Settlements, Asia Pac)• Buy-side
Pursue Significant Growth Opportunities
• Invest in sales capabilities• Evolve to one market-facing segment• Add significant talent
Refine Organization to Support Growth
29

30© 2014 |
We are Investing in Four Key Differentiating Capabilities
• World-Class Technology organization
• We invest ~$400M+ annually
• Strong investments in new Products and Platforms, Resiliency, and Cybersecurity
Technology
30

31© 2014 |
We are Investing in Four Key Differentiating Capabilities
• World-Class Technology organization
• We invest ~$400M+ annually
• Strong investments in new Products and Platforms, Resiliency, and Cybersecurity
Technology Brand
• Increased Sales & Marketing investment 35% in last 2 years
• “One Broadridge” brand
• Growing thought leadership platform
31

32© 2014 |
We are Investing in Four Key Differentiating Capabilities
• Strong track record of success, with 20%+ portfolio IRR
• Expect to invest about $400-600M over the next 3 years
• Strong pipeline of acquisition targets
Acquisitions
• World-Class Technology organization
• We invest ~$400M+ annually
• Strong investments in new Products and Platforms, Resiliency, and Cybersecurity
Technology Brand
• Increased Sales & Marketing investment 35% in last 2 years
• “One Broadridge” brand
• Growing thought leadership platform
32

33© 2014 |
We are Investing in Four Key Differentiating Capabilities
• Strong track record of success, with 20%+ portfolio IRR
• Expect to invest about $400-600M over the next 3 years
• Strong pipeline of acquisition targets
AcquisitionsIndia
• 1,800+ Associates grown over 15 years
• Innovation hub
• Voted one of the best places to work in India
• World-Class Technology organization
• We invest ~$400M+ annually
• Strong investments in new Products and Platforms, Resiliency, and Cybersecurity
Technology Brand
• Increased Sales & Marketing investment 35% in last 2 years
• “One Broadridge” brand
• Growing thought leadership platform
33

34© 2014 |
FY11 FY14FY11-FY14
CAGR
Total Revenue $2.2B $2.6B 5.7%
Recurring Fee Revenue
$1.3B $1.6B 7.7%
EBIT $285M $420M 13.9%
EBIT Margin 13.1% 16.4% 110 bps p.a.
Recurring RevenueClosed Sales
$113M $127M 3.8%
Strong Performance Provides Platformfor Growth
Note: EBIT and EBIT Margin (Non-GAAP)
34
35© 2014 |
Executing on GrowthKey Takeaways
Large market opportunity aligned with powerful industry trends
Business Unit strategies closely align with industry trends
Proven results support continued growth
Product mix driving higher growth
Secular opportunity for stronger margins
35

2014 Investor &Analyst Day
• Broadridge Financial Solutions, Inc.
Robert SchifellitePresident, Investor Communication Solutions
Banks, Broker-Dealers and Issuers

37© 2014 | 37
We Connect Capital Markets Participants
140,000,000Individual Accounts (Globally)
240+Retirement Service
Providers
~800Mutual Fund
Families
~10,000Corporate Issuers USA & Canada
~36,000Global Corporate Issuers
1,100+Banks & Brokers
6,700+Institutional Investors
80,000+Financial Advisors
€£$
InvestorCommunication
SolutionsOver 2 Billion
Communications Each Year

38© 2014 | 38
A Great Business Model
Strong CoreBusiness
Portfolio of Growth
Businesses+
The core portfolio includes a diversified mix of proxy, post-sale,
customer & marketing communications businesses
Growth products represented ~30% of ICS recurring fee revenue in FY14
Acquisitions generated $156M of recurring fee
revenue in FY14
Consistent 99% client revenue retention rate
Addressable Market of $8 Billion

39© 2014 | 39
Banks, Broker-Dealers and Issuers (BBDI) success aligned with three key Broadridge themes
Strategic Focus
Leverage our central position in the market, the trust of regulators and our clients
Key Products:
• Proxy and Regulatory Communications
• Tax Managed Services
• Transfer Agency Services
• Securities Class Actions
• Customer Communications
Mutualization
Help our customers migrate to digital channels
Key Products:
• Proxy and Regulatory Communications
• Fluent℠
• Inlet™
• Advisor Solutions
• PostEdge eDelivery
Digitization
Unique data enables us to help our clients understand investors
Key Products:
• Proxy and Regulatory Communications
• Shareholder Data Services
• Wealth Insight SolutionsSM
Data & Analytics

40© 2014 | 40
$0
$1
$2
$3
$4
$5
Total Mutualization Digitization Data & Analytics
Advisor
Institutional
Issuer
Broker
Billions
With solutions that meet critical industry needs
BBDI: Targeting a $5B Addressable Market
$5B
Cybersecurity
Increased CorporateGovernance Scrutiny
Broker Cost Pressures
Demographic Shifts
Increased Regulation
Growth of WealthManagement Services

41© 2014 | 41
And extending into new products and services
Supporting the Core Business
Driving Transformation to Digital and Data
• Fluent℠ & Inlet™• Investor Mailbox• Shareholder Data Services • Wealth Insight Solutions
• Tax Managed Services• Advisor Solutions
Extending to Build New Businesses
• Regulatory Leadership• Diverse Voting
Platforms • State-of-the-Art
Processing• Compliance and Data
Security
Supporting Our Core Capabilities
CoreRegulatory Proxy,
Post-Sale & CustomerCommunications

42© 2014 | 42
Key Products and Services Driving Growth
FY11 Recurring Sales~30% From Growth Products
FY14 Recurring Sales~40% From Growth Products
A significant portion of our market runway is coming from growth product portfolio
Securities Class Actions
Fluent/Inlet
Canada Smart
Data
Tax
Advisor
Transfer Agency
Annual Meeting Services
~30% ~40%

43© 2014 | 43
Overview • Technology and tools for financial advisors
Build customized websites
Expand their reach and enhance the customer experience
Acquire assets across multiple generations of investors as a result
of the $30 Trillion wealth shift from baby boomers to their heirs
• Rapid Growth
~4,000 advisors served in 2008
80,000+ in 2014
Accelerating Financial Advisor Success
Client Use CaseGoal: Field compliant, scalable and customizable website solutions
for advisors
Actions: Create custom campaigns; Enable ROI analytics
Results: Streamlined compliance operations; Increase acquired assets
Stage:Growth
Buy/Build:Acquisition
Strategy: Digital/Data
Industry Need:• Growth of
Wealth Mgmt. Services
• Demographic Shifts

44© 2014 | 44
Tax Center of ExcellenceOverview • Building a Tax Managed Service (TMS) business through
sophisticated tools and data • One of only two industry providers and the only proven BPO
provider in the brokerage tax space• Rapid client growth: Expand their reach and enhance the
customer experience ~50 new clients since 2007 launch Over 500 users on the platform
Client Use Case
Goal: Comply with 2014 Original Issue Discount (OID) cost basis requirements
Actions: Sought out comprehensive OID database that would cover all OID securities in client portfolios
Results: Client is now in IRS Regulatory compliance for Tax Year 2014 and beyond
Industry Need:• Broker Cost
Pressure• Regulatory • Risk
Strategy: Mutual/Data
Buy/Build:Organic
Stage:Growth

45© 2014 | 45
Driving Transformation in DigitalOverview
• Inlet, our partnership with Pitney Bowes:
Is built on the Fluent technology platform
Captures consumer preferences and consents
Provides more interactive, user-friendly content
Lets consumers access that content through the online channels they already use
Significance of Digital Transformation
Broadridge processes over 2 billion investor communications per year
The financial industry spends $20B per year on print and mail
Digital distribution means a cost reduction of 65-80% and a better customer experience
Note: $20B is a Broadridge estimate based on research by BCG and Pitney Bowes
Stage:Growth
Strategy: Digital
Industry Need:• Broker Cost
Pressure• Cybersecurity• Demographic
Shifts
Stage:Growth
Buy/Build:Build/JV

46© 2014 | 46
Proprietary Data Provides Unique Insights
Stage:Introduction
Buy/Build:Organic
Strategy: Data
Industry Need:• Corporate
Governance Scrutiny
• Growth of Wealth Mgmt.
Shareholder Data Services (SDS)
• Launched Shareholder Data Services in March 2014
• SDS provides new capabilities for corporate issuers to analyze the behavior of retail shareholders, and determine who, when and how to most effectively engage
• More than 20 SDS clients since launch
Wealth Insight Solutions (WINS)
• WINS, launched in November, observes and models more than $10 trillion in retail-held assets
• WINS helps Banks and Broker-Dealers by providing enhanced wealth data to drive revenue
• Gives insights to identify new market opportunities and target consumers based on their total financial capacity and behaviors

47© 2014 | 47
99% Client
RevenueRetention Rate
ICS Strong Financial Performance FY11 FY14 CAGR
Recurring Fee $ 725 $ 961 10%
Event-Driven $ 135 $ 156 5%
Total Fee $ 860 $ 1,117 9%
Distribution Revenue $ 704 $ 764 3%
Total Revenue $ 1,564 $ 1,881 6%
EBIT $ 209 $ 336 17%
Contributed ~50% of ICS recurring fee growth from FY11-FY14
Growth Products
65% of recurring revenue closed sales in FY14 from growth products
Sales
Generated $156M or 16% of ICS recurring fee revenue in FY14
Acquisitions
Combined equity and mutual fund position growth has always been positive
Position Growth
Driven by top line growth and cost efficiencies
Margin Expansion
Note: Certain discrete services previously reported in our Global Technology and Operations segment are now reported within the Investor Communication Solutions segment. As a result, our segment results have been revised to reflect this change in reporting segments

48© 2014 | 48
Transformation to Digital and Data
Extending to Build New BusinessesSupport
& Extend the
Core
Focus Over the Next 3 Years
Core

2014 Investor &Analyst Day
• Broadridge Financial Solutions, Inc.
Gerard F. ScavelliPresident, Mutual Fund and Retirement Solutions
Mutual Fund and Retirement Solutions (ICS)
50© 2014 | 50
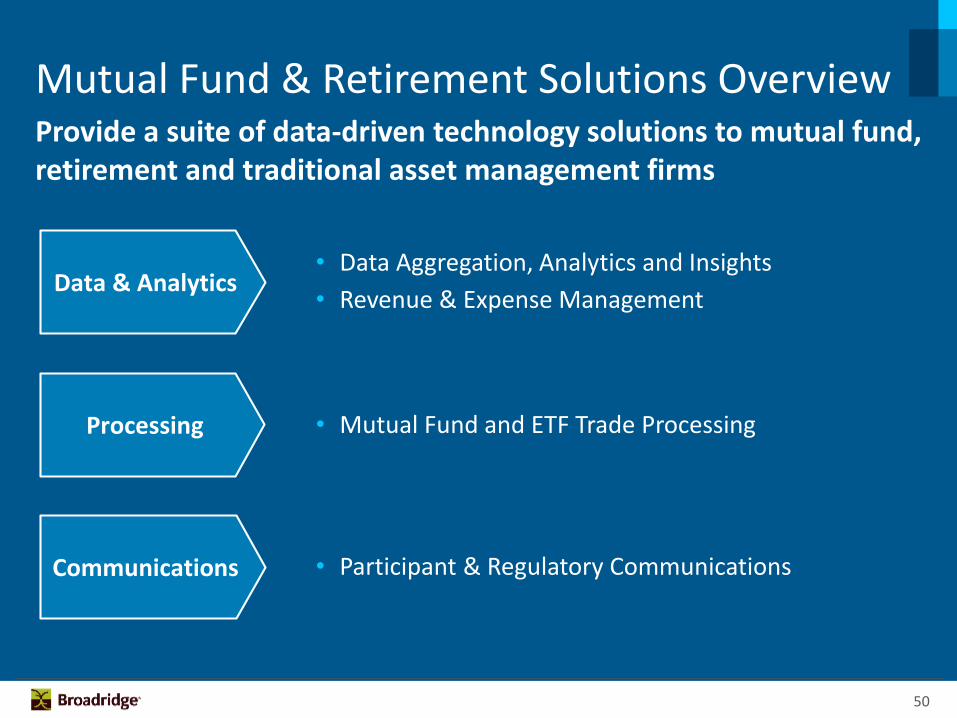
Mutual Fund & Retirement Solutions Overview
Data & Analytics
Processing
Communications
• Data Aggregation, Analytics and Insights
• Revenue & Expense Management
• Mutual Fund and ETF Trade Processing
• Participant & Regulatory Communications
Provide a suite of data-driven technology solutions to mutual fund, retirement and traditional asset management firms

51© 2014 | 51
Mutual Fund & Retirement Solutions OverviewIllustrative Mutual Fund Client: Global Asset Penetration
Illustrative Mutual Fund Client: Asset Distribution by Broker

52© 2014 | 52
Mutual Fund & Retirement Solutions Overview
Plan 1
Trade ProcessingEngine
Plan 2
Plan 3
Plan 4
Plan 50,000
Fund 1
Fund 2
Fund 3
Fund 4
Fund 550

53© 2014 | 53
401(k) PlanMarketing Campaign
Enrollment Conversion Disclosures Rollover
Retirement Plan Participant Communications Lifecycle
Mutual Fund & Retirement Solutions Overview

54© 2014 | 54
~$3B total addressable market across our three major offerings supported by several key trends
Data & Analytics• Demand for data and analytics to drive sales,
meet regulations, manage expense
• Adoption of automated revenue and expense management tools by asset managers and brokers
Processing• Shift in retirement savings toward DC
• Filling the US retirement gap
Communications• Increase in regulatory disclosures for DC
retirement plans
Market Opportunity
$2.0B
$0.5B
$0.5B
Processing
Data & Analytics
Communications
55© 2014 | 55
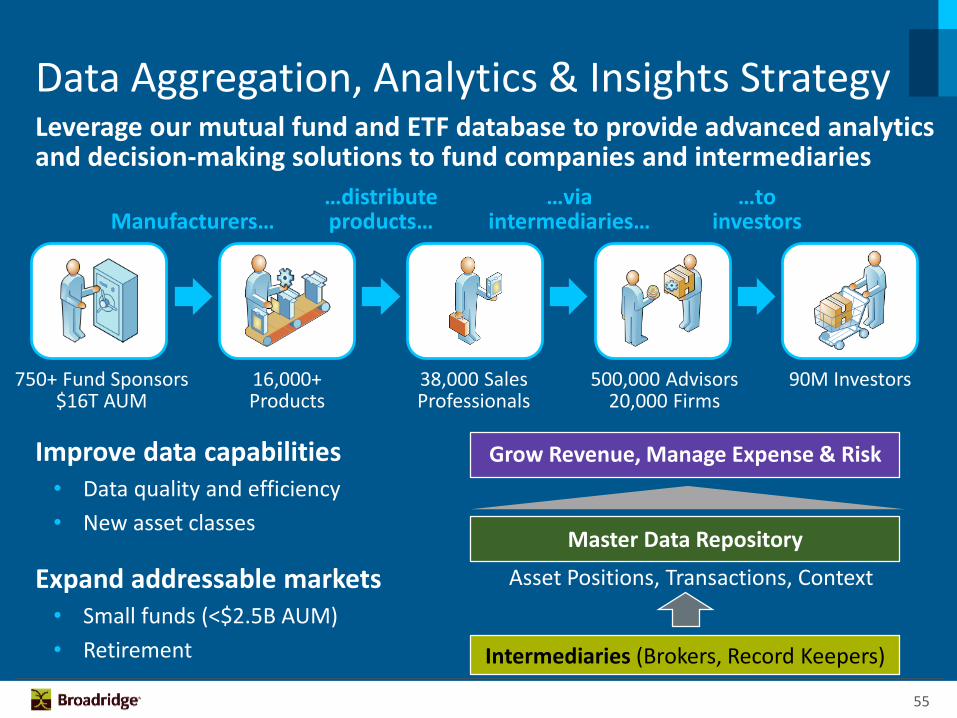
Leverage our mutual fund and ETF database to provide advanced analytics and decision-making solutions to fund companies and intermediaries
Improve data capabilities• Data quality and efficiency
• New asset classes
Expand addressable markets• Small funds (<$2.5B AUM)
• Retirement
Data Aggregation, Analytics & Insights Strategy
Asset Positions, Transactions, Context
Grow Revenue, Manage Expense & Risk
Intermediaries (Brokers, Record Keepers)
Master Data Repository
Manufacturers……distribute products…
…via intermediaries…
…to investors
750+ Fund Sponsors$16T AUM
16,000+Products
38,000 SalesProfessionals
500,000 Advisors20,000 Firms
90M Investors

56© 2014 | 56
Further penetrate the Asset Management market and leverage our core offering with global investment banks and brokers (i.e., Capital Markets)
• Asset Management
– Continue penetrating core market
– Expand into smaller (< $10B AUM) firms with SaaS offering
– Expand globally
Revenue & Expense Management Strategy
TransactionData
InputsRevenue &
Expense Calculations
Fee BillingDistribution Fees
ExpensesOutputs
• Capital Markets
– Drive sales of post-trade expense management to sell-side
– Develop managed service offering

57© 2014 | 57
Increase Assets Under Administration (AUA) processed for third party retirement plan administrators (TPAs), banks and trust companies
• Grow trade processing sales
– Enhance trading platform
– Broaden TPA client relationships to attract additional plan assets
• Attract AUA by serving Retirement Plan Advisors
– Sales Enablement & Marketing
– Home office and compliance oversight
Processing Growth Strategy
MutualFunds Trade Processing
Engine
BanksTrustsTPAs
Trust AccountsDC Plans
401(k), 403(b)
Distribution Agreements
Fund & ETFDistribution

58© 2014 | 58
Enable Defined Contribution retirement plan providers to effectively communicate with plan sponsors and participants
• Expand Communications Footprint
– Lifecycle solutions for bundled providers
– Turnkey products/strategic alliances for small- and mid-sized providers
Communications Growth Strategy
401(k) PlanMarketing Campaign
Enrollment Conversion Disclosures Rollover
Retirement Plan Participant Communications Lifecycle
• Expand Plan Sponsor Product Offering
– Plan health scorecard
– Performance reports
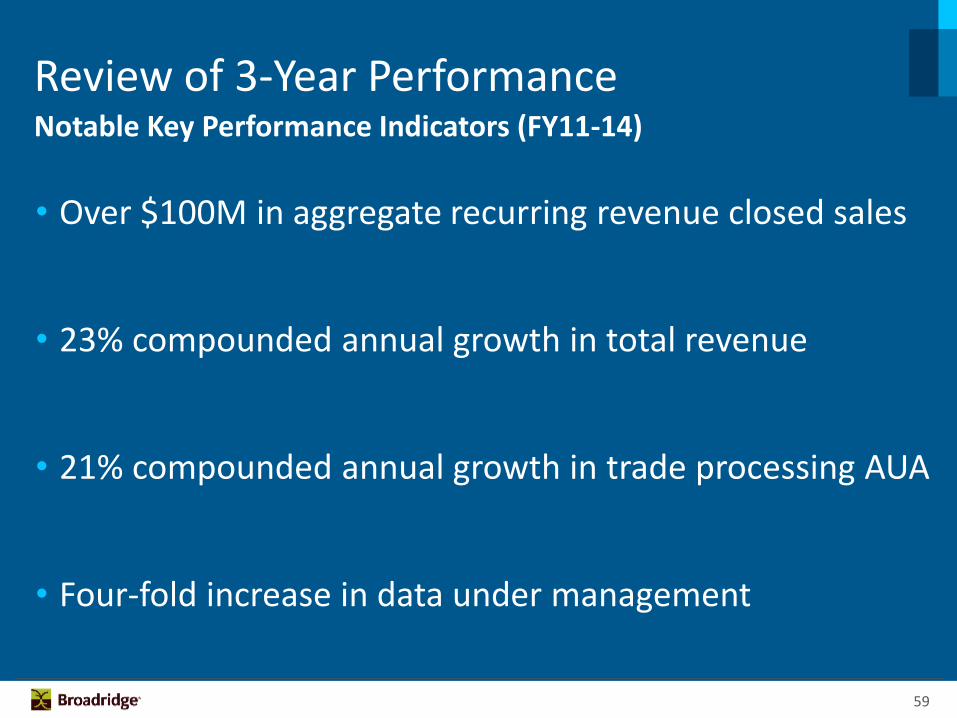
59© 2014 | 59
Notable Key Performance Indicators (FY11-14)
• Over $100M in aggregate recurring revenue closed sales
• 23% compounded annual growth in total revenue
• 21% compounded annual growth in trade processing AUA
• Four-fold increase in data under management
Review of 3-Year Performance

60© 2014 | 60
• Capitalize on complexity of the manufacturer–distributor–investor ecosystem with our big data capabilities
• Expand our trading and communications capabilities to more broadly serve the DC retirement market
• Increase penetration of existing clients and win new accounts with greater focus on client engagement
Focus Areas for Next Three Years

2014 Investor &Analyst Day
• Broadridge Financial Solutions, Inc.
Break

2014 Investor &Analyst Day
• Broadridge Financial Solutions, Inc.
Charles J. MarchesaniPresident, Global Technology and Operations
Global Technology and Operations (GTO)

63© 2014 | 63
Global leader in technology and business process solutions that enable efficient operation of global Investment Banks, Broker-dealers, Wealth Managers and Investment Managers
Business Overview
Sources: Internal Analysis Nov 2014. Top 10 global banks based on total revenues in equity, FICC and IBD per Coalition Research, 1Q’14. Canada Banks 2013 A New Normal PwC. Federal Reserve Bank of NY Primary Dealer List Dec 2014. Note: Certain discrete services previously reported in our Global Technology and Operations segment are now reported within the Investor Communication Solutions segment. As a result, our segment results have been revised to reflect this change in reporting segments.
FY14 Revenue and Earnings
$681M FY14 Revenue
$119M FY14 EBIT
FY14 Revenue Distribution
~85% North America
~15% Rest of World
Global Scale
Clearing and settling in 70+ countries
$5+ Trillion in daily settlements
Servicing 49 million accounts
Leading Market Positions
6 of the top 10 global banks
4 of the top 6 Canadian banks
Support 16 of the 22 Primary Dealers
98% Client Revenue Retention

64© 2014 | 64
Our solutions enable smooth and seamless functioning of core capital market activities
Integral Part of Financial Markets Ecosystem
Sell-Side Buy-Side
Back Office Middle Office Front Office
Financing & LiquidityClearance/SettlementPortfolio
ManagementInvestor Portal
Reference DataAsset ServicingPerformance
ReportingReference Data
Reconciliations Risk Management Risk ManagementBroker Desktop

65© 2014 | 65
Significant Progress Positioning for GrowthTo meet market trends while leveraging our existing leadership positions, we have executed a significant business transformation in the past 18 months
One Client Facing
Approach
Operating Optimization
Product Strategy
Talent Investment
• Right-sized key businesses
• Centers of Excellence
• Multi-asset product roadmap
• Global product portfolio
• Senior leadership team expansion
• Compensation/rewards alignment
• Go-to-Market as a Global segment
• Consultative/ Solutions selling • $16B market
• Multiple growth strategies
• Executable initiatives
• Strong YoY growth
– 6% Revenue
– 41% EBIT

66© 2014 | 66
Aligned Against $16B Addressable Market
MARKET TREND CLIENT STRATEGIES
• Regulation impacting RoE
• Market Structure Changes
• Globalization
• Disruptive business models
• Fee pressure
• Capability Mutualization
• Vendor optimization
• Global multi-asset solutions
• Liquidity Management
• Fee-based Solutions
Man
age
d s
erv
ice
s
Embedded market leadership and differentiated assetscreate addressability
Capital Markets
$9B
Retail/ Wealth
$2.5B
Buy-Side
$4.5B
Sources: Strategy& "2013 Capital Markets Industry Perspective". 2014 BoA/ML. Morningstar and S&P Analyst reports. Celent "Future of the Post-Trade Industry" 2013

67© 2014 | 67
Leveraging Our Leadership Position inNorth America
• Embedded market leadership with leading financial institutions
• Competition, regulatory changes impacting clients’ RoE
• Focus on cost efficiencies, regulatory investments, differentiation
Overview
• Create significant cost savings via mutualization
• Differentiate offerings through Managed Services
• Extend based on our leading market position
Retail/Wealth expansion in the US and Canada
Expand Fixed Income globally and extend into financing and liquidity
Strategy
Sources: Strategy& "2013 Capital Markets Industry Perspective". 2014 BoA/ML. Morningstar and S&P Analyst reports. Celent "Future of the Post-Trade Industry" 2013
68© 2014 | 68
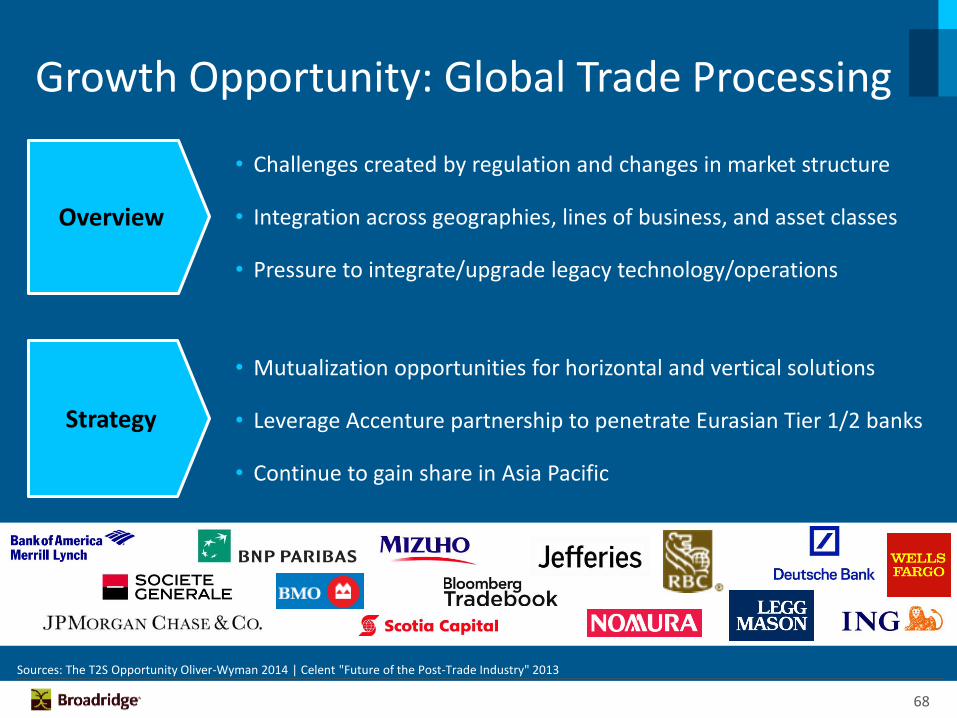
Growth Opportunity: Global Trade Processing
• Mutualization opportunities for horizontal and vertical solutions
• Leverage Accenture partnership to penetrate Eurasian Tier 1/2 banks
• Continue to gain share in Asia Pacific
Strategy
• Challenges created by regulation and changes in market structure
• Integration across geographies, lines of business, and asset classes
• Pressure to integrate/upgrade legacy technology/operations
Overview
Sources: The T2S Opportunity Oliver-Wyman 2014 | Celent "Future of the Post-Trade Industry" 2013

69© 2014 | 69
Growth Opportunity: Buy-Side
• Deliver multi-asset capabilities while mutualizing costs
• Expand Buy-Side integration with other Broadridge solutions
Reconciliations, Fee Management, Managed Services
• Leverage Reference Data capabilities to serve Sell-Side
Strategy
• Repositioned Paladyne as Broadridge Investment Management Solutions
• Comprehensive solutions for Hedge Funds, Prime Brokers and HFA’s
Order/Portfolio management
Risk and Reference Data management
• Fee pressure, regulatory compliance, and multi-asset trading strategies
Overview

70© 2014 | 70
98% Client
Revenue Retention Rate
FY14 CAGR and Key Performance Indicators
Margin Expansion
~200 bps from operating leverage from FY11-FY14
Contributed ~55% of recurring revenue growth from FY11-FY14
Growth Products
Sales
~45% of recurring revenue closed sales in FY14 from growth products
Revenues and EBIT have grown despite industry consolidation, challenging regulatory environment and post credit crisis financial recovery
FY11 FY14 CAGR
Total Revenue $ 589M $ 681M 5%
EBIT $ 92M $ 119M 9%
Acquisitions
~$65M of recurring fee revenue in FY14; ~10% of total revenue
Note: Certain discrete services previously reported in our Global Technology and Operations segment are now reported within the Investor Communication Solutions segment. As a result, our segment results have been revised to reflect this change in reporting segments

71© 2014 | 71
Growth Strategy balanced across:
Market Trends Give Confidence to Three-Year Growth Strategy
• Support and Extend by continuing to drive operating efficiencies while investing in platform differentiation
• Expand and Penetrate into high growth product and market adjacencies
• Innovate and Disrupt through scalable technology and operations solutions and unique client delivery models
Mutualization trend driven by:
Regulations…
are creating new requirements, additional expense and ongoing investments
Globalization…
is increasing interconnection between asset and geographic markets
Competition…
and low interest rates are intensifying margin pressures

2014 Investor &Analyst Day
• Broadridge Financial Solutions, Inc.
Christopher J. PerryPresident, Global Sales, Marketing and Client Solutions
Global Sales and Marketing

73© 2014 | 73
It Is an Exciting Time to Be at Broadridge
• Unparalleled position in financial services
• Enables financial services firms to stay competitive
• Expertise our clients rely on
• Clear and executable strategy to drive growth

74© 2014 | 74
Broadridge Has a Well Defined Sales Strategy
1
2
3
4
Increase sales penetration at largest clients
Enhance innovative and acquired product sales
Investments in sales organization and infrastructure
Accelerate and leverage marketing drivers

75© 2014 | 75
Now is Our Time!
• Dynamic industry landscape
• Clients in transformation and need right partner
• We have proven solutions with solid track record
• Unified and energized go to market organization
2014 Investor &Analyst Day
• Broadridge Financial Solutions, Inc.
Vijay MayadasSVP, Strategy, Mergers & Acquisitions
Acquisitions Overview

77© 2014 | 77
Overview
Broadridge’s acquisition track record
Acquisitions as a driver of growth and innovation
Acquisition criteria

78© 2014 | 78
Broadridge’s Track Record Is Strong
Note: Investment amounts reflect cash paid for acquisitions (net of cash acquired)
Our acquisitions portfolio is creating significant value for shareholders
• Portfolio IRR tracking to 20%+
• Contributed ~$220M recurring fee revenue and ~$75M EBITDA in FY14
Broadridge has invested $565M in 10 key acquisitions since becoming a public company
• FY07 – FY09: Investigo, Access Data
• FY10 – FY13: City Networks, StockTrans, NewRiver, Matrix, Forefield, Paladyne
• FY14: Bonaire, Emerald Connect

79© 2014 | 79
25% of Our Acquisition Portfolio Revenue Is Now Organic
25%
Note: Shows acquisitions since becoming a public company; 1) defined as incremental revenue over revenue during first year of acquisition
FY14 Total Portfolio Recurring
Fee Revenue
FY14 Recurring Fee Revenue Generated Since Acquisition1
~$55M
Annualized Recurring Fee Revenue at Acquisition Year
~$220M
~$165M

80© 2014 | 80
Acquisitions Enhance Our Growth and Innovation Capabilities
Mutualization
Paladyne FY12 10%
NewRiver FY11 13%
Matrix FY11 15%
StockTrans FY10 59%
City Networks FY10 10%
Transaction Processing/License
Broadridge’s Acquisition Portfolio Since Becoming a Public Company (Acquisition Year, Total Revenue CAGR to FY14)
Digitization
Emerald FY14 n/a
Forefield FY11 12%
SaaS
Data & Analytics
Bonaire FY14 n/a
Access Data FY09 17%
Investigo FY09 15%
SaaS/License

81© 2014 | 81
Bonaire Acquisition Demonstrates Broadridge’sTuck-in Strategy
First SaaS Contract Signed
March 2014
Trained Sales Team
Fall 2013
Pipeline >$40M
June 2014
AcquisitionClosed
July 2013
FY 14
Surpassed FY14 Financial Plan
Sales: +50% vs. Plan
Pipeline <$15M
Jan 2014
Signed 6th
SaaS ClientJune 2014
SaaS Enhancement Announcement
March 2014
Entered Capital Markets and developed bundled offering with Access Data

82© 2014 | 82
0
2
4
6
8
2005 2010 2015 2020
$B
Activity in Fintech Is Driving a Robust PipelineGlobal fintech investment expected to more than double by 2018
Disruptive industry environment driving innovation in Fintech
Over past 4 years VC investment in Fintech has grown 4x faster than VC investing overall
Increased competition from Private Equity
$6–8B
Source: Accenture, Partnership Fund analysis of CB Insights data

83© 2014 | 83
We Have Clear Criteria For Acquisitions
Tightly linked to Broadridge’s strategic priorities
Accretive to growth, margins and earnings
>20% IRR in conservative business case
Primary focus on "tuck-in" sized businesses
High confidence in our ability to execute

84© 2014 | 84
Strong pipeline of opportunities driven by disruptive trends in Fintech
Aspiration to invest about $400–600M over next 3 years
Investing in additional capabilities to ensure we continue to maintain our disciplined criteria as we explore more opportunities
Moving Forward, We Will Maintain Our Disciplined Approach

85© 2014 | 85
1) Our acquisition track record is strong
2) There is significant opportunity to drive growth and innovation through acquisitions
3) We will continue to maintain our disciplined approach
In Conclusion

2014 Investor &Analyst Day
• Broadridge Financial Solutions, Inc.
James M. YoungChief Financial Officer
Financial Overview

87© 2014 | 87
Targeting Top Quartile Total Shareholder Return (TSR)
• Drive organic growth in current markets
• Exploit adjacencies
7–10% Recurring Fee3-Year CAGR(FY14–FY17F)
Sustainable Growth
• Realize efficiencies
• Increase operational leverage
Margin Expansionfrom 16% to ~18%
(ending FY17F)
Operational Excellence
• Consistent, strong FCF
• Balance investing and returning cash to shareholders
Target ~45% payout ratio1
and share repurchasecontributing 3–4% to TSR
Capital Strategy
Top Quartile Total Shareholder Return
• Strong and resilient franchise• Ubiquitous presence in financial services
• Deep industry expertise• Powerful service profit chain
1. Dividend subject to Board approval

88© 2014 | 88
Components of TSR Performance3Total Shareholder Return (FY11–FY14)1,2
16.6%
22.6% 23.4%
S&P 500Mean
S&P 500Top
Quartile
Broadridge
FY11–FY14
Revenue Growth 6%
Margin Growth 8%
Net Earnings Growth 14%
Dividends andShare Repurchases 5%
Multiple Change 4%
Total TSR 23%
Broadridge Has Delivered Top Quartile TSR
7/1/11–6/30/14 2. Equilar 3. 3-yr Compounded Annual Growth Rates (CAGRs)Note: Adjusted Net Earnings (Non-GAAP)
89© 2014 | 89
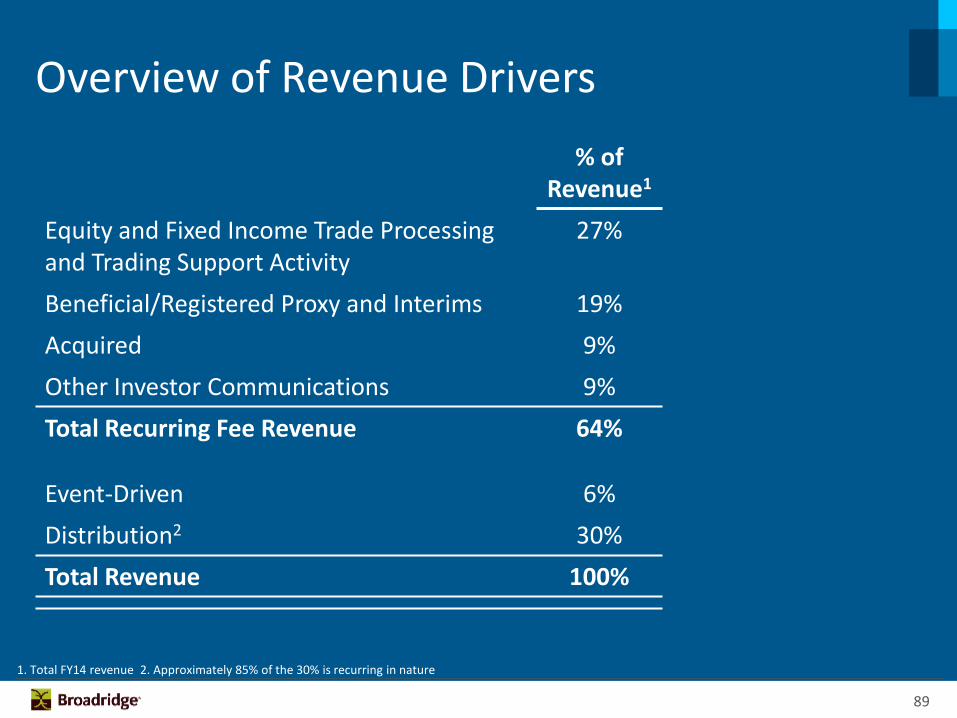
Overview of Revenue Drivers
% of Revenue1
Equity and Fixed Income Trade Processingand Trading Support Activity
27%
Beneficial/Registered Proxy and Interims 19%
Acquired 9%
Other Investor Communications 9%
Total Recurring Fee Revenue 64%
Event-Driven 6%
Distribution2 30%
Total Revenue 100%
1. Total FY14 revenue 2. Approximately 85% of the 30% is recurring in nature

90© 2014 | 90
% of Revenue1
Equity and Fixed Income Trade Processingand Trading Support Activity
27%
Beneficial/Registered Proxy and Interims 19%
Acquired 9%
Other Investor Communications 9%
Total Recurring Fee Revenue 64%
Event-Driven 6%
Distribution2 30%
Total Revenue 100%
Drivers• Net New Business• Internal Growth –
trade volumes, fulfillment activity
Attributes• Good position with
runway in the US• Meaningful
opportunity internationally (e.g., Accenture Post-Trade Processing)
• Processing typically has longer sales and implementation cycles
Overview of Revenue Drivers
1. Total FY14 revenue 2. Approximately 85% of the 30% is recurring in nature

91© 2014 | 91
Overview of Revenue Drivers
Drivers
• Internal Growth –stock record and interim positions
• Client Retention
Attributes
• More predictable growth
• Scalable
• International potential
% of Revenue1
Equity and Fixed Income Trade Processingand Trading Support Activity
27%
Beneficial/Registered Proxy and Interims 19%
Acquired 9%
Other Investor Communications 9%
Total Recurring Fee Revenue 64%
Event-Driven 6%
Distribution2 30%
Total Revenue 100%
1. Total FY14 revenue 2. Approximately 85% of the 30% is recurring in nature
92© 2014 | 92
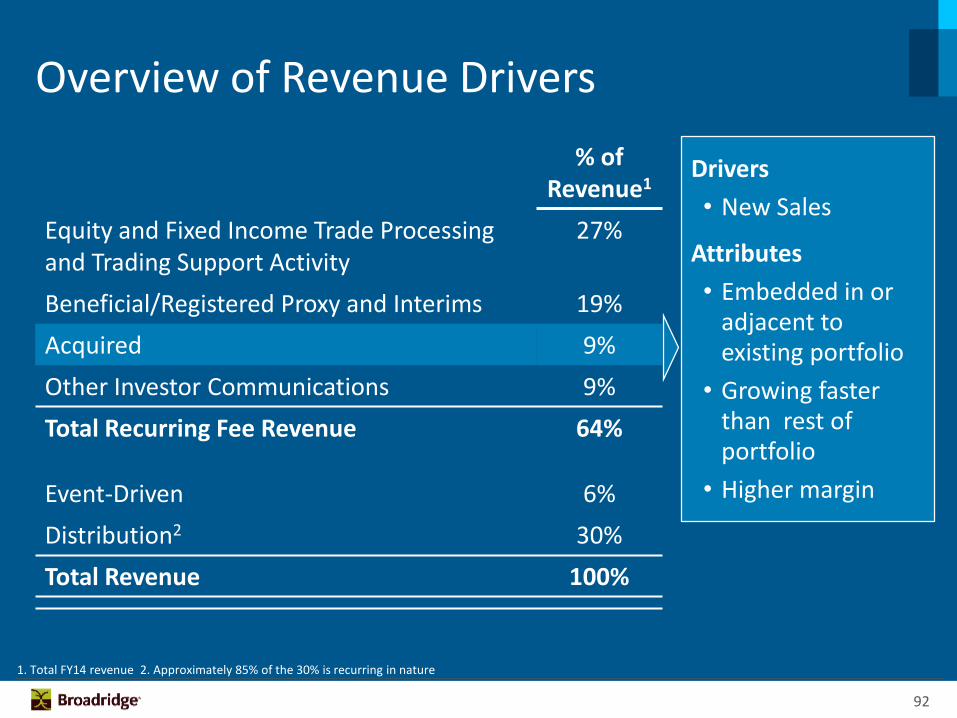
Overview of Revenue Drivers
Drivers
• New Sales
Attributes
• Embedded in or adjacent to existing portfolio
• Growing faster than rest of portfolio
• Higher margin
% of Revenue1
Equity and Fixed Income Trade Processingand Trading Support Activity
27%
Beneficial/Registered Proxy and Interims 19%
Acquired 9%
Other Investor Communications 9%
Total Recurring Fee Revenue 64%
Event-Driven 6%
Distribution2 30%
Total Revenue 100%
1. Total FY14 revenue 2. Approximately 85% of the 30% is recurring in nature

93© 2014 | 93
Overview of Revenue Drivers
Drivers
• Net New Business
Attributes
• Core to digital strategy
• Lower margin opportunity set fornon-digital
% of Revenue1
Equity and Fixed Income Trade Processingand Trading Support Activity
27%
Beneficial/Registered Proxy and Interims 19%
Acquired 9%
Other Investor Communications 9%
Total Recurring Fee Revenue 64%
Event-Driven 6%
Distribution2 30%
Total Revenue 100%
1. Total FY14 revenue 2. Approximately 85% of the 30% is recurring in nature

94© 2014 | 94
Overview of Revenue Drivers
Drivers
• Mutual Fund Proxy and Supplements, Equity Specials and Contests
Attributes
• Recent history is flat growth, MF Proxy has fluctuated
% of Revenue1
Equity and Fixed Income Trade Processingand Trading Support Activity
27%
Beneficial/Registered Proxy and Interims 19%
Acquired 9%
Other Investor Communications 9%
Total Recurring Fee Revenue 64%
Event-Driven 6%
Distribution2 30%
Total Revenue 100%
1. Total FY14 revenue 2. Approximately 85% of the 30% is recurring in nature

95© 2014 | 95
Overview of Revenue Drivers
Drivers
• Volume of mailed pieces
Attributes
• Lower margin
• Mainly recurring in nature
% of Revenue1
Equity and Fixed Income Trade Processingand Trading Support Activity
27%
Beneficial/Registered Proxy and Interims 19%
Acquired 9%
Other Investor Communications 9%
Total Recurring Fee Revenue 64%
Event-Driven 6%
Distribution2 30%
Total Revenue 100%
1. Total FY14 revenue 2. Approximately 85% of the 30% is recurring in nature

96© 2014 | 96
FY11–FY14
Recurring Fee Revenue
Net New Business 5%
Internal Growth 1%
Acquisitions 2%
8%
Total Revenue
Recurring Fee 5%
Event-Driven 0%
Distribution/Other 1%
6%
FY14–FY17F
Recurring Fee Revenue
Net New Business 5%–7%
Internal Growth 0%–1%
Acquisitions ~2%
7%–10%
Total Revenue
Recurring Fee 4%–6%
Event-Driven ~0%
Distribution/Other ~1%
5%–7%
Revenue Growth History And Objectives3-Year compounded annual growth rates (CAGRs)

97© 2014 | 97
13.1%16.4%
FY11 FY14 FY17F
~18%
EBIT Margin Expansion to Continue
Note: EBIT Margin (Non-GAAP)

98© 2014 | 98
FY17F
$188M
$279M
FY11 FY14
Improved Scale and Continued Growth Lead to Consistent Double Digit Earnings Growth
Note: Adjusted Net Earnings (Non-GAAP)

99© 2014 | 99
Capital Stewardship Priorities
2. Adjusted Debt/EBITDAR ratio calculated as (Debt + 8x Rent Expense)/(EBITDA + Rent Expense)
Maintain minimum 45% dividend payout ratio1
Fund tuck-in acquisitions aspiration of about $400M–600M through FY17
In order to support priorities, anticipate using debt capacity while maintaining long term investment grade credit rating with Adjusted Debt/EBITDAR target ratio2 of 2:1
Increase targeted levels of share repurchase
1. Subject to Board approval

100
© 2014 | 100
$0.60 $0.64 $0.72 $0.84
$1.08
FY11 FY12 FY13 FY14 FY15F
Dividends Per Share
Strong Free Cash Flows Enabled Us to Increase the Dividend to a 45% Payout Ratio in FY15F
$143
$244 $220
$334
FY11 FY12 FY13 FY14
Free Cash Flows
(in millions except for dividends per share)
101
© 2014 | 101
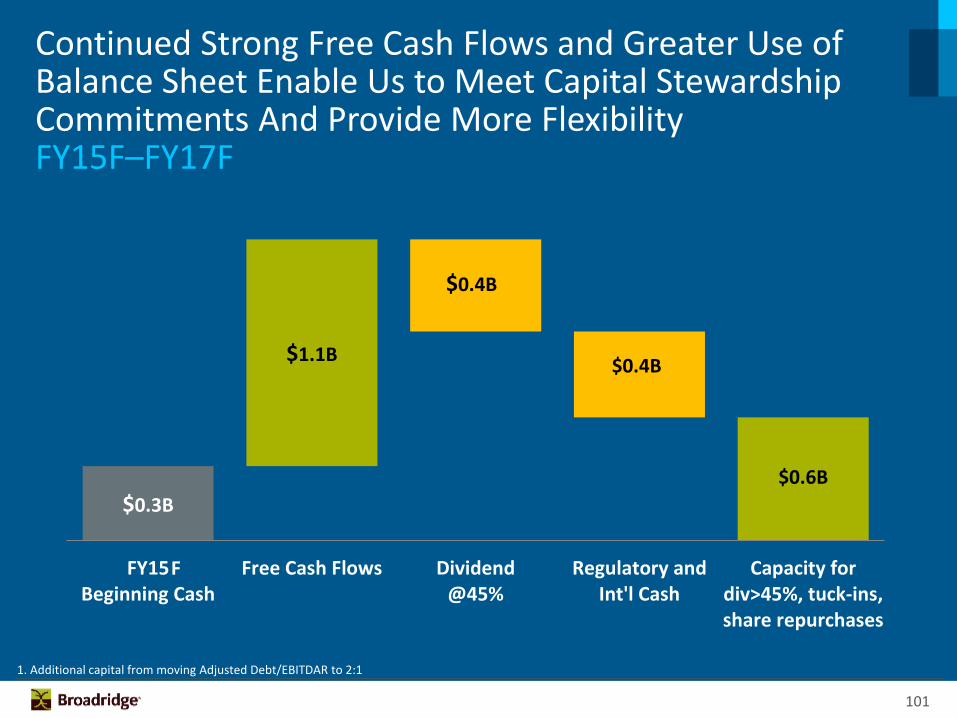
$0.4B
$0.6B
$0.3B
$1.1B
$0.4B
FY15Beginning Cash
Free Cash Flows Dividend@45%
Regulatory andInt'l Cash
Capacity fordiv>45%, tuck-ins,share repurchases
Continued Strong Free Cash Flows and Greater Use of Balance Sheet Enable Us to Meet Capital Stewardship Commitments And Provide More FlexibilityFY15F–FY17F
1. Additional capital from moving Adjusted Debt/EBITDAR to 2:1
F

102
© 2014 | 102
$0.4B
$0.6B
$0.3B
$1.1B
$0.4B
FY15Beginning Cash
Free Cash Flows Dividend@45%
Regulatory andInt'l Cash
Capacity fordiv>45%, tuck-ins,share repurchases
$0.6B
$1.2B
Lever to 2X1
1. Additional capital from moving Adjusted Debt/EBITDAR to 2:1
Continued Strong Free Cash Flows and Greater Use of Balance Sheet Enable Us to Meet Capital Stewardship Commitments And Provide More FlexibilityFY15F–FY17F
F
103
© 2014 | 103
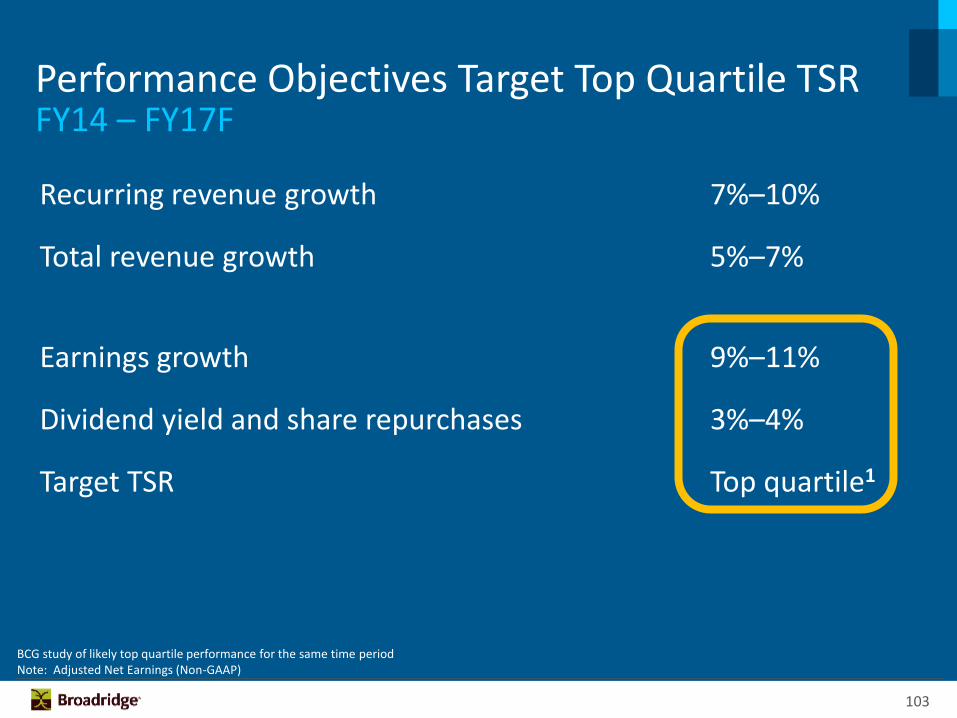
Performance Objectives Target Top Quartile TSRFY14 – FY17F
Recurring revenue growth 7%–10%
Total revenue growth 5%–7%
Earnings growth 9%–11%
Dividend yield and share repurchases 3%–4%
Target TSR Top quartile1
BCG study of likely top quartile performance for the same time periodNote: Adjusted Net Earnings (Non-GAAP)

2014 Investor &Analyst Day
• Broadridge Financial Solutions, Inc.
Richard J. DalyPresident and Chief Executive Officer
Closing Remarks

105
© 2014 | 105
Broadridge’s Investment Thesis
Resilient business model
Proven track record delivering top quartile TSR
Large market opportunity aligned with powerful industry trends
Experienced management and highly engaged associate team focused on delivering strong TSR
Track record driving growth through new products and tuck-in acquisitions
Low capital intensity and strong free cash flow enable effective capital stewardship
Note: All Broadridge results and statistics are for FY14 unless otherwise stated; Adjusted Net Earnings (Non-GAAP)
Unique franchise and ubiquitous presence
• 98% client revenue retention rate; 90% of total revenue is recurring
• Expanding portfolio of growth products: ~25% of recurring fee revenue in FY14 vs. ~10% in FY10
• Delivered top quartile avg. annual TSR of 13% since becoming public and 23% over past 3 years
• Grew recurring fee revenue 8%, total revenue 6% and earnings 14% CAGR from FY11-14
• $24B addressable market
• Regulatory environment pressuring clients’ return on equity; driving mutualization of non-differentiating costs and capabilities which is at the core of what Broadridge does
• Digital and paper elimination solutions drove proxy suppression rate to 62% in FY14; investing to drive digital adoption across the $20B paper and postage spend in Financial Services
• Data & Analytics solutions generated $46M recurring fee revenue in FY14, up from zero since becoming a public company; investing in our data and analytics product portfolio
• Recognized as an employer of choice in New York, Canada and India driven by our commitment to the service profit chain and alignment among our associates, clients and shareholders
• 100% of associates have a bonus tied to customer satisfaction
• Acquired 10 businesses since becoming public
• Portfolio tracking to 20%+ IRR; generated ~$220M in recurring fee revenue and ~$75M in EBITDA
• Generated $2.2B free cash flow since becoming public
• Returned $1.4B cash to stockholders through dividends and share repurchases since becoming public
• Commitment to dividends targeting at least a 45% payout ratio
• Using debt capacity positions us to increase our investments and return of capital, while maintaining investment grade credit rating
• Leading provider of US beneficial proxy, prospectus, US fixed income and Canadian
equity processing; 80%+ outstanding shares in US processed for voting; $5+ trillion in North American fixed income and equity trades cleared and settled daily

2014 Investor &Analyst Day
• Broadridge Financial Solutions, Inc.
Q&A