broiler grower survey report · broiler grower survey report page ... as part of a larger project...
TRANSCRIPT

Chapter 2 Broiler Grower Survey Report
Page 2-1
Chapter 2
Broiler Grower Survey Report Professor Lee Schrader, Purdue University Professor John Wilson, Duke University
I. Introduction This report sets out the results of a survey of contract broiler growers that was conducted in mid- to late 1999. The purpose of the survey was to obtain information from growers about their experience in contract broiler growing. The results are based upon survey responses received from 1424 growers in 10 states.
This survey was conducted as part of a larger project seeking to assess the impact of company practices on growers in contract poultry production. As a result of discussions with growers, farm organization representatives, Extension agents, and poultry specialists, a number of areas of possible concern were identified as question categories for the survey. The first area has to do with the how much freedom or autonomy contract growing grants to the farmer who elects to grow broilers under this system. For example, is the company fieldman seen as a resource on which the grower can draw or as a person who is in charge of the details of the broiler operation? The second area of concern identified is one of accounting. Does the grower understand the terms of the contract and is he or she able to interpret the settlement sheet? The third area of concern is the grower’s assessment of the balance of risk and reward entailed in contract growing. For example, do growers believe that the reward for their work is determined by factors within their control? A fourth area of concern has to do with the quality of the interpersonal relationships between grower and company. On a routine, day-to-day basis, are growers treated with consideration and respect and is their expertise and experience recognized and used? Elsewhere in the survey growers were asked if their contract stipulated that any disputes they might have with their company be settled in a certain way, such as through arbitration, mediation, or peer review. The growers were asked if they had ever used such a method and, if so, whether they were satisfied with it. If they had not used the provided method they were asked to state their reasons why.
Two final areas of concern have to do with the quality of inputs provided by the company and its methods of dealing with the grower’s output—the finished broiler chicken. Contract growing means that the company provides most of the inputs for the operation. In the case of broiler growing, this means feed and chicks. Are these inputs provided on a timely basis and are they of consistently high quality? The output of the broiler operation is the finished bird. Are birds picked up on a timely basis and treated in such a way as to protect the grower’s investment in them?

Chapter 2 Broiler Grower Survey Report Page 2-2
Besides asking growers about these areas of concern, the survey also gathered information about a wide range of characteristics of the grower and his or her operation. Many of the questions had to do with the grower’s work experience. What kinds of work were they doing before they became contract growers? Do they or their spouse currently have a job off the farm and, if so, what is that job and is it full-time or part-time? How many hours of work a day is spent looking after the chickens? Do they grow crops or livestock on their farm other than broilers? Another batch of questions asked about the farm. How many houses are used? What is the age and size of each house and how many improvements have been made to them? What is the average number of flocks handled each year? Has this number remained steady over the past three years? How many birds in each flock and what was the average growout weight?
Growers were also asked about their finances. What was their net cash flow from the broiler operation last year? How many times over the past ten flocks did they finish above average in their growout group and receive a bonus? Is their income from broiler growing their only source of farm income? How dependent is their family on broiler earnings for its household income? What is their level of total farm debt? How much of that is attributable to the broiler operation? Have they received any contractually stipulated increases in their rate of pay over the past three years? Questions were also asked about the “human capital” of each grower. What is their level of education? How experienced a broiler grower are they? What is their age? Are they male or female? Are they members of farm organizations?
An important set of questions had to do with growers’ expectations about contract growing. What was their reason for becoming contract growers originally? Where did they get their information about what their income from broiler growing would be? Has that income been higher or lower than they were led to expect? If it has been less than expected, what were the reasons? Has the time they spend looking after chickens been more or less than they expected?
Finally, in recognition of the rapid changes occurring in the broiler industry, growers were asked about how their experience of contract growing had changed. They were asked to compare the number of companies offering contracts in their area when they started out in the business with the number now offering contracts. They were asked whether they had ever changed companies and, if so, why and, if they had not changed, why they had stayed with their original company.
II. Sample and Survey Procedure The survey sample was drawn by National Agricultural Statistics Service, U. S. Department of Agriculture (NASS) from a list frame of growers marketing between 100,000 and 1,500,000 broilers per year in the 10 major broiler producing states. A minimum size was selected to limit the sample to commercial producers and the maximum to exclude operations owned by broiler companies. Four replicates of about 2000 each were drawn to provide additional names if needed. Only the first replicate set of 2004 names was used. States sampled in proportion to production are Alabama, Arkansas, Delaware, Georgia,

Chapter 2 Broiler Grower Survey Report
Page 2-3
Maryland, Mississippi, North Carolina, South Carolina, Texas, and Virginia. Lists were reviewed by State Statisticians in each state who identified 33 names in the set used that should not be contacted because of prior survey burden, known to be company farms, or known to object strongly to being contacted.
At least some information was provided by 1424 of the 1971 contacts. Additional analysis by Purdue Department of Agricultural Statistics based on Census of Agriculture data indicated no significant difference in size of operation or grower demographics between respondents and non-respondents in the original sample. All data preparation and analysis was completed using the SAS system with the assistance of Linda Lawson of Purdue University’s Department of Agricultural Statistics. Details of the response rates are provided in Appendix 2-A.
III. Responses to the Survey This section of the report describes the responses to the survey. The description follows the sequence of items as laid out in the questionnaire. A copy of the questionnaire used is provided in Appendix 2-B. More details on the number of growers who responded to each item together with the percentages for each item’s response category are reported in Appendix 2-C.
A. The Growers and Their Farms The growers who responded to the survey have extensive experience. Sixty-two percent have been growing broilers for more than 10 years. The average is 16 years. Most growers in the survey entered the business to enhance their income or financial security. However, a large majority of growers responding also indicated that being their own boss (72 percent) was at least somewhat important in their decision to enter broiler production. Only 37 percent of growers responding were operating a farm prior to starting their broiler operation. Table 1 provides additional analysis of grower responses related to prior employment.
Table 1
Employment when started growing broilers
Frequency Percent
Farm, no off-farm job 217 22
Off-farm job, no farm 535 53
Both farm and off-farm job 151 15
Neither farm nor off-farm job 98 10
Thirty-seven percent of growers responding currently have an off-farm job. Of those, 66 percent are employed full time. Sixty-five percent of growers responding grow other crops

Chapter 2 Broiler Grower Survey Report Page 2-4
or livestock. Ninety percent are married and almost half their spouses work off the farm, most of them full time.
The average farm represented in the survey has 3.6 houses, which average 15.5 years in age. Seventy-four percent of farms have between two and four houses, with three being most common at 30 percent. Sixty-seven percent of broiler houses represented in the survey had undergone at least one “substantial” improvement (costing at least $3,000) over the past five years.
Responses from some growers indicating that they worked more than 24 hours a day and spent fewer hours per day working in the broiler operation in the initial two weeks after receiving flock delivery suggests caution in interpreting the data on labor time devoted to broiler growing. Excluding these questionable responses, the data indicate that the average operation uses 7.4 hours of labor per day in the first 2 weeks and 5.5 hours per day in subsequent weeks. Routine cleanout requires 33.3 hours and a major cleanout, 43.3 hours. Responses indicating hours needed for both types of cleanouts indicate the use of substantial hired help. Despite the problems with these questions on labor time, a regression analysis found that hours of labor per day for both the first two weeks and the rest of the growout period are positively related to number of houses as might be expected, suggesting that the edited responses are valid.
B. The Growers and Their Contracts The average number of companies offering contracts within the grower’s area (self-defined) at the time of the survey was 2.48, lower by .33 than when respondents began growing broilers. Of those growers providing information about companies operating when they started growing and companies operating now, 28 percent reported a decrease, 54 percent reported no change, and 18 percent reported an increase. Nearly a third of growers have changed companies. Forty-seven percent of those indicating a reason for the change said that they did so because the old company closed or changed hands, while 12 percent of those indicating a reason for changing companies said it was because they were cut off by their old company. This latter statistic probably understates the occurrence of cut-offs because it includes only those that remain in the business. Of those who have not changed, two-thirds did not see an alternative to their current company.
Thirty-six percent of growers responding indicated that their contracts stipulate a specific procedure for settlement of disputes between the grower and the company. Thirty-eight percent of growers indicated that they did not know whether their contract requires disputes to be settled through a specified procedure. For those growers who did know of a required procedure, arbitration (52%) and peer review (30%) are the most common procedures used. However, few growers (4%) had used the dispute resolution procedure provided in their contract. (Of the 13 growers who indicated that they had used the dispute resolution procedure, four were not at all satisfied with the process, one was not very satisfied, four were somewhat satisfied, three were very satisfied, and one failed to indicate a degree of satisfaction.) Of those not using the contractual dispute settlement procedure, 13 percent believed that it would prove too costly, 33 percent feared that it would provoke

Chapter 2 Broiler Grower Survey Report
Page 2-5
retaliation by the company, and 29 percent believed that it simply would not work to their benefit.
During the three years prior to the survey (1996-98), growers responding averaged 5.5 flocks per year with flocks averaging 71,725 birds per flock raised to an average of 5.14 pounds per bird. The number of flocks per year stayed about the same for roughly two-thirds of the growers, while 12% of growers reported decreasing flock numbers and 7% reported increasing flock numbers.
C. Grower Perceptions of Company Relations Two questions in the survey focused on the growers’ perceptions of their relationship with their contracting companies. The questions were designed to evaluate the quality of that grower-company relationship. Question 7 in Section 2 of the survey presented statements with which respondents were asked to completely agree, agree, disagree, or completely disagree. Question 8 in Section 2 presented statements for which respondents were asked to indicate the frequency that the statement applied to their situation.
The survey results indicate that growers generally find that companies provide helpful information on flock management (80% agree) and that growers view their service person as a good judge of their work (77% agree). Two-thirds of the survey respondents agreed that they feel free to complain to the company if they have a problem. However, forty-two percent of the growers responding to the survey indicated that they do not feel free not to follow the recommendations of the company service person. Seventy-eight percent of the growers indicated that the service person rarely or never lets the grower know ahead of time about a farm visit. Settlement sheets are difficult to decipher for 31 percent of the growers. Almost half the growers (48%) do not regard the ranking method of determining payment as a good incentive to work hard. Seventy-eight percent of growers agree that pay depends more on quality of chicks and feed supplied than on the quality of their own work. One third of respondents feel that time required to care for the broilers is more than they were led to expect. Barely half (51%) agree that improvements to houses suggested by the company made them better off, while half believe that their contract will not be renewed unless company recommendations regarding house replacement are followed. Seventy-five percent agree that getting into broiler growing was a good decision for them. However, only 35 percent would encourage others to enter the business, with 23 percent indicating strong disagreement with that statement.
While only 45 percent of growers find that company management always or usually responds helpfully to complaints (and 21 percent indicating that this is rarely or never true), the survey suggests that growers generally have a good relationship with their service person, as indicated by majorities of survey respondents indicating that the service person always or usually takes the time to help the grower understand and follow recommendations (64%) and keeps promises made to the grower (66%). Many growers perceive chick quality as a problem. Less than half (44%) indicate that good quality chicks are always or usually delivered to the farm. On the other hand, sixty-five percent of growers indicated that they always or usually receive good quality feed. Most growers responding to the survey indicated that they receive chicks, feed, and pickup as scheduled.

Chapter 2 Broiler Grower Survey Report Page 2-6
However, 38 percent of growers indicated that they are at least sometimes left without birds long enough to be hurt financially. Sixty-three percent believe the catching crew always or usually does a good job. When asking about condemnation rates, only 44 percent of growers always or usually receive a satisfactory explanation.
Most growers responding (65%) believe that their company always or usually provides them with good quality feed, and a slightly higher proportion (71%) report punctual feed delivery to their farms. Survey questions on charges for feed evoked a slightly different response pattern. While about half of growers responding believe they are rarely or never charged for more feed than delivered, 32% indicated that they did not know whether this was the case or not. A smaller but still significant proportion of growers (19%) indicated that they did not know whether feed had been emptied from their bins without their being credited for it. Most growers, however, were satisfied that this rarely or never occurred.
Seventy-eight percent of growers responding reported no company assistance with proper disposal of litter or dead birds. Growers who are company employees are frequently included in growout groups (implying inclusion in calculation of payment, although the question could have been interpreted otherwise). Seventy percent of growers responding believe that company employees should not be included in the same growout groups as non-employees.
D. Income and Expenses Net cash flow (income less cash expenses) from the broiler operation was less than $30,000 for three-quarters of growers responding. Nine percent reported losing money. While sixty-five percent of the growers responding have diversified farm operations, only 14 percent of all growers reported other farm activity accounting for more than 50 percent of gross farm income. Broilers therefore seem to be the chief source of farm income for most growers participating in the survey. Only a slim majority, 51 percent, however, indicated that more than half their family’s total income (including any off-farm income) is derived from the broiler operation. (A preliminary analysis of the determinants of net cash flow is reported in Appendix 2-D.)
The growers were asked how many times, in the past ten flocks, they had been ranked above average in their growout group. The mean number of times was 5.94. Either the respondents were better than average growers or there is a positive bias in the response.
Broiler companies and other growers were the most important sources of income information at the time respondents began to think about broiler growing. Lending organizations were the next most important information source. Forty-seven percent of growers indicated that their incomes have been about as expected based on information provided by the company when starting. Ten percent indicated that their incomes have been more than expected. However, the income of 43 percent has been below expectations. Most of those whose expectations have been disappointed attribute this to chick quality (76%), higher than anticipated operating costs (86%), higher than expected chick death rates (65%), and the need to make expensive improvements (65%). Sixty percent of

Chapter 2 Broiler Grower Survey Report
Page 2-7
respondents reported contract changes that increased their pay in the preceding three years.
Two-thirds of growers (66%) reported total farm debt of less than $200,000, and almost half (46%) reported less than $100,000 in total farm debt. More than half (52%) reported that 75 percent or more of their total farm debt was owed on the broiler operation.
Growers indicated Farm Bureau most often (43%) and Contract Poultry Growers Association next (20%) as organizations they belong to in the belief that the organization will help them manage the broiler operation. The average grower age is 51 years. Most growers are male (82%) and have completed no more than high school education (58%).
IV. Summary of Results of Analysis of Broiler Data The purpose of the survey was not only to gather descriptive data on broiler growers but to find out why growers have such different experiences with contract growing. The growers’ demographic and financial information reported in the survey was grouped to assess whether any categories of factors were associated with specific grower perceptions. The first set of factors had to do with the growers’ level of performance in the ranking system and the size of their operation (measured in net cash flow, number of flocks per year, and number of houses). The second had to do with the grower’s human and social capital (measured in education, age, gender, years of growing experience, and organizational membership). The third deals with the grower’s work experience. The fourth concerns the grower’s dependence on the company for a livelihood. And the fifth deals with changes in the circumstances under which the grower has operated.
The analysis performed looks at the impact of each of these clusters of variables on nine areas of concern. These are:
• Grower ratings of autonomy • Grower ratings of difficulty understanding contracts and settlement sheets • Grower assessments of risk and reward in contract growing • Grower ratings of quality and timeliness of chick delivery • Grower ratings of quality and timeliness of feed delivery • Grower ratings of the quality of interactions with company personnel • Grower expectations about the work time entailed in broiler growing • Grower reports of delayed flock delivery and high condemnation rates • Grower opinions about broiler growing and recommendation to others
The complete tables from which the following summary is drawn, with accompanying text, can be found in Appendix 2-E.
A. Grower Ratings of Autonomy Contract growing is one way to enter or stay in farming, it can be an attractive means of farm diversification, and it offers individual growers resources and support from company representatives. On the other hand, there are many restrictions and conditions imposed by

Chapter 2 Broiler Grower Survey Report Page 2-8
the contract that undermine some of the freedoms enjoyed by independent growers. A number of items of the survey were intended to measure the grower’s sense of autonomy with respect to the company. There was considerable disagreement among growers on many of these items. For example, 67% felt free to complain to their company if they had a problem but 28% did not; 51% believed that the improvements mandated by their company had made them better off but 33% either disagreed or strongly disagreed that this was the case and a further 16% indicated they did not know either way. By and large, growers who were doing better financially seemed to feel the most autonomous. This could mean that the more “independent” growers performed better or it could mean that better performance enabled growers to enjoy more autonomy, or at least think they had more autonomy. It could also mean that a third, prior, factor not only helped some growers to be more successful but also more “their own boss.”
A typical pattern of association is to be found in the case of the item: “My service person may make recommendations but I feel free to go my own way.” Just over half (52%) of the growers agreed but 42% disagreed with this statement, ten percent of them strongly. A further 6% refused to say. Who was most likely to feel they could go their own way despite the recommendation of their service person? Two performance measures stand out: growers with higher net incomes and growers who had ranked above average often were more likely to express a sense of autonomy. Growers whose income was higher than they had expected were also more likely to agree as were growers who had been well treated by the company—as shown by an increase in the number of flocks they received per year. Several other factors, however, pointed to disagreement with this statement with almost half of the growers not feeling that they could go their own way: these growers were more likely to be male than female, they tended to be older and, significantly, they tended to have accumulated more years of experience as a contract grower.
B. Grower Ratings of Difficulty in Understanding Contracts and Settlement Sheets These questions were intended to measure the degree of difficulty faced by growers in understanding the various documents pertaining to the contract growing relationship. As it turned out, 82% of the growers said they could understand the terms of their contract. The settlement sheet was another matter: only 63% claimed to be able to understand those documents, leaving 31% who could not understand the calculations reported. Which growers seemed to experience the most difficulty? Once again, a number of performance measures were relevant. The growers most likely to report difficulties understanding their settlement sheets were those who were not doing too well: that is, they had lower net cash incomes, had not ranked above average very often recently, had received fewer flocks per year, and realized income from the broiler operation that was less than they expected. Furthermore, they had enjoyed no increases in financial well being in recent years: they had not been given an increase in flocks per year and their contract had not been changed to increase their pay. In addition to these performance measures, there were several other grower and farm characteristics associated with understanding of settlement sheets. The managers of larger operations (as measured by number of houses) found the settlement sheets easier to understand, as did the more highly educated growers and those with an off-farm job in the managerial or professional world. Somewhat surprisingly, the more

Chapter 2 Broiler Grower Survey Report
Page 2-9
experienced growers reported more difficulty: a function, perhaps, of their age and education. Finally, growers operating farms in areas in which several companies were offering contracts were more likely to find their settlement sheets comprehensible.
C. Grower Assessments of Risk and Reward in Contract Growing These questions were intended to measure the growers’ perceptions of how risk and reward are related in contract farming. Perhaps the most important item in this cluster pertains to the ranking method. Does it provide a good incentive to the grower to work hard and take care of his or her operation? Just under half the growers (48%) clearly believe that the ranking system does not provide much incentive to work hard, while 45% are in favor of it and a further 7% did not provide an answer.
Who are the growers most likely to speak favorably of the ranking method? As might be expected, performance measures are strongly associated with opinions on this matter, with the better performing growers (measured by times ranked above average and net cash flow) more supportive of it. Positive attitudes toward the ranking method are also more likely to be found among growers whose recent experience with growing under contract has been good: their flock numbers have been rising and their contract has been changed to increase their pay. Enjoying an income greater than expected also contributed to positive attitudes about ranking. Those reporting an average of seven or more flocks in the previous three years were also supportive, compared to those who had been given five flocks. There is also a tendency for growers with little debt and with little of their debt owed on the chicken operation to think more highly of the ranking method. Grower characteristics also played some role: growers with some post-high school education (in trade or technical school) were the least favorably disposed as were the younger growers. On the other hand, growers with an off-farm job in the managerial category were, of all off-farm workers, the most approving of the system.
D. Grower Ratings of Quality and Timeliness in Chick Delivery A majority of the growers in the survey (78%) believe that their pay depends more on the quality of chicks delivered to their farm than on their quality of their work. Growers’ assessments of the quality and punctuality of chick delivery is thus very important. Growers were asked a number of questions about timeliness of chick delivery and the quality of the chicks delivered. Quite a number of growers (38%) agreed that they are at least “sometimes” left without birds long enough to hurt them financially. However, 85% reported that birds are “always” or “usually” delivered to their farm when promised. Perhaps the key item in this batch, considering the opinions expressed on the importance of chick quality, is that which states: “Good quality chicks are delivered to my farm.” Growers were split on this item, with 43% indicating “always” or “usually,” 44% indicating “sometimes,” and 12% saying “rarely” or “never.”
Who were the growers most likely to report always, or at least usually, receiving good quality chicks? They tend to be those with higher net cash incomes, they rank above average more frequently, they receive more flocks per year, the number of flocks they have been receiving has risen in recent years, as has their base pay as stipulated in the contract,

Chapter 2 Broiler Grower Survey Report Page 2-10
and they are earning more than they expected. They are older and hold a job off the farm in a managerial position. Only a small fraction of their farm debt is attributable to broiler growing.
E. Grower Ratings of Quality and Timeliness of Feed Delivery Feed is the other major input supplied by the company, and many growers are concerned that their lack of control over the delivery and quality of the feed they must use affects their incomes. Few growers (3%) responding believe that they are “always” or “usually” overcharged for their feed although 16% believe they “sometimes” are. Almost one-third (32%) of growers responding to the survey marked the “other” column regarding overcharging for feed, indicating that some growers do not know what to believe about overcharging while others may have not wanted to indicate their belief about overcharging. Most (71%) report on-time delivery of feed. However, there is more variation with respect to the perceived quality of the feed with which they are supplied. The majority (65%) believe that good quality feed is “always” or “usually” delivered to their farm, but the rest are more skeptical.
Who, according to these reports, gets the best quality feed? They tend to be growers with higher net cash incomes who often rank above average, are given more flocks a year, have experienced an increase in the number of flocks delivered and an increase in base pay and are earning more than they expected. They operate more houses but have less total farm debt and attribute a smaller fraction of their debt to broiler growing. They are older and have more years of experience as a contract grower. Their job prior to becoming a contract grower is less likely to have been that of a farmer. Good quality feed delivery is also more likely to be reported by those without a job off the farm. However, if they do have a job off the farm it is those who occupy managerial or professional positions who report receiving good quality feed most consistently. Once again, more favorable reports come from growers with low farm debt and those who report that little of the debt they have is attributable to broiler growing. More consistent quality feed delivery is reported by growers whose family income is the least dependent on money they make from raising chickens.
F. Grower Ratings of the Quality of Interactions with Company Personnel These questions allowed growers to rate the degree to which their company seems to acknowledge and use their expertise. High quality relationships are defined as those in which the skills and concerns of the grower are respected and acknowledged; low quality relationships are those in which the grower is “de-skilled” and simply told exactly what to do for each phase of the growout operation. One key indicator of relationship quality is how readily companies respond to the concerns of their growers. Do they respond helpfully when the grower approaches them? Just under half (45%) of the growers said that their company “always” or “usually” responds to their complaints helpfully, but 21% responded that their company “rarely” or “never” does so and 28% said that their company responded helpfully only “sometimes.”

Chapter 2 Broiler Grower Survey Report
Page 2-11
Which growers were most likely to see their company as responding helpfully when they complain? They had higher net cash incomes, rank above average more often, receive more flocks per year, had seen the number of flocks they receive rise in recent years and were earning more than they had expected. They had also received an increase in pay through a re-written contract. They are more highly educated, female, older, and, if they have an off-farm job, working in a managerial rather than a technical or sales position. They are also likely to owe little on their farm.
Growers were also asked to describe their relationship with their service person. Although few growers (8%) reported that their service person let them know ahead of time about visiting their farm, 64% reported that he or she “always” or “usually” took time to help them understand and follow recommendations. This still leaves 33% who would describe their service person as not spending enough time on their concerns. Who are these growers? They tend to be growers who: had lost money on their operation last year or reported low net cash incomes, ranked below average more frequently, had fewer flocks last year, had not been granted an increase in flock numbers or in their base pay through contract revision, and were earning less than they expected. They tended to be more well educated, male, younger, and have an off-farm job. The less dependent the grower was on broilers for family income, the worse they rated the service person on this criterion, but the association with debt was the opposite: the smaller the proportion of total debt attributable to broiler growing, the more favorable the rating for the service person.
G. Grower Expectations About the Work Time Entailed in Broiler Growing Contract broiler growing is frequently marketed by companies as a part-time job, but many growers feel that their time commitments exceed those expectations. Growers were asked if they believe that the amount of time they and their families spend on the broiler operation is more than the company led them to expect. A third of the growers agreed that they did spend more time than they had anticipated, while just over half (54%) disagreed, with the remainder offering no answer. Who were the growers most likely to think they were having to spend more time than they had planned? They reported lower net cash income, but more flocks per year and more houses. They were older and their job prior to contract broiler growing was farming. They reported that broiler income represented less than a quarter of their family income and they had not enjoyed an increase in base pay through contract revision. They were also more likely to report that their income was less than they had expected.
H. Grower Reports of Delayed Flock Delivery and High Condemnation Rates Two factors that seem to play a role in growers’ overall assessment of contract growing are how frequently they are left without birds long enough to hurt them financially and how often their birds are condemned at the plant at rates higher than they had expected. Being left without birds makes it more likely that the grower will report lower income, rank below average, and, not surprisingly, receive less than seven flocks a year and not have been given increased flock numbers. The more highly educated growers also report being without birds more often, as do growers who have diversified operations. Higher than expected condemnation rates are found among growers who are male, earn less income,

Chapter 2 Broiler Grower Survey Report Page 2-12
earn less than expected, rank above average infrequently, have more experience with contract growing, and have not been granted an increase in pay through contract revision.
I. Grower Opinions About Broiler Growing and Recommendation to Others The survey asked two questions intended to provide the grower with the chance to make an overall assessment of their role as a contract grower: had it been a good decision for them and would they recommend it to others? Three quarters of the growers agreed that getting into broiler growing had been a good decision for them, but only 35% would encourage others to do the same.
Who were the growers most likely to believe that their career choice had been a good one? As might be expected, they tended to be the growers who were doing better financially, better than they had expected. They had higher net cash incomes, were ranked above average with greater frequency, their contract had been changed to increase their pay, they received more flocks per year and the number of flocks delivered had been going up. They tended to be full-time farmers (no off-farm job) and attributed little of their farm debt to the broiler operation. They were also more likely to be women. Finally, growers were more likely to see their decision as a good one if they were farming in an area where the number of companies offering contracts was rising.
Who were the growers most likely to want to encourage others to join their ranks? Once again, they tended to be growers who were doing well financially, better than they had expected. They had higher net cash incomes, were ranked above average frequently, had been granted an increase in base pay, and were either young or old (the middle aged were the least likely to recommend it). If they had an off-farm job they were more positive about contract growing if they were managers or professionals (in contrast to those with technical or sales jobs who were the most negative). They were more likely to recommend the job to others if the number of companies offering contracts in the area had been increasing.
V. Grower Comments Growers participating in the survey were also invited to submit written comments. Forty-two percent of the completed surveys included at least one comment. The ten most frequently addressed issues matched many topics already covered by survey questions. These comments were reviewed and grouped by topic. Those frequently addressed topics were:
• Level of contract payments (income) (126 comments).
• Cost of improvements and repairs specified by the company (93 comments).
• Grower involvement in decisions affecting his or her operation (78 comments).
• Cost increases (69 comments).
• Chick quality and/or count (63 comments).
• Pay based on performance relative to other growers (58 comments).
Chapter 2 Broiler Grower Survey Report
Page 2-13
• Satisfaction now compared to past (50 comments).
• Expressing high level of satisfaction (49 comments).
• Concern about an imbalance of power between companies and growers (43 comments).
• Feed quality and/or weight (40 comments).
VI. Conclusion The purpose of this survey was not only to gather descriptive data on broiler growers but also to assess the impact of contract poultry growing arrangements on the growers. Survey responses indicate that most growers participating feel that their company provides helpful information about flock management (80%), that they feel free to complain to the company about problems (67%), that the service person is a good judge of the grower’s work quality (77%), and that getting into broiler growing was a good decision for them (75%).
Despite these positive indications, grower responses to other survey questions identify certain aspects of their broiler growing arrangements that are perceived by growers to be of continuing concern. Survey responses indicate that growers perceive the following as areas of continuing concern:
• Use of the ranking system to determine grower pay.
• That grower pay is most affected by matters outside their control, namely the quality of inputs provided by the company.
• Confusion among a substantial number of growers regarding their settlement sheets.
• Higher than expected condemnation rates and inadequate explanations of condemnations.
• The dispute resolution procedures available to growers under growout contracts.
• The disconnect between many growers’ negative perceptions of the value of improvements suggested by the companies and their belief that their contracts will not be renewed if the improvements are not made.
• Grower concerns and uncertainty about the accuracy of feed weighing and prompt weighing of birds.
• The large majority of growers who receive no assistance from their company with the disposal of litter or dead birds.
• The high percentage of growers earning less than expected and high percentages perceiving the causes to be related to chick quality, required improvements, and rising operating costs.
• Growers being left without flocks long enough to suffer financially.

Chapter 2 Broiler Grower Survey Report Page 2-14
How these perceived grower concerns are addressed by broiler grower contract provisions and state and federal laws will be discussed in subsequent chapters of this report. Chapter Four, which discusses the extent to which federal and state laws address these grower concerns, also includes recommendations for policy changes that may improve grower and company relations in these areas.

Chapter 2, Appendix A Survey Protocol
Page 2-15
Appendix 2-A Survey Protocol The survey was conducted by the Department of Agricultural Statistics, Purdue University. The first mailing was made July 30, 1999. A second mailing to non-respondents was made August 30. Telephone contacts of non-respondents were made from September 20 through October. Those contacted by phone who did not agree to complete the survey were asked a subset of four questions to aid in assessment of bias.
A third mailing was made to those who did not respond to the first two mailings and were not reached by phone.
Responses:
1010 Fully completed questionnaires 103 Answered 4-6 questions by phone 311 Not growing broilers (out of scope of survey) 33 Not contacted at request of state office 25 Unable to contact—post office return and no valid phone number 77 Valid address, mailed three times, but unable to reach by phone 5 Returned form, stating they didn’t want to participate 49 Refused to complete the survey when called 58 Mailed twice, when called said they would return form—never received 19 Mailed twice, when called requested we mail it again—never received 79 Mailed twice, when called requested call back, but then not home 235 Valid phone and address, mailed three times, attempted by phone more than three times 2004 Sample

Chapter 2, Appendix A Survey Protocol Page 2-16

Chapter 2, Appendix B Blank Survey Form
Page 2-17
Appendix 2-B Blank Survey Form

Chapter 2, Appendix B Blank Survey Form Page 2-18


Chapter 2, Appendix C Survey Results
Page 2-27
Appendix 2-C Survey Results

Chapter 2, Appendix C Survey Results Page 2-28


Chapter 2, Appendix D Calculating Net Cash Flow
Page 2-37
Appendix 2-D Calculating Net Cash Flow The survey indicates that many growers derive relatively low incomes from their broiler operation. An examination of the data in the survey shows that level of income corresponds quite closely with size of operation. In the ensuing analysis, the following variables are used:
Net cash flow = 0 if “Lost Money” to 5 if “$60,000+” from Section 3, Question 1 Square feet = total house space calculated from Section 1, Question 7 Number of flocks per year = Section 2, Question 6 Operator has off-farm job = 1 if yes, 0 if no Operator has full-time job = 1 if yes, 0 if no Farm includes crops and/or other livestock = 1 if yes, 0 if no
Three regression models were estimated. The results of testing the first model are reported in the table below. A positive relationship between cash flow and house capacity, the number of flocks per year, and the farm including other enterprise(s) is indicated. The grower’s job status has no impact net of these factors.
Dependent : Net Cash Flow
Parameter Estimate
Probability
Intercept 1.483770 .0001
Square feet 0.000010699 .0001
Number of flocks per year 0.105853 .0366
Operator has off-farm job -0.175447 .1647
Operator has full-time job -0.186525 .1797
Farm has other crops/livestock 0.188428 .0179
In a second model, net cash flow was regressed on age of operator, average age of houses, and number of houses. Positive statistically significant coefficients were found for operator age and number of houses and a marginally significant negative relationship for age of houses.
A third model regressed net cash flow on operator age, age of houses, and number of flocks in last 10 ranked above average. Operator age was not significant in this model, but house age had a negative significant coefficient, and number of flocks above average showed a positive significant influence.

Chapter 2, Appendix D Calculating Net Cash Flow Page 2-38

Chapter 2, Appendix E Statistical Analyses of Survey Results
Page 2-39
Appendix 2-E Statistical Analyses of Survey Results In the following 35 tables are presented detailed analyses of relationships between the growers’ responses to Questions 7 and 8 in Section 2 of the questionnaire and various characteristics of the grower and his or her operation. It important to recognize that the analyses presented identify association, not causation. Even though the statistical analyses are structured as if one variable is dependent on another, the existence of a statistically significant relationship does not indicate which is cause and which is effect. The tables present the results of analysis of variance employing the Duncan multiple range test on the responses to Questions 7 and 8. For Question 7 the scores are: completely agree=1, agree=2, disagree=3, and completely disagree=4. “Other” is treated as a missing value. For Question 8 the scores are: always=1, usually=2, sometimes=3, rarely=4, and never=5. “Other” is treated as a missing value. Thus an average of 2.5 for statements in Question 7 implies an equal level of agreement and disagreement, and an average of 3.0 for statements in Question 8 implies “sometimes.” Letters to the left of the average scores indicate differences between groups. A statistically significant difference (p=.05) exists between groups only if they do not have any of the same letters displayed. Code numbers at the top of the table refer to the questionnaire item.
Tables 1-5 focus on the relationship of statements related to the grower’s assessment of his or her autonomy with respect to the company to variables measuring grower performance, human and social capital, work experience, dependency, and change. Tables 6-10 highlight the degree of difficulty involved in understanding contract and settlement documents. Tables 11-15 concern items on the questionnaire asking the grower to assess the ratio of risk and reward in the contract relationship. Tables 16-20 have to do with the quality of the interaction between grower and company. Tables 21-25 concern the quality of chicks and associated services. Tables 26-30 deal with growers’ evaluation of feed and feed services. Tables 31-35 contain items in which growers provide an overall assessment of the contract relationship.
With regard to the human and social capital variable of organizational membership (Tables 2, 7, 12, 17, 22, 27, and 32) note that, because the survey asked if growers joined the organizations for the specific purpose of helping them “manage their broiler operations better,” a negative response does not necessarily mean that the grower is not a member of the organization. He or she may have answered “no” because that was not the reason for joining the organization.
Grower Ratings of the Degree of Autonomy They Have With Respect to Their Company Table 1 shows a mainly positive relationship between growers’ net cash flow and their assessment of their autonomy with respect to the company. Greatest differences occur for the grower’s feeling free to complain to the company about problems and the perception that contracts will not be renewed unless company recommendations to build new houses or make major improvements are followed. Growers with higher cash flow from the broiler operation are also more likely to see themselves as having a higher degree of independence—they feel freer to go their own way—than do those with low net cash flow. There is some tendency for growers producing more flocks per year to see themselves as more independent. Size of the

Chapter 2, Appendix E Statistical Analyses of Survey Results Page 2-40
growing operation has limited impact. Frequency of ranking above average is also positively related to a feeling of independence.
Table 1. Grower assessment of autonomy with respect to the company and measures of grower performance
251 - Feel free to complain 252 - Feel free to go own way 253 - Service person is a good judge 260 - Improvements worth it 261 - Particular vendors 262 - No contract unless new houses/improvements
Performance Variables
N
Code 251
Code 252
Code 253
Code 260
Code 261
Code 262
Net Cash Lost Money $ 0 - $14,999 $15,000 - $29,999 $30,000 - $44,999 $45,000 - $59,999 $60,000 & Up
81
329 274 152 42 36
D 2.55 C 2.26
BC 2.11 B 1.95
BC 2.01 A 1.65
C 2.68
BC 2.46 B 2.41 B 2.37 B 2.38 A 2.06
B 2.40 A 2.02 A 1.96 A 1.99 A 1.98 A 1.81
C 2.82 B 2.40 B 2.39 B 2.25 B 2.28 A 1.96
AB 2.84 A 2.81
AB 2.94 AB 2.94
B 3.13 B 3.13
A 1.88
AB 2.12 BC 2.24 CD 2.40 CD 2.48
D 2.62
Flocks/Year Less Than 5 5.0 - 5.9 6.0 - 6.9 7.0 or More
102 498 337 63
B 2.11 B 2.22 B 2.09 A 1.85
A 2.32 A 2.45 A 2.42 A 2.35
AB 2.01
B 2.08 AB 1.93 A 1.89
AB 2.38
B 2.44 AB 2.34 A 2.21
A 2.93 A 2.89 A 2.89 A 3.02
A 2.18 A 2.17 A 2.23 A 2.36
Houses/Farm 1 - 2 Houses 3 - 4 Houses 5 or More
335 426 222
B 2.21 A 2.03 B 2.22
A 2.41 A 2.39 A 2.47
A 2.00 A 1.99 A 2.05
A 2.35 A 2.36 A 2.47
A 2.92 A 2.90 A 2.87
A 2.18 A 2.26 A 2.15
Ranked Above 0 - 5 Times 6 - 10 Times
368 451
A 2.18 A 2.09
B 2.47 A 2.36
B 2.07 A 1.94
B 2.46 A 2.30
A 2.86 A 2.96
A 2.15 B 2.26
Table 2 shows relationships between perceptions of autonomy and measures of human and social capital of growers. Surprisingly, there are no significant effects of education. Women respondents are more likely to perceive themselves as having more autonomy. Older and more experienced growers are somewhat less likely to feel independent, although the older growers have more respect for the judgment of the service person. The more experienced growers split on the issue of respect for their service person’s judgment, with the most experienced group (25 or more years) most likely to respect that person’s judgment and the next most experienced group (13 to 24 years) least likely to respect that person’s judgment, when compared to growers with 12 or fewer years in the business. Growers who belong to the Farm Bureau but not the Contract Poultry Growers Association or neither of these are more likely perceive themselves as

Chapter 2, Appendix E Statistical Analyses of Survey Results
Page 2-41
independent than are those belonging to the Growers Association or both Farm Bureau and the Growers Association. Table 2. Grower assessment of autonomy with respect to the company and measures of grower human and social capital
251 - Feel free to complain 252 - Feel free to go own way 253 - Service person is a good judge 260 - Improvements worth it 261 - Particular vendors 262 - No contract unless new houses/improvements
Human & Social Capital Variables
N
Code 251
Code 252
Code 253
Code 260
Code 261
Code 262
Education Grade School High School Trade/Technical Some 4-year Bachelor & Up
83
495 135 163 116
A 2.07 A 2.12 A 2.19 A 2.21 A 2.16
A 2.53 A 2.37 A 2.43 A 2.50 A 2.46
A 1.96 A 1.98 A 2.02 A 2.10 A 2.12
A 2.30 A 2.36 A 2.41 A 2.45 A 2.48
A 2.97 A 2.89 A 2.85 A 2.94 A 2.97
A 2.25 A 2.23 A 2.20 A 2.09 A 2.23
Gender Male Female
822 180
B 2.17 A 2.00
B 2.45 A 2.27
B 2.05 A 1.82
A 2.40 A 2.33
A 2.87 B 3.06
A 2.20 A 2.23
Years Growing 7 or Less 8 - 12 13 - 24 25 or More
213 251 328 206
A 2.12 A 2.15 A 2.17 A 2.10
A 2.27
AB 2.40 BC 2.45 C 2.56
AB 2.04 AB 1.97
B 2.09 A 1.92
A 2.27
AB 2.37 B 2.45
AB 2.41
A 2.90 A 2.87 A 2.92 A 2.91
AB 2.26
B 2.28 AB 2.16 A 2.12
Age 40 & Under 41 - 50 51 - 60 Over 60
177 307 307 209
B 2.20 B 2.20 B 2.16 A 1.97
A 2.27 B 2.45 B 2.46 B 2.45
B 2.11 B 2.06
AB 1.99 A 1.89
AB 2.33
B 2.46 AB 2.41 A 2.28
A 2.95 A 2.86 A 2.89 A 2.95
A 2.22 A 2.15 A 2.22 A 2.23
Organizations Poultry Grower Farm Bureau Both Neither
93
311 92
447
B 2.50 A 2.03 B 2.49 A 2.07
AB 2.51 A 2.37 B 2.67 A 2.40
B 2.24 A 1.97 B 2.20 A 1.98
B 2.64 A 2.32 B 2.66 A 2.34
A 2.66 B 2.97 A 2.68 B 2.96
A 1.91 B 2.30 A 2.00 B 2.23
Note: Organization grouping is as follows:
Poultry Grower represents those who belong to the Contract Poultry Growers Association to help them manage their broiler operations better, and do not belong to Farm Bureau for that purpose.
Farm Bureau represents those who belong to Farm Bureau in order to help them manage their broiler operations better, and do not belong to the Contract Poultry Growers Association for that reason.

Chapter 2, Appendix E Statistical Analyses of Survey Results Page 2-42
Both represents those who belong to both the Contract Poultry Growers Association and Farm Bureau in order to help them manage their broiler operations better.
Neither represents those who belong to neither the Contract Poultry Growers Association nor to Farm Bureau in order to help them manage their broiler operations better.
Table 3 outlines the relation between growers’ work experience and their perceptions of autonomy. Those with prior farming activity differ from those without only in being more likely to agree that the company suggests use of particular vendors for equipment. Off-farm jobholders are no different from other growers, with the exception that they disagree that the service person is a good judge of the quality of their work. Whether the spouse has an off-farm job has no effect on the perception of independence.
Table 3. Grower assessment of autonomy with respect to the company and measures of grower work experience
251 - Feel free to complain 252 - Feel free to go own way 253 - Service person is a good judge 260 - Improvements worth it 261 - Particular vendors 262 - No contract unless new houses/improvements
Work Experience Variables
N
Code 251
Code 252
Code 253
Code 260
Code 261
Code 262
Farming Prior Job Yes No
368 642
A 2.13 A 2.15
A 2.41 A 2.43
A 2.02 A 2.01
A 2.40 A 2.37
A 2.74 B 3.00
A 2.19 A 2.21
Has Off-farm Job Yes No
360 624
A 2.18 A 2.10
A 2.44 A 2.40
B 2.08 A 1.97
A 2.43 A 2.35
A 2.94 A 2.89
A 2.19 A 2.22
Spouse Off-farm Job Yes No No Spouse
400 458 94
A 2.23 A 2.09 A 2.07
A 2.43 A 2.44 A 2.33
B 2.09
AB 1.99 A 1.89
B 2.45 B 2.38 A 2.21
A 2.88 A 2.94 A 2.84
A 2.16 A 2.26 A 2.20
Current Occupation Manager/Professional Tech/Sales/Support Farm/Forest/Broilers Precision/Repair Operators/Labor Other/None Listed
45 66 47 80 85 36
A 1.94
AB 2.14 AB 2.07 AB 2.31 AB 2.24
B 2.35
A 2.39 A 2.41 A 2.52 A 2.46 A 2.45 A 2.48
A 1.93 A 2.12 A 1.92 A 2.09 A 2.20 A 2.14
A 2.37 A 2.43 A 2.36 A 2.45 A 2.47 A 2.44
B 3.17
AB 3.07 AB 2.98 AB 2.92 A 2.73
AB 2.96
A 2.31 A 2.19 A 2.20 A 2.18 A 2.18 A 2.09

Chapter 2, Appendix E Statistical Analyses of Survey Results
Page 2-43
Table 4 describes the association between the growers’ financial dependence on broiler growing and their rating of their autonomy with respect to their company. Growers who depend very little on broiler growing for their family income reported feeling less autonomous. Growers who derive 75% or more of their family income from broilers show a somewhat greater perception of independence, although they join the growers deriving less than 25% of family income from broilers in feeling less able to complain than the middle groups do. Indebtedness does not seem to account for variation in grower attitudes: neither total farm debt nor percentage of debt attributable to broiler growing is associated with the items in this table, with the rather surprising exception that growers with a higher percentage of farm debt owed on the broiler operation feel most free to complain. Feeling bound to a particular company is not associated with autonomy ratings. The number of companies in the area makes no difference, however an increase in number is associated with a perception of greater autonomy.

Chapter 2, Appendix E Statistical Analyses of Survey Results Page 2-44
Table 4. Grower assessment of autonomy with respect to the company and measures of grower dependency
251 - Feel free to complain252 - Feel free to go own way253 - Service person is a good judge 260 - Improvements worth it 261 - Particular vendors 262 - No contract unless new houses/improvements
Dependency Variables
N
Code 251
Code 252
Code 253
Code 260
Code 261
Code 262
% of Family Income Less Than 25% 25% - 49% 50% - 74% 75% or More
185 272 243 228
B 2.30 A 2.08 A 2.05
AB 2.23
A 2.46 A 2.43 A 2.41 A 2.39
B 2.13
AB 2.00 AB 2.03 A 1.97
A 2.47 A 2.37 A 2.33 A 2.41
A 2.73 B 2.95 B 2.93 B 2.97
A 2.09
AB 2.17 B 2.31 B 2.26
Total Farm Debt Under $50,000 $ 50,000 - $ 99,999 $100,000 - $199,999 $200,000 - $299,999 $300,000 or More
276 143 178 132 180
A 2.05
AB 2.24 B 2.31 A 2.04
AB 2.19
AB 2.40 AB 2.43
B 2.57 A 2.34
AB 2.43
A 1.95 A 1.97 B 2.19
AB 2.02 AB 2.06
AB 2.33
B 2.44 B 2.48 A 2.25 B 2.44
A 2.99 A 2.92 A 2.88 A 2.84 A 2.81
A 2.29 A 2.20 A 2.12 A 2.30 A 2.17
% of Debt is Broiler Less Than 25% 25% - 49% 50% - 74% 75% or More
217 84
105 472
A 2.00
AB 2.16 AB 2.12
B 2.25
A 2.36 A 2.48 A 2.43 A 2.46
A 1.95 A 2.12 A 2.07 A 2.05
A 2.30 A 2.37 A 2.40 A 2.42
A 2.94 A 2.92 A 2.88 A 2.87
A 2.34 A 2.18 A 2.24 A 2.16
50% Other Crops Yes No
136 820
A 2.20 A 2.13
A 2.41 A 2.42
A 2.07 A 2.01
A 2.43 A 2.38
A 2.82 A 2.91
A 2.13 A 2.22
Current Companies 1 2 3 4 5 or More Don’t Know
274 202 160 109 82
162
A 2.24 A 2.18 A 2.10 A 2.06 A 2.06 A 2.05
A 2.48 A 2.49 A 2.39 A 2.40 A 2.35 A 2.30
A 2.02 A 2.02 A 1.99 A 2.01 A 1.94 A 2.05
A 2.44 A 2.43 A 2.33 A 2.40 A 2.38 A 2.28
A 2.90 A 3.00 A 2.81 A 2.96 A 2.81 A 2.90
A 2.21 A 2.10 A 2.27 A 2.22 A 2.20 A 2.27
Number of Companies Offering Contracts Decreased Stayed the Same Increased
212 422 144
B 2.27 AB 2.16 A 1.99
A 2.49 A 2.45 A 2.41
B 2.12 AB 1.98 A 1.95
B 2.51 B 2.42 A 2.23
A 2.93 A 2.90 A 2.89
A 2.16 A 2.19 A 2.23

Chapter 2, Appendix E Statistical Analyses of Survey Results
Page 2-45
Growers’ attitudes and perceptions can be affected by uncertainty and fluctuations in their circumstances. A number of measures of change are identified in Table 5, where their association with the autonomy ratings is also described. If the number of flocks per year has increased, income exceeds expectations, or the contract has changed to increase income, growers are more likely to perceive a higher level of independence relative to the company. Likewise, if the number of companies offering contracts has increased, growers’ ratings of degree of autonomy are somewhat higher, particularly concerning the growers’ feelings of freedom to complain, feelings that the service person is a good judge of their work, and feelings that improvements are worthwhile. A change of companies by growers is not associated with perceptions of autonomy.
Table 5. Grower assessment of autonomy with respect to the company and measures of change
251 - Feel free to complain252 - Feel free to go own way253 - Service person is a good judge 260 - Improvements worth it 261 - Particular vendors 262 - No contract unless new houses/improvements
Change Variables N Code 251 Code 252 Code 253 Code 260 Code 261 Code 262
Number of Flocks per Year Gone Up Gone Down Gone Up & Down Stayed the Same
68 121 115 691
A 1.92 B 2.52 B 2.33 A 2.06
A 2.31 B 2.69
AB 2.52 A 2.36
A 1.85 C 2.24
BC 2.12 AB 1.97
A 2.08 C 2.74 C 2.61 B 2.32
C 3.17 A 2.67 A 2.69 B 2.95
B 2.35 A 1.94 A 1.99 B 2.27
Income Expectations More Than Expected About What Expected Less Than Expected
100 454 413
A 1.67 B 1.89 C 2.53
A 2.21 A 2.25 B 2.65
A 1.73 B 1.88 C 2.24
A 1.83 B 2.16 C 2.76
B 3.19 B 3.07 A 2.66
C 2.57 B 2.36 A 1.95
Contract Changed to Increase Pay Yes No Don’t Know
563 319 55
A 1.98 B 2.44 A 2.07
A 2.37 A 2.50 A 2.41
A 1.92 B 2.19 A 1.9
A 2.27 B 2.61 A 2.29
B 3.00 A 2.75 A 2.76
B 2.30 A 2.03 B 2.27
Number of Companies Offering Contracts Decreased Stayed the Same Increased
212 422 144
B 2.27 AB 2.16 A 1.99
A 2.49 A 2.45 A 2.41
B 2.12 AB 1.98 A 1.95
B 2.51 B 2.42 A 2.23
A 2.93 A 2.90 A 2.89
A 2.16 A 2.19 A 2.23
Changed Companies Yes No
303 689
A 2.06 A 2.17
A 2.42 A 2.42
A 1.98 A 2.02
A 2.41 A 2.37
A 2.89 A 2.91
A 2.20 A 2.21

Chapter 2, Appendix E Statistical Analyses of Survey Results Page 2-46
Difficulty Understanding the Terms of the Contract Relationship Four statements from Question 7 in Section 2 of the questionnaire represent the degree of difficulty or “hassle” involved in understanding the terms of the contract relationship. A lower score (more agreement) for the four statements represents less difficulty or hassle. Table 6 shows that growers with the highest cash flow experience fewer problems understanding the terms of their contract than those who lost money or earned less than $15,000. Since these will also typically be larger growers, it is not surprising that the number of flocks per year is also associated with more positive scores on some of these items. It also follows that growers ranked above average more often are significantly more likely to perceive company information helpful and to understand their settlement sheet. However, sheer size of operation is not a consistent indicator: small operators are significantly more likely than large growers to agree that their company provides helpful information but are less likely than large growers to understand their settlement sheet.
Table 6. The degree of difficulty involved in the contract relationships and measures of grower performance
250 - Helpful information 254 - Effort to understand contract 255 - Understand the terms of contract 256 - Understand settlement sheet
Performance Variables N Code 250 Code 254 Code 255 Code 256
Net cash Lost Money $ 0 - $14,999 $15,000 - $29,999 $30,000 - $44,999 $45,000 - $59,999 $60,000 & Up
81
329 274 152 42 36
C 2.23
BC 2.07 B 1.90 B 1.89 B 1.90 A 1.61
A 1.67 A 1.83 A 1.71 A 1.70 A 1.80 A 1.84
B 2.00 B 1.98
AB 1.84 AB 1.79 AB 1.95 A 1.74
D 2.51
CD 2.35 ABC 2.20
AB 2.04 BCD 2.29
A 1.94
Flocks/Year Less Than 5 5.0 - 5.9 6.0 - 6.9 7.0 or More
102 498 337 63
B 1.91 B 2.00 B 1.96 A 1.74
A 1.81 A 1.77 A 1.76 A 1.70
A 1.97 A 1.94 A 1.85 A 1.81
B 2.39 B 2.34 A 2.11 A 1.96
Houses/Farm 1 - 2 Houses 3 - 4 Houses 5 or More
335 426 222
AB 1.99 A 1.90 B 2.04
A 1.77 A 1.75 A 1.79
A 1.89 A 1.89 A 1.95
B 2.32
AB 2.20 A 2.17
Ranked Above 0 - 5 Times 6 - 10 Times
368 451
B 2.00 A 1.92
A 1.79 A 1.74
A 1.94 A 1.86
B 2.34 A 2.12

Chapter 2, Appendix E Statistical Analyses of Survey Results
Page 2-47
Table 7 describes the association between human and social capital measures and the degree of difficulty understanding the terms of the contract. The more highly educated growers are more likely to understand their contract and their settlement sheets. Women and growers over 60 are more likely to find company information helpful. However, no consistent pattern emerged with respect to grower experience. Members of the Contract Poultry Growers Association perceive greater difficulty in understanding settlement sheets than do growers belonging to Farm Bureau and not the Growers Association or not belonging to either of these organizations. Growers belonging to both the Growers Association and Farm Bureau perceived the greatest difficulty in understanding their contract terms.
Table 7. The degree of difficulty involved in the contract relationships and measures of grower human and social capital
250 - Helpful information 254 - Effort to understand contract 255 - Understand the terms of contract 256 - Understand settlement sheet
Human & Social Capital Variables
N
Code 250
Code 254
Code 255
Code 256
Education Grade School High School Trade/Technical Some 4-year Bachelor & Up
83
495 135 163 116
A 1.95 A 1.94 A 1.99 A 2.07 A 1.93
A 1.84 A 1.76 A 1.74 A 1.83 A 1.71
B 2.01
AB 1.90 B 1.98
AB 1.92 A 1.79
C 2.41
BC 2.29 C 2.41
AB 2.15 A 1.94
Gender Male Female
822 180
B 1.98 A 1.87
A 1.78 A 1.71
A 1.92 A 1.85
A 2.24 A 2.29
Years Growing 7 or Less 8 - 12 13 - 24 25 or More
213 251 328 206
A 2.01 A 1.95 A 1.99 A 1.90
A 1.74 A 1.80 A 1.74 A 1.79
A 1.82 B 1.97
AB 1.87 B 1.96
A 2.12 B 2.34
AB 2.23 AB 2.27
Age 40 & Under 41 - 50 51 - 60 Over 60
177 307 307 209
B 2.02 B 1.97 B 2.00 A 1.84
A 1.82 A 1.76 A 1.75 A 1.78
A 1.90 A 1.91 A 1.91 A 1.90
A 2.16 A 2.25 A 2.31 A 2.22
Organizations* Poultry Growers Farm Bureau Both Neither
93
311 92
447
B 2.10 A 1.90 B 2.15 A 1.94
A 1.76 A 1.79 A 1.69 A 1.78
A 1.88 A 1.91 B 2.10 A 1.87
B 2.47 A 2.24 B 2.52 A 2.15
* See Note accompanying Table 2

Chapter 2, Appendix E Statistical Analyses of Survey Results Page 2-48
Table 8 describes the relation between the items related to growers’ understanding of their contracts and various measures of work experience. Prior work experience has little impact on grower comprehension. Whether the operator or spouse has an off-farm job also shows no significant effect.
Table 8. The degree of difficulty involved in the contract relationships and measures of grower work experience
250 - Helpful information 254 - Effort to understand contract 255 - Understand the terms of contract 256 - Understand settlement sheet
Work Experience Variables
N
Code 250
Code 254
Code 255
Code 256
Farming Prior Job Yes No
368 642
A 1.97 A 1.96
A 1.77 A 1.76
A 1.93 A 1.89
A 2.28 A 2.22
Has Off-farm Job Yes No
360 624
A 2.01 A 1.93
A 1.79 A 1.75
A 1.92 A 1.89
A 2.27 A 2.22
Spouse Off-farm Job Yes No No Spouse
400 458 94
B 2.01
AB 1.96 A 1.87
A 1.79 A 1.75 A 1.79
A 1.91 A 1.90 A 1.95
A 2.27 A 2.21 A 2.32
Current Occupation Manager/Professional Tech/Sales/Support Farm/Forest/Broilers Precision/Repair Operators/Labor Other/None Listed
45 66 47 80 85 36
A 1.87 A 2.06 A 1.89 A 2.01 A 2.07 A 2.14
A 1.83 A 1.72 A 1.78 A 1.78 A 1.67 B 2.21
A 1.88 A 1.81 A 1.83
AB 1.95 AB 1.93
B 2.19
A 1.94
AB 2.09 AB 2.15 BC 2.38 BC 2.36 C 2.70

Chapter 2, Appendix E Statistical Analyses of Survey Results
Page 2-49
Table 9 describes the association between being dependent on the company and the level of perceived difficulty in understanding the contract and settlement sheet. One of the key items in this table—the growers’ perceptions of understanding their contracts—is unaffected by any of the dependency measures, except the change in number of companies where a decrease is associated with reports of less understanding. Growers’ assessment of their level of comprehension of their settlement sheets is not associated in a systematic way with farm debt. Growers whose family income is very dependent on broilers do make more of an effort to understand the terms of their contract. The more companies operating in the growers’ area, the more likely it is that growers describe their company as giving helpful information. Growers who report having five or more companies in their area are the most likely to report that they understand their settlement sheet, but the group reporting the lowest level of comprehension is not those with one company but those with three.

Chapter 2, Appendix E Statistical Analyses of Survey Results Page 2-50
Table 9. The degree of difficulty involved in the contract relationships and measures of dependency
250 - Helpful information 254 - Effort to understand contract 255 - Understand the terms of contract 256 - Understand settlement sheet
Dependency Variables N Code 250 Code 254 Code 255 Code 256
% of Family Income Less Than 25% 25% - 49% 50% - 74% 75% or More
185 272 243 228
A 2.03 A 1.96 A 1.92 A 1.98
B 1.83
AB 1.80 AB 1.75 A 1.68
A 1.96 A 1.90 A 1.90 A 1.85
A 2.28 A 2.26 A 2.29 A 2.16
Total Farm Debt Under $50,000 $ 50,000 - $ 99,999 $100,000 - $199,999 $200,000 - $299,999 $300,000 or More
276 143 178 132 180
A 1.87
AB 1.94 C 2.10
AB 1.93 BC 2.05
A 1.76 A 1.77 A 1.76 A 1.77 A 1.77
A 1.86 A 1.98 A 1.93 A 1.92 A 1.91
A 2.15 B 2.37 B 2.36
AB 2.27 AB 2.19
% of Debt is Broiler Less Than 25% 25% - 49% 50% - 74% 75% or More
217 84
105 472
A 1.86 A 1.97 A 1.98 A 2.01
A 1.81 A 1.75 A 1.71 A 1.76
A 1.88 A 1.81 A 1.88 A 1.93
A 2.13 A 2.32 A 2.30 A 2.29
50% Other Crops Yes No
136 820
A 2.06 A 1.95
A 1.83 A 1.74
A 1.85 A 1.90
A 2.30 A 2.23
Current Companies 1 2 3 4 5 or More Don’t Know
274 202 160 109 82
162
B 2.05
AB 1.96 AB 1.97 AB 1.92 A 1.85
AB 1.90
AB 1.76 AB 1.78 AB 1.79 A 1.64
AB 1.72 B 1.81
A 1.93 A 1.84 A 1.96 A 1.83 A 1.90 A 1.93
AB 2.24 AB 2.25
B 2.33 AB 2.10 A 2.09
AB 2.30
Number of Companies Offering Contracts Decreased Stayed the Same Increased
212 422 144
A 2.04 A 1.98 A 1.93
A 1.77 A 1.74 A 1.78
B 2.00 A 1.87 A 1.85
A 2.28 A 2.19 A 2.28

Chapter 2, Appendix E Statistical Analyses of Survey Results
Page 2-51
Table 10 looks at the association between the various measures of change and the growers’ degree of difficulty understanding their contracts and settlement sheets. A pattern is clearly evident here, since changes that benefit the grower are associated with more reported comprehension of contracts and settlement sheets. Thus, growers who report that their flock numbers have gone up are more likely to agree that the company gives helpful information and more likely to report that they understand settlement sheets. Growers whose incomes are more than they expected are more likely to rate company information as helpful and, together with growers whose income is about what they expected, more likely (than those whose income fell short), to report that they understand contracts and settlement sheets. Growers whose contracts had been altered to improve their pay were, again, more likely to rate company information as helpful, and more likely to report that they understand their contracts and settlement sheets. Whether a grower has changed companies is not related to these items.
Table 10. The degree of difficulty involved in the contract relationships and measures of change
250 - Helpful information 254 - Effort to understand contract 255 - Understand the terms of contract 256 - Understand settlement sheet
Change Variables N Code 250 Code 254 Code 255 Code 256
Number of Flocks per Year Gone Up Gone Down Gone Up & Down Stayed the Same
68 121 115 691
A 1.89 BC 2.07 C 2.21 B 1.91
A 1.74 A 1.71 A 1.69 A 1.80
A 1.85 A 1.97 A 1.85 A 1.91
A 2.11 B 2.40
AB 2.31 AB 2.22
Income Expectations More Than Expected About What Expected Less Than Expected
100 454 413
A 1.64 B 1.82 C 2.20
A 1.70 A 1.77 A 1.76
A 1.75 A 1.80 B 2.04
A 1.89 A 2.02 B 2.57
Contract Changed to Increase Pay Yes No Don’t Know
563 319 55
A 1.87 B 2.13
AB 2.00
A 1.75 A 1.76 A 1.77
A 1.83 B 2.00 A 1.84
A 2.12 B 2.42 B 2.38
Changed Companies Yes No
303 689
A 1.92 A 1.98
A 1.80 A 1.75
A 1.94 A 1.89
A 2.26 A 2.23

Chapter 2, Appendix E Statistical Analyses of Survey Results Page 2-52
Growers Assess Risks and Rewards The following five tables detail the relationships between growers’ characteristics and four measures of how growers see the relation between risks and rewards in contract growing. Perception that the ranking method of payment is a good incentive implies that the quality of inputs supplied by the company is consistent across growers. The statement “My pay depends more on the quality of chicks and feed supplied by the company than on the quality of my work” implies the opposite.
Table 11 shows relationships of the four measures to grower performance variables. Net cash flow from the broiler operation is clearly related to favorable perceptions of the risk-reward relationship. Respondents with the highest cash flow (5% of growers surveyed) are more likely to see the ranking method as a good incentive and more likely to think their own work is more important than the quality of chicks they receive. Growers having more flocks per year are somewhat more likely to believe that the ranking system is a good incentive and are least likely to believe that company employees are in their growout groups. On the other hand, larger operators are more likely to perceive their pay as dependent on quality of inputs than on their work, contrary to that indicated by the cash flow relationship. As expected, the growers more often ranked above average are more likely to see ranking as a good incentive and see pay as less dependent on inputs.

Chapter 2, Appendix E Statistical Analyses of Survey Results
Page 2-53
Table 11. Grower assessment of risk and measures of grower performance
257 - Ranking method is good incentive 258 - Pay depends more on chicks & feed than work 263 - Employees should not be group 291 - Employees are in my group
Performance Variables N Code 257 Code 258 Code 263 Code 291
Net cash Lost Money $ 0 - $14,999 $15,000 - $29,999 $30,000 - $44,999 $45,000 - $59,999 $60,000 & Up
81
329 274 152 42 36
D 3.08 C 2.74
BC 2.58 BC 2.44
B 2.28 A 1.98
A 1.47 B 1.73
AB 1.71 AB 1.66 AB 1.72
C 2.27
A 1.67 A 1.82 A 1.80 A 1.92 A 1.80 B 2.20
A 2.56
AB 2.68 AB 2.84 AB 2.85
B 3.07 AB 2.67
Flocks/Year Less Than 5 5.0 - 5.9 6.0 - 6.9 7.0 or More
102 498 337 63
AB 2.53
B 2.69 AB 2.56 A 2.36
A 1.79 A 1.69 A 1.70 A 1.64
A 1.98 A 1.78 A 1.86 A 1.87
A 2.66
AB 2.79 A 2.69 B 3.03
Houses/Farm 1 - 2 Houses 3 - 4 Houses 5 or More
335 426 222
A 2.59 A 2.59 A 2.69
B 1.76
AB 1.68 A 1.64
A 1.87 A 1.85 A 1.75
A 2.57 B 2.83 B 2.86
Ranked Above 0 - 5 Times 6 - 10 Times
368 451
B 2.83 A 2.41
B 1.83 A 1.58
B 1.96 A 1.69
B 2.87 A 2.67
Table 12 describes the association between social and human capital characteristics and growers’ assessment of the risk-reward relationship in contract growing. No clear patterns emerge from these data. With respect to education, for example, the growers most supportive of the ranking method are those whose education is limited to grade school, while the growers who are least supportive of the ranking system are those whose highest level of education was technical or trade school. As far as age is concerned, the ranking method gets its strongest approval from growers over 60, but years growing makes no difference, nor does gender or experience. Farm Bureau members are more likely to view the ranking method most favorably. The idea that pay depends more on quality of chicks than quality of work finds its strongest agreement among middle-aged growers, growers with some four-year college education, and growers who are members of both the Farm Bureau and the Contract Poultry Growers Association. Growers who belong to both of these organizations are also more likely to disapprove of company employees being in their growout group.

Chapter 2, Appendix E Statistical Analyses of Survey Results Page 2-54
Table 12. Grower assessment of risk and measures of grower human and social capital
257 - Ranking method is good incentive 258 - Pay depends more on chicks & feed than work 263 - Employees should not be group 291 - Employees are in my group
Human & Social Capital Variables
N
Code 257
Code 258
Code 263
Code 291
Education Grade School High School Trade/Technical Some 4-year Bachelor & Up
83
495 135 163 116
A 2.45
AB 2.59 B 2.76
AB 2.69 AB 2.56
A 1.71 A 1.72 A 1.67 A 1.62 A 1.73
A 1.98 A 1.83 A 1.84 A 1.76 A 1.84
A 2.44
AB 2.76 A 2.64 B 3.00
AB 2.72
Gender Male Female
822 180
A 2.63 A 2.53
A 1.69 A 1.73
A 1.82 A 1.88
A 2.78 A 2.66
Years Growing 7 or Less 8 - 12 13 - 24 25 or More
213 251 328 206
A 2.52 A 2.68 A 2.66 A 2.53
A 1.77 A 1.63 A 1.72 A 1.69
A 1.90 A 1.75 A 1.84 A 1.85
B 2.89 B 2.84 A 2.57
AB 2.80
Age 40 & Under 41 - 50 51 - 60 Over 60
177 307 307 209
B 2.66 B 2.69
AB 2.59 A 2.46
AB 1.73 A 1.64 A 1.66 B 1.89
A 1.80 A 1.83 A 1.82 A 1.88
B 3.05 A 2.63 A 2.76 A 2.69
Organizations* Poultry Growers Farm Bureau Both Neither
93
311 92
447
B 2.91 A 2.51 B 3.02 A 2.51
B 1.65 B 1.74 A 1.48 B 1.71
A 1.62 B 1.82 A 1.59 B 1.93
A 2.75 A 2.71 A 2.72 A 2.78
*See Note accompanying Table 2
Table 13 reports the association between work experience and the risk-reward assessment variables. The ranking method receives strongest support from growers who work full time on the farm, though the average value of the responses even for these growers indicates greater disapproval than approval. Of those who work off the farm, those who have managerial or professional jobs or who have jobs in the agricultural sector are the most likely to believe that their own efforts, rather than the quality of their inputs, makes the most difference to their pay, though the average value for these responses lies between “agree” and “strongly” agree that company inputs are more important. Those who have technical or manual jobs off the farm are the most likely to think that the quality of chicks is more important. Spouse’s off-farm job is unrelated to the assessment of risk.

Chapter 2, Appendix E Statistical Analyses of Survey Results
Page 2-55
Table 13. Grower assessment of risk and measures of grower work experience
257 - Ranking method is good incentive 258 - Pay depends more on chicks & feed than work 263 - Employees should not be group 291 - Employees are in my group
Work Experience Variables
N Code 257 Code 258 Code 263 Code 291
Farming Prior Job Yes No
368 642
A 2.66 A 2.58
A 1.68 A 1.71
A 1.84 A 1.82
A 2.70 A 2.79
Has Off-farm Job Yes No
360 624
B 2.69 A 2.56
A 1.65 A 1.73
A 1.83 A 1.84
A 2.79 A 2.72
Spouse Off-farm Job Yes No No Spouse
400 458 94
B 2.73
AB 2.58 A 2.46
A 1.65 A 1.73 A 1.74
A 1.81 A 1.83 A 1.97
A 2.70 A 2.80 A 2.73
Current Occupation Manager/Professional Tech/Sales/Support Farm/Forest/Broilers Precision/Repair Operators/Labor Other/None Listed
45 66 47 80 85 36
A 2.33 B 2.76
AB 2.56 B 2.95
AB 2.72 AB 2.56
CD 1.87
ABC 1.63 D 1.95
AB 1.54 A 1.46
BCD 1.76
A 1.99 A 1.74 A 1.98 A 1.72 A 1.85 A 1.75
A 2.69 A 2.89 A 2.86 A 2.80 A 2.74 A 2.76
Table 14 reports the association between assessment of risk and various items describing the financial dependency of the grower. Percent of family income derived from the broiler operation has no significant impact on assessment of risk. Growers with the least farm debt are most likely to agree that ranking is a good incentive. Those with farm debt levels of $100,000 or more are somewhat more reluctant to have company employees in their growout group. Lower broiler debt as percent of farm debt is associated with greater agreement that ranking is a good incentive. Competition among companies appears to leave growers more favorably disposed to ranking as an incentive.

Chapter 2, Appendix E Statistical Analyses of Survey Results Page 2-56
Table 14. Grower assessment of risk and measures of grower dependency
257 - Ranking method is good incentive 258 - Pay depends more on chicks & feed than work 263 - Employees should not be group 291 - Employees are in my group
Dependency Variables N Code 257 Code 258 Code 263 Code 291
% of Family Income Less Than 25% 25% - 49% 50% - 74% 75% or More
185 272 243 228
A 2.74 A 2.61 A 2.59 A 2.58
A 1.70 A 1.70 A 1.68 A 1.75
A 1.76 A 1.89 A 1.82 A 1.80
A 2.70 A 2.73 A 2.71 A 2.93
Total Farm Debt Under $50,000 $ 50,000 - $ 99,999 $100,000 - $199,999 $200,000 - $299,999 $300,000 or More
276 143 178 132 180
A 2.45 B 2.71 B 2.70
AB 2.61 B 2.74
A 1.76 A 1.74 A 1.68 A 1.68 A 1.66
B 1.93 B 1.93 A 1.69
AB 1.88 AB 1.73
AB 2.73 AB 2.79 A 2.55
AB 2.72 B 3.00
% of Debt Is Broiler Less Than 25% 25% - 49% 50% - 74% 75% or More
217 84
105 472
A 2.42
AB 2.51 B 2.70 B 2.74
A 1.74 A 1.77 A 1.64 A 1.68
A 1.91 A 1.77 A 1.80 A 1.79
A 2.75 A 2.59 A 2.64 A 2.81
50% Other Crops Yes No
136 820
A 2.74 A 2.59
A 1.68 A 1.71
A 1.92 A 1.82
A 2.58 A 2.79
Current Companies 1 2 3 4 5 or More Don’t Know
274 202 160 109 82
162
B 2.72
AB 2.63 AB 2.60 AB 2.51 A 2.39
AB 2.58
ABC 1.72
AB 1.61 A 1.59 C 1.83
ABC 1.74 BC 1.79
A 1.80 A 1.81 A 1.85 A 1.82 A 1.90 A 1.86
B 2.86
AB 2.71 AB 2.69
B 2.86 A 2.40 B 2.80
Number of Companies Offering Contracts Decreased Stayed the Same Increased
212 422 144
A 2.62 A 2.64 A 2.58
A 1.69 A 1.71 A 1.58
A 1.81 A 1.83 A 1.84
A 2.66 A 2.80 A 2.71

Chapter 2, Appendix E Statistical Analyses of Survey Results
Page 2-57
Table 15 describes how the growers’ assessment of risk is related to changes in their situations. Those experiencing a constant or increasing number of flocks per year view ranking more positively and are more likely to agree that their pay reflects their own effort rather than the quality of chicks and feed with which they are provided. Similarly, higher income relative to expectations is associated with a greater likelihood of agreement that ranking is a good incentive and with a greater likelihood of agreement that pay is more the result of the grower’s effort than input quality. Growers receiving less than expected are more likely to believe that company employees should not be in the same growout group as others and, together with growers earning about what they expected, are more likely to believe that company employees are in their group. A contract change resulting in a pay increase is also associated with a greater likelihood of a positive view of the ranking method.
Table 15. Grower assessment of risk and measures of change
257 - Ranking method is good incentive 258 - Pay depends more on chicks & feed than work 263 - Employees should not be group 291 - Employees are in my group
Change Variables N Code 257 Code 258 Code 263 Code 291
Number of Flocks per Year Gone Up Gone Down Gone Up & Down Stayed the Same
68 121 115 691
A 2.52 B 3.09 B 2.86 A 2.50
B 1.78 A 1.55 A 1.57
AB 1.74
A 1.81 A 1.72 A 1.67 A 1.87
A 2.87 A 2.75 A 2.83 A 2.74
Income Expectations More Than Expected About What Expected Less Than Expected
100 454 413
A 1.90 B 2.32 C 3.09
C 2.03 B 1.81 A 1.50
B 2.13 B 1.97 A 1.61
B 3.19 A 2.77 A 2.62
Contract Changed to Increase Pay Yes No Don’t Know
563 319 55
A 2.48 B 2.88 A 2.48
A 1.73 A 1.67 A 1.79
A 1.89 A 1.75 A 1.88
A 2.86 A 2.63 A 2.66
Changed Companies Yes No
303 689
A 2.55 A 2.64
A 1.70 A 1.70
A 1.87 A 1.82
A 2.66 A 2.79

Chapter 2, Appendix E Statistical Analyses of Survey Results Page 2-58
Grower Reports on the Quality of Their Interactions with Their Company Tables 16-20 describe the relationships between six measures of the quality of the interaction between grower and company and grower/operation characteristics. Response scores indicate the frequency (always to never) with which the statement holds true for the respondent, where a low score is “always” and a high score is “never.”
Table 16 describes the relation between grower performance measures and grower reports on interactions between them and their company. Overall, net cash flow is positively associated with reports of more favorable and supportive relations. Higher income growers are more likely to report a responsive company management and good quality service from the fieldman. Growers averaging seven or more flocks were also more likely to rate their company management and fieldmen highly. The number of houses on the operation shows little association but an anomalous significant difference with respect to receiving a satisfactory explanation for condemnation rate. One might expect the larger grower to receive more attention from the company, but the frequency of satisfactory explanations reported by larger growers was lower. Those who more often rank above average were more likely to view the relationship with their company more positively than those more often ranking below average.

Chapter 2, Appendix E Statistical Analyses of Survey Results
Page 2-59
Table 16. Quality of the interaction between grower and company and measures of grower performance
270 - Management responds to complaints 271 - Service person lets me know about visits 272 - Service person takes time to help me 275 - Service person keeps promises 276 - Service person is hard to contact 286 - Satisfactory explanation about condemnation rate
Performance Variables N Code 270 Code 271 Code 272 Code 275 Code 276 Code 286
Net Cash Lost Money $ 0 - $14,999 $15,000 - $29,999 $30,000 - $44,999 $45,000 - $59,999 $60,000 & Up
81
329 274 152 42 36
C 3.13 B 2.75 B 2.66 B 2.58
AB 2.44 A 2.19
B 4.47 B 4.26 B 4.26 B 4.31 B 4.20 A 3.81
C 2.64
BC 2.34 B 2.19 B 2.11 B 2.02 A 1.80
D 2.49
CD 2.23 BC 2.14
ABC 2.11 AB 1.88 A 1.82
A 3.57 A 3.63 A 3.68 A 3.74 A 3.93 A 3.82
C 2.95 B 2.61 B 2.49 B 2.52 B 2.46 A 2.03
Flocks/Year Less Than 5 5.0 - 5.9 6.0 - 6.9 7.0 or More
102 498 337 63
B 2.61 B 2.75 B 2.67 A 2.24
A 3.92 B 4.29 B 4.32
AB 4.14
AB 2.12
B 2.30 AB 2.18 A 1.98
B 2.10 B 2.19 B 2.16 A 1.86
A 3.83 A 3.64 A 3.70 A 3.78
B 2.45 B 2.69 B 2.45 A 2.06
Houses/Farm 1 - 2 Houses 3 - 4 Houses 5 or More
335 426 222
A 2.70 A 2.62 A 2.76
A 4.30 A 4.21 A 4.27
A 2.29 A 2.15 A 2.24
A 2.22 A 2.10 A 2.14
A 3.59 B 3.78
AB 3.64
A 2.48
AB 2.53 B 2.68
Ranked Above 0 - 5 Times 6 -10 Times
368 451
B 2.83 A 2.58
A 4.26 A 4.28
B 2.35 A 2.15
B 2.24 A 2.11
A 3.61 A 3.75
B 2.66 A 2.46
Table 17 describes the relation between human and social capital variables and the quality of the grower’s interaction with the company. These variables are less consistently related than the performance items. Women are more likely to report positive relations than are men. Grower years of experience shows no significant effect. Older respondents are more likely to report higher quality interactions. Growers who are members of Farm Bureau and not the Contract Poultry Growers Association, or who are members of neither organization, are most likely to report better quality interactions with the company.

Chapter 2, Appendix E Statistical Analyses of Survey Results Page 2-60
Table 17. Quality of the interaction between grower and company and measures of grower human and social capital
270 - Management responds to complaints 271 - Service person lets me know about visits 272 - Service person takes time to help me 275 - Service person keeps promises 276 - Service person is hard to contact 286 - Satisfactory explanation about condemnation rate
Human & Social Capital Variables
N Code 270 Code 271 Code 272 Code 275 Code 276 Code 286
Education Grade School High School Trade/Technical Some 4-year Bachelor & Up
83
495 135 163 116
AB 2.64A 2.56 A 2.84
AB 2.81 B 2.84
A 4.21 A 4.23 A 4.14 A 4.35 A 4.32
A 2.07 AB 2.17 AB 2.27
B 2.36 AB 2.30
A 2.05 A 2.13 A 2.16 A 2.14 A 2.29
A 3.69 A 3.69 A 3.73 A 3.62 A 3.67
A 2.48 A 2.51 A 2.56 A 2.73 A 2.51
Gender Male Female
822 180
B 2.74 A 2.39
A 4.27 A 4.15
B 2.26 A 2.03
A 2.16 A 2.10
A 3.66 A 3.78
B 2.58 A 2.41
Years Growing 7 or Less 8 - 12 13 - 24 25 or More
213 251 328 206
A 2.65 A 2.63A 2.73A 2.66
A 4.16 A 4.25A 4.32A 4.22
A 2.28 A 2.17A 2.23A 2.17
A 2.08 A 2.07 A 2.24 A 2.14
A 3.66 A 3.72 A 3.68 A 3.66
A 2.52 A 2.56A 2.55A 2.52
Age 40 & Under 41 - 50 51 - 60 Over 60
177 307 307 209
B 2.70 B 2.74B 2.71A 2.50
AB 4.25 AB 4.22
B 4.35A 4.15
B 2.36 B 2.27B 2.21A 2.06
AB 2.11
B 2.19 B 2.22 A 2.01
A 3.62 A 3.79 A 3.68 A 3.58
A 2.64 A 2.60A 2.48A 2.48
Organizations* Poultry Growers Farm Bureau Both Neither
93
311 92
447
B 3.05A 2.51 B 3.05A 2.63
A 4.37A 4.23 A 4.27A 4.25
B 2.54A 2.17 B 2.43A 2.18
B 2.43 A 2.13 B 2.43 A 2.06
A 3.33 B 3.71 A 3.47 B 3.76
B 2.74A 2.50 B 2.76A 2.50
* See note accompanying Table 2

Chapter 2, Appendix E Statistical Analyses of Survey Results
Page 2-61
Table 18 describes the relation between work experience and the quality of interaction with the company. Growers who farmed prior to broiler growing are more likely to say that the service person lets them know ahead of time about his visits, as are growers who currently work full time on the farm and do not have an off-farm job. Full-time farmers are also more likely to say that their service person takes time to help them. Those whose off-farm job is a managerial or professional one are more likely to report that the company responds helpfully to their complaints. Those with no prior farm experience are more likely to be satisfied with the company’s explanation about condemnation rates.
Table 18. Quality of the interaction between grower and company and measures of grower work experience
270 - Management responds to complaints 271 - Service person lets me know about visits 272 - Service person takes time to help me 275 - Service person keeps promises 276 - Service person is hard to contact 286 - Satisfactory explanation about condemnation rate
Work Experience Variables
N
Code 270
Code 271
Code 272
Code 275
Code 276
Code 286
Farming Prior Job Yes No
368 642
A 2.72A 2.65
A 4.13B 4.32
A 2.26A 2.19
A 2.20 A 2.11
A 3.65 A 3.70
A 2.64B 2.50
Has Off-farm Job Yes No
360 624
A 2.74A 2.63
B 4.36A 4.18
B 2.33A 2.15
A 2.21 A 2.11
A 3.64 A 3.72
A 2.59A 2.52
Spouse Off-farm Job Yes No No Spouse
400 458 94
A 2.74A 2.66A 2.60
B 4.29B 4.27A 4.06
B 2.35AB 2.17A 2.07
A 2.21 A 2.13 A 2.07
A 3.64 A 3.71 A 3.72
A 2.61A 2.54A 2.48
Current Occupation Manager/Professional Tech/Sales/Support Farm/Forest/Broilers Precision/Repair Operators/Labor Other/None Listed
45 66 47 80 85 36
A 2.37B 2.79
AB 2.60B 2.97
AB 2.75B 2.81
A 4.27A 4.38A 4.35A 4.33A 4.51A 4.12
A 2.32A 2.33A 2.13A 2.27A 2.56A 2.20
A 1.97 A 2.31 A 2.18 A 2.16 A 2.31 A 2.24
A 3.44 A 3.78 A 3.61 A 3.73 A 3.53 A 3.66
A 2.44A 2.44A 2.39A 2.66A 2.78A 2.67

Chapter 2, Appendix E Statistical Analyses of Survey Results Page 2-62
Table 19 describes the relation between quality of interaction with the company and the measures of grower dependency on the company. The most dependent under the income measure are those who derive 75% or more of their family income from broiler growing. These growers are more likely than those whose corresponding proportion is less than 25% to report that the service person is hard to contact, but they are distinctive in no other way in this table. Growers who reported that the number of companies in their area increased, indicating greater independence, were somewhat more likely to report that the company service person keeps promises with greater frequency. Growers whose broiler-related debt amounted to less than 25% of total farm debt, again suggesting greater independence, were most likely to be satisfied with explanations of condemnation rates. Other than this, there is no clear pattern in the results relating dependency to quality of interactions.
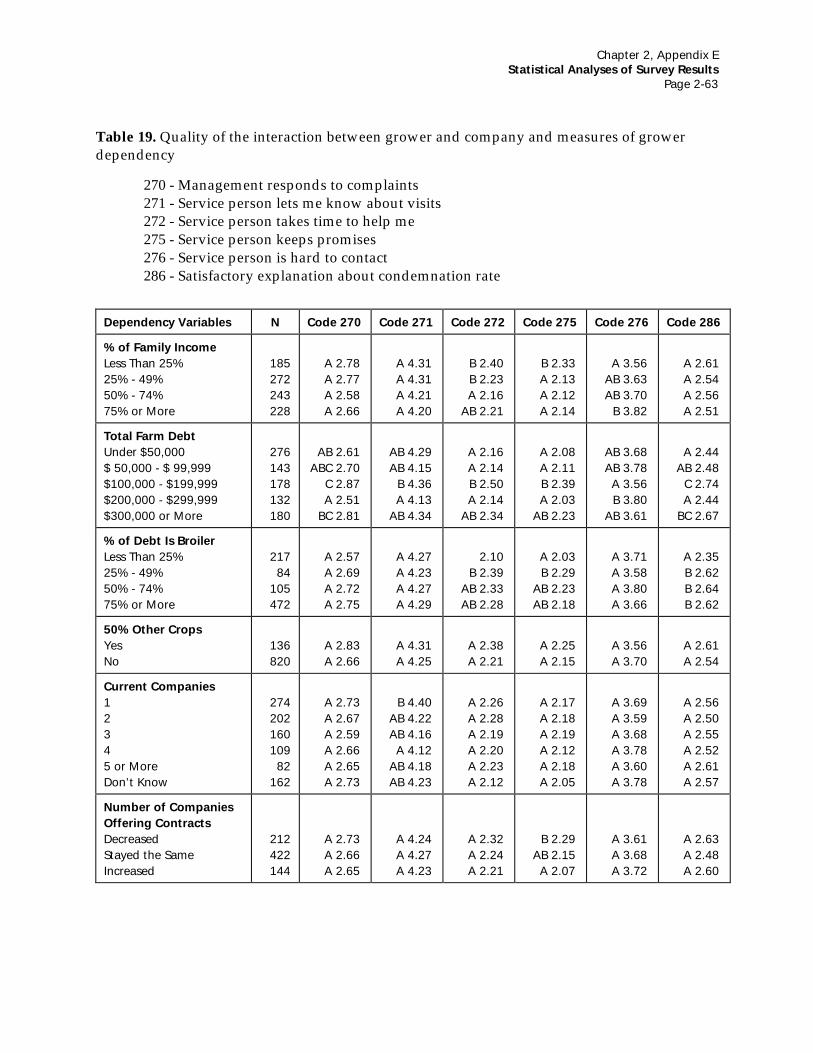
Chapter 2, Appendix E Statistical Analyses of Survey Results
Page 2-63
Table 19. Quality of the interaction between grower and company and measures of grower dependency
270 - Management responds to complaints 271 - Service person lets me know about visits 272 - Service person takes time to help me 275 - Service person keeps promises 276 - Service person is hard to contact 286 - Satisfactory explanation about condemnation rate
Dependency Variables N Code 270 Code 271 Code 272 Code 275 Code 276 Code 286
% of Family Income Less Than 25% 25% - 49% 50% - 74% 75% or More
185 272 243 228
A 2.78A 2.77A 2.58A 2.66
A 4.31A 4.31A 4.21A 4.20
B 2.40B 2.23A 2.16
AB 2.21
B 2.33 A 2.13 A 2.12 A 2.14
A 3.56
AB 3.63 AB 3.70
B 3.82
A 2.61A 2.54A 2.56A 2.51
Total Farm Debt Under $50,000 $ 50,000 - $ 99,999 $100,000 - $199,999 $200,000 - $299,999 $300,000 or More
276 143 178 132 180
AB 2.61ABC 2.70
C 2.87A 2.51
BC 2.81
AB 4.29AB 4.15
B 4.36A 4.13
AB 4.34
A 2.16A 2.14B 2.50A 2.14
AB 2.34
A 2.08 A 2.11 B 2.39 A 2.03
AB 2.23
AB 3.68 AB 3.78 A 3.56 B 3.80
AB 3.61
A 2.44AB 2.48
C 2.74A 2.44
BC 2.67
% of Debt Is Broiler Less Than 25% 25% - 49% 50% - 74% 75% or More
217 84
105 472
A 2.57A 2.69A 2.72A 2.75
A 4.27A 4.23A 4.27A 4.29
2.10B 2.39
AB 2.33AB 2.28
A 2.03 B 2.29
AB 2.23 AB 2.18
A 3.71 A 3.58 A 3.80
A 3.66
A 2.35B 2.62B 2.64B 2.62
50% Other Crops Yes No
136 820
A 2.83A 2.66
A 4.31A 4.25
A 2.38A 2.21
A 2.25 A 2.15
A 3.56 A 3.70
A 2.61A 2.54
Current Companies 1 2 3 4 5 or More Don’t Know
274 202 160 109 82
162
A 2.73A 2.67A 2.59A 2.66A 2.65A 2.73
B 4.40AB 4.22AB 4.16A 4.12
AB 4.18AB 4.23
A 2.26A 2.28A 2.19A 2.20A 2.23A 2.12
A 2.17 A 2.18 A 2.19 A 2.12 A 2.18 A 2.05
A 3.69 A 3.59 A 3.68 A 3.78 A 3.60 A 3.78
A 2.56A 2.50A 2.55A 2.52A 2.61A 2.57
Number of Companies Offering Contracts Decreased Stayed the Same Increased
212 422 144
A 2.73A 2.66A 2.65
A 4.24A 4.27A 4.23
A 2.32A 2.24A 2.21
B 2.29 AB 2.15 A 2.07
A 3.61 A 3.68 A 3.72
A 2.63A 2.48A 2.60

Chapter 2, Appendix E Statistical Analyses of Survey Results Page 2-64
Table 20 describes the relation between quality of interaction with the company and the variables measuring changes in the grower’s situation. Growers whose flock numbers had remained stable or who had received an increase in the number of flocks per year viewed their interactions with their company more positively. Likewise, the higher the growers’ incomes relative to expectations, the more favorably the reports on the interactions. Experiencing a recent change in contract that increased pay also is associated with a positive contract relationship. Growers who had not changed companies were more likely than growers who had changed to indicate that their service person frequently keeps promises.
Table 20. Quality of the interaction between grower and company and measures of change
270 - Management responds to complaints 271 - Service person lets me know about visits 272 - Service person takes time to help me 275 - Service person keeps promises 276 - Service person is hard to contact 286 - Satisfactory explanation about condemnation rate
Change Variables N Code 270 Code 271 Code 272 Code 275 Code 276 Code 286
Number of Flocks per Year Gone Up Gone Down Gone Up & Down Stayed the Same
68 121 115 691
A 2.39B 3.06B 3.03A 2.58
A 4.23A 4.37A 4.33A 4.22
A 2.05B 2.48B 2.49A 2.15
A 2.02 B 2.32 B 2.43 A 2.08
B 3.74 AB 3.54 A 3.37 B 3.75
A 2.28C 2.87
BC 2.69AB 2.50
Income Expectations More Than Expected About What Expected Less Than Expected
100 454 413
A 2.09B 2.34C 3.18
A 4.07A 4.14B 4.42
A 1.75B 2.01C 2.59
A 1.73 B 1.95 C 2.47
B 3.95 B 3.83 A 3.45
A 2.03B 2.28C 2.96
Contract Changed to Increase Pay Yes No Don’t Know
563 319 55
A 2.52 B 2.98A 2.61
A 4.20A 4.34A 4.20
A 2.13B 2.43A 2.12
A 2.04 B 2.35
AB 2.13
A 3.77 A 3.51 A 3.73
A 2.36B 2.88A 2.52
Changed Companies Yes No
303 689
A 2.66A 2.69
A 4.22A 4.26
A 2.22A 2.22
B 2.25 A 2.10
A 3.69 A 3.68
A 2.60A 2.52

Chapter 2, Appendix E Statistical Analyses of Survey Results
Page 2-65
Grower Assessment of Chicks as Input and Output Tables 21-25 relate to the quality of chicks, their delivery, and determination of pay weight. The associations between the six variables in this set and the grower performance variables are shown in Table 21. Chick quality and the related variables are key determinants of grower income. Increasing levels of net cash flow are associated with increasing perceptions of frequently receiving good quality, accurately counted chicks and frequently having birds picked up on schedule. Growers receiving seven or more flocks per year are more likely than those receiving 5.0 to 5.9 flocks a year to report prompt delivery of birds, and the same comparison yields similar differences in reports on chick quality. Differences in quality ratings associated with size of operation are not consistent with those associated with cash flow. One would expect income to be related to the number of houses, but growers with larger operations were more likely to report a lower frequency of desirable attributes and more of the undesirable. Growers ranked above average consistently report higher frequencies of desired attributes and lower frequencies of the undesirable.
Table 21. Grower assessment of the quality of the chicks and measures of grower performance
278 - Chicks are delivered when promised 279 - Good quality chicks are delivered 280 - The chick count is accurate 281 - Birds are picked up as scheduled 282 - Birds are weighed promptly at plant 283 - My weight tickets are machine stamped
Performance Variables N Code 278 Code 279 Code 280 Code 281 Code 282 Code 283
Net Cash Lost Money $ 0 - $14,999 $15,000 - $29,999 $30,000 - $44,999 $45,000 - $59,999 $60,000 & Up
81
329 274 152 42 36
D 2.03
CD 1.84 CD 1.84 BC 1.72 A 1.45
AB 1.52
C 2.96
BC 2.74 B 2.64
AB 2.53 AB 2.52 A 2.31
C 2.56 B 2.22 B 2.24
AB 2.10 A 1.94 A 1.95
B 2.03
AB 1.91 AB 1.93 AB 1.89 A 1.71 A 1.69
B 2.04 A 1.81 A 1.77 A 1.82 A 1.61 A 1.72
B 1.83 B 1.62
AB 1.53 AB 1.54
B 1.60 A 1.26
Flocks/Year Less Than 5 5.0 - 5.9 6.0 - 6.9 7.0 or More
102 498 337 63
AB 1.76
B 1.89 AB 1.71 A 1.59
AB 2.57
B 2.73 AB 2.60 A 2.42
AB 2.17
B 2.28 AB 2.09 A 2.03
A 1.84 B 2.02 A 1.77 A 1.70
B 1.77 B 1.86 B 1.77 A 1.61
A 1.56 A 1.60 A 1.56 A 1.40
Houses/Farm 1 - 2 Houses 3 - 4 Houses 5 or More
335 426 222
A 1.75
AB 1.79 B 1.90
A 2.63 A 2.68 A 2.64
A 2.15 A 2.20 A 2.23
A 1.80 A 1.88 B 2.10
A 1.79 A 1.79 A 1.87
AB 1.60 A 1.50 B 1.68
Ranked Above 0 - 5 Times 6 -10 Times
368 451
A 1.83 A 1.79
B 2.79 A 2.54
B 2.30 A 2.12
B 1.97 A 1.86
A 1.84 A 1.78
B 1.68 A 1.51
Chapter 2, Appendix E Statistical Analyses of Survey Results Page 2-66
Table 22 describes the association between the growers’ assessments of chick input and output and the human and social capital variables. Growers with less formal education were somewhat more likely to report more frequent occurrence of on-time delivery and on-time pick up than those with higher education. Women reported more favorably than men did on chicks being delivered when promised. There are no significant differences associated with grower experience. Older growers show some tendency to report better quality chicks and pick-up. Significant differences in ratings of chick input quality are associated with organizational membership. Growers who belong to both the Contract Poultry Growers Association and Farm Bureau report lower perceptions of chick quality, reliable pick-up and delivery, and accurate chick counts than growers who are not members of these organizations or are members of Farm Bureau only.

Chapter 2, Appendix E Statistical Analyses of Survey Results
Page 2-67
Table 22. Grower assessment of the quality of the chicks and measures of grower human and social capital
278 - Chicks are delivered when promised 279 - Good quality chicks are delivered 280 - The chick count is accurate 281 - Birds are picked up as scheduled 282 - Birds are weighed promptly at plant 283 - My weight tickets are machine stamped
Human & Social Capital Variables N Code 78 Code 79 Code 80 Code 81 Code 82 Code 83
Education Grade School High School Trade/Technical Some 4-year Bachelor & Up
83
495 135 163 116
A 1.62
AB 1.79 B 1.83 B 1.90 B 1.84
A 2.59 A 2.66 A 2.74 A 2.68 A 2.56
A 2.00 B 2.18 B 2.27 B 2.26 B 2.15
A 1.72
BC 1.90 AB 1.82
C 2.04 BC 1.96
A 1.74 A 1.78 A 1.85 A 1.89 A 1.80
A 1.46 A 1.55 A 1.68 A 1.63 A 1.57
Gender Male Female
822 180
B 1.83 A 1.68
A 2.67 A 2.58
A 2.19 A 2.16
A 1.92 A 1.83
A 1.80 A 1.84
A 1.58 A 1.55
Years Growing 7 or Less 8 - 12 13 - 24 25 or More
213 251 328 206
A 1.82 A 1.78 A 1.86 A 1.71
A 2.60 A 2.64 A 2.70 A 2.65
A 2.12 A 2.15 A 2.26 A 2.17
A 1.94 A 1.89 A 1.90 A 1.87
A 1.75 A 1.81 A 1.86 A 1.76
A 1.53 A 1.61 A 1.61 A 1.50
Age 40 & Under 41 - 50 51 - 60 Over 60
177 307 307 209
B 1.88 B 1.89 A 1.71 A 1.74
B 2.73
AB 2.69 AB 2.64 A 2.56
A 2.16 A 2.26 A 2.17 A 2.12
B 2.04 A 1.90 A 1.86 A 1.84
A 1.83 A 1.84 A 1.78 A 1.76
A 1.56 A 1.58 A 1.55 A 1.61
Organizations* Poultry Growers Farm Bureau Both Neither
93
311 92
447
B 2.17 A 1.76 B 1.99 A 1.73
AB 2.79 A 2.62 B 2.81 A 2.62
B 2.32
AB 2.17 C 2.51 A 2.11
B 2.14 A 1.86 B 2.11 A 1.84
B 1.93
AB 1.84 B 1.96 A 1.73
A 1.68 A 1.56 A 1.68 A 1.54
* See Note accompanying Table 2

Chapter 2, Appendix E Statistical Analyses of Survey Results Page 2-68
Table 23 describes the association between chick input and output quality and work experience. Chick quality was not significantly associated with prior farming experience, having an off-farm job, or the spouse having an off-farm job. There are few significant differences associated with current off-farm occupation type, and, where differences occur, they display no discernable pattern. However, those with managerial or professional jobs off the farm report more frequent quality chick delivery than those working as operators or laborers off the farm. The same difference is found with respect to how often the chick count is accurate. Growers with off-farm occupations in agriculture and forestry were more likely to report that their birds were picked up on schedule than were those working off-farm as operators or laborers.
Table 23. Grower assessment of the quality of the chicks and measures of grower work experience
278 - Chicks are delivered when promised 279 - Good quality chicks are delivered 280 - The chick count is accurate 281 - Birds are picked up as scheduled 282 - Birds are weighed promptly at plant 283 - My weight tickets are machine stamped
Work Experience Variables
N
Code 278
Code 279
Code 280
Code 281
Code 282
Code 283
Farming Prior Job Yes No
368 642
A 1.83A 1.78
A 2.71A 2.62
A 2.25A 2.15
A 1.94 A 1.88
A 1.85 A 1.78
A 1.62A 1.54
Has Off-Farm Job Yes No
360 624
A 1.86A 1.76
A 2.69A 2.63
A 2.19A 2.19
A 1.95 A 1.87
A 1.84 A 1.78
A 1.62A 1.54
Spouse Off-Farm Job Yes No No Spouse
400 458 94
B 1.90AB 1.76A 1.69
A 2.69A 2.65A 2.57
A 2.27A 2.14A 2.16
A 1.96 A 1.87 A 1.85
A 1.85 A 1.78 A 1.79
A 1.59A 1.57A 1.51
Current Occupation Manager/Professional Tech/Sales/Support Farm/Forest/Broilers Precision/Repair Operators/Labor Other/None Listed
45 66 47 80 85 36
A 1.76A 2.02A 1.66A 1.81A 1.96A 1.88
A 2.34BC 2.79
ABC 2.61BC 2.76C 2.84
AB 2.52
A 1.97AB 2.16AB 2.17AB 2.18
B 2.33AB 2.24
AB 1.84 AB 2.02 A 1.72
AB 1.92 B 2.10
AB 1.97
A 1.85 A 1.76 A 1.70 A 1.85 A 1.95 A 1.85
A 1.67A 1.58A 1.71A 1.55A 1.65A 1.60
Table 24 describes the association between chick input and output quality and growers’ level of dependency. Those with a larger percentage of family income coming from the broiler operation tend to give higher quality ratings, as do growers with lower total farm debt and a

Chapter 2, Appendix E Statistical Analyses of Survey Results
Page 2-69
lower percentage of broiler debt. Neither the number of companies in the area nor the change in their number is an important factor determining perceptions of chick quality measures.
Table 24. Grower assessment of the quality of the chicks and measures of grower dependency
278 - Chicks are delivered when promised 279 - Good quality chicks are delivered 280 - The chick count is accurate 281 - Birds are picked up as scheduled 282 - Birds are weighed promptly at plant 283 - My weight tickets are machine stamped
Dependency Variables N Code 278 Code 279 Code 280 Code 281 Code 282 Code 283
% of Family Income Less Than 25% 25% - 49% 50% - 74% 75% or More
185 272 243 228
B 1.96A 1.76A 1.77A 1.80
A 2.71A 2.62A 2.69A 2.64
B 2.30AB 2.20A 2.13
AB 2.19
A 1.96 A 1.91 A 1.85 A 1.93
A 1.90 A 1.81 A 1.79 A 1.78
A 1.65A 1.59A 1.59A 1.55
Total Farm Debt Under $50,000 $ 50,000 - $ 99,999 $100,000 - $199,999 $200,000 - $299,999 $300,000 or More
276 143 178 132 180
A 1.74AB 1.78AB 1.85AB 1.77
B 1.93
A 2.58A 2.68A 2.74A 2.63A 2.75
A 2.15A 2.16A 2.26A 2.20A 2.26
A 1.83 A 1.88 A 1.93 A 1.82 B 2.10
A 1.78 A 1.81 A 1.85 A 1.77 A 1.86
A 1.54A 1.54A 1.57A 1.55A 1.72
% of Debt Is Broiler Less Than 25% 25% - 49% 50% - 74% 75% or More
217 84
105 472
A 1.67B 1.88B 1.88B 1.86
A 2.50AB 2.65
B 2.75B 2.73
A 2.05AB 2.15
B 2.34B 2.27
A 1.81 A 1.85 A 1.93 A 1.96
A 1.74
AB 1.88 B 1.99 A 1.79
A 1.49A 1.63A 1.59A 1.60
50% Other Crops Yes No
136 820
A 1.80A 1.81
A 2.74A 2.64
A 2.21A 2.20
A 1.94 A 1.91
A 1.87 A 1.80
A 1.68A 1.56
Current Companies 1 2 3 4 5 or More Don’t Know
274 202 160 109 82
162
A 1.85A 1.87A 1.70A 1.79A 1.84A 1.71
A 2.69A 2.70A 2.65A 2.61A 2.67A 2.55
A 2.18A 2.20A 2.18A 2.21A 2.30A 2.14
A 1.94 A 1.86 A 1.90 A 1.84 A 2.01 A 1.86
A 1.81 A 1.82 A 1.80 A 1.79 A 1.76 A 1.81
B 1.61B 1.57A 1.36B 1.63B 1.69B 1.62
Number of Companies Offering Contracts Decreased Stayed the Same Increased
212 422 144
A 1.82A 1.81A 1.84
A 2.67A 2.65A 2.71
A 2.23A 2.17A 2.23
A 1.94 A 1.89 A 1.89
A 1.78 A 1.80 A 1.88
A 1.57A 1.55A 1.60

Chapter 2, Appendix E Statistical Analyses of Survey Results Page 2-70
Table 25 describes the association between chick input and output and changes in the grower’s situation. Growers experiencing an increase in the number of flocks per year consistently report more favorable chick quality than do those for whom the number of flocks has decreased or fluctuated. Likewise, growers whose income has been higher than expected and those whose contract has changed to increase the pay rate are more likely to give higher ratings to chick input and output quality. Whether or not growers have changed companies shows no significant impact.
Table 25. Grower assessment of the quality of the chicks and measures of change
278 - Chicks are delivered when promised 279 - Good quality chicks are delivered 280 - The chick count is accurate 281 - Birds are picked up as scheduled 282 - Birds are weighed promptly at plant 283 - My weight tickets are machine stamped
Change Variables N Code 278 Code 279 Code 280 Code 281 Code 282 Code 283
Number of Flocks per Year Gone Up Gone Down Gone Up & Down Stayed the Same
68 121 115 691
A 1.57BC 1.90C 2.01B 1.78
A 2.45B 2.83B 2.91A 2.61
A 2.02B 2.35B 2.47A 2.13
A 1.79 BC 2.05 C 2.06
AB 1.86
A 1.72 B 1.96
AB 1.87 A 1.78
A 1.50B 1.81A 1.52A 1.55
Income Expectations More Than Expected About What Expected Less Than Expected
100 454 413
A 1.46B 1.64C 2.05
A 2.15B 2.43C 2.99
A 1.77B 2.00C 2.49
A 1.62 A 1.75 B 2.13
A 1.55 B 1.67 C 1.99
A 1.31B 1.49C 1.73
Contract Changed to Increase Pay Yes No Don’t Know
563 319 55
AB 1.75B 1.93A 1.61
A 2.59B 2.81A 2.58
A 2.13B 2.33A 2.09
A 1.79 B 2.14 A 1.78
AB 1.76 B 1.91 A 1.73
A 1.49B 1.75A 1.44
Changed Companies Yes No
303 689
A 1.81A 1.79
A 2.67A 2.64
A 2.22A 2.18
A 1.97 A 1.87
A 1.84 A 1.79
A 1.61A 1.56

Chapter 2, Appendix E Statistical Analyses of Survey Results
Page 2-71
Grower Assessment of Feed Quality
Tables 26-30 focus on the growers’ assessments of the quality of feed, timeliness of delivery, and accuracy of feed quantity.
Table 26 looks at the relation between these feed items and grower performance variables. Feed being emptied from bins without proper credit was reported as rarely being a problem and bears no significant relationship to any of the four performance characteristics included in Table 26. Generally, more positive assessments of the feed situation have some association with higher net cash flow. Positive evaluations of feed are also associated with receiving more flocks per year, although the relation is not linear. Size of operation does matter, however, with the larger operations most likely to provide a positive assessment of feed. Growers more often ranked above average were more likely to report receipt of good quality feed and were less likely to report being overcharged for feed.
Table 26. Grower assessment of the quality of feed and measures of grower performance
287 - My company provides me with good quality feed 288 - Feed is delivered as scheduled 289 - I am charged for more feed than delivered 290 - Feed is emptied from my bins and not credited
Performance Variables N Code 287 Code 288 Code 289 Code 290
Net Cash Lost Money $ 0 - $14,999 $15,000 - $29,999 $30,000 - $44,999 $45,000 - $59,999 $60,000 & Up
81
329 274 152 42 36
C 2.47
BC 2.29 AB 2.16 AB 2.09 AB 2.09 A 1.96
C 2.41
BC 2.25 AB 2.12 BC 2.22 BC 2.21 A 1.90
A 3.83
AB 3.98 B 4.12
AB 4.07 B 4.11 B 4.23
A 4.29 A 4.34 A 4.37 A 4.44 A 4.26 A 4.35
Flocks/Year Less Than 5 5.0 - 5.9 6.0 - 6.9 7.0 or More
102 498 337 63
AB 2.09
B 2.25 B 2.18 A 1.99
B 2.20 B 2.24
AB 2.15 A 1.98
B 4.21 A 3.96
AB 4.12 AB 4.14
A 4.50 A 4.30 A 4.38 A 4.44
Houses/Farm 1 - 2 Houses 3 - 4 Houses 5 or More
335 426 222
A 2.11
AB 2.22 B 2.28
A 2.12
AB 2.19 B 2.30
B 4.06 B 4.08 A 3.92
A 4.29 A 4.39 A 4.34
Ranked Above 0 - 5 Times 6 - 10 Times
368 451
B 2.32 A 2.13
A 2.26 A 2.19
A 3.91 B 4.11
A 4.32 A 4.37

Chapter 2, Appendix E Statistical Analyses of Survey Results Page 2-72
Table 27 describes the relation between feed evaluation and human and social capital variables. Growers’ education is not related to their assessments of the feed inputs. Women are more likely to report on-time delivery of feed than are men, the only significant difference associated with gender. The more experienced growers are more likely to report receipt of good quality feed. Similarly, older growers are more likely to assess the quality of feed and timeliness of delivery higher than are the younger. Growers who are members of Farm Bureau and not the Contract Poultry Growers Association and growers who are members of neither organization are more likely to report a favorable assessment of the feed relationship than are members of the Contract Poultry Growers Association.
Table 27. Grower assessment of the quality of feed and measures of grower human and social capital
287 - My company provides me with good quality feed 288 - Feed is delivered as scheduled 289 - I am charged for more feed than delivered 290 - Feed is emptied from my bins and not credited
Human & Social Capital Variables
N
Code 287
Code 288
Code 289
Code 290
Education Grade School High School Trade/Technical Some 4-year Bachelor & Up
83
495 135 163 116
A 2.18 A 2.15 A 2.25 A 2.32 A 2.18
A 2.13 A 2.15 A 2.20 A 2.30 A 2.25
A 4.09 A 4.05 A 3.98 A 4.06 A 4.07
A 4.25 A 4.32 A 4.35 A 4.43 A 4.40
Gender Male Female
822 180
A 2.20 A 2.16
B 2.22 A 2.07
A 4.04 A 4.05
A 4.34 A 4.37
Years Growing 7 or Less 8 - 12 13 - 24 25 or More
213 251 328 206
B 2.23 B 2.23
AB 2.21 A 2.08
A 2.21 A 2.23 A 2.22 A 2.08
A 4.10 A 4.04 A 3.98 A 4.10
A 4.39 A 4.33 A 4.33 A 4.32
Age 40 & Under 41 - 50 51 - 60 Over 60
177 307 307 209
B 2.29 B 2.30 B 2.17 A 2.01
C 2.36 C 2.28 B 2.14 A 1.99
A 4.05 A 4.02 A 4.07 A 4.04
A 4.44 A 4.32 A 4.39 A 4.25
Organizations* Poultry Growers Farm Bureau Both Neither
93
311 92
447
B 2.45 A 2.15
AB 2.32 A 2.16
B 2.44 A 2.18
AB 2.27 A 2.14
A 3.89 B 4.08 A 3.80 B 4.09
A 4.15 B 4.40
AB 4.33 AB 4.36
*See Note accompanying Table 2

Chapter 2, Appendix E Statistical Analyses of Survey Results
Page 2-73
Table 28 describes the relation between work experience and feed evaluation. Growers with prior farm experience and those who have an off-farm job are more likely to be skeptical of the quality of feed they receive. Prior experience as a farmer is also associated with reporting that feed is frequently emptied from bins and not credited, while having an off-farm job is also associated with reporting problems with off-schedule deliveries. A spouse’s off-farm work does not significantly affect this assessment. Growers currently employed off-farm in manager/professional positions and technical/sales/support positions are more likely to report frequently receiving good quality feed than growers in other off-farm occupations.
Table 28. Grower assessment of the quality of feed and measures of grower work experience
287 - My company provides me with good quality feed 288 - Feed is delivered as scheduled 289 - I am charged for more feed than delivered 290 - Feed is emptied from my bins and not credited
Work Experience Variables
N
Code 287
Code 288
Code 289
Code 290
Farming Prior Job Yes No
368 642
B 2.27 A 2.15
A 2.21 A 2.18
A 3.98 A 4.08
A 4.26 B 4.40
Has Off-Farm Job Yes No
360 624
B 2.28 A 2.15
B 2.27 A 2.14
A 4.02 A 4.06
A 4.32 A 4.37
Spouse Off-Farm Job Yes No No Spouse
400 458 94
B 2.24 B 2.20 A 2.04
A 2.23 A 2.19 A 2.10
A 4.00 A 4.08 A 3.99
A 4.31 A 4.35 A 4.39
Current Occupation Manager/Professional Tech/Sales/Support Farm/Forest/Broilers Precision/Repair Operators/Labor Other/None Listed
45 66 47 80 85 36
A 2.03
AB 2.20 B 2.37 B 2.37 B 2.44 A 2.02
A 2.09 A 2.19 A 2.31 A 2.35 A 2.40 A 2.10
A 4.15 A 4.06 A 4.06 A 4.00 A 3.94 A 3.90
A 4.44 A 4.22 A 4.40 A 4.41 A 4.20 A 4.28
Table 29 describes the relation between feed assessment and dependency. Those who rely on broilers for the bulk of their income are more likely to report frequently receiving good quality feed and they are the least likely to report that feed is frequently emptied from their bins without being credited. Growers having the lowest total farm debt are more likely to provide a positive assessment of the feed quality set than are those with the largest debt. A lower percentage of broiler debt is associated with a more positive view of feed quality. Neither a

Chapter 2, Appendix E Statistical Analyses of Survey Results Page 2-74
change in the number of companies, pursuing other farm enterprises, or the number of companies in the area affects the grower’s view of feed quality.
Table 29. Grower assessment of the quality of feed and measures of grower dependency
287 - My company provides me with good quality feed 288 - Feed is delivered as scheduled 289 - I am charged for more feed than delivered 290 - Feed is emptied from my bins and not credited
Dependency Variables N Code 287 Code 288 Code 289 Code 290
% of Family Income Less Than 25% 25% - 49% 50% - 74% 75% or More
185 272 243 228
B 2.31
AB 2.20 AB 2.22 A 2.13
A 2.25 A 2.18 A 2.26 A 2.15
A 4.00 A 4.07 A 4.00 A 4.03
A 4.31 A 4.29 A 4.33 B 4.54
Total Farm Debt Under $50,000 $ 50,000 - $ 99,999 $100,000 - $199,999 $200,000 - $299,999 $300,000 or More
276 143 178 132 180
A 2.09
AB 2.25 B 2.28
AB 2.21 B 2.35
A 2.04 B 2.22 B 2.27 B 2.22 B 2.39
AB 4.08 AB 4.03 A 3.92 B 4.16 A 3.95
A 4.29 A 4.41 A 4.29 A 4.50 A 4.34
% of Debt Is Broiler Less Than 25% 25% - 49% 50% - 74% 75% or More
217 84
105 472
A 2.03 B 2.33 B 2.30 B 2.29
A 2.02 B 2.22 B 2.33 B 2.29
A 4.15 A 4.01 A 3.98 A 3.98
A 4.32 A 4.27 A 4.31 A 4.41
50% Other Crops Yes No
136 820
A 2.24 A 2.19
A 2.29 A 2.18
A 4.05 A 4.04
A 4.25 A 4.37
Current Companies 1 2 3 4 5 or More Don’t Know
274 202 160 109 82
162
A 2.21 A 2.20 A 2.22 A 2.14 A 2.26 A 2.15
A 2.20 A 2.17 A 2.19 A 2.21 A 2.21 A 2.18
A 4.00 A 4.04 A 4.11 A 4.12 A 4.00 A 4.03
A 4.33 A 4.34 A 4.39 A 4.48 A 4.30 A 4.24
Number of Companies Offering Contracts Decreased Stayed the Same Increased
212 422 144
A 2.19 A 2.19 A 2.23
A 2.21 A 2.15 A 2.25
A 4.01 A 4.05 A 4.05
A 4.30 A 4.38 A 4.38

Chapter 2, Appendix E Statistical Analyses of Survey Results
Page 2-75
Table 30 describes the association between feed assessment and variables measuring changes in the grower’s situation. Growers who experienced an increase in the number of flocks per year or had the same number of flocks were more likely to have positive perceptions of feed quality. A higher income than expected and contract changes that increase pay are also associated with a positive assessment of feed quality. Having changed companies shows no impact.
Table 30. Grower assessment of the quality of feed and measures of change
287 - My company provides me with good quality feed 288 - Feed is delivered as scheduled 289 - I am charged for more feed than delivered 290 - Feed is emptied from my bins and not credited
Change Variables N Code 287 Code 288 Code 289 Code 290
Number of Flocks per Year Gone Up Gone Down Gone Up & Down Stayed the Same
68 121 115 691
A 2.06 C 2.42
BC 2.30 AB 2.16
AB 2.19 C 2.43
BC 2.34 A 2.13
B 4.13 A 3.80 A 3.90 B 4.10
B 4.61 A 4.26 A 4.21
AB 4.37
Income Expectations More Than Expected About What Expected Less Than Expected
100 454 413
A 1.82 B 1.98 C 2.51
A 1.92 A 2.00 B 2.47
C 4.38 B 4.24 A 3.76
B 4.42 B 4.46 A 4.20
Contract Changed to Increase Pay Yes No Don’t Know
563 319 55
A 2.11 B 2.38 A 2.19
A 2.12 B 2.36 A 2.12
B 4.16 A 3.85
AB 4.00
A 4.41 A 4.23 A 4.38
Changed Companies Yes No
303 689
A 2.17 A 2.21
A 2.18 A 2.19
A 4.03 A 4.05
A 4.35 A 4.34

Chapter 2, Appendix E Statistical Analyses of Survey Results Page 2-76
Overall Assessment of the Contract Relationship Tables 31-35 include variables assessing the growers’ assessments of their overall contract relationships. Whether getting into broiler production has been a good decision for the respondent and whether he or she recommends broiler growing to others cuts to the heart of the contract relationship. The labor time required when birds are on the farm and the amount of down time between flocks are both important aspects of that relationship.
Table 31 shows the relationship between the overall assessment and grower performance measures. Agreement with statements 264 and 265, disagreement with statement 259 and low frequency of statements 277 and 285 indicate a positive view of the contract relationship. There is a clear positive association between net cash flow and a positive perception of the contract relationship. However, at all cash flow levels, growers are more positive regarding their own involvement in broiler growing than about recommending it to others. The number of flocks per year is also generally positively related to a favorable perception of the relationship. Growers having seven or more flocks per year were significantly more likely to view the relationship favorably. Ranking above average more than half the time is also associated with a more positive view.
Those who lost money in the previous year are more likely to agree that broiler growing takes more labor time than they planned. A higher numbers of houses is also associated with increased grower perceptions of spending more time than expected. However, spending more time is inversely related to the number of flocks per year: those receiving five or fewer are more likely to agree that they have spent more time than growers receiving more flocks per year. Being left without birds is a serious problem for the grower. Not surprisingly, higher income growers are less likely to agree that they are often left without birds, as are those growers receiving seven or more flocks per year. On the other hand, growers operating five or more houses are more likely than those operating one to four houses to report being without birds frequently. Being left without birds for too long was also associated with ranking below average.
Unexpectedly high condemnation rates are also a source of concern for growers since they have a major impact on their income. Growers who lost money are more likely to report condemnation rates higher than they expected, as are those growers operating five or more houses. Those receiving seven or more flocks per year, on the other hand, were less likely to report unexpectedly high condemnation rates. Having condemnation rates higher than expected was also associated with ranking below average.

Chapter 2, Appendix E Statistical Analyses of Survey Results
Page 2-77
Table 31. Overall assessment of contract production and measures of grower performance
264 - Broiler growing has been a good decision for me 265 - I would encourage others to become broiler growers 259 - Spent more time than expected 277 - Left without birds too long 285 - The condemnation rate is higher than I expected
Performance Variables N Code 264 Code 265 Code 259 Code 277 Code 285
Net Cash Lost Money $ 0 - $14,999 $15,000 - $29,999 $30,000 - $44,999 $45,000 - $59,999 $60,000 & Up
81
329 274 152 42 36
D 2.77 C 2.16
BC 1.93 B 1.80 B 1.78 A 1.52
E 3.40 D 2.85
CD 2.71 BC 2.51 AB 2.29 A 2.19
A 2.14 B 2.50 B 2.54
BC 2.67 C 2.82
BC 2.68
A 3.38
AB 3.66 BC 3.76 CD 4.01
D 4.21 D 4.15
A 2.72 B 3.03
BC 3.11 BC 3.17 C 3.34 C 3.37
Flocks/Year Less Than 5 5.0 - 5.9 6.0 - 6.9 7.0 or More
102 498 337 63
B 2.08 B 2.05 B 2.04 A 1.83
A 2.77 A 2.79 A 2.70 A 2.58
A 2.38
AB 2.52 B 2.60 B 2.67
A 3.74 A 3.75 A 3.82 B 4.09
A 3.13 A 3.02 A 3.15 B 3.40
Houses/Farm 1 - 2 Houses 3 - 4 Houses 5 or More
335 426 222
A 2.05 A 2.02 A 2.07
A 2.79 A 2.70 A 2.76
B 2.60
AB 2.53 A 2.44
B 3.81 B 3.87 A 3.63
B 3.18 B 3.11 A 2.95
Ranked Above 0 - 5 Times 6 - 10 Times
368 451
B 2.18 A 1.91
B 2.87 A 2.65
A 2.50 A 2.59
A 3.71 B 3.86
A 2.92 B 3.25
Table 32 illustrates the association of the overall assessment to growers’ human and social capital. Education has no impact, except that the more highly educated are more likely to feel that they are frequently without birds too long. Men report condemnation rates higher than expected more often than women do. The more experienced growers are less likely than less experienced growers to find condemnation rates higher than expected. However, more experienced growers are also less likely to recommend broiler growing to others. Younger growers are somewhat more likely to have a positive perspective. Contract Poultry Growers Association members consistently hold a less favorable view of the contract situation than do non-members.

Chapter 2, Appendix E Statistical Analyses of Survey Results Page 2-78
Table 32. Overall assessment of contract production and measures of grower human and social capital
264 - Broiler growing has been a good decision for me 265 - I would encourage others to become broiler growers 259 - Spent more time than expected 277 - Left without birds too long 285 - The condemnation rate is higher than I expected
Human & Social Capital Variables
N
Code 264
Code 265
Code 259
Code 277
Code 285
Education Grade School High School Trade/Technical Some 4-year Bachelor & Up
83
495 135 163 116
A 2.04 A 1.99 A 2.08 A 2.09 A 2.13
A 2.64 A 2.71 A 2.83 A 2.77 A 2.83
A 2.51A 2.51A 2.56A 2.50 A 2.65
B 3.93 B 3.82 B 3.83
AB 3.73 A 3.54
A 3.18 A 3.10 A 3.05 A 3.07 A 3.11
Gender Male Female
822 180
A 2.06 A 1.94
A 2.76 A 2.68
A 2.54A 2.51
A 3.77 A 3.88
A 3.07 B 3.22
Years Growing 7 or Less 8 - 12 13 - 24 25 or More
213 251 328 206
A 2.02 A 1.99A 2.13A 1.99
A 2.55 A 2.66B 2.87B 2.85
A 2.63A 2.52A 2.50A 2.51
A 3.79 A 3.72 A 3.78 A 3.87
A 3.01
AB 3.09 AB 3.08
B 3.23
Age 40 & Under 41 - 50 51 - 60 Over 60
177 307 307 209
A 1.92 B 2.10B 2.11
AB 1.95
A 2.63 AB 2.74
B 2.86A 2.67
B 2.69A 2.54A 2.49A 2.48
A 3.72 A 3.69
AB 3.85 B 3.91
A 3.05 A 3.04 A 3.14 A 3.13
Organizations* Poultry Growers Farm Bureau Both Neither
93
311 92
447
B 2.23A 1.99 B 2.35A 1.98
BC 2.90AB 2.71
C 3.03A 2.69
A 2.23 B 2.59 A 2.28 B 2.63
A 3.50 B 3.82
AB 3.63 B 3.82
AB 2.91 BC 3.11 A 2.84 C 3.18
* See Note accompanying Table 2
Table 33 shows the relationship between growers’ overall assessment of contract production and their work experience. Contrary to expectations, growers with prior farming experience are more likely than those without to find the time required for broiler production longer than expected. Those without an off-farm job are more likely to find broiler production good for them and they are less likely to report being frequently left without birds. Off-farm work by a spouse shows no significant impact. If employed off-farm, the type of job has no impact on the assessment except that the managerial /professional workers are more likely than the technical/sales/support workers to recommend broiler growing to others.

Chapter 2, Appendix E Statistical Analyses of Survey Results
Page 2-79
Table 33. Overall assessment of contract production and measures of grower work experience
264 - Broiler growing has been a good decision for me 265 - I would encourage others to become broiler growers 259 - Spent more time than expected 277 - Left without birds too long 285 - The condemnation rate is higher than I expected
Work Experience Variables
N
Code 264
Code 265
Code 259
Code 277
Code 285
Farming Prior Job Yes No
368 642
A 2.03A 2.05
A 2.76A 2.74
A 2.46B 2.58
A 3.74 A 3.81
A 3.02 A 3.13
Has Off-Farm Job Yes No
360 624
B 2.11A 2.00
A 2.79A 2.72
A 2.56A 2.52
A 3.69 B 3.86
A 3.07 A 3.13
Spouse Off-Farm Job Yes No No Spouse
400 458 94
A 2.11A 1.99A 2.10
A 2.79A 2.73A 2.74
A 2.59A 2.52A 2.48
A 3.69
AB 3.83 B 3.96
A 3.05 A 3.13 A 3.09
Current Occupation Manager/Professional Tech/Sales/Support Farm/Forest/Broilers Precision/Repair Operators/Labor Other/None Listed
45 66 47 80 85 36
A 1.98A 2.12A 2.00A 2.21A 2.10A 2.22
A 2.55B 2.95
AB 2.68AB 2.80AB 2.87AB 2.74
A 2.74A 2.62A 2.64A 2.47A 2.46A 2.59
A 3.58 A 3.68 A 3.88 A 3.80 A 3.54 A 3.77
A 3.27 A 3.11 A 3.24 A 2.93 A 2.96 A 3.09
Table 34 provides the association between the overall assessment and measures of grower dependence on the company. A higher percentage of family income from broilers is generally associated with a positive view of the relationship. Lower farm debt is also associated with a positive view, however, less consistently than is a high share of income. The lower the share of debt that is for broilers, the more positive the assessment. Respondents without other farm operations (i.e., those whose farm is undiversified) are more likely to recommend broiler production and are less frequently left without birds. The number of companies in the area has no impact on the overall assessment, but there is a somewhat more positive view where the number of companies is increasing rather than decreasing.

Chapter 2, Appendix E Statistical Analyses of Survey Results Page 2-80
Table 34. Overall assessment of contract production and measures of grower dependency
264 - Broiler growing has been a good decision for me 265 - I would encourage others to become broiler growers 259 - Spent more time than expected 277 - Left without birds too long 285 - The condemnation rate is higher than I expected
Dependency Variables N Code 264 Code 265 Code 259 Code 277 Code 285
% of Family Income Less Than 25% 25% - 49% 50% - 74% 75% or More
185 272 243 228
B 2.29A 2.03A 1.93A 1.96
C 2.92BC 2.81A 2.62
AB 2.67
A 2.39AB 2.54
B 2.63AB 2.53
A 3.52 B 3.79 B 3.86 B 3.90
A 2.95
AB 3.11 AB 3.11
B 3.14
Total Farm Debt Under $50,000 $ 50,000 - $ 99,999 $100,000 - $199,999 $200,000 - $299,999 $300,000 or More
276 143 178 132 180
A 1.91AB 2.04
B 2.19AB 2.06
B 2.10
A 2.69A 2.87A 2.85A 2.74A 2.69
A 2.58A 2.59A 2.47A 2.53A 2.44
B 3.94
AB 3.76 A 3.60
AB 3.79 A 3.68
B 3.18 B 3.17
AB 3.02 AB 3.07 A 2.88
% of Debt Is Broiler Less Than 25% 25% - 49% 50% - 74% 75% or More
217 84
105 472
A 1.84B 2.14B 2.07B 2.12
A 2.57B 2.78B 2.85B 2.80
A 2.64A 2.59A 2.47A 2.48
B 3.99 A 3.63 A 3.66 A 3.72
B 3.20
AB 3.09 A 2.96
AB 3.03
50% Other Crops Yes No
136 820
A 2.09A 2.03
B 2.93A 2.72
A 2.43A 2.55
A 3.60 B 3.81
A 3.02 A 3.10
Current Companies 1 2 3 4 5 or More Don’t Know
274 202 160 109 82
162
A 2.03A 2.04A 2.05A 2.09A 1.99A 2.06
A 2.67A 2.78A 2.81A 2.83A 2.82A 2.68
A 2.50A 2.54A 2.53A 2.58A 2.52A 2.59
A 3.80 A 3.69 A 3.84 A 3.89 A 3.72 A 3.83
A 3.12 A 3.09 A 3.11 A 3.17 A 2.99 A 3.08
Number of Companies Offering Contracts Decreased Stayed the Same Increased
212 422 144
B 2.17AB 2.04A 1.89
B 2.95A 2.70A 2.63
A 2.52A 2.54A 2.52
A 3.64 B 3.84 B 3.83
A 3.08 A 3.14 A 3.02

Chapter 2, Appendix E Statistical Analyses of Survey Results
Page 2-81
Table 35 shows association between the overall assessment of contract production and changes in the grower’s situation. An increase in the number of flocks per year is clearly more associated with a positive view of the contract relationship than is a decrease or variation. Likewise, income above expectations is associated with a favorable assessment of contract production, as is a contract change to increase pay. Whether the grower has changed companies matters little except that the growers who have not changed are more likely to recommend the business to others. As might be expected, growers who have enjoyed increasing flock numbers are less likely to say they have been left without birds for too long as are those whose income is more than, or about the same as, they expected and those whose contract has been changed to increase pay. Those growers whose flock numbers have risen are less likely to report higher than expected condemnation rates, as are those whose income is higher than expected and those whose contract has been changed to increase pay.
Table 35. Overall assessment of contract production and measures of change
264 - Broiler growing has been a good decision for me 265 - I would encourage others to become broiler growers 259 - Spent more time than expected 277 - Left without birds too long 285 - The condemnation rate is higher than I expected
Change Variables N Code 264 Code 265 Code 259 Code 277 Code 285
Number of Flocks per Year Gone Up Gone Down Gone Up & Down Stayed the Same
68 121 115 691
A 1.74C 2.31C 2.27B 1.99
A 2.46C 3.07C 3.01B 2.69
B 2.61A 2.32A 2.37B 2.59
C 4.14 A 3.27 A 3.34 B 3.91
B 3.35 A 2.95 A 2.95 A 3.11
Income Expectations More Than Expected About What Expected Less Than Expected
100 454 413
A 1.47B 1.78C 2.46
A 2.00B 2.48C 3.22
B 2.86B 2.74A 2.24
B 4.21 B 4.04 A 3.41
C 3.47 B 3.29 A 2.78
Contract Changed to Increase Pay Yes No Don’t Know
563 319 55
A 1.89C 2.29B 2.09
A 2.57C 3.07 B 2.81
B 2.66A 2.30B 2.52
B 3.93 A 3.54 B 3.95
B 3.24 A 2.86 A 3.01
Changed Companies Yes No
303 689
A 2.10A 2.02
B 2.91A 2.67
A 2.54A 2.54
A 3.77 A 3.81
A 3.11 A 3.10

Chapter 2, Appendix E Statistical Analyses of Survey Results Page 2-82