brookfield business partners l.p. q3 2017 …/media/files/b/brookfield-bbu-ir/... · ... we include...
TRANSCRIPT

BROOKFIELD BUSINESS PARTNERS L.P.
Q3 2017 Supplemental
Third Quarter September 30, 2017
Information

2
Primary FontColour
R0 G48 B87
Logo & Divider Slide Font
Title Slide Font
LightBackgroundR17 G17 B17
Dark BackdropR255 G255 B255
R64 G126 B182
Sub-headers & EmphasisText
Business GroupColours
Real EstateR69 G152 B182
InfrastructureR83 G56 B82
RenewableR92 G153 B121
Private EquityR230 G202 B139
Additional PaletteColours
R244 G125 B32
R77 G77 B77
R200 G200 B200
On-screenR17 G17 B17
PrintR34 G34 B35 Important Cautionary Notes
All amounts in this Supplemental Information are in U.S. dollars unless otherwise specified. Unless otherwise indicated, the statistical and financial data in this document is presented asat September 30, 2017.
CAUTIONARY STATEMENT REGARDING FORWARD-LOOKING STATEMENTS AND INFORMATIONThis Supplemental Information contains “forward-looking information” within the meaning of Canadian provincial securities laws and “forward-looking statements” within the meaning ofSection 27A of the U.S. Securities Act of 1933, as amended, Section 21E of the U.S. Securities Exchange Act of 1934, as amended, “safe harbor” provisions of the United States PrivateSecurities Litigation Reform Act of 1995 and in any applicable Canadian securities regulations. Forward-looking statements include statements that are predictive in nature, depend uponor refer to future events or conditions, include statements regarding the operations, business, financial condition, expected financial results, performance, prospects, opportunities, priorities,targets, goals, ongoing objectives, strategies and outlook of Brookfield Business Partners L.P. and its subsidiaries, as well as the outlook for North American and international economiesfor the current fiscal year and subsequent periods. In some cases, forward-looking statements can be identified by terms such as “expects,” “anticipates,” “plans,” “believes,” “estimates,”“seeks,” “intends,” “targets,” “projects,” “forecasts” or negative versions thereof and other similar expressions, or future or conditional verbs such as “may,” “will,” “should,” “would” and“could.”
Although we believe that our anticipated future results, performance or achievements expressed or implied by the forward-looking statements and information are based upon reasonableassumptions and expectations, the reader should not place undue reliance on forward-looking statements and information because they involve known and unknown risks, uncertaintiesand other factors, many of which are beyond our control, which may cause the actual results, performance or achievements of Brookfield Business Partners L.P. and its subsidiaries todiffer materially from anticipated future results, performance or achievement expressed or implied by such forward-looking statements and information.
Factors that could cause actual results to differ materially from those contemplated or implied by forward-looking statements include, but are not limited to: the impact or unanticipatedimpact of general economic, political and market factors in the countries in which we do business; the behavior of financial markets, including fluctuations in interest and foreign exchangesrate; global equity and capital markets and the availability of equity and debt financing and refinancing within these markets; strategic actions including dispositions; the ability to completeand effectively integrate acquisitions into existing operations and the ability to attain expected benefits; changes in accounting policies and methods used to report financial condition(including uncertainties associated with critical accounting assumptions and estimates); the effect of applying future accounting changes; business competition; operational and reputationalrisks; technological change; changes in government regulation and legislation within the countries in which we operate; changes in tax laws, catastrophic events, such as earthquakesand hurricanes; the possible impact of international conflicts and other developments including terrorist acts; and other risks and factors detailed from time to time in our documents filedwith the securities regulators in Canada and the United States.
We caution that the foregoing list of important factors that may affect future results is not exhaustive. When relying on our forward-looking statements, investors and others should carefullyconsider the foregoing factors and other uncertainties and potential events. Except as required by law, Brookfield Business Partners L.P. undertakes no obligation to publicly update orrevise any forward-looking statements or information, whether written or oral, that may be as a result of new information, future events or otherwise.
CAUTIONARY STATEMENT REGARDING USE OF NON-IFRS MEASURESThis Supplemental Information contains references to Company FFO and Company EBITDA. When determining Company FFO and Company EBITDA, we include our unitholders’proportionate share for equity accounted investments. Our definition of Company FFO and Company EBITDA may differ from definitions of Company FFO, Funds from Operations orCompany EBITDA used by other entities. We believe that Company FFO and Company EBITDA are useful supplemental measures that may assist investors in assessing the financialperformance of Brookfield Business Partners and its subsidiaries. Company FFO and Company EBITDA should not be considered as the sole measures of our performance and shouldnot be considered in isolation from, or as a substitute for, analysis of our financial statements prepared in accordance with IFRS.

3
Overview

Primary FontColour
R0 G48 B87Logo & Divider Slide Font
Title Slide Font
LightBackgroundR17 G17 B17
Dark BackdropR255 G255 B255
R64 G126 B182
Sub-headers & EmphasisText
Business GroupColours
Real EstateR69 G152 B182
InfrastructureR83 G56 B82
RenewableR92 G153 B121
Private EquityR230 G202 B139
Additional PaletteColours
R244 G125 B32
R77 G77 B77
R200 G200 B200
On-screenR17 G17 B17
PrintR34 G34 B35
4
US$ MILLIONS, unaudited
As atSeptember 30,
2017December 31,
2016
Total assets $ 15,930 $ 8,193
Net debt 2,089 501
Equity attributable to unitholders1 3,181 2,501
UNITS
As atSeptember
30, 2017December31, 2016
September30, 2016
Limited partnership units 65,185,298 51,845,298 43,845,298
Redemption-exchange units 63,095,497 56,150,497 48,150,497General partnership and special limitedpartnership units 8 8 8
Total units outstanding 128,280,803 107,995,803 91,995,803
Q3-2017 Highlights
Financial Performance - Three Months Ended September 30• For the three months ended September 30, 2017, Company EBITDA
was $85 million, compared to $60 million for the three months endedSeptember 30, 2016. The increase was due to:
– a $28 million increase in contributions from our industrialoperations segment, which benefited from the acquisition ofBRK Ambiental, as well as improved performance in ourgraphite electrode manufacturing business and our palladiummining operation;
– partially offset by a $5 million increase in management andcorporate expenses.
• Company FFO was $46 million for the quarter, compared to $50million for the three months ended September 30, 2016. Thedecrease in Company FFO was due to:
– the $16 million loss on sale, net of taxes, of an oil and gasproducer in Western Canada ("Insignia Energy") in ourenergy segment this quarter;
– partially offset by the increase in contributions from ourindustrial operations as discussed above.
• Net income attributable to unitholders for the three months endedSeptember 30, 2017 was $9 million, compared to net income of $20million for the same period in 2016.
Key Performance Metrics
Key Balance Sheet Metrics
1) Attributable to parent company prior to the spin-off on June 20, 2016 ("Spin-off"), and to limited partnership unitholders, general partnership unitholders, redemption-exchange unitholders, and speciallimited partnership unitholders post Spin-off.
2) Company FFO is a non-IFRS measure and is calculated as net income excluding the impact of depreciation and amortization, deferred income taxes, breakage and transaction costs, non-cash gainsor losses and other items. When determining Company FFO, we include our proportionate share of Company FFO of equity accounted investment. Company FFO is further adjusted as CompanyEBITDA to exclude the impact of realized disposition gains (losses), interest expense, current income taxes, and realized disposition gain, current income taxes and interest expenses related to equityaccounted investments. Company EBITDA and Company FFO are presented net to unitholders. For further information on Company FFO and Company EBITDA see “Use of Non-IFRS Measures” onpage 5 of the 2016 20-F. These terms are consistently used throughout the Supplemental.
3) Comparative figures for the nine months ended September 30, 2016 are not representative of performance, as units were spun out on June 20, 2016.4) Average number of partnership units outstanding on a fully diluted time weighted average basis, assuming the exchange of redemption exchange units held by Brookfield Asset Management for limited
partnership units, for the three and nine months ended September 30, 2017 was 108.9 million and 108.3 million respectively, and for the three months ended September 30, 2016 was 92 million.5) Income (loss) attributed to limited partnership unit on a fully diluted basis is reduced by incentive distributions paid to special limited partnership unitholders during the period.
US$ MILLIONS, unaudited
Three MonthsEnded
September 30,
Nine MonthsEnded
September 30,
2017 2016 2017 2016
Net income (loss) attributable tounitholders1 $ 9 $ 20 $ 69 $ (18)
Company EBITDA1,2 85 60 132 177
Company FFO1,2 46 50 184 145
Net (loss) income per limited partnershipunit3,4,5 $ (0.15) 0.22 $ 0.40 N/A
Units Outstanding

Primary FontColour
R0 G48 B87Logo & Divider Slide Font
Title Slide Font
LightBackgroundR17 G17 B17
Dark BackdropR255 G255 B255
R64 G126 B182
Sub-headers & EmphasisText
Business GroupColours
Real EstateR69 G152 B182
InfrastructureR83 G56 B82
RenewableR92 G153 B121
Private EquityR230 G202 B139
Additional PaletteColours
R244 G125 B32
R77 G77 B77
R200 G200 B200
On-screenR17 G17 B17
PrintR34 G34 B35
5
Q3-2017 Highlights (cont'd)
Business Development• Completed the following transactions during the third quarter of 2017 along
with institutional partners:
– Closed the acquisition of the 213 gas stations and associatedconvenience kiosks in our business services segment forapproximately $423 million on July 17, 2017 ("fuel marketingbusiness"). The share of the equity investment attributable tounitholders was approximately $43 million for a 26% ownershipinterest in the business.
– Closed the acquisition of a 60% limited partnership interest inTeekay Offshore Partners L.P. ("Teekay Offshore") on September25, 2017 ("marine energy services business"). The share of theequity investment attributable to unitholders was $317 million for a25% ownership interest in the business, participation in a loan,warrants, and ownership share of the General Partner of TeekayOffshore.
• Completed the following transactions during the second quarter of 2017along with institutional partners:
– Acquisition of a 70% controlling stake in a Brazilian waste waterand industrial water treatment business in our industrial operationssegment ("BRK Ambiental").
– Acquisition of approximately an 85% controlling stake in a roadfuel storage and distribution operation in our business servicessegment ("Greenergy").
Financial Performance - Nine Months Ended September 30• For the nine months ended September 30, 2017, our Company
EBITDA was $132 million, a decrease of $45 million, compared tothe same period last year. The decrease was due to:
– lower results in our construction services and highermanagement and corporate expenses;
– lower equity accounted income primarily resulting fromthe reorganization of the ownership group and a partialsell down of our Western Australian energy operations;
– partially offset by an increased contribution from ourindustrial operations segment.
• Our Company FFO for the nine months ended September 30,2017, was $184 million, compared to $145 million for the ninemonths ended September 30, 2016. Company FFO waspositively impacted by a $92 million net gain before taxes realizedon the sale of our bath and shower products manufacturingoperation in the first quarter of 2017 offset by the net loss on thesale of Insignia Energy in our energy segment during the thirdquarter.
• Net income for the nine months ended September 30, 2017, was$69 million, compared to a net loss of $18 million for the ninemonths ended September 30, 2016. The increase in net income,in addition to the factors noted above, was due to the prior periodincluding a $39 million impairment expense attributable tounitholders within our industrial operations segment.
Financial Position• Total assets and net debt increased by $7,737 million and $1,588
million, respectively, primarily due to the acquisitions completedduring 2017.
Subsequent Events• The Board of Directors declared a quarterly distribution in the amount of
$0.0625 per unit, payable on December 29, 2017, to unitholders of recordas at the close of business on November 30, 2017.
• The Board of Directors approved a $69 million incentive distributionpayment to Brookfield, payable on December 29, 2017, based on thevolume weighted average price of $29.34 (exceeding the previousincentive distribution threshold of $26.17/unit) and the time weightedaverage of 108.9 million units outstanding for the quarter. Going forwardthe incentive distribution threshold is $29.34/unit.
Primary FontColour
R0 G48 B87Logo & Divider Slide Font
Title Slide Font
LightBackgroundR17 G17 B17
Dark BackdropR255 G255 B255
R64 G126 B182
Sub-headers & EmphasisText
Business GroupColours
Real EstateR69 G152 B182
InfrastructureR83 G56 B82
RenewableR92 G153 B121
Private EquityR230 G202 B139
Additional PaletteColours
R244 G125 B32
R77 G77 B77
R200 G200 B200
On-screenR17 G17 B17
PrintR34 G34 B35
6
Statement of Operating Results
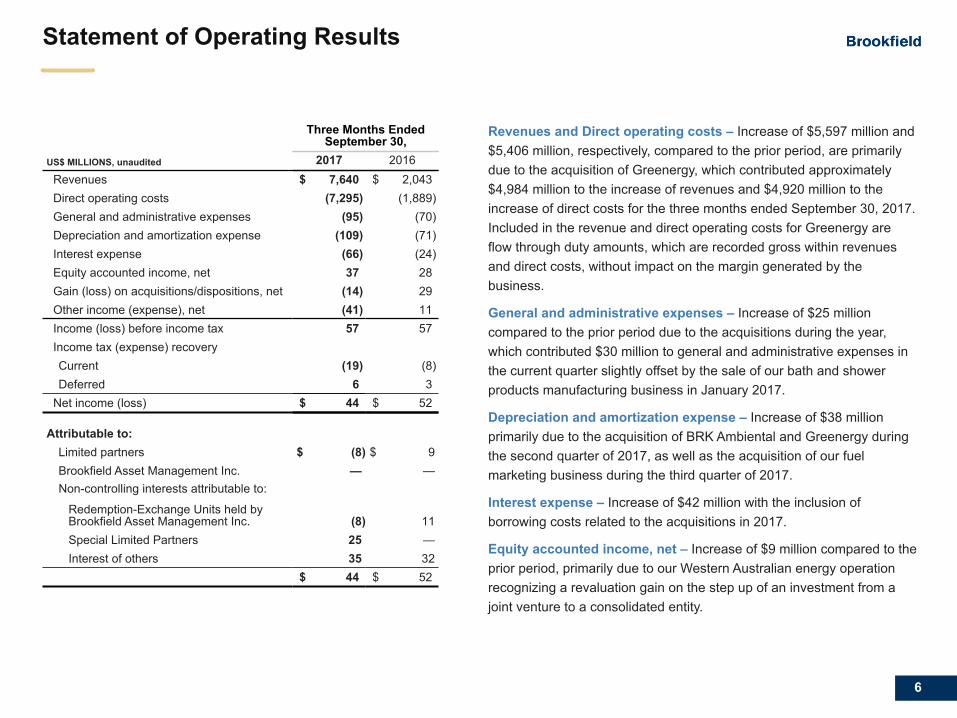
Revenues and Direct operating costs – Increase of $5,597 million and$5,406 million, respectively, compared to the prior period, are primarilydue to the acquisition of Greenergy, which contributed approximately$4,984 million to the increase of revenues and $4,920 million to theincrease of direct costs for the three months ended September 30, 2017.Included in the revenue and direct operating costs for Greenergy areflow through duty amounts, which are recorded gross within revenuesand direct costs, without impact on the margin generated by thebusiness.
General and administrative expenses – Increase of $25 millioncompared to the prior period due to the acquisitions during the year,which contributed $30 million to general and administrative expenses inthe current quarter slightly offset by the sale of our bath and showerproducts manufacturing business in January 2017.
Depreciation and amortization expense – Increase of $38 millionprimarily due to the acquisition of BRK Ambiental and Greenergy duringthe second quarter of 2017, as well as the acquisition of our fuelmarketing business during the third quarter of 2017.
Interest expense – Increase of $42 million with the inclusion ofborrowing costs related to the acquisitions in 2017.
Equity accounted income, net – Increase of $9 million compared to theprior period, primarily due to our Western Australian energy operationrecognizing a revaluation gain on the step up of an investment from ajoint venture to a consolidated entity.
US$ MILLIONS, unaudited
Three Months EndedSeptember 30,
2017 2016Revenues $ 7,640 $ 2,043Direct operating costs (7,295) (1,889)General and administrative expenses (95) (70)Depreciation and amortization expense (109) (71)Interest expense (66) (24)Equity accounted income, net 37 28Gain (loss) on acquisitions/dispositions, net (14) 29Other income (expense), net (41) 11Income (loss) before income tax 57 57Income tax (expense) recoveryCurrent (19) (8)Deferred 6 3
Net income (loss) $ 44 $ 52
Attributable to:Limited partners $ (8) $ 9Brookfield Asset Management Inc. — —Non-controlling interests attributable to:
Redemption-Exchange Units held by Brookfield Asset Management Inc. (8) 11 Special Limited Partners 25 — Interest of others 35 32
$ 44 $ 52
Primary FontColour
R0 G48 B87Logo & Divider Slide Font
Title Slide Font
LightBackgroundR17 G17 B17
Dark BackdropR255 G255 B255
R64 G126 B182
Sub-headers & EmphasisText
Business GroupColours
Real EstateR69 G152 B182
InfrastructureR83 G56 B82
RenewableR92 G153 B121
Private EquityR230 G202 B139
Additional PaletteColours
R244 G125 B32
R77 G77 B77
R200 G200 B200
On-screenR17 G17 B17
PrintR34 G34 B35
7
Statement of Operating Results
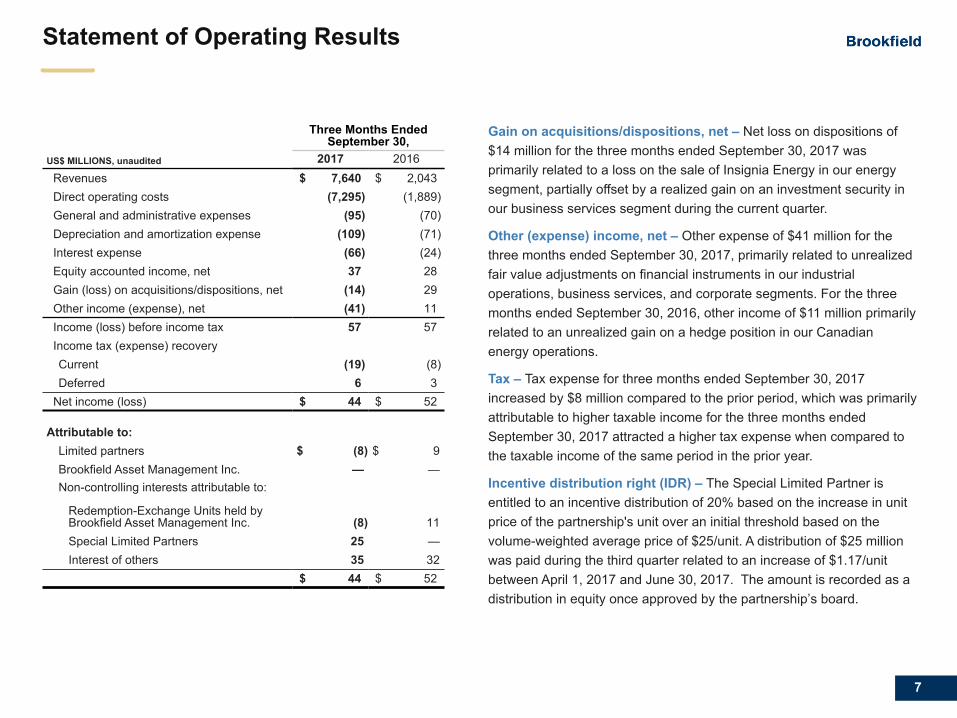
Gain on acquisitions/dispositions, net – Net loss on dispositions of$14 million for the three months ended September 30, 2017 wasprimarily related to a loss on the sale of Insignia Energy in our energysegment, partially offset by a realized gain on an investment security inour business services segment during the current quarter.
Other (expense) income, net – Other expense of $41 million for thethree months ended September 30, 2017, primarily related to unrealizedfair value adjustments on financial instruments in our industrialoperations, business services, and corporate segments. For the threemonths ended September 30, 2016, other income of $11 million primarilyrelated to an unrealized gain on a hedge position in our Canadianenergy operations.
Tax – Tax expense for three months ended September 30, 2017increased by $8 million compared to the prior period, which was primarilyattributable to higher taxable income for the three months endedSeptember 30, 2017 attracted a higher tax expense when compared tothe taxable income of the same period in the prior year.
Incentive distribution right (IDR) – The Special Limited Partner isentitled to an incentive distribution of 20% based on the increase in unitprice of the partnership's unit over an initial threshold based on thevolume-weighted average price of $25/unit. A distribution of $25 millionwas paid during the third quarter related to an increase of $1.17/unitbetween April 1, 2017 and June 30, 2017. The amount is recorded as adistribution in equity once approved by the partnership’s board.
US$ MILLIONS, unaudited
Three Months EndedSeptember 30,
2017 2016Revenues $ 7,640 $ 2,043Direct operating costs (7,295) (1,889)General and administrative expenses (95) (70)Depreciation and amortization expense (109) (71)Interest expense (66) (24)Equity accounted income, net 37 28Gain (loss) on acquisitions/dispositions, net (14) 29Other income (expense), net (41) 11Income (loss) before income tax 57 57Income tax (expense) recoveryCurrent (19) (8)Deferred 6 3
Net income (loss) $ 44 $ 52
Attributable to:Limited partners $ (8) $ 9Brookfield Asset Management Inc. — —Non-controlling interests attributable to:
Redemption-Exchange Units held by Brookfield Asset Management Inc. (8) 11 Special Limited Partners 25 — Interest of others 35 32
$ 44 $ 52

Primary FontColour
R0 G48 B87Logo & Divider Slide Font
Title Slide Font
LightBackgroundR17 G17 B17
Dark BackdropR255 G255 B255
R64 G126 B182
Sub-headers & EmphasisText
Business GroupColours
Real EstateR69 G152 B182
InfrastructureR83 G56 B82
RenewableR92 G153 B121
Private EquityR230 G202 B139
Additional PaletteColours
R244 G125 B32
R77 G77 B77
R200 G200 B200
On-screenR17 G17 B17
PrintR34 G34 B35
8
Statement of Financial Position
Cash and cash equivalents – Cash and cash equivalents included$604 million of corporate cash available for general corporate purposesand to fund growth opportunities. In addition, the September 30, 2017balance included $226 million of cash and cash equivalents within ourindustrial operations, $334 million at our construction operations, $399million at our business services operations, and $10 million at our energyoperations.
Accounts and other receivable, net – The $2,260 million increaserelative to December 31, 2016, was primarily related to the acquisition ofGreenergy and BRK Ambiental during the second quarter of 2017, aswell as increased activity in our construction services operation.
Inventory and other assets – Increase of $857 million, primarily relatedto the acquisition of Greenergy, which contributed $781 million to thebalance as at September 30, 2017. The Greenergy inventory and otherassets balance included fuel inventories and Renewable Transport FuelObligation (RTFO) certificates. RTFO's are generated on blending ofbiofuel into the fuel Greenergy supplies, and these certificates can besold to other oil companies.
Assets held for sale – The balance decreased compared toDecember 31, 2016 primarily due to the disposition of our bath andshower products manufacturing operation in the first quarter of 2017.The balance as at September 30, 2017, was comprised of certain non-core operations within our graphite electrode manufacturing business.
Property, plant and equipment – The $473 million increase wasprimarily related to the acquisitions within our business services andindustrial operations segments since December 31, 2016.
US$ MILLIONS, unaudited
As atSep 30,
2017Dec 31,
2016
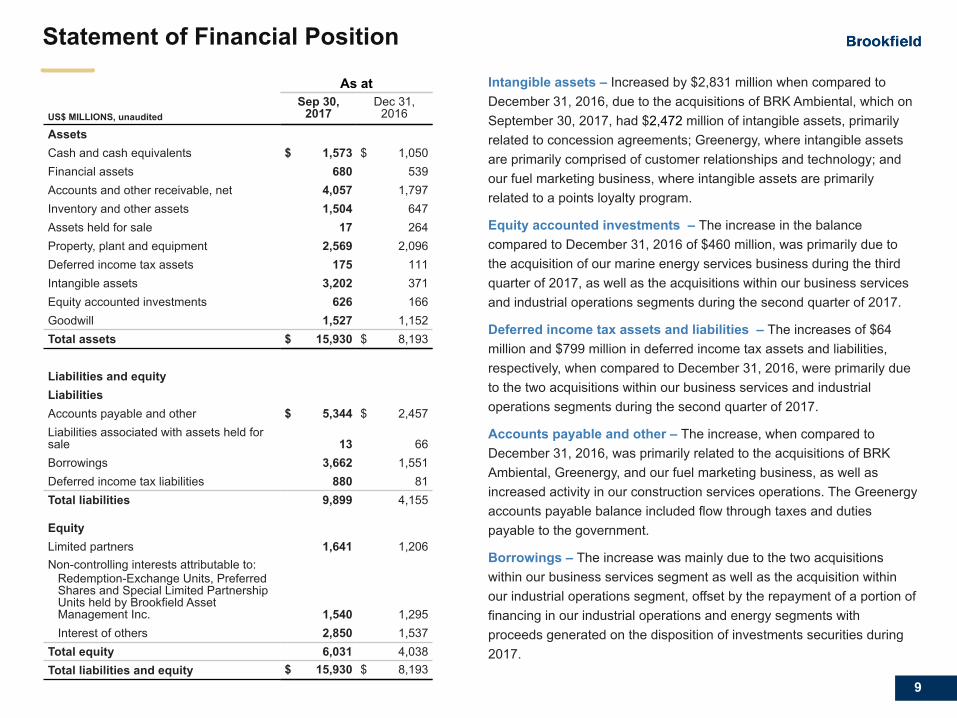
AssetsCash and cash equivalents $ 1,573 $ 1,050Financial assets 680 539Accounts and other receivable, net 4,057 1,797Inventory and other assets 1,504 647Assets held for sale 17 264Property, plant and equipment 2,569 2,096Deferred income tax assets 175 111Intangible assets 3,202 371Equity accounted investments 626 166Goodwill 1,527 1,152Total assets $ 15,930 $ 8,193
Liabilities and equityLiabilitiesAccounts payable and other $ 5,344 $ 2,457Liabilities associated with assets held forsale 13 66Borrowings 3,662 1,551Deferred income tax liabilities 880 81Total liabilities 9,899 4,155
EquityLimited partners 1,641 1,206Non-controlling interests attributable to: Redemption-Exchange Units, Preferred Shares and Special Limited Partnership Units held by Brookfield Asset Management Inc. 1,540 1,295 Interest of others 2,850 1,537Total equity 6,031 4,038Total liabilities and equity $ 15,930 $ 8,193
Primary FontColour
R0 G48 B87Logo & Divider Slide Font
Title Slide Font
LightBackgroundR17 G17 B17
Dark BackdropR255 G255 B255
R64 G126 B182
Sub-headers & EmphasisText
Business GroupColours
Real EstateR69 G152 B182
InfrastructureR83 G56 B82
RenewableR92 G153 B121
Private EquityR230 G202 B139
Additional PaletteColours
R244 G125 B32
R77 G77 B77
R200 G200 B200
On-screenR17 G17 B17
PrintR34 G34 B35
9
Statement of Financial Position
Intangible assets – Increased by $2,831 million when compared toDecember 31, 2016, due to the acquisitions of BRK Ambiental, which onSeptember 30, 2017, had $2,472 million of intangible assets, primarilyrelated to concession agreements; Greenergy, where intangible assetsare primarily comprised of customer relationships and technology; andour fuel marketing business, where intangible assets are primarilyrelated to a points loyalty program.
Equity accounted investments – The increase in the balancecompared to December 31, 2016 of $460 million, was primarily due tothe acquisition of our marine energy services business during the thirdquarter of 2017, as well as the acquisitions within our business servicesand industrial operations segments during the second quarter of 2017.
Deferred income tax assets and liabilities – The increases of $64million and $799 million in deferred income tax assets and liabilities,respectively, when compared to December 31, 2016, were primarily dueto the two acquisitions within our business services and industrialoperations segments during the second quarter of 2017.
Accounts payable and other – The increase, when compared toDecember 31, 2016, was primarily related to the acquisitions of BRKAmbiental, Greenergy, and our fuel marketing business, as well asincreased activity in our construction services operations. The Greenergyaccounts payable balance included flow through taxes and dutiespayable to the government.
Borrowings – The increase was mainly due to the two acquisitionswithin our business services segment as well as the acquisition withinour industrial operations segment, offset by the repayment of a portion offinancing in our industrial operations and energy segments withproceeds generated on the disposition of investments securities during2017.
US$ MILLIONS, unaudited
As atSep 30,
2017Dec 31,
2016
AssetsCash and cash equivalents $ 1,573 $ 1,050Financial assets 680 539Accounts and other receivable, net 4,057 1,797Inventory and other assets 1,504 647Assets held for sale 17 264Property, plant and equipment 2,569 2,096Deferred income tax assets 175 111Intangible assets 3,202 371Equity accounted investments 626 166Goodwill 1,527 1,152Total assets $ 15,930 $ 8,193
Liabilities and equityLiabilitiesAccounts payable and other $ 5,344 $ 2,457Liabilities associated with assets held forsale 13 66Borrowings 3,662 1,551Deferred income tax liabilities 880 81Total liabilities 9,899 4,155
EquityLimited partners 1,641 1,206Non-controlling interests attributable to: Redemption-Exchange Units, Preferred Shares and Special Limited Partnership Units held by Brookfield Asset Management Inc. 1,540 1,295 Interest of others 2,850 1,537Total equity 6,031 4,038Total liabilities and equity $ 15,930 $ 8,193
10
Operating Segments
Primary FontColour
R0 G48 B87Logo & Divider Slide Font
Title Slide Font
LightBackgroundR17 G17 B17
Dark BackdropR255 G255 B255
R64 G126 B182
Sub-headers & EmphasisText
Business GroupColours
Real EstateR69 G152 B182
InfrastructureR83 G56 B82
RenewableR92 G153 B121
Private EquityR230 G202 B139
Additional PaletteColours
R244 G125 B32
R77 G77 B77
R200 G200 B200
On-screenR17 G17 B17
PrintR34 G34 B35
11
Construction Services
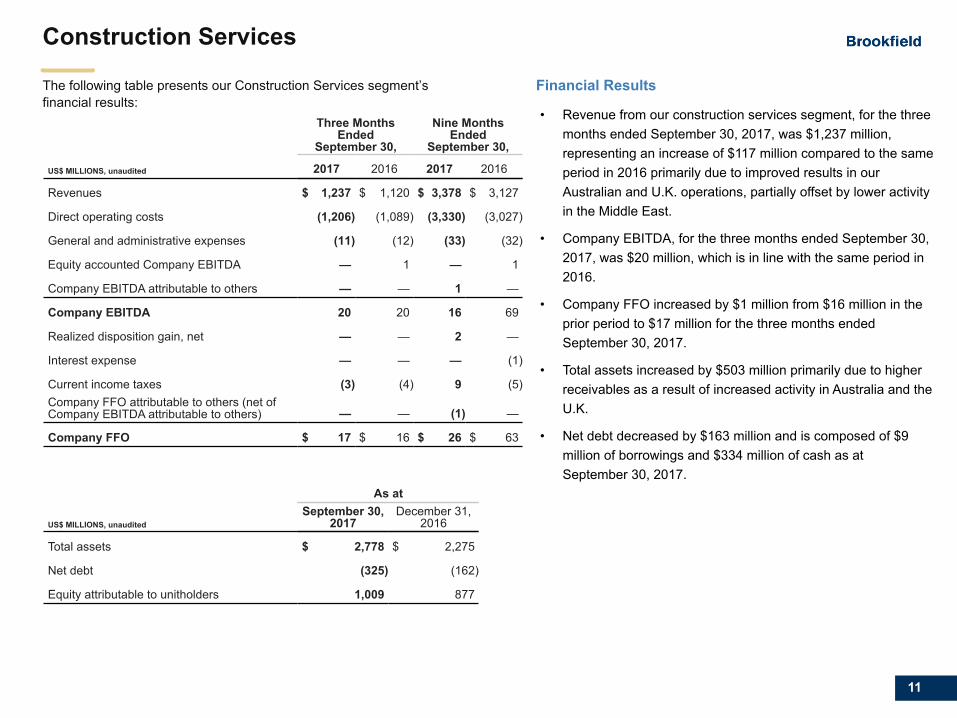
• Revenue from our construction services segment, for the threemonths ended September 30, 2017, was $1,237 million,representing an increase of $117 million compared to the sameperiod in 2016 primarily due to improved results in ourAustralian and U.K. operations, partially offset by lower activityin the Middle East.
• Company EBITDA, for the three months ended September 30,2017, was $20 million, which is in line with the same period in2016.
• Company FFO increased by $1 million from $16 million in theprior period to $17 million for the three months endedSeptember 30, 2017.
• Total assets increased by $503 million primarily due to higherreceivables as a result of increased activity in Australia and theU.K.
• Net debt decreased by $163 million and is composed of $9million of borrowings and $334 million of cash as atSeptember 30, 2017.
US$ MILLIONS, unaudited
Three MonthsEnded
September 30,
Nine MonthsEnded
September 30,
2017 2016 2017 2016
Revenues $ 1,237 $ 1,120 $ 3,378 $ 3,127
Direct operating costs (1,206) (1,089) (3,330) (3,027)
General and administrative expenses (11) (12) (33) (32)
Equity accounted Company EBITDA — 1 — 1
Company EBITDA attributable to others — — 1 —
Company EBITDA 20 20 16 69
Realized disposition gain, net — — 2 —
Interest expense — — — (1)
Current income taxes (3) (4) 9 (5)Company FFO attributable to others (net ofCompany EBITDA attributable to others) — — (1) —
Company FFO $ 17 $ 16 $ 26 $ 63
US$ MILLIONS, unaudited
As atSeptember 30,
2017December 31,
2016
Total assets $ 2,778 $ 2,275
Net debt (325) (162)
Equity attributable to unitholders 1,009 877
Financial ResultsThe following table presents our Construction Services segment’sfinancial results:

Primary FontColour
R0 G48 B87Logo & Divider Slide Font
Title Slide Font
LightBackgroundR17 G17 B17
Dark BackdropR255 G255 B255
R64 G126 B182
Sub-headers & EmphasisText
Business GroupColours
Real EstateR69 G152 B182
InfrastructureR83 G56 B82
RenewableR92 G153 B121
Private EquityR230 G202 B139
Additional PaletteColours
R244 G125 B32
R77 G77 B77
R200 G200 B200
On-screenR17 G17 B17
PrintR34 G34 B35
12
The following table presents our Business Services segment’s financialresults:
Business Services
• Revenue and direct operating costs from our business servicessegment increased by $5,324 million and $5,246 million,respectively, for the three months ended September 30, 2017.$4,984 million of the increase in revenues and $4,920 millionof the increase in direct operating costs is related to theacquisition of Greenergy. Included in the revenue and directoperating costs for Greenergy are flow through duty amounts,which are recorded gross within revenues and direct costs,without impact on the margin generated by the business. Inaddition, the acquisition of a fuel marketing business in July2017 also contributed to the increase in revenue and directoperating costs.
• Company EBITDA was $4 million higher for the three monthsended September 30, 2017 compared to the same period inthe prior year, primarily due to contributions from theacquisition of Greenergy in the second quarter of 2017 and ourfuel marketing business in the third quarter of 2017. Theincrease was partially offset by a lower contribution from ourfinancial advisory service business.
• Company FFO of $23 million for the quarter was $5 millionhigher than Company FFO for the three months endedSeptember 30, 2016, due to the aforementioned acquisitionsand contributions from the sale of an investment securityduring the quarter, partially offset by lower contributions fromour financial advisory service business.
• Total assets and net debt increased by $3,191 million and$804 million, respectively due to the acquisitions of Greenergyand our fuel marketing business. Net debt is composed of$399 million of cash and $1,438 million of borrowings atSeptember 30, 2017.
US$ MILLIONS, unaudited
As at
September 30,2017
December 31,2016
Total assets $ 4,881 $ 1,690
Net debt 1,039 235
Equity attributable to unitholders 371 357
US$ MILLIONS, unaudited
Three MonthsEnded
September 30,
Nine MonthsEnded
September 30,
2017 2016 2017 2016
Revenues $ 5,833 $ 509 $ 9,722 $ 1,442
Direct operating costs (5,703) (457) (9,493) (1,304)
General and administrative expenses (39) (26) (92) (76)
Equity accounted Company EBITDA 8 8 23 18
Company EBITDA attributable to others (72) (11) (112) (31)
Company EBITDA 27 23 48 49
Realized disposition gain, net 11 — 17 —
Interest expense (15) (4) (28) (11)
Current income taxes (12) (3) (16) (9)Company FFO attributable to others (net ofCompany EBITDA attributable to others) 12 2 23 6
Company FFO $ 23 $ 18 $ 44 $ 35
Financial Results
Primary FontColour
R0 G48 B87Logo & Divider Slide Font
Title Slide Font
LightBackgroundR17 G17 B17
Dark BackdropR255 G255 B255
R64 G126 B182
Sub-headers & EmphasisText
Business GroupColours
Real EstateR69 G152 B182
InfrastructureR83 G56 B82
RenewableR92 G153 B121
Private EquityR230 G202 B139
Additional PaletteColours
R244 G125 B32
R77 G77 B77
R200 G200 B200
On-screenR17 G17 B17
PrintR34 G34 B35
13
The following table presents our Energy segment’s financial results:
Energy
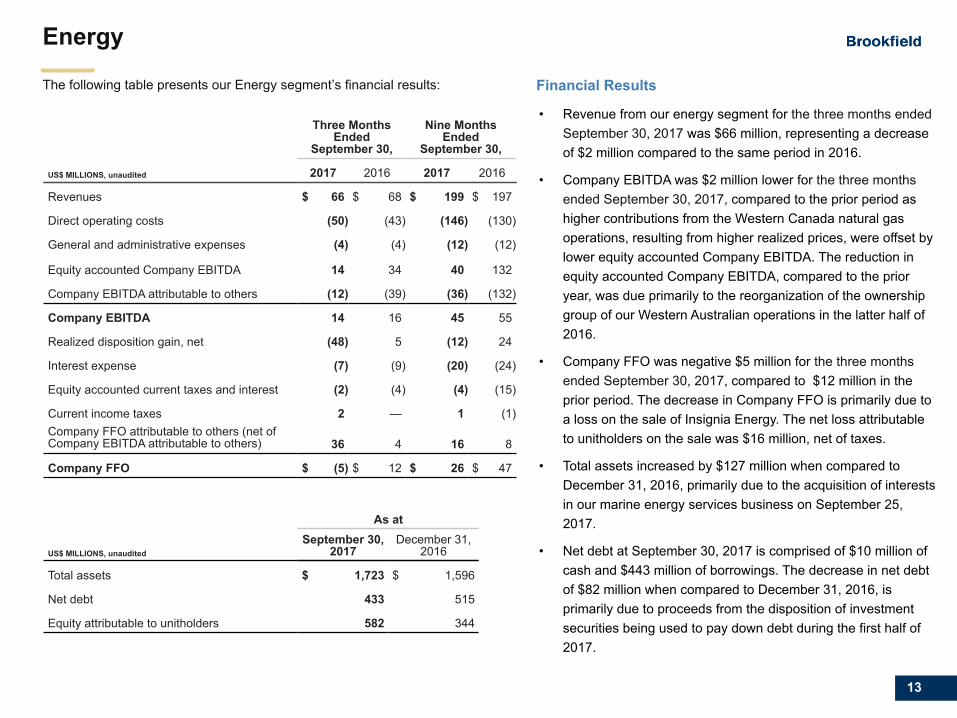
• Revenue from our energy segment for the three months endedSeptember 30, 2017 was $66 million, representing a decreaseof $2 million compared to the same period in 2016.
• Company EBITDA was $2 million lower for the three monthsended September 30, 2017, compared to the prior period ashigher contributions from the Western Canada natural gasoperations, resulting from higher realized prices, were offset bylower equity accounted Company EBITDA. The reduction inequity accounted Company EBITDA, compared to the prioryear, was due primarily to the reorganization of the ownershipgroup of our Western Australian operations in the latter half of2016.
• Company FFO was negative $5 million for the three monthsended September 30, 2017, compared to $12 million in theprior period. The decrease in Company FFO is primarily due toa loss on the sale of Insignia Energy. The net loss attributableto unitholders on the sale was $16 million, net of taxes.
• Total assets increased by $127 million when compared toDecember 31, 2016, primarily due to the acquisition of interestsin our marine energy services business on September 25,2017.
• Net debt at September 30, 2017 is comprised of $10 million ofcash and $443 million of borrowings. The decrease in net debtof $82 million when compared to December 31, 2016, isprimarily due to proceeds from the disposition of investmentsecurities being used to pay down debt during the first half of2017.
US$ MILLIONS, unaudited
Three MonthsEnded
September 30,
Nine MonthsEnded
September 30,
2017 2016 2017 2016
Revenues $ 66 $ 68 $ 199 $ 197
Direct operating costs (50) (43) (146) (130)
General and administrative expenses (4) (4) (12) (12)
Equity accounted Company EBITDA 14 34 40 132
Company EBITDA attributable to others (12) (39) (36) (132)
Company EBITDA 14 16 45 55
Realized disposition gain, net (48) 5 (12) 24
Interest expense (7) (9) (20) (24)
Equity accounted current taxes and interest (2) (4) (4) (15)
Current income taxes 2 — 1 (1)Company FFO attributable to others (net ofCompany EBITDA attributable to others) 36 4 16 8
Company FFO $ (5) $ 12 $ 26 $ 47
US$ MILLIONS, unaudited
As atSeptember 30,
2017December 31,
2016
Total assets $ 1,723 $ 1,596
Net debt 433 515
Equity attributable to unitholders 582 344
Financial Results
Primary FontColour
R0 G48 B87Logo & Divider Slide Font
Title Slide Font
LightBackgroundR17 G17 B17
Dark BackdropR255 G255 B255
R64 G126 B182
Sub-headers & EmphasisText
Business GroupColours
Real EstateR69 G152 B182
InfrastructureR83 G56 B82
RenewableR92 G153 B121
Private EquityR230 G202 B139
Additional PaletteColours
R244 G125 B32
R77 G77 B77
R200 G200 B200
On-screenR17 G17 B17
PrintR34 G34 B35
14
The following table presents our Industrial Operations segment’s financialresults:
Industrial Operations
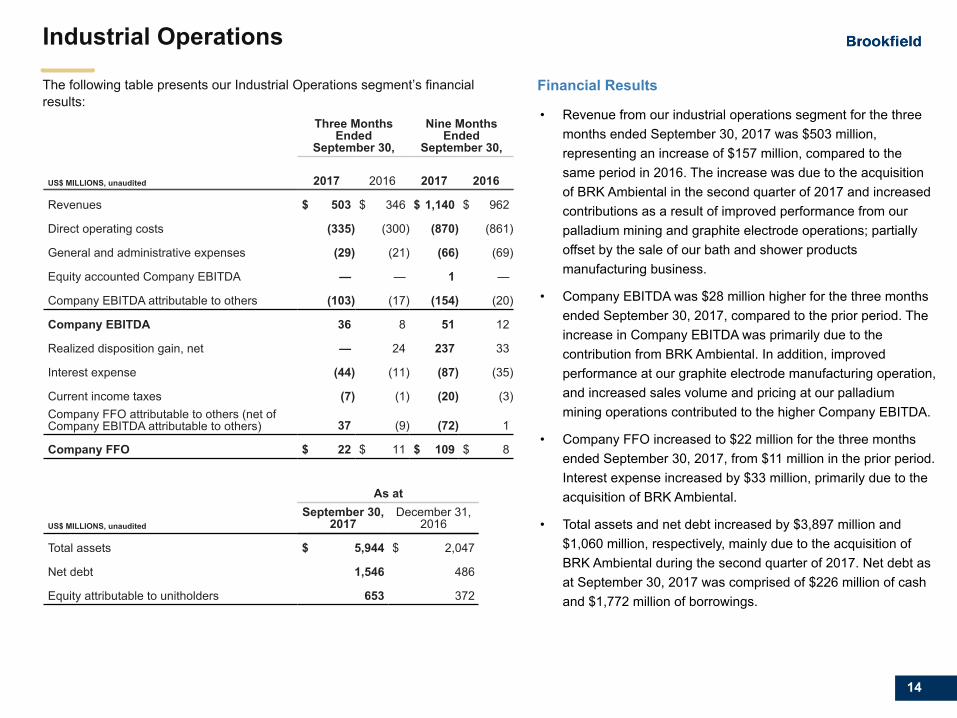
• Revenue from our industrial operations segment for the threemonths ended September 30, 2017 was $503 million,representing an increase of $157 million, compared to thesame period in 2016. The increase was due to the acquisitionof BRK Ambiental in the second quarter of 2017 and increasedcontributions as a result of improved performance from ourpalladium mining and graphite electrode operations; partiallyoffset by the sale of our bath and shower productsmanufacturing business.
• Company EBITDA was $28 million higher for the three monthsended September 30, 2017, compared to the prior period. Theincrease in Company EBITDA was primarily due to thecontribution from BRK Ambiental. In addition, improvedperformance at our graphite electrode manufacturing operation,and increased sales volume and pricing at our palladiummining operations contributed to the higher Company EBITDA.
• Company FFO increased to $22 million for the three monthsended September 30, 2017, from $11 million in the prior period.Interest expense increased by $33 million, primarily due to theacquisition of BRK Ambiental.
• Total assets and net debt increased by $3,897 million and$1,060 million, respectively, mainly due to the acquisition ofBRK Ambiental during the second quarter of 2017. Net debt asat September 30, 2017 was comprised of $226 million of cashand $1,772 million of borrowings.
US$ MILLIONS, unaudited
Three MonthsEnded
September 30,
Nine MonthsEnded
September 30,
2017 2016 2017 2016
Revenues $ 503 $ 346 $ 1,140 $ 962
Direct operating costs (335) (300) (870) (861)
General and administrative expenses (29) (21) (66) (69)
Equity accounted Company EBITDA — — 1 —
Company EBITDA attributable to others (103) (17) (154) (20)
Company EBITDA 36 8 51 12
Realized disposition gain, net — 24 237 33
Interest expense (44) (11) (87) (35)
Current income taxes (7) (1) (20) (3)Company FFO attributable to others (net ofCompany EBITDA attributable to others) 37 (9) (72) 1
Company FFO $ 22 $ 11 $ 109 $ 8
US$ MILLIONS, unaudited
As atSeptember 30,
2017December 31,
2016
Total assets $ 5,944 $ 2,047
Net debt 1,546 486
Equity attributable to unitholders 653 372
Financial Results
Primary FontColour
R0 G48 B87Logo & Divider Slide Font
Title Slide Font
LightBackgroundR17 G17 B17
Dark BackdropR255 G255 B255
R64 G126 B182
Sub-headers & EmphasisText
Business GroupColours
Real EstateR69 G152 B182
InfrastructureR83 G56 B82
RenewableR92 G153 B121
Private EquityR230 G202 B139
Additional PaletteColours
R244 G125 B32
R77 G77 B77
R200 G200 B200
On-screenR17 G17 B17
PrintR34 G34 B35
15
Corporate and Other
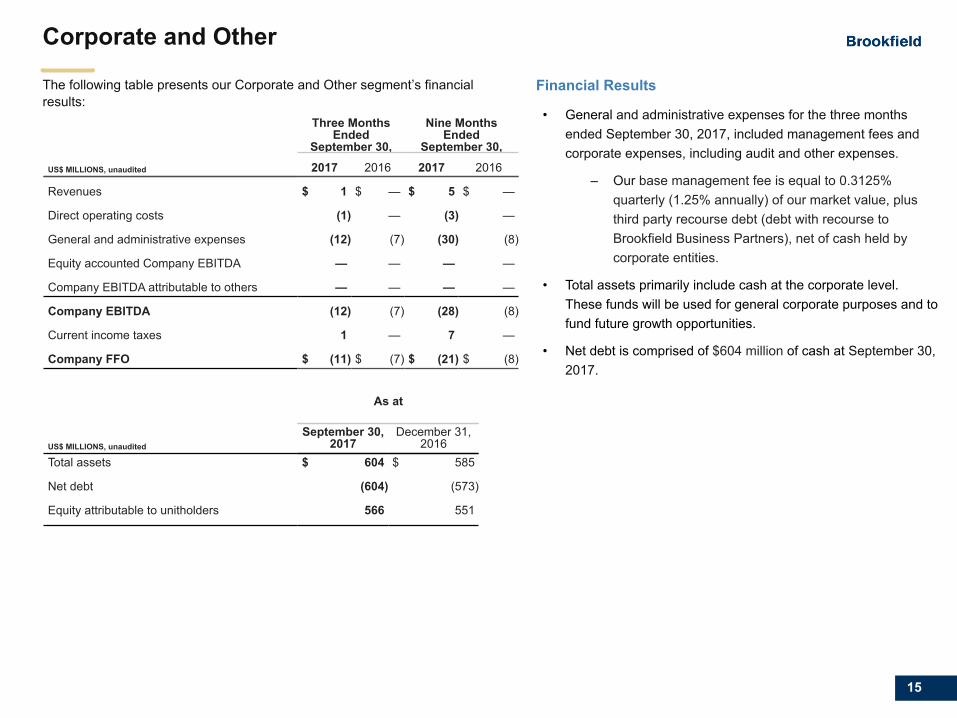
• General and administrative expenses for the three monthsended September 30, 2017, included management fees andcorporate expenses, including audit and other expenses.
– Our base management fee is equal to 0.3125%quarterly (1.25% annually) of our market value, plusthird party recourse debt (debt with recourse toBrookfield Business Partners), net of cash held bycorporate entities.
• Total assets primarily include cash at the corporate level.These funds will be used for general corporate purposes and tofund future growth opportunities.
• Net debt is comprised of $604 million of cash at September 30,2017.
The following table presents our Corporate and Other segment’s financialresults:
US$ MILLIONS, unaudited
Three MonthsEnded
September 30,
Nine MonthsEnded
September 30,2017 2016 2017 2016
Revenues $ 1 $ — $ 5 $ —
Direct operating costs (1) — (3) —
General and administrative expenses (12) (7) (30) (8)
Equity accounted Company EBITDA — — — —
Company EBITDA attributable to others — — — —
Company EBITDA (12) (7) (28) (8)
Current income taxes 1 — 7 —
Company FFO $ (11) $ (7) $ (21) $ (8)
US$ MILLIONS, unaudited
As at
September 30,2017
December 31,2016
Total assets $ 604 $ 585
Net debt (604) (573)
Equity attributable to unitholders 566 551
Financial Results
16
Appendix

17
Primary FontColour
R0 G48 B87
Logo & Divider Slide Font
Title Slide Font
LightBackgroundR17 G17 B17
Dark BackdropR255 G255 B255
R64 G126 B182
Sub-headers & EmphasisText
Business GroupColours
Real EstateR69 G152 B182
InfrastructureR83 G56 B82
RenewableR92 G153 B121
Private EquityR230 G202 B139
Additional PaletteColours
R244 G125 B32
R77 G77 B77
R200 G200 B200
On-screenR17 G17 B17
PrintR34 G34 B35
The following table presents our results from operations for the eight most recent quarters
US$ MILLIONS, unaudited
2017 2016 2015
Q3 Q2 Q1 Q4 Q3 Q2 Q1 Q4Revenues $ 7,640 $ 4,870 $ 1,934 $ 2,232 $ 2,043 $ 2,008 $ 1,677 $ 2,087Direct operating costs (7,295) (4,673) (1,874) (2,064) (1,889) (1,865) (1,569) (1,909)General and administrative expenses (95) (76) (62) (72) (70) (64) (62) (68)Depreciation and amortization expense (109) (88) (65) (67) (71) (76) (72) (70)Interest expense (66) (50) (19) (19) (24) (23) (24) (29)Equity accounted income, net 37 14 10 (7) 28 20 27 (35)Impairment expense, net — (23) (7) (155) — (106) — (7)Gain (loss) on acquisitions/dispositions, net (14) 9 272 — 29 28 — —Other income (expense), net (41) (9) 14 9 11 (21) (10) 21Income (loss) before income tax 57 (26) 203 (143) 57 (99) (33) (10)Income tax (expense) recovery
Current (19) (4) 4 (7) (8) (7) (3) (17)Deferred 6 4 (4) 16 3 15 7 (14)
Net (loss) income $ 44 $ (26) $ 203 $ (134) $ 52 $ (91) $ (29) $ (41)Attributable to:
Limited Partners $ (8) $ (3) $ 32 $ (5) $ 9 $ (1) $ — $ —Brookfield Asset Management Inc. — — — — — (30) (5) 2Non-controlling interests attributable to: Redemption-Exchange Units held by Brookfield Asset Management Inc. (8) (3) 34 (6) 11 (2) — — Special Limited Partners 25 — — — — — — — Interest of others 35 (20) 137 (123) 32 (58) (24) (43)
$ 44 $ (26) $ 203 $ (134) $ 52 $ (91) $ (29) $ (41)
Summary of Results by Quarter
Revenue and operating costs vary from quarter to quarter primarily due to acquisitions of businesses, fluctuations in foreign exchange rates,business and economic cycles, and weather and seasonality in underlying operations. Broader economic factors and commodity market volatility,in particular, can have a significant impact on a number of our operations, specifically within our energy and industrial operations segment.Seasonality primarily affects our construction operations and some of our business services, which typically have stronger performance in thelatter half of the year. Our energy operations are also impacted by seasonality, usually generating stronger results in the first and fourth quarters.Net income is impacted by periodic gains and losses on acquisitions, monetization and impairments.

Primary FontColour
R0 G48 B87
Logo & Divider Slide FontTitle Slide Font
LightBackgroundR17 G17 B17
Dark BackdropR255 G255 B255R64 G126 B182
Sub-headers & EmphasisText
Business GroupColours
Real EstateR69 G152 B182
InfrastructureR83 G56 B82
RenewableR92 G153 B121
Private EquityR230 G202 B139
Additional PaletteColours
R244 G125 B32
R77 G77 B77
R200 G200 B200
On-screenR17 G17 B17
PrintR34 G34 B35
18
Reconciliation of Non-IFRS Measures to IFRS Measures
Reconciliation of Segmented Company EBITDA and Company FFO to Net Income
1) The sum of these amounts equate to equity accounted income of $37 million as per IFRS statement of operating results2) Total cash and non-cash items attributable to the interest of others equals a net gain of $35 million as per IFRS statement of operating results3) Attributable to limited partnership unitholders, general partnership unitholders, redemption-exchange unitholders, special limited partnership unitholders and to parent company
prior to the Spin-off4) The sum of these amounts equates to realized disposition loss of $14 million as per IFRS statement of operating results
For the THREE MONTHS ended SEPTEMBER 30, 2017 US$ MILLIONS,unaudited
ConstructionServices
BusinessServices Energy
IndustrialOperations
Corporate andOther
As per IFRSFinancials
Revenues $ 1,237 $ 5,833 $ 66 $ 503 $ 1 $ 7,640
Direct operating costs (1,206) (5,703) (50) (335) (1) (7,295)
General and administrative expenses (11) (39) (4) (29) (12) (95)
Equity accounted Company EBITDA1 — 8 14 — — 22
Company EBITDA attributable to others2 — (72) (12) (103) — (187)
Company EBITDA 20 27 14 36 (12) 85
Realized disposition gain (loss), net4 — 11 (48) — — (37)
Interest expense — (15) (7) (44) — (66)
Equity accounted current taxes and interest1 — — (2) — — (2)
Current income taxes (3) (12) 2 (7) 1 (19)
Company FFO attributable to others2 — 12 36 37 — 85
Company FFO3 17 23 (5) 22 (11) 46
Depreciation and amortization expense (109)
Impairment expense, net —Realized disposition gain (loss) recorded in priorperiods4 23
Other income (expense), net (41)
Deferred income taxes 6Non-cash items attributable to equity accountedinvestments1 17
Non-cash items attributable to others2 67
Net income attributable to unitholders3 $ 9
Primary FontColour
R0 G48 B87
Logo & Divider Slide FontTitle Slide Font
LightBackgroundR17 G17 B17
Dark BackdropR255 G255 B255R64 G126 B182
Sub-headers & EmphasisText
Business GroupColours
Real EstateR69 G152 B182
InfrastructureR83 G56 B82
RenewableR92 G153 B121
Private EquityR230 G202 B139
Additional PaletteColours
R244 G125 B32
R77 G77 B77
R200 G200 B200
On-screenR17 G17 B17
PrintR34 G34 B35
19
Reconciliation of Non-IFRS Measures to IFRS Measures
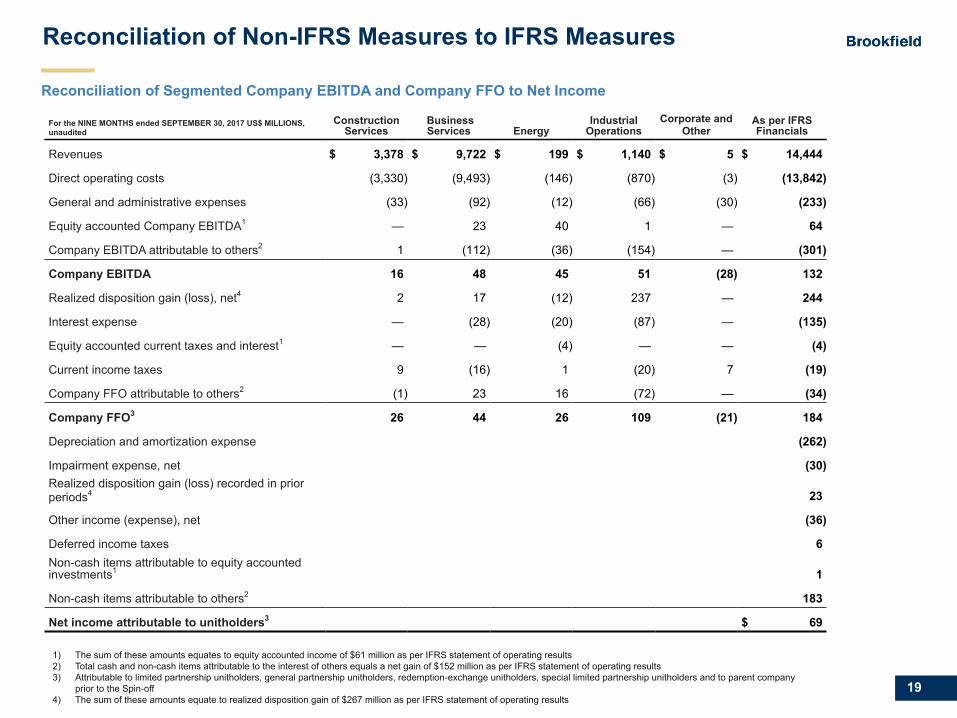
Reconciliation of Segmented Company EBITDA and Company FFO to Net Income
1) The sum of these amounts equates to equity accounted income of $61 million as per IFRS statement of operating results2) Total cash and non-cash items attributable to the interest of others equals a net gain of $152 million as per IFRS statement of operating results3) Attributable to limited partnership unitholders, general partnership unitholders, redemption-exchange unitholders, special limited partnership unitholders and to parent company
prior to the Spin-off4) The sum of these amounts equate to realized disposition gain of $267 million as per IFRS statement of operating results
For the NINE MONTHS ended SEPTEMBER 30, 2017 US$ MILLIONS,unaudited
ConstructionServices
BusinessServices Energy
IndustrialOperations
Corporate andOther
As per IFRSFinancials
Revenues $ 3,378 $ 9,722 $ 199 $ 1,140 $ 5 $ 14,444
Direct operating costs (3,330) (9,493) (146) (870) (3) (13,842)
General and administrative expenses (33) (92) (12) (66) (30) (233)
Equity accounted Company EBITDA1 — 23 40 1 — 64
Company EBITDA attributable to others2 1 (112) (36) (154) — (301)
Company EBITDA 16 48 45 51 (28) 132
Realized disposition gain (loss), net4 2 17 (12) 237 — 244
Interest expense — (28) (20) (87) — (135)
Equity accounted current taxes and interest1 — — (4) — — (4)
Current income taxes 9 (16) 1 (20) 7 (19)
Company FFO attributable to others2 (1) 23 16 (72) — (34)
Company FFO3 26 44 26 109 (21) 184
Depreciation and amortization expense (262)
Impairment expense, net (30)Realized disposition gain (loss) recorded in priorperiods4 23
Other income (expense), net (36)
Deferred income taxes 6Non-cash items attributable to equity accountedinvestments1 1
Non-cash items attributable to others2 183
Net income attributable to unitholders3 $ 69

Primary FontColour
R0 G48 B87
Logo & Divider Slide FontTitle Slide Font
LightBackgroundR17 G17 B17
Dark BackdropR255 G255 B255R64 G126 B182
Sub-headers & EmphasisText
Business GroupColours
Real EstateR69 G152 B182
InfrastructureR83 G56 B82
RenewableR92 G153 B121
Private EquityR230 G202 B139
Additional PaletteColours
R244 G125 B32
R77 G77 B77
R200 G200 B200
On-screenR17 G17 B17
PrintR34 G34 B35
20
Reconciliation of Non-IFRS Measures to IFRS Measures
Reconciliation of Segmented Company EBITDA and Company FFO to Net Income
For the THREE MONTHS ended SEPTEMBER 30, 2016US$ MILLIONS, unaudited
ConstructionServices
BusinessServices Energy
IndustrialOperations
Corporate andOther
As per IFRSFinancials
Revenues $ 1,120 $ 509 $ 68 $ 346 $ — $ 2,043
Direct operating costs (1,089) (457) (43) (300) — (1,889)
General and administrative expenses (12) (26) (4) (21) (7) (70)
Equity accounted Company EBITDA1 1 8 34 — — 43
Company EBITDA attributable to others² — (11) (39) (17) — (67)
Company EBITDA 20 23 16 8 (7) 60
Realized disposition gain (loss), net — — 5 24 — 29
Interest expense — (4) (9) (11) — (24)
Equity accounted current taxes and interest1 — — (4) — — (4)
Current income taxes (4) (3) — (1) — (8)
Company FFO attributable to others2 — 2 4 (9) — (3)
Company FFO 16 18 12 11 (7) 50
Depreciation and amortization expense (71)
Impairment expense, net —
Other income (expense), net 11
Deferred income taxes 3Non-cash items attributable to equity accountedinvestments1 (11)
Non-cash items attributable to others² 38
Net income attributable to unitholders3 $ 20
1) The sum of these amounts equate to equity accounted income of $28 million as per IFRS statement of operating results 2) Total cash and non-cash items attributable to the interest of others equals a net gain of $32 million as per IFRS statement of operating results3) Attributable to limited partnership unitholders, general partnership unitholders, redemption-exchange unitholders, special limited partnership unitholders and to parent
company prior to the Spin-off

Primary FontColour
R0 G48 B87
Logo & Divider Slide FontTitle Slide Font
LightBackgroundR17 G17 B17
Dark BackdropR255 G255 B255R64 G126 B182
Sub-headers & EmphasisText
Business GroupColours
Real EstateR69 G152 B182
InfrastructureR83 G56 B82
RenewableR92 G153 B121
Private EquityR230 G202 B139
Additional PaletteColours
R244 G125 B32
R77 G77 B77
R200 G200 B200
On-screenR17 G17 B17
PrintR34 G34 B35
21
Reconciliation of Non-IFRS Measures to IFRS Measures
Reconciliation of Segmented Company EBITDA and Company FFO to Net Income
For the NINE MONTHS ended SEPTEMBER 30, 2016US$ MILLIONS, unaudited
ConstructionServices
BusinessServices Energy
IndustrialOperations
Corporate andOther
As per IFRSFinancials
Revenues $ 3,127 $ 1,442 $ 197 $ 962 $ — $ 5,728
Direct operating costs (3,027) (1,304) (130) (861) — (5,322)
General and administrative expenses (32) (76) (12) (69) (8) (197)
Equity accounted Company EBITDA1 1 18 132 — — 151
Company EBITDA attributable to others² — (31) (132) (20) — (183)
Company EBITDA 69 49 55 12 (8) 177
Realized disposition gain (loss), net — — 24 33 — 57
Interest expense (1) (11) (24) (35) — (71)
Equity accounted current taxes and interest1 — — (15) — — (15)
Current income taxes (5) (9) (1) (3) — (18)
Company FFO attributable to others2 — 6 8 1 — 15
Company FFO 63 35 47 8 (8) 145
Depreciation and amortization expense (219)
Impairment expense, net (106)
Other income (expense), net (20)
Deferred income taxes 25Non-cash items attributable to equity accountedinvestments1 (61)
Non-cash items attributable to others² 218
Net income attributable to unitholders3 $ (18)
1) The sum of these amounts equate to equity accounted income of $75 million as per IFRS statement of operating results 2) Total cash and non-cash items attributable to the interest of others equals a net loss of $50 million as per IFRS statement of operating results3) Attributable to limited partnership unitholders, general partnership unitholders, redemption-exchange unitholders, special limited partnership unitholders and to parent
company prior to the Spin-off
Primary FontColour
R0 G48 B87
Logo & Divider Slide FontTitle Slide Font
LightBackgroundR17 G17 B17
Dark BackdropR255 G255 B255R64 G126 B182
Sub-headers & EmphasisText
Business GroupColours
Real EstateR69 G152 B182
InfrastructureR83 G56 B82
RenewableR92 G153 B121
Private EquityR230 G202 B139
Additional PaletteColours
R244 G125 B32
R77 G77 B77
R200 G200 B200
On-screenR17 G17 B17
PrintR34 G34 B35
22
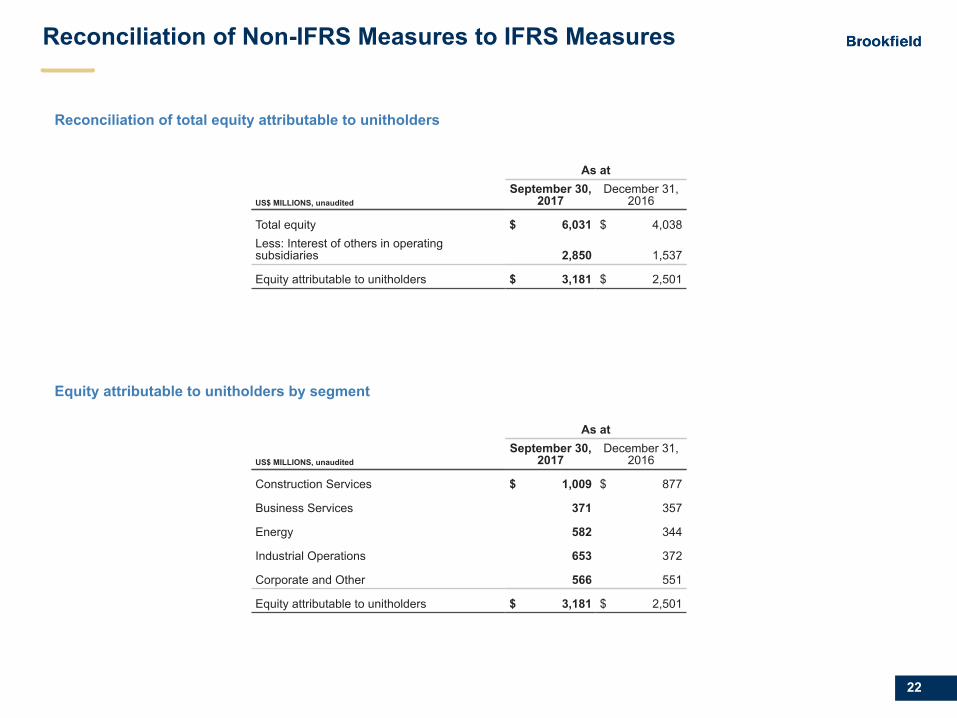
Equity attributable to unitholders by segment
Reconciliation of Non-IFRS Measures to IFRS Measures
Reconciliation of total equity attributable to unitholders
US$ MILLIONS, unaudited
As atSeptember 30,
2017December 31,
2016
Total equity $ 6,031 $ 4,038Less: Interest of others in operatingsubsidiaries 2,850 1,537
Equity attributable to unitholders $ 3,181 $ 2,501
US$ MILLIONS, unaudited
As atSeptember 30,
2017December 31,
2016
Construction Services $ 1,009 $ 877
Business Services 371 357
Energy 582 344
Industrial Operations 653 372
Corporate and Other 566 551
Equity attributable to unitholders $ 3,181 $ 2,501
Primary FontColour
R0 G48 B87
Logo & Divider Slide FontTitle Slide Font
LightBackgroundR17 G17 B17
Dark BackdropR255 G255 B255R64 G126 B182
Sub-headers & EmphasisText
Business GroupColours
Real EstateR69 G152 B182
InfrastructureR83 G56 B82
RenewableR92 G153 B121
Private EquityR230 G202 B139
Additional PaletteColours
R244 G125 B32
R77 G77 B77
R200 G200 B200
On-screenR17 G17 B17
PrintR34 G34 B35
23
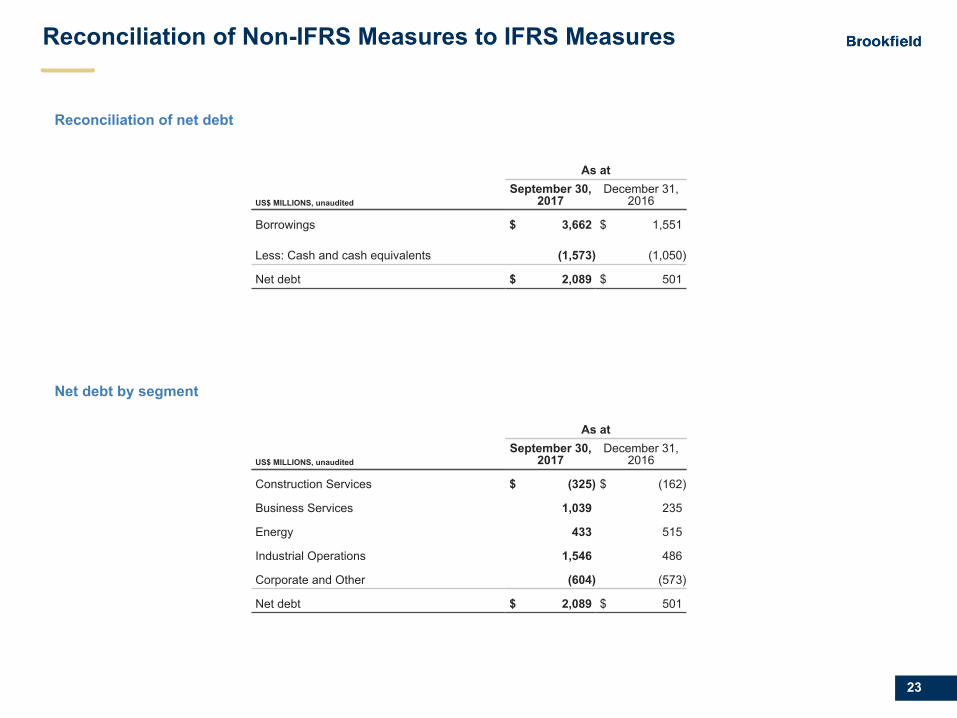
Net debt by segment
Reconciliation of Non-IFRS Measures to IFRS Measures
Reconciliation of net debt
US$ MILLIONS, unaudited
As atSeptember 30,
2017December 31,
2016
Borrowings $ 3,662 $ 1,551
Less: Cash and cash equivalents (1,573) (1,050)
Net debt $ 2,089 $ 501
US$ MILLIONS, unaudited
As atSeptember 30,
2017December 31,
2016
Construction Services $ (325) $ (162)
Business Services 1,039 235
Energy 433 515
Industrial Operations 1,546 486
Corporate and Other (604) (573)
Net debt $ 2,089 $ 501

24
Primary FontColour
R0 G48 B87
Logo & Divider Slide Font
Title Slide Font
LightBackgroundR17 G17 B17
Dark BackdropR255 G255 B255
R64 G126 B182
Sub-headers & EmphasisText
Business GroupColours
Real EstateR69 G152 B182
InfrastructureR83 G56 B82
RenewableR92 G153 B121
Private EquityR230 G202 B139
Additional PaletteColours
R244 G125 B32
R77 G77 B77
R200 G200 B200
On-screenR17 G17 B17
PrintR34 G34 B35 Definitions
• Company Funds From Operations (Company FFO), where applicable, is a key measure of our financial performance and weuse Company FFO to assess operating results and our business performance. Company FFO is a non-IFRS measure whichdoes not have any standard meaning prescribed by IFRS and therefore may not be comparable to similar measures presentedby other companies. Company FFO is calculated as net income excluding the impact of depreciation and amortization, deferredincome taxes, breakage and transaction costs, non-cash gains or losses and other items. Company FFO is presented net tounitholders, or net to parent company. When determining Company FFO, we include our proportionate share of Company FFOof equity accounted investments. For further information on Company FFO see “Use of Non IFRS Measures” on page 5 of the2016 20-F.
• Company EBITDA, where applicable, is a key measure of our financial performance and we use Company EBITDA to assessoperating results and our business performance. Company EBITDA is non-IFRS measure which does not have any standardmeaning prescribed by IFRS and therefore may not be comparable to similar measures presented by other companies.Company FFO is further adjusted as Company EBITDA to exclude the impact of realized disposition gains (losses), interestexpense, current income taxes, and realized disposition gain, current income taxes and interest expenses related to equityaccounted investments. Company EBITDA is presented net to unitholders, or net to parent company. For further information onCompany EBITDA see “Use of Non-IFRS Measures” on page 5 of the 2016 20-F.
• Equity accounted Company EBITDA is exclusive of non-cash items, realized disposition gains, current income taxes and interestexpenses included within equity accounted income.
• Equity attributable to unitholders is exclusive of the equity interest of others in our operating subsidiaries.
• Net (loss) income attributable to unitholders is exclusive of the net (loss) income attributable to others in our operatingsubsidiaries.
• Unitholders are defined as the parent company prior to the Spin-off on June 20, 2016 and as limited partnership unitholders,general partnership unitholders, special limited partnership unitholders, and redemption-exchange unitholders post Spin-off.
• Net debt is calculated by subtracting cash and cash equivalents from borrowings.