brookfield renewable partners l.p. q3 2018 supplemental
TRANSCRIPT
BROOKFIELD RENEWABLE PARTNERS L.P.
Q3 2018 Supplemental
Three and Nine Months Ended September 30, 2018
Information
2
CAUTIONARY STATEMENT REGARDING FORWARD-LOOKING STATEMENTS
This Supplemental Information, dated October 31, 2018, contains forward-looking statements and information, within the meaning of Canadian securities laws and “forward-looking statements” within the meaning
of Section 27A of the U.S. Securities Act of 1933, as amended, Section 21E of the U.S. Securities Exchange Act of 1934, as amended, “safe harbor” provisions of the United States Private Securities Litigation
Reform Act of 1995 and in any applicable Canadian securities regulations, concerning the business and operations of Brookfield Renewable. Forward-looking statements may include estimates, plans,
expectations, opinions, forecasts, projections, guidance or other statements that are not statements of fact. Forward-looking statements in this Supplemental Information include statements regarding the quality of
Brookfield Renewable’s assets and the resiliency of the cash flow they will generate, Brookfield Renewable’s anticipated financial performance and payout ratio, future commissioning of assets, contracted nature
of our portfolio, technology diversification, acquisition opportunities, expected completion of acquisitions, financing and refinancing opportunities, future energy prices and demand for electricity, economic recovery,
achieving long-term average generation, project development and capital expenditure costs, energy policies, economic growth, growth potential of the renewable asset class, the future growth prospects and
distribution profile of Brookfield Renewable and Brookfield Renewable’s access to capital. In some cases, forward-looking statements can be identified by the use of words such as “plans”, “expects”, “scheduled”,
“estimates”, “intends”, “anticipates”, “believes”, “potentially”, “tends”, “continue”, “attempts”, “likely”, “primarily”, “approximately”, “endeavours”, “pursues”, “strives”, “seeks”, “targets”, “believes”, or variations of such
words and phrases, or statements that certain actions, events or results “may”, “could”, “would”, “should”, “might” or “will” be taken, occur or be achieved. Although we believe that our anticipated future results,
performance or achievements expressed or implied by the forward-looking statements and information in this Supplemental Information are based upon reasonable assumptions and expectations, we cannot
assure you that such expectations will prove to have been correct. You should not place undue reliance on forward-looking statements and information as such statements and information involve known and
unknown risks, uncertainties and other factors which may cause our actual results, performance or achievements to differ materially from anticipated future results, performance or achievement expressed or
implied by such forward-looking statements and information.
Changes to hydrology at our hydroelectric facilities, to wind conditions at our wind energy facilities, to irradiance at our solar facilities or to weather generally at any of our facilities; volatility in supply and demand in
the energy markets; our inability to re-negotiate or replace expiring power purchase agreements on similar terms; increases in water rental costs (or similar fees) or changes to the regulation of water supply;
advances in technology that impair or eliminate the competitive advantage of our projects; an increase in the amount of uncontracted generation in our portfolio; industry risks relating to the power markets in which
we operate; the termination of, or a change to, the hydrological balancing pool in Brazil; increased regulation of our operations; concessions and licenses expiring and not being renewed or replaced on similar
terms; increases in the cost of operating our plants; our failure to comply with conditions in, or our inability to maintain, governmental permits; equipment failures, including failures related to wind turbines and solar
panels; dam failures and the costs and potential liabilities associated with such failures; force majeure events; uninsurable losses; adverse changes in currency exchange rates and our inability to effectively
manage foreign currency exposure; availability and access to interconnection facilities and transmission systems; health, safety, security and environmental risks; disputes, governmental and regulatory
investigations and litigation; counterparties to our contracts not fulfilling their obligations; the time and expense of enforcing contracts against non-performing counter-parties and the uncertainty of success; our
operations being affected by local communities; fraud, bribery, corruption, other illegal acts or inadequate or failed internal processes or systems; our reliance on computerized business systems, which could
expose us to cyber-attacks; newly developed technologies in which we invest not performing as anticipated; labor disruptions and economically unfavorable collective bargaining agreements; our inability to finance
our operations due to the status of the capital markets; operating and financial restrictions imposed on us by our loan, debt and security agreements; changes to our credit ratings; our inability to identify sufficient
investment opportunities and complete transactions; the growth of our portfolio and our inability to realize the expected benefits of our transactions or acquisitions; our inability to develop greenfield projects or find
new sites suitable for the development of greenfield projects; delays, cost overruns and other problems associated with the construction and operation of generating facilities and risks associated with the
arrangements we enter into with communities and joint venture partners; Brookfield Asset Management’s election not to source acquisition opportunities for us and our lack of access to all renewable power
acquisitions that Brookfield Asset Management identifies; we do not have control over all our operations or investments; foreign laws or regulation to which we become subject as a result of future acquisitions in
new markets; changes to government policies that provide incentives for renewable energy; a decline in the value of our investments in securities, including publicly traded securities of other companies; we are
not subject to the same disclosure requirements as a U.S. domestic issuer; the separation of economic interest from control within our organizational structure; the incurrence of debt at multiple levels within our
organizational structure; being deemed an “investment company” under the U.S. Investment Company Act of 1940; the effectiveness of our internal controls over financial reporting; our dependence on Brookfield
Asset Management and Brookfield Asset Management’s significant influence over us; the departure of some or all of Brookfield Asset Management’s key professionals; changes in how Brookfield Asset
Management elects to hold its ownership interests in Brookfield Renewable; and Brookfield Asset Management acting in a way that is not in the best interests of Brookfield Renewable or our unitholders.
We caution that the foregoing list of important factors that may affect future results is not exhaustive. The forward-looking statements represent our views as of the date of this Supplemental Information and
should not be relied upon as representing our views as of any subsequent date. While we anticipate that subsequent events and developments may cause our views to change, we disclaim any obligation to
update the forward-looking statements, other than as required by applicable law. For further information on these known and unknown risks, please see “Risk Factors” included in our Form 20-F.
CAUTIONARY STATEMENT REGARDING USE OF NON-IFRS MEASURES
This Supplemental Information contains references to Adjusted EBITDA, Funds From Operations, Normalized Funds From Operations, Adjusted Funds From Operations, Funds From Operations per Unit and
Normalized Funds From Operations per Unit (collectively, “Brookfield Renewable’s Non-IFRS Measures”) which are not generally accepted accounting measures under IFRS and therefore may differ from
definitions of Adjusted EBITDA, Funds From Operations, Normalized Funds From Operations, Adjusted Funds From Operations, Funds From Operations per Unit and Normalized Funds From Operations per Unit
used by other entities. We believe that Brookfield Renewable’s Non-IFRS Measures are useful supplemental measures that may assist investors in assessing the financial performance and the cash anticipated to
be generated by our operating portfolio. Brookfield Renewable’s Non-IFRS Measures should not be considered as the sole measures of our performance and should not be considered in isolation from, or as a
substitute for, analysis of our financial statements prepared in accordance with IFRS, which are available on our website at https://bep.brookfield.com as well as at www.sec.gov/edgar.shtml and www.sedar.com.

3
5.6 TWhPROPORTIONATE
GENERATION
Pro
Forma(1)
Sep 30 Dec 31
(MILLIONS, EXCEPT AS NOTED) 2018 2017
Liquidity and Capital Resources
Available liquidity $ 2,308 $ 1,658 $ 1,697
Debt to capitalization 41% 41% 39%
Non-recourse proportionate borrowings 71% 71% 70%
Floating rate debt exposure on a proportionate basis 14% 14% 13%
Subsidiary borrowings on a proportionate basis
Average debt term to maturity 10 years 10 years 10.5 years
Average interest rate 5.5% 5.5% 5.8%(1) Available liquidity includes $650 million of proceeds from the announced sale of a 25% non-controlling interest in a 413 MW
hydroelectric portfolio in Canada and an additional 25% non-controlling interest that we intend to sell with the next three
months, and our net proceeds from the South Africa sale. See Note 3 and Note 21 of our unaudited interim report.
Three months ended Nine months ended
(MILLIONS, EXCEPT AS NOTED) 2018 2017 2018 2017
Operational Information
Capacity (MW) 17,392 12,740 17,392 12,740
Total generation (GWh)
Long-term average generation 12,113 9,098 38,486 30,136
Actual generation 11,609 9,370 37,611 31,472
Proportionate generation (GWh)
Long-term average generation 5,956 5,053 19,242 17,221
Actual generation 5,552 5,198 18,701 18,078
Average revenue ($ per MWh) 79 72 76 69
Selected Financial Information
Consolidated Adjusted EBITDA(1)
$ 494 $ 381 $ 1,619 $ 1,297
Proportionate Adjusted EBITDA(1)
277 232 952 846
Funds From Operations (FFO)(1)
105 91 470 438
Normalized FFO (1)(2)
139 74 513 380
Adjusted FFO(1)
87 74 416 387
FFO per Unit (1)(3)
0.33 0.28 1.50 1.44
Normalized FFO per Unit (1)(2)(3)
0.44 0.24 1.64 1.25
Distributions per LP Unit 0.49 0.47 1.47 1.40
Net (Loss) income attributable to Unitholders (55) (43) (49) 11
Basic (loss) earnings per LP Unit (0.18) (0.14) (0.16) 0.04(1) Non-IFRS measures. For reconciliations to the most directly comparable IFRS measure see “Reconciliation of Non-IFRS
Measures” and “Cautionary Statement Regarding Use of Non-IFRS Measures”.
(2) Normalized FFO assumes long-term average generation in North America and Europe and uses constant foreign currency
rates. For the three and nine months ended September 30, 2018, the change related to long-term average generation totaled
$22 million and $35 million (2017: ($17) million and ($58) million), respectively, and the change to foreign currency totaled $12
million and $8 million, respectively.
(3) For the three and nine months ended September 30, 2018, weighted average LP Units, Redeemable/Exchangeable
partnership units and GP interest totaled 312.6 million and 312.7 million, respectively (2017: 311.8 million and 303.5 million,
respectively).
Q3 2018 Highlights
$139MNORMALIZED
FFO
$0.44NORMALIZED
FFO/UNIT
PERFORMANCE HIGHLIGHTS
• Normalized FFO increased to $139 million and
$0.44 on a per unit basis driven by
‒ Investments in TerraForm Global and
TerraForm Power and development projects
‒ Relatively higher realized prices, primarily in
Colombia, Brazil and the U.S. northeast
‒ Cost-reduction initiatives
• FFO increased 15% to $105 million as the above
noted benefits were partially offset by lower
generation at our hydroelectric facilities primarily in
North America (7% below long term average and
14% lower than prior year where we experienced
higher than average generation) and the weakening
of the Brazilian reais versus the U.S. dollar
• Year to date FFO increased 7% to $470 million as
contributions from growth in our portfolio, higher
realized prices, and cost-reduction initiatives were
partially offset by lower same-store generation that
was 2% below long-term average and 7% below
prior year where we experienced higher than
average generation (5% above long-term average)
• Net loss attributable to Unitholders increased $12
million compared to the prior year due primarily to an
increase in depreciation from growth that more than
offset the increase in Funds From Operations

4
Q3 2018 Highlights (cont’d)
OPERATIONS
• Continued to focus on extending our profile at premium
pricing
‒ Entered into 30 new contracts in Colombia
during the quarter representing 2,545 GWh of
annual generation at an average price of 191
COP/KWh ($65/MWh)
‒ Entered into four new contracts in Brazil
commencing in 2019 to deliver 221 GWh
annually until 2023
LIQUIDITY AND CAPITAL RESOURCES
• Available liquidity remains strong with $2.3 billion1
• Executed $395 million of non-recourse financings in the
quarter, maintaining a weighted-average cost of project
debt of 5.5% and weighted average duration of 10 years
• Issued a C$300 million ($231 million) corporate medium
term green bond, maturing in January 2029 at a fixed
rate of 4.25%
• Minimal interest rate exposure with only 14% floating
rate debt with less than 7% in North America and
Europe
• Continued to advance the sale of our 178 MW South
Africa wind and solar portfolio for $166 million
(Brookfield Renewable’s share ~$50 million), which is
expected to close in the fourth quarter of 2018, subject
to closing conditions
LIQUIDITY AND CAPITAL RESOURCES (cont’d)
• Post quarter-end, we entered into an agreement and
sold a 25% non-controlling interest in a 413 MW
contracted hydroelectric portfolio in Canada to a
consortium of buyers. In connection with this
transaction, we also amended or agreed to amend
certain historical related party contracts on a value
neutral basis and agreed to internalize Brookfield Asset
Management’s North American energy marketing
business. Refer to Note 21 – Subsequent events of our
unaudited interim consolidated financial statements
GROWTH AND DEVELOPMENT
• Post quarter-end, we acquired a 23 MW Irish wind
facility that is expected to contribute annualized FFO to
Brookfield Renewable of $1 million for total
consideration of £38 million ($50 million) with Brookfield
Renewable’s share totalling $20 million
• Completed the commissioning of a 28 MW wind project
in Ireland that is expected to contribute annualized FFO
to Brookfield Renewable of $3 million on average over
the life of the asset and continued to advance 131 MW
of hydro, wind, and storage development projects that
are expected to contribute annualized FFO to Brookfield
Renewable of $17 million on a run rate basis
1 See Capitalization and Available Liquidity on slide 13

5
About Brookfield Renewable
877 power generating facilities
$42 billionTOTAL POWER ASSETS
25 markets in 15 countries
17,400MEGAWATTS OF CAPACITY
Situated on 82 river systems
76%HYDROELECTRIC GENERATION
One of the largest public pure-play renewable businesses globally
100 years of experience in power generation
Full operating, development and power marketing capabilities
Over 2,000 operating employees

6
Storage
River Capacity LTA(1)
Capacity
As at September 30, 2018 Systems Facilities (MW) (GWh) (GWh)
Hydroelectric
North America
United States 30 136 2,886 11,982 2,523
Canada 19 33 1,361 5,177 1,261
49 169 4,247 17,159 3,784
Colombia 6 6 2,732 14,476 3,703
Brazil 27 43 927 4,799 -
82 218 7,906 36,434 7,487
Wind
North America
United States - 24 1,888 6,565 -
Canada - 4 484 1,437 -
- 28 2,372 8,002 -
Europe - 49 1,224 2,760 -
Brazil - 21 552 2,258 -
Other(2)
- 7 277 536 -
- 105 4,425 13,556 -
Solar(2)
- 544 1,783 3,381 -
Storage(3)
2 4 2,698 - 5,220
Other(4)
- 6 580 - -
Total 84 877 17,392 53,371 12,707(1) LTA is calculated based on our portfolio as at the date of this report, reflecting all facilities on a consolidated and an annualized
basis from the beginning of the year, regardless of the acquisition, disposition or commercial operation date.26,373 GWh. See
'Presentation to Stakeholders' for our methodology in computing LTA and for why we do not consider LTA for our Storage and Other
facilities.
(2) Includes five solar facilities (151 MW) and one wind facility (27 MW) in South Africa that have been presented as Assets held for
sale.
(3) Includes pumped storage in North America (600 MW) and Europe (2,088 MW) and battery storage in North America (10 MW).
(4) Includes four biomass facilities in Brazil (175 MW), one cogeneration plant in Colombia (300 MW), and one cogeneration plant in
North America (105 MW).
Long-term Average Generation by Source of Energy
(proportionate basis)
Long-term Average Generation by Region
(proportionate basis)
Overview of Our Operations

7
Generation and Financial Review for the Three Months Ended September 30

8
Performance Measurement
Segmented Information
The Chief Operating Decision Maker (“CODM”) reviews results, manages operations and allocates resources, segmented by – 1) hydroelectric, 2)
wind, 3) solar, 4) storage & other (cogeneration and biomass), and 5) corporate – with hydroelectric and wind further segmented by geography (i.e.,
North America, Colombia, Brazil, Europe and Other). Our investment in the TerraForm Power and TerraForm Global businesses led to the creation of
the solar segment which will now be reviewed on a standalone basis. Our investment in First Hydro resulted in the creation of a storage segment
which will be reviewed along with our cogeneration and biomass businesses, on an aggregate basis. The Colombia segment aggregates the financial
results of its hydroelectric and cogeneration facilities. The corporate segment represents all activity performed above the individual segments for the
business.
Proportionate Information
Information on a proportionate basis reflects our share from facilities which we account for using consolidation and the equity method whereby we
either control or exercise significant influence or joint control over the investment, respectively. The total proportionate financial information is not, and
is not intended to be, presented in accordance with IFRS. Proportionate information provides a net to Brookfield Renewable perspective that
management considers important when performing internal analyses and making strategic and operating decisions. Management also believes that
providing proportionate information helps investors understand the impacts of decisions made by management and financial results allocable to
Brookfield Renewable’s LP Unitholders. Tables reconciling IFRS data with data presented on a proportionate consolidation basis have been disclosed.
As a result, segment revenues, other income, direct operating costs, interest expense, depreciation, current and deferred income taxes, and other are
reconciling items that will differ from results presented in accordance with IFRS as these reconciling items (1) include our proportionate share of
earnings from equity-accounted investments attributable to each of the above-noted items, and (2) exclude the proportionate share of earnings (loss)
of consolidated investments not held by us apportioned to each of the above-noted items.
The presentation of proportionate results has limitations as an analytical tool, including the following: The amounts shown on the individual line items
were derived by applying our overall economic ownership interest percentage and do not necessarily represent our legal claim to the assets and
liabilities, or the revenues and expenses; and other companies may calculate proportionate results differently than we do. Because of these limitations,
our proportionate financial information should not be considered in isolation or as a substitute for our financial statements as reported under IFRS. We
do not control those entities that have not been consolidated and as such, have been presented as equity-accounted investments in our financial
statements. The presentation of the assets and liabilities and revenues and expenses do not represent our legal claim to such items, and the removal
of financial statement amounts that are attributable to non-controlling interests does not extinguish our legal claims or exposures to such items.
We provide additional information on how we determine Adjusted EBITDA, Funds From Operations, and Adjusted Funds From Operations. See
“Appendix 4 – Presentation to Stakeholders and Performance Measurement ”. We also provide reconciliations to IFRS Measures. See “Appendix 1 –
Reconciliation of Non-IFRS Measures”.

9
Proportionate Results for the Three Months Ended September 30
For each operating segment, this Supplemental Information outlines Brookfield Renewable’s proportionate share of
results in order to demonstrate the impact of key value drivers of each operating segment on the partnership’s overall
performance.
(GWh) (MILLIONS)
Actual Generation LTA Generation Revenues Adjusted EBITDA
Funds From
Operations Net Income (Loss)2018 2017 2018 2017 2018 2017 2018 2017 2018 2017 2018 2017
Hydroelectric
North America 2,526 2,900 2,654 2,654 $ 166 $ 201 $ 99 $ 128 $ 53 $ 82 $ (3) $ 35
Brazil 791 802 996 978 53 60 38 42 31 37 2 1
Colombia 742 881 859 861 54 47 29 25 20 13 11 1
4,059 4,583 4,509 4,493 273 308 166 195 104 132 10 37
Wind
North America 597 285 696 378 50 30 30 21 14 11 (27) (21)
Europe 141 96 208 95 17 11 9 4 2 - (9) (1)
Brazil 211 95 242 87 15 10 13 9 11 7 5 6
Other 48 - 41 - 4 - 3 - 2 - 1 -
997 476 1,187 560 86 51 55 34 29 18 (30) (16)
Solar 279 - 260 - 58 - 46 - 31 - 19 -
Storage & Other 217 139 - - 25 18 14 9 11 6 5 2
Corporate - - - - - - (4) (6) (70) (65) (59) (66)
Total 5,552 5,198 5,956 5,053 $ 442 $ 377 $ 277 $ 232 $ 105 $ 91 $ (55) $ (43)

10
4,059 GWhPROPORTIONATE GENERATION
$104MFFO
Hydroelectric Operations on Proportionate Basis
The following table presents our proportionate results for the three
months ended September 30:
FINANCIAL RESULTS
FFO decreased 21% or $28 million to $104 million
• FFO at our North American business was $53 million versus
$82 million in the prior year as generation was 5% below
long-term average and 13% lower than prior year, where we
experienced higher than average generation (9% of long-
term average). Operating costs were lower than the prior
year as we continued to execute our cost-reduction
initiatives
• FFO at our Brazilian business was $31 million versus $37
million in the prior year. On local currency basis FFO
increased by 4% versus the prior year due to the
contributions from development projects and higher average
revenue per MWh due to inflation indexation of our contracts
and higher market prices. These benefits were offset by the
weakening of the Brazilian reais versus the U.S. dollar
• FFO at our Colombian business was $20 million versus $13
million in the prior year as our cost-reduction initiatives and a
38% increase in average revenue per MWh due to inflation
indexation of our contracts, re-contracting efforts and higher
ancillary revenues were partially offset by lower generation
as we stored water in anticipation of higher pricing in the
upcoming dry seasonThe following table presents our proportionate results for the three
months ended September 30 by geography:
(MILLIONS, EXCEPT AS NOTED) 2018 2017
Generation (GWh) – LTA 4,509 4,493
Generation (GWh) – actual 4,059 4,583
Revenue $ 273 $ 308
Other income 2 5
Direct operating costs (109) (118)
Adjusted EBITDA 166 195
Interest expense (58) (58)
Current income taxes (4) (5)
Funds From Operations $ 104 $ 132
Depreciation (93) (98)
Deferred taxes and other (1) 3
Net income $ 10 $ 37
Actual Generation
Average revenue
per MWh Adjusted EBITDA
Funds From
Operations
Net Income
(Loss)
(MILLIONS, EXCEPT AS NOTED) 2018 2017 2018 2017 2018 2017 2018 2017 2018 2017
North America
United States 1,477 1,594 $ 70 $ 73 $ 55 $ 65 $ 25 $ 37 $ (14) $ (4)
Canada 1,049 1,306 59 65 44 63 28 45 11 39
2,526 2,900 66 69 99 128 53 82 (3) 35
Brazil 791 802 67 75 38 42 31 37 2 1
Colombia 742 881 73 53 29 25 20 13 11 1
Total 4,059 4,583 $ 67 $ 67 $ 166 $ 195 $ 104 $ 132 $ 10 $ 37

11
997 GWhPROPORTIONATE GENERATION
$29MFFO
Wind Operations on Proportionate Basis
The following table presents our proportionate results for the three
months ended September 30:
FINANCIAL RESULTS
FFO increased 61% or $11 million to $29 million
• FFO at our North American business was $14 million
versus $11 million in the prior year due to improved
generation at our U.S. wind farms and growth in our
portfolio from our investments in TerraForm Power
• FFO at our European business was $2 million, driven by the
contribution from growth in our portfolio following TerraForm
Power’s acquisition of Saeta Yield – $2 million of FFO and
79 GWh of generation. On a same store basis, improved
realized pricing was offset by a decrease in generation due
to lower resource
• FFO at our Brazilian business was $11 million versus
$7 million in the prior year due primarily to the contribution
from our investment in TerraForm Global – $4 million of
FFO and 113 GWh of generation. On a same-store basis,
higher average revenue per MWh due to re-contracting
initiatives executed earlier in the year was offset by the
weakening of the Brazilian reais versus the U.S. dollar
The following table presents our proportionate results for the three
months ended September 30 by geography:
(MILLIONS, EXCEPT AS NOTED) 2018 2017
Generation (GWh) – LTA 1,187 560
Generation (GWh) – actual 997 476
Revenue $ 86 $ 51
Direct operating costs (31) (17)
Adjusted EBITDA 55 34
Interest expense (25) (15)
Current income taxes (1) (1)
Funds From Operations $ 29 $ 18
Depreciation (50) (28)
Deferred taxes and other (9) (6)
Net (loss) income $ (30) $ (16)
Actual Generation
Average revenue
per MWh Adjusted EBITDA
Funds From
Operations
Net Income
(Loss)
(MILLIONS, EXCEPT AS NOTED) 2018 2017 2018 2017 2018 2017 2018 2017 2018 2017
North America
United States 421 112 $ 83 $ 125 $ 19 $ 10 $ 8 $ 6 $ (13) $ (3)
Canada 176 173 85 92 11 11 6 5 (14) (18)
597 285 84 105 30 21 14 11 (27) (21)
Europe 141 96 121 93 9 4 2 - (9) (1)
Brazil 211 95 71 104 13 9 11 7 5 6
Other 48 - 62 - 3 - 2 - 1 -
Total 997 476 $ 85 $ 102 $ 55 $ 34 $ 29 $ 18 $ (30) $ (16)

12
Solar, Storage & Other and Corporate on Proportionate Basis
FINANCIAL RESULTS
• FFO from our solar business was $31 million. The
business is operating in line with expectations following
our investments in TerraForm Power, including the
additional investment in the second quarter of this year,
and TerraForm Global. Generation was roughly in line with
LTA
• FFO at our pumped storage and biomass business was
$11 million. The increase of $5 million is primarily due to
improved performance at our pumped storage facility in
New England supported by improved capacity pricing and
generation
The following table presents our proportionate results for the three
months ended September 30:
FINANCIAL RESULTS
• Management service costs totaling $22 million represents
an increase of $1 million over the prior year, which is
attributable to the growth in capitalization of our business
over the last year
• Interest expense increased $4 million compared to the
prior year as a result of increased borrowings to fund
growth in our business
• Distributions attributable to Preferred LP Units and shares
increased $2 million compared to the prior year as a result
of the C$250 million ($201 million) Preferred LP Units
issuance completed in the first quarter of 2018 partially
offset by the impact weaker Canadian dollar versus the
U.S dollar
The following table presents Corporate results for the three months ended
September 30:
(MILLIONS, EXCEPT AS NOTED) 2018 2017
Other income 1 -
Direct operating costs (5) (6)
Adjusted EBITDA (4) (6)
Management service costs (22) (21)
Interest expense (27) (23)
Distributions on Preferred LP Units and
Shares (17) (15)
Funds From Operations $ (70) $ (65)
Deferred taxes and other 12 (1)
Net (loss) $ (58) $ (66)
Solar Storage and Other
(MILLIONS, EXCEPT AS NOTED) 2018 2017 2018 2017
Generation (GWh) – LTA 260 - - -
Generation (GWh) – actual 279 - 217 139
Revenue $ 58 $ - $ 25 $ 18
Other income 1 - - -
Direct operating costs (13) - (11) (9)
Adjusted EBITDA 46 - 14 9
Interest expense (15) - (3) (3)
Funds From Operations $ 31 $ - $ 11 $ 6
Depreciation (11) - (5) (7)
Deferred taxes and other (1) - (1) 3
Net income $ 19 $ - $ 5 $ 2

13
Sep 30 Dec 31
(MILLIONS) Pro Forma(1)
2018 2017
Brookfield Renewable's share of cash and cash equivalents(2)
$ 290 $ 290 $ 195
Investments in equity and debt securities 135 135 159
Corporate credit facilities
Authorized credit facilities(3)
2,100 2,100 2,090
Draws on credit facilities(3)
(388) (1,038) (685)
Issued letters of credit (35) (35) (193)
Available portion of corporate credit facilities 1,677 1,027 1,212
Available portion of subsidiary credit facilities on a proportionate basis 206 206 131
Available liquidity $ 2,308 $ 1,658 $ 1,697(1) Draws on credit facilities include the offset of $650 of proceeds from the announced sale of a 25% non-controlling interest in a 413 MW hydroelectric portfolio in Canada
and an additional 25% non-controlling interest that we intend to sell within the next three months, and Brookfield Renewable’s portion of proceeds associated with assets
held for sale in South Africa. See Note 3 and Note 21 of our unaudited interim report.
(2) In 2017, amounts were net of cash and cash equivalents on TerraForm Global's balance sheet which, under the indenture at that time, was not available for distribution.
(3) Amounts are guaranteed by Brookfield Renewable. Excludes $11 million (2017: $202 million) borrowed under a subscription credit facility made available to a Brookfield
sponsored private fund.
We operate with sufficient liquidity to enable us to fund growth initiatives, capital expenditures, distributions, withstand sudden adverse
changes in economic circumstances or short-term fluctuations in generation, and to finance the business on an investment-grade basis.
Principal sources of liquidity are cash flows from operations, our credit facilities, up-financings on subsidiary borrowings and proceeds from
the issuance of securities through public markets. The following table summarizes the available liquidity:
(MILLIONS, EXCEPT AS NOTED) 2018 2017
Credit facilities (1)
$ 1,049 $ 887
Corporate borrowings (2)
1,853 1,665
Subsidiary borrowings(3)
8,851 8,774
Long-term indebtedness 11,753 11,326
Deferred income tax liabilities, net of deferred income tax assets 3,374 3,411
Equity 13,354 14,282
Total capitalization $ 28,481 $ 29,019
Debt to total capitalization 41% 39%(1) Amounts are guaranteed by Brookfield Renewable. Includes $11 million (2017: $202 million) borrowed under a subscription credit facility made available to a Brookfield
sponsored private fund.
(2) Amounts are unsecured and guaranteed by Brookfield Renewable.
(3) Asset-specific, non-recourse borrowings secured against the assets of certain Brookfield Renewable subsidiaries. Includes $361 million of debt relating to South African
Portfolio currently classified as held for sale.
A key element of our financing strategy is to raise the majority of our debt in the form of asset-specific, non-recourse borrowings at our
subsidiaries on an investment grade basis. The following table summarizes our capitalization:
Capitalization and Available Liquidity

14
We remain focused on refinancing near-term facilities on acceptable terms and maintaining a manageable maturity ladder. We do not anticipate
material issues in addressing our borrowings through 2022 on acceptable terms and will do so opportunistically based on the prevailing interest
rate environment.
Our sole near term maturity is our C$200 million ($155 million) Series 3 medium-term notes which will be repaid through our available liquidity.
The overall maturity profile and average interest rates associated with our borrowings and credit facilities on a proportionate basis are as follows:
Average term (years) Average interest rate (%)
2018 2017 2018 2017
Corporate borrowings 6.2 6.4 4.5 4.5
Credit facilities(1)
4.8 4.5 3.2 2.6
Subsidiary borrowings 10.0 10.5 5.5 5.8(1)
Draws on our corporate credit facilities are presented based on available capacity of our longest dated facilities irrespective
of the credit facility drawn.
Long-Term Debt and Credit Facilities
The following table summarizes our undiscounted principal and scheduled amortization repayments on a proportionate basis:
(MILLIONS)
Balance of
2018 2019 2020 2021 2022 Thereafter Total
Principal repayments
Corporate borrowings and credit facilities(1)
155 - 348 - 310 2,095 $ 2,908
Subsidiary borrowings
Credit facilities - - - 158 - - 158
Hydro - 26 293 127 136 2,094 2,676
Wind - 10 - - 81 319 410
Solar - - - - 68 421 489
Storage and other - - - 60 - 181 241
- 36 293 345 285 3,015 3,974
Amortization
Subsidiary borrowings
Hydro 28 87 59 71 77 705 1,027
Wind 31 102 106 109 107 817 1,272
Solar 17 42 39 40 42 396 576
Storage and other 2 3 3 3 3 5 19
78 234 207 223 229 1,923 2,894
Total 233 270 848 568 824 7,033 $ 9,776(1)
Draws on our corporate credit facilities are presented based on available capacity of our longest dated facilities irrespective of the credit facility drawn.

15
(GWh, except as noted)
Balance
of 2018 2019 2020 2021 2022
Contracted
Hydroelectric(1)(2)
2,808 10,442 11,010 7,841 7,081
Wind(3)
1,185 4,419 4,285 4,210 4,180
Solar(3)
214 972 972 972 972
4,207 15,833 16,267 13,023 12,233
Uncontracted 377 2,816 2,382 5,626 6,417
Long-term average on a proportionate basis 4,584 18,649 18,649 18,649 18,650
Non-controlling interests 3,586 14,221 14,220 14,220 14,220
Total long-term average 8,170 32,870 32,869 32,869 32,870
Contracted generation as a % of
total generation on a proportionate basis 92 % 85 % 87 % 70 % 66 %
Price per MWh - total generation on a proportionate basis $ 78 $ 83 $ 81 $ 90 $ 94
(1) Includes generation of 202 GWh for 2018, 1,661 GWh for 2019 and 2,304 GWh for 2020 secured under financial contracts.
(2) Generation reflects the sale of a 25% non-controlling interest in a 413 MW hydroelectric portfolio in Canada and the restructuring of certain related party contracts, see “Part 7 –
Subsequent Events”. The close of the Energy Marketing Internalization was assumed to occur on January 1, 2019.
(3) Includes the proportionate contracted generation of five solar facilities (49 GWh) and one wind facility (16 GWh) in South Africa that are classified as Assets held for sale.
Weighted-average remaining contract durations on a proportionate basis are 17 years in North America, 9 years in Brazil, 2 years in
Colombia, 12 years in Europe and 18 years across our remaining jurisdictions.
In North America, over the next five years, a number of contracts will expire at our hydroelectric facilities. Based on current market prices
for energy and ancillary products, we do not foresee a negative impact to cash flows from contracts expiring over the next five years. In our
Brazilian and Colombian portfolios, we continue to focus on securing long-term contracts while maintaining a certain percentage of
uncontracted generation so as to mitigate hydrology risk.
The overall composition of our contracted generation on a proportionate basis under power purchase agreements is comprised of
Brookfield (30%), public power authorities (28%), distribution companies (22%) and industrial users (20%).
The following table sets out our contracts over the next five years for generation output in North America, Europe, and other countries in
Asia and Africa on a proportionate basis, assuming long-term average. The table excludes Brazil and Colombia, where we would expect
the energy associated with maturing contracts to be re-contracted in the normal course given the construct of the respective power
markets. In these countries we currently have a contracted profile of approximately 90% and 70%, respectively, of the long-term average
and we would expect to maintain this going forward. Overall, our portfolio has a weighted-average remaining contract duration of 14 years
(on a proportionate basis).
Contract Profile
16
Expected
Expected Funds From
Country / Capacity date of Operations
Project Name Region Technology (MW) commission (annualized)
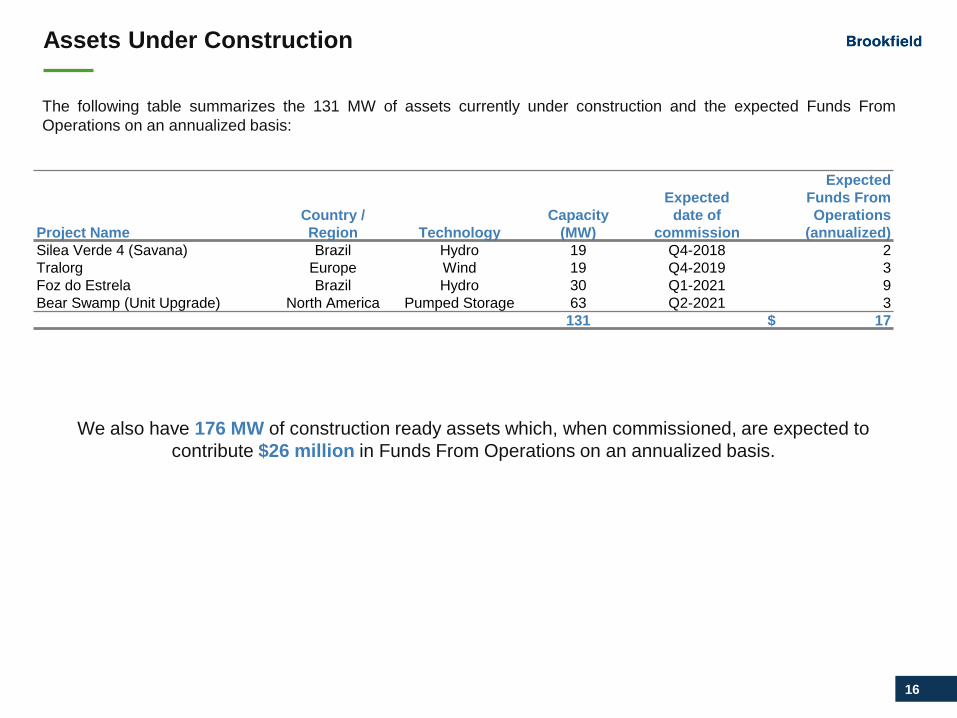
Silea Verde 4 (Savana) Brazil Hydro 19 Q4-2018 2
Tralorg Europe Wind 19 Q4-2019 3
Foz do Estrela Brazil Hydro 30 Q1-2021 9
Bear Swamp (Unit Upgrade) North America Pumped Storage 63 Q2-2021 3
131 $ 17
We also have 176 MW of construction ready assets which, when commissioned, are expected to
contribute $26 million in Funds From Operations on an annualized basis.
The following table summarizes the 131 MW of assets currently under construction and the expected Funds From
Operations on an annualized basis:
Assets Under Construction

17
(GWh) (MILLIONS)
Actual Generation LTA Generation Revenues Adjusted EBITDAFunds From
OperationsNet Income (Loss)
2018 2017 2018 2017 2018 2017 2018 2017 2018 2017 2018 2017
Hydroelectric
North America 9,704 10,866 9,915 9,916 $ 655 $ 726 $ 455 $ 520 $ 322 $ 386 $ 130 $ 198
Brazil 2,731 2,559 2,931 2,896 185 178 133 135 109 115 5 3
Colombia 2,382 2,705 2,547 2,553 160 140 91 73 62 38 41 12
14,817 16,130 15,393 15,365 1,000 1,044 679 728 493 539 176 213
Wind
North America 1,905 1,117 2,184 1,326 158 109 109 83 64 52 (39) (13)
Europe 413 362 496 367 46 35 27 19 13 9 (12) (6)
Brazil 473 204 506 163 33 19 26 15 20 11 (1) 8
Other 117 - 117 - 9 - 6 - 3 - (3) -
2,908 1,683 3,303 1,856 246 163 168 117 100 72 (55) (11)
Solar 569 - 546 - 106 - 87 - 57 - 19 -
Storage & Other 407 265 - - 62 42 33 17 23 7 (6) (5)
Corporate - - - - - - (15) (16) (203) (180) (183) (186)
Total 18,701 18,078 19,242 17,221 $ 1,414 $ 1,249 $ 952 $ 846 $ 470 $ 438 $ (49) $ 11
Proportionate Results for the Nine Months Ended September 30
For each operating segment, this Supplemental Information outlines Brookfield Renewable’s proportionate share of
results in order to demonstrate the impact of key value drivers of each operating segment on the partnership’s overall
performance.
For the nine months ended September 30, FFO was $470 million versus $438 million in the prior year as contributions
from growth in our portfolio, higher realized prices, and cost-reduction initiatives were partially offset by lower same-store
generation 2% below long-term average and 7% below prior year where we experienced higher than average generation
(5% above long-term average)

18
Appendix 1 – Reconciliation of Non-IFRS Measures

19
The following table reflects Adjusted EBITDA, Funds From Operations, Adjusted Funds From Operations and provides reconciliation to IFRS financial
data for the three months ended September 30, 2018:
Attributable to Unitholders Contribution Attributable
Hydroelectric Wind Solar Storage Corporate Total from equity to non- As per
and accounted controlling IFRS
($ MILLIONS) Other investments interests financials(1)
Revenues 273 86 58 25 - 442 (100) 332 674
Other income 2 - 1 - 1 4 (1) 4 7
Direct operating costs (109) (31) (13) (11) (5) (169) 31 (119) (257)
Share of Adjusted EBITDA from
equity accounted investments - - - - - - 70 - 70
Adjusted EBITDA 166 55 46 14 (4) 277 - 217
Management service costs - - - - (22) (22) - - (22)
Interest expense - borrowings (58) (25) (15) (3) (27) (128) 29 (77) (176)
Current income taxes (4) (1) - - - (5) 2 (3) (6)
Distributions attributable to
Preferred limited partners equity - - - - (10) (10) - - (10)
Preferred equity - - - - (7) (7) - - (7)
Share of interest and cash taxes from
equity accounted investments - - - - - - (31) - (31)
Share of Funds From Operations attributable
to non-controlling interests - - - - - - - (137) (137)
Funds From Operations 104 29 31 11 (70) 105 - -
Adjusted sustaining capital expenditures (16) - - - (2) (18) - -
Adjusted Funds From Operations 88 29 31 11 (72) 87 - -
Adjusted sustaining capital expenditures 16 - - - 2 18 - -
Depreciation (93) (50) (11) (5) (1) (160) 32 (64) (192)
Foreign exchange and
unrealized financial instruments gain (loss) (4) (3) - - 1 (6) - (4) (10)
Deferred income tax recovery (expense) 6 (3) (1) - 15 17 3 (9) 11
Other (3) (3) - (1) (4) (11) (2) (5) (18)
Share of earnings from associates - - - - - - (33) - (33)
Net loss attributable
to non-controlling interests - - - - - - - 82 82
Net income (loss) attributable to Unitholders 10 (30) 19 5 (59) (55) - - (55)(1) Share of earnings from equity-accounted investments of $6 million is comprised of amounts found on the share of Adjusted EBITDA, share of interest and cash taxes and share of earnings lines. Net income
attributable to participating non-controlling interests – in operating subsidiaries of $55 million is comprised of amounts found on Share of Funds From Operations attributable to non-controlling interests and Net
loss attributable to non-controlling interests.
Segment Reconciliation on a Proportionate Basis – Three Months
Ended September 30, 2018

20
The following table reflects Adjusted EBITDA, Funds From Operations, Adjusted Funds From Operations and provides reconciliation to IFRS financial
data for the three months ended September 30, 2017:
Attributable to Unitholders Contribution Attributable
Hydroelectric Wind Storage Corporate Total from equity to non- As per
and accounted controlling IFRS
($ MILLIONS) Other investments interests financials(1)
Revenues 308 51 18 - 377 (15) 246 608
Other income 5 - - - 5 - 2 7
Direct operating costs (118) (17) (9) (6) (150) 6 (99) (243)
Share of Adjusted EBITDA from
equity accounted investments - - - - - 9 - 9
Adjusted EBITDA 195 34 9 (6) 232 - 149
Management service costs - - - (21) (21) - - (21)
Interest expense - borrowings (58) (15) (3) (23) (99) 3 (62) (158)
Current income taxes (5) (1) - - (6) - (9) (15)
Distributions attributable to
Preferred limited partners equity - - - (8) (8) - - (8)
Preferred equity - - - (7) (7) - - (7)
Share of interest and cash taxes from
equity accounted investments - - - - - (3) - (3)
Share of Funds From Operations attributable
to non-controlling interests - - - - - - (78) (78)
Funds From Operations 132 18 6 (65) 91 - -
Adjusted sustaining capital expenditures (15) - - (2) (17) - -
Adjusted Funds From Operations 117 18 6 (67) 74 - -
Adjusted sustaining capital expenditures 15 - - 2 17 - -
Depreciation (98) (28) (7) - (133) 3 (72) (202)
Foreign exchange and
unrealized financial instrument loss (1) (8) - 1 (8) - (4) (12)
Deferred income tax recovery 11 (8) - 7 10 - (6) 4
Other (7) 10 3 (9) (3) (1) - (4)
Share of earnings from associates - - - - - (2) - (2)
Net loss attributable to non-controlling interests - - - - - - 82 82
Net loss attributable to Unitholders 37 (16) 2 (66) (43) - - (43)(1) Share of earnings from equity-accounted investments of $4 million is comprised of amounts found on the share of Adjusted EBITDA, share of interest and cash taxes and share of earnings lines. Net loss
attributable to participating non-controlling interests – in operating subsidiaries of $4 million is comprised of amounts found on Share of Funds From Operations attributable to non-controlling interests and
Net loss attributable to non-controlling interests.
Segment Reconciliation on a Proportionate Basis – Three Months
Ended September 30, 2017

21
The following table reconciles net income attributable to Limited partners’ equity and earnings per LP Unit, the most directly comparable IFRS measures,
to Funds From Operations, and Funds From Operations per Unit, both non-IFRS financial metrics for the three months ended September 30:
Per unit
(MILLIONS, EXCEPT AS NOTED) 2018 2017 2018 2017
Net loss attributable to:
Limited partners' equity $ (32) $ (24) $ (0.18) $ (0.14)
General partnership interest in a holding
subsidiary held by Brookfield (1) (1) - -
Participating non-controlling interests - in a holding
subsidiary - Redeemable/Exchangeable units
held by Brookfield (22) (18) - -
Net loss attributable to Unitholders $ (55) $ (43) $ (0.18) $ (0.14)
Adjusted for proportionate share of:
Depreciation 160 133 0.51 0.43
Foreign exchange and
unrealized financial instruments loss 6 8 0.02 0.02
Deferred income tax recovery (17) (10) (0.05) (0.03)
Other 11 3 0.03 -
Funds From Operations $ 105 $ 91 $ 0.33 $ 0.28
Weighted average units outstanding (1)
312.6 311.8(1) Includes GP interest, Redeemable/Exchangeable partnership units, and LP Units.
Per Unit Reconciliation– Three Months Ended September 30

22
The following table reflects Adjusted EBITDA, Funds From Operations and provides reconciliation to IFRS financial data for the nine months ended
September 30, 2018:
Attributable to Unitholders Contribution Attributable
Hydroelectric Wind Solar Storage Corporate Total from equity to non- As per
and accounted controlling IFRS
($ MILLIONS) Other investments interests financials(1)
Revenues 1,000 246 106 62 - 1,414 (197) 985 2,202
Other income 10 2 4 - 2 18 (5) 13 26
Direct operating costs (331) (80) (23) (29) (17) (480) 63 (343) (760)
Share of Adjusted EBITDA from
equity accounted investments - - - - - - 139 12 151
Adjusted EBITDA 679 168 87 33 (15) 952 - 667
Management service costs - - - - (64) (64) - - (64)
Interest expense - borrowings (174) (65) (30) (10) (75) (354) 54 (234) (534)
Current income taxes (12) (3) - - - (15) 3 (8) (20)
Distributions attributable to
Preferred limited partners equity - - - - (29) (29) - - (29)
Preferred equity - - - - (20) (20) - - (20)
Share of interest and cash taxes from
equity accounted investments - - - - - - (57) (10) (67)
Share of Funds From Operations attributable
to non-controlling interests - - - - - - - (415) (415)
Funds From Operations 493 100 57 23 (203) 470 - -
Adjusted sustaining capital expenditures (48) - - - (6) (54) - -
Adjusted Funds From Operations 445 100 57 23 (209) 416 - -
Adjusted sustaining capital expenditures 48 - - - 6 54 - -
Depreciation (287) (131) (24) (17) (1) (460) 61 (212) (611)
Foreign exchange and
unrealized financial instrument loss (3) (4) (3) (2) 14 2 (6) (31) (35)
Deferred income tax expense (2) (7) (1) - 24 14 2 (18) (2)
Other (25) (13) (10) (10) (17) (75) 15 (12) (72)
Share of earnings from associates - - - - - - (72) - (72)
Net loss attributable
to non-controlling interests - - - - - - - 273 273
Net loss attributable to Unitholders 176 (55) 19 (6) (183) (49) - - (49)(1) Share of earnings from equity-accounted investments of $12 million is comprised of amounts found on the share of Adjusted EBITDA, share of interest and cash taxes and share of earnings lines. Net
income attributable to participating non-controlling interests – in operating subsidiaries of $142 million is comprised of amounts found on Share of Funds From Operations attributable to non-controlling interests
and Net loss attributable to non-controlling interests.
Segment Reconciliation on a Proportionate Basis – Nine Months
Ended September 30, 2018

23
Segment Reconciliation on a Proportionate Basis – Nine Months
Ended September 30, 2017
The following table reflects Adjusted EBITDA, Funds From Operations and provides reconciliation to IFRS financial data for the nine months ended
September 30, 2017:
Attributable to Unitholders Contribution Attributable
Hydroelectric Wind Storage Corporate Total from equity to non- As per
and accounted controlling IFRS
($ MILLIONS) Other investments interests financials(1)
Revenues 1,044 163 42 - 1,249 (35) 754 1,968
Other income 13 - - 1 14 - 11 25
Direct operating costs (329) (46) (25) (17) (417) 15 (314) (716)
Share of Adjusted EBITDA from
equity accounted investments - - - - - 20 - 20
Adjusted EBITDA 728 117 17 (16) 846 - 451
Management service costs - - - (58) (58) - - (58)
Interest expense - borrowings (179) (44) (10) (66) (299) 9 (187) (477)
Current income taxes (10) (1) - - (11) - (16) (27)
Distributions attributable to
Preferred limited partners equity - - - (21) (21) - - (21)
Preferred equity - - - (19) (19) - - (19)
Share of interest and cash taxes from
equity accounted investments - - - - - (9) - (9)
Share of Funds From Operations attributable
to non-controlling interests - - - - - - (248) (248)
Funds From Operations 539 72 7 (180) 438 - -
Adjusted sustaining capital expenditures (45) - - (6) (51) - -
Adjusted Funds From Operations 494 72 7 (186) 387 - -
Adjusted sustaining capital expenditures 45 - - 6 51 - -
Depreciation (293) (84) (19) - (396) 9 (213) (600)
Foreign exchange and
unrealized financial instrument loss (7) (13) - (15) (35) 1 (4) (38)
Deferred income tax expense (11) - - 18 7 - (24) (17)
Other (15) 14 7 (9) (3) (2) 22 17
Share of earnings from associates - - - - - (8) - (8)
Net (income) loss attributable to non-
controlling interests - - - - - - 219 219
Net income attributable to Unitholders 213 (11) (5) (186) 11 - - 11(1) Share of earnings from equity-accounted investments of $3 million is comprised of amounts found on the share of Adjusted EBITDA, share of interest and cash taxes and share of earnings lines. Net income
attributable to participating non-controlling interests – in operating subsidiaries of $29 million is comprised of amounts found on Share of Funds From Operations attributable to non-controlling interests and Net
loss attributable to non-controlling interests.

24
Per Unit Reconciliation – Nine Months Ended September 30, 2018
The following table reconciles net income attributable to Limited partners’ equity and earnings per LP Unit, the most directly comparable IFRS measures,
to Funds From Operations, and Funds From Operations per Unit, both non-IFRS financial metrics for the nine months ended September 30, 2018:
Per unit
(MILLIONS, EXCEPT AS NOTED) 2018 2017 2018 2017
Net (loss) income attributable to:
Limited partners' equity $ (28) $ 6 $ (0.16) $ 0.04
General partnership interest in a holding
subsidiary held by Brookfield (1) - - -
Participating non-controlling interests - in a holding
subsidiary - Redeemable/Exchangeable units
held by Brookfield (20) 5 - -
Net (loss) income attributable to Unitholders $ (49) $ 11 $ (0.16) $ 0.04
Depreciation 460 396 1.47 1.30
Foreign exchange and
unrealized financial instruments (2) 35 (0.01) 0.12
Deferred income tax recovery (14) (7) (0.04) (0.02)
Other 75 3 0.24 -
Funds From Operations $ 470 $ 438 $ 1.50 $ 1.44
Weighted average units outstanding (1)
312.7 303.5(1) Includes GP interest, Redeemable/Exchangeable partnership units, and LP Units.

25
Long-Term Debt Reconciliation
(MILLIONS, EXCEPT AS NOTED)
Corporate borrowings $ 1,859
Credit facilities 1,049
Proportionate subsidiary borrowings
Hydroelectric 3,704
Wind(1)
1,739
Solar(1)
1,166
Storage and other 259
Total proportionate subsidiary borrowing 6,868
Total proportionate debt $ 9,776
Proportionate unamortized financing
fees, net of unamortized premiums (49)
Brookfield Renewable's share 9,727
Equity accounted borrowings (2,041)
Non-controlling interests 3,706
As per IFRS Statements $ 11,392(1) Excludes $60 million of proportionate debt associated with South African
assets classified as held for sale.
The following table provides a reconciliation to IFRS financial data as at September 30, 2018:

26
Appendix 2 – Consolidated Information
27
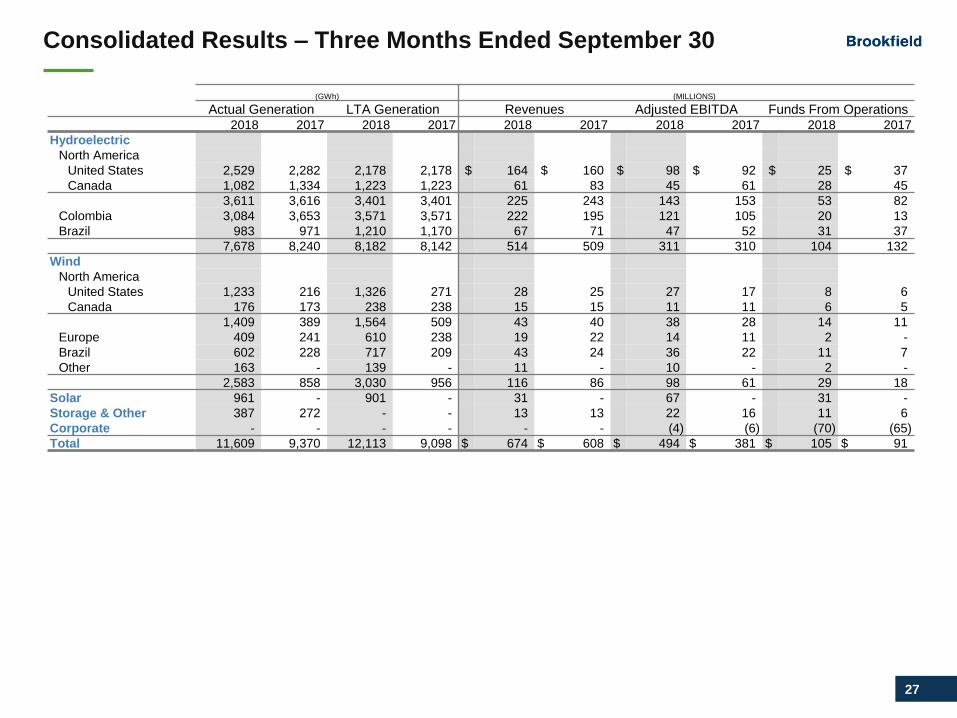
(GWh) (MILLIONS)
Actual Generation LTA Generation Revenues Adjusted EBITDA Funds From Operations2018 2017 2018 2017 2018 2017 2018 2017 2018 2017
Hydroelectric
North America
United States 2,529 2,282 2,178 2,178 $ 164 $ 160 $ 98 $ 92 $ 25 $ 37
Canada 1,082 1,334 1,223 1,223 61 83 45 61 28 45
3,611 3,616 3,401 3,401 225 243 143 153 53 82
Colombia 3,084 3,653 3,571 3,571 222 195 121 105 20 13
Brazil 983 971 1,210 1,170 67 71 47 52 31 37
7,678 8,240 8,182 8,142 514 509 311 310 104 132
Wind
North America
United States 1,233 216 1,326 271 28 25 27 17 8 6
Canada 176 173 238 238 15 15 11 11 6 5
1,409 389 1,564 509 43 40 38 28 14 11
Europe 409 241 610 238 19 22 14 11 2 -
Brazil 602 228 717 209 43 24 36 22 11 7
Other 163 - 139 - 11 - 10 - 2 -
2,583 858 3,030 956 116 86 98 61 29 18
Solar 961 - 901 - 31 - 67 - 31 -
Storage & Other 387 272 - - 13 13 22 16 11 6
Corporate - - - - - - (4) (6) (70) (65)
Total 11,609 9,370 12,113 9,098 $ 674 $ 608 $ 494 $ 381 $ 105 $ 91
Consolidated Results – Three Months Ended September 30

28
(GWh) (MILLIONS)
Actual Generation LTA Generation Revenues Adjusted EBITDA Funds From Operations2018 2017 2018 2017 2018 2017 2018 2017 2018 2017
Hydroelectric
North America
United States 9,317 9,227 9,056 9,057 $ 604 $ 600 $ 405 $ 399 $ 188 $ 206
Canada 3,816 4,571 3,959 3,959 232 282 184 230 134 180
13,133 13,798 13,015 13,016 836 882 589 629 322 386
Colombia 9,898 11,217 10,588 10,588 664 583 377 305 62 38
Brazil 3,324 3,089 3,540 3,468 215 211 160 161 109 115
26,355 28,104 27,143 27,072 1,715 1,676 1,126 1,095 493 539
Wind
North America
United States 4,478 670 4,879 894 80 73 80 49 24 14
Canada 814 766 930 854 70 70 58 57 40 38
5,292 1,436 5,809 1,748 150 143 138 106 64 52
Europe 1,112 913 1,357 925 87 80 59 48 13 9
Brazil 1,384 490 1,511 391 97 44 78 40 20 11
Other 396 - 391 - 27 - 19 - 3 -
8,184 2,839 9,068 3,064 361 267 294 194 100 72
Solar 2,339 - 2,275 - 103 - 159 - 57 -
Storage & Other 733 529 - - 23 25 55 24 23 7
Corporate - - - - - - (15) (16) (203) (180)
Total 37,611 31,472 38,486 30,136 $ 2,202 $ 1,968 $ 1,619 $ 1,297 $ 470 $ 438
Consolidated Results – Nine Months Ended September 30

29
Appendix 3 – Additional Information

30
GENERATION (GWh)(1) Q1 Q2 Q3 Q4 Total
Hydroelectric
North America
United States 2,225 2,361 1,470 1,953 8,009
Canada 1,111 1,343 1,081 1,078 4,613
3,336 3,704 2,551 3,031 12,622
Colombia 844 844 859 935 3,482
Brazil 969 985 996 996 3,946
5,149 5,533 4,406 4,962 20,050
Wind
North America
United States 590 620 447 558 2,215
Canada 346 308 249 366 1,269
936 928 696 924 3,484
Europe 266 220 208 263 957
Brazil 146 168 242 199 755
Other(2)
37 42 41 36 156
1,385 1,358 1,187 1,422 5,352
Solar(2)
223 275 260 213 971
Total 6,757 7,166 5,853 6,597 26,373(1) LTA is calculated based on our portfolio as at the date of this report, reflecting all facilities on an annualized basis from the beginning of the year, regardless of the acquisition, disposition or commercial
operation date. See Presentation to Stakeholders and Performance Measurement for an explanation on our methodology in computing LTA, why we do not consider LTA for our Storage and Other
facilities.
(2) Includes five solar facilities (151 MW) and one wind facility (27 MW) in South Africa that have been presented as Assets held for sale.
Annualized Proportionate Long-term Average Generation
31
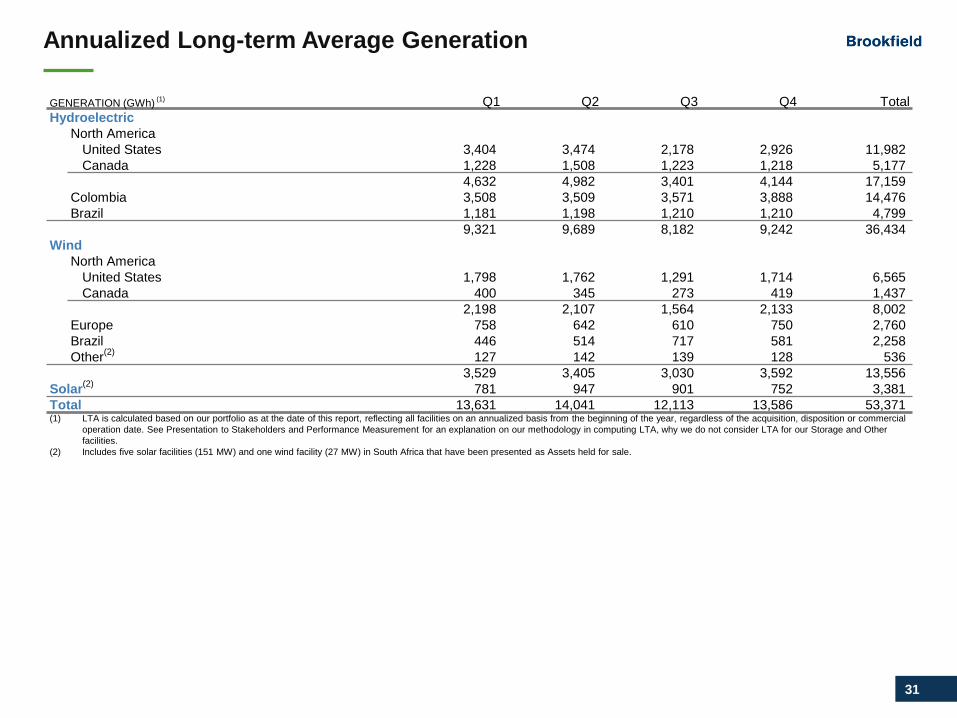
GENERATION (GWh)(1) Q1 Q2 Q3 Q4 Total
Hydroelectric
North America
United States 3,404 3,474 2,178 2,926 11,982
Canada 1,228 1,508 1,223 1,218 5,177
4,632 4,982 3,401 4,144 17,159
Colombia 3,508 3,509 3,571 3,888 14,476
Brazil 1,181 1,198 1,210 1,210 4,799
9,321 9,689 8,182 9,242 36,434
Wind
North America
United States 1,798 1,762 1,291 1,714 6,565
Canada 400 345 273 419 1,437
2,198 2,107 1,564 2,133 8,002
Europe 758 642 610 750 2,760
Brazil 446 514 717 581 2,258
Other(2)
127 142 139 128 536
3,529 3,405 3,030 3,592 13,556
Solar(2)
781 947 901 752 3,381
Total 13,631 14,041 12,113 13,586 53,371(1) LTA is calculated based on our portfolio as at the date of this report, reflecting all facilities on an annualized basis from the beginning of the year, regardless of the acquisition, disposition or commercial
operation date. See Presentation to Stakeholders and Performance Measurement for an explanation on our methodology in computing LTA, why we do not consider LTA for our Storage and Other
facilities.
(2) Includes five solar facilities (151 MW) and one wind facility (27 MW) in South Africa that have been presented as Assets held for sale.
Annualized Long-term Average Generation

32
Attributable to Unitholders Contribution Attributable
Storage from equity to non- As per
and accounted controlling IFRS
($ MILLIONS) Hydro Wind Solar Other Corporate Total investments interests financials
As at September 30, 2018:
Cash and cash equivalents 116 88 64 10 12 290 (115) 138 313
Property, plant and equipment, at fair value 13,930 3,267 1,312 572 - 19,081 (3,079) 9,519 25,521
Total assets 14,777 3,612 1,619 632 165 20,805 (2,503) 11,639 29,941
Total borrowings 3,674 1,934 998 256 2,891 9,753 (2,041) 3,680 11,392
Total liabilities 6,311 2,534 1,256 291 3,105 13,497 (2,503) 5,593 16,587
For the nine months ended September 30, 2018:
Additions to property, plant and equipment 81 19 9 2 6 117 (15) 56 158
As at December 31, 2017:
Cash and cash equivalents 75 147 90 11 7 330 (30) 499 799
Property, plant and equipment, at fair value 14,607 2,595 602 625 - 18,429 (1,451) 10,118 27,096
Total assets 15,432 2,894 765 691 180 19,962 (1,040) 11,982 30,904
Total borrowings 3,696 1,439 499 253 2,552 8,439 (848) 4,175 11,766
Total liabilities 6,418 1,898 573 304 2,786 11,979 (1,039) 5,682 16,622
For the year ended December 31, 2017:
Additions to property, plant and equipment 157 40 - 13 10 220 (10) 144 354
Segment Proportionate Balance Sheet

33
Appendix 4 – Presentation to Stakeholders and Performance Measurement

34
Presentation to Stakeholders
Actual and Long-term Average Generation
For assets acquired, disposed or reaching commercial operation during the period, reported generation is calculated from the acquisition, disposition
or commercial operation date and is not annualized. As it relates to Colombia only, generation includes both hydroelectric and cogeneration facilities.
“Other” includes generation from North America cogeneration and Brazil biomass.
North America hydroelectric LTA is the expected average level of generation based on the results of a simulation based on historical inflow data
performed over a period of typically 30 years. Colombia hydroelectric LTA is the expected average level of generation based on the results of a
simulation based on historical inflow data performed over a period of typically 20 years. Colombia includes generation from both hydroelectric and
cogeneration facilities. Hydroelectric assets located in Brazil benefit from a market framework which levelizes generation risk across producers. Wind
LTA is the expected average level of generation based on the results based on simulated historical wind speed data performed over a period of
typically 10 years. Solar LTA is the expected average level of generation based on the results of a simulation using historical irradiance levels in the
locations of our projects from the last 14 to 20 years combined with actual generation data during the operational period.
We compare actual generation levels against the long-term average to highlight the impact of an important factor that affects the variability of our
business results. In the short-term, we recognize that hydrology, wind and irradiance conditions will vary from one period to the next; over time
however, we expect our facilities will continue to produce in line with their long-term averages, which have proven to be reliable indicators of
performance.
Our risk of a generation shortfall in Brazil continues to be minimized by participation in a hydrological balancing pool administered by the government
of Brazil. This program mitigates hydrology risk by assuring that all participants receive, at any particular point in time, an assured energy amount,
irrespective of the actual volume of energy generated. The program reallocates energy, transferring surplus energy from those who generated an
excess to those who generate less than their assured energy, up to the total generation within the pool. Periodically, low precipitation across the entire
country’s system could result in a temporary reduction of generation available for sale. During these periods, we expect that a higher proportion of
thermal generation would be needed to balance supply and demand in the country potentially leading to higher overall spot market prices.
Generation from our North American pumped storage and cogeneration facilities is highly dependent on market price conditions rather than the
generating capacity of the facilities. Our European pumped storage generates on a dispatchable basis when required by our contracts for ancillary
services. Generation from our biomass facilities is dependent on the amount of sugar cane harvested in a given year. For these reasons, we do not
consider a long-term average for these facilities.
Brookfield Renewable’s consolidated equity interests
Brookfield Renewable’s consolidated equity interests include the non-voting publicly traded limited partnership units (“LP Units”) held by public
unitholders and Brookfield, redeemable/exchangeable partnership units held by Brookfield (“Redeemable/Exchangeable partnership units”), in
Brookfield Renewable Energy L.P. (“BRELP”), a holding subsidiary of Brookfield Renewable, and general partnership interest (“GP interest”) in
BRELP held by Brookfield. Holders of the GP interest, Redeemable/Exchangeable partnership units, and LP Units will be collectively referred to
throughout as “Unitholders” or “per Unit”. The LP Units and Redeemable/Exchangeable partnership units have the same economic attributes in all
respects.

35
Performance Measurement
One of our primary business objectives is to generate reliable and growing cash flows while minimizing risk for the benefit of all stakeholders. We
monitor our performance in this regard through four key metrics – i) Net Income (Loss), ii) Adjusted Earnings Before Interest, Taxes, Depreciation
and Amortization, iii) Funds From Operations, and iv) Adjusted Funds from Operations. It is important to highlight that Adjusted EBITDA, Funds
From Operations, and Adjusted Funds From Operations do not have any standardized meaning prescribed by IFRS and therefore are unlikely to be
comparable to similar measures presented by other companies.
• Net Income (Loss) – Calculated in accordance with IFRS. Net income (loss) is an important measure of profitability, in particular because it
has a standardized meaning under IFRS. The presentation of net income (loss) on an IFRS basis for our business will often lead to the
recognition of a loss or a year-over-year decrease in income even though the underlying cash flows generated by the assets are supported by
strong margins and stable, long-term power purchase agreements. The primary reason for this is that accounting rules require us to recognize
a significantly higher level of depreciation for our assets than we are required to reinvest in the business as sustaining capital expenditures.
• Adjusted Earnings Before Interest, Taxes, Depreciation, and Amortization (Adjusted EBITDA) – EBITDA is a non-IFRS measure used
by investors to analyze the operating performance of companies. Brookfield Renewable uses Adjusted EBITDA to assess the performance of
its operations before the effects of interest expense, income taxes, depreciation, management service costs, non-controlling interests,
unrealized gain or loss on financial instruments, non-cash gain or loss from equity-accounted investments, distributions to preferred limited
partners and other typical non-recurring items. Brookfield Renewable adjusts for these factors as they may be non-cash, unusual in nature
and/or are not factors used by management for evaluating operating performance. Brookfield Renewable believes that presentation of this
measure will enhance an investor’s understanding of the performance of the business. As compared to the preceding years, we revised our
definition of Adjusted EBITDA to include our proportionate share of Adjusted EBITDA from equity-accounted investments. In preceding years,
we included our proportionate shares of Funds From Operations from equity-accounted investments. We revised our definition as we believe it
provides a more meaningful measure for investors to evaluate our financial and operating performance on an allocable basis to Unitholders.
• Funds From Operations, Normalized Funds From Operations, and Funds From Operations per Unit – Funds From Operations is a non-
IFRS measure used by investors to analyze net earnings from operations without the effects of certain volatile items that generally have no
current financial impact or items not directly related to the performance of the business. Brookfield Renewable uses Funds From Operations to
assess the performance of the business before the effects of deferred income taxes, depreciation, non-cash portion of non-controlling
interests, unrealized gain or loss on financial instruments, non-cash gain or loss from equity-accounted investments and other typical non-
recurring items as these are not reflective of the performance of the underlying business. In our audited consolidated financial statements we
use the revaluation approach in accordance with IAS 16, Property, Plant and Equipment, whereby depreciation is determined based on a
revalued amount, thereby reducing comparability with our peers who do not report under IFRS as issued by the IASB or who do not employ
the revaluation approach to measuring property, plant and equipment. We add back deferred income taxes on the basis that we do not believe
this item reflects the present value of the actual tax obligations that we expect to incur over our long-term investment horizon. Brookfield
Renewable believes that analysis and presentation of Funds From Operations on this basis will enhance an investor’s understanding of the
performance of the business. Normalized Funds From Operations assumes long-term average generation in North America and Europe and
uses constant foreign currency rates for all periods presented. Brookfield Renewable does not place undue attention on short-term fluctuations
in hydrology or resource and uses Normalized Funds From Operations to assess the fundamental performance of the business when actual
generation varies materially from long-term average. Funds From Operations per Unit is not a substitute measure of performance for earnings
per share and does not represent amounts available for distribution to LP Unitholders.

36
Performance Measurement
• Adjusted Funds From Operations – Adjusted Funds From Operations is a non-IFRS measure used by investors to analyze net earnings
from operations without the effects of certain volatile items that generally have no current financial impact or items not directly related to the
performance of the business but also adjusted for sustaining capital expenditures. Adjusted sustaining capital expenditures are an estimate
made by management of the amount of ongoing capital investment required to maintain the condition of all our facilities and current revenues.
Annually, Brookfield Renewable determines the fair value of its property, plant and equipment using a 20-year discounted cash flow model
with each operational facility having a 20-year capital plan. In addition, the useful lives of property, plant and equipment are determined
periodically by independent engineers and are reviewed annually by management. Management considers several items in estimating
adjusted sustaining capital expenditures. Such factors include, but are not limited to, review and analysis of historical capital spending, the
annual budgeted capital expenditures, management’s 5-year business plan, and independent third-party engineering assessments. Sustaining
capital expenditures do not occur evenly over the life of our assets and may fluctuate depending on the timing of actual project spend.
Adjusted sustaining capital expenditures are intended to reflect an average annual spending level based on the 20-year capital plan and are
our best estimate of the long-term capital required to maintain the operations of our facilities. Over time, we expect our average sustaining
capital expenditures to be in line with our adjusted long-term sustaining capital forecasts. Accounting rules require us to recognize a
significantly higher level of depreciation for our assets than we are required to reinvest in the business as sustaining capital expenditures. This
higher level of depreciation is primarily attributed to: 1) our election to annually fair value property, plant and equipment under IFRS; and 2)
accounting useful life is not always reflective of the perpetual nature of a hydroelectric facility. Brookfield Renewable uses Adjusted Funds
From Operations to also assess performance of the business and defines it as Funds From Operations less Brookfield Renewable’s
proportionate share of adjusted sustaining capital expenditures (based on long-term sustaining capital expenditure plans) which are recurring
in nature and used to maintain the reliability and efficiency of our power generating assets over our long-term investment horizon. Neither
Funds From Operations or Adjusted Funds From Operations are intended to be representative of cash provided by operating activities or
results of operations determined in accordance with IFRS. Furthermore, these measures are not used by the CODM to assess Brookfield
Renewable’s liquidity.

NYSE:
BEPTSX:
BEP.UNhttps://bep.brookfield.com
37