brookhaven field: conformance challenges in an active co flood
TRANSCRIPT

Denbury Resources Inc.
Brookhaven Field: Conformance Challenges in an Active CO2 Flood
Michael Cain Denbury Resources, Inc.
Presented at the 16th Annual CO2 Flooding Conference
December 9-10, 2010
Midland, Texas

Denbury Resources Inc.
About Forward Looking StatementsThe data contained in this presentation that are not historical facts are forward-looking statements that involve a number ofrisks and uncertainties. Such statements may relate to, among other things, capital expenditures, drilling activity, developmentactivities, production efforts and volumes, net asset values, proved reserves, potential reserves and anticipated productiongrowth rates in our CO2 models, 2010 and future production and expenditure estimates, availability and cost of equipment andservices, and other enumerated reserve potential. These forward-looking statements are generally accompanied by wordssuch as “estimated”, “projected”, “potential”, “anticipated”, “forecasted” or other words that convey the uncertainty of futureevents or outcomes. These statements are based on management’s current plans and assumptions and are subject to anumber of risks and uncertainties as further outlined in our most recent 10-K and 10-Q. Therefore, the actual results maydiffer materially from the expectations, estimates or assumptions expressed in or implied by any forward-looking statementmade by or on behalf of the Company
.Cautionary Note to U.S. Investors – The SEC has recently modified its rules regarding oil and gas reserve information thatmay be included in filings with the SEC. The newly applicable rules allow oil and gas companies to disclose not only provedreserves, but also probable and possible reserves that meet the SEC’s definitions of such terms. We disclose only provedreserves in our filings with the SEC. Denbury’s proved reserves as of December 31, 2009 were estimated by DeGolyer &MacNaughton and Miller & Lents, independent petroleum engineering firms. In this presentation, we make reference toprobable and possible reserves, some of which have been prepared by our independent engineers and some of which havebeen prepared by Denbury’s internal staff of engineers. In this presentation, we also refer to estimates of resource “potential”or other descriptions of volumes potentially recoverable, which in addition to reserves generally classifiable as probable andpossible, include estimates of reserves that do not rise to the standards for possible reserves, and which SEC guidelinesstrictly prohibit us from including in filings with the SEC. These estimates, as well as the estimates of probable and possiblereserves, are by their nature more speculative than estimates of proved reserves and are subject to greater uncertainties, andaccordingly the likelihood of recovering those reserves is subject to substantially greater risk.
2

Denbury Resources Inc.
Gulf Coast CO2 Projects – Potential Tertiary Oil Reserves(1)
3
Brookhaven CO2 Unit•Discovered in 1943 by The California
Company (Chevron)•Pressure maintenance (gas injection)
began in 1945•Waterflood started in 1957•Florabama 1990 and Coho 1995•Denbury purchased the field in 2002•CO2 injection began in 2005

Denbury Resources Inc.
Brookhaven Map and Type Log4

Denbury Resources Inc.
Brookhaven Geological Setting• Located in the Mississippi Interior Salt Basin, a passive
continental margin with extensional rift tectonics (normal faulting)
• Structure is a Salt Cored 4-way Anticline, producing from the Upper Cretaceous, Tuscaloosa formation
• Approximately 9200 acres of Closure• Faulting Occasionally Affects Production, Faults tend to have
small (100-200’) vertical displacements and trend north-south• Depositional Environment – Fluvial Sands with long, narrow
meandering channel sands that tend to trend North-South– Thickness ranges from 1-2’ up to 42’ for individual sands, when sands
coalesce together can reach 60-70’– Average ; 22.2% (all sands) max ; 42%– Average Permeability; 181.7 md (all sands) max k; 5830 md
5
Denbury Resources Inc.
Flooding Philosophy at Brookhaven• Clean out or tie-back existing wellbores
• 10,500’ Lower Tuscaloosa• 60+ years old wellbores• Less expensive than drilling
• Use existing perforation intervals • Typically 100% of the sands are shot• Regardless of porosity and permeability streaks • Both injectors and producers
• Enjoy flowing producing wells• Relatively low lifting costs• No artificial lift (pumping units, etc)
• Inhibited oil is circulated in producers to prevent corrosion
• Miscible flood
6
Denbury Resources Inc.
05 06 07 08 09 101x10
1
1x10²
1x10³
1x10⁴
1x10⁵
(L1)1x10⁶
1x101
1x10²
1x10³
1x10⁴
1x10⁵
(R1)1x10⁶
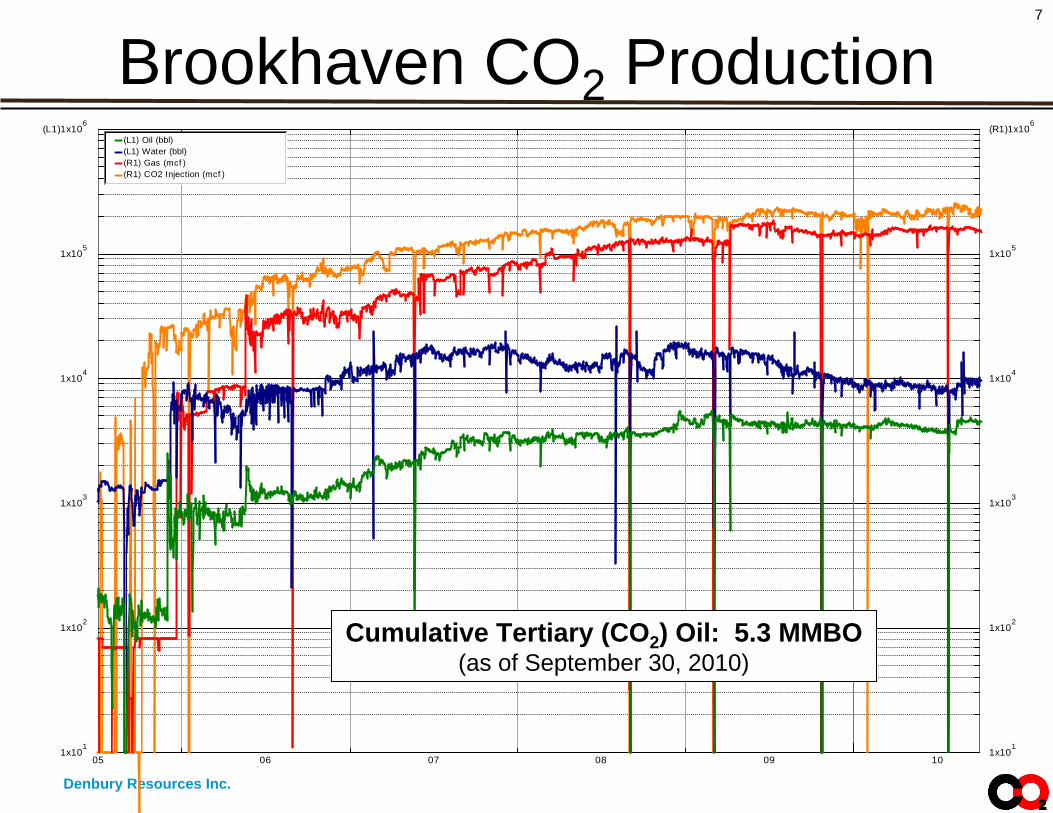
(L1) Oil (bbl)(L1) Water (bbl)(R1) Gas (mcf )(R1) CO2 Injection (mcf )
Brookhaven CO2 Production7
Cumulative Tertiary (CO2 ) Oil: 5.3 MMBO(as of September 30, 2010)

Denbury Resources Inc.
Brookhaven CO2 Unit8
Test Site
CO2 Injection Well

Denbury Resources Inc.
What is conformance and why is it important?
• Conformance is:– “The process of applying various methods and
technologies to a reservoir or wellbore to reduce or control unwanted water or gas production so that recovery efforts are effectively enhanced and operator profitability improved”(1)
• In highly heterogeneous reservoirs, CO2 tends to bypass lower permeability rock and travel primarily in high permeability streaks– Initially, high production rates can be realized– Ultimately, recovery factors may be reduced due to a significant
volume of oil not being contacted by CO2
• Techniques to identify and modify injection profiles is essential for effective management of a CO2 flood
9
(1) “Conformance Technology”, Halliburton Energy Services Publication, 1996.

Denbury Resources Inc.
Injection Profiles• Traces the path of injectant
– Indicates % of CO2 entering the reservoir by depth
– Highly interpretive– Radioactive iodine, I-131
• Red bars indicates velocity, green is intensity
• Temperature indicates cooling
• Important tool for engineers– Helps identify injectors that
may need profile modification work
– Assists reservoir engineer in predicting future performance of offset wells
10
intensityvelocity
temp
caliper
CCL
cross- flow

Denbury Resources Inc.
Good Injection Profile• Good vertical distribution
– especially in the top sand
• CO2 is being injected in all three sands
• Should result in higher sweep efficiency for the pattern
11
Denbury Resources Inc.
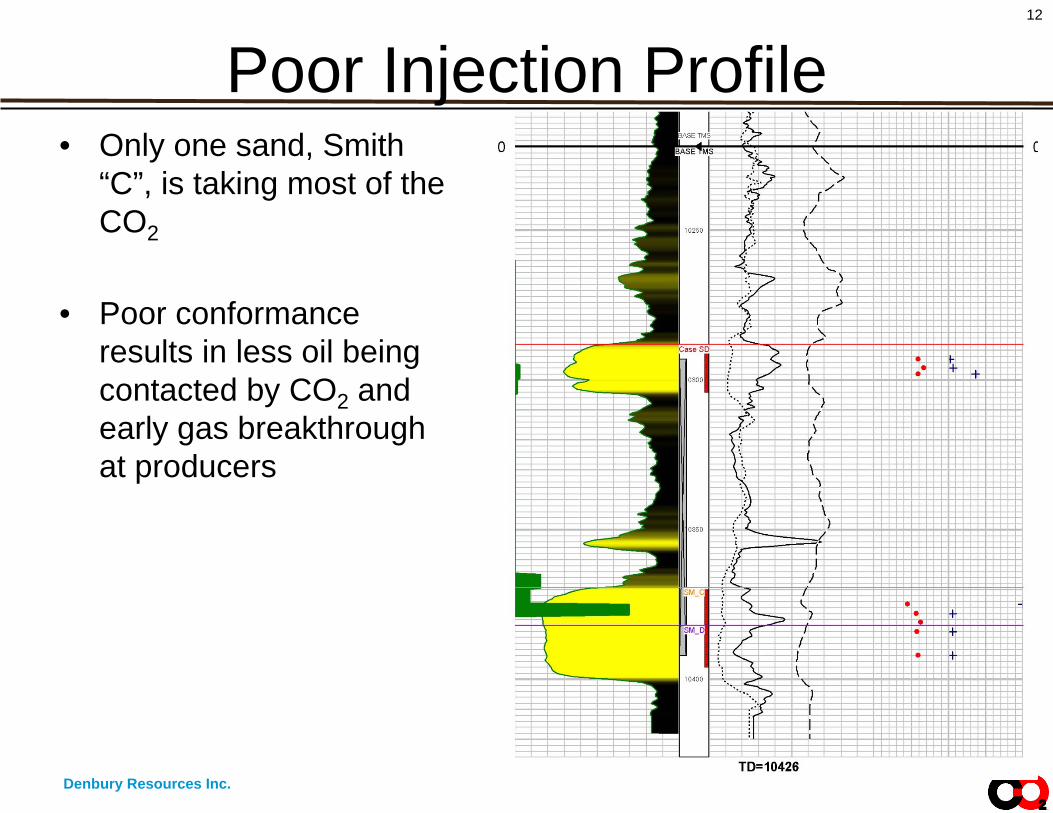
Poor Injection Profile• Only one sand, Smith
“C”, is taking most of the CO2
• Poor conformance results in less oil being contacted by CO2 and early gas breakthrough at producers
12

Denbury Resources Inc.
Identifying Areas of Unswept Oil• Review of injection profiles suggests a significant portion of
the reservoir was not being swept• Developed a methodology for determining areas of unswept oil
– Pattern production and injection for individual sand units is allocated based on injection profiles and pattern allocations
• Assumptions– Geometric pattern allocations– CO2 stays in same sand as injected into– Injection and pattern allocations are constant over a period of time
• Bubble maps are generated to help identify areas of interest• Identifies areas for “targeted” injection
13

Denbury Resources Inc.
Allocated Production By Sand14
Smith “D” Sand
Smith “C” Sand
Smith “C” Sand
Denbury Resources Inc.
Difficulties with Selective Perforations
• Targeted sands tend to be lower permeability– Injectors: Lower injection rates result in delayed production response– Producers: Tighter sands usually result in lower production rates
• Squeezing off intervals can be problematic– CO2 will find the weak spots and migrate through cement
• Near wellbore effect only– Need shale break to effectively isolate CO2 injection
15

Denbury Resources Inc.
Additional Techniques to Address High GOR
• Conversion of Producer to Injector (CTI)– Utilizes an idle wellbore– Must consider other factors such as IWR and available CO2
– Likely to have conformance issues; possibly accelerating GOR increase in offset producers
– Does not solve conformance/sweep problem
• Gel Treatments– Idea is to introduce a significant volume of permanent gel in swept,
high permeability rock to force CO2 to take an alternate path• Gel is pushed into the reservoir away from wellbore
– Brookhaven team has conducted 5 gel treatments in the field• Four ~5,000 bbl gel treatments on four injectors• One 1,500 bbl gel treatment on a producer
16

Denbury Resources Inc.
Gel Treatments• Polyacrylamide polymer with organic cross-linker
– Concentrations of 3,000 to 9,000 ppm– Rates of 0.75 to 1.0 bbl per minute over several days– Shut-in to allow strengthening of the gel
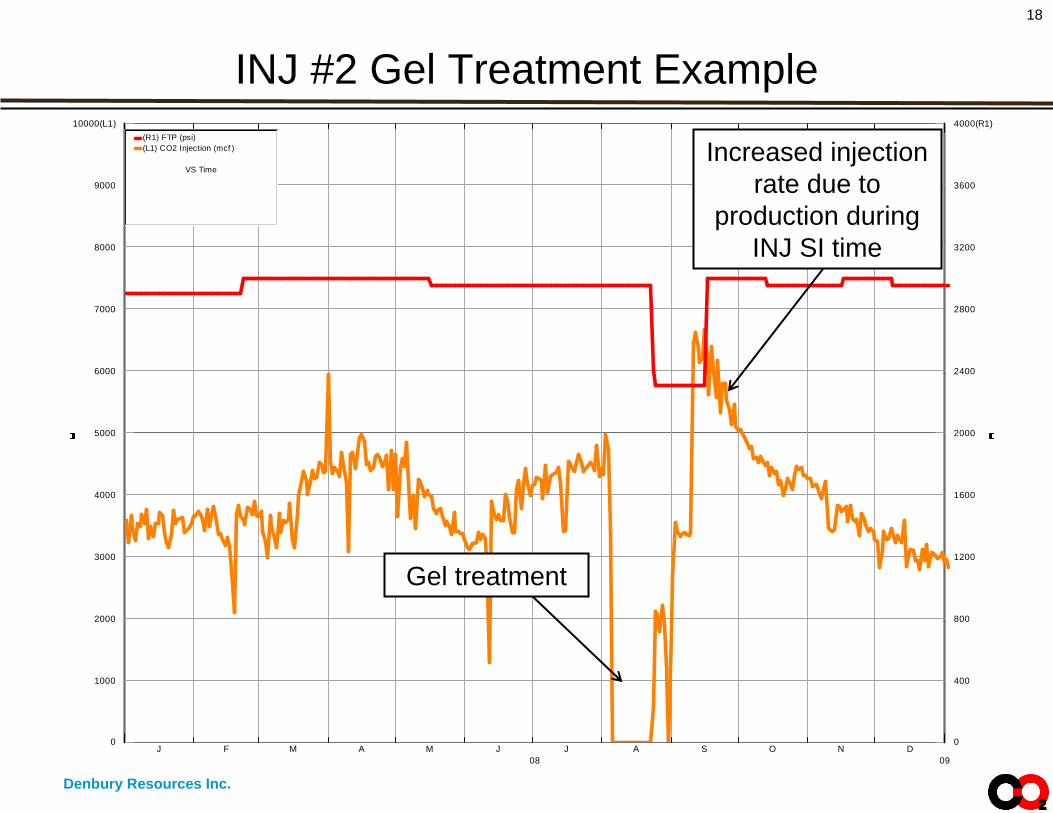
• First gel treatments – August 2008– INJ #1: 3,900 bbl– INJ #2: 6,900 bbl– Offset production continued during treatment and shut-in period
• Second gel treatments – January 2009– INJ #3: 5,500 bbl– INJ #4: 5,500 bbl– Offset production shut-in after treatment to reduce withdrawals
and minimize reservoir pressure reduction• Producer gel treatment – July 2009
– PRD #1: 1,500 bbl
17
Denbury Resources Inc.
INJ #2 Gel Treatment Example18
J F M A M J J A S O N D08 09
1000
2000
3000
4000
6000
7000
8000
9000
0
5000
10000(L1)
400
800
1200
1600
2400
2800
3200
3600
0
2000
4000(R1)(R1) FTP (psi)(L1) CO2 Injection (mcf )
VS Time
Gel treatment
Increased injection rate due to
production during INJ SI time
Denbury Resources Inc.
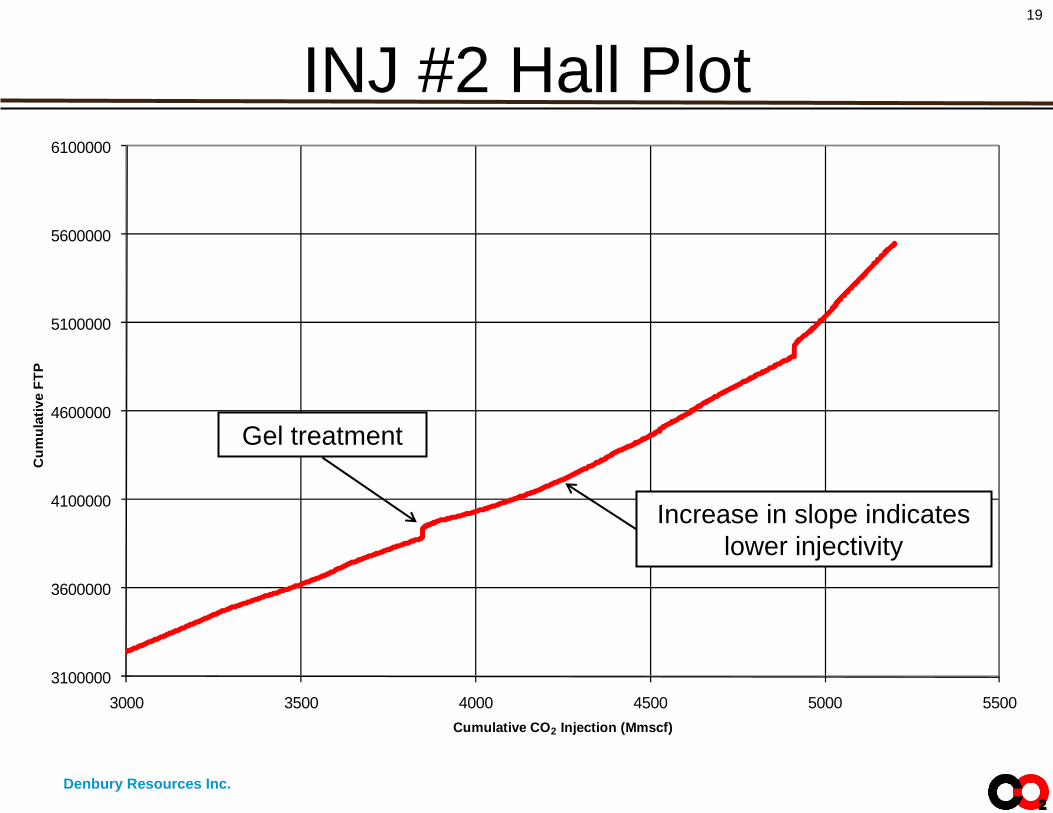
INJ #2 Hall Plot19
3100000
3600000
4100000
4600000
5100000
5600000
6100000
3000 3500 4000 4500 5000 5500
Cum
ulat
ive
FTP
Cumulative CO2 Injection (Mmscf)
Gel treatment
Increase in slope indicates lower injectivity

Denbury Resources Inc.
J F M A M J J A S O N D J F M A M J J A S O N D J F M A M J J A S O N D J F M A M J J07 08 09 10
200
400
600
800
1200
1400
1600
1800
0
1000
2000(L1)
5500
11000
16500
22000
33000
38500
44000
49500
0
27500
55000(R1)(L1) Oil (bbl)(R1) Gas (mcf )(R1) CO2 Injection (mcf )
VS Time INJ #1 & #2 Gel
Treatment
INJ #3 & #4 Gel
Treatment
Gel Treatment Production Effect20
Production Response???
Denbury Resources Inc.
Gel Treatment Conclusions• Injectivity decreased in 3 of 4 injectors
• Production impacts are very difficult to quantify– Too many variables to measure gains and losses
• Gel treatments may have slightly modified injection profiles– Near well effects may be minimal because gel is pushed deep into the
reservoir before it sets up
• Considering significantly larger treatments in the future– Attempt to plug off a more substantial portion of the high permeability
streak
21

Denbury Resources Inc.
Phase 1 of Tracer Study - Breakthrough Times
• Unique, CO2 soluble chemical tracers were injected in 4 CO2 injectors
• Breakthrough times of highest tracer concentrations shown at right
• Tracers from INJ 1A have been detected in almost every well in the area
• Study has confirmed a north- south preferential flow direction
22
INJ #3
INJ #2
INJ #1BINJ #1A
<10 days
~21
days
21 days
<21 days
27 d
ays

Denbury Resources Inc.
Water-Alternating Gas (WAG)• As of May 2010, 7 of 11 active
producers were shut-in due to high GOR
• Convert four continuous CO2 injectors to WAG injectors– Use slugs of produced water to divert
CO2 into unswept regions– Try to avoid artificial lift with small
water slug sizes
• Chemical tracer survey conducted by ProTechnics– Two phase program
• 1st Phase: Continuous CO2 study (completed)
• 2nd Phase: WAG (water and CO2 ) study (ongoing)
23
INJ #3
INJ #2
INJ #1AINJ #1B
3
2
1
Denbury Resources Inc.
Three Pattern WAG Injection Protocol
• WAG cycles began on 6/29/2010• Target was ~1000 bbl of water, twice a week
– Approximate amount of water injected per injection cycle:• WAG INJ #1A: ~1100 bbl• WAG INJ #1B: ~1250 bbl• WAG INJ #2: ~1100 bbl• WAG INJ #3: ~200 bbl
• WAG INJ #2 was down due to MIT failure for the month of August
• WAG cycles altered on 10/1/2010– Approximate amount of water injected per injection cycle:
• WAG INJ #1A: ~2100 bbl• WAG INJ #1B: ~2700 bbl• WAG INJ #2: ~2200 bbl• WAG INJ #3: ~100 bbl

Denbury Resources Inc.
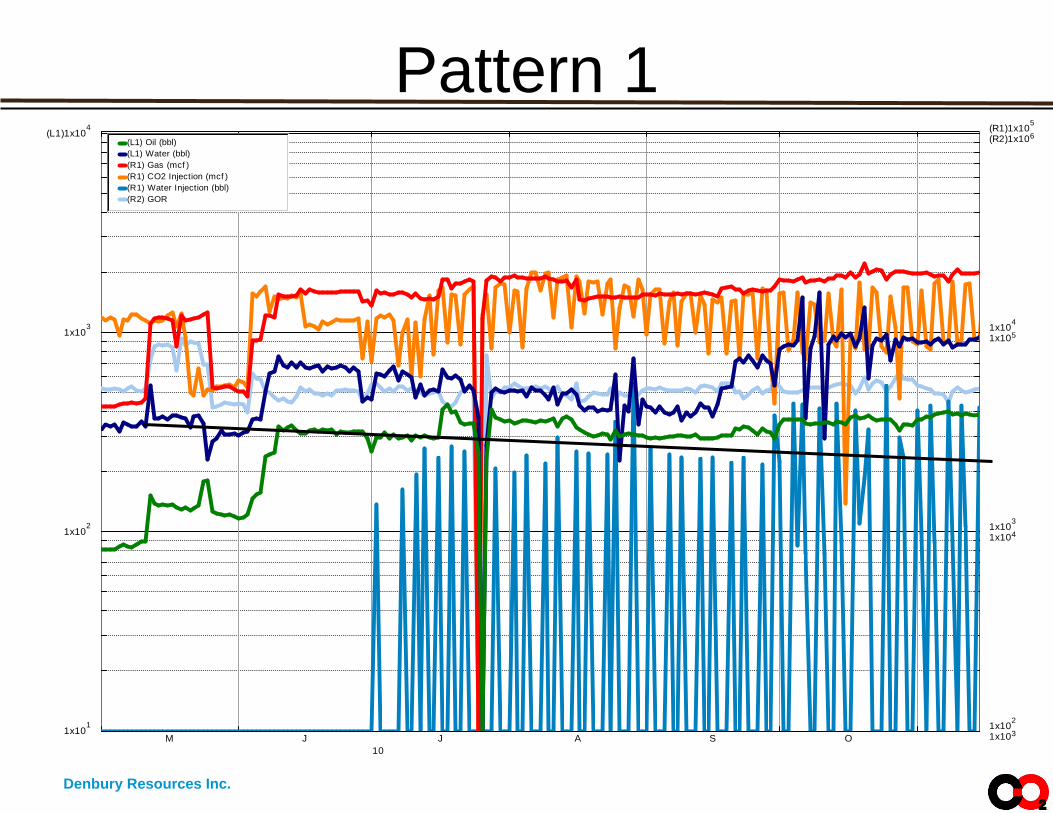
M J J A S O10
1x101
1x10²
1x10³
(L1)1x10⁴
1x10²
1x10³
1x10⁴
(R1)1x10⁵
1x10³
1x10⁴
1x10⁵
(R2)1x10⁶(L1) Oil (bbl)(L1) Water (bbl)(R1) Gas (mcf )(R1) CO2 Injection (mcf )(R1) Water Injection (bbl)(R2) GOR
WAG Area
High GOR wells activated
WAG begins

Denbury Resources Inc.
M J J A S O10
1x101
1x10²
1x10³
(L1)1x10⁴
1x10²
1x10³
1x10⁴
(R1)1x10⁵
1x10³
1x10⁴
1x10⁵
(R2)1x10⁶(L1) Oil (bbl)(L1) Water (bbl)(R1) Gas (mcf )(R1) CO2 Injection (mcf )(R1) Water Injection (bbl)(R2) GOR
Pattern 3

Denbury Resources Inc.
M J J A S O10
1x101
1x10²
1x10³
(L1)1x10⁴
1x10²
1x10³
1x10⁴
(R1)1x10⁵
1x10³
1x10⁴
1x10⁵
(R2)1x10⁶(L1) Oil (bbl)(L1) Water (bbl)(R1) Gas (mcf )(R1) CO2 Injection (mcf )(R1) Water Injection (bbl)(R2) GOR
Pattern 2
Denbury Resources Inc.
M J J A S O10
1x101
1x10²
1x10³
(L1)1x10⁴
1x10²
1x10³
1x10⁴
(R1)1x10⁵
1x10³
1x10⁴
1x10⁵
(R2)1x10⁶(L1) Oil (bbl)(L1) Water (bbl)(R1) Gas (mcf )(R1) CO2 Injection (mcf )(R1) Water Injection (bbl)(R2) GOR
Pattern 1

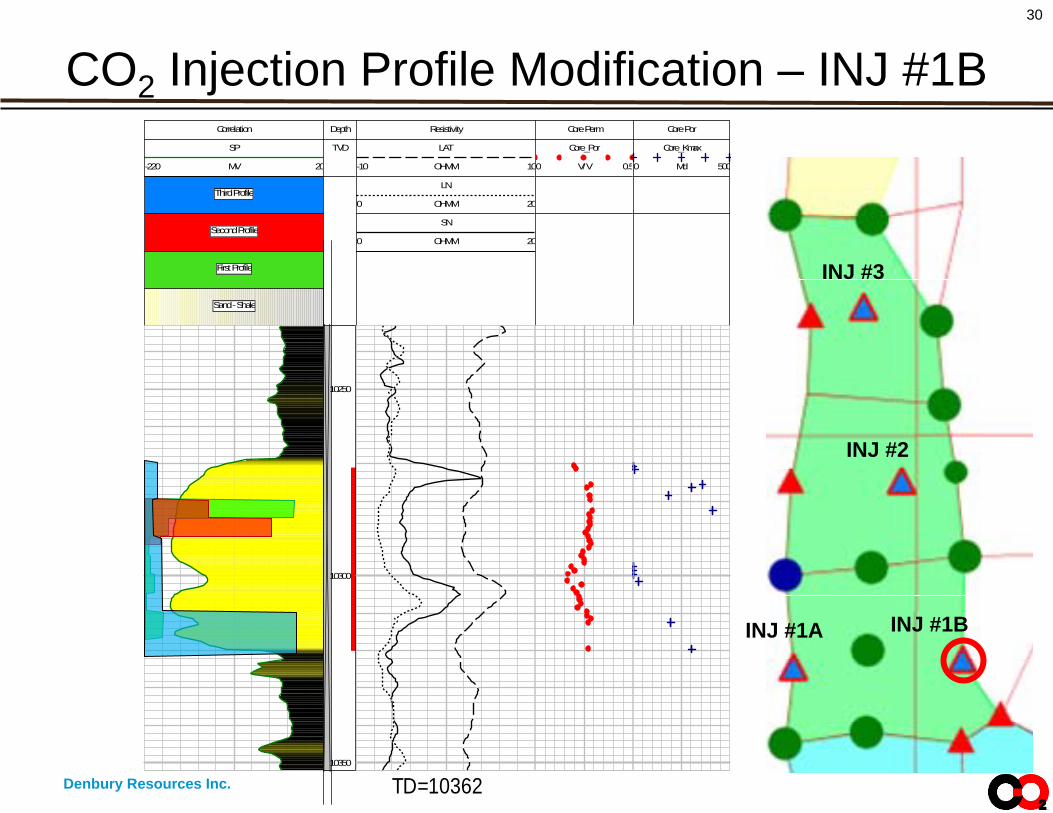
Denbury Resources Inc. TD=10362
Correlation
SP
-220 20MV
Third Profile
Second Profile
First Profile
Sand - Shale
Depth
TVD
Resistivity
LAT
-10 10OHMM
LN
0 20OHMM
SN
0 20OHMM
Core Perm
Core_Por
0 0.5V/V
Core Por
Core_Kmax
0 500Md
10250
10300
10350
CO2 Injection Profile Modification – INJ #1B29
INJ #3
INJ #2
INJ #1A INJ #1B
Denbury Resources Inc. TD=10362
Correlation
SP
-220 20MV
Third Profile
Second Profile
First Profile
Sand - Shale
Depth
TVD
Resistivity
LAT
-10 10OHMM
LN
0 20OHMM
SN
0 20OHMM
Core Perm
Core_Por
0 0.5V/V
Core Por
Core_Kmax
0 500Md
10250
10300
10350
CO2 Injection Profile Modification – INJ #1B30
INJ #3
INJ #2
INJ #1A INJ #1B
Denbury Resources Inc.
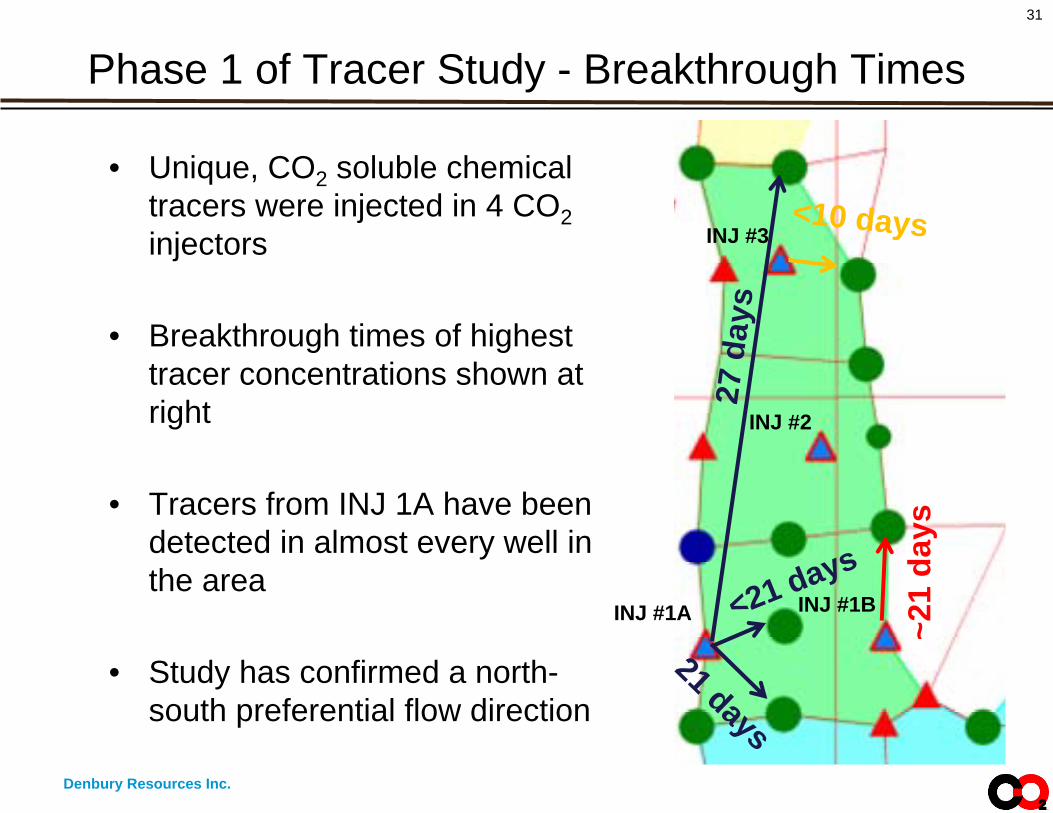
Phase 1 of Tracer Study - Breakthrough Times
• Unique, CO2 soluble chemical tracers were injected in 4 CO2 injectors
• Breakthrough times of highest tracer concentrations shown at right
• Tracers from INJ 1A have been detected in almost every well in the area
• Study has confirmed a north- south preferential flow direction
31
INJ #3
INJ #2
INJ #1BINJ #1A
<10 days
~21
days
21 days
<21 days
27 d
ays
Denbury Resources Inc.
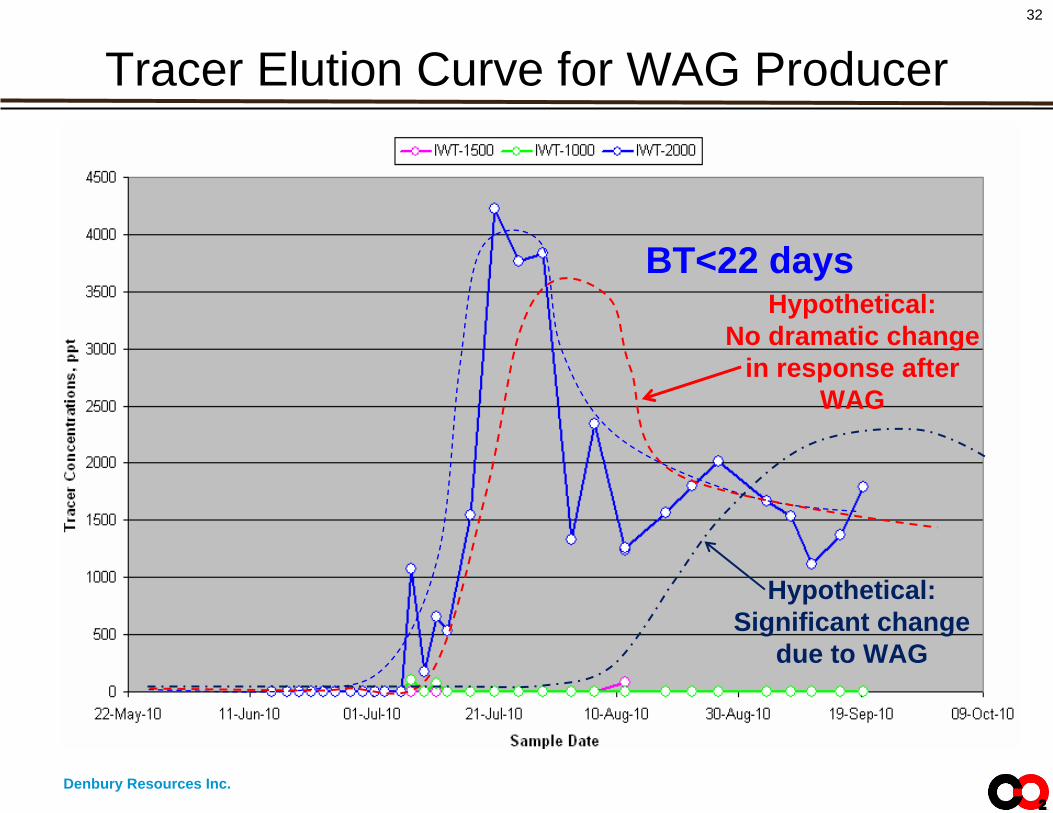
Tracer Elution Curve for WAG Producer32
BT<22 daysHypothetical:
No dramatic change in response after
WAG
Hypothetical: Significant change
due to WAG

Denbury Resources Inc.
WAG Results to Date• Have seen production improvements on the pattern level
– Most improvement has been seen in Pattern 1– Approximately 200 BOPD incremental gain has been observed in
the WAG area– No reduction in CO2 production has been observed yet– Water production has started to trend up in the past 2 months –
unknown if this is injected water or formation water
• Successful in modifying injection profiles
• Tracer results to date are consistent with observed field behavior– Provided supporting information for modifying slug sizes– Began Phase 2 of tracer study 1st week of December
33
Denbury Resources Inc.
Future Conformance Work at Brookhaven
• Continue to selectively perforate wells when possible and target specific sands
• Gel treatments– Increase treatment size– Where implementing WAG may be expensive and/or difficult– Treat high GOR producing wells
• WAG plans– Modify slug sizes in Phase 4B
• Need to determine optimal slug size for profile modification– Looking at expanding WAG in areas of the field where early CO2
breakthrough is a problem
• Continue to look at new technologies– Foam– “Viscosify” water for WAG
34

Denbury Resources Inc.
Recognizing Personnel• Field:
– Billy Biggers, Kyle Burke, Chad Lofton, Don Herrington, Joey Williford and other BFU Operators, Lester Reed, Will Duncan, Betty Boothe, Lisa Ballard, Regina Compton, Denise Allen, Philip Hollimon, Matt O’Bryant and Arnold Jackson
35
SW Mississippi District Officedusted with snow

Denbury Resources Inc.
Recognizing Personnel• Corporate Office
– Management: • Barry Schneider, Bruce Augustine, Ken Cameron, Walt True, Dave Senor,
Gordon Moore, West Richardson and Brenda Borden
– Brookhaven Team: • Gary Patterson, Randy L. Charles, Kevin Skees, Ed Deslauriers, Jim
Cobb, Jim Kean, Reuben Pratt, Lisa Nordstrom, Dylan Sheppard, Angie Cate, Karla Stines, Tammy Sims, and Naomi Johnson
36

Denbury Resources Inc.
Questions?37